Embed Size (px)
Citation preview

23 February 2018
1H FY18 RESULTS INVESTOR PRESENTATION
Shaver Shop Group Limited
1
TABLE OF TABLE OF TABLE OF TABLE OF CONTENTSCONTENTSCONTENTSCONTENTS
2
01 Key business highlights
02 Financial results
03Key growth drivers
04Trading update & outlook
05Appendices

01.01.01.01.KEY BUSINESS HIGHLIGHTS
3
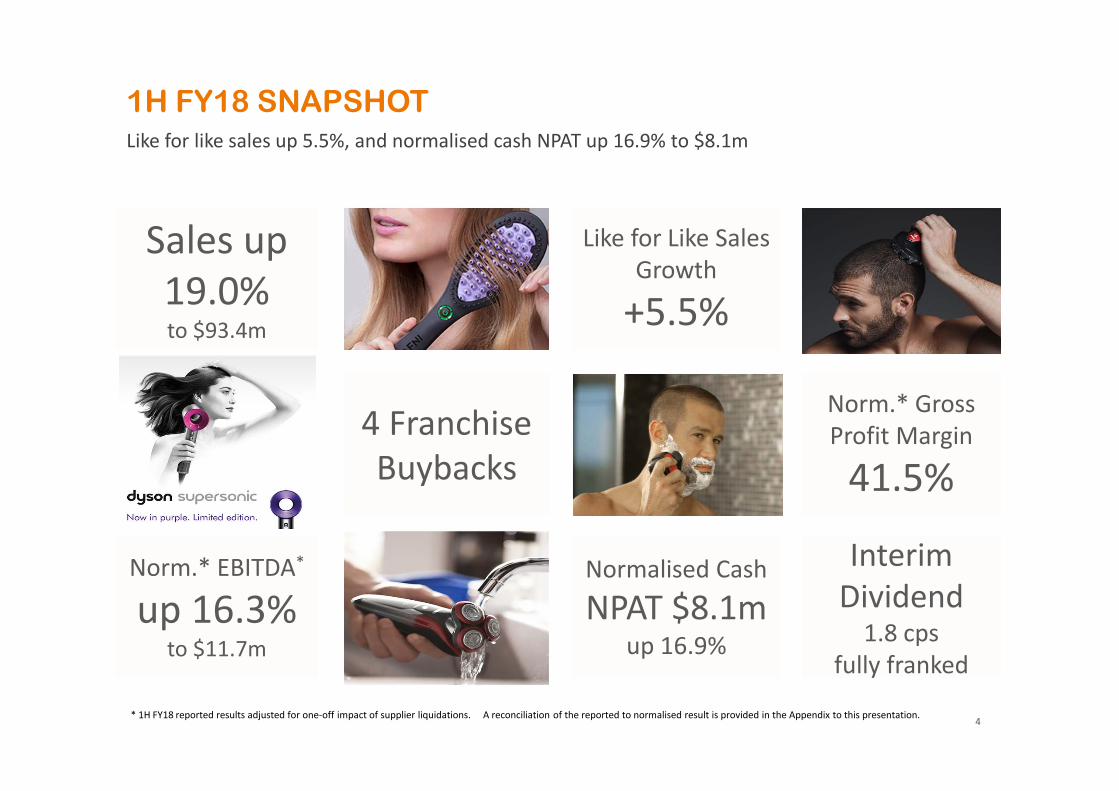
1H FY18 SNAPSHOT
4
Like for like sales up 5.5%, and normalised cash NPAT up 16.9% to $8.1m
Sales up
19.0% to $93.4m
Sales up
19.0% to $93.4m
Insert Braun
S9 image
Insert Braun
S9 image
Like for Like Sales
Growth
+5.5%
Like for Like Sales
Growth
+5.5%
Insert Foreo
image with
woman
Insert Foreo
image with
woman
Insert DysonInsert Dyson4 Franchise
Buybacks
4 Franchise
Buybacks
Norm.* Gross
Profit Margin
41.5%
Norm.* Gross
Profit Margin
41.5%
Norm.* EBITDA*
up 16.3% to $11.7m
Norm.* EBITDA*
up 16.3% to $11.7m
Insert Dafni
image (with
lady)
Insert Dafni
image (with
lady)
Normalised Cash
NPAT $8.1mup 16.9%
Normalised Cash
NPAT $8.1mup 16.9%
Interim
Dividend 1.8 cps
fully franked
Interim
Dividend 1.8 cps
fully franked
* 1H FY18 reported results adjusted for one-off impact of supplier liquidations. A reconciliation of the reported to normalised result is provided in the Appendix to this presentation.
PERFORMANCE TRENDS
5
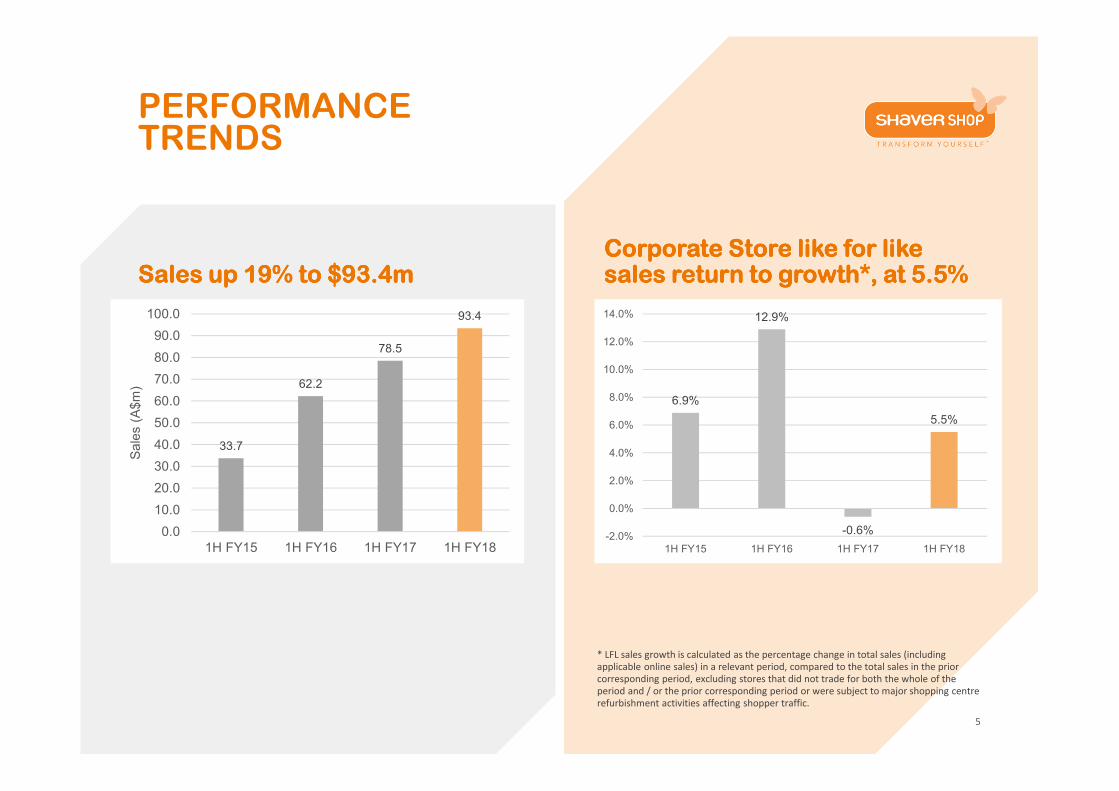
Sales up 19% to $93.4mSales up 19% to $93.4mSales up 19% to $93.4mSales up 19% to $93.4mCorporate Store like for like Corporate Store like for like Corporate Store like for like Corporate Store like for like sales return to growth*, at 5.5%sales return to growth*, at 5.5%sales return to growth*, at 5.5%sales return to growth*, at 5.5%
* LFL sales growth is calculated as the percentage change in total sales (including applicable online sales) in a relevant period, compared to the total sales in the prior corresponding period, excluding stores that did not trade for both the whole of the period and / or the prior corresponding period or were subject to major shopping centre refurbishment activities affecting shopper traffic.
33.7
62.2
78.5
93.4
0.0
10.0
20.0
30.0
40.0
50.0
60.0
70.0
80.0
90.0
100.0
1H FY15 1H FY16 1H FY17 1H FY18
Sale
s (
A$m
)
6.9%
12.9%
-0.6%
5.5%
-2.0%
0.0%
2.0%
4.0%
6.0%
8.0%
10.0%
12.0%
14.0%
1H FY15 1H FY16 1H FY17 1H FY18
PERFORMANCE TRENDS (CONT’D)
6
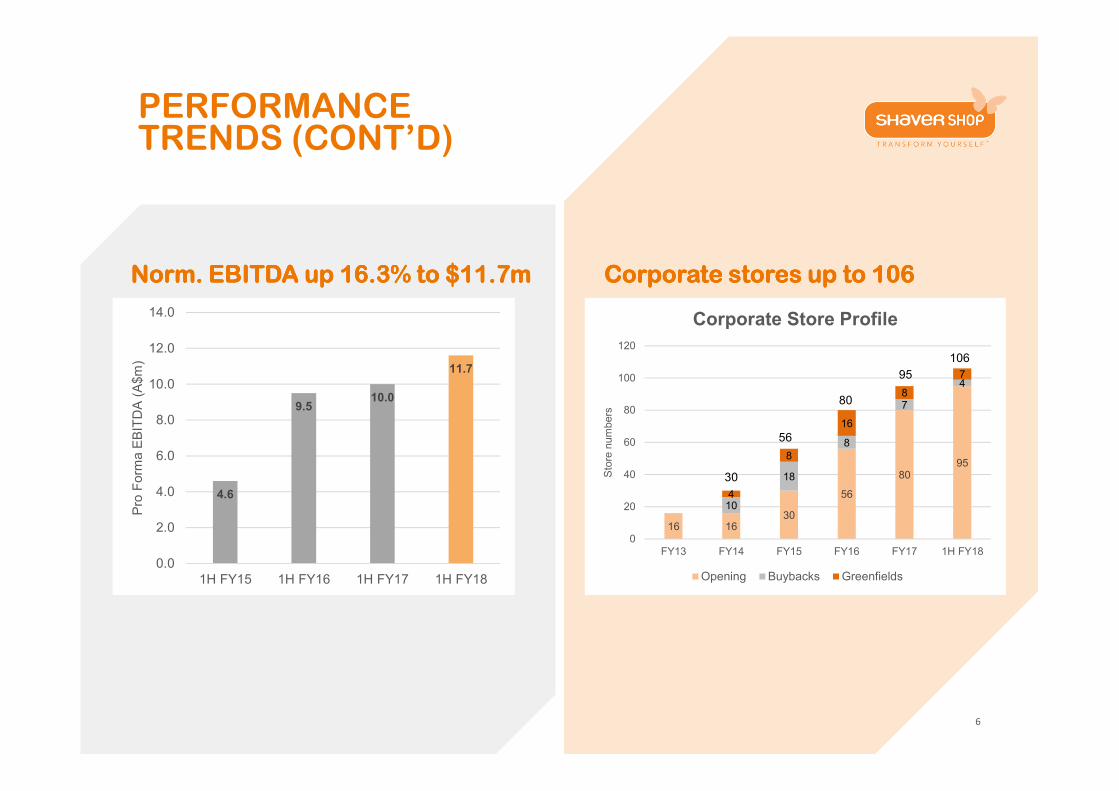
Norm. EBITDA Norm. EBITDA Norm. EBITDA Norm. EBITDA up 16.3% up 16.3% up 16.3% up 16.3% to $11.7mto $11.7mto $11.7mto $11.7m Corporate stores up to 106Corporate stores up to 106Corporate stores up to 106Corporate stores up to 106
4.6
9.510.0
11.7
0.0
2.0
4.0
6.0
8.0
10.0
12.0
14.0
1H FY15 1H FY16 1H FY17 1H FY18
Pro
Form
a E
BIT
DA
(A
$m
)
16 1630
56
8095
10
18
8
7
4
4
8
16
8
7
0
20
40
60
80
100
120
FY13 FY14 FY15 FY16 FY17 1H FY18
Sto
re n
um
bers
Corporate Store Profile
Opening Buybacks Greenfields
30
56
80
106
95
PERFORMANCE TRENDS (CONT’D)
7
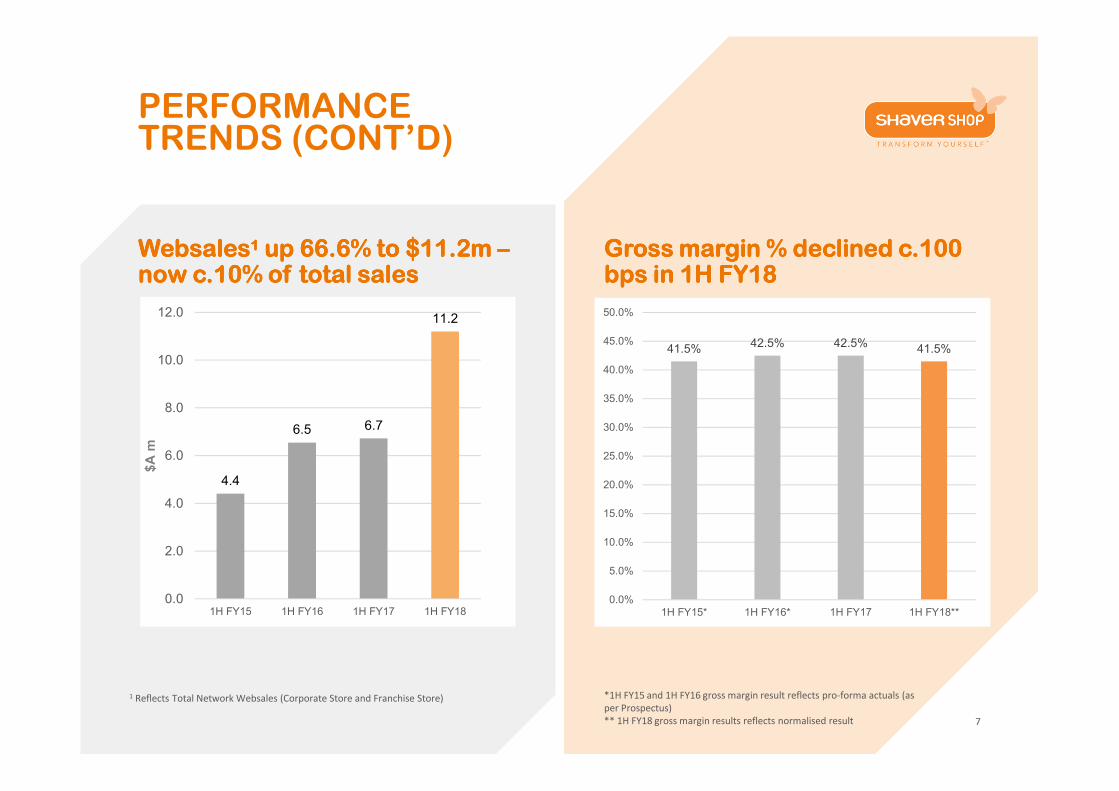
WebsalesWebsalesWebsalesWebsales1111 up 66.6% to $11.2m up 66.6% to $11.2m up 66.6% to $11.2m up 66.6% to $11.2m ––––now c.10% of total salesnow c.10% of total salesnow c.10% of total salesnow c.10% of total sales
Gross margin % declined c.100 Gross margin % declined c.100 Gross margin % declined c.100 Gross margin % declined c.100 bps in 1H FY18bps in 1H FY18bps in 1H FY18bps in 1H FY18
*1H FY15 and 1H FY16 gross margin result reflects pro-forma actuals (as
per Prospectus)
** 1H FY18 gross margin results reflects normalised result
1 Reflects Total Network Websales (Corporate Store and Franchise Store)
4.4
6.5 6.7
11.2
0.0
2.0
4.0
6.0
8.0
10.0
12.0
1H FY15 1H FY16 1H FY17 1H FY18
$A
m
41.5% 42.5% 42.5% 41.5%
0.0%
5.0%
10.0%
15.0%
20.0%
25.0%
30.0%
35.0%
40.0%
45.0%
50.0%
1H FY15* 1H FY16* 1H FY17 1H FY18**
02.02.02.02.FINANCIAL RESULTS
8
1H FY18 VS 1H FY17
9
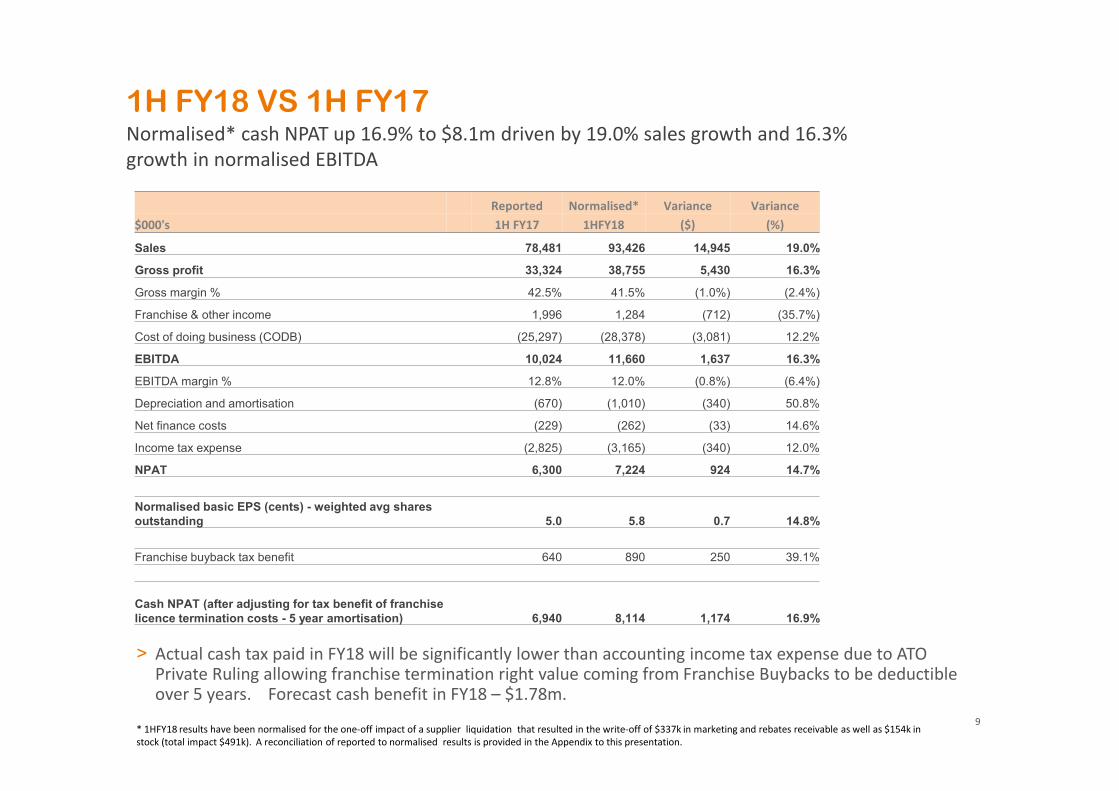
Normalised* cash NPAT up 16.9% to $8.1m driven by 19.0% sales growth and 16.3%
growth in normalised EBITDA
> Actual cash tax paid in FY18 will be significantly lower than accounting income tax expense due to ATO Private Ruling allowing franchise termination right value coming from Franchise Buybacks to be deductible over 5 years. Forecast cash benefit in FY18 – $1.78m.
* 1HFY18 results have been normalised for the one-off impact of a supplier liquidation that resulted in the write-off of $337k in marketing and rebates receivable as well as $154k in
stock (total impact $491k). A reconciliation of reported to normalised results is provided in the Appendix to this presentation.
Reported Normalised* Variance Variance
$000's 1H FY17 1HFY18 ($) (%)
Sales 78,481 93,426 14,945 19.0%
Gross profit 33,324 38,755 5,430 16.3%
Gross margin % 42.5% 41.5% (1.0%) (2.4%)
Franchise & other income 1,996 1,284 (712) (35.7%)
Cost of doing business (CODB) (25,297) (28,378) (3,081) 12.2%
EBITDA 10,024 11,660 1,637 16.3%
EBITDA margin % 12.8% 12.0% (0.8%) (6.4%)
Depreciation and amortisation (670) (1,010) (340) 50.8%
Net finance costs (229) (262) (33) 14.6%
Income tax expense (2,825) (3,165) (340) 12.0%
NPAT 6,300 7,224 924 14.7%
Normalised basic EPS (cents) - weighted avg shares outstanding 5.0 5.8 0.7 14.8%
Franchise buyback tax benefit 640 890 250 39.1%
Cash NPAT (after adjusting for tax benefit of franchise licence termination costs - 5 year amortisation) 6,940 8,114 1,174 16.9%
TOTAL SALES UP 19.0%
10
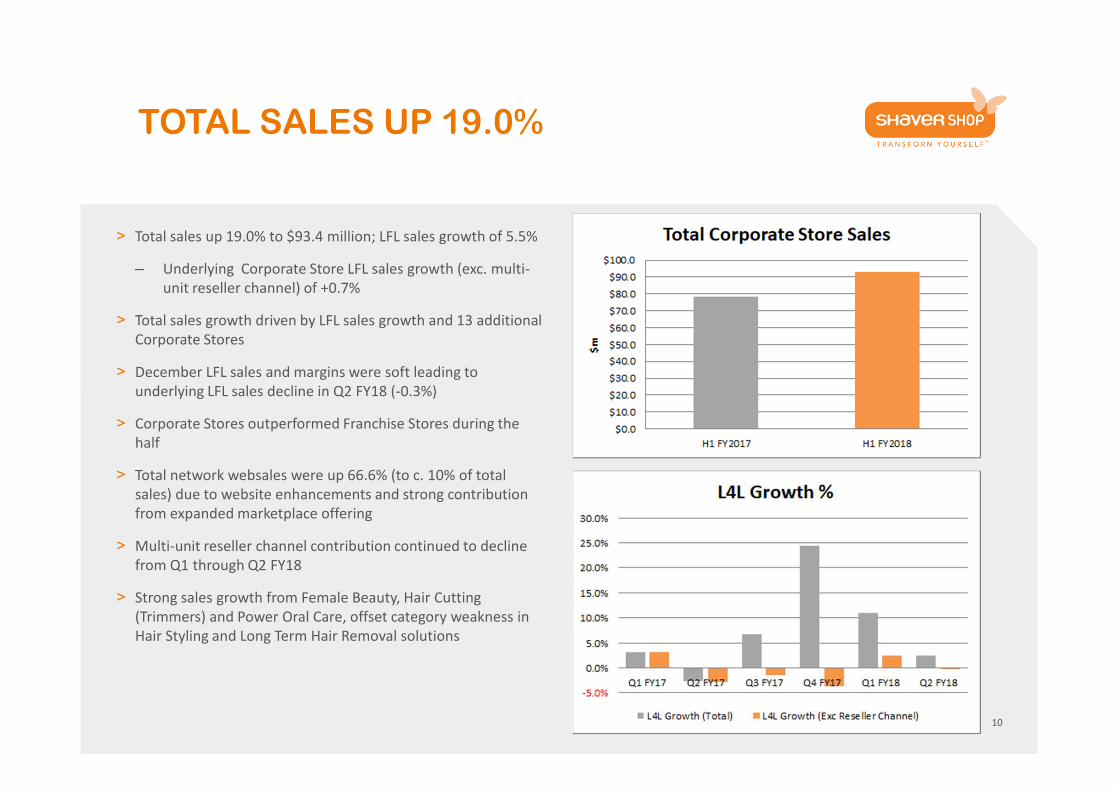
> Total sales up 19.0% to $93.4 million; LFL sales growth of 5.5%
– Underlying Corporate Store LFL sales growth (exc. multi-
unit reseller channel) of +0.7%
> Total sales growth driven by LFL sales growth and 13 additional
Corporate Stores
> December LFL sales and margins were soft leading to
underlying LFL sales decline in Q2 FY18 (-0.3%)
> Corporate Stores outperformed Franchise Stores during the
half
> Total network websales were up 66.6% (to c. 10% of total
sales) due to website enhancements and strong contribution
from expanded marketplace offering
> Multi-unit reseller channel contribution continued to decline
from Q1 through Q2 FY18
> Strong sales growth from Female Beauty, Hair Cutting
(Trimmers) and Power Oral Care, offset category weakness in
Hair Styling and Long Term Hair Removal solutions
GROSS PROFIT GROWTH
11
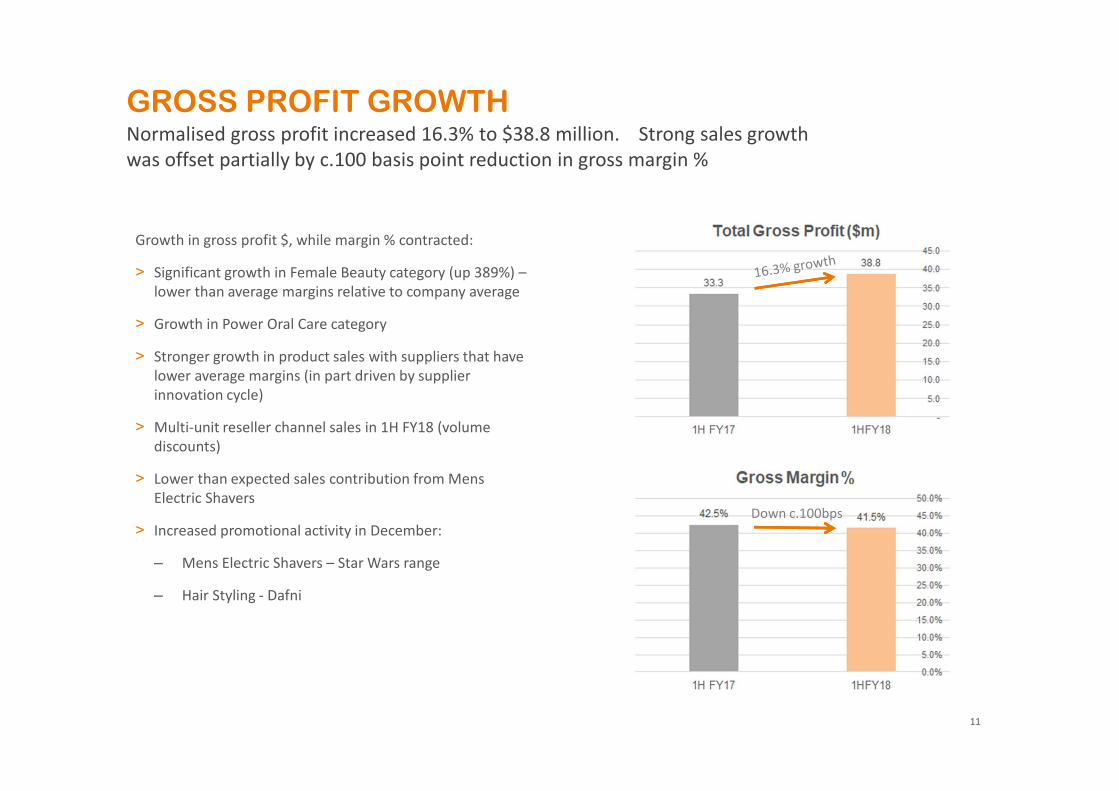
Growth in gross profit $, while margin % contracted:
> Significant growth in Female Beauty category (up 389%) –
lower than average margins relative to company average
> Growth in Power Oral Care category
> Stronger growth in product sales with suppliers that have
lower average margins (in part driven by supplier
innovation cycle)
> Multi-unit reseller channel sales in 1H FY18 (volume
discounts)
> Lower than expected sales contribution from Mens
Electric Shavers
> Increased promotional activity in December:
– Mens Electric Shavers – Star Wars range
– Hair Styling - Dafni
Normalised gross profit increased 16.3% to $38.8 million. Strong sales growth
was offset partially by c.100 basis point reduction in gross margin %
Down c.100bps
IMPROVED COST OF DOING BUSINESS
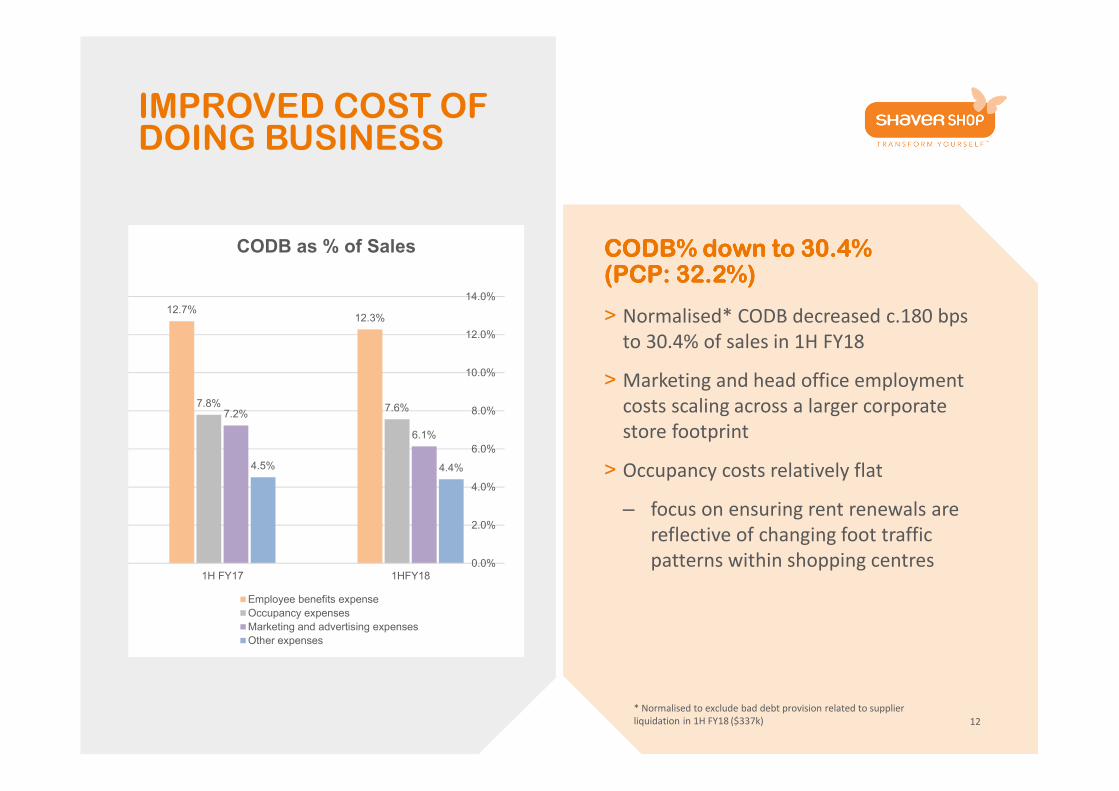
CODBCODBCODBCODB% down to % down to % down to % down to 30.4% 30.4% 30.4% 30.4% (PCP: 32.2%) (PCP: 32.2%) (PCP: 32.2%) (PCP: 32.2%)
> Normalised* CODB decreased c.180 bps
to 30.4% of sales in 1H FY18
> Marketing and head office employment
costs scaling across a larger corporate
store footprint
> Occupancy costs relatively flat
– focus on ensuring rent renewals are
reflective of changing foot traffic
patterns within shopping centres
12
* Normalised to exclude bad debt provision related to supplier
liquidation in 1H FY18 ($337k)
12.7%12.3%
7.8% 7.6%7.2%
6.1%
4.5% 4.4%
0.0%
2.0%
4.0%
6.0%
8.0%
10.0%
12.0%
14.0%
1H FY17 1HFY18
CODB as % of Sales
Employee benefits expense
Occupancy expenses
Marketing and advertising expenses
Other expenses
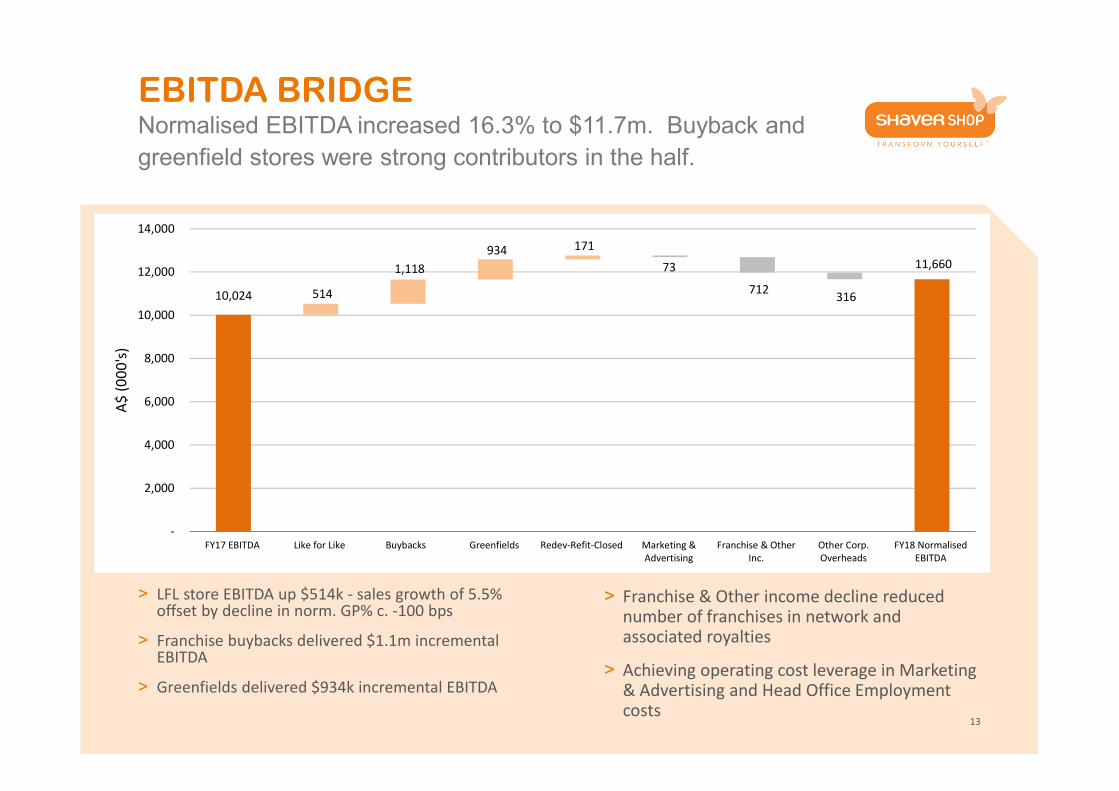
EBITDA BRIDGENormalised EBITDA increased 16.3% to $11.7m. Buyback and
greenfield stores were strong contributors in the half.
13
> LFL store EBITDA up $514k - sales growth of 5.5% offset by decline in norm. GP% c. -100 bps
> Franchise buybacks delivered $1.1m incremental EBITDA
> Greenfields delivered $934k incremental EBITDA
> Franchise & Other income decline reduced number of franchises in network and associated royalties
> Achieving operating cost leverage in Marketing & Advertising and Head Office Employment costs
10,024
11,660
712 316 514
1,118
934 171
73
-
2,000
4,000
6,000
8,000
10,000
12,000
14,000
FY17 EBITDA Like for Like Buybacks Greenfields Redev-Refit-Closed Marketing &
Advertising
Franchise & Other
Inc.
Other Corp.
Overheads
FY18 Normalised
EBITDA
A$
(0
00
's)
STRONG BALANCE SHEET
14
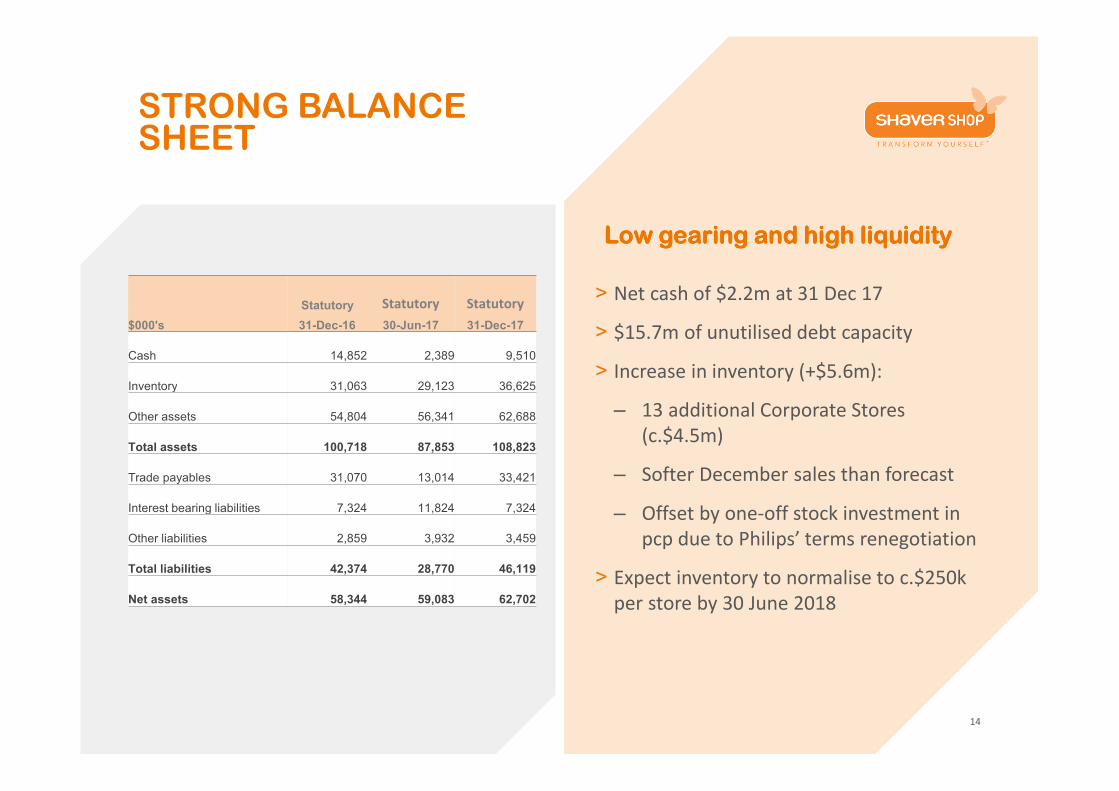
> Net cash of $2.2m at 31 Dec 17
> $15.7m of unutilised debt capacity
> Increase in inventory (+$5.6m):
– 13 additional Corporate Stores
(c.$4.5m)
– Softer December sales than forecast
– Offset by one-off stock investment in
pcp due to Philips’ terms renegotiation
> Expect inventory to normalise to c.$250k
per store by 30 June 2018
Statutory Statutory Statutory
$000's 31-Dec-16 30-Jun-17 31-Dec-17
Cash 14,852 2,389 9,510
Inventory 31,063 29,123 36,625
Other assets 54,804 56,341 62,688
Total assets 100,718 87,853 108,823
Trade payables 31,070 13,014 33,421
Interest bearing liabilities 7,324 11,824 7,324
Other liabilities 2,859 3,932 3,459
Total liabilities 42,374 28,770 46,119
Net assets 58,344 59,083 62,702
Low gearing and high liquidityLow gearing and high liquidityLow gearing and high liquidityLow gearing and high liquidity
STRONG CASH FLOW GENERATION
15
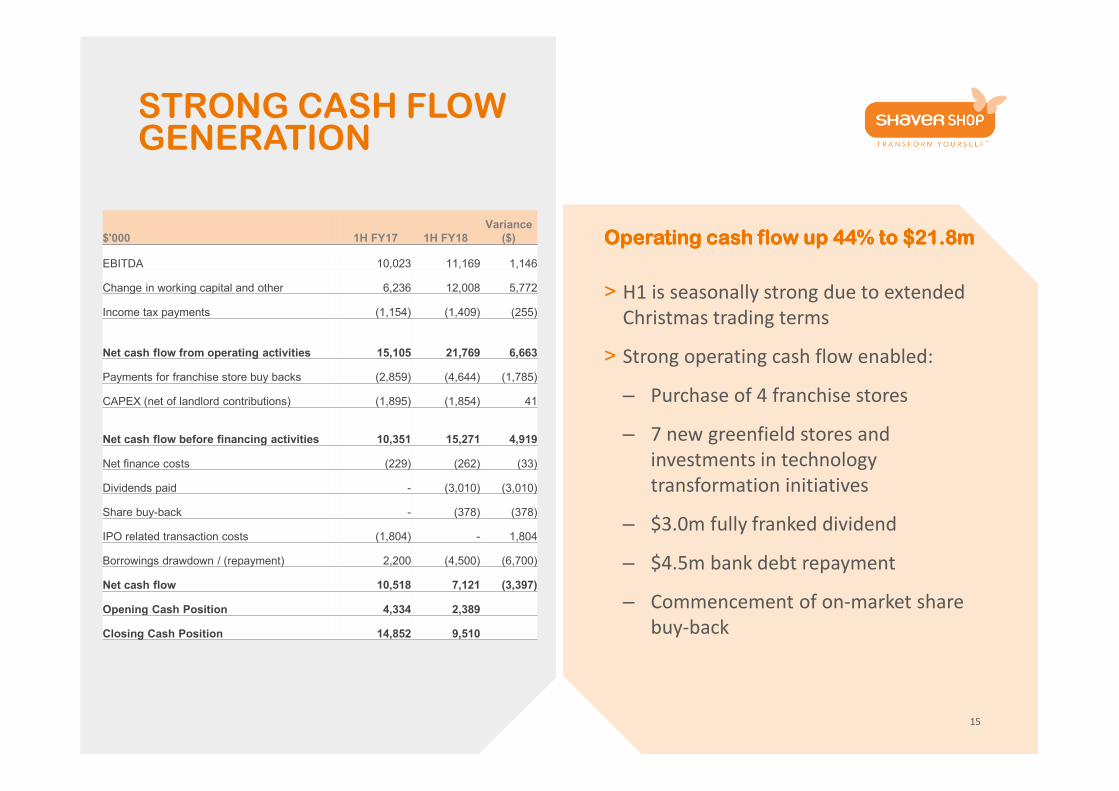
> H1 is seasonally strong due to extended
Christmas trading terms
> Strong operating cash flow enabled:
– Purchase of 4 franchise stores
– 7 new greenfield stores and
investments in technology
transformation initiatives
– $3.0m fully franked dividend
– $4.5m bank debt repayment
– Commencement of on-market share
buy-back
Operating cash flow up 44% to $Operating cash flow up 44% to $Operating cash flow up 44% to $Operating cash flow up 44% to $21.8m21.8m21.8m21.8m$'000 1H FY17 1H FY18Variance
($)
EBITDA 10,023 11,169 1,146
Change in working capital and other 6,236 12,008 5,772
Income tax payments (1,154) (1,409) (255)
Net cash flow from operating activities 15,105 21,769 6,663
Payments for franchise store buy backs (2,859) (4,644) (1,785)
CAPEX (net of landlord contributions) (1,895) (1,854) 41
Net cash flow before financing activities 10,351 15,271 4,919
Net finance costs (229) (262) (33)
Dividends paid - (3,010) (3,010)
Share buy-back - (378) (378)
IPO related transaction costs (1,804) - 1,804
Borrowings drawdown / (repayment) 2,200 (4,500) (6,700)
Net cash flow 10,518 7,121 (3,397)
Opening Cash Position 4,334 2,389
Closing Cash Position 14,852 9,510
RETURN AND CAPITAL RATIOS
16
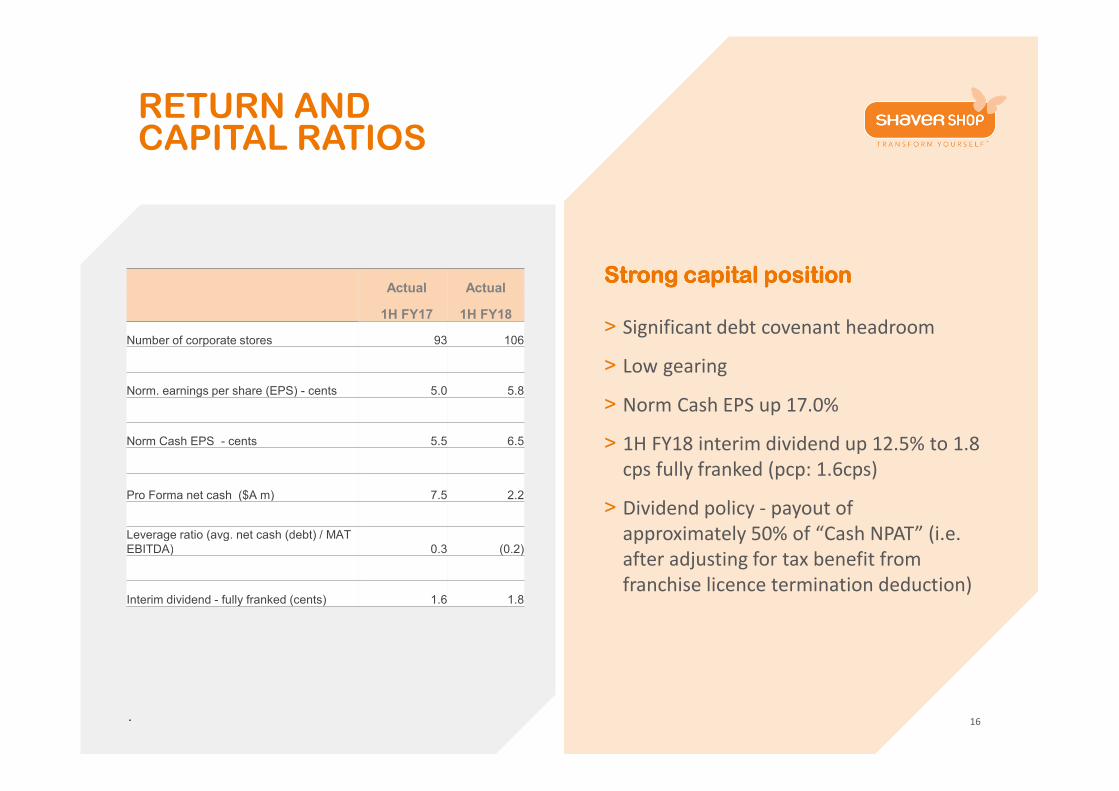
Strong capital positionStrong capital positionStrong capital positionStrong capital position
> Significant debt covenant headroom
> Low gearing
> Norm Cash EPS up 17.0%
> 1H FY18 interim dividend up 12.5% to 1.8
cps fully franked (pcp: 1.6cps)
> Dividend policy - payout of
approximately 50% of “Cash NPAT” (i.e.
after adjusting for tax benefit from
franchise licence termination deduction)
.
Actual Actual
1H FY17 1H FY18
Number of corporate stores 93 106
Norm. earnings per share (EPS) - cents 5.0 5.8
Norm Cash EPS - cents 5.5 6.5
Pro Forma net cash ($A m) 7.5 2.2
Leverage ratio (avg. net cash (debt) / MAT EBITDA) 0.3 (0.2)
Interim dividend - fully franked (cents) 1.6 1.8
03.03.03.03.KEY GROWTH DRIVERS
17
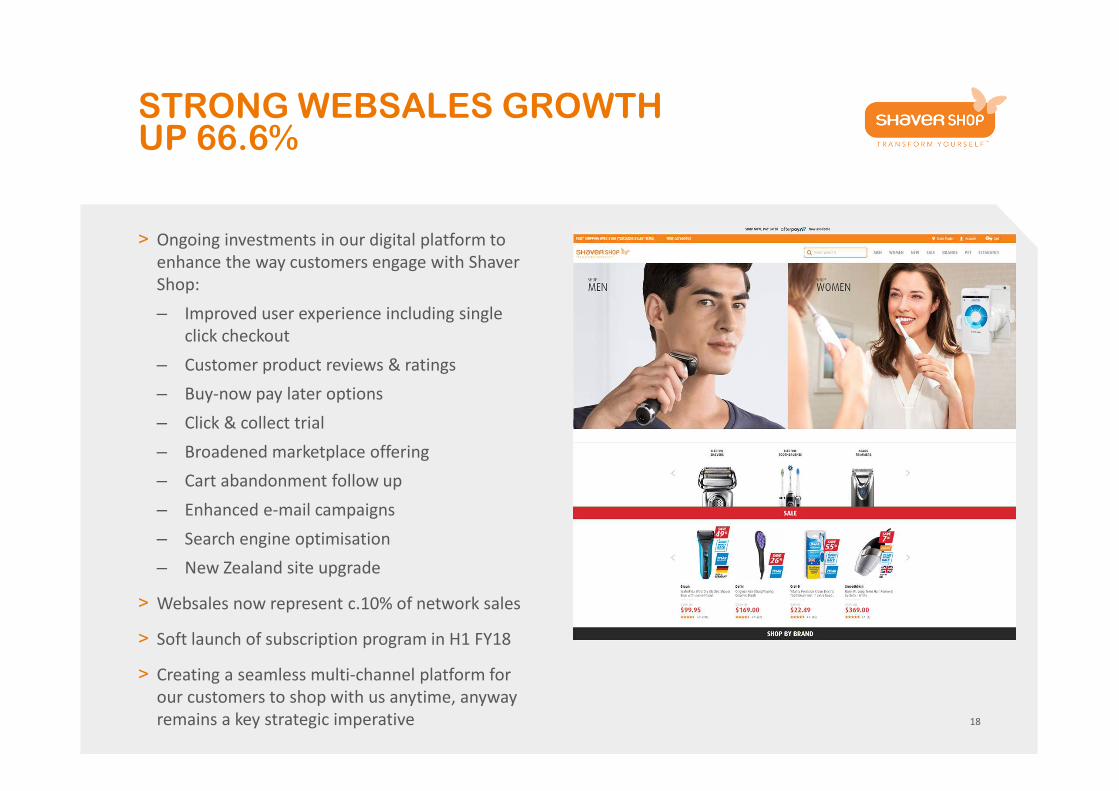
STRONG WEBSALES GROWTH UP 66.6%
18
> Ongoing investments in our digital platform to
enhance the way customers engage with Shaver
Shop:
– Improved user experience including single
click checkout
– Customer product reviews & ratings
– Buy-now pay later options
– Click & collect trial
– Broadened marketplace offering
– Cart abandonment follow up
– Enhanced e-mail campaigns
– Search engine optimisation
– New Zealand site upgrade
> Websales now represent c.10% of network sales
> Soft launch of subscription program in H1 FY18
> Creating a seamless multi-channel platform for
our customers to shop with us anytime, anyway
remains a key strategic imperative
TECHNOLOGY TRANSFORMATION INITIATIVES
19
> Shaver Shop is implementing technology solutions to drive sales growth, improved customer
experience as well as operating efficiency
> A number of projects underway:
– Launching new CRM for omnichannel view of customer in H2 FY18
– Implemented new foot traffic monitoring system in H1 FY18 to drive increased customer
conversion and improve knowledge of customer traffic patterns
– In-store automation of buy-now pay later option that is currently available online
– Enhanced demand planning and procurement solution
– Automation of previous manual processes to drive operational efficiencies across the business
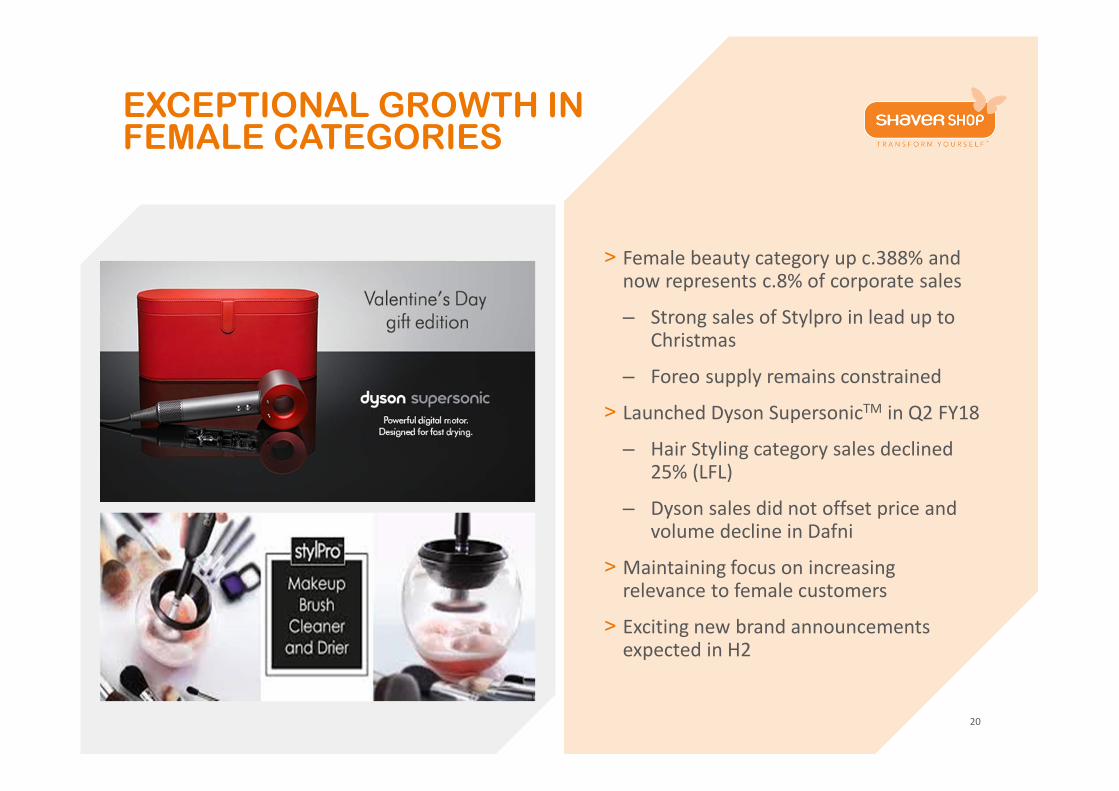
EXCEPTIONAL GROWTH IN FEMALE CATEGORIES
20
> Female beauty category up c.388% and now represents c.8% of corporate sales
– Strong sales of Stylpro in lead up to Christmas
– Foreo supply remains constrained
> Launched Dyson SupersonicTM in Q2 FY18
– Hair Styling category sales declined 25% (LFL)
– Dyson sales did not offset price and volume decline in Dafni
> Maintaining focus on increasing relevance to female customers
> Exciting new brand announcements expected in H2
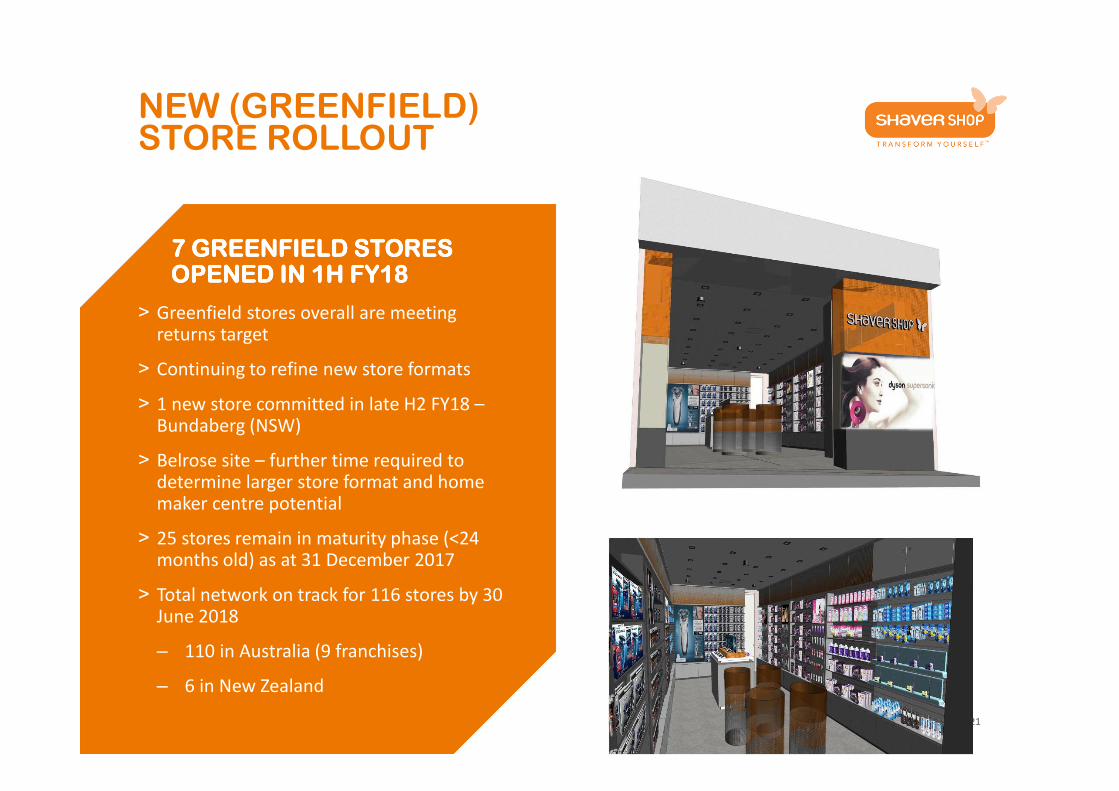
NEW (GREENFIELD) STORE ROLLOUT
7 GREENFIELD STORES 7 GREENFIELD STORES 7 GREENFIELD STORES 7 GREENFIELD STORES OPENED IN 1H FY18OPENED IN 1H FY18OPENED IN 1H FY18OPENED IN 1H FY18
> Greenfield stores overall are meeting returns target
> Continuing to refine new store formats
> 1 new store committed in late H2 FY18 –Bundaberg (NSW)
> Belrose site – further time required to determine larger store format and home maker centre potential
> 25 stores remain in maturity phase (<24 months old) as at 31 December 2017
> Total network on track for 116 stores by 30 June 2018
– 110 in Australia (9 franchises)
– 6 in New Zealand
21
FRANCHISE BUYBACKS
4 franchise buybacks completed 4 franchise buybacks completed 4 franchise buybacks completed 4 franchise buybacks completed in in in in H1 FY18H1 FY18H1 FY18H1 FY18
> 9 franchises remaining in store network
(4 owners)
> Penrith Plaza (NSW), Bankstown (NSW)
acquired in late November 2017
> Remaining franchise stores are amongst
the largest stores (by sales) and well run
making it more difficult to buyback at
attractive multiples
> Will retain a disciplined, ROI-based,
investment approach
22
04.04.04.04.TRADING UPDATE &
OUTLOOK
23
TRADING UPDATE
> Total like for like sales growth of +0.8% for the period 1 January to 15 February 2018 (Underlying LFL sales
down -0.3%)
> Sales and margin softness experienced in December continued in January
– Total Corporate Store LFL sales declined -0.8% in January (Underlying LFL sales down -1.1%)
– Sales softness in higher margin Mens Electric Shavers and Long Term Hair Reduction categories
– Promotional activity undertaken to achieve optimal stock levels during higher traffic periods
– Female Beauty and Power Oral Care continue to perform well (lower than average GP margins)
> Improving performance in February with total like for like sales growth in-line with target (to 15 Feb). Gross
margins have improved in February but still slightly below target.
– Total like for like sales up +4.8% (Underlying like for like sales up +1.7%) – to 15 Feb
> Negotiated strong promotional campaigns with major suppliers for H2 FY18
> Reduced average stock levels per store to c.$275k at mid Feb 2018
24
KEY INITIATIVES IN H2 FY18
25
1. Major new supplier launch (Q4)
2. Launch of fully functioning CRM and omni-channel customer view
3. Continued expansion across female beauty category – including launch of own brand range
4. Introduction of buy-now pay later option in-store (Q4)
5. Technology transformation project
6. Phase II of subscription program
7. Continued investment across e-commerce imperatives
SUMMARY & OUTLOOK
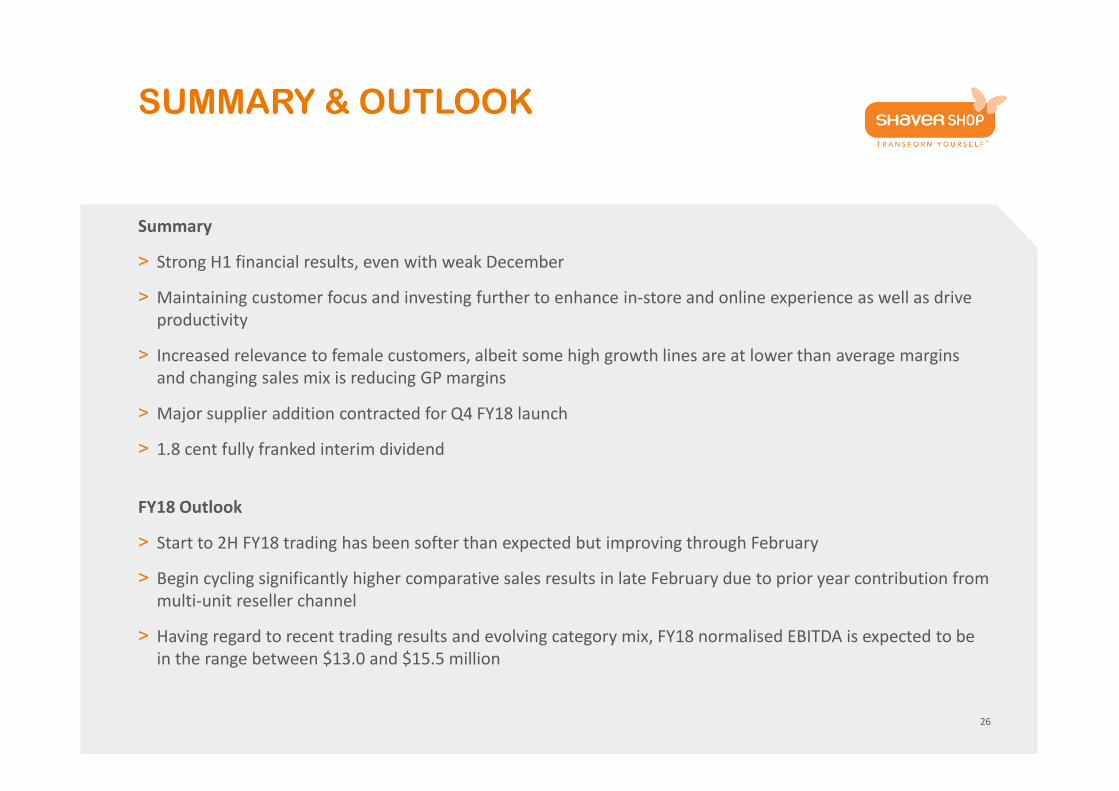
Summary
> Strong H1 financial results, even with weak December
> Maintaining customer focus and investing further to enhance in-store and online experience as well as drive
productivity
> Increased relevance to female customers, albeit some high growth lines are at lower than average margins
and changing sales mix is reducing GP margins
> Major supplier addition contracted for Q4 FY18 launch
> 1.8 cent fully franked interim dividend
FY18 Outlook
> Start to 2H FY18 trading has been softer than expected but improving through February
> Begin cycling significantly higher comparative sales results in late February due to prior year contribution from
multi-unit reseller channel
> Having regard to recent trading results and evolving category mix, FY18 normalised EBITDA is expected to be
in the range between $13.0 and $15.5 million
26

05.05.05.05.APPENDICES
27

1H FY18 KEY HIGHLIGHTS
28
Solid like for like sales and earnings growth in 1H FY18 in a challenging December retail environment
Store
sales
• Total Sales up 19.0% to $93.4m on prior corresponding period (pcp)
• 1H FY18 LFL Corporate Store Sales growth +5.5% (pcp -0.6%), Franchise +0.8% (pcp +0.4%)
• YTD network web sales growth +66.6% on the back of continued investments in e-commerce capability
• 7 new greenfield stores launched in 1H FY18
Earnings
• Normalised EBITDA up 16.3% to $11.7m in 1H FY18 (pcp $10.0m)
• Normalised gross profit margin 41.5% (pcp – 42.5%) down c.100 bps (product/category mix & multi-
unit sales)
• Normalised Cost of Doing Business 30.4% of sales (pcp – 32.2%) down c.180 bps
• Normalised cash NPAT $8.1m up 16.9% (pcp - $6.9m)
Growth
• Net CAPEX - $1.9m - opened 7 new greenfield sites, ongoing e-commerce and technology investments
• Completed 4 franchise buybacks – net investment $4.5m (including net working cap)
• Moderation in “Multi-unit” reseller channel contribution (versus 2H FY17)
• Omni-channel technology transformation continuing across CRM, e-commerce, finance & operations
Capital
Structure
• 1H FY18 operating cash flow up 44% to $21.8m (pcp $15.1m)
• Net cash $2.2m at 31 December 2017 (gross debt $7.3m)
• Low gearing – gross debt $7.3m following $4.5m debt repayment in 1H FY18
• Interim dividend up 12.5% – 1.8 cents per share fully-franked (pcp 1.6 cents per share fully franked)
• On-market share buyback announced in Oct 2017
Variances refer to FY17 actual and pro forma (where applicable) results compared to pro-forma FY16 results
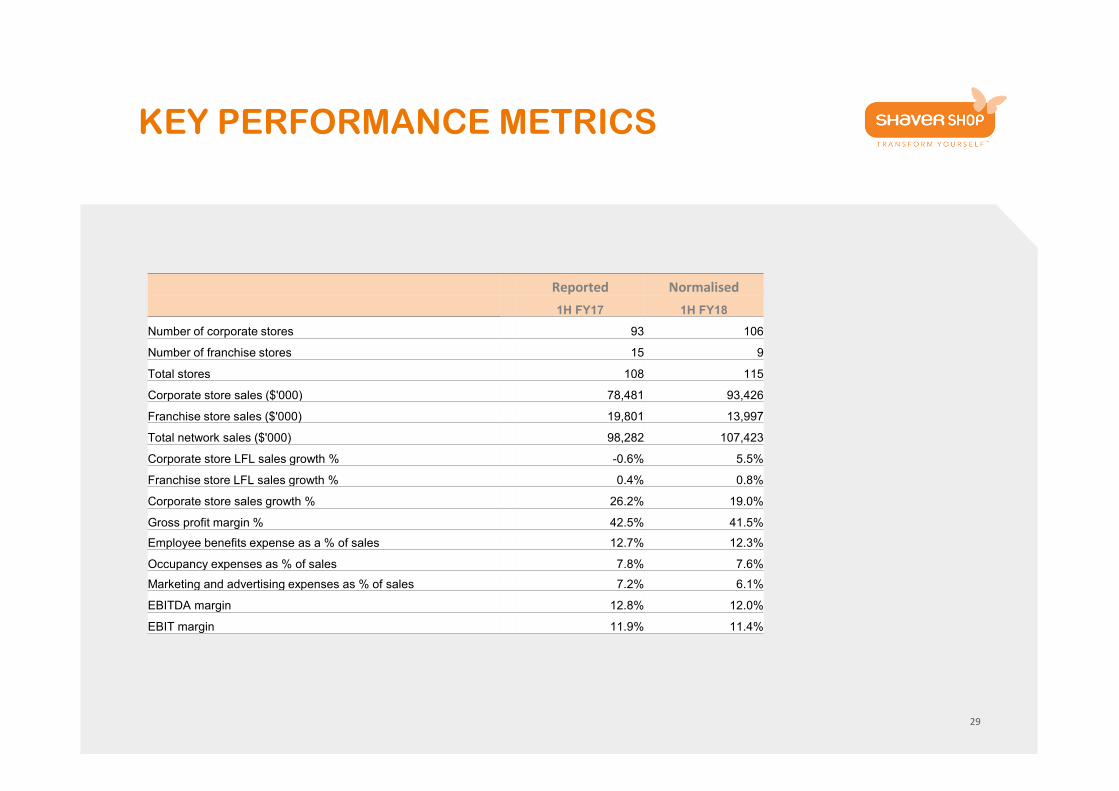
KEY PERFORMANCE METRICS
29
Reported Normalised
1H FY17 1H FY18
Number of corporate stores 93 106
Number of franchise stores 15 9
Total stores 108 115
Corporate store sales ($'000) 78,481 93,426
Franchise store sales ($'000) 19,801 13,997
Total network sales ($'000) 98,282 107,423
Corporate store LFL sales growth % -0.6% 5.5%
Franchise store LFL sales growth % 0.4% 0.8%
Corporate store sales growth % 26.2% 19.0%
Gross profit margin % 42.5% 41.5%
Employee benefits expense as a % of sales 12.7% 12.3%
Occupancy expenses as % of sales 7.8% 7.6%
Marketing and advertising expenses as % of sales 7.2% 6.1%
EBITDA margin 12.8% 12.0%
EBIT margin 11.9% 11.4%
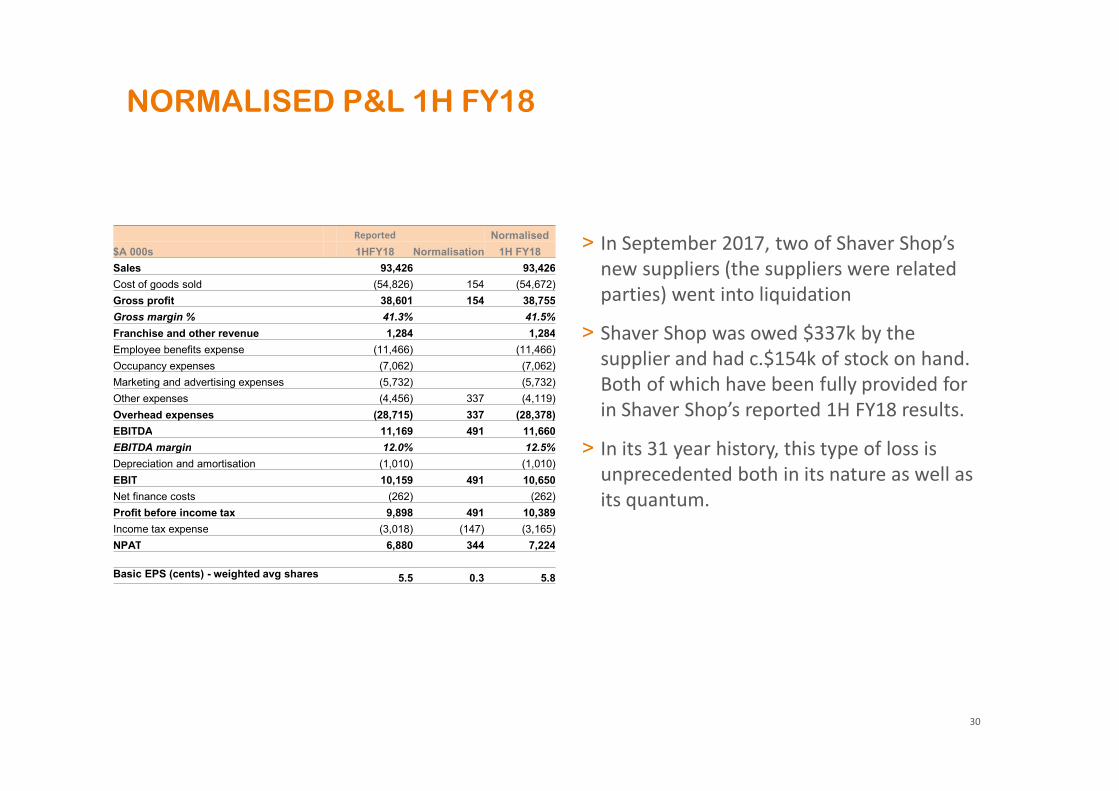
NORMALISED P&L 1H FY18
30
> In September 2017, two of Shaver Shop’s
new suppliers (the suppliers were related
parties) went into liquidation
> Shaver Shop was owed $337k by the
supplier and had c.$154k of stock on hand.
Both of which have been fully provided for
in Shaver Shop’s reported 1H FY18 results.
> In its 31 year history, this type of loss is
unprecedented both in its nature as well as
its quantum.
Reported Normalised
$A 000s 1HFY18 Normalisation 1H FY18
Sales 93,426 93,426
Cost of goods sold (54,826) 154 (54,672)
Gross profit 38,601 154 38,755
Gross margin % 41.3% 41.5%
Franchise and other revenue 1,284 1,284
Employee benefits expense (11,466) (11,466)
Occupancy expenses (7,062) (7,062)
Marketing and advertising expenses (5,732) (5,732)
Other expenses (4,456) 337 (4,119)
Overhead expenses (28,715) 337 (28,378)
EBITDA 11,169 491 11,660
EBITDA margin 12.0% 12.5%
Depreciation and amortisation (1,010) (1,010)
EBIT 10,159 491 10,650
Net finance costs (262) (262)
Profit before income tax 9,898 491 10,389
Income tax expense (3,018) (147) (3,165)
NPAT 6,880 344 7,224
Basic EPS (cents) - weighted avg shares 5.5 0.3 5.8
IMPORTANT NOTICE AND DISCLAIMER
3131
This management presentation (“Presentation”) has been prepared by Shaver Shop Group Limited ACN 150 747 649 (“Shaver Shop”) and contains general background information about Shaver Shop, its
subsidiaries and their activities which is current at the date of this Presentation.
Summary Information
The information contained in this Presentation is of a general nature and does not purport to be complete nor does it contain all the information which a prospective investor may require in evaluating a
possible investment in Shaver Shop or that would be required in a prospectus or product disclosure statement prepared in accordance with the requirements of the Corporations Act 2001 (Cth). This
Presentation should be read in conjunction with Shaver Shop’s other periodic and continuous disclosure announcements lodged with ASX, which are available at www.asx.com.au (Shaver Shop ASX Code:
SSG). This Presentation is not intended to be relied upon as advice to investors or potential investors in Shaver Shop and does not take into account the investment objectives, financial situation or needs of
any particular investor. These should be considered, with our without professional advice, when deciding if an investment is appropriate.
Disclaimer
Neither Shaver Shop, its related bodies corporate nor any of their respective officers, directors, employees, advisers and agents (Shaver Shop Parties) warrant the accuracy or reliability of the information
contained in this Presentation. To the maximum extent permitted by law, each of the Shaver Shop Parties disclaims any responsibility and liability flowing from the use of the information contained in this
Presentation by any party. To the maximum extent permitted by law, the Shaver Shop Parties do not accept any liability to any person, organisation or entity for any loss or damage suffered as a result of
reliance on this Presentation.
Past performance
Past performance, including past share price performance and historical information in this Presentation, is given for illustrative purposes only and cannot be relied upon as an indicator of, and provides no
guidance as to, future performance of Shaver Shop, including future share price performance. The historical information contained in this Presentation is not represented as being indicative of Shaver
Shop’s views on its future financial condition and/or performance.
Forward looking statements
This Presentation contains certain forward looking statements and comments about future events, including Shaver Shop’s expectations about the performance of its business. Forward looking statements
can generally be identified by the use of forward looking words such as ‘expect’, ‘anticipate’, ‘likely’, ‘intend’, ‘should’, ‘could’, ‘may’, ‘predict’, ‘plan’, ‘propose’, ‘will’, ‘believe’, ‘forecast’, ‘estimate’, ‘target’
and other similar expressions. Indications of and any guidance on future earnings or financial position or performance of Shaver Shop are also forward looking statements.
Forward looking statements involve inherent risks and uncertainties, both general and specific, and there is a risk that such predictions, forecasts, projections and other forward looking statements will not
be achieved. Shaver Shop’s IPO Prospectus dated 7 June 2016, a copy of which is available at www.asx.com.au (Shaver Shop ASX Code: SSG), contains details of a number of key risks associated with an
investment in Shaver Shop. Many of these risks are beyond the control of Shaver Shop. Should one or more of these risks or uncertainties materialise, or should any assumption underlying any forward
looking statement contained in this Presentation prove incorrect, Shaver Shop’s actual results may differ materially from the plans, objectives, expectations, estimates, and intentions expressed in the
forward looking statements contained in this Presentation. As such, undue reliance should not be placed on any forward looking statement.
Shaver Shop is providing the information contained in this Presentation as at the date of this Presentation and, except as required by law or regulation (including the ASX Listing Rules), does not assume any
obligation to update any forward-looking statements contained in this Presentation as a result of new information, future events or developments or otherwise.
Pro forma and normalised financial information
This Presentation contains pro forma and normalised financial information. The pro forma and normalised financial information and past information provided in this Presentation is for illustrative purposes
only and is not represented as being indicative of Shaver Shop’s views on its future financial condition and/or performance. The pro forma and normalised financial information has been prepared by Shaver
Shop in accordance with the measurement and recognition requirements, but not the disclosure requirements, of applicable accounting standards and other mandatory reporting requirements in Australia.
Shaver Shop uses certain measures to manage and report on its business that are not recognised under Australian Accounting Standards. These measures are referred to as non-IFRS financial information.
Shaver Shop considers that this non-IFRS financial information is important to assist in evaluating Shaver Shop’s performance. The information is presented to assist in making appropriate comparisons with
prior periods and to assess the operating performance of the business. In particular this information is important for comparative purposes with pro forma information in Shaver Shop’s Prospectus.
For a reconciliation of the non-IFRS financial information contained in this Presentation to IFRS-compliant comparative information, refer to the Directors Report that forms part of the Shaver Shop Group
Limited Consolidated Financial Report that has been lodged with the ASX. All dollar values in this Presentation are in Australian dollars (A$), unless otherwise specified.

SHAVER SHOP1H FY18 RESULTS INVESTOR PRESENTION
32
THANK YOUTHANK YOUTHANK YOUTHANK YOU