Embed Size (px)
Citation preview
SHASTA COUNTY 2012 REGIONAL TRANSPORTATION IMPROVEMENT PROGRAM
Shasta County Regional Transportation Planning Agency 1855 Placer Street Redding, CA 96001
Phone: 530-225-5654 Fax: 530-225-5667
Email: [email protected] Website: www.scrtpa.org
Approved December 19, 2011
SHASTA COUNTY 2012
REGIONAL TRANSPORTATION IMPROVEMENT PROGRAM (RTIP)
FOR FISCAL YEARS 2012/13 – 2016/17
DECEMBER 19, 2011
Prepared By:
The Shasta County Regional Transportation Planning Agency
1855 Placer Street Redding, CA 96001
In Cooperation With:
City of Redding City of Anderson
City of Shasta Lake Shasta County
Redding Area Bus Authority Caltrans District 2
The preparation of this Transportation Improvement Program was financed in part by a planning grant from the Federal Highway Administration
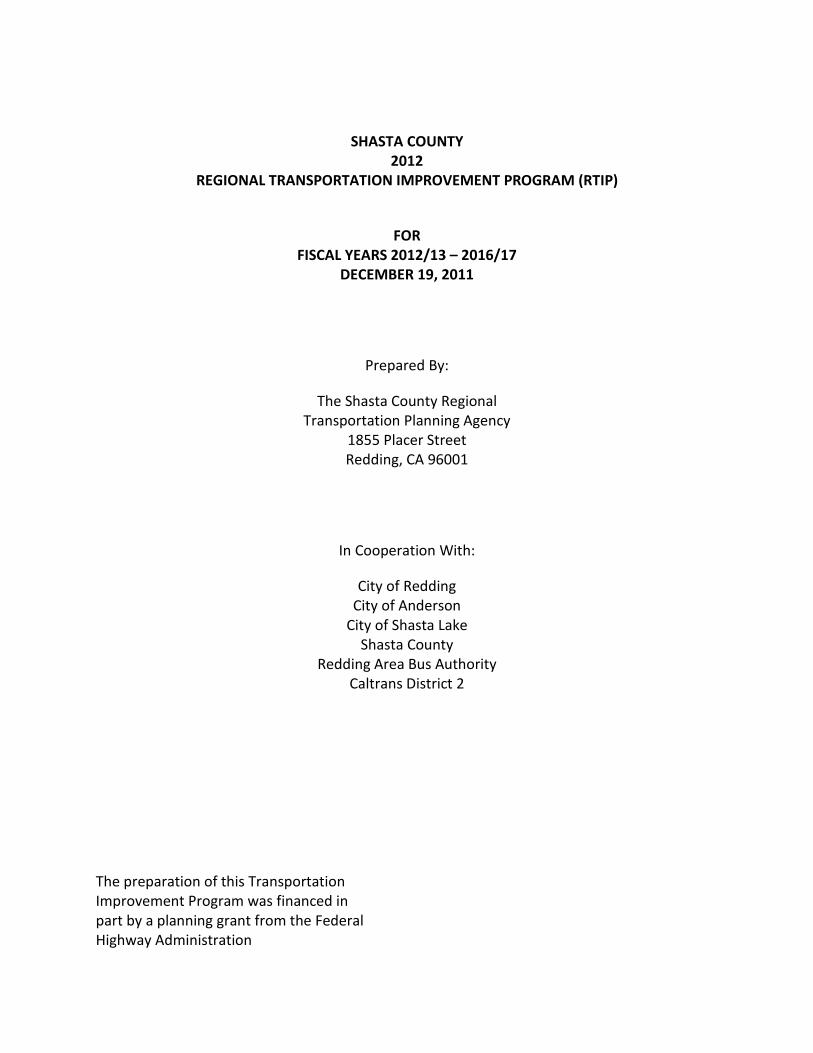
Shasta County 2012 RTIP (Proposed) Note- Values are in Thousands
FY12-13 FY 13-14 FY 14-15 FY 15-16 FY 16-172012 RTIP/ STIP Total
Beyond (CON) Total
RTIP ProgramFix 5: Redding to Anderson Six Lane (P&E, ROW) $3,760 $50 $3,810 $71,400 $75,210Planning, Programming, and Monitoring (PPM) $147 $147 $147 $147 $222 $810 $810I-5/Deschutes Road Northbound Off-Ramp (Con) $3,000 $3,000 $3,000Total $6,907 $197 $147 $147 $222 $7,620 $71,400 $79,020Notes: All dollars are RIP; no IIP funds proposed at this time. Fix 5: Redding to Anderson Six Lane is RTPA's highest priority. Request that this also be a CTC priority for early funding. Environmental already funded by RTPA. Construction estimated at $71.4 million and may be phased. IIP contribution or grant anticipated to build project. Deschutes will be matched with $3 million in non-STIP funds. Other grants are pending and if successful, may negate need for STIP funds. Deschutes STIP funds to be reimbursed to RTPA by City of Anderson for future I-5 mainline improvements per formal agreement. $810,000 in PPM includes $492,000 carryover from last three years of current STIP
Table 1

Project Nomination
Sheets
DTP-0001 (REV. 6/11)
Begin Closeout PhaseEnd Closeout Phase (Closeout Report)
N/A
End Environmental Phase (PA&ED Milestone)Begin Design (PS&E) PhaseEnd Design Phase (Ready to List for Advertisement Milestone)Begin Right of Way PhaseEnd Right of Way Phase (Right of Way Certification Milestone)Begin Construction Phase (Contract Award Milestone)
Capital Outlay
End Construction Phase (Construction Contract Acceptance Milestone)
Phone(530) 225-3180
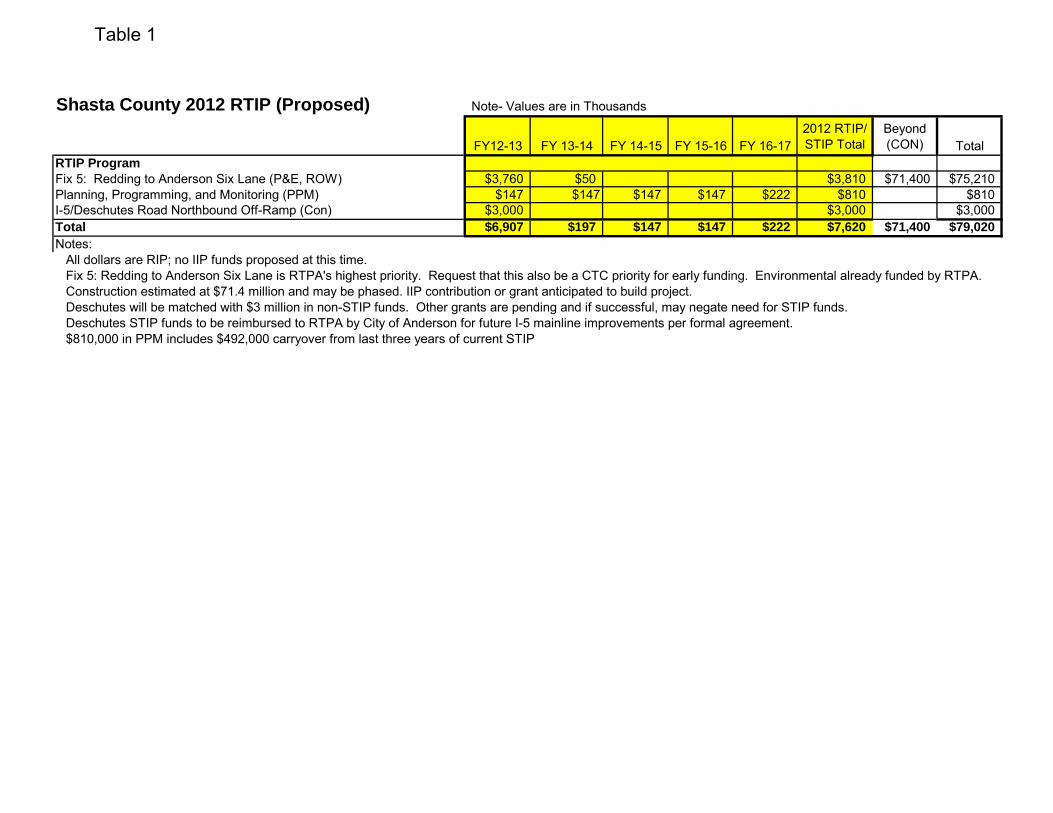
Improve regional and interregional mobility, connectivity and goods movement. Improve operations and safety by reducing traffic congestion northbound and southbound. Provide connectivity by linking two 6-lane projects, one recently completed and one in construction, on the Interstate 5 corridor in Shasta County.
Add an additional lane northbound and southbound on Interstate 5 in Shasta County through the City of Anderson to the South of the City of Redding. Widen roadway and structures in median to accomodate an additional lane and shoulder in each direction.
PM Bk PM AhdR2.0 R12.2
Interstate 5, in Shasta County from Anderson to Redding from Deschutes Road to Bechelli-Churn Creek interchange. Widen to 6 lanes.
Location, Project Limits, Description, Scope of Work, Legislative Description
Assembly:
PS&E CaltransCaltransCaltrans
CaltransReimbursements
County Route/Corridor Project Sponsor/Lead AgencyShasta County RTPA
EA
Project Mgr/ContactPhil Baker
MPO ID TCRP No.02
5
District
SHA
Project ID PPNO
12/19/11
Project Benefits
2Congressional:
Proposed12/15/11
Project MilestoneProject Study Report ApprovedBegin Environmental (PA&ED) Phase
12/01/12
Document Type
01/01/17
12/01/12
01/01/1303/01/1402/01/15
08/01/14
Draft Project Report
STATE OF CALIFORNIA ● DEPARTMENT OF TRANSPORTATION
PROJECT PROGRAMMING REQUEST
Date: 12/05/11
General Instructions
Senate:Legislative DistrictsConstruction
2 4
Right of Way
For individuals with sensory disabilities, this document is available in alternate formats. For information call (916) 654-6410 or TDD (916) 654-3880 or write Records and Forms Management, 1120 N Street, MS-89, Sacramento, CA 95814.
ADA Notice
01/01/1701/01/18
Component
Circulate Draft Environmental Document
PA&ED
Purpose and Need
4C402 0200020191 3445
Implementing Agency
E-mail Address
MPOShasta
Element
Redding to Anderson 6-Lane
Project Title
New Project Amendment (Existing Project)
1 of 2
DTP-0001 (REV. 6/11) Date: 12/05/11
District EA02 4C402
Project Title:
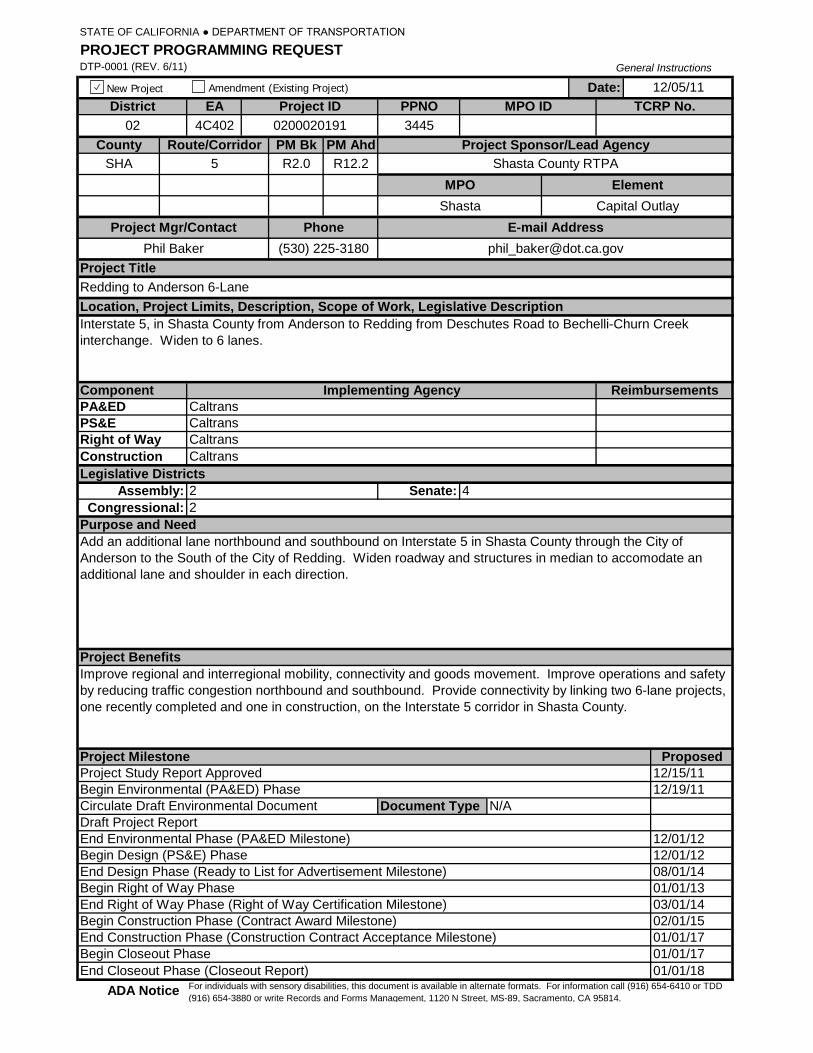
Component Prior 12/13 13/14 14/15 15/16 16/17 17/18+ Total
E&P (PA&ED) 340 340
PS&E 3,760 3,760
R/W SUP (CT) 25 25
CON SUP (CT) 6,400 6,400
R/W 25 25
CON 65,000 65,000
TOTAL 340 3,760 50 71,400 75,550
Fund No. 1:
Component Prior 12/13 13/14 14/15 15/16 16/17 17/18+ Total
E&P (PA&ED) 340 340
PS&E
R/W SUP (CT)
CON SUP (CT)
R/W
CON
TOTAL 340 340
Fund No. 2:
Component Prior 12/13 13/14 14/15 15/16 16/17 17/18+ Total
E&P (PA&ED)
PS&E 3,760 3,760
R/W SUP (CT) 25 25
CON SUP (CT)
R/W 25 25
CON
TOTAL 3,760 50 3,810
Fund No. 3:
Component Prior 12/13 13/14 14/15 15/16 16/17 17/18+ Total
E&P (PA&ED)
PS&E
R/W SUP (CT)
CON SUP (CT) 6,400 6,400
R/W
CON 65,000 65,000
TOTAL 71,400 71,400
STATE OF CALIFORNIA ● DEPARTMENT OF TRANSPORTATION
Route TCRP No.
PROJECT PROGRAMMING REQUEST
County Project ID PPNO
Redding to Anderson 6-Lane
5 SHA 0200020191 3445
STIP Regional Improvement Program Program CodeProposed Funding 20.20.075.600
Local Funds in FY 11/12 for PA&ED
Proposed Total Project Cost Notes
Funding AgencyShasta County RTPA
State Highway Projects Funded From Other Sources Program CodeProposed Funding 20.20.400
Funding AgencySCRTPA
Funding AgencySCRTPA/CTC
SCRTPA expects total project funding at project conclusion, CON shares proposal at $33,625 RIP and $37,775 IIP.
PS&E, R/W Support, R/W Capital - 100% RIP
STIP Regional Improvement Program Program CodeProposed Funding 20.20.075.600
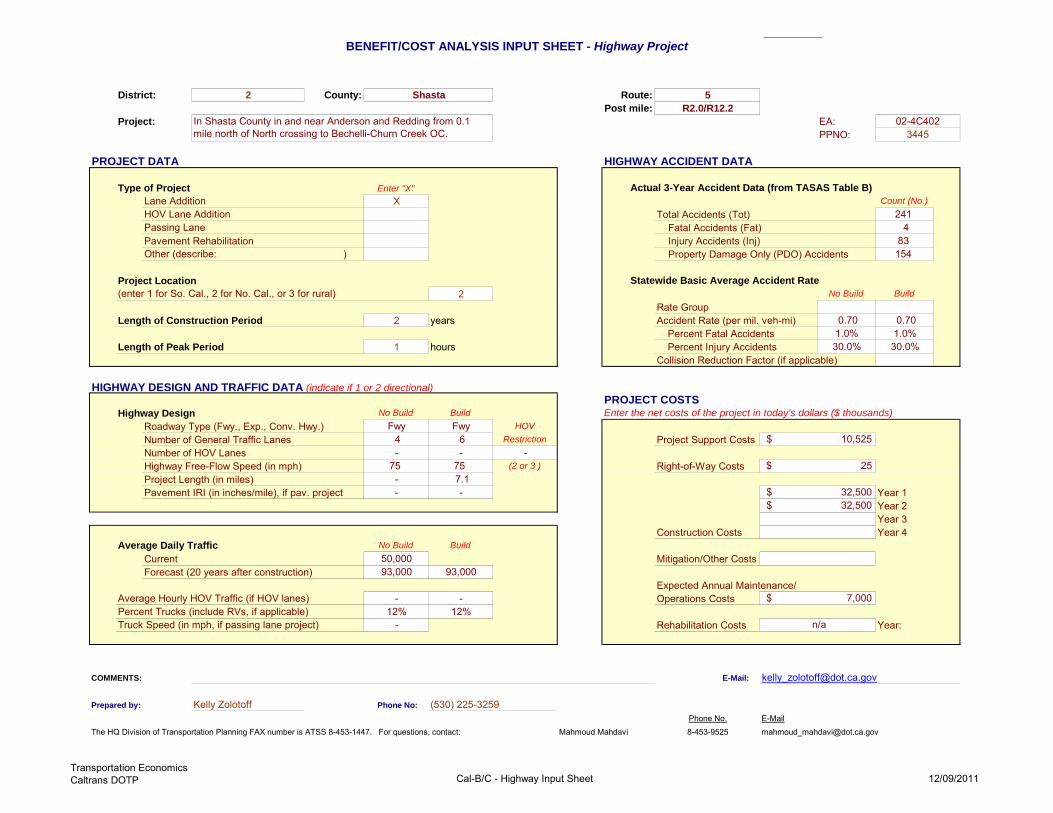
Transportation EconomicsCaltrans DOTP Cal-B/C - Highway Input Sheet 12/09/2011
BENEFIT/COST ANALYSIS INPUT SHEET - Highway Project
District: 2 County: Route: 5Post mile: R2.0/R12.2
Project: EA:PPNO:
PROJECT DATA HIGHWAY ACCIDENT DATA
Type of Project Enter "X" Actual 3-Year Accident Data (from TASAS Table B)Lane Addition X Count (No.)HOV Lane Addition Total Accidents (Tot) 241Passing Lane Fatal Accidents (Fat) 4Pavement Rehabilitation Injury Accidents (Inj) 83Other (describe: ) Property Damage Only (PDO) Accidents 154
Project Location Statewide Basic Average Accident Rate(enter 1 for So. Cal., 2 for No. Cal., or 3 for rural) 2 No Build Build
Rate GroupLength of Construction Period 2 years Accident Rate (per mil. veh-mi) 0.70 0.70
Percent Fatal Accidents 1.0% 1.0%Length of Peak Period 1 hours Percent Injury Accidents 30.0% 30.0%
Collision Reduction Factor (if applicable)
HIGHWAY DESIGN AND TRAFFIC DATA (indicate if 1 or 2 directional)PROJECT COSTS
Highway Design No Build Build Enter the net costs of the project in today's dollars ($ thousands)Roadway Type (Fwy., Exp., Conv. Hwy.) Fwy Fwy HOVNumber of General Traffic Lanes 4 6 Restriction Project Support CostsNumber of HOV Lanes - - -Highway Free-Flow Speed (in mph) 75 75 (2 or 3 ) Right-of-Way CostsProject Length (in miles) - 7.1Pavement IRI (in inches/mile), if pav. project - - Year 1
Year 2Year 3
Construction Costs Year 4Average Daily Traffic No Build Build
Current 50,000 Mitigation/Other CostsForecast (20 years after construction) 93,000 93,000
Expected Annual Maintenance/Average Hourly HOV Traffic (if HOV lanes) - - Operations CostsPercent Trucks (include RVs, if applicable) 12% 12%Truck Speed (in mph, if passing lane project) - Rehabilitation Costs Year:
COMMENTS: E-Mail:
Prepared by: Kelly Zolotoff Phone No: Phone No. E-Mail
The HQ Division of Transportation Planning FAX number is ATSS 8-453-1447. For questions, contact: Mahmoud Mahdavi 8-453-9525 [email protected]
$ 25
Shasta
In Shasta County in and near Anderson and Redding from 0.1 mile north of North crossing to Bechelli-Churn Creek OC.
02-4C4023445
$ 10,525
n/a
(530) 225-3259
$ 32,500 $ 32,500
$ 7,000
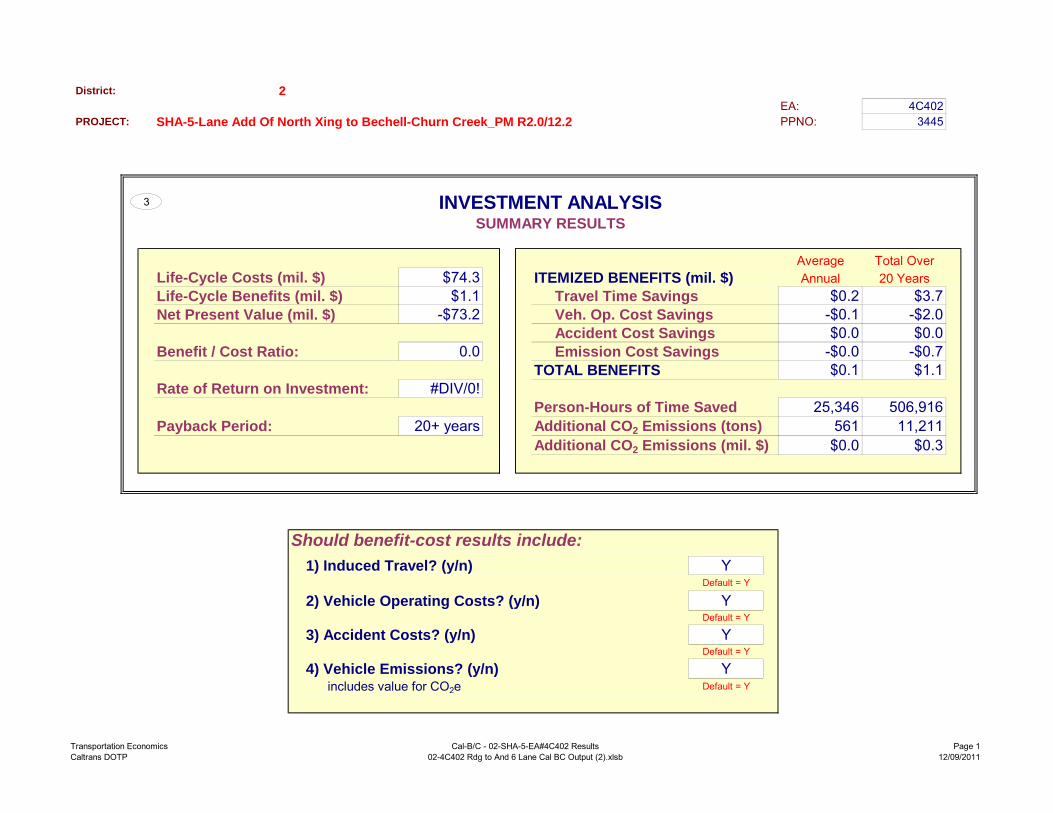
Transportation EconomicsCaltrans DOTP
Cal-B/C - 02-SHA-5-EA#4C402 Results02-4C402 Rdg to And 6 Lane Cal BC Output (2).xlsb
Page 112/09/2011
District: 2EA: 4C402
PROJECT: SHA-5-Lane Add Of North Xing to Bechell-Churn Creek_PM R2.0/12.2 PPNO: 3445
3 INVESTMENT ANALYSISSUMMARY RESULTS
Average Total OverLife-Cycle Costs (mil. $) $74.3 ITEMIZED BENEFITS (mil. $) Annual 20 YearsLife-Cycle Benefits (mil. $) $1.1 Travel Time Savings $0.2 $3.7Net Present Value (mil. $) -$73.2 Veh. Op. Cost Savings -$0.1 -$2.0
Accident Cost Savings $0.0 $0.0Benefit / Cost Ratio: 0.0 Emission Cost Savings -$0.0 -$0.7
TOTAL BENEFITS $0.1 $1.1Rate of Return on Investment: #DIV/0!
Person-Hours of Time Saved 25,346 506,916Payback Period: 20+ years Additional CO2 Emissions (tons) 561 11,211
Additional CO2 Emissions (mil. $) $0.0 $0.3
Should benefit-cost results include:1) Induced Travel? (y/n) Y
Default = Y
2) Vehicle Operating Costs? (y/n) YDefault = Y
3) Accident Costs? (y/n) YDefault = Y
4) Vehicle Emissions? (y/n) Yincludes value for CO2e Default = Y
DTP-0001 (REV. 6/11)
Begin Closeout PhaseEnd Closeout Phase (Closeout Report)
N/A
End Environmental Phase (PA&ED Milestone)Begin Design (PS&E) PhaseEnd Design Phase (Ready to List for Advertisement Milestone)Begin Right of Way PhaseEnd Right of Way Phase (Right of Way Certification Milestone)Begin Construction Phase (Contract Award Milestone)
Local Assistance
End Construction Phase (Construction Contract Acceptance Milestone)
Phone530-245-6826
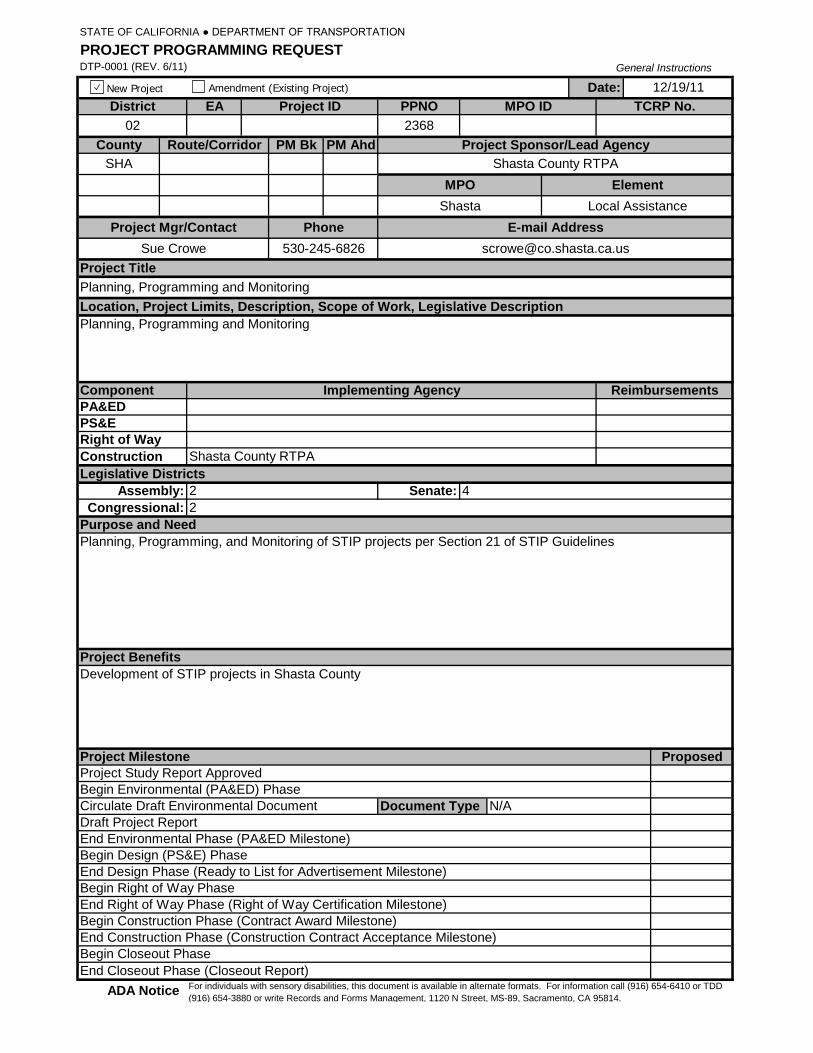
Development of STIP projects in Shasta County
Planning, Programming, and Monitoring of STIP projects per Section 21 of STIP Guidelines
PM Bk PM Ahd
Planning, Programming and MonitoringLocation, Project Limits, Description, Scope of Work, Legislative Description
Assembly:
PS&E
Shasta County RTPA
Reimbursements
County Route/Corridor Project Sponsor/Lead AgencyShasta County RTPA
EA
Project Mgr/ContactSue Crowe
MPO ID TCRP No.02
District
SHA
Project ID PPNO
Project Benefits
2Congressional:
ProposedProject MilestoneProject Study Report ApprovedBegin Environmental (PA&ED) Phase
Document TypeDraft Project Report
STATE OF CALIFORNIA ● DEPARTMENT OF TRANSPORTATION
PROJECT PROGRAMMING REQUEST
Date: 12/19/11
General Instructions
Senate:Legislative DistrictsConstruction
2 4
Right of Way
For individuals with sensory disabilities, this document is available in alternate formats. For information call (916) 654-6410 or TDD (916) 654-3880 or write Records and Forms Management, 1120 N Street, MS-89, Sacramento, CA 95814.
ADA Notice
Component
Circulate Draft Environmental Document
PA&ED
Purpose and Need
2368
Implementing Agency
E-mail Address
MPOShasta
Element
Planning, Programming and Monitoring
Project Title
New Project Amendment (Existing Project)
1 of 2
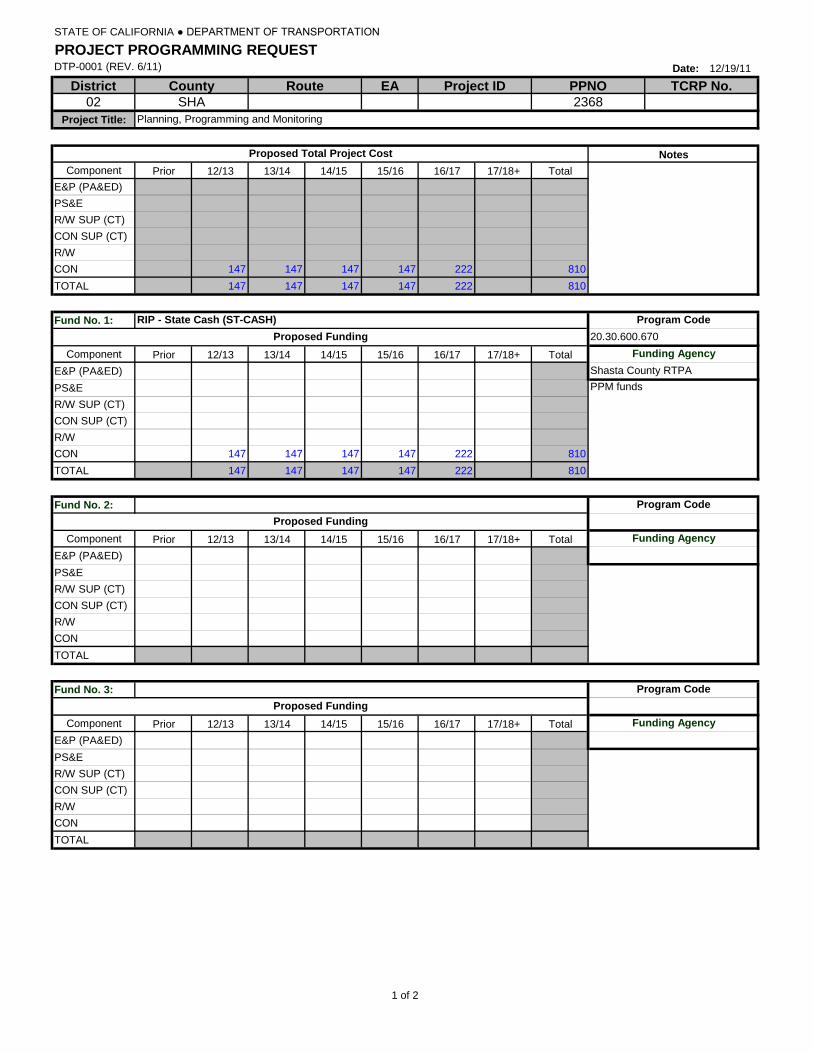
DTP-0001 (REV. 6/11) Date: 12/19/11
District EA02
Project Title:
Component Prior 12/13 13/14 14/15 15/16 16/17 17/18+ Total
E&P (PA&ED)
PS&E
R/W SUP (CT)
CON SUP (CT)
R/W
CON 147 147 147 147 222 810
TOTAL 147 147 147 147 222 810
Fund No. 1:
Component Prior 12/13 13/14 14/15 15/16 16/17 17/18+ Total
E&P (PA&ED)
PS&E
R/W SUP (CT)
CON SUP (CT)
R/W
CON 147 147 147 147 222 810
TOTAL 147 147 147 147 222 810
Fund No. 2:
Component Prior 12/13 13/14 14/15 15/16 16/17 17/18+ Total
E&P (PA&ED)
PS&E
R/W SUP (CT)
CON SUP (CT)
R/W
CON
TOTAL
Fund No. 3:
Component Prior 12/13 13/14 14/15 15/16 16/17 17/18+ Total
E&P (PA&ED)
PS&E
R/W SUP (CT)
CON SUP (CT)
R/W
CON
TOTAL
STATE OF CALIFORNIA ● DEPARTMENT OF TRANSPORTATION
Route TCRP No.
PROJECT PROGRAMMING REQUEST
County Project ID PPNO
Planning, Programming and Monitoring
SHA 2368
Program CodeProposed Funding
PPM funds
Proposed Total Project Cost Notes
Funding Agency
RIP - State Cash (ST-CASH) Program CodeProposed Funding 20.30.600.670
Funding AgencyShasta County RTPA
Funding Agency
Program CodeProposed Funding
DTP-0001 (REV. 6/11)
34760 3488
Implementing Agency
E-mail Address
MPOShasta
Element
I-5/Deschutes Road NB Off-Ramp
Project Title
For individuals with sensory disabilities, this document is available in alternate formats. For information call (916) 654-6410 or TDD (916) 654-3880 or write Records and Forms Management, 1120 N Street, MS-89, Sacramento, CA 95814.
ADA Notice
12/01/1205/01/13
Component
Circulate Draft Environmental Document
PA&ED
Purpose and Need
Senate:Legislative DistrictsConstruction
2 4
Right of Way
STATE OF CALIFORNIA ● DEPARTMENT OF TRANSPORTATION
PROJECT PROGRAMMING REQUEST
Date: 12/19/11
General Instructions
05/01/11
Document Type
12/01/12
Complete
05/01/1102/15/1205/01/12
03/01/12
CompleteDraft Project Report
CompleteComplete
Project Benefits
2Congressional:
ProposedComplete
Project MilestoneProject Study Report ApprovedBegin Environmental (PA&ED) Phase
MPO ID TCRP No.02
I-5
District
SHA
Project ID PPNO
County Route/Corridor Project Sponsor/Lead AgencyShasta County RTPA
EA
Project Mgr/ContactJeff Kiser
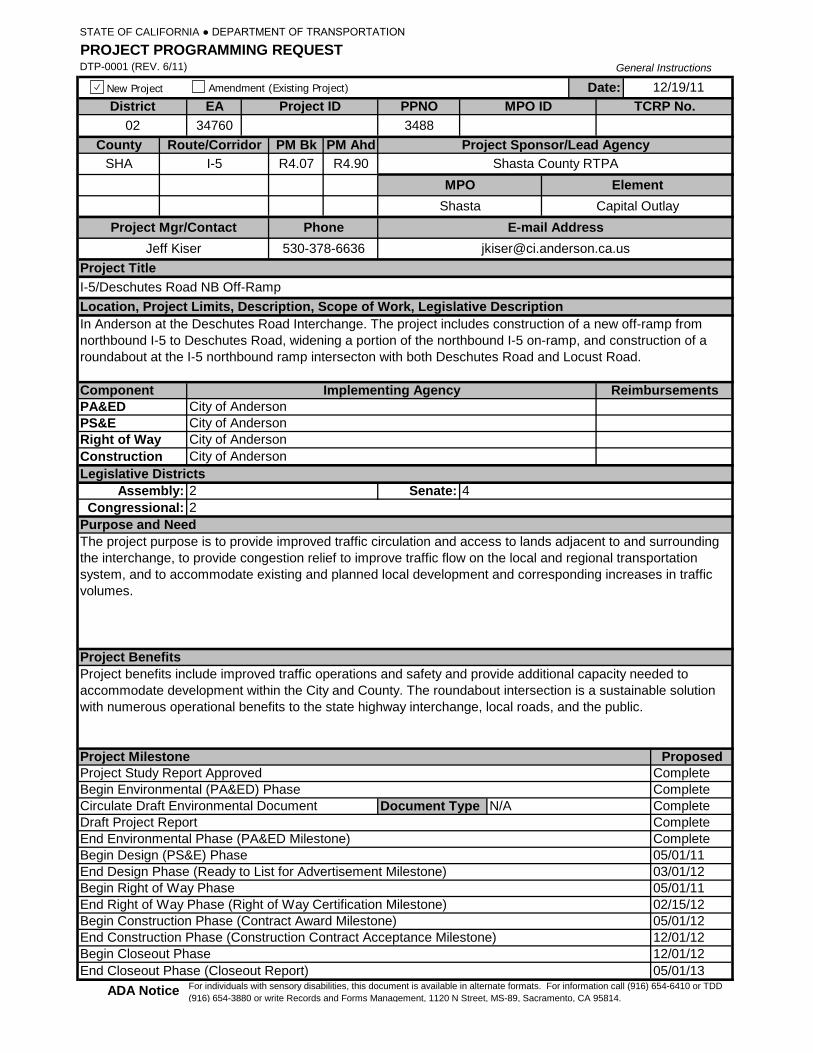
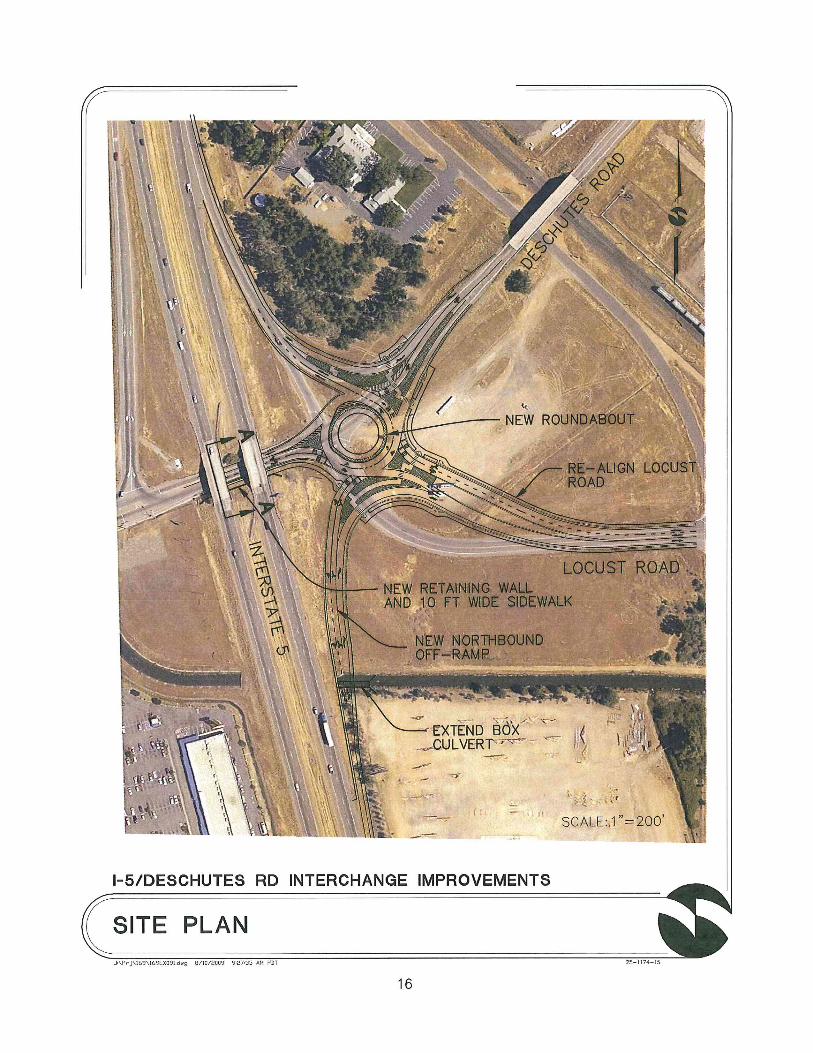
In Anderson at the Deschutes Road Interchange. The project includes construction of a new off-ramp from northbound I-5 to Deschutes Road, widening a portion of the northbound I-5 on-ramp, and construction of a roundabout at the I-5 northbound ramp intersecton with both Deschutes Road and Locust Road.
Location, Project Limits, Description, Scope of Work, Legislative Description
Assembly:
PS&E City of AndersonCity of AndersonCity of Anderson
City of AndersonReimbursements
PM Bk PM AhdR4.07 R4.90
Capital Outlay
End Construction Phase (Construction Contract Acceptance Milestone)
Phone530-378-6636
Project benefits include improved traffic operations and safety and provide additional capacity needed to accommodate development within the City and County. The roundabout intersection is a sustainable solution with numerous operational benefits to the state highway interchange, local roads, and the public.
The project purpose is to provide improved traffic circulation and access to lands adjacent to and surrounding the interchange, to provide congestion relief to improve traffic flow on the local and regional transportation system, and to accommodate existing and planned local development and corresponding increases in traffic volumes.
Begin Closeout PhaseEnd Closeout Phase (Closeout Report)
N/A
End Environmental Phase (PA&ED Milestone)Begin Design (PS&E) PhaseEnd Design Phase (Ready to List for Advertisement Milestone)Begin Right of Way PhaseEnd Right of Way Phase (Right of Way Certification Milestone)Begin Construction Phase (Contract Award Milestone)
New Project Amendment (Existing Project)
1 of 2
DTP-0001 (REV. 6/11) Date: 12/19/11
District EA02 34760
Project Title:
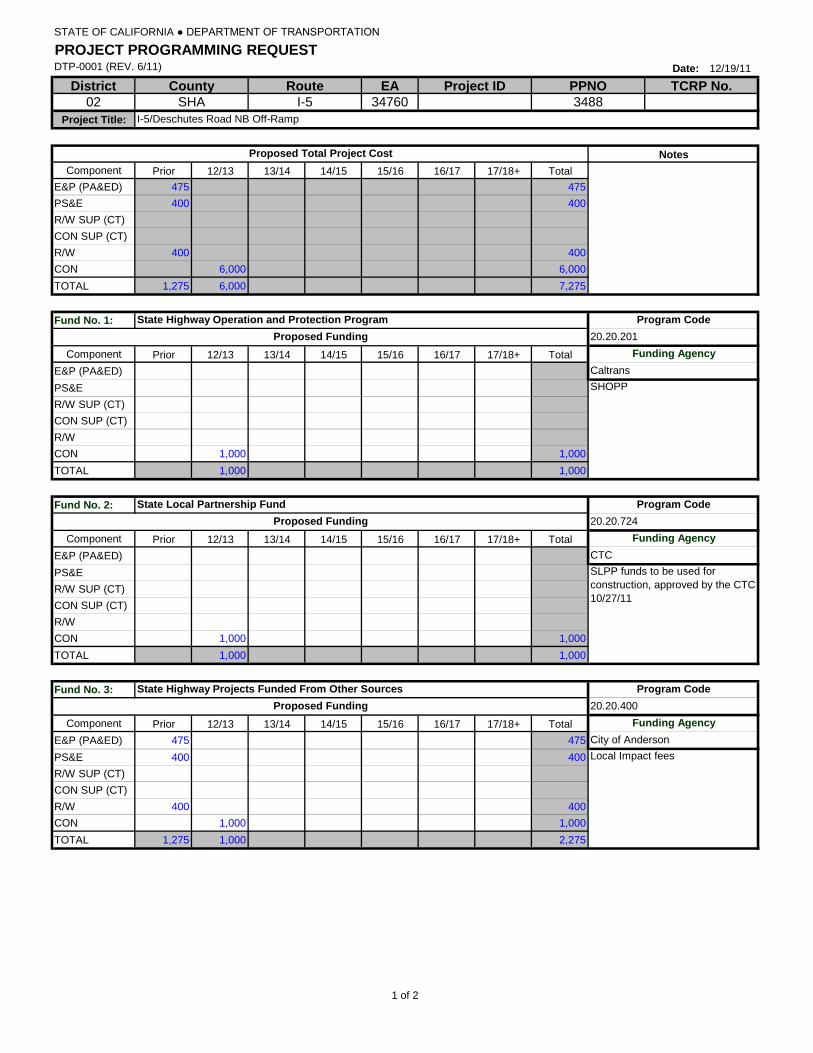
Component Prior 12/13 13/14 14/15 15/16 16/17 17/18+ Total
E&P (PA&ED) 475 475
PS&E 400 400
R/W SUP (CT)
CON SUP (CT)
R/W 400 400
CON 6,000 6,000
TOTAL 1,275 6,000 7,275
Fund No. 1:
Component Prior 12/13 13/14 14/15 15/16 16/17 17/18+ Total
E&P (PA&ED)
PS&E
R/W SUP (CT)
CON SUP (CT)
R/W
CON 1,000 1,000
TOTAL 1,000 1,000
Fund No. 2:
Component Prior 12/13 13/14 14/15 15/16 16/17 17/18+ Total
E&P (PA&ED)
PS&E
R/W SUP (CT)
CON SUP (CT)
R/W
CON 1,000 1,000
TOTAL 1,000 1,000
Fund No. 3:
Component Prior 12/13 13/14 14/15 15/16 16/17 17/18+ Total
E&P (PA&ED) 475 475
PS&E 400 400
R/W SUP (CT)
CON SUP (CT)
R/W 400 400
CON 1,000 1,000
TOTAL 1,275 1,000 2,275
Funding AgencyCity of Anderson
Local Impact fees
SLPP funds to be used for construction, approved by the CTC 10/27/11
State Highway Projects Funded From Other Sources Program CodeProposed Funding 20.20.400
Proposed Total Project Cost Notes
Funding AgencyCTC
State Highway Operation and Protection Program Program CodeProposed Funding 20.20.201
Funding AgencyCaltrans
State Local Partnership Fund Program CodeProposed Funding 20.20.724
SHOPP
I-5/Deschutes Road NB Off-Ramp
I-5 SHA 3488
STATE OF CALIFORNIA ● DEPARTMENT OF TRANSPORTATION
Route TCRP No.
PROJECT PROGRAMMING REQUEST
County Project ID PPNO
2 of 2
DTP-0001 (REV. 6/11) Date: 12/19/11
District EA02 34760
Project Title:
I-5/Deschutes Road NB Off-Ramp
I-5 SHA 3488
STATE OF CALIFORNIA ● DEPARTMENT OF TRANSPORTATION
Route TCRP No.
PROJECT PROGRAMMING REQUEST
County Project ID PPNO
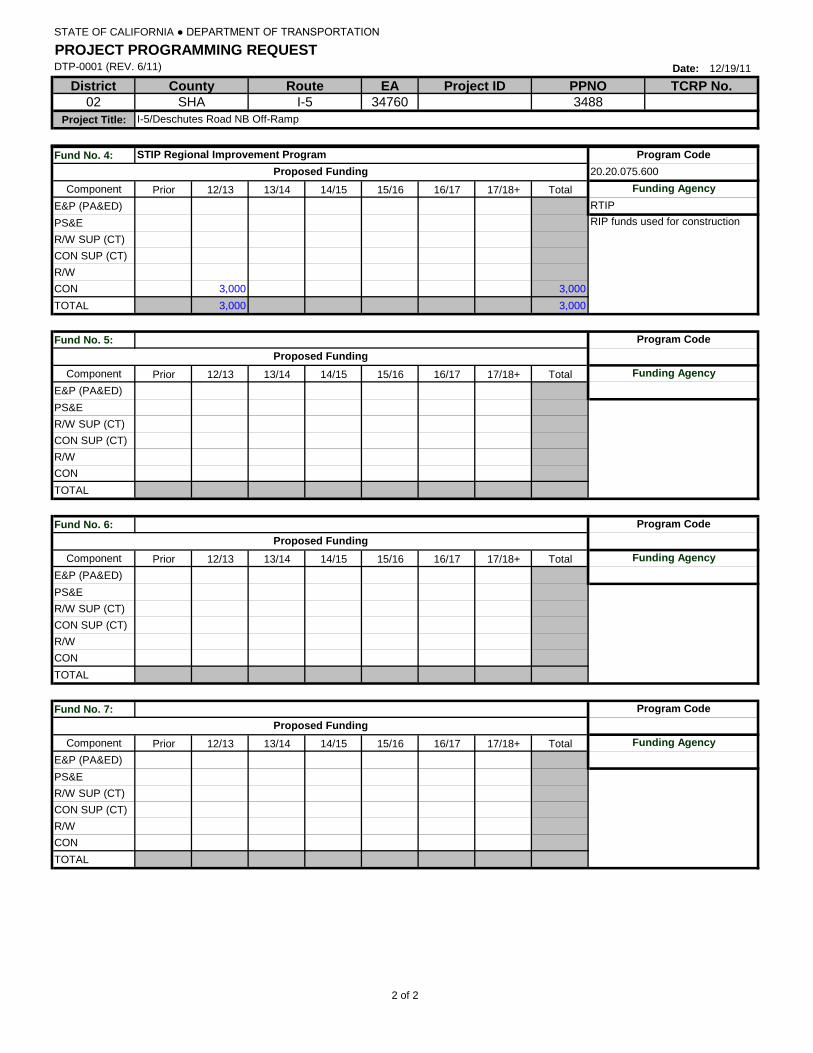
Fund No. 4:
Component Prior 12/13 13/14 14/15 15/16 16/17 17/18+ Total
E&P (PA&ED)
PS&E
R/W SUP (CT)
CON SUP (CT)
R/W
CON 3,000 3,000
TOTAL 3,000 3,000
Fund No. 5:
Component Prior 12/13 13/14 14/15 15/16 16/17 17/18+ Total
E&P (PA&ED)
PS&E
R/W SUP (CT)
CON SUP (CT)
R/W
CON
TOTAL
Fund No. 6:
Component Prior 12/13 13/14 14/15 15/16 16/17 17/18+ Total
E&P (PA&ED)
PS&E
R/W SUP (CT)
CON SUP (CT)
R/W
CON
TOTAL
Fund No. 7:
Component Prior 12/13 13/14 14/15 15/16 16/17 17/18+ Total
E&P (PA&ED)
PS&E
R/W SUP (CT)
CON SUP (CT)
R/W
CON
TOTAL
Funding Agency
Program CodeProposed Funding
Proposed FundingFunding Agency
Funding Agency
Program Code
RIP funds used for construction
Program CodeProposed Funding
Proposed Funding 20.20.075.600
Funding AgencyRTIP
STIP Regional Improvement Program Program Code
Transportation EconomicsCaltrans DOTP Cal-B/C - Interchange Input Sheet 12/09/2011
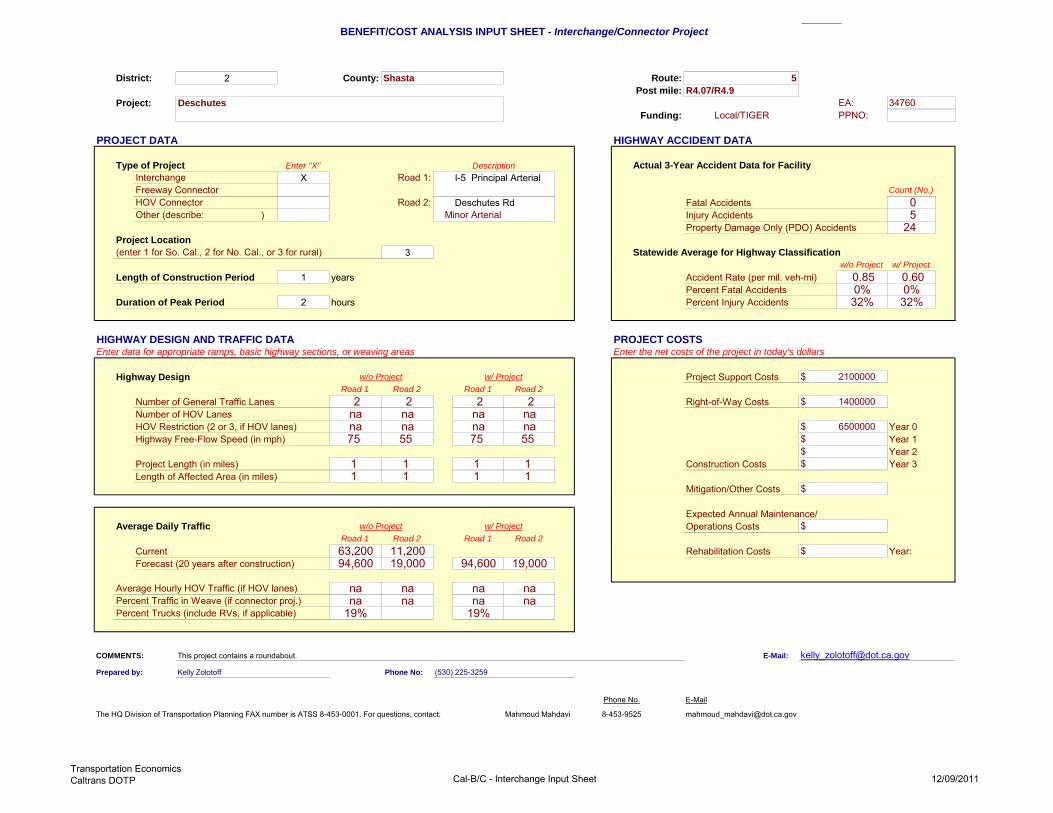
BENEFIT/COST ANALYSIS INPUT SHEET - Interchange/Connector Project
District: 2 County: Shasta Route: 5Post mile: R4.07/R4.9
Project: Deschutes EA: 34760Funding: Local/TIGER PPNO:
PROJECT DATA HIGHWAY ACCIDENT DATA
Type of Project Enter "X" Description Actual 3-Year Accident Data for FacilityInterchange X Road 1: I-5 Principal ArterialFreeway Connector Count (No.)HOV Connector Road 2: Deschutes Rd Fatal Accidents 0Other (describe: ) Minor Arterial Injury Accidents 5
Property Damage Only (PDO) Accidents 24Project Location (enter 1 for So. Cal., 2 for No. Cal., or 3 for rural) 3 Statewide Average for Highway Classification
w/o Project w/ ProjectLength of Construction Period 1 years Accident Rate (per mil. veh-mi) 0.85 0.60
Percent Fatal Accidents 0% 0%Duration of Peak Period 2 hours Percent Injury Accidents 32% 32%
HIGHWAY DESIGN AND TRAFFIC DATA PROJECT COSTSEnter data for appropriate ramps, basic highway sections, or weaving areas Enter the net costs of the project in today's dollars
Highway Design w/o Project w/ Project Project Support Costs $ 2100000Road 1 Road 2 Road 1 Road 2
Number of General Traffic Lanes 2 2 2 2 Right-of-Way Costs $ 1400000Number of HOV Lanes na na na naHOV Restriction (2 or 3, if HOV lanes) na na na na $ 6500000 Year 0Highway Free-Flow Speed (in mph) 75 55 75 55 $ Year 1
$ Year 2Project Length (in miles) 1 1 1 1 Construction Costs $ Year 3Length of Affected Area (in miles) 1 1 1 1
Mitigation/Other Costs $
Expected Annual Maintenance/Average Daily Traffic w/o Project w/ Project Operations Costs $
Road 1 Road 2 Road 1 Road 2Current 63,200 11,200 Rehabilitation Costs $ Year:Forecast (20 years after construction) 94,600 19,000 94,600 19,000
Average Hourly HOV Traffic (if HOV lanes) na na na naPercent Traffic in Weave (if connector proj.) na na na naPercent Trucks (include RVs, if applicable) 19% 19%
COMMENTS: This project contains a roundabout. E-Mail: [email protected]
Prepared by: Kelly Zolotoff Phone No: (530) 225-3259
Phone No. E-Mail
The HQ Division of Transportation Planning FAX number is ATSS 8-453-0001. For questions, contact: Mahmoud Mahdavi 8-453-9525 [email protected]
Transportation EconomicsCaltrans DOTP
Cal-B/C - Deschutes IC ResultsInvestment Analysis Deschutes Interchange Results Output.xls
Page 112/09/2011
District: 2EA: 34760
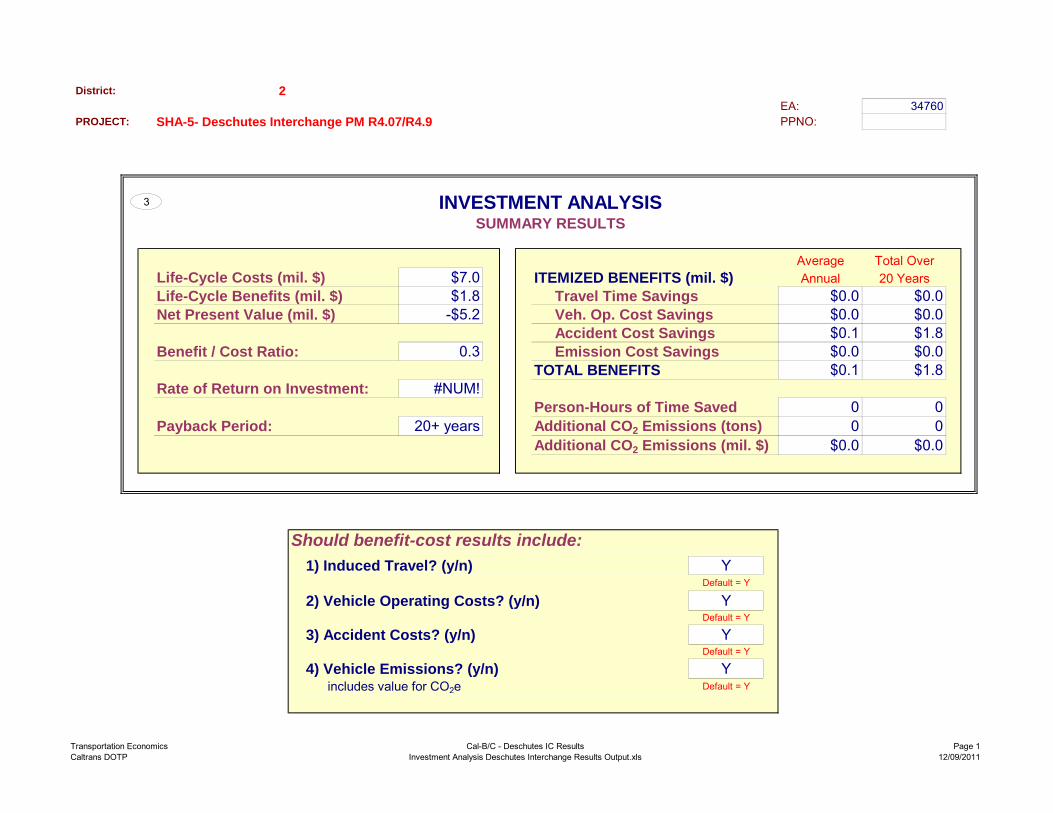
PROJECT: SHA-5- Deschutes Interchange PM R4.07/R4.9 PPNO:
3 INVESTMENT ANALYSISSUMMARY RESULTS
Average Total OverLife-Cycle Costs (mil. $) $7.0 ITEMIZED BENEFITS (mil. $) Annual 20 YearsLife-Cycle Benefits (mil. $) $1.8 Travel Time Savings $0.0 $0.0Net Present Value (mil. $) -$5.2 Veh. Op. Cost Savings $0.0 $0.0
Accident Cost Savings $0.1 $1.8Benefit / Cost Ratio: 0.3 Emission Cost Savings $0.0 $0.0
TOTAL BENEFITS $0.1 $1.8Rate of Return on Investment: #NUM!
Person-Hours of Time Saved 0 0Payback Period: 20+ years Additional CO2 Emissions (tons) 0 0
Additional CO2 Emissions (mil. $) $0.0 $0.0
Should benefit-cost results include:1) Induced Travel? (y/n) Y
Default = Y
2) Vehicle Operating Costs? (y/n) YDefault = Y
3) Accident Costs? (y/n) YDefault = Y
4) Vehicle Emissions? (y/n) Yincludes value for CO2e Default = Y
PERFORMANCE AND COST-EFFECTIVENESS
REPORT
SHASTA COUNTY 2012 RTIP PERFORMANCE AND COST – EFFECTIVENESS REPORT
Shasta County Regional Transportation Planning Agency December 19, 2011
Part A Attachment 1 on the following page is from the 2011 STIP Augmentation Guidelines dated August 10, 2011. It attempts to quantify the projected impact of projects on the regional transportation system, including those in the 2012 RTIP, in terms of the performance measures listed in Section III of the Guidelines at the system wide level. The attached Cost-Benefit Analyses show project-specific performance measures. Part A is sufficient in indicating how progress towards attaining the goals and objectives listed in the RTP are measured. It should be noted that each project recommended for funding is consistent with the Regional Performance measures in the RTP (Attachment 2) and has been reviewed and ranked regionally in light of criteria in the RTPA’s Project Selection Procedures (Attachment 3) attached to this report. The process to rank local projects utilized a consistent modeling approach that included model runs from the Regional Travel Demand Forecasting Model and outputs from the Caltrans Benefit/Cost Model. The current process is documented in Attachment 1 by the Shasta County RTPA Board for RTIP Project Selection Principles. The Shasta County RTPA agrees that the extent of measurements at the project level is desirable and will provide improved performance measures during the 2015 update to the RTP as part of the Travel Demand Model Update and Sustainable Community Strategy.
California Transportation Commission STIP Guidelines August 10, 2011
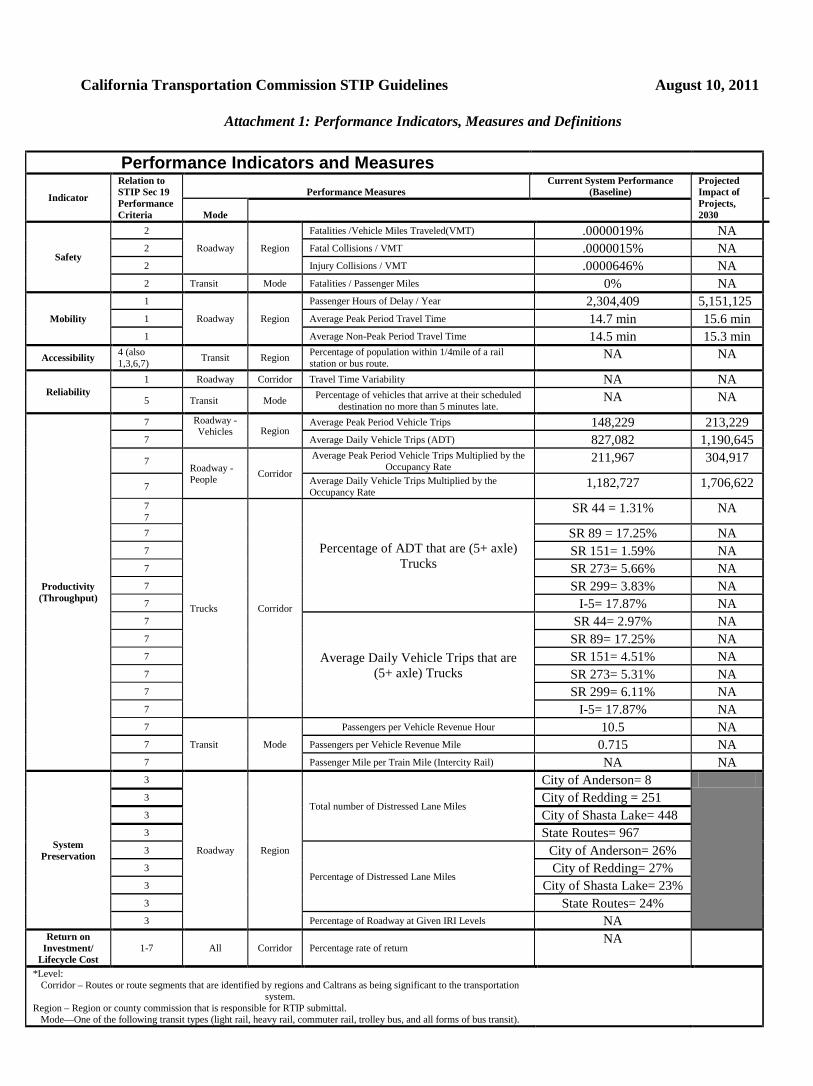
Attachment 1: Performance Indicators, Measures and Definitions
Performance Indicators and Measures
Indicator
Relation to STIP Sec 19 Performance Criteria
Performance Measures Current System Performance
(Baseline) Projected Impact of Projects, 2030 Mode
Safety
2
Roadway Region
Fatalities /Vehicle Miles Traveled(VMT) .0000019% NA 2 Fatal Collisions / VMT .0000015% NA 2 Injury Collisions / VMT .0000646% NA 2 Transit Mode Fatalities / Passenger Miles 0% NA
Mobility
1
Roadway Region
Passenger Hours of Delay / Year 2,304,409 5,151,125 1 Average Peak Period Travel Time 14.7 min 15.6 min 1 Average Non-Peak Period Travel Time 14.5 min 15.3 min
Accessibility 4 (also 1,3,6,7) Transit Region Percentage of population within 1/4mile of a rail
station or bus route. NA NA
Reliability 1 Roadway Corridor Travel Time Variability NA NA 5 Transit Mode Percentage of vehicles that arrive at their scheduled
destination no more than 5 minutes late. NA NA
Productivity (Throughput)
7 Roadway -Vehicles Region
Average Peak Period Vehicle Trips 148,229 213,229 7 Average Daily Vehicle Trips (ADT) 827,082 1,190,645 7
Roadway -People Corridor
Average Peak Period Vehicle Trips Multiplied by the Occupancy Rate
211,967 304,917
7 Average Daily Vehicle Trips Multiplied by the Occupancy Rate
1,182,727 1,706,622
7 7
Trucks Corridor
Percentage of ADT that are (5+ axle) Trucks
SR 44 = 1.31% NA
7 SR 89 = 17.25% NA 7 SR 151= 1.59% NA 7 SR 273= 5.66% NA 7 SR 299= 3.83% NA 7 I-5= 17.87% NA 7
Average Daily Vehicle Trips that are (5+ axle) Trucks
SR 44= 2.97% NA 7 SR 89= 17.25% NA 7 SR 151= 4.51% NA 7 SR 273= 5.31% NA 7 SR 299= 6.11% NA 7 I-5= 17.87% NA 7
Transit Mode
Passengers per Vehicle Revenue Hour 10.5 NA 7 Passengers per Vehicle Revenue Mile 0.715 NA 7 Passenger Mile per Train Mile (Intercity Rail) NA NA
System Preservation
3
Roadway Region
Total number of Distressed Lane Miles
City of Anderson= 8 3 City of Redding = 251 3 City of Shasta Lake= 448 3 State Routes= 967 3
Percentage of Distressed Lane Miles
City of Anderson= 26% 3 City of Redding= 27% 3 City of Shasta Lake= 23% 3 State Routes= 24% 3 Percentage of Roadway at Given IRI Levels NA
Return on Investment/
Lifecycle Cost 1-7 All Corridor Percentage rate of return
NA
*Level: Corridor – Routes or route segments that are identified by regions and Caltrans as being significant to the transportation
system. Region – Region or county commission that is responsible for RTIP submittal.
Mode—One of the following transit types (light rail, heavy rail, commuter rail, trolley bus, and all forms of bus transit).
California Transportation Commission STIP Guidelines August 10, 2011
42
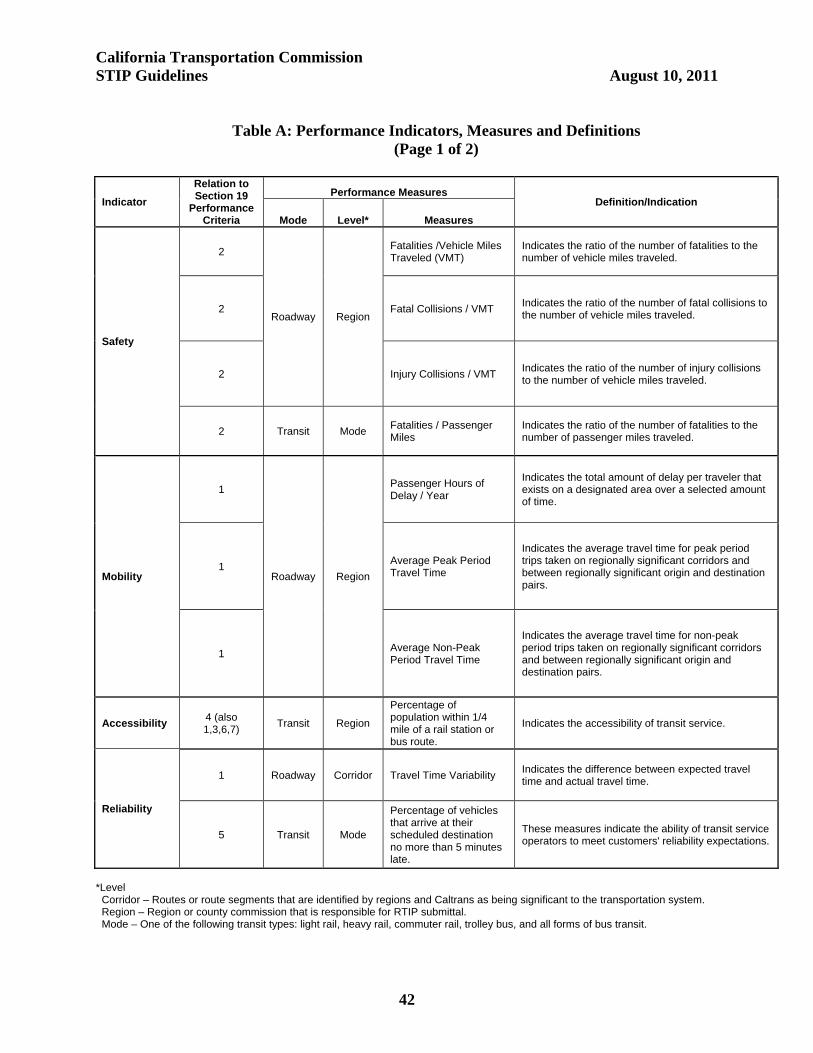
Table A: Performance Indicators, Measures and Definitions
(Page 1 of 2)
Indicator Relation to Section 19
Performance Criteria
Performance Measures Definition/Indication
Mode Level* Measures
Safety
2
Roadway Region
Fatalities /Vehicle Miles Traveled (VMT)
Indicates the ratio of the number of fatalities to the number of vehicle miles traveled.
2 Fatal Collisions / VMT Indicates the ratio of the number of fatal collisions to the number of vehicle miles traveled.
2 Injury Collisions / VMT Indicates the ratio of the number of injury collisions to the number of vehicle miles traveled.
2 Transit Mode Fatalities / Passenger Miles
Indicates the ratio of the number of fatalities to the number of passenger miles traveled.
Mobility
1
Roadway Region
Passenger Hours of Delay / Year
Indicates the total amount of delay per traveler that exists on a designated area over a selected amount of time.
1 Average Peak Period Travel Time
Indicates the average travel time for peak period trips taken on regionally significant corridors and between regionally significant origin and destination pairs.
1 Average Non-Peak Period Travel Time
Indicates the average travel time for non-peak period trips taken on regionally significant corridors and between regionally significant origin and destination pairs.
Accessibility 4 (also 1,3,6,7)
Transit Region
Percentage of population within 1/4 mile of a rail station or bus route.
Indicates the accessibility of transit service.
Reliability
1 Roadway Corridor Travel Time Variability Indicates the difference between expected travel time and actual travel time.
5 Transit Mode
Percentage of vehicles that arrive at their scheduled destination no more than 5 minutes late.
These measures indicate the ability of transit service operators to meet customers' reliability expectations.
*Level Corridor – Routes or route segments that are identified by regions and Caltrans as being significant to the transportation system. Region – Region or county commission that is responsible for RTIP submittal. Mode – One of the following transit types: light rail, heavy rail, commuter rail, trolley bus, and all forms of bus transit.
California Transportation Commission STIP Guidelines August 10, 2011
43
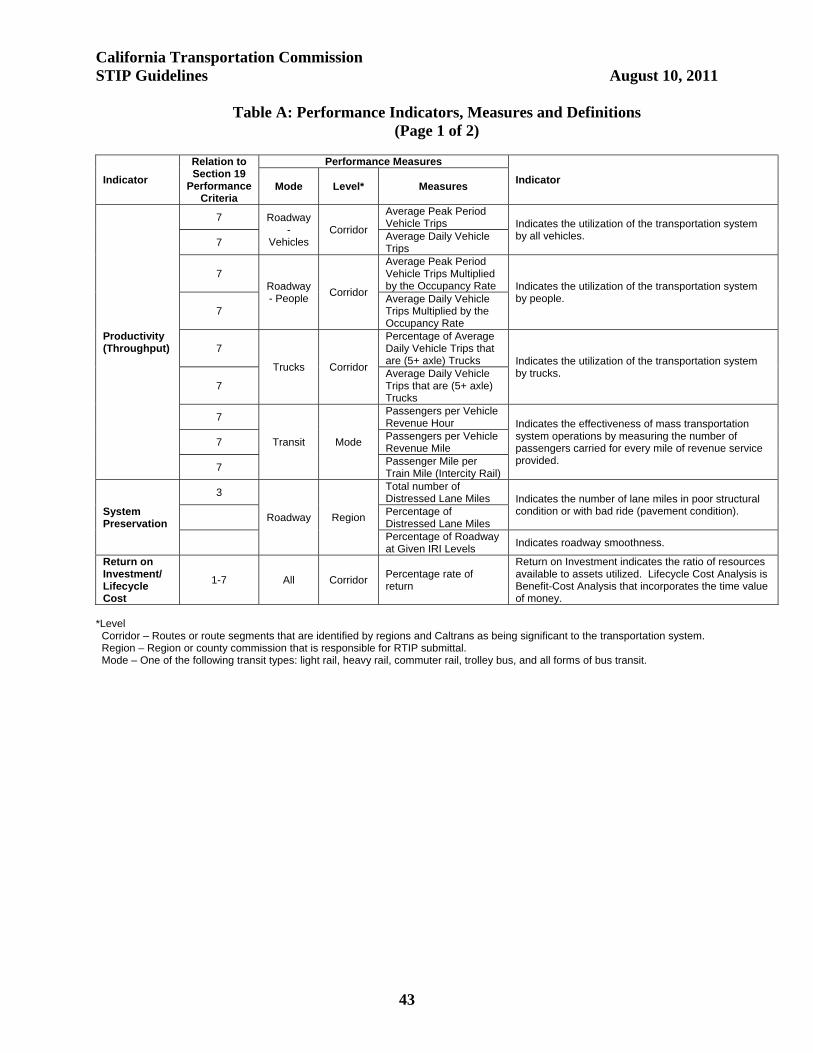
Table A: Performance Indicators, Measures and Definitions (Page 1 of 2)
Indicator Relation to Section 19
Performance Criteria
Performance Measures Indicator Mode Level* Measures
Productivity (Throughput)
7 Roadway -
Vehicles Corridor
Average Peak Period Vehicle Trips Indicates the utilization of the transportation system
by all vehicles. 7
Average Daily Vehicle Trips
7 Roadway - People
Corridor
Average Peak Period Vehicle Trips Multiplied by the Occupancy Rate Indicates the utilization of the transportation system
by people. 7
Average Daily Vehicle Trips Multiplied by the Occupancy Rate
7
Trucks Corridor
Percentage of Average Daily Vehicle Trips that are (5+ axle) Trucks Indicates the utilization of the transportation system
by trucks. 7
Average Daily Vehicle Trips that are (5+ axle) Trucks
7
Transit Mode
Passengers per Vehicle Revenue Hour Indicates the effectiveness of mass transportation
system operations by measuring the number of passengers carried for every mile of revenue service provided.
7 Passengers per Vehicle Revenue Mile
7 Passenger Mile per Train Mile (Intercity Rail)
System Preservation
3
Roadway Region
Total number of Distressed Lane Miles Indicates the number of lane miles in poor structural
condition or with bad ride (pavement condition).
Percentage of Distressed Lane Miles
Percentage of Roadway at Given IRI Levels
Indicates roadway smoothness.
Return on Investment/ Lifecycle Cost
1-7 All Corridor Percentage rate of return
Return on Investment indicates the ratio of resources available to assets utilized. Lifecycle Cost Analysis is Benefit-Cost Analysis that incorporates the time value of money.
*Level Corridor – Routes or route segments that are identified by regions and Caltrans as being significant to the transportation system. Region – Region or county commission that is responsible for RTIP submittal. Mode – One of the following transit types: light rail, heavy rail, commuter rail, trolley bus, and all forms of bus transit.
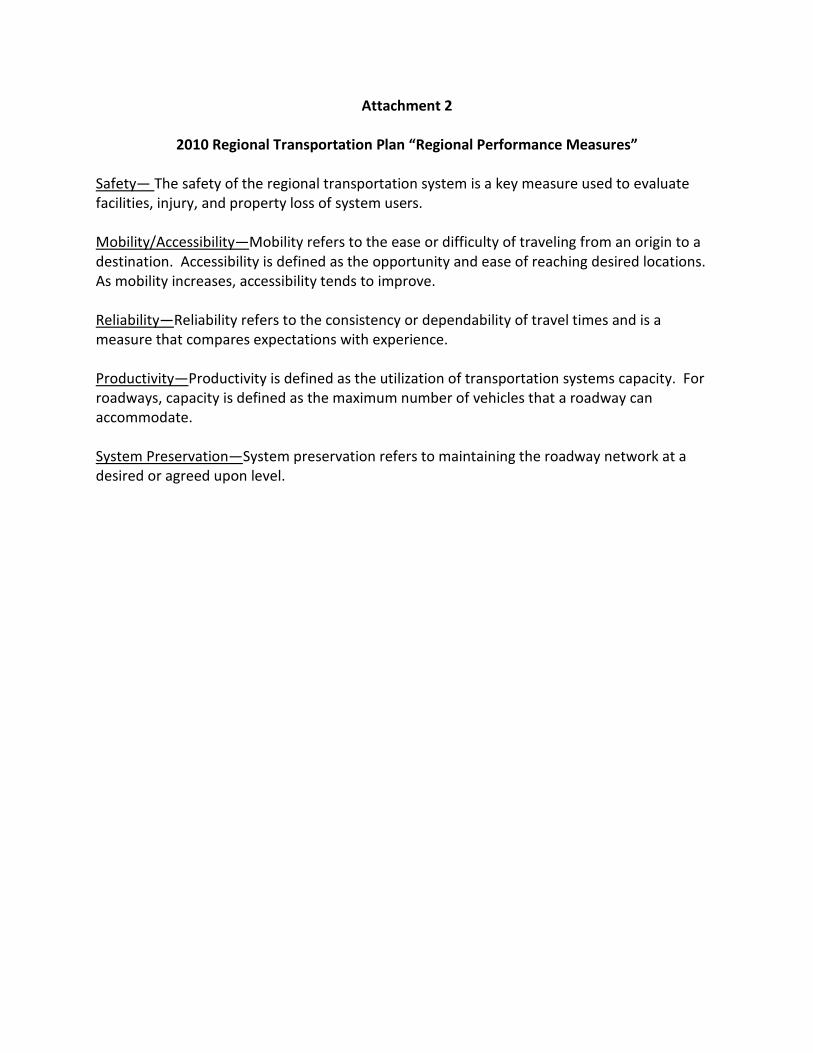
Attachment 2
2010 Regional Transportation Plan “Regional Performance Measures”
Safety— The safety of the regional transportation system is a key measure used to evaluate facilities, injury, and property loss of system users. Mobility/Accessibility—Mobility refers to the ease or difficulty of traveling from an origin to a destination. Accessibility is defined as the opportunity and ease of reaching desired locations. As mobility increases, accessibility tends to improve. Reliability—Reliability refers to the consistency or dependability of travel times and is a measure that compares expectations with experience. Productivity—Productivity is defined as the utilization of transportation systems capacity. For roadways, capacity is defined as the maximum number of vehicles that a roadway can accommodate. System Preservation—System preservation refers to maintaining the roadway network at a desired or agreed upon level.
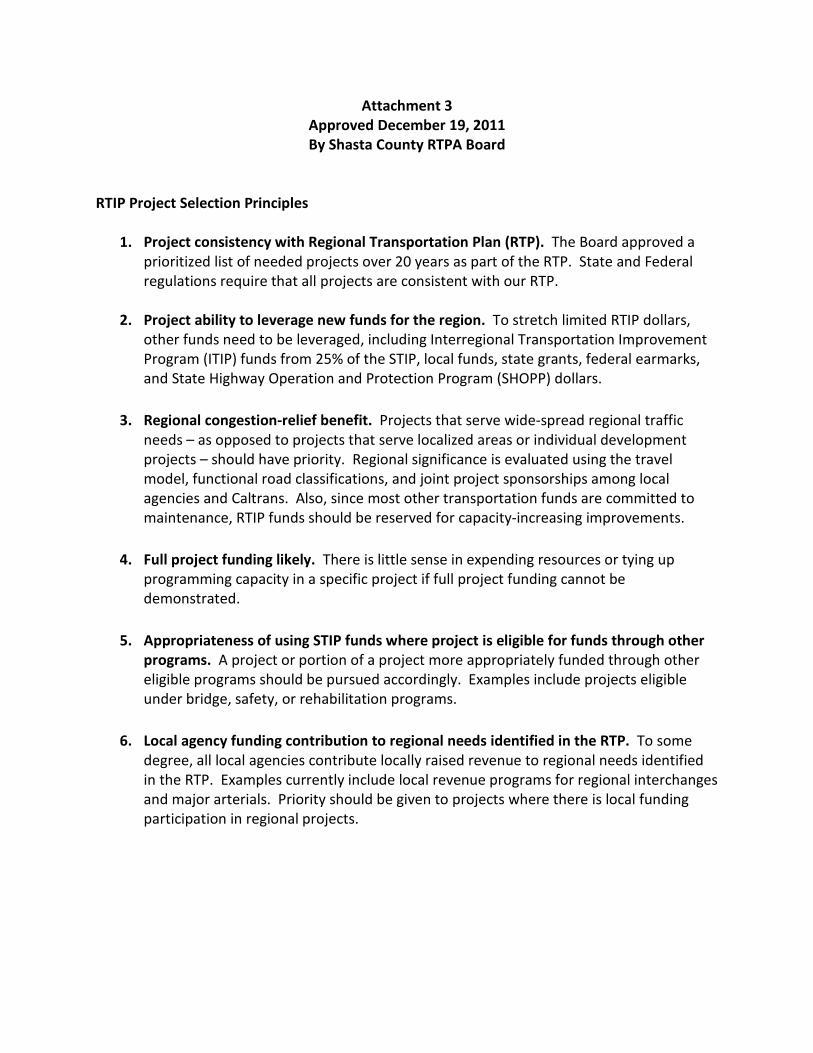
Attachment 3 Approved December 19, 2011 By Shasta County RTPA Board
RTIP Project Selection Principles
1. Project consistency with Regional Transportation Plan (RTP). The Board approved a prioritized list of needed projects over 20 years as part of the RTP. State and Federal regulations require that all projects are consistent with our RTP.
2. Project ability to leverage new funds for the region. To stretch limited RTIP dollars,
other funds need to be leveraged, including Interregional Transportation Improvement Program (ITIP) funds from 25% of the STIP, local funds, state grants, federal earmarks, and State Highway Operation and Protection Program (SHOPP) dollars.
3. Regional congestion-relief benefit. Projects that serve wide-spread regional traffic needs – as opposed to projects that serve localized areas or individual development projects – should have priority. Regional significance is evaluated using the travel model, functional road classifications, and joint project sponsorships among local agencies and Caltrans. Also, since most other transportation funds are committed to maintenance, RTIP funds should be reserved for capacity-increasing improvements.
4. Full project funding likely. There is little sense in expending resources or tying up programming capacity in a specific project if full project funding cannot be demonstrated.
5. Appropriateness of using STIP funds where project is eligible for funds through other programs. A project or portion of a project more appropriately funded through other eligible programs should be pursued accordingly. Examples include projects eligible under bridge, safety, or rehabilitation programs.
6. Local agency funding contribution to regional needs identified in the RTP. To some degree, all local agencies contribute locally raised revenue to regional needs identified in the RTP. Examples currently include local revenue programs for regional interchanges and major arterials. Priority should be given to projects where there is local funding participation in regional projects.
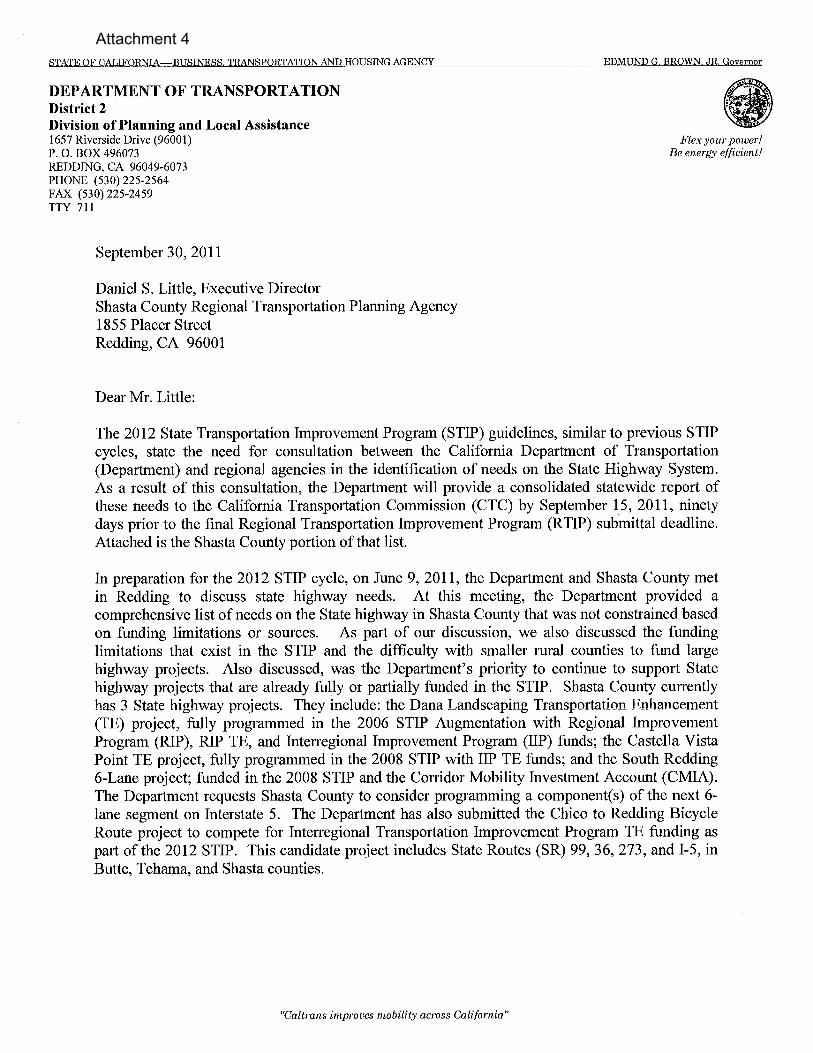
Attachment 4
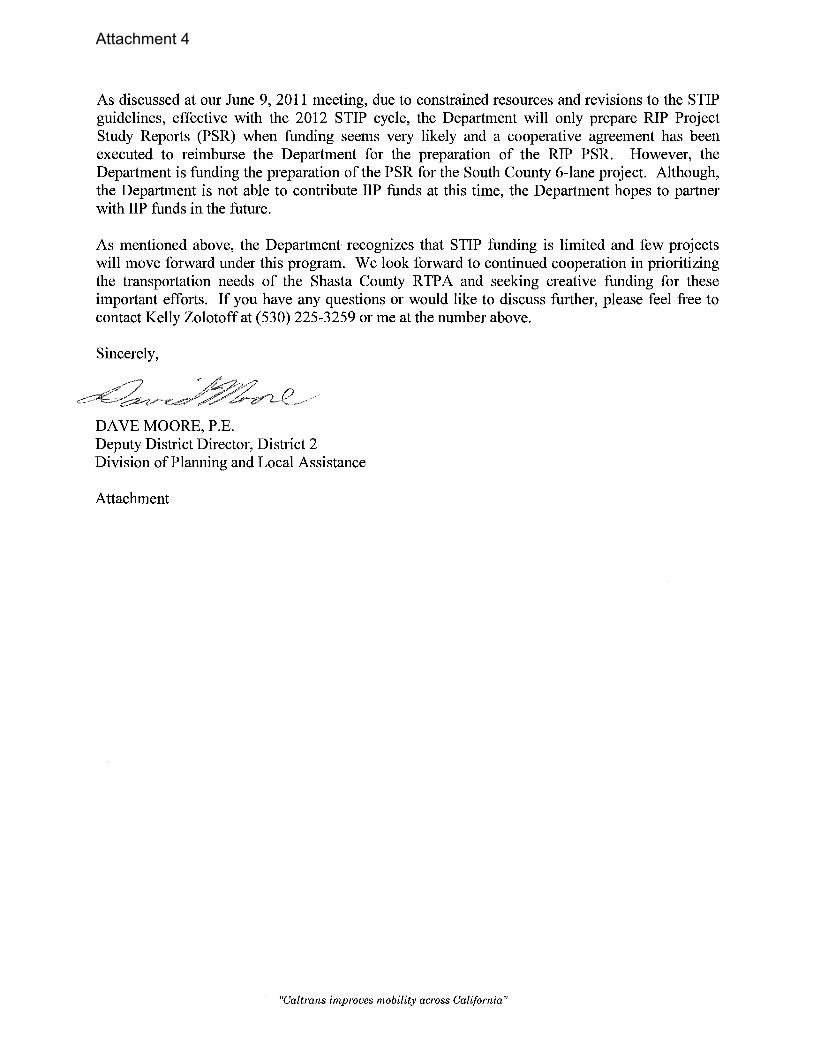
Attachment 4
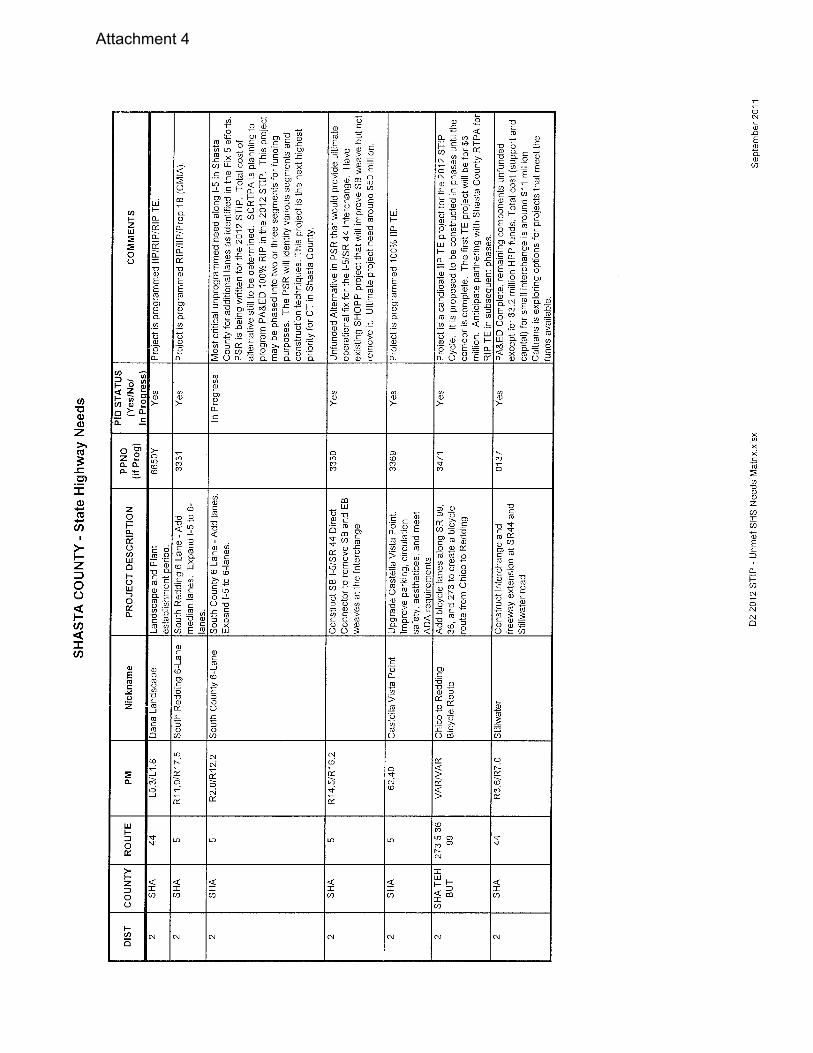
Attachment 4