Embed Size (px)
Citation preview
Rep. ITU-R M.2109 1
REPORT ITU-R M.2109
Sharing studies between IMT-Advanced systems and geostationary
satellite networks in the fixed-satellite service in the 3 400-4 200
and 4 500-4 800 MHz frequency bands
(2007)
Executive summary
This Report provides a summary of the sharing studies between IMT-Advanced systems and
geostationary satellite networks in the fixed-satellite service (FSS) in the 3 400-4 200 and
4 500-4 800 MHz frequency bands. It was conducted by ITU-R in the framework of Agenda
item 1.4 of WRC-07, in accordance with resolves 5 to Resolution 228 (Rev.WRC-03), as these
bands were identified as candidate bands for future development of IMT-2000 and IMT-Advanced
systems, as described in the Report ITU-R M.2079.
The bands 3 400-4 200 MHz and 4 500-4 800 MHz are allocated worldwide on a primary basis to
the FSS. This Report presents the results of the sharing studies performed between geostationary
satellite networks in the FSS and IMT-Advanced systems.
The following areas are covered in this Report:
− Regulatory information.
− Frequency usage by satellite services in these bands, provided on a global and regional
basis.
− FSS space and earth station deployments.
− Considerations on potential identification of the 3 400-4 200 MHz and 4 500-4 800 MHz
bands for IMT-Advanced.
− Parameters of the systems considered in this Report.
− Sharing studies (methodologies and results) between the two services from two aspects:
− Interferences from IMT-Advanced transmitters to receiving FSS earth stations (in-band
and adjacent band, and overdrive of the FSS receivers).
− Interferences from transmitting FSS space stations to IMT-Advanced receivers.
− Results from one measurement study on interference from IMT-Advanced transmitter into
one television receive only (TVRO) earth station.
− Mitigation techniques and spectrum management techniques to improve the sharing
possibilities.
− Sensitivity analysis with respect to certain parameters to show the effect of their variation
on the sharing situation between both systems.
The main conclusions are provided in § 11.
Table of abbreviations:
3GPP 3rd generation partnership project
ACLR Adjacent channel leakage power ratio

2 Rep. ITU-R M.2109
ACS Adjacent channel selectivity
ATPC Automatic transmit power control
BER Bit error rate
C/N Carrier-to-noise power ratio
CDMA Code division multiple access
DOE Direction of earth station
EIRP Effective isotropic radiated power
FEC Forward error correction
FSS Fixed-satellite service
GSO Geostationary satellite orbit
IMT International Mobile Telecommunications
ITU International Telecommunication Union
LNA Low noise amplifier
LNB Low noise block downconverter
LoS Line-of-sight
MIFR Master International Frequency Register
MIMO Multiple input multiple output
NLoS Non line of sight
OFDM Orthogonal frequency division multiplexing
OFDMA Orthogonal frequency division multiple access
OOB Out of band
PSD Power spectrum density
PSK Phase shift keying
SDMA Space division multiple access
TDMA Time division multiple access
TT&C Tracking, telemetry and command
TVRO Television receive only
UMTS Universal mobile telecommunications System
UWB Ultra-wideband
VSAT Very small aperture terminal
WMO World Meteorological Organization
1 Introduction
During the preparatory work for WRC-07 performed within ITU-R, in accordance with
Resolution 228 (Rev.WRC-03), the frequency bands 3 400-4 200 MHz and 4 400-4 990 MHz have
been considered as two of the candidate bands for the future development of the terrestrial

Rep. ITU-R M.2109 3
component of IMT-2000 and IMT-Advanced systems with the understanding that the use of these
bands will be limited to the terrestrial component of IMT-Advanced.
2 Scope of the report
As the bands 3 400-4 200 MHz and 4 500-4 800 MHz are allocated worldwide on a primary basis to
the FSS, this Report presents the results of the sharing studies performed between the FSS networks
using the geostationary satellite orbit (GSO) and IMT-Advanced systems.
The sharing studies have been performed based on:
– the current band usage by GSO-FSS and the associated generalized characteristics, which
could evolve during the period while IMT-Advanced is being further developed and
implemented;
– assumptions on the future characteristics of IMT-Advanced.
3 Regulatory information
3.1 Table of the frequency allocations
Table 1 lists the various allocations contained in Article 5 of the Radio Regulations (RR) (Edition
of 2004) together with their respective status in the frequency range 3 400-4 200 MHz, as well as in
the frequency range 4 500-4 800 MHz.
TABLE 1
Table of frequency allocations in the bands 3 400-4 200 MHz and 4 500-4 800 MHz
Region 1 Region 2 Region 3
3 400-3 600
FIXED
FIXED-SATELLITE
(space-to-Earth)
Mobile
Radiolocation
5.431
3 600-4 200
FIXED
FIXED-SATELLITE
(space-to-Earth)
Mobile
3 400-3 500
FIXED
FIXED-SATELLITE (space-to-Earth)
Amateur
Mobile
Radiolocation 5.433
5.432
3 500-3 700
FIXED
FIXED-SATELLITE (space-to-Earth)
MOBILE except aeronautical mobile
Radiolocation 5.433
5.435
3 700-4 200
FIXED
FIXED-SATELLITE (space-to-Earth)
MOBILE except aeronautical mobile

4 Rep. ITU-R M.2109
4 500-4 800 FIXED
FIXED-SATELLITE (space-to-Earth) 5.441
MOBILE
Note – Footnote 5.441 indicates, inter-alia, that the use of the band 4 500-4 800 MHz
(space-to-Earth) by the FSS shall be in accordance with the provisions of RR Appendix 30B.
3.2 International considerations between FSS earth stations and IMT-Advanced stations
International protection of FSS earth stations and their coordination are governed by RR Nos 9.17
and 9.18 and is applicable only to specific FSS earth stations (those whose geographical coordinates
are known). The thresholds/conditions to be used to trigger coordination are those specified in RR
Appendix 5, together with the calculation method (contained in RR Appendix 7). This coordination
procedure is a regulatory concept.
It is up to each administration to decide which stations within its own territory it wishes to protect
in accordance with the RR. For Example, if an administration wishes to ensure the protection of the
receiving FSS earth station located in its territory from the transmitting terrestrial station located in
the adjacent countries and within the coordination area of the earth station, a set of specific earth
stations located at the edge of the territory should be registered to the ITU through the coordination
and notification procedure under the provisions of RR Articles 9 and 11.
Particularly, as specified in RR No 9.6, an administration intending to bring into use terrestrial
services, whose territory falls within the coordination contours of the earth stations under the
coordination or notification procedure or notified under RR Articles 9 and 11, shall effect
coordination with other administrations having these earth stations.
The Radio Regulations do not provide any criteria or procedures for all kinds of required
coordination under RR Article 9, such as between GSO FSS networks and between FSS and
terrestrial network, for how this bilateral coordination is to take place.
Annex C gives examples of coordination contours at some locations.
3.3 National considerations between FSS earth stations and IMT-Advanced stations
In countries where FSS earth stations are deployed, national arrangements are likely to be required
within national borders, by administrations willing also to deploy terrestrial systems in these bands.
4 FSS space stations and earth stations deployment 1 in the 3 400-4 200 MHz and
4 500-4 800 MHz bands
4.1 Band 3 400-4 200 MHz
There is extensive utilization by the FSS of the frequency band 3 625-4 200 MHz in all ITU
Regions of the world (except certain countries in Europe and in Asia) and of the frequency band
3 400-3 625 MHz in ITU Region 1 (except parts of Europe) and Region 3 (except some countries of
Asia). The low atmospheric absorption in these bands enables highly reliable space-to-earth
communication links with wide service coverage, particularly in, but not limited to, geographical
areas with severe rain fade conditions. The wide coverage enables services to be provided to
developing countries, to sparsely populated areas and over large distances.
1 Additional band usage information on the FSS in the 3 400-4 200 MHz and 4 500-4 800 MHz bands is
summarized in Table 1 of Report ITU-R M.2079.

Rep. ITU-R M.2109 5
The 3 400-4 200 MHz band has been used by the FSS for over 40 years. The technology is mature
and offers equipment at low cost. This, together with the wide coverage, has lead to satellites in this
band being an important part of the telecommunications infrastructure in many developing
countries.
Satellite services in this band currently include very small aperture terminal (VSAT) networks,
internet services, point-to-point links, satellite news gathering, TV and data broadcasting to satellite
master antenna television (SMATV) and direct-to-home (DTH) receivers, feeder links for the
mobile satellite service. Due to their wide coverage characteristics, satellites operating in this band
have been extensively used for disaster relief operations.
The use of the band 3 400-4 200 MHz by FSS includes governmental uses and international
commitments within the WMO. WMO usages of the band, which are essential for civil aviation and
weather, water, climate and environmental alerts, are currently using only a few channels in the
3 600-3 800 MHz band.
The 3 400-4 200 MHz band is also utilized for tracking, telemetry and command (TT&C) purposes,
under the FSS allocation, by a majority of FSS satellites operating in this band. Furthermore, there
are additional satellites with service links operating in other frequency bands which have their
TT&C in the 3 400-4 200 MHz band.
At the time of development of this Report, there were approximately 160 geostationary satellites
operating in the band 3 400-4 200 MHz, comprising a total capacity exceeding two thousand
36 MHz transponders. The location and coverage areas of most of these satellites are provided in
Table A2 of Annex A of this Report.
With regard to FSS earth stations receiving transmissions from FSS space networks, according to
the ITU earth station database, there are more than 1 500 registered earth stations operating with
geostationary satellites in the 3 400-4 200 MHz band. However, it should be noted that the majority
of the FSS earth stations are not required to be notified to the ITU under the national regulations,
and for each satellite system their characteristics are recorded in the Master International Frequency
Register (MIFR) database under the “Typical earth station” category. In some rare cases, an FSS
network filing with the ITU may contain few “Specific” earth stations filed in association with the
satellite network.
Moreover, in many countries, the local administration does not individually license/register receive
only earth stations or VSAT terminals and their number, location or detailed operating
characteristics are not known. Also, even transmit stations are for the most part not registered with
the ITU because their location does not raise interference issues with other countries.
FSS earth stations are deployed, in varying degrees, all around the world in the band
3 400-4 200 MHz. Some examples of such deployment are provided below.
− One major satellite operator has more than 9 900 registered earth stations, in its data base,
deployed across the globe operating in the 3 400-4 200 MHz band. The location of these
earth stations is shown in Fig. A4 through A6 of Annex A of this Report. The operating
earth stations shown in these figures do not include all FSS earth stations dedicated to
signal reception such as television receive-only (TVRO) terminals.
− In Brazil, in the band 3 700-4 200 MHz, there are more than 8 000 nationally registered
earth stations pointing to one of the Brazilian satellites in and 12 000 nationally registered
earth stations pointing to one of the non-Brazilian satellites that cover the country plus an
equal number of earth stations in the 3 625-3 700 MHz band (see Fig. A7 of Annex A).
There are also an estimated 20 million TVRO terminals deployed across the country.
− A provider of television programming in the USA provides programming via satellite
directly to the general public in areas that are outside the coverage area of its terrestrial
6 Rep. ITU-R M.2109
television stations. As of December 2005, there were approximately 122 000 receive-only
earth stations that received programming from that provider in that country.
− Members of one Broadcasting Association utilize more than 31 000 earth stations in
North America to reach over 66 million cable television households.
− In the Russian Federation, there are approximately 6 000 nationally registered earth stations
that receive transmissions in the 3 400-4 200 MHz band (see Figs. A4, A5 and A6 of
Annex A). This figure does not include TVRO earth stations that are deployed across the
country.
− In France and Korea (Republic of), there is a limited number per country, twenty or less, of
nationally registered FSS earth stations on their territories.
− In Finland and Sweden, there is a limited number per country, less than 5, of nationally
registered FSS earth stations.
Different earth stations, depending on the application and traffic requirement may access different
amounts of spectrum. For example, in Sweden, a particular earth station only uses a total of 2 MHz
spectrum.
In other countries such as the United Kingdom, some earth station locations use a large number of
antennas to communicate with different satellites and may therefore use the whole allocated band.
An earth station antenna may also receive several carriers at different frequencies and may also
switch between different receive frequencies (e.g. TVRO).
4.2 Band 4 500 – 4 800 MHz
The band 4 500-4 800 MHz is part of the FSS Plan, specified in RR Appendix 30B, and is therefore
intended to preserve orbit/spectrum resources for future use, in particular for countries that may not
have the possibility to implement satellite systems in unplanned bands in the short- and mid-terms.
5 Considerations on potential identification of the 3 400-4 200 MHz and
4 500-4 800 MHz bands for IMT-Advanced
This section provides some information about the main reasons why these bands are of interest for
use by IMT-Advanced systems.
The size of these bands would accommodate IMT-Advanced systems which are envisaged with
large bandwidth and would provide significant capacity, according to the ITU-R spectrum
requirement estimations (see Report ITU-R M.2078).
The use of these bands may facilitate the convergence between cellular and broadband wireless
access systems already deployed in the lower part of the band 3 400-4 200 MHz in some countries.
In some administrations, FSS is not deployed in the sub-band 3 400-3 600 MHz.
These frequency bands allow use of smaller antenna size for terminals and base stations, which is a
favorable feature to implement multiple-antenna techniques enabling high spectrum efficiency.
6 FSS Parameters including the interference criteria
The parameters listed in § 6.1 provide key FSS parameters to be used in calculation of interference
into FSS receive earth stations. Section 6.2 provides the interference criteria for FSS and § 6.3
addresses the apportionment of the interference for the FSS receivers.
Rep. ITU-R M.2109 7
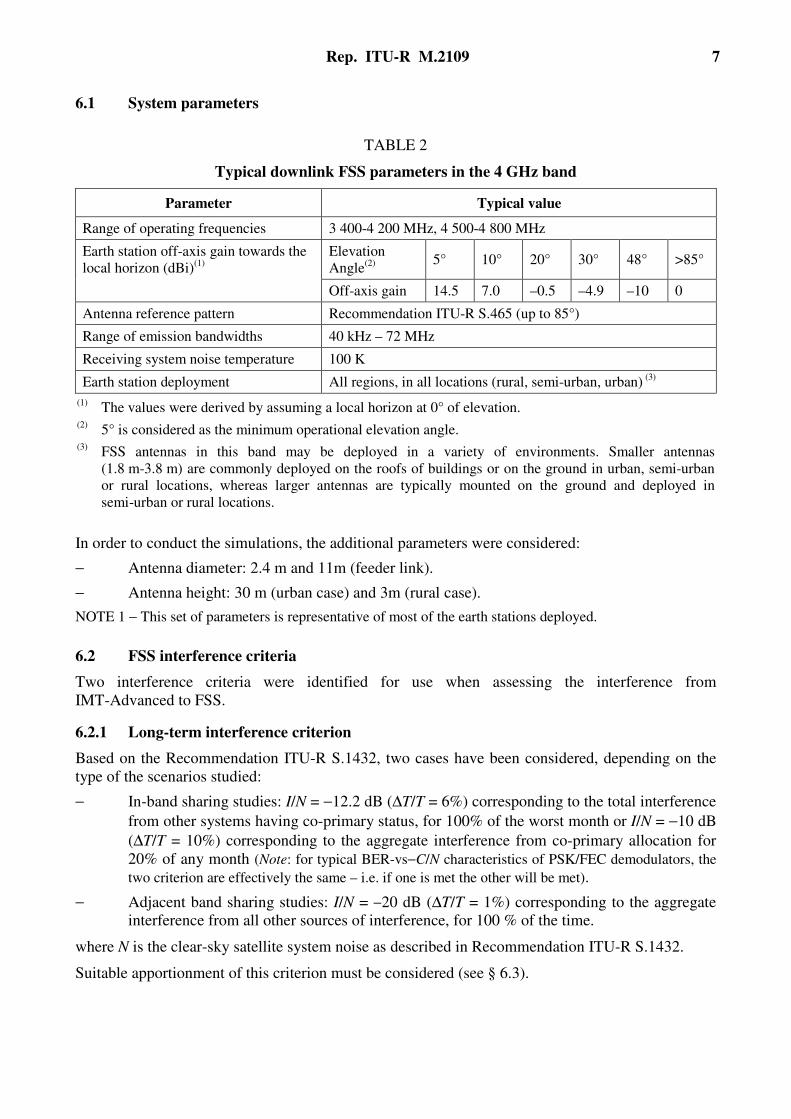
6.1 System parameters
TABLE 2
Typical downlink FSS parameters in the 4 GHz band
Parameter Typical value
Range of operating frequencies 3 400-4 200 MHz, 4 500-4 800 MHz
Earth station off-axis gain towards the
local horizon (dBi)(1)
Elevation
Angle(2)
5° 10° 20° 30° 48° >85°
Off-axis gain 14.5 7.0 –0.5 –4.9 –10 0
Antenna reference pattern Recommendation ITU-R S.465 (up to 85°)
Range of emission bandwidths 40 kHz – 72 MHz
Receiving system noise temperature 100 K
Earth station deployment All regions, in all locations (rural, semi-urban, urban) (3)
(1) The values were derived by assuming a local horizon at 0° of elevation.
(2) 5° is considered as the minimum operational elevation angle.
(3) FSS antennas in this band may be deployed in a variety of environments. Smaller antennas
(1.8 m-3.8 m) are commonly deployed on the roofs of buildings or on the ground in urban, semi-urban
or rural locations, whereas larger antennas are typically mounted on the ground and deployed in
semi-urban or rural locations.
In order to conduct the simulations, the additional parameters were considered:
− Antenna diameter: 2.4 m and 11m (feeder link).
− Antenna height: 30 m (urban case) and 3m (rural case).
NOTE 1 − This set of parameters is representative of most of the earth stations deployed.
6.2 FSS interference criteria
Two interference criteria were identified for use when assessing the interference from
IMT-Advanced to FSS.
6.2.1 Long-term interference criterion
Based on the Recommendation ITU-R S.1432, two cases have been considered, depending on the
type of the scenarios studied:
− In-band sharing studies: I/N = −12.2 dB (∆T/T = 6%) corresponding to the total interference
from other systems having co-primary status, for 100% of the worst month or I/N = −10 dB
(∆T/T = 10%) corresponding to the aggregate interference from co-primary allocation for
20% of any month (Note: for typical BER-vs−C/N characteristics of PSK/FEC demodulators, the
two criterion are effectively the same – i.e. if one is met the other will be met).
− Adjacent band sharing studies: I/N = −20 dB (∆T/T = 1%) corresponding to the aggregate
interference from all other sources of interference, for 100 % of the time.
where N is the clear-sky satellite system noise as described in Recommendation ITU-R S.1432.
Suitable apportionment of this criterion must be considered (see § 6.3).
8 Rep. ITU-R M.2109
6.2.2 Short-term interference criterion
The ITU-R reference for this criterion is Recommendation ITU-R SF.1006. This criterion also
appears in Annex 7 (see both text and Table 8b) of RR Appendix 7:
− I/N = −1.3 dB which may be exceed by up to 0.001667% time (single entry)
It is noted that:
− the criterion above is also used to define a coordination area as defined in Annex 7 of RR
Appendix 7, in conjunction with the methodology (e.g. propagation model) and other
parameters described therein.
− Recommendation ITU-R SF.1006 recommends the methods that may be used for assessing
interference potential between earth stations and the specific stations in the fixed service
within the coordination area.
6.2.3 Guidance to use the two interference criteria
The interference potential into a FSS earth station should be evaluated taking into account both
long-term and short-term interference criteria.
Studies have shown that for all types of terrain and paths, the separation distances calculated using
the short-term criterion are significantly different from those calculated using the long-term.
It was noted by ITU-R that the propagation model described the Recommendation ITU-R P.452
should not be applied with a smooth earth terrain, but should use a representative terrain profile.
However, some studies have considered that the terrain profile associated with a smooth earth
model is representative of areas such as coastal and flat inland plain regions. It should be noted that
it is not representative of areas that have different characteristics and the use of such a model may
result in the overestimation of the interference into a receiving FSS earth station.
6.3 Apportionment of the interference
As shown in § 8.1.4, two cases regarding the apportionment of the interference were investigated
based on the following two assumptions.
− In one case, 100% of the interference to the FSS was allocated to IMT-Advanced systems,
which corresponded to the case where both IMT-Advanced and the fixed service systems
were assumed to be not deployed in the same band, in the same geographical area.
− In the other case, 50% (I/N = –15.2 dB) apportionment of the allowable interference
IMT-Advanced was evaluated, i.e., splitting the 6% allowance for other systems having
a co-primary status equally between two such systems, which corresponded to the case
when the FSS would share this band with the fixed service as well as IMT-Advanced
systems.
Similarly, in the case of interference from other sources, including spurious emission and out-of-
band (OoB) emissions from adjacent bands, it may be necessary to apportion the allotted increase in
noise due to such sources of interference between various other sources of interference. No
guidance has been provided by ITU-R regarding the apportionment of interference from the various
other sources.
7 IMT-Advanced parameters including the interference criterion
The following values have been used to conduct the sharing studies presented in this Report.

Rep. ITU-R M.2109 9
7.1 In-band parameters
This paragraph contains the IMT-Advanced parameters assumed for the comparison of the different
studies, which represent one possible scenario of an IMT-Advance deployment.
TABLE 3
IMT-Advanced base station parameters
Parameter Value Value considered
in the simulations
EIRP density range: macro base station
scaled to 1 MHz bandwidth
39 to 46 dBm/MHz 46 dBm/MHz
EIRP density range: micro base station
scaled to 1 MHz bandwidth
15 to 22 dBm/MHz 22 dBm/MHz
Maximum EIRP(1)
(Transmitter output power + antenna gain – feeder loss)
59 dBm (macro base
station)
35 dBm (micro base station)
Antenna type (Tx/Rx)
(the gain is assumed to be flat within one sector)
Sectored for macrocell
omni for microcell
Receiver thermal noise
(including noise figure)
–109 dBm/MHz
Protection criterion (I/N)
interference to individual base station
–6 dB or –10 dB(2)
Protection criterion (I/N)
vs satellite systems
–10 dB
(1) EIRP range of values assume range of frequency bandwidth between 20 and 100 MHz.
(2) This value has to be used when assessing compatibility between a non primary allocated system and a
primary allocated system (e.g. between UWB and IMT-Advanced).
TABLE 4
IMT-Advanced mobile station parameters
Parameter Value
Value to be
considered in the
simulations
Maximum Tx PSD range output power(1)
4 to 11 dBm/MHz 7.5(2)
dBm/MHz
Maximum EIRP 24 dBm
Receiver thermal noise (dBm/MHz)
(Including noise figure)
–109 to –105 dBm/MHz
Protection criterion (I/N) –6 dB
(1) With reference signal bandwidth between 20 and 100 MHz.
(2) A median value is selected considering the effect of automatic transmit power control (ATPC).

10 Rep. ITU-R M.2109
TABLE 5
IMT-Advanced network parameters
Parameter Value
Macro cell antenna gain 20 dBi
Micro cell antenna gain 5 dBi
Macro cell feeder loss 4 dB
Micro cell feeder loss 0 dB
Antenna pattern for vertical sharing Rec. ITU-R F.1336(1)
Mobile station antenna gain 0 dBi
Base station Antenna downtilt (Micro) 0 degree
Base station Antenna downtilt (Macro) 2 degrees
Base station antenna height (Micro) 5 m
Base station antenna height (Macro) 30 m
Mobile station antenna height (mobile station) 1.5 m
Intersite distance (Micro) 600 m
Intersite distance (Macro) 5 km
Intersite distance (Macro) for urban case 1,5 km
Active users density (Dense Urban/Macro) 18/km²
Active users density (Dense Urban/Micro) 115/km²
Active users density (Suburban/Macro) 15/km²
Active users density (Suburban /Micro) 19/km²
Frequency reuse pattern 1(2)
and 6(3)
(1) Recommendation ITU-R F.1336 has generally been used in the studies. However,
STUDY 2 of this report has used the Recommendation ITU-R F.1336-2 (see § 8.2.2). (2)
The same frequency is used by all sectors. (3)
Except STUDY 6 in § 8.1.2, all the other studies have only applied 1.
7.2 Out-of-band parameters
The following values were assumed to define the spectrum mask, valid for the bandwidths between
20 MHz and 100 MHz:
TABLE 6
IMT-Advanced out-of-band parameters
Offset ACLR limit
1st adjacent channel 45 dB
2nd
adjacent channel 50 dB
3rd
adjacent channel and above 66 dB
Rep. ITU-R M.2109 11
Regarding the spurious emissions, the document 3GPP TS 25.104, which is referred to in
Recommendation ITU-R M.1457, specifies the data relating to the bandwidth of 5 MHz. The
Table 6.9E in the document gives the absolute level of −30 dBm/MHz after the 2nd
adjacent channel
(i.e., above 2 700 MHz). For a base station transmitting a level of 43 dBm/5 MHz
(i.e., 36 dBm/MHz), this leads to a relative value of 66 dB.
Some studies have been based on the spurious emission limits prescribed in RR Appendix 3. In
accordance with Appendix 3 of the RR, it is assumed that the IMT-Advanced transmitters would be
specified such that its spurious emission at frequency separation of 2.5 x (necessary bandwidth)
from the center frequency of the IMT-Advanced carrier, measured in bandwidth of 1 MHz, would
be attenuated by 43 + 10 log(P) dB or 70 dBc, whichever is less stringent, below the transmitter
power level P (W). The OoB domain emission masks contained in Annex 10 of the
Recommendation ITU-R SM.1541 does not present a suitable model that may be applicable to
IMT-Advanced systems. As a result, the impact of OoB emission of IMT-Advanced transmitters
into FSS receivers has not been evaluated in these studies.
8 Sharing study results
This paragraph provides a summary of the methodologies and assumptions incorporated by the
various sharing studies and their respective results. Additionally, a number of possible mitigation
techniques that may be taken into consideration to improve the sharing between FSS and
IMT-Advanced systems are described in § 8.1.5.
8.1 Interference from IMT-Advanced systems to FSS receiving earth stations
The studies presented in this Report have considered one or more of the following interference
mechanisms:
− In-band interference where IMT-Advanced and FSS operate at the same frequency.
− Interference from unwanted emissions of IMT-Advanced stations (OoB and spurious
emissions) operating in one portion of the 3 400-4 200 MHz band into FSS receivers
operating in another portion of this band.
− Overdrive and non-linear operation of FSS receive low noise block (LNB) due to the power
levels of IMT-Advanced emissions within the receive band of these, driving them outside
their dynamic range.
There are some differences in the calculation methodologies, parameters and assumptions used in
the different studies. Therefore:
− A description of the methodologies are given in the § 8.1.1.
− The assumptions and methodologies associated with each sharing study are summarized in
Tables of § 8.1.2 and 8.1.3. These tables also indicate the extent to which each sharing
study employed the common FSS and IMT-Advanced parameters that are specified in
Tables 2 through 5.
The studies examined single entry and/or aggregate interference effects. A number of these studies
were non-site specific (also called generic) while others were site specific and employed terrain
information specific to that site and its surrounding area. The results of the generic and site specific
sharing studies are summarized in the tables in § 8.1.4.1 and § 8.1.4.2, respectively.
12 Rep. ITU-R M.2109
8.1.1 Methodologies used in the simulations
This paragraph provides additional information regarding the assumptions and methodologies
incorporated by the various sharing studies. The information provided herein is meant to
complement that which is contained in § 8.1.2 and § 8.1.3.
The STUDY 3 analyses the single-entry interference cases only, for both short-term and long-term
criteria.
The analyses are based on the propagation models described in ITU-R P.452. Due to the generic
nature of the analysis, for the long-term protection cases, the propagation is calculated over a
smooth earth surface, utilizing the propagation model described in § 4.3 of ITU-R P.452. Building
losses and clutter effects have been assumed to represent suburban environment in these analyses.
In the case of short-term propagation, the ducting mode of propagation model described in § 4.5 of
ITU-R P.452 has been utilized. In order to simplify the model, rain scatter and tropospheric scatter
were not considered.
This study presents the results of analyses on impact of interference into FSS receivers from
spurious emission from IMT-Advanced equipment based on the prescribed guidelines of RR
Appendix 3 and the propagation models described in ITU-R P.452.
The STUDY 4 considered the following assumptions:
Single-entry
In order to generally evaluate the interference from the IMT-Advanced systems on application cases
using the specific terrain profile information, in each trial of the simulation, the location of the base
station of the IMT-Advanced systems is randomly changed in the area of 1 km-radius with the
resolution of 50 m × 50 m, and then the interference into the FSS earth station is computed. By the
sufficient number of trials, the possibility of sharing between IMT-Advanced and FSS systems is
statistically evaluated.
Aggregate
In the case of the aggregated interference from the multiple IMT-Advanced base stations is
evaluated, it assumed a 10-cell hexagonal deployment with specified inter-site distance scenario.
The simulation methodology is the same as that of single-entry case, except that the aggregated
interference from the multiple IMT-Advanced base stations is taken into account.
The STUDY 7 considered the following assumptions:
Single Entry
For each environment, results are expressed in terms of separation distance between IMT-Advanced
base station and FSS earth station to meet the long term protection criterion. These separation
distances are assessed regarding the FSS earth station elevation angle and additionally azimuth
between earth station and single base station.
Aggregate case (without terrain data model)
For the aggregate case, the effect of all the IMT-Advanced base station is taken into account i.e.
a certain number of base station equi-spaced have been uniformly located on a circle around the
FSS earth station. Thus radius is the result of the required separation distance meeting the
interference criterion. The number of IMT-Advanced base station is assessed according to the
separation distance and the base station intersite distance range as following:

Rep. ITU-R M.2109 13
FIGURE 1
BS
ES
d intersite
d protection
The number aggregate base station assessed is as following:
Number of aggregate base station = (2*pi* d protection) /d intersite
Aggregate IMT-Advanced base station case (with terrain data model)
Based on the consideration of a cellular network modeling and base station intersite distance, this
aggregate case modeling takes into account the effect of all the IMT-Advanced base station whose
interference contribution is significant is considered in the calculation. These base station are
uniformly (equi-spaced) located on rings around the FSS earth station. The total sum of the
interference takes into account the interference of all base station up to the farthest ring of potential
interference contributors. The radius of the closest ring is the required separation distance resulting
from the calculation of the total sum of the interference contribution.

14 Rep. ITU-R M.2109
FIGURE 2
Aggregate base stations scenario
The radius of the ith
ring is:
D(i)= Dprotection + ( i-1)* Dintersite
The number N(i) of IMT-Advanced base station located on the ith
ring is assessed according to the
corresponding distance D(i) and the base station intersite distance range as following:
N(i) = pi / (arc sin (Dintersite/ (2*D(i))))
Aggregate mobile station contribution
This study assumes a random distribution of agreed number of user density of mobile stations
within each cell whose base station is interfering into the FSS earth station. The distance Dmobile
station of the closest mobile station is defined as following:
Dmobile station = Dprotection – Dintersite/2
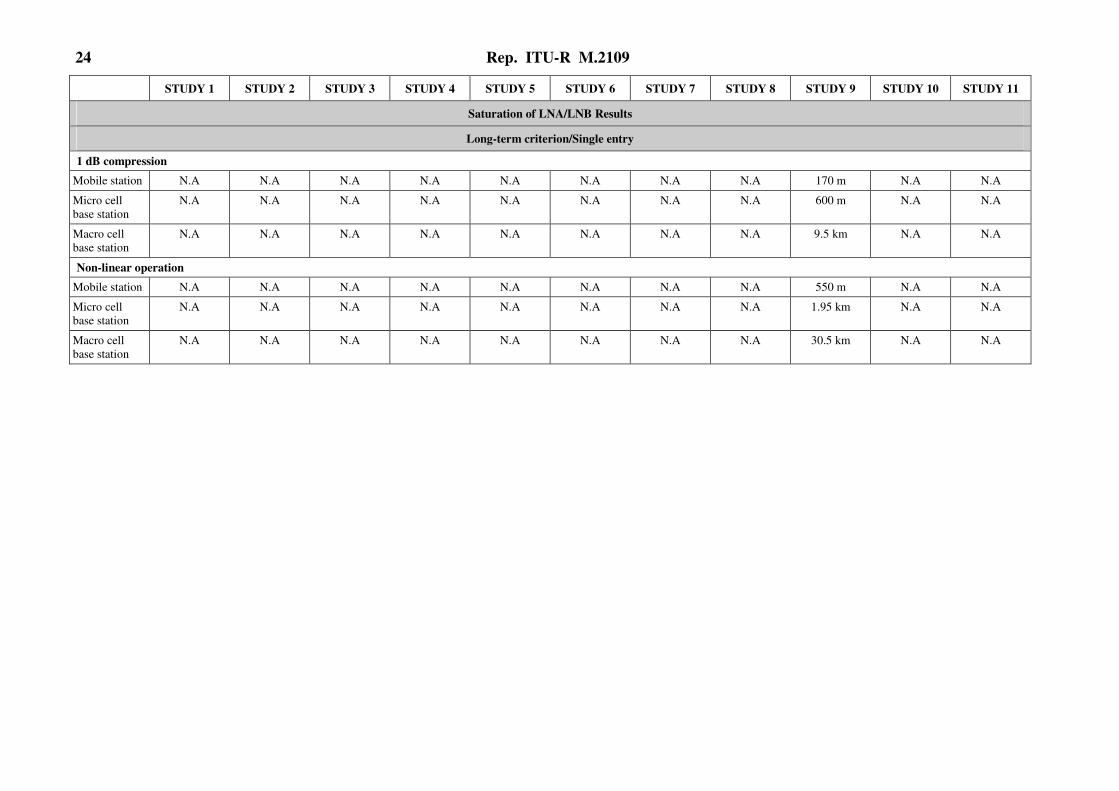
Study 9 investigated overdrive of LNB’s and interference from unwanted emissions. It was
expected that these phenomena will occur at smaller distances than in-band interference. It was
therefore assumed that such interference from IMT-Advanced transmitters beyond the horizon are
most unlikely. The calculations therefore have not taken trans-horizon propagation into account and
are based on LoS calculations.
earth
station
Rep. ITU-R M.2109 15
It is understood that multipath and focusing effects may significantly increase the received signal
levels for short periods of time and increase the required separation distance. However, in these
calculations, these effects have not been taken into account.
This study also only calculated required separation distances with respect to single entry
interference contributions from IMT-Advanced stations and did not consider the aggregation of
several IMT-Advanced base stations and/or user terminals.
Detailed description of the methodology, assumptions, calculations and results of STUDY 9 can be
found in Annex E.
For LNB overdrive calculations, some additional parameters which have not yet been specified in
Tables 3 to 5 are required. Amongst these are input levels that will make the LNB exhibit non-linear
behaviour. For this purpose, the LNB 1 dB compression point was assumed to correspond to a level
of −50 dBm at the LNB input and that the LNB would start to show non-linear behaviour at an
input level about 10 dB below this level (i.e. −60 dBm). For estimation of the total received satellite
power, 36 MHz satellite transponders in the full 800 MHz bandwidth, each with an EIRP of
41 dBW was assumed for this study.
In STUDY 10, the aggregate interferences have been calculated with the following assumptions:
− Base Station Case – 42 cells distributed (static distribution) within a radius of 3 km from
the FSS receive station. Six-cell reuse for TDMA / single cell reuse for CDMA. Simulation
assumed FSS earth station located amongst macro cells. Result was a measure of the
exceedence of the required I/N protection requirement for the FSS.
− Mobile Station Case – Monte Carlo simulation, mobile stations randomly distributed within
a circular area of 2.95 km about the FSS receive station. Simulation assumed FSS earth
station located amongst a population of mobile IMT-Advanced stations. Result was a
measure of the exceedence of the required I/N protection requirement for the FSS
The goal of the STUDY 11 is to consider the combined exclusion zone for multiple earth stations
deployed in the same region. The study considers 9 existing and operational earth station receiving
in the band 3 700-3 800 MHz. Aggregation over 100 MHz is based on anticipated IMT-Advanced
network bandwidth. For each earth station the interference from single macro base station is
evaluated for short-term and long-term interference criteria taking into account terrain, actual
frequency, azimuth, elevation angle and antenna height. Other parameters have been taken from § 6
and 7 of this Report. Two extreme cases have been considered with one 100 MHz channel and with
five 20 MHz channels corresponding to 39 dBm/MHz and 46 dBm/MHz EIRP accordingly. All
other possible channel bandwidths and channel arrangements will be enclosed within these two
cases.
During analysis macro base station has been moved from one position to another within 5 km grid,
for each position short-term and long-term interference and I/N have been calculated for each earth
station. Square area with approximately 5 km sides is treated as an exclusion zone if macro base
station positioned in the centre of such area creates interference in earth station receiver leading to
I/N higher than criterion. For long-term interference I/N is allowed to be higher than −10 dB only
for 20% of time, for short-term interference I/N could exceed −1.3 dB only for 0.001667% of time.
As a result aggregated exclusion zones have been drawn based on the worst value of interference
among all earth station for each point of the grid.
Additional information on this study could be found in Annex B.
16 Rep. ITU-R M.2109
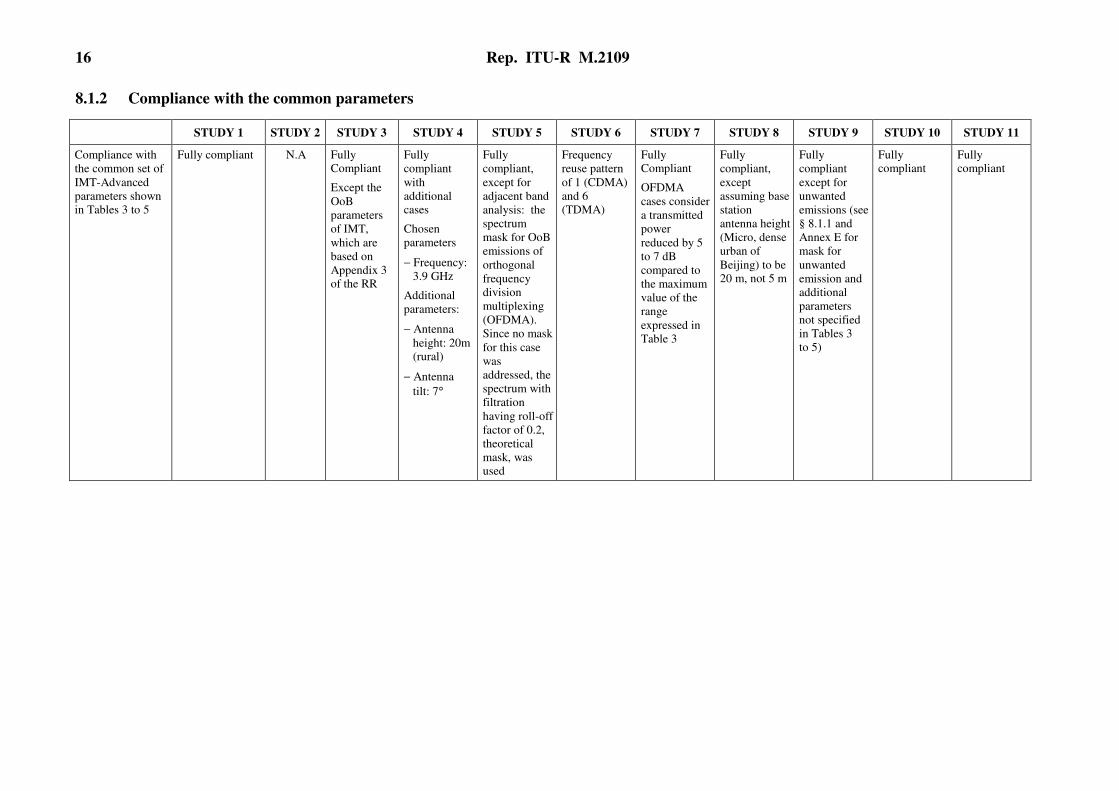
8.1.2 Compliance with the common parameters
STUDY 1 STUDY 2 STUDY 3 STUDY 4 STUDY 5 STUDY 6 STUDY 7 STUDY 8 STUDY 9 STUDY 10 STUDY 11
Compliance with
the common set of
IMT-Advanced
parameters shown
in Tables 3 to 5
Fully compliant N.A Fully
Compliant
Except the
OoB
parameters
of IMT,
which are
based on
Appendix 3
of the RR
Fully
compliant
with
additional
cases
Chosen
parameters
− Frequency:
3.9 GHz
Additional
parameters:
− Antenna
height: 20m
(rural)
− Antenna
tilt: 7°
Fully
compliant,
except for
adjacent band
analysis: the
spectrum
mask for OoB
emissions of
orthogonal
frequency
division
multiplexing
(OFDMA).
Since no mask
for this case
was
addressed, the
spectrum with
filtration
having roll-off
factor of 0.2,
theoretical
mask, was
used
Frequency
reuse pattern
of 1 (CDMA)
and 6
(TDMA)
Fully
Compliant
OFDMA
cases consider
a transmitted
power
reduced by 5
to 7 dB
compared to
the maximum
value of the
range
expressed in
Table 3
Fully
compliant,
except
assuming base
station
antenna height
(Micro, dense
urban of
Beijing) to be
20 m, not 5 m
Fully
compliant
except for
unwanted
emissions (see
§ 8.1.1 and
Annex E for
mask for
unwanted
emission and
additional
parameters
not specified
in Tables 3
to 5)
Fully
compliant
Fully
compliant

Rep. ITU-R M.2109 17
STUDY 1 STUDY 2 STUDY 3 STUDY 4 STUDY 5 STUDY 6 STUDY 7 STUDY 8 STUDY 9 STUDY 10 STUDY 11
Compliance with
the common set of
FSS parameters
shown in Table 2
Antenna
height a.g.l
Stn-1:5 m ;
Stn-2: 25 m
Antenna Gain:
Stn-1:47.7;
Stn-2: 59.8 dBi
Locations:
Stn-1:
N51:43:44
W0:10:39
Stn-2:
N50:02:55;
W5:10:46
N.A Fully
compliant
Chosen
parameters
− Frequency:
3.9 GHz
− Antenna
diameter:
2.4 m
non-compliant
parameters
− Antenna
height:
10 m
(urban)
3 m (rural)
Fully
compliant
Fully
compliant
except: Earth
station
off-axis gain:
Appendix 7
Long-term
protection
criterion:
–15.2 dB
Fully
compliant
Fully
compliant,
except
assuming FSS
antennas
deployed in
suburban and
dense urban
locations in
Beijing:
Antenna
height:
2 m (on the
ground,
suburban and
dense urban);
10 m (on the
roofs of
buildings,
Suburban);
30 m (on the
roofs of
buildings,
dense urban)
Only IMT-
Advanced
interference
allowance of
6% and 1%
considered in
the studies,
not 3% and
0.5%
Fully
compliant
except with
respect to
1) the height
of the FSS
earth
station
antenna,
where a
height of
2 m was
assumed
2) for off-axis
azimuth of
greater
than 85°,
where an
antenna
gain of
−10 dBi
was
assumed
Only thermal
noise and
antenna
pattern are
compliant.
Other
parameters are
actual values
for earth
station under
study and
within
following
ranges:
Antenna
height from
2.5 to 24 m.
Elevation
angle from 3°
to 22.5°.
Azimuth from
107° to 146°
18 Rep. ITU-R M.2109
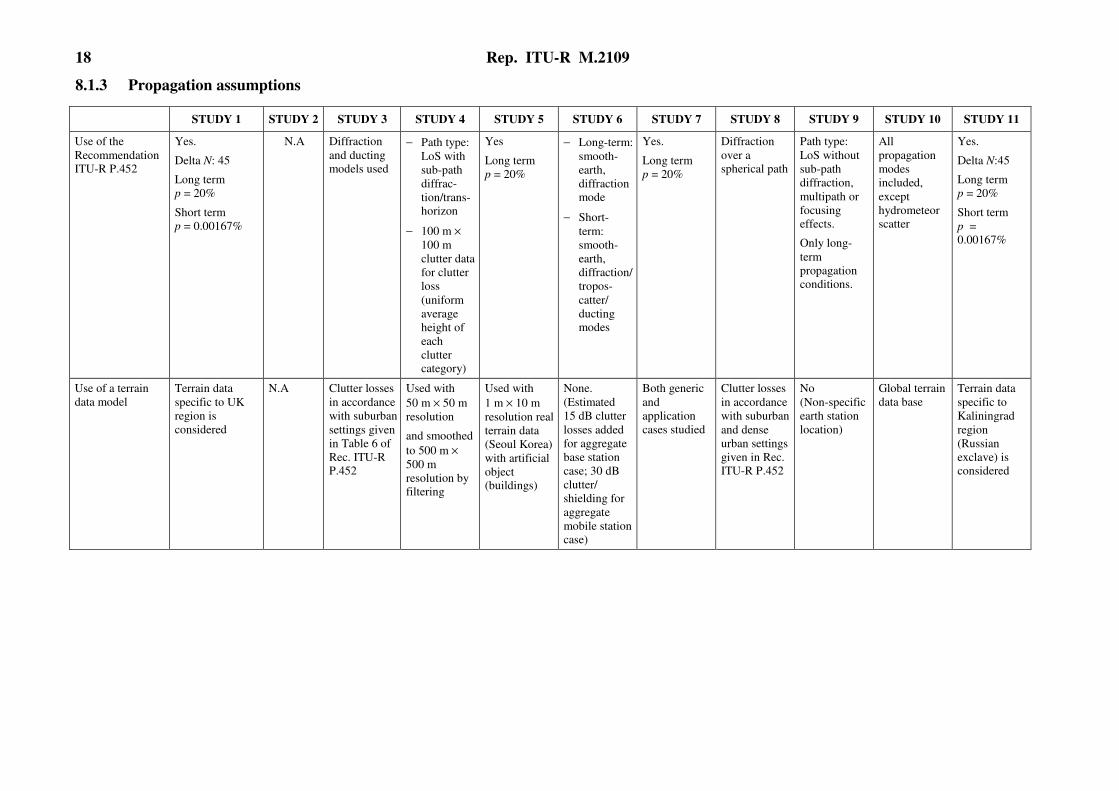
8.1.3 Propagation assumptions
STUDY 1 STUDY 2 STUDY 3 STUDY 4 STUDY 5 STUDY 6 STUDY 7 STUDY 8 STUDY 9 STUDY 10 STUDY 11
Use of the
Recommendation
ITU-R P.452
Yes.
Delta N: 45
Long term
p = 20%
Short term
p = 0.00167%
N.A Diffraction
and ducting
models used
− Path type:
LoS with
sub-path
diffrac-
tion/trans-
horizon
− 100 m ×
100 m
clutter data
for clutter
loss
(uniform
average
height of
each
clutter
category)
Yes
Long term
p = 20%
− Long-term:
smooth-
earth,
diffraction
mode
− Short-
term:
smooth-
earth,
diffraction/
tropos-
catter/
ducting
modes
Yes.
Long term
p = 20%
Diffraction
over a
spherical path
Path type:
LoS without
sub-path
diffraction,
multipath or
focusing
effects.
Only long-
term
propagation
conditions.
All
propagation
modes
included,
except
hydrometeor
scatter
Yes.
Delta N:45
Long term
p = 20%
Short term
p =
0.00167%
Use of a terrain
data model
Terrain data
specific to UK
region is
considered
N.A Clutter losses
in accordance
with suburban
settings given
in Table 6 of
Rec. ITU-R
P.452
Used with
50 m × 50 m
resolution
and smoothed
to 500 m ×
500 m
resolution by
filtering
Used with
1 m × 10 m
resolution real
terrain data
(Seoul Korea)
with artificial
object
(buildings)
None.
(Estimated
15 dB clutter
losses added
for aggregate
base station
case; 30 dB
clutter/
shielding for
aggregate
mobile station
case)
Both generic
and
application
cases studied
Clutter losses
in accordance
with suburban
and dense
urban settings
given in Rec.
ITU-R P.452
No
(Non-specific
earth station
location)
Global terrain
data base
Terrain data
specific to
Kaliningrad
region
(Russian
exclave) is
considered
Rep. ITU-R M.2109 19
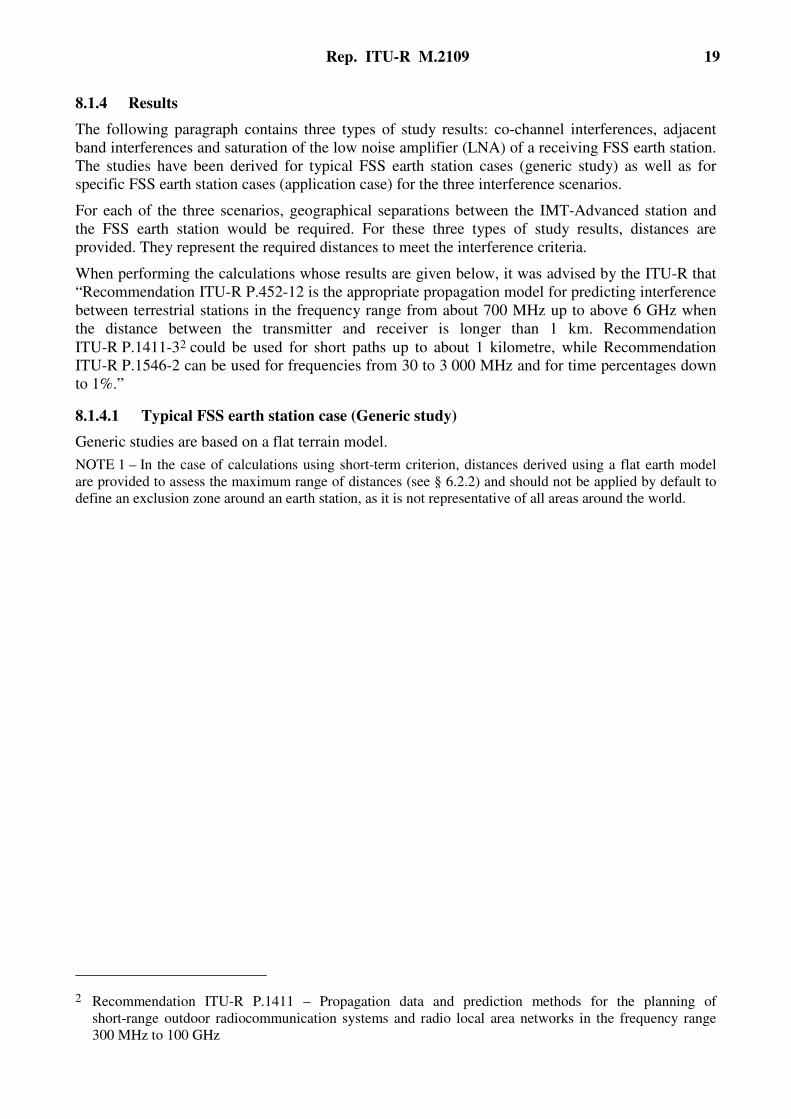
8.1.4 Results
The following paragraph contains three types of study results: co-channel interferences, adjacent
band interferences and saturation of the low noise amplifier (LNA) of a receiving FSS earth station.
The studies have been derived for typical FSS earth station cases (generic study) as well as for
specific FSS earth station cases (application case) for the three interference scenarios.
For each of the three scenarios, geographical separations between the IMT-Advanced station and
the FSS earth station would be required. For these three types of study results, distances are
provided. They represent the required distances to meet the interference criteria.
When performing the calculations whose results are given below, it was advised by the ITU-R that
“Recommendation ITU-R P.452-12 is the appropriate propagation model for predicting interference
between terrestrial stations in the frequency range from about 700 MHz up to above 6 GHz when
the distance between the transmitter and receiver is longer than 1 km. Recommendation
ITU-R P.1411-32 could be used for short paths up to about 1 kilometre, while Recommendation
ITU-R P.1546-2 can be used for frequencies from 30 to 3 000 MHz and for time percentages down
to 1%.”
8.1.4.1 Typical FSS earth station case (Generic study)
Generic studies are based on a flat terrain model.
NOTE 1 – In the case of calculations using short-term criterion, distances derived using a flat earth model
are provided to assess the maximum range of distances (see § 6.2.2) and should not be applied by default to
define an exclusion zone around an earth station, as it is not representative of all areas around the world.
2 Recommendation ITU-R P.1411 – Propagation data and prediction methods for the planning of
short-range outdoor radiocommunication systems and radio local area networks in the frequency range
300 MHz to 100 GHz

20 Rep. ITU-R M.2109
STUDY 1 STUDY 2 STUDY 3 STUDY 4 STUDY 5 STUDY 6 STUDY 7 STUDY 8 STUDY 9 STUDY 10 STUDY 11
Co-channel Results
Long-term interference criterion / Single entry
Minimum
distance
(I/N =
–12.2 dB)
N.A N.A Macro base
station: 55 km
Mobile station:
1 km
37-54 km
(Macro urban)
15-23 km
(Micro urban)
40-59 km
(Macro rural)
with a downtilt
varying from 2
to 7°
Base station:
45-58 km
(FSS earth
station
elevation
angle: 5°-48°
and
bandwidth:
75 MHz)
33-57 km
(5º elevation)
33-37 km
(15º elevation)
CDMA Macro
base station:
from 47 to
65.5 km
CDMA Micro
base station:
from 39 to
49.5 km
CDMA
Mobile station:
0 km
OFDMA
Macro base
Station: from
43 to 55 km
OFDMA
Micro base
station: from
29 to 47 km
OFDMA
Mobile station:
0 km
N.A N.A N.A N.A
Minimum
distance
(I/N =
–15.2 dB)
N.A N.A Macro base
Station: 70 km
Mobile station:
1.5 km
N.A N.A 36-60 km
(5º elevation)
36-40 km
(15º elevation)
N.A N.A N.A N.A N.A
Rep. ITU-R M.2109 21
STUDY 1 STUDY 2 STUDY 3 STUDY 4 STUDY 5 STUDY 6 STUDY 7 STUDY 8 STUDY 9 STUDY 10 STUDY 11
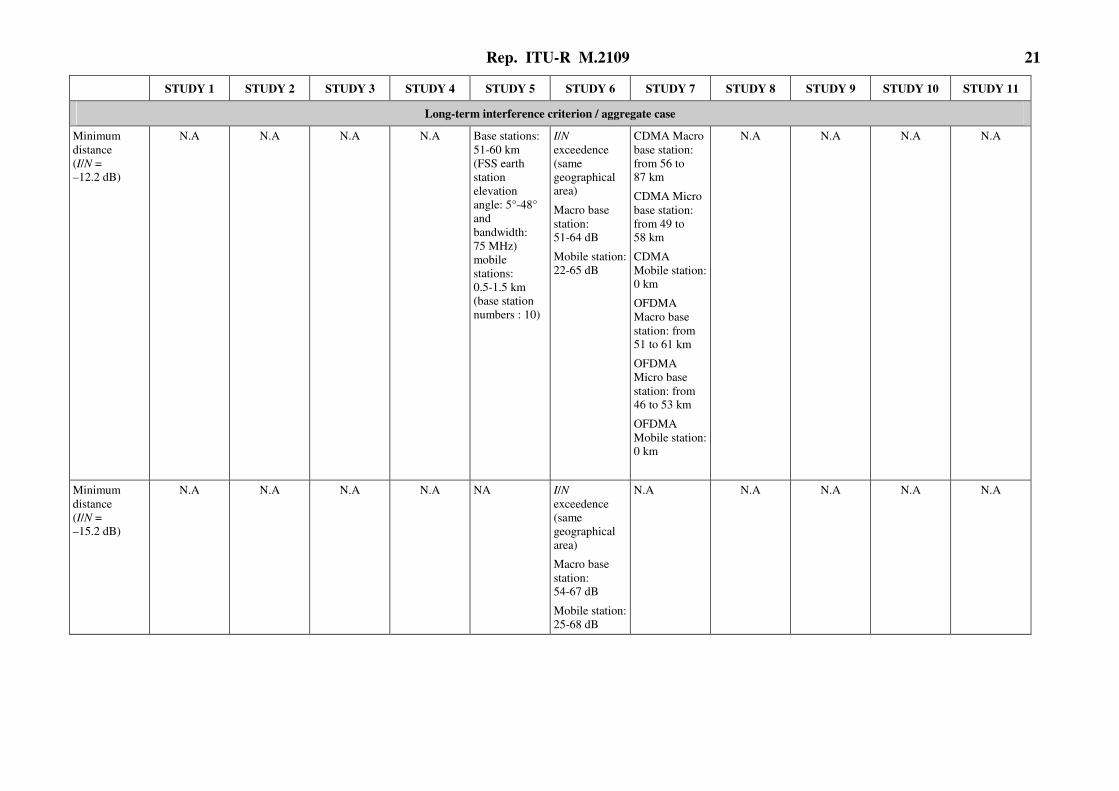
Long-term interference criterion / aggregate case
Minimum
distance
(I/N =
–12.2 dB)
N.A N.A N.A N.A Base stations:
51-60 km
(FSS earth
station
elevation
angle: 5°-48°
and
bandwidth:
75 MHz)
mobile
stations:
0.5-1.5 km
(base station
numbers : 10)
I/N
exceedence
(same
geographical
area)
Macro base
station:
51-64 dB
Mobile station:
22-65 dB
CDMA Macro
base station:
from 56 to
87 km
CDMA Micro
base station:
from 49 to
58 km
CDMA
Mobile station:
0 km
OFDMA
Macro base
station: from
51 to 61 km
OFDMA
Micro base
station: from
46 to 53 km
OFDMA
Mobile station:
0 km
N.A N.A N.A N.A
Minimum
distance
(I/N =
–15.2 dB)
N.A N.A N.A N.A NA I/N
exceedence
(same
geographical
area)
Macro base
station:
54-67 dB
Mobile station:
25-68 dB
N.A N.A N.A N.A N.A

22 Rep. ITU-R M.2109
STUDY 1 STUDY 2 STUDY 3 STUDY 4 STUDY 5 STUDY 6 STUDY 7 STUDY 8 STUDY 9 STUDY 10 STUDY 11
Short-term interference criterion
Minimum
distance
N.A N.A Macro base
station:
140 km
Mobile station:
1.5 km
N.A 187-430 km
(5º elevation,
considering all
propagation
modes)
187-282 km
(15º elevation
considering all
propagation
modes)
34-120 km
(5º elevation,
considering
troposcatter/
diffraction
propagation
modes only)
34-50 km
(15º elevation,
considering
troposcatter/
diffraction
propagation
modes only)
N.A N.A N.A N.A N.A

Rep. ITU-R M.2109 23
STUDY 1 STUDY 2 STUDY 3 STUDY 4 STUDY 5 STUDY 6 STUDY 7 STUDY 8 STUDY 9 STUDY 10 STUDY 11
Adjacent band Results
Long-term interference criterion / Single entry
Minimum
distance
(I/N = –20 dB)
N.A N.A Macro base
station:
18 to 25 km
Mobile station:
300 to 450 m
N.A CDMA Case
from 10 to
34 km
OFDMA Case
from 0.07 to
19 km
N.A CDMA Macro
base station:
from 10 to
42.5 km
CDMA Micro
base station:
from 2 to
14 km
OFDMA
Macro base
station: from 5
to 29 km
OFDMA
Micro base
station: from
2.4 to 8.7 km
N.A Macro base
station: from
49.5 to
80.5 km
Micro base
station: from
39.5 to 51 km
User terminal:
from 25 km to
32.5 km
N.A N.A
Long-term interference criterion / aggregate case
Minimum
distance
(I/N =
– 20 dB)
N.A N.A N.A N.A CDMA Macro
base station:
from 15 to
37 km
OFDMA
Macro base
station: from
0.35 to 21 km
N.A CDMA Macro
base station:
from 27 to
45.5 km
CDMA Micro
base station:
from 11 to
35 km
OFDMA
Macro base
station: from
15 to 41 km
OFDMA
Micro Base
station: from 4
to 8.5 km
N.A N.A
24 Rep. ITU-R M.2109
STUDY 1 STUDY 2 STUDY 3 STUDY 4 STUDY 5 STUDY 6 STUDY 7 STUDY 8 STUDY 9 STUDY 10 STUDY 11
Saturation of LNA/LNB Results
Long-term criterion/Single entry
1 dB compression
Mobile station N.A N.A N.A N.A N.A N.A N.A N.A 170 m N.A N.A
Micro cell
base station
N.A N.A N.A N.A N.A N.A N.A N.A 600 m N.A N.A
Macro cell
base station
N.A N.A N.A N.A N.A N.A N.A N.A 9.5 km N.A N.A
Non-linear operation
Mobile station N.A N.A N.A N.A N.A N.A N.A N.A 550 m N.A N.A
Micro cell
base station
N.A N.A N.A N.A N.A N.A N.A N.A 1.95 km N.A N.A
Macro cell
base station
N.A N.A N.A N.A N.A N.A N.A N.A 30.5 km N.A N.A
Rep. ITU-R M.2109 25
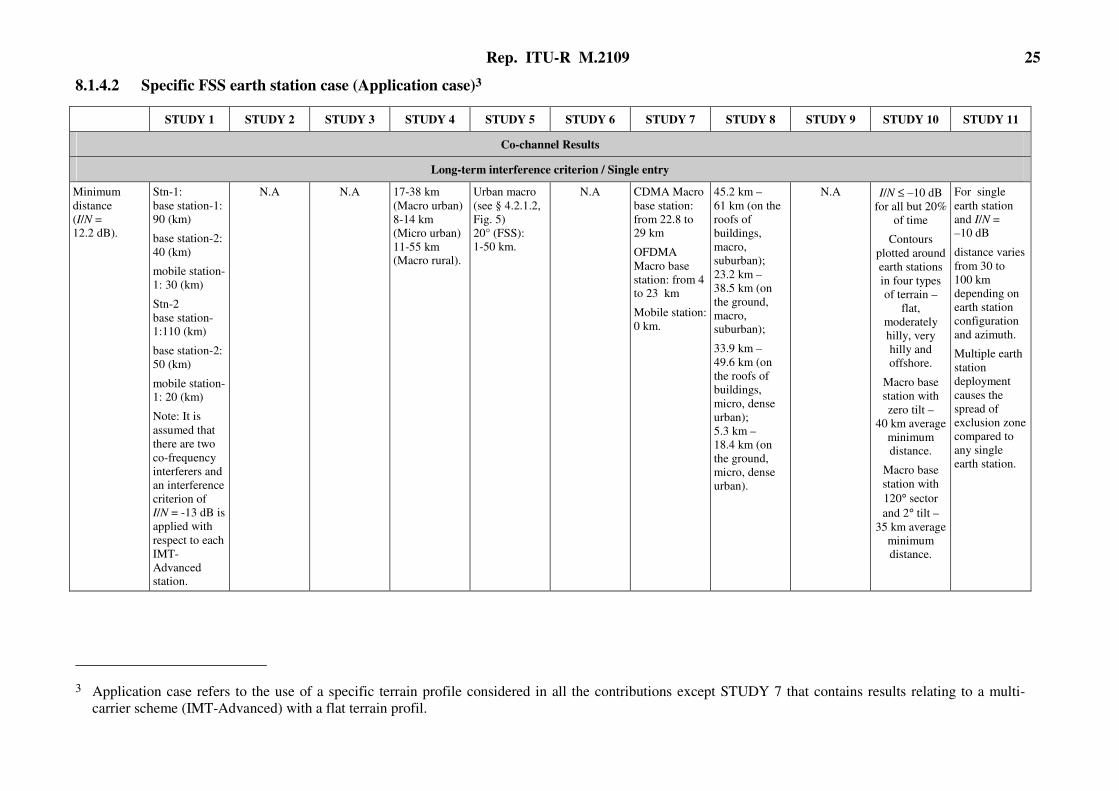
8.1.4.2 Specific FSS earth station case (Application case)3
STUDY 1 STUDY 2 STUDY 3 STUDY 4 STUDY 5 STUDY 6 STUDY 7 STUDY 8 STUDY 9 STUDY 10 STUDY 11
Co-channel Results
Long-term interference criterion / Single entry
Minimum
distance
(I/N =
12.2 dB).
Stn-1:
base station-1:
90 (km)
base station-2:
40 (km)
mobile station-
1: 30 (km)
Stn-2
base station-
1:110 (km)
base station-2:
50 (km)
mobile station-
1: 20 (km)
Note: It is
assumed that
there are two
co-frequency
interferers and
an interference
criterion of
I/N = -13 dB is
applied with
respect to each
IMT-
Advanced
station.
N.A N.A 17-38 km
(Macro urban)
8-14 km
(Micro urban)
11-55 km
(Macro rural).
Urban macro
(see § 4.2.1.2,
Fig. 5)
20° (FSS):
1-50 km.
N.A CDMA Macro
base station:
from 22.8 to
29 km
OFDMA
Macro base
station: from 4
to 23 km
Mobile station:
0 km.
45.2 km –
61 km (on the
roofs of
buildings,
macro,
suburban);
23.2 km –
38.5 km (on
the ground,
macro,
suburban);
33.9 km –
49.6 km (on
the roofs of
buildings,
micro, dense
urban);
5.3 km –
18.4 km (on
the ground,
micro, dense
urban).
N.A I/N ≤ –10 dB
for all but 20%
of time
Contours
plotted around
earth stations
in four types
of terrain –
flat,
moderately
hilly, very
hilly and
offshore.
Macro base
station with
zero tilt –
40 km average
minimum
distance.
Macro base
station with
120° sector
and 2° tilt –
35 km average
minimum
distance.
For single
earth station
and I/N =
–10 dB
distance varies
from 30 to
100 km
depending on
earth station
configuration
and azimuth.
Multiple earth
station
deployment
causes the
spread of
exclusion zone
compared to
any single
earth station.
3 Application case refers to the use of a specific terrain profile considered in all the contributions except STUDY 7 that contains results relating to a multi-
carrier scheme (IMT-Advanced) with a flat terrain profil.

26 Rep. ITU-R M.2109
STUDY 1 STUDY 2 STUDY 3 STUDY 4 STUDY 5 STUDY 6 STUDY 7 STUDY 8 STUDY 9 STUDY 10 STUDY 11
Minimum
distance
(I/N =
–15.2 dB)
N.A N.A N.A N.A N.A N.A N.A N.A N.A N.A N.A
Long-term interference criteria / Aggregate case
Minimum
distance
(I/N =
–12.2 dB)
N.A N.A N.A 21-42 km
(Macro urban)
11-18 km
(Micro urban)
15-58 km
(Macro rural)
N.A N.A N.A N.A N.A N.A N.A
Minimum
Distance
(I/N =
–15.2 dB)
N.A N.A N.A N.A N.A N.A N.A N.A N.A N.A N.A
Short-term interference criterion
Minimum
distance
Stn-1:
base station-1:
270 (km)
base station-2:
90 (km)
mobile station-
1: 30 (km)
Stn-2
base station-
1:280 (km)
base station-2:
80 (km)
mobile station-
1: 20 (km)
N.A N.A 21 to 128 km
for macro
urban
8 to 17 km for
micro urban
28 to 107 km
for macro rural
N.A N.A N.A N.A N.A Macro base
station with
zero tilt –
> 150 km
average
minimum
distance.
Macro base
station with
120° sector
and 2° tilt –
> 125 km
average
minimum
distance.
For single
earth station
and I/N =
–1.3 dB
distance varies
from 50 to
400 km
depending on
earth station
configuration
and azimuth,
and IMT-
Advanced
deployment.
Multiple earth
station
deployment
causes the
spread of
exclusion zone
compared to
any single
earth station.

Rep. ITU-R M.2109 27
8.1.5 Techniques to improve the sharing
This section covers the techniques that would improve the sharing between IMT-Advanced and
FSS. The use of these techniques result either in co-frequency operation of both systems or adjacent
band operation of both systems.
The feasibility and practicability of implementing these techniques have not been studied in the
various FSS deployment scenarios.
Furthermore, some of the techniques listed in this section would need to be further studied.
Techniques implying the use, by IMT-Advanced base stations, of frequencies different from those
used by the FSS earth stations would need to ensure not causing unacceptable interference to FSS
receiving earth station (including unwanted emissions and LNA overdrive).
8.1.5.1 Possible mitigation techniques
The mitigation techniques described in this section would only apply to the situation where the
location of the FSS receive earth station, subject to interference (further referenced as victim FSS
earth station), is known. All of them have been studied with respect to one victim FSS earth station
only.
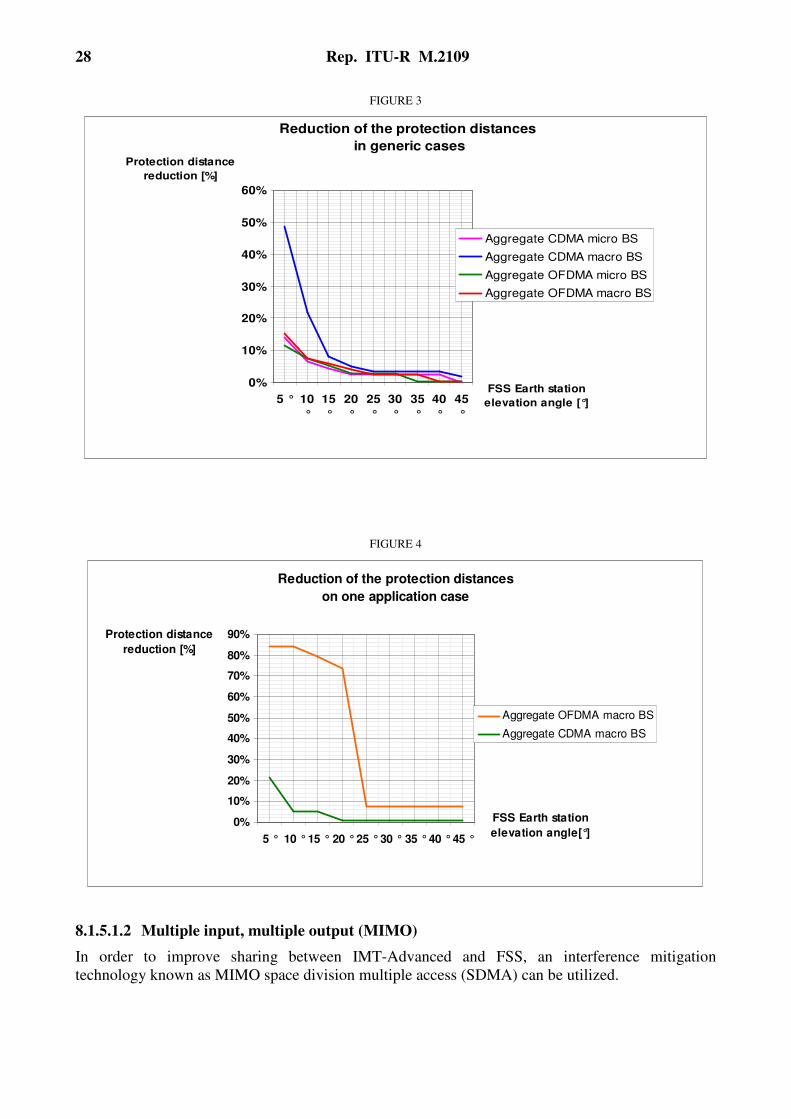
8.1.5.1.1 Sector disabling
The aim of this technique is to reduce, in the direction of the victim FSS earth station, the
transmitting output power of base stations that are located at a distance smaller than the separation
distance. Generally, base stations utilize tri-sectorial antennas. Accordingly, one way to reduce the
transmitting output power level could be to disable the antenna sector that points towards the FSS
earth station, noting that such an area would be covered through the use of other frequency bands by
IMT-Advanced systems.
As shown in the following figures, when compared with normal full active sector mode, the
application of this mitigation technique has shown that the separation distance ranges are reduced
by between 0 and 49% in generic studies (without terrain horizon profile) and between 0 and 83%
for one specific site (with terrain horizon profile) depending on the access mode (see table of
§ 8.1.2, STUDY 7) and on the elevation angle of FSS earth station. These results are valid for base
stations employing CDMA as well as OFDMA access modes.
28 Rep. ITU-R M.2109
FIGURE 3
Reduction of the protection distances
in generic cases
0%
10%
20%
30%
40%
50%
60%
5 ° 10
°
15
°
20
°
25
°
30
°
35
°
40
°
45
°
FSS Earth station
elevation angle [°]
Protection distance
reduction [%]
Aggregate CDMA micro BS
Aggregate CDMA macro BS
Aggregate OFDMA micro BS
Aggregate OFDMA macro BS
FIGURE 4
Reduction of the protection distances
on one application case
0%
10%
20%
30%
40%
50%
60%
70%
80%
90%
5 ° 10 °15 ° 20 °25 °30 ° 35 °40 °45 °
FSS Earth station
elevation angle[°]
Protection distance
reduction [%]
Aggregate OFDMA macro BS
Aggregate CDMA macro BS
8.1.5.1.2 Multiple input, multiple output (MIMO)
In order to improve sharing between IMT-Advanced and FSS, an interference mitigation
technology known as MIMO space division multiple access (SDMA) can be utilized.
Rep. ITU-R M.2109 29
By using this technique, a gain reduction in the base station transmit antenna diagram is generated
towards the interfered FSS earth station. By using the MIMO technique, the minimum separation
distance is 35 m in case of an IMT-Advanced base station and single FSS receiving earth station
under the assumption of 0o direction of earth station (DOE) estimation error which implies that null
beam to the FSS receiving earth station is formulated perfectly. In the case of an IMT-Advanced
base station and 3 FSS receiving earth stations, the minimum separation distance increases up to
3.5 km under the same assumptions. Other results have shown that under the assumption of 8° DOE
estimation error, the minimum separation distances is 22 km, but this still reduces the minimum
separation distance by approximately 50% in the considered case.
As for the sector disabling technique, this approach would require the use of other frequencies to
cover the area where the base transmit antenna gain is reduced.
Some detailed information about this mitigation technique is provided in Annex D.
8.1.5.1.3 Site shielding
In Recommendation ITU-R SF.1486, interference attenuation effect, in a range about 30 dB, due to
the site shielding isolation obtained by providing physical or natural shielding at the FSS earth
stations is described. If such shielding isolation is taken into account, the required separation
distance to protect FSS earth station receivers from IMT-Advanced transmitters can be reduced.
However, the required distance separation between IMT-Advanced transmitter and a FSS receiving
earth station using site shielding has to be evaluated on a site-by-site basis and is dependent on
characteristics and location of each site. The possibility of applying site shielding may not be
guaranteed for all sites.
8.1.5.1.4 Antenna donwtilting
A possible mitigation technique to improve sharing is antenna downtilting at the IMT-Advanced
base stations. In the deployment scenarios envisaged in IMT-Advanced systems, the cell size will
be reduced to support high-speed transmissions assuming a limitation of transmission power. The
deployment based on the small cell size is also indispensable for IMT-Advanced systems in order to
achieve high frequency efficiency. Since the degree of antenna downtilting will be increased in the
case of small cell size in order to avoid inter-cell interference in IMT-Advanced systems using the
frequency reuse, this will also result in the reduction of interference from an IMT-Advanced base
station to FSS earth stations and the reduction of the required minimum distance.
STUDY 4 shows that, for one specific site in urban macro environment, the required separation
distance is decreased by approximately 30% and 50% for the long-term and short-term interference
criteria, respectively, when the antenna-downtilt at IMT-Advanced transmitter is changed from 2°
to 7°. However, the impact of this technique may vary for different locations and results may be
different at other locations.
By increasing the downtilt of the base station antenna, there is a potential:
– for an increase of the number of IMT-Advanced base stations required to provide service in
a given area;
– for a decrease of transmission power per IMT-Advanced base station.
Accordingly, when computing aggregate interference into an FSS receives station, these two
elements would have to be taken into account.

30 Rep. ITU-R M.2109
8.1.5.2 Spectrum management techniques
In areas where all the frequency resources are not fully utilized by the FSS earth station, it may be
possible to introduce IMT-Advanced services. The following spectrum management techniques
may be of interest to administrations wishing to introduce new services in specific geographical
areas.
8.1.5.2.1 Dynamic spectrum allocation
The distribution of radio resources could either be static or dynamic depending on the local
situation in a given area. For spectrum efficiency, the most favorable method would be to use the
dynamic method. Local arrangements may be made to facilitate usage of both systems. In areas
where not all the frequency resources are fully utilized, it may be possible to introduce additional
services either of the same type or other types or a mix. The IMT-Advanced systems need then to
be informed whether the FSS bands can be utilized or not. In the case when an earth station changes
its frequency of operation, the IMT-advanced system may also have to change its frequency in the
surrounding area.
A way for the administration to provide such information to the IMT-Advanced systems may be to
have a data base where all relevant information of the current services or stations, such as FSS earth
stations, using the radio resources in the area. The data base would need to be up to date and would
include information such as central carrier frequency, channel bandwidth etc.
8.1.5.2.2 Usage of beacon
Broadcasting beacon or a network of beacons, or control information co-located with the FSS earth
station (respectively IMT-Advanced base station) provide dynamic and active information on its
spectrum usage to the IMT-Advanced system (respectively FSS earth station) to allow optimum
usage of the unused spectrum to eliminate the inter-system interference.
8.1.6 Proposed methodology to be utilized with mitigation techniques
8.1.6.1 Interference area ratio methodology
This section describes a new methodology to be utilized in assessing the level of coordination
difficulty on the basis of the actual terrain profile between two services for a specific site. This
methodology may be used to assess the effectiveness of mitigation techniques based on the use of
directional antennas, which takes into account the actual shielding effect by terrain profile and
clutter losses associated with the artificial objects. In order to quantitatively evaluate this shielding
effect, the methodology called “interference area ratio”, is employed in some studies, where its
definition is shown in Fig. 5. When applying the interference area ratio of x%, we exclude the x% of
area that has the larger separation distance over d + ∆d. Then, the required separation distance
becomes d + ∆d. When x > 0%, the additional mitigation technique is adopted in order to protect the
FSS earth stations located in the x% of the area. A possible mitigation technique is to employ
directional-beam antenna, such as sectorized- or adaptive-beamforming antenna at an IMT-
Advanced transmitter. The details of the methodology “interference area ratio” can be found in
Annex F.

Rep. ITU-R M.2109 31
FIGURE 5
Definition of interference area ratio
Location of IMT-Advanced transmitter
Discrete point for calculation
Interfered area due to IMT-Advanced transmitter
Calculation area between d and d + ∆d
Interfered area between d and d + ∆d
Interfered area is non-uniformly distributed due to
shielding effect by terrain profile and clutter losses
Interference area ratio = Area of
Area of
Distance d ∆d
Location of IMT-Advanced transmitterLocation of IMT-Advanced transmitter
Discrete point for calculation
Interfered area due to IMT-Advanced transmitter
Calculation area between d and d + ∆d
Interfered area between d and d + ∆d
Discrete point for calculation
Interfered area due to IMT-Advanced transmitter
Calculation area between d and d + ∆d
Interfered area between d and d + ∆d
Interfered area is non-uniformly distributed due to
shielding effect by terrain profile and clutter losses
Interference area ratio = Area of
Area of Interference area ratio =
Area of
Area of
Area of
Area of
Distance d ∆d
Figure 6 shows the required minimum distance as a function of the interference area ratio. As
shown in this figure, according to increase in the interference area ratio value, the required
minimum separation distance can be reduced.
FIGURE 6
Required minimum distance as a function of interference area ratio
(urban area, macro-cell, single-entry)

32 Rep. ITU-R M.2109
In Table 7, the required minimum distance is summarized for an assumed interference area ratio of
10%, as an example. For the comparison, the required minimum distance is also shown in the case
of the interference area ratio of 0%, which is equivalent to the separation distance without
considering the interference area ratio. As shown in this table, by introducing the measure
“interference area ratio” associated with the mitigation technique using the directional beam
antenna, the required minimum distance is reduced by about 5% to 60% depending on the scenarios
in IMT-Advanced systems.
TABLE 7
Required minimum distance for interference area ratio of 10%
(urban area, single-entry, FSS earth station elevation angle = 5°)
Environment IMT-Advanced base
station antenna
downtilt
(degrees)
Interference area
ratio = 10%
(km)
(Reference) Without
considering interference
area ratio
(km)
Macro 2 36 38
Macro 7 21 32
Micro 2 12 14
Micro 7 5.8 14
8.2 Interference from FSS transmitting space station to IMT-Advanced systems
A number of sharing studies examined the impact of FSS interference upon IMT-Advanced receive
stations. The assumptions and methodologies associated with each sharing study are summarized in
tables of § 8.2.2 and 8.2.3. These tables also indicate the extent to which each sharing study
employed the common FSS and IMT-Advance parameters that are specified in Tables 2 through 5
of this Report as well as the operational FSS scenarios recommended by the ITU-R (see § 8.2.1).
The results of the studies are contained in the table in § 8.2.4.
It should be noted that only STUDIES 2, 3, 6 and 7 have provided some results for the § 8.2.
8.2.1 Methodologies used in the simulation
Two scenarios were considered:
– SCENARIO 1 was based on one GSO satellite every 10° of longitude transmitting a
maximum EIRP of 11 dBW per 4 kHz at all elevation angles of 0°-90°, with all such
satellites operating co-frequency and with overlapping areas of coverage.
– SCENARIO 2 was based on one GSO satellite every 4° of longitude transmitting an EIRP
compliant to the RR Article 21 (11.3 dBW per 4 kHz at the 0°-5° elevation angles, {11.3 +
0.5(δ− 5)} dBW per 4 kHz for δ between 5°-25° and 20.1 dBW per 4 kHz at the 25°-90°
elevation angles), with all such satellites operating co-frequency and with overlapping areas
of coverage (δ is the elevation angle).
These scenarios may not be representative of the current satellite deployments but could be
representative of future satellite deployments.

Rep. ITU-R M.2109 33
8.2.2 Compliance with the common parameters
STUDY 2 STUDY 3 STUDY 6 STUDY 7
Compliance with the common set
of IMT-Advanced parameters as
shown in Tables 3 to 5
Fully compliant.
(Use of Rec.
ITU-R F.1336-2)
Fully Compliant Fully Compliant Fully Compliant
Compliance with the common set
of FSS parameters as shown in
Table 2
Fully Compliant. Fully Compliant. Fully Compliant. Fully Compliant.
8.2.3 Compliance with the methodology of § 8.2.1
STUDY 2 STUDY 3 STUDY 6 STUDY 7
Compliance with the proposed
FSS scenarios
Compliant to
SCENARIOS 1
and 2
Compliant to
SCENARIO 2
Supplementary
Scenario
Space station
orbital separation:
10°
Maximum space
station space-to-
Earth PFD: 11.3-
20.1 dB(W/4 kHz)
depending on
angle of arrival
Scenario 1
11.3 dB(W/4 kHz)
for all angles of
arrival
Compliant to
SCENARIO 1
Results (co-channel only)
STUDY 2 STUDY 3 STUDY 6 STUDY 7
I/N for the Macro-cell base
station
SCENARIO 1
– Typical
antenna: from
–15.6 to
–14.4 dB
– Improved
antenna: from
–16.4 to
–14.8 dB
dB, for the 4
latitudes
considered
SCENARIO 2
–3.6
Supplementary
Scenario
0.3-4.2 dB
Scenario 2
No Exceedence
SCENARIO 1
From -18.8 to
–14.9 dB, for the
4 latitudes
considered
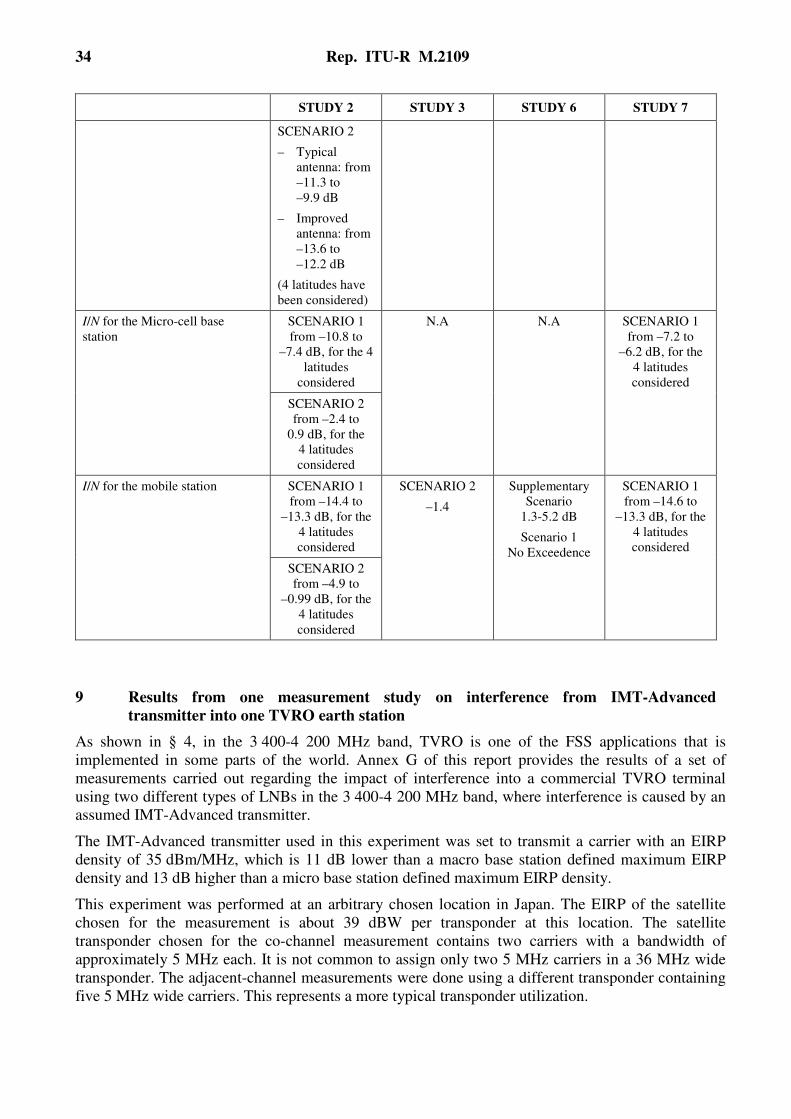
34 Rep. ITU-R M.2109
STUDY 2 STUDY 3 STUDY 6 STUDY 7
SCENARIO 2
– Typical
antenna: from
–11.3 to
–9.9 dB
– Improved
antenna: from
–13.6 to
–12.2 dB
(4 latitudes have
been considered)
I/N for the Micro-cell base
station
SCENARIO 1
from –10.8 to
–7.4 dB, for the 4
latitudes
considered
N.A N.A SCENARIO 1
from –7.2 to
–6.2 dB, for the
4 latitudes
considered
SCENARIO 2
from –2.4 to
0.9 dB, for the
4 latitudes
considered
I/N for the mobile station SCENARIO 1
from –14.4 to
–13.3 dB, for the
4 latitudes
considered
SCENARIO 2
–1.4
Supplementary
Scenario
1.3-5.2 dB
Scenario 1
No Exceedence
SCENARIO 1
from –14.6 to
–13.3 dB, for the
4 latitudes
considered
SCENARIO 2
from –4.9 to
–0.99 dB, for the
4 latitudes
considered
9 Results from one measurement study on interference from IMT-Advanced
transmitter into one TVRO earth station
As shown in § 4, in the 3 400-4 200 MHz band, TVRO is one of the FSS applications that is
implemented in some parts of the world. Annex G of this report provides the results of a set of
measurements carried out regarding the impact of interference into a commercial TVRO terminal
using two different types of LNBs in the 3 400-4 200 MHz band, where interference is caused by an
assumed IMT-Advanced transmitter.
The IMT-Advanced transmitter used in this experiment was set to transmit a carrier with an EIRP
density of 35 dBm/MHz, which is 11 dB lower than a macro base station defined maximum EIRP
density and 13 dB higher than a micro base station defined maximum EIRP density.
This experiment was performed at an arbitrary chosen location in Japan. The EIRP of the satellite
chosen for the measurement is about 39 dBW per transponder at this location. The satellite
transponder chosen for the co-channel measurement contains two carriers with a bandwidth of
approximately 5 MHz each. It is not common to assign only two 5 MHz carriers in a 36 MHz wide
transponder. The adjacent-channel measurements were done using a different transponder containing
five 5 MHz wide carriers. This represents a more typical transponder utilization.
Rep. ITU-R M.2109 35
Summary of the measurement is given as follows:
1) When the distance between an IMT-Advanced transmitter and a TVRO terminal was in the
range of 345 to 5,420 m comprising different 26 locations, no influence on the quality of
the received TV picture was observed at 25 and 26 locations in the case of the co-channel
and adjacent interference scenarios, respectively, with FEC coding rate of 3/4.
2) TV channel employing FEC coding rate of 3/4 was more robust against the increase in the
co-channel interference power level by approximately 2 dB compared to that of 7/8 in
maintaining the same quality of the received TV picture.
3) The influence on the quality of the received TV picture for adjacent-channel interference
scenario was smaller compared to that for co-channel scenario. In order to maintain the
same quality of the received TV picture, approximately 14 dB more power of an IMT-
Advanced transmitter was permitted in the adjacent-channel interference scenario compared
to the co-channel interference scenario.
This test was conducted for one arbitrarily chosen location in Japan. Moreover, only one specific
satellite with the transmissions characteristics of the selected TV carriers was used in the test. The
test reflects one snapshot of one case and does not take into account short-term effects, aggregation
or other applications or modulation/error correction schemes. Therefore results with regard to
potential interference from IMT-Advanced into TVRO or other applications cannot by default be
extended to other cases.
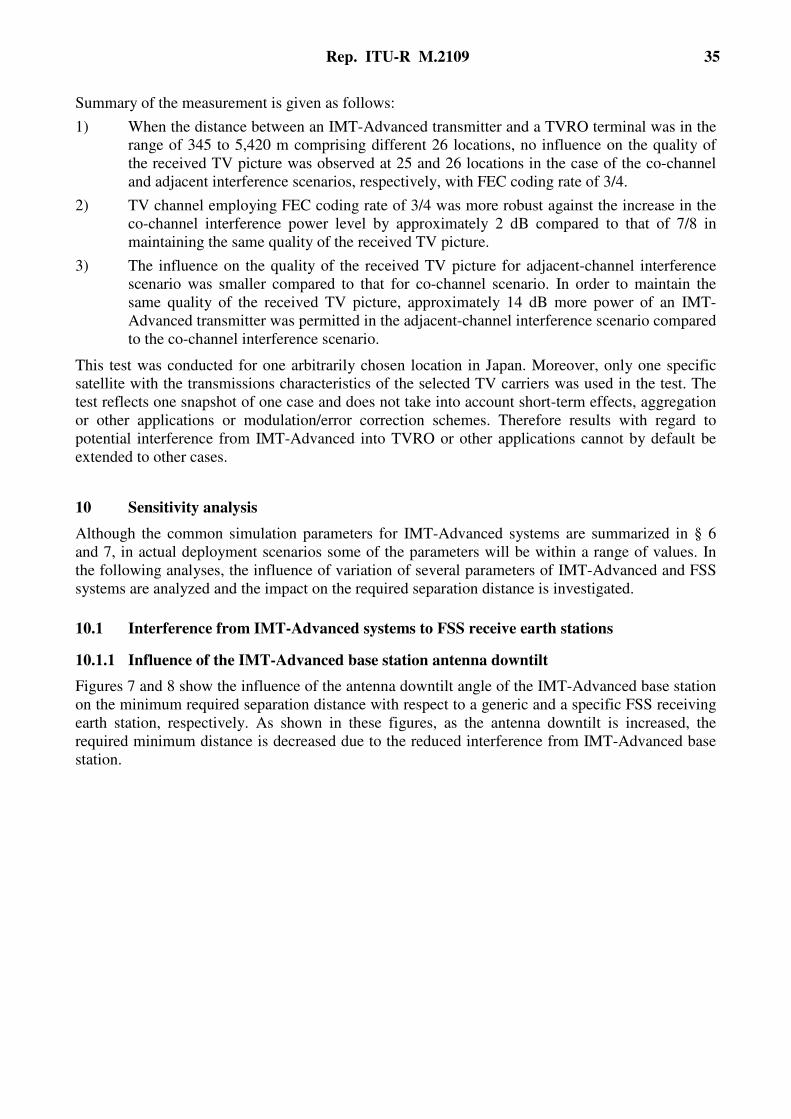
10 Sensitivity analysis
Although the common simulation parameters for IMT-Advanced systems are summarized in § 6
and 7, in actual deployment scenarios some of the parameters will be within a range of values. In
the following analyses, the influence of variation of several parameters of IMT-Advanced and FSS
systems are analyzed and the impact on the required separation distance is investigated.
10.1 Interference from IMT-Advanced systems to FSS receive earth stations
10.1.1 Influence of the IMT-Advanced base station antenna downtilt
Figures 7 and 8 show the influence of the antenna downtilt angle of the IMT-Advanced base station
on the minimum required separation distance with respect to a generic and a specific FSS receiving
earth station, respectively. As shown in these figures, as the antenna downtilt is increased, the
required minimum distance is decreased due to the reduced interference from IMT-Advanced base
station.
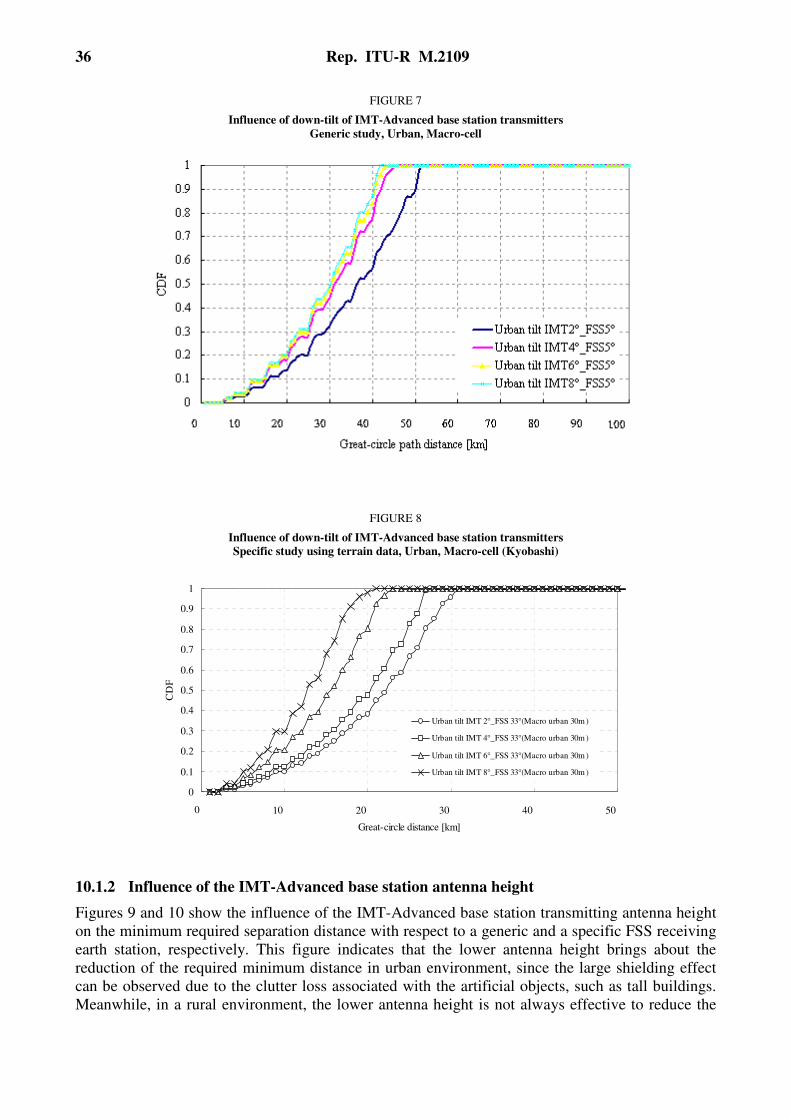
36 Rep. ITU-R M.2109
FIGURE 7
Influence of down-tilt of IMT-Advanced base station transmitters
Generic study, Urban, Macro-cell
FIGURE 8
Influence of down-tilt of IMT-Advanced base station transmitters
Specific study using terrain data, Urban, Macro-cell (Kyobashi)
0
0.1
0.2
0.3
0.4
0.5
0.6
0.7
0.8
0.9
1
0 10 20 30 40 50
Great-circle distance [km]
CD
F
Urban tilt IMT 2°_FSS 33°(Macro urban 30m )
Urban tilt IMT 4°_FSS 33°(Macro urban 30m )
Urban tilt IMT 6°_FSS 33°(Macro urban 30m )
Urban tilt IMT 8°_FSS 33°(Macro urban 30m )
10.1.2 Influence of the IMT-Advanced base station antenna height
Figures 9 and 10 show the influence of the IMT-Advanced base station transmitting antenna height
on the minimum required separation distance with respect to a generic and a specific FSS receiving
earth station, respectively. This figure indicates that the lower antenna height brings about the
reduction of the required minimum distance in urban environment, since the large shielding effect
can be observed due to the clutter loss associated with the artificial objects, such as tall buildings.
Meanwhile, in a rural environment, the lower antenna height is not always effective to reduce the

Rep. ITU-R M.2109 37
required minimum distance, since the large clutter loss is not expected due to the lower average
building height in this environment.
FIGURE 9
Influence of antenna-height of IMT-Advanced base station transmitters
Generic study, Macro-cell
FIGURE 10
Influence of antenna-height of IMT-Advanced base station transmitters
Specific study, Macro-cell (urban: Kyobashi , rural: Kumagaya)
0
0.1
0.2
0.3
0.4
0.5
0.6
0.7
0.8
0.9
1
0 10 20 30 40 50
Great-circle distance [km]
CD
F
Urban tilt IMT 2°_FSS 33°(Macro urban 30m )
Urban tilt IMT 2°_FSS 33°(Macro urban 20m )
Urban tilt IMT 2°_FSS 33°(Macro urban 10m )
Urban tilt IMT 2°_FSS 33°(Macro rural 10m )
10.1.3 Influence of the IMT-Advanced base station EIRP
The sharing studies have been based on the maximum value of the macro and micro base stations
EIRP, shown in Table 3. When deploying an IMT-Advanced network, the maximum EIRP for
IMT-Advanced base station can vary from 59 to 35 dBm according to the type of the base station.
The variation of this maximum EIRP would influence the sharing leading to the reduction of the
size of the required separation distance between IMT-Advanced base station and FSS earth station.
This is a static setting and the reduction of the distance can be derived deterministically.

38 Rep. ITU-R M.2109
Additionally, IMT-Advanced systems will implement the dynamic downlink power control (in
CDMA and OFDMA networks). This feature will have the effect of reducing the EIRP of base
stations, depending on the load of the cells, the distribution of the mobile stations within a cell and
the time. It should be noted that:
– For a single IMT-Advanced base station to FSS earth station path, this would have no
impact on the required distance separation between the IMT-Advanced transmitting base
station and the FSS earth station given that the required distance separation would be based
on the IMT-Advanced base station’s maximum EIRP level.
– For the aggregate case, experience to date shows that it is unlikely that all the IMT-
Advanced base stations transmit at the maximum EIRP at the same time. Consequently, the
use of the downlink power control could result in reducing the required distance separation.
However, the statistical and temporal impact of the downlink power control has not been
quantified
10.1.3.1 Influence of the IMT-Advanced base station maximum EIRP
The maximum EIRP of an IMT-Advanced base station can vary from 59 to 35 dBm for the 20 MHz
minimum bandwidth, according to the Table 3 of this Report. E.i.r.p. below the maximum level of
59 dBm could reduce the required distance separation between the IMT-Advanced transmitting base
station and the FSS earth station.
Figure 11 shows the impact on the required distance between an FSS earth station and an
IMT-Advanced base station, taking into account the different types of aggregate base stations with
a maximum EIRP value between 35 dBm and 56 dBm. The variation of the base stations
deployment density and antenna type has been taken into account accordingly4.
FIGURE 11
Protection distance reduction) versus earth station antenna elevation angles a function of EIRP
0,00%
5,00%
10,00%
15,00%
20,00%
25,00%
30,00%
35,00%
40,00%
45,00%
5° 15° 25° 35° 45°
Elevation angle [°]
Protection distance
reduction[%]
EIRP=56 dBm
EIRP=53 dBm
EIRP=38 dBm
EIRP=35 dBm
4 The number of the aggregate base stations is determined according to the methodology defined in the
§ 8.1.1 and the cell size values defined in the Table 3.
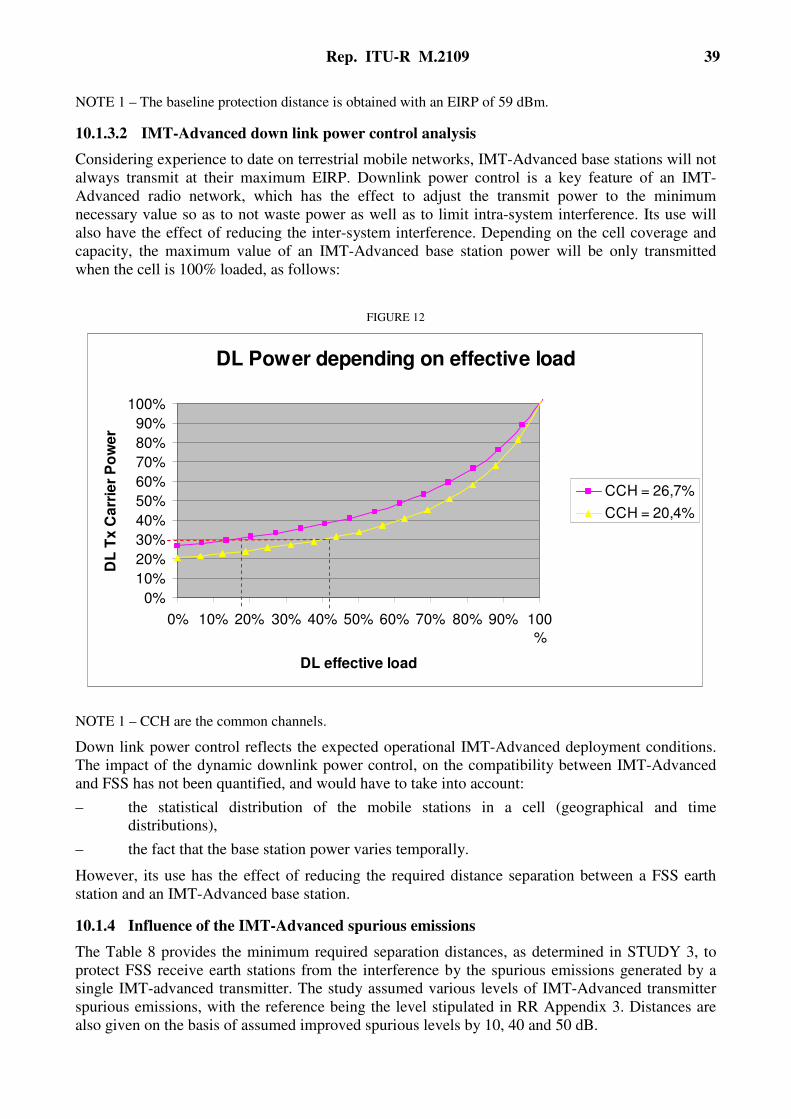
Rep. ITU-R M.2109 39
NOTE 1 – The baseline protection distance is obtained with an EIRP of 59 dBm.
10.1.3.2 IMT-Advanced down link power control analysis
Considering experience to date on terrestrial mobile networks, IMT-Advanced base stations will not
always transmit at their maximum EIRP. Downlink power control is a key feature of an IMT-
Advanced radio network, which has the effect to adjust the transmit power to the minimum
necessary value so as to not waste power as well as to limit intra-system interference. Its use will
also have the effect of reducing the inter-system interference. Depending on the cell coverage and
capacity, the maximum value of an IMT-Advanced base station power will be only transmitted
when the cell is 100% loaded, as follows:
FIGURE 12
DL Power depending on effective load
0%
10%
20%
30%
40%
50%
60%
70%
80%
90%
100%
0% 10% 20% 30% 40% 50% 60% 70% 80% 90% 100
%
DL effective load
DL
Tx
Ca
rrie
r P
ow
er
CCH = 26,7%
CCH = 20,4%
NOTE 1 – CCH are the common channels.
Down link power control reflects the expected operational IMT-Advanced deployment conditions.
The impact of the dynamic downlink power control, on the compatibility between IMT-Advanced
and FSS has not been quantified, and would have to take into account:
– the statistical distribution of the mobile stations in a cell (geographical and time
distributions),
– the fact that the base station power varies temporally.
However, its use has the effect of reducing the required distance separation between a FSS earth
station and an IMT-Advanced base station.
10.1.4 Influence of the IMT-Advanced spurious emissions
The Table 8 provides the minimum required separation distances, as determined in STUDY 3, to
protect FSS receive earth stations from the interference by the spurious emissions generated by a
single IMT-advanced transmitter. The study assumed various levels of IMT-Advanced transmitter
spurious emissions, with the reference being the level stipulated in RR Appendix 3. Distances are
also given on the basis of assumed improved spurious levels by 10, 40 and 50 dB.

40 Rep. ITU-R M.2109
The analyses were based on the propagation models described in ITU-R P.452-12. Due to the
generic nature of the analysis, for the long-term protection cases, the propagation was calculated
over a smooth earth surface, utilizing the propagation model described in § 4.3 of ITU-R P.452-12.
The models in ITU-R P.452-12 can include the effects of building losses and clutter where the
topography of surrounding obstacles etc. is known. However, due to lack of information for these
parameters, the building losses and clutter effects have been assumed to represent suburban
environment in these analyses.
TABLE 8
Percentage Increase of FSS system noise 1.0% 0.5% 1.0% 0.5%
Additional reduction of IMT-Advanced
transmitter spurious emission level (dB)
0 0 10 10
IMT-Advanced macro base station 18 km 25 km 5 km 7.5 km
IMT-Advanced mobile station 300 m 450 m 100 m 140 m
Percentage Increase of FSS system noise 1.0% 0.5% 1.0% 0.5%
Additional reduction of IMT-Advanced
transmitter spurious emission level (dB)
40 40 50 50
IMT-Advanced macro base station 115 m 150 m 35 m 50 m
NOTE – The results corresponding to 0,5% are only given as an example, since no guidance was provided
by ITU-R on the apportionment for the interference from other sources.
The results of this study showed that operation of IMT-Advanced systems and the FSS in adjacent
bands in the 4 GHz frequency range would be very difficult and may not be feasible in the same
geographical area if the IMT-Advanced transmitter spurious emission is defined in accordance with
the limits specified in RR Appendix 3.
Additional information on this study can be found in Annex H.
10.1.5 Influence of FSS earth station elevation angle and losses from local clutter on adjacent
band separation distances
From STUDY 9, it was noted that the required separation distances will depend significantly on the
elevation angle of the FSS earth station. Also, if the propagation is attenuated by local clutter that
blocks direct line-of-sight, this will have a significant impact on the received interference.
To ascertain the impact of elevation angle and clutter loss, STUDY 9 also calculated the required
separation distance (both with respect to overdrive of LNA’s and unwanted emissions) as a function
of the elevation angle, assuming two values for clutter loss; 0 dB and 20 dB.
From the results of the study, it can be noted that:
– An elevation angle of 20° will reduce the separation distance to 17.7% compared to that of
5°.
– An elevation angle of 45° will reduce the separation distance to 6.4% compared to that of
5°.
– 20 dB clutter loss will reduce the separation distance to 10% compared to that of 0 dB.

Rep. ITU-R M.2109 41
10.2 Interference from FSS transmitting space station to IMT-Advanced systems
10.2.1 Influence of the antenna downtilt and the latitude of a base station
This section provides I/N ranges according to the FSS networks parameters scenario and the
IMT-Advanced downtilt parameter chosen.
Range of I/N (dB), as a function of the downtilt (from 0° to 2°) and latitude of the IMT-Advanced
base station.
TABLE 9
FSS network
scenario
Macro-cell base station Micro-cell base
station Typical antenna Improved antenna
Scenario 1 From –14.4 to –7.0 From –14.8 to –7.1 From –7.9 to –7.4
Scenario 2 From –9.9 to –5.5 From –12.2 to –6.2 From 0.3 to 0.9
NOTES:
1 See § 7.2.1 for a description of FSS network scenarios 1 and 2.
2 These results have been assessed using the approved draft new Recommendation ITU-R F.1336-1, i.e.,
Rec. ITU-R F.1336-2.
3 It has to be noted that typical values for the antenna downtilt are as follows:
a) Macro base station IMT-Advanced (height = 30 m): between 2° and 20°.
b) Micro base station IMT-Advanced (height = 5 m): between 0° and 20°.
11 Conclusions
Sharing studies have been performed to assess the technical feasibility of deploying IMT-Advanced
systems in the 3 400-4 200 MHz and 4 500-4 800 MHz bands, that are utilized by FSS (amongst
other services).
To provide protection of the FSS receive earth stations, some separation distance relative to the
stations of the mobile terrestrial network is required. The magnitude of this separation distance
depends on the parameters of the networks and the deployment of the two services. The magnitudes
of these required separation distances to protect the FSS receive earth stations have been studied,
taking account of the need to meet both short-term and long-term interference criteria requirements,
with respect to the three following interference mechanisms:
1. In-band, co-channel operations
The minimum required separation distances from IMT-Advanced base stations, when using
the long-term interference criterion derived in the studies to date, are at least in the tens of
kilometres.
The minimum separation distances associated with short-term interference criterion,
generally, but not in all cases, exceed one hundred kilometres in the considered cases with
similar assumptions as the ones used for the long-term.
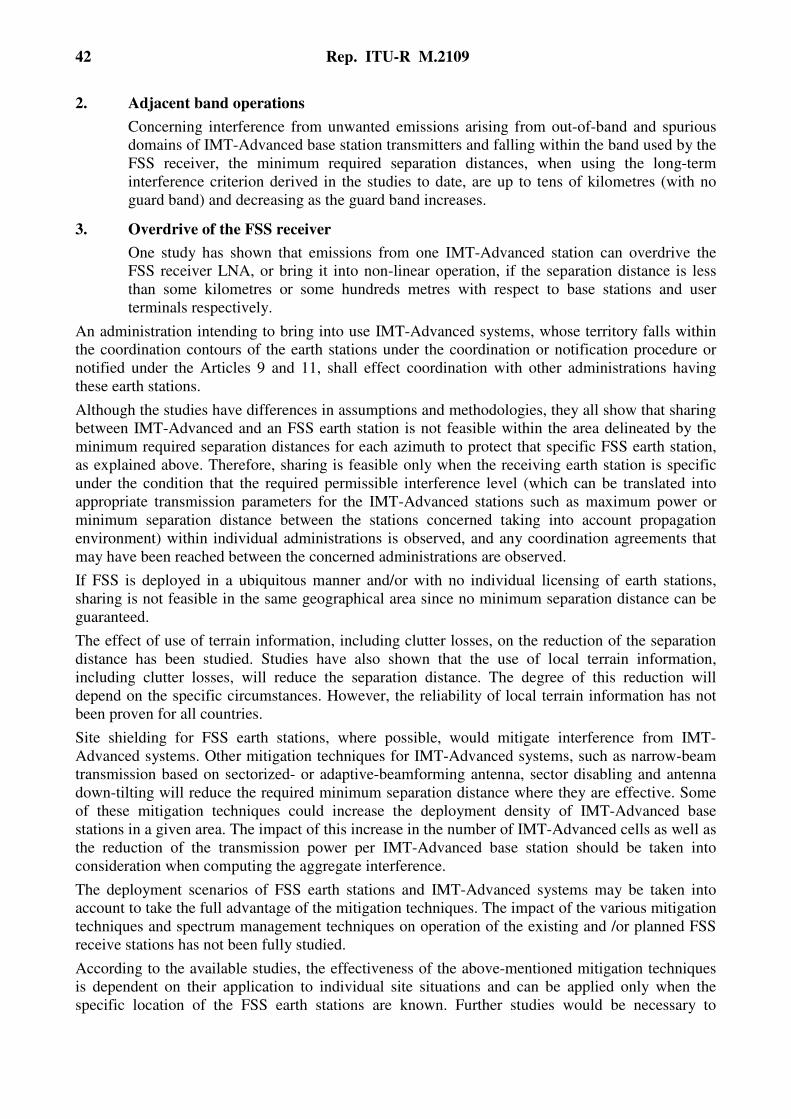
42 Rep. ITU-R M.2109
2. Adjacent band operations
Concerning interference from unwanted emissions arising from out-of-band and spurious
domains of IMT-Advanced base station transmitters and falling within the band used by the
FSS receiver, the minimum required separation distances, when using the long-term
interference criterion derived in the studies to date, are up to tens of kilometres (with no
guard band) and decreasing as the guard band increases.
3. Overdrive of the FSS receiver
One study has shown that emissions from one IMT-Advanced station can overdrive the
FSS receiver LNA, or bring it into non-linear operation, if the separation distance is less
than some kilometres or some hundreds metres with respect to base stations and user
terminals respectively.
An administration intending to bring into use IMT-Advanced systems, whose territory falls within
the coordination contours of the earth stations under the coordination or notification procedure or
notified under the Articles 9 and 11, shall effect coordination with other administrations having
these earth stations.
Although the studies have differences in assumptions and methodologies, they all show that sharing
between IMT-Advanced and an FSS earth station is not feasible within the area delineated by the
minimum required separation distances for each azimuth to protect that specific FSS earth station,
as explained above. Therefore, sharing is feasible only when the receiving earth station is specific
under the condition that the required permissible interference level (which can be translated into
appropriate transmission parameters for the IMT-Advanced stations such as maximum power or
minimum separation distance between the stations concerned taking into account propagation
environment) within individual administrations is observed, and any coordination agreements that
may have been reached between the concerned administrations are observed.
If FSS is deployed in a ubiquitous manner and/or with no individual licensing of earth stations,
sharing is not feasible in the same geographical area since no minimum separation distance can be
guaranteed.
The effect of use of terrain information, including clutter losses, on the reduction of the separation
distance has been studied. Studies have also shown that the use of local terrain information,
including clutter losses, will reduce the separation distance. The degree of this reduction will
depend on the specific circumstances. However, the reliability of local terrain information has not
been proven for all countries.
Site shielding for FSS earth stations, where possible, would mitigate interference from IMT-
Advanced systems. Other mitigation techniques for IMT-Advanced systems, such as narrow-beam
transmission based on sectorized- or adaptive-beamforming antenna, sector disabling and antenna
down-tilting will reduce the required minimum separation distance where they are effective. Some
of these mitigation techniques could increase the deployment density of IMT-Advanced base
stations in a given area. The impact of this increase in the number of IMT-Advanced cells as well as
the reduction of the transmission power per IMT-Advanced base station should be taken into
consideration when computing the aggregate interference.
The deployment scenarios of FSS earth stations and IMT-Advanced systems may be taken into
account to take the full advantage of the mitigation techniques. The impact of the various mitigation
techniques and spectrum management techniques on operation of the existing and /or planned FSS
receive stations has not been fully studied.
According to the available studies, the effectiveness of the above-mentioned mitigation techniques
is dependent on their application to individual site situations and can be applied only when the
specific location of the FSS earth stations are known. Further studies would be necessary to
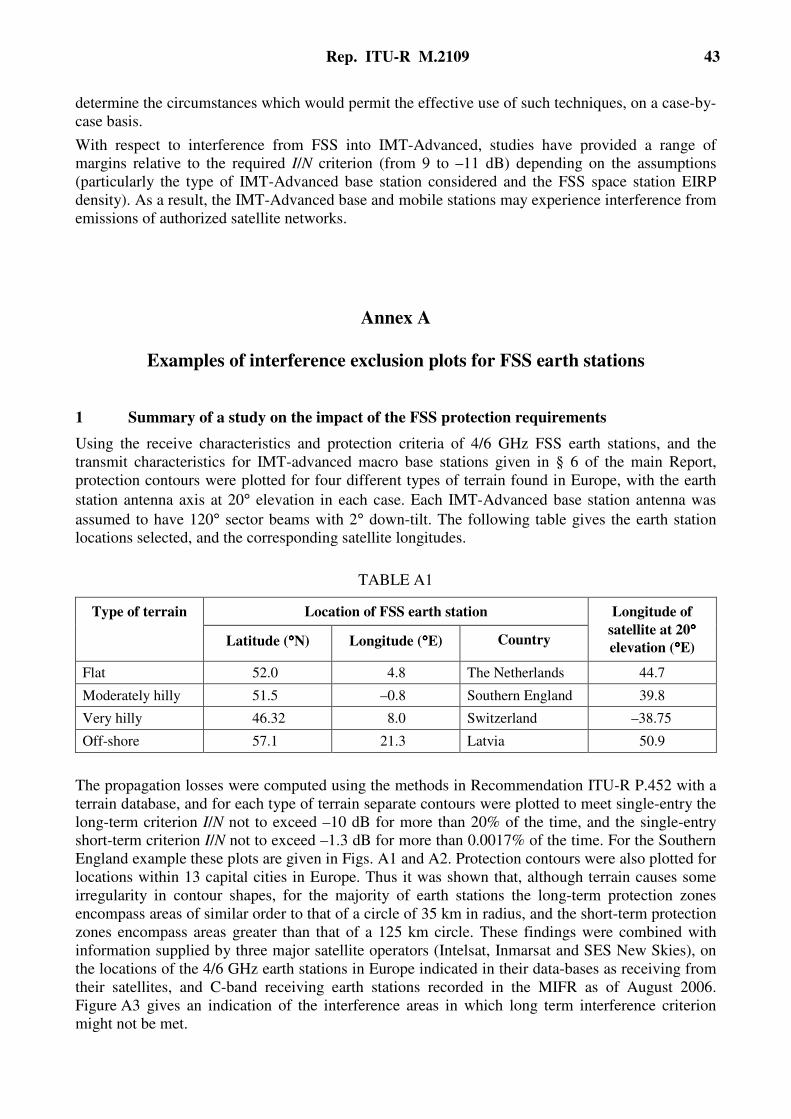
Rep. ITU-R M.2109 43
determine the circumstances which would permit the effective use of such techniques, on a case-by-
case basis.
With respect to interference from FSS into IMT-Advanced, studies have provided a range of
margins relative to the required I/N criterion (from 9 to –11 dB) depending on the assumptions
(particularly the type of IMT-Advanced base station considered and the FSS space station EIRP
density). As a result, the IMT-Advanced base and mobile stations may experience interference from
emissions of authorized satellite networks.
Annex A
Examples of interference exclusion plots for FSS earth stations
1 Summary of a study on the impact of the FSS protection requirements
Using the receive characteristics and protection criteria of 4/6 GHz FSS earth stations, and the
transmit characteristics for IMT-advanced macro base stations given in § 6 of the main Report,
protection contours were plotted for four different types of terrain found in Europe, with the earth
station antenna axis at 20° elevation in each case. Each IMT-Advanced base station antenna was
assumed to have 120° sector beams with 2° down-tilt. The following table gives the earth station
locations selected, and the corresponding satellite longitudes.
TABLE A1
Type of terrain Location of FSS earth station Longitude of
satellite at 20°°°°
elevation (°°°°E) Latitude (°°°°N) Longitude (°°°°E) Country
Flat 52.0 4.8 The Netherlands 44.7
Moderately hilly 51.5 –0.8 Southern England 39.8
Very hilly 46.32 8.0 Switzerland –38.75
Off-shore 57.1 21.3 Latvia 50.9
The propagation losses were computed using the methods in Recommendation ITU-R P.452 with a
terrain database, and for each type of terrain separate contours were plotted to meet single-entry the
long-term criterion I/N not to exceed –10 dB for more than 20% of the time, and the single-entry
short-term criterion I/N not to exceed –1.3 dB for more than 0.0017% of the time. For the Southern
England example these plots are given in Figs. A1 and A2. Protection contours were also plotted for
locations within 13 capital cities in Europe. Thus it was shown that, although terrain causes some
irregularity in contour shapes, for the majority of earth stations the long-term protection zones
encompass areas of similar order to that of a circle of 35 km in radius, and the short-term protection
zones encompass areas greater than that of a 125 km circle. These findings were combined with
information supplied by three major satellite operators (Intelsat, Inmarsat and SES New Skies), on
the locations of the 4/6 GHz earth stations in Europe indicated in their data-bases as receiving from
their satellites, and C-band receiving earth stations recorded in the MIFR as of August 2006.
Figure A3 gives an indication of the interference areas in which long term interference criterion
might not be met.
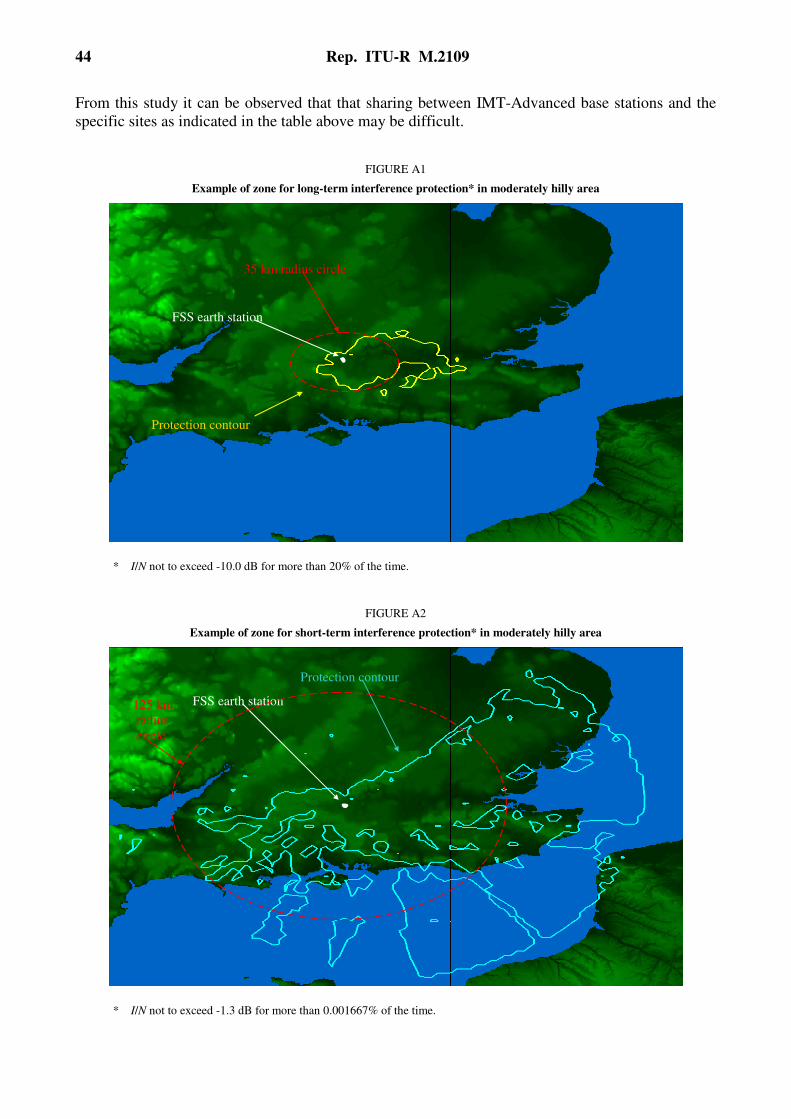
44 Rep. ITU-R M.2109
From this study it can be observed that that sharing between IMT-Advanced base stations and the
specific sites as indicated in the table above may be difficult.
FIGURE A1
Example of zone for long-term interference protection* in moderately hilly area
* I/N not to exceed -10.0 dB for more than 20% of the time.
FIGURE A2
Example of zone for short-term interference protection* in moderately hilly area
* I/N not to exceed -1.3 dB for more than 0.001667% of the time.
FSS earth station
Protection contour
35 km radius circle
FSS earth station
Protection contour
125 km
radius
circle
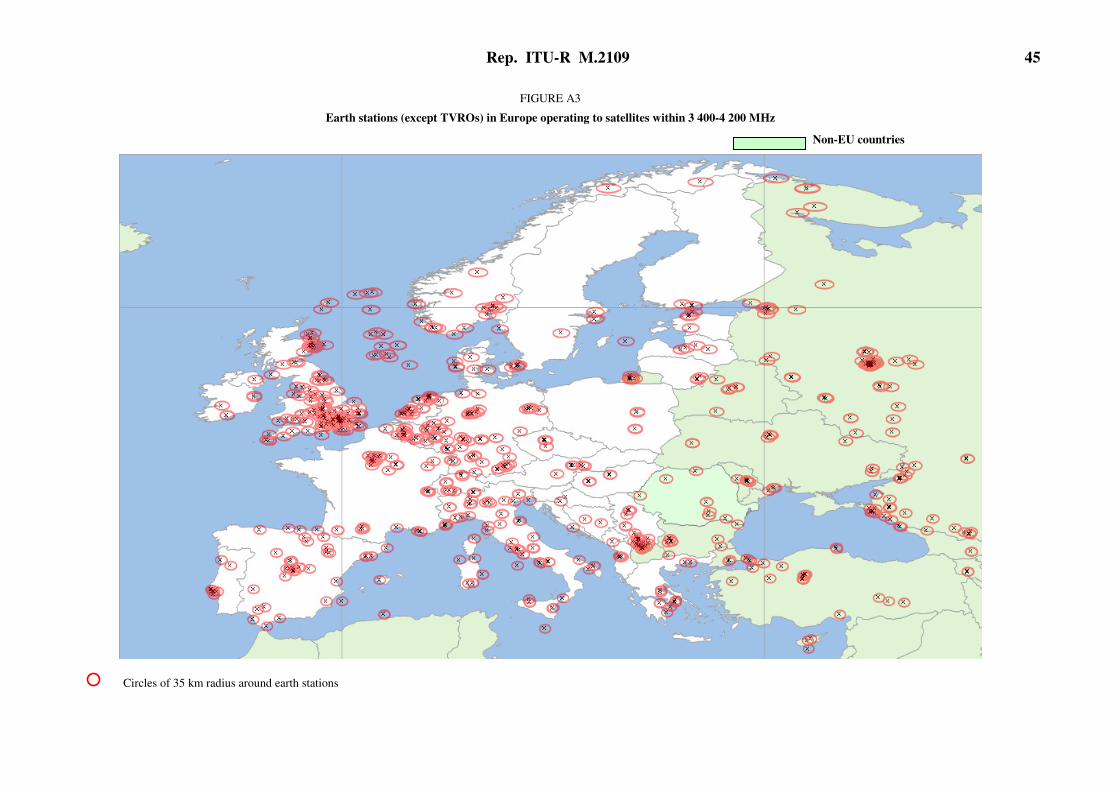
Rep. ITU-R M.2109 45
FIGURE A3
Earth stations (except TVROs) in Europe operating to satellites within 3 400-4 200 MHz
Non-EU countries
Circles of 35 km radius around earth stations

46 Rep. ITU-R M.2109
2 Locations of FSS earth stations
Figures A4, A5 and A6 show the locations of some earth stations registered with several satellite operators receiving authorised transmissions from
the operating satellites of one FSS operator in the 3 700-4 200 MHz, 3 625-3 700 MHz and 3 400-3 625 MHz bands respectively. Also Fig. A7
provides information regarding the use of 3 625-4 200 MHz band by the FSS in Brazil. The earth stations shown in these figures do not include un-
registered earth stations such as TVRO terminals
FIGURE A4
Locations of earth stations registered with several satellite operators and receiving in the 3 700-4 200 MHz band
Denotes a site that may include one or more stations.

Rep. ITU-R M.2109 47
FIGURE A5
Locations of earth stations registered with several satellite operators and receiving in the 3 625-3 700 MHz band
Denotes a site that may include one or more stations.

48 Rep. ITU-R M.2109
FIGURE A6
Locations of earth stations registered with several satellite operators and receiving in the 3 400-3 625 MHz band
Denotes a site that may include one or more stations.

Rep. ITU-R M.2109 49
FIGURE A7
FSS earth stations in Brazil (sites using 3 625-4 200 MHz)

50 Rep. ITU-R M.2109
3 Locations and areas of coverage of 4/6 GHz FSS satellites
The longitudes and service areas of many, but not all, of the FSS satellites providing down-links in
the 3 400-4 200 MHz band are given in Table A2.
TABLE A2
Some space stations operating in the 3 400-4 200 MHz band
Satellite Name
Orbital
location
(EL)
Service area
NSS 5 –177 East Asia /Australia / Western United States
AMC-8 –139.0 North America
AMC-7 –137.0 North America
AMC-10 –135.0 North America
Galaxy 15 –133.0 North America
AMC-11 –131.0 North America
Intelsat Americas 7 –129.0 North America
Galaxy 13 –127.0 North America
Galaxy 14 –125.0 North America
Galaxy 12 –125.0 North America
Galaxy 10R –123.0 North America
Intelsat Americas 13 –121.0 North America
Anik F3 –118.7 North America
SATMEX-5 –116.9 North America
Solidaridad-2 –114.9 North America
SATMEX-6 –113.0 North America
Anik F2 –111.1 North America
Anik F1 –107.3 North America
Anik F1R –107.3 South America
AMC-18 –105.0 North America
AMC-1 –103.0 North America
AMC-4 –101.0 North America
Galaxy 16 –99.0 North America
INMARSAT 3 –98.0 Global
Intelsat Americas 5 –97.0 North America
Galaxy 3C –95.0 North America
Intelsat Americas 6 –93.0 North America
BRASILSAT B4 –92.0 Brazil
Galaxy 11 –91.0 North America
Intelsat Americas 8 –89.0 North America
AMC-3 –87.0 North America
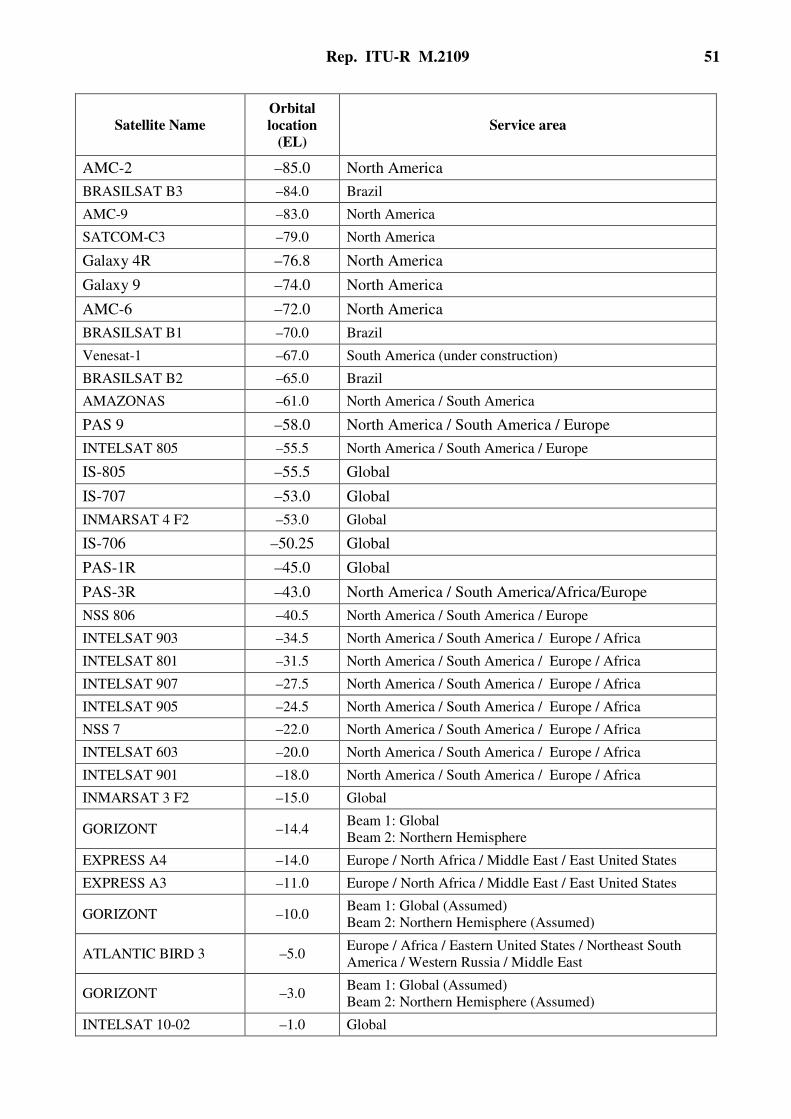
Rep. ITU-R M.2109 51
Satellite Name
Orbital
location
(EL)
Service area
AMC-2 –85.0 North America
BRASILSAT B3 –84.0 Brazil
AMC-9 –83.0 North America
SATCOM-C3 –79.0 North America
Galaxy 4R –76.8 North America
Galaxy 9 –74.0 North America
AMC-6 –72.0 North America
BRASILSAT B1 –70.0 Brazil
Venesat-1 –67.0 South America (under construction)
BRASILSAT B2 –65.0 Brazil
AMAZONAS –61.0 North America / South America
PAS 9 –58.0 North America / South America / Europe
INTELSAT 805 –55.5 North America / South America / Europe
IS-805 –55.5 Global
IS-707 –53.0 Global
INMARSAT 4 F2 –53.0 Global
IS-706 –50.25 Global
PAS-1R –45.0 Global
PAS-3R –43.0 North America / South America/Africa/Europe
NSS 806 –40.5 North America / South America / Europe
INTELSAT 903 –34.5 North America / South America / Europe / Africa
INTELSAT 801 –31.5 North America / South America / Europe / Africa
INTELSAT 907 –27.5 North America / South America / Europe / Africa
INTELSAT 905 –24.5 North America / South America / Europe / Africa
NSS 7 –22.0 North America / South America / Europe / Africa
INTELSAT 603 –20.0 North America / South America / Europe / Africa
INTELSAT 901 –18.0 North America / South America / Europe / Africa
INMARSAT 3 F2 –15.0 Global
GORIZONT –14.4 Beam 1: Global
Beam 2: Northern Hemisphere
EXPRESS A4 –14.0 Europe / North Africa / Middle East / East United States
EXPRESS A3 –11.0 Europe / North Africa / Middle East / East United States
GORIZONT –10.0 Beam 1: Global (Assumed)
Beam 2: Northern Hemisphere (Assumed)
ATLANTIC BIRD 3 –5.0 Europe / Africa / Eastern United States / Northeast South
America / Western Russia / Middle East
GORIZONT –3.0 Beam 1: Global (Assumed)
Beam 2: Northern Hemisphere (Assumed)
INTELSAT 10-02 –1.0 Global
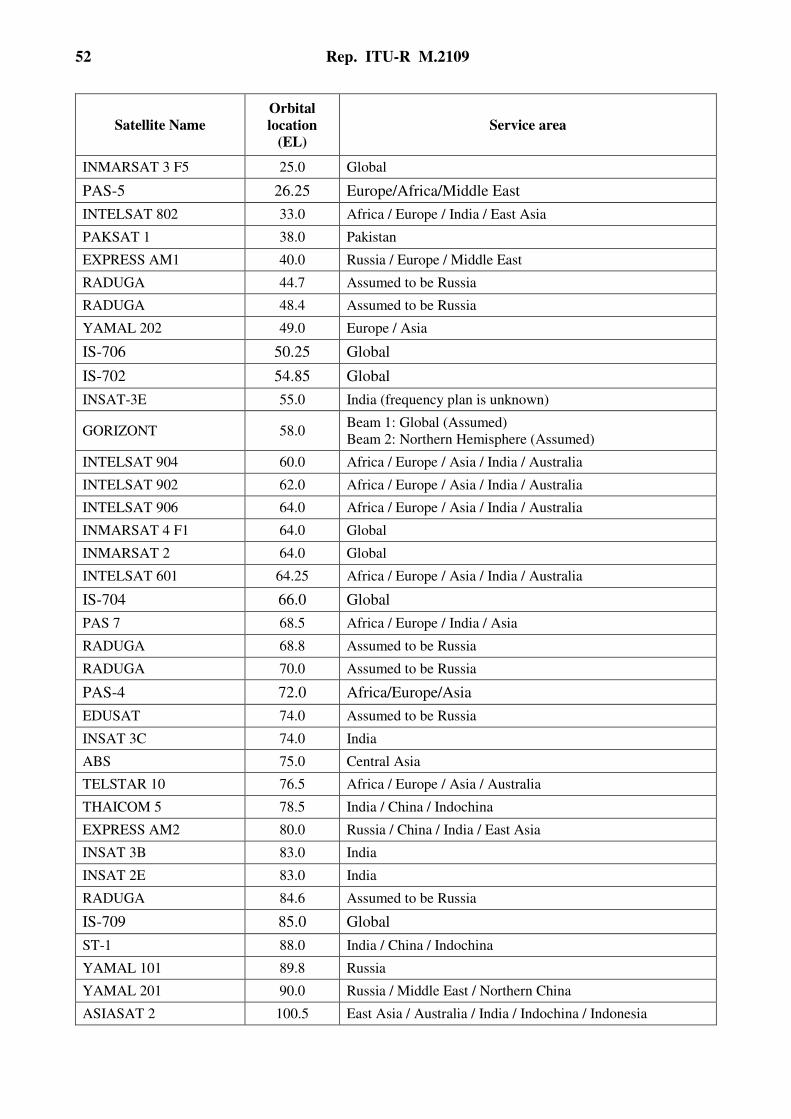
52 Rep. ITU-R M.2109
Satellite Name
Orbital
location
(EL)
Service area
INMARSAT 3 F5 25.0 Global
PAS-5 26.25 Europe/Africa/Middle East
INTELSAT 802 33.0 Africa / Europe / India / East Asia
PAKSAT 1 38.0 Pakistan
EXPRESS AM1 40.0 Russia / Europe / Middle East
RADUGA 44.7 Assumed to be Russia
RADUGA 48.4 Assumed to be Russia
YAMAL 202 49.0 Europe / Asia
IS-706 50.25 Global
IS-702 54.85 Global
INSAT-3E 55.0 India (frequency plan is unknown)
GORIZONT 58.0 Beam 1: Global (Assumed)
Beam 2: Northern Hemisphere (Assumed)
INTELSAT 904 60.0 Africa / Europe / Asia / India / Australia
INTELSAT 902 62.0 Africa / Europe / Asia / India / Australia
INTELSAT 906 64.0 Africa / Europe / Asia / India / Australia
INMARSAT 4 F1 64.0 Global
INMARSAT 2 64.0 Global
INTELSAT 601 64.25 Africa / Europe / Asia / India / Australia
IS-704 66.0 Global
PAS 7 68.5 Africa / Europe / India / Asia
RADUGA 68.8 Assumed to be Russia
RADUGA 70.0 Assumed to be Russia
PAS-4 72.0 Africa/Europe/Asia
EDUSAT 74.0 Assumed to be Russia
INSAT 3C 74.0 India
ABS 75.0 Central Asia
TELSTAR 10 76.5 Africa / Europe / Asia / Australia
THAICOM 5 78.5 India / China / Indochina
EXPRESS AM2 80.0 Russia / China / India / East Asia
INSAT 3B 83.0 India
INSAT 2E 83.0 India
RADUGA 84.6 Assumed to be Russia
IS-709 85.0 Global
ST-1 88.0 India / China / Indochina
YAMAL 101 89.8 Russia
YAMAL 201 90.0 Russia / Middle East / Northern China
ASIASAT 2 100.5 East Asia / Australia / India / Indochina / Indonesia
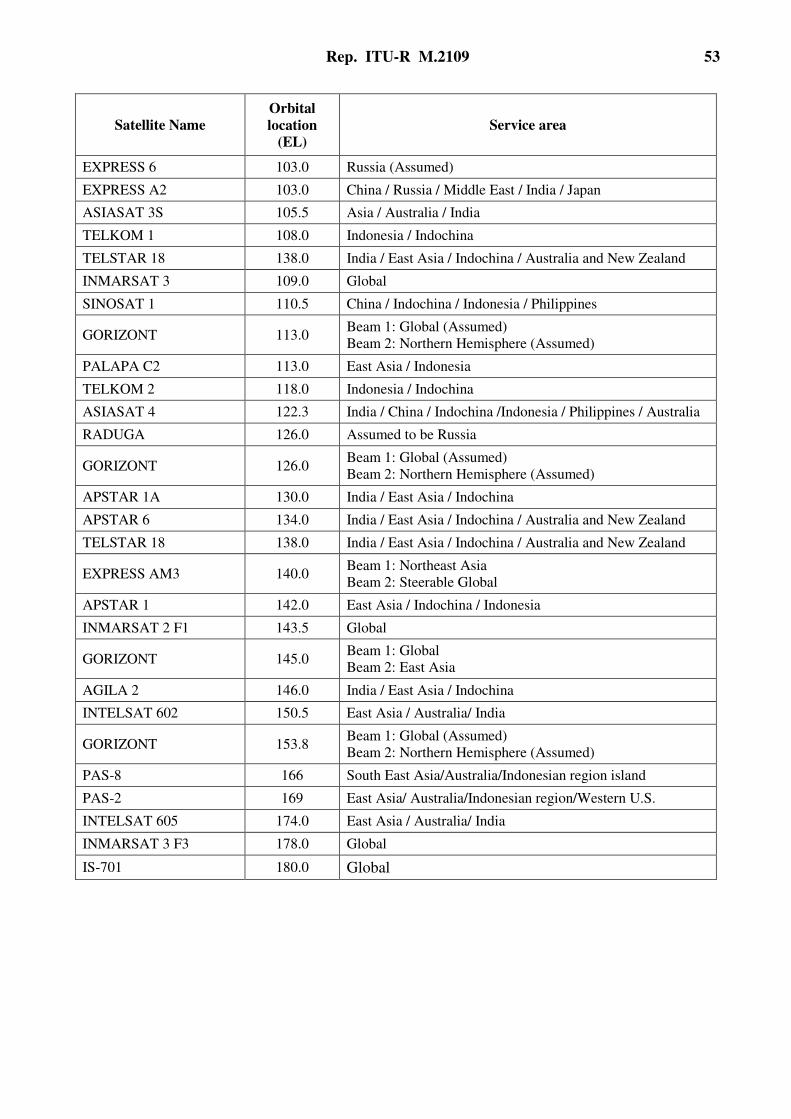
Rep. ITU-R M.2109 53
Satellite Name
Orbital
location
(EL)
Service area
EXPRESS 6 103.0 Russia (Assumed)
EXPRESS A2 103.0 China / Russia / Middle East / India / Japan
ASIASAT 3S 105.5 Asia / Australia / India
TELKOM 1 108.0 Indonesia / Indochina
TELSTAR 18 138.0 India / East Asia / Indochina / Australia and New Zealand
INMARSAT 3 109.0 Global
SINOSAT 1 110.5 China / Indochina / Indonesia / Philippines
GORIZONT 113.0 Beam 1: Global (Assumed)
Beam 2: Northern Hemisphere (Assumed)
PALAPA C2 113.0 East Asia / Indonesia
TELKOM 2 118.0 Indonesia / Indochina
ASIASAT 4 122.3 India / China / Indochina /Indonesia / Philippines / Australia
RADUGA 126.0 Assumed to be Russia
GORIZONT 126.0 Beam 1: Global (Assumed)
Beam 2: Northern Hemisphere (Assumed)
APSTAR 1A 130.0 India / East Asia / Indochina
APSTAR 6 134.0 India / East Asia / Indochina / Australia and New Zealand
TELSTAR 18 138.0 India / East Asia / Indochina / Australia and New Zealand
EXPRESS AM3 140.0 Beam 1: Northeast Asia
Beam 2: Steerable Global
APSTAR 1 142.0 East Asia / Indochina / Indonesia
INMARSAT 2 F1 143.5 Global
GORIZONT 145.0 Beam 1: Global
Beam 2: East Asia
AGILA 2 146.0 India / East Asia / Indochina
INTELSAT 602 150.5 East Asia / Australia/ India
GORIZONT 153.8 Beam 1: Global (Assumed)
Beam 2: Northern Hemisphere (Assumed)
PAS-8 166 South East Asia/Australia/Indonesian region island
PAS-2 169 East Asia/ Australia/Indonesian region/Western U.S.
INTELSAT 605 174.0 East Asia / Australia/ India
INMARSAT 3 F3 178.0 Global
IS-701 180.0 Global
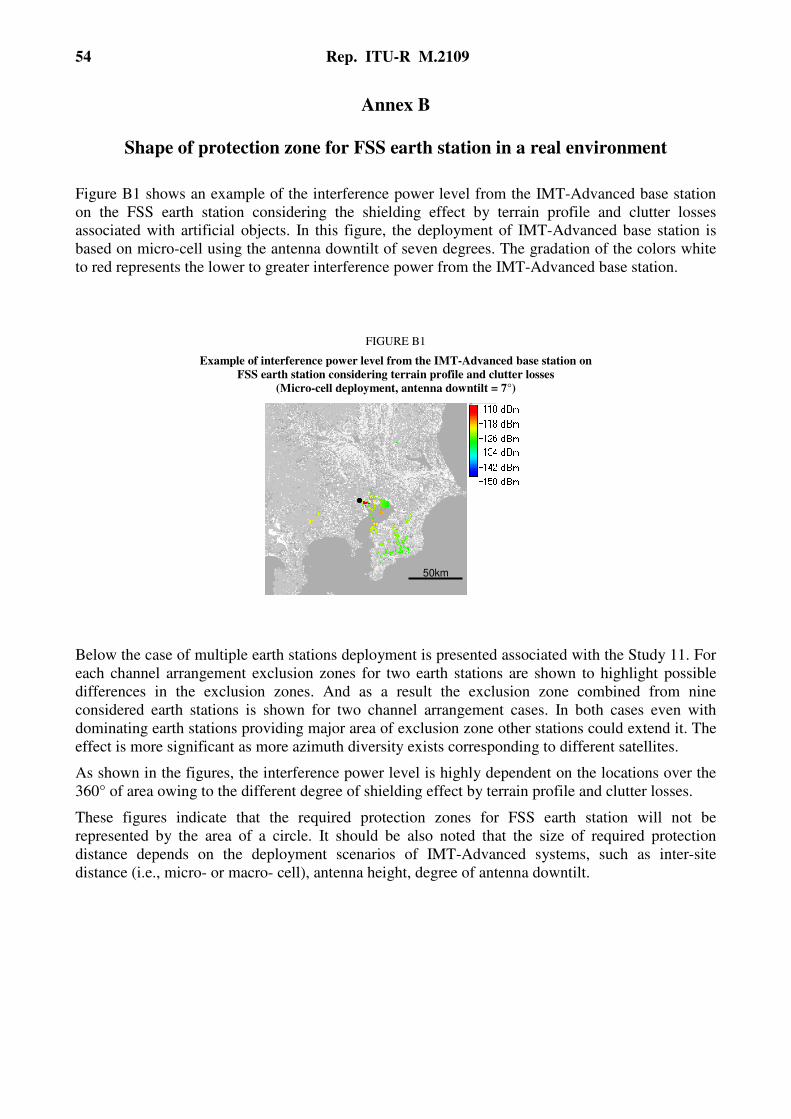
54 Rep. ITU-R M.2109
Annex B
Shape of protection zone for FSS earth station in a real environment
Figure B1 shows an example of the interference power level from the IMT-Advanced base station
on the FSS earth station considering the shielding effect by terrain profile and clutter losses
associated with artificial objects. In this figure, the deployment of IMT-Advanced base station is
based on micro-cell using the antenna downtilt of seven degrees. The gradation of the colors white
to red represents the lower to greater interference power from the IMT-Advanced base station.
FIGURE B1
Example of interference power level from the IMT-Advanced base station on
FSS earth station considering terrain profile and clutter losses
(Micro-cell deployment, antenna downtilt = 7°)
50km
Below the case of multiple earth stations deployment is presented associated with the Study 11. For
each channel arrangement exclusion zones for two earth stations are shown to highlight possible
differences in the exclusion zones. And as a result the exclusion zone combined from nine
considered earth stations is shown for two channel arrangement cases. In both cases even with
dominating earth stations providing major area of exclusion zone other stations could extend it. The
effect is more significant as more azimuth diversity exists corresponding to different satellites.
As shown in the figures, the interference power level is highly dependent on the locations over the
360° of area owing to the different degree of shielding effect by terrain profile and clutter losses.
These figures indicate that the required protection zones for FSS earth station will not be
represented by the area of a circle. It should be also noted that the size of required protection
distance depends on the deployment scenarios of IMT-Advanced systems, such as inter-site
distance (i.e., micro- or macro- cell), antenna height, degree of antenna downtilt.
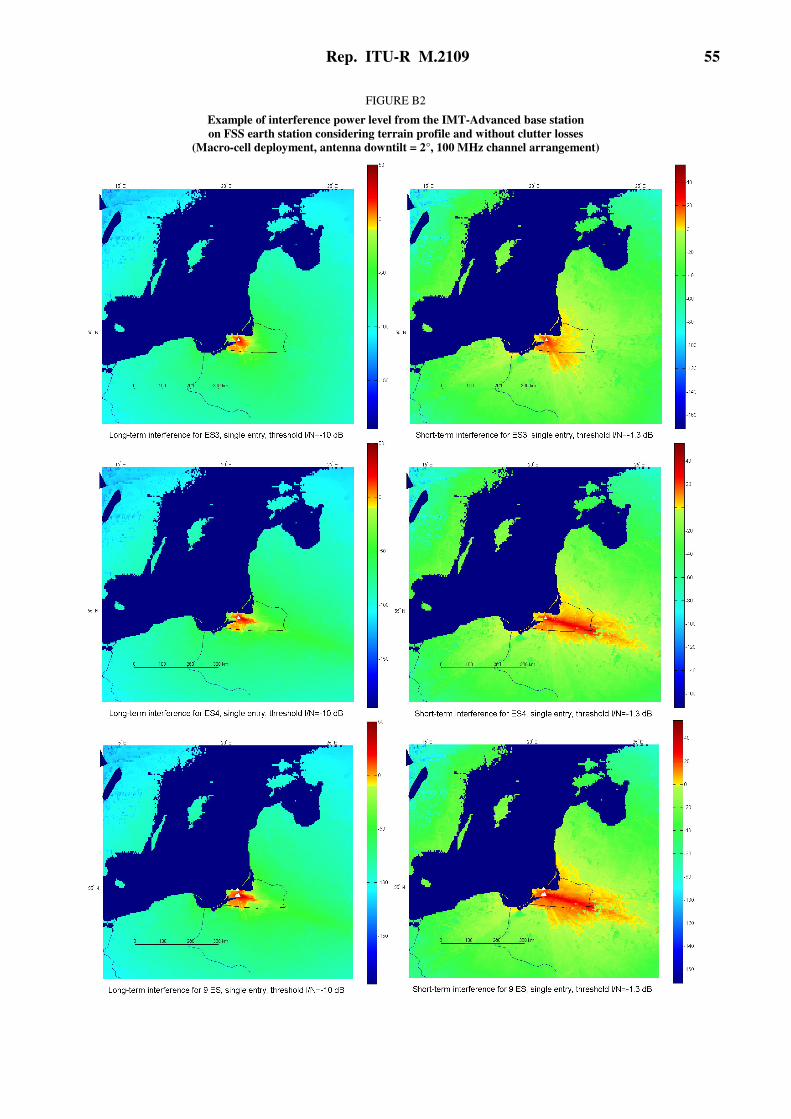
Rep. ITU-R M.2109 55
FIGURE B2
Example of interference power level from the IMT-Advanced base station
on FSS earth station considering terrain profile and without clutter losses
(Macro-cell deployment, antenna downtilt = 2°, 100 MHz channel arrangement)
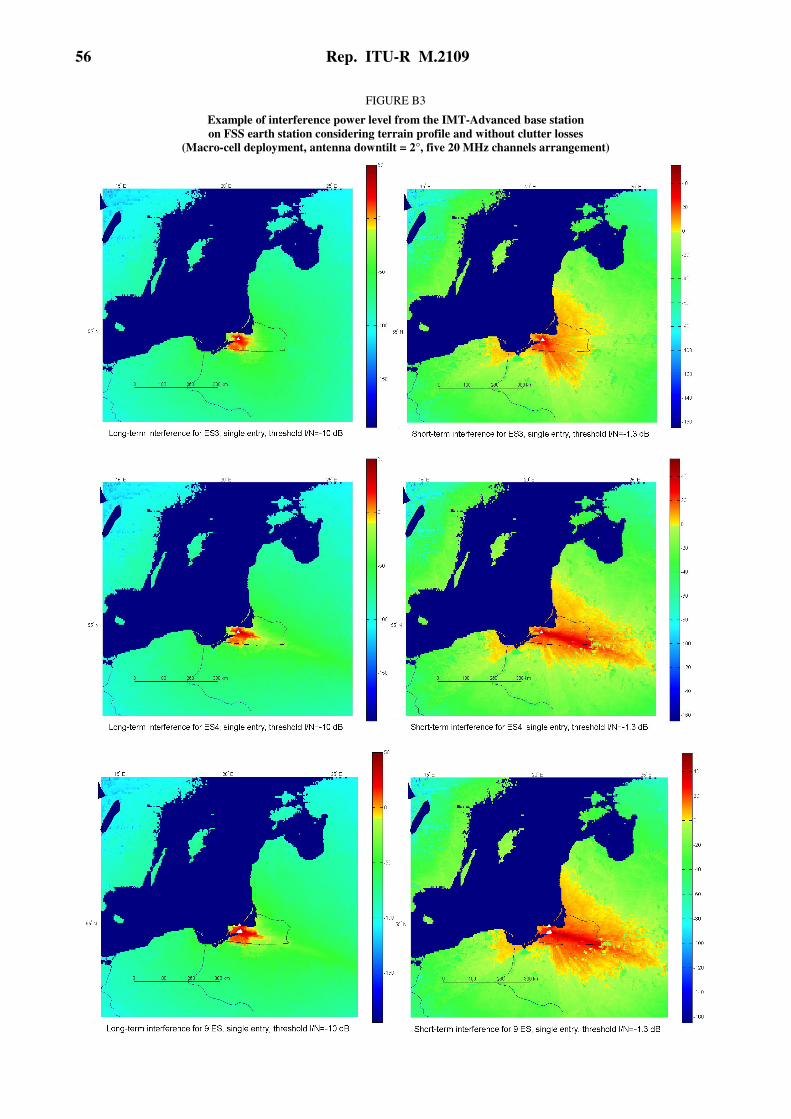
56 Rep. ITU-R M.2109
FIGURE B3
Example of interference power level from the IMT-Advanced base station
on FSS earth station considering terrain profile and without clutter losses
(Macro-cell deployment, antenna downtilt = 2°, five 20 MHz channels arrangement)

Rep. ITU-R M.2109 57
Annex C
Examples of coordination contours
The figures below provide examples of coordination contours taken from the ITU Master Register
for some earth stations around the world. These contours have been derived using the ITU-R
Appendix 7 methodology and criteria. The example earth stations are:
EARTH STATION INFORMATION SATELLITE INFORMATION
NAME LONGITUDE LATITUDE SATELLITE
NAME
LONGITUDE
(NOMINAL)
1 SI RACHA 2 100 E 56 11 13 N 06 02 INTELSAT5
INDOC1
63
2 AGARTALA 91 E 16 00 23 N 48 00 INSAT-1B 74
It should be noted that RR Appendix 7 states (see § 1.1 of RR Appendix 7) that “the coordination
area is not an exclusion zone within which the sharing of frequencies between the earth station and
terrestrial stations or other earth stations is prohibited, but a means for determining the area within
which more detailed calculations need to be performed. In most cases a more detailed analysis will
show that sharing within the coordination area is possible since the procedure for the determination
of the coordination area is based on unfavourable assumptions with regard to the interference
potential”.
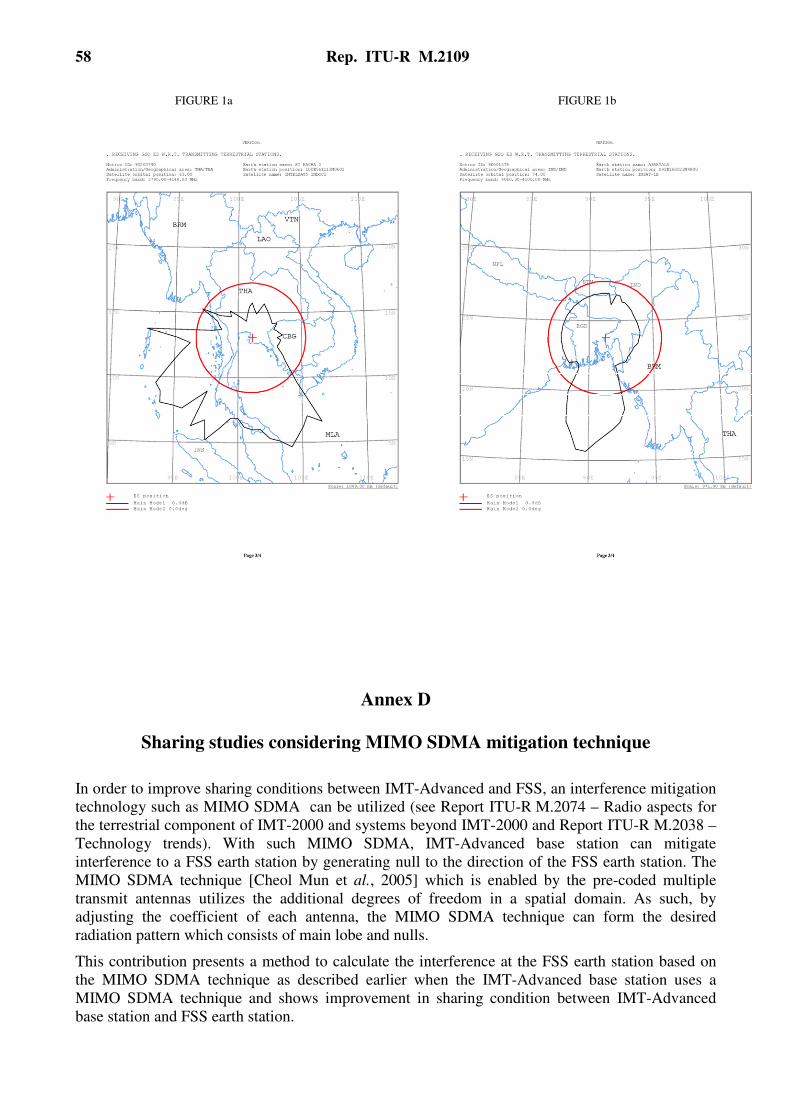
58 Rep. ITU-R M.2109
FIGURE 1a FIGURE 1b
Annex D
Sharing studies considering MIMO SDMA mitigation technique
In order to improve sharing conditions between IMT-Advanced and FSS, an interference mitigation
technology such as MIMO SDMA can be utilized (see Report ITU-R M.2074 – Radio aspects for
the terrestrial component of IMT-2000 and systems beyond IMT-2000 and Report ITU-R M.2038 –
Technology trends). With such MIMO SDMA, IMT-Advanced base station can mitigate
interference to a FSS earth station by generating null to the direction of the FSS earth station. The
MIMO SDMA technique [Cheol Mun et al., 2005] which is enabled by the pre-coded multiple
transmit antennas utilizes the additional degrees of freedom in a spatial domain. As such, by
adjusting the coefficient of each antenna, the MIMO SDMA technique can form the desired
radiation pattern which consists of main lobe and nulls.
This contribution presents a method to calculate the interference at the FSS earth station based on
the MIMO SDMA technique as described earlier when the IMT-Advanced base station uses a
MIMO SDMA technique and shows improvement in sharing condition between IMT-Advanced
base station and FSS earth station.

Rep. ITU-R M.2109 59
With the assumptions of co-channel frequency sharing condition and free space channel
environment, the interference power from an IMT-Advanced base station to a FSS earth station can
be reduced smaller than the maximum permissible interference level while the distance between
IMT-Advanced base station and FSS earth station is more than 35 m. In case of an IMT-Advanced
base station and 3 FSS receiving earth stations, the minimum separation distance increases up to
3.5 km under the same assumptions. Moreover, up to 22° of estimation error in the direction of
earth station (DOE), the minimum separation distance is reduced further by a MIMO SDMA and at
the DOE estimation error of 8°, the minimum separation distance can be reduced by at least 50%
compared to the separation distance without any interference mitigation scheme of 44 km.
This sharing study results indicate that the high possibility of the sharing between the
IMT-Advanced and multiple FSS systems.
System modelling and interference mitigation techniques
The basic concept of the mitigation scheme is to form nulls in the spatial domain to the direction of
the victim FSS earth station. For convenience, ‘DOE’ denotes the direction angles of the victim FSS
earth station in this contribution.
To enable the MIMO SDMA technology, the IMT-Advance base station has to obtain DOE
information and perform null steering. DOE information can be obtained by adopting a popular
spatial spectrum estimation direction finding method or from the database including information
about the direction from the interfering IMT-Advanced base station to the victim FSS earth station.
It is assumed that the IMT-Advanced base station is already aware of DOE information for the FSS
earth station.
Fig. D1 shows the interference scenario of IMT-Advanced base station with proposed interference
mitigation technique, where IMT-Advanced base station constructs nulls at DOE θ1, θ2, and θ3.
Fig. D2 illustrates the IMT-Advanced base station null-steering beamformer structures for
suppressing the interference toward FSS earth stations.
FIGURE D1
Interference scenario of IMT-Advanced base station with interference mitigation technique

60 Rep. ITU-R M.2109
FIGURE D2
IMT-Advanced base station incorporating the interference mitigation technique
based on null- steering for MIMO downlinks with uniform linear array
A linear array of TN isotropic antenna elements with uniform spacing is considered. The data
signals kx , TNk ,,1 L= from the beam selector are direct multiplied by a set of weights
{ }TNU www ,,, 21 L= to form a null at known DOE. ( ) ( ) ( )[ ]m
N
mm
m Twww ,,, 21 L=w is the m-th weight
vector in row vector and is given by the following set of equations:
( )
( ) 1,,2,1;0
1
−==θ
=θ
Tim
dm
Ni Law
aw
where a(θ) is the array propagation vector at an angle θ with respect to the array broadside and is
defined by:
( )( )
Td
Njd
j T
=θ
θλ
−πθλ
π sin12sin2
ee1 La
We can solve for the weight vector so that:
= −
0
0
1
1
MAWm
where:
( ) ( ) ( ) ( )[ ]121 −θθθθ=TNd aaaaA L
Let us consider scenario where the spatial location of the desired user is at 0o with respect to the
array broadside. There are multiple FSS earth stations at -50o, -20
o, and 40
o. IMT-Advanced base
station is equipped with four antennas with half wavelength spacing between the antennas. Fig. D3
shows four mutually orthogonal overlapped beams generated by null-steering vectors
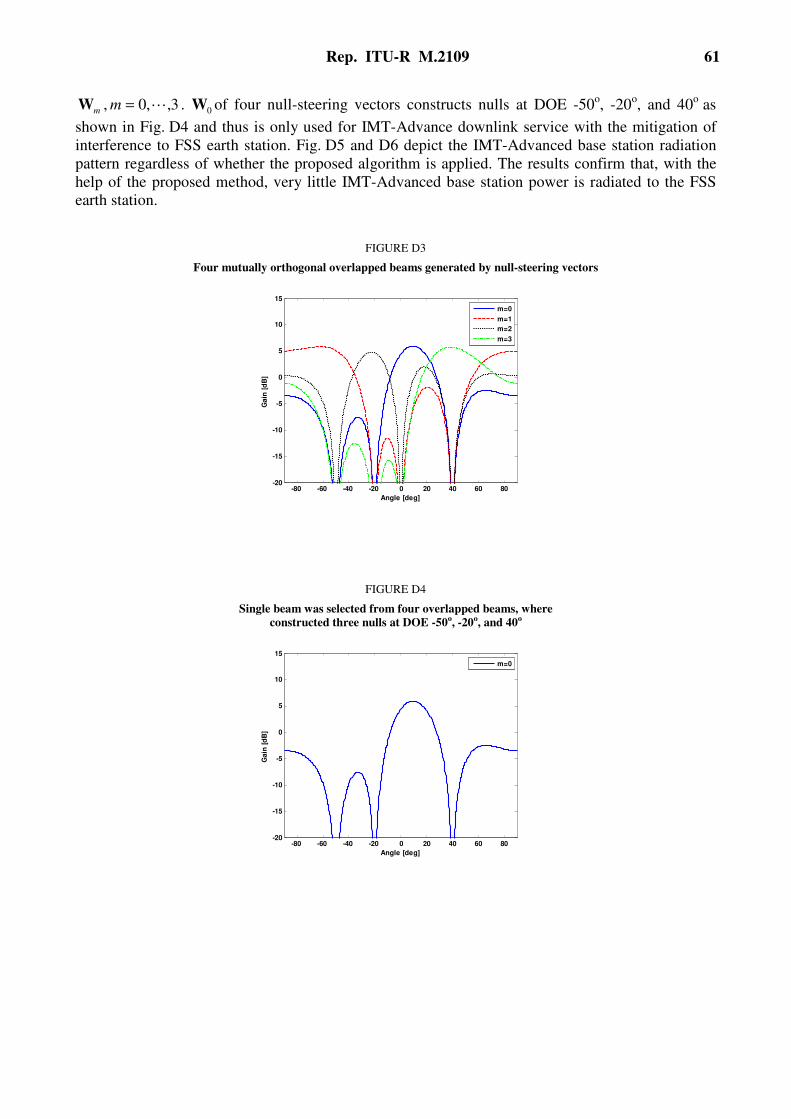
Rep. ITU-R M.2109 61
mW , 3,,0 L=m . 0W of four null-steering vectors constructs nulls at DOE -50o, -20
o, and 40
o as
shown in Fig. D4 and thus is only used for IMT-Advance downlink service with the mitigation of
interference to FSS earth station. Fig. D5 and D6 depict the IMT-Advanced base station radiation
pattern regardless of whether the proposed algorithm is applied. The results confirm that, with the
help of the proposed method, very little IMT-Advanced base station power is radiated to the FSS
earth station.
FIGURE D3
Four mutually orthogonal overlapped beams generated by null-steering vectors
-80 -60 -40 -20 0 20 40 60 80-20
-15
-10
-5
0
5
10
15
Angle [deg]
Gain
[d
B]
m=0
m=1
m=2
m=3
FIGURE D4
Single beam was selected from four overlapped beams, where
constructed three nulls at DOE -50o, -20o, and 40o
-80 -60 -40 -20 0 20 40 60 80-20
-15
-10
-5
0
5
10
15
Angle [deg]
Gain
[d
B]
m=0
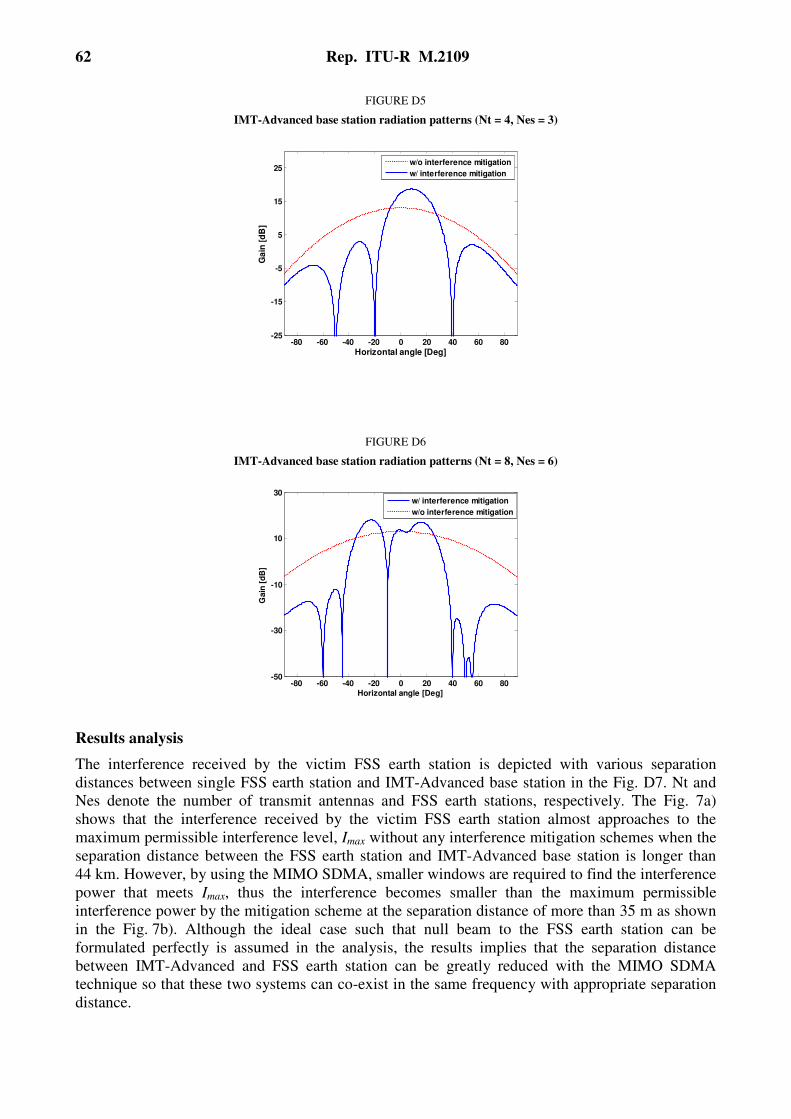
62 Rep. ITU-R M.2109
FIGURE D5
IMT-Advanced base station radiation patterns (Nt = 4, Nes = 3)
-80 -60 -40 -20 0 20 40 60 80-25
-15
-5
5
15
25
Horizontal angle [Deg]
Ga
in [
dB
]
w/o interference mitigation
w/ interference mitigation
FIGURE D6
IMT-Advanced base station radiation patterns (Nt = 8, Nes = 6)
-80 -60 -40 -20 0 20 40 60 80-50
-30
-10
10
30
Horizontal angle [Deg]
Gain
[d
B]
w/ interference mitigation
w/o interference mitigation
Results analysis
The interference received by the victim FSS earth station is depicted with various separation
distances between single FSS earth station and IMT-Advanced base station in the Fig. D7. Nt and
Nes denote the number of transmit antennas and FSS earth stations, respectively. The Fig. 7a)
shows that the interference received by the victim FSS earth station almost approaches to the
maximum permissible interference level, Imax without any interference mitigation schemes when the
separation distance between the FSS earth station and IMT-Advanced base station is longer than
44 km. However, by using the MIMO SDMA, smaller windows are required to find the interference
power that meets Imax, thus the interference becomes smaller than the maximum permissible
interference power by the mitigation scheme at the separation distance of more than 35 m as shown
in the Fig. 7b). Although the ideal case such that null beam to the FSS earth station can be
formulated perfectly is assumed in the analysis, the results implies that the separation distance
between IMT-Advanced and FSS earth station can be greatly reduced with the MIMO SDMA
technique so that these two systems can co-exist in the same frequency with appropriate separation
distance.
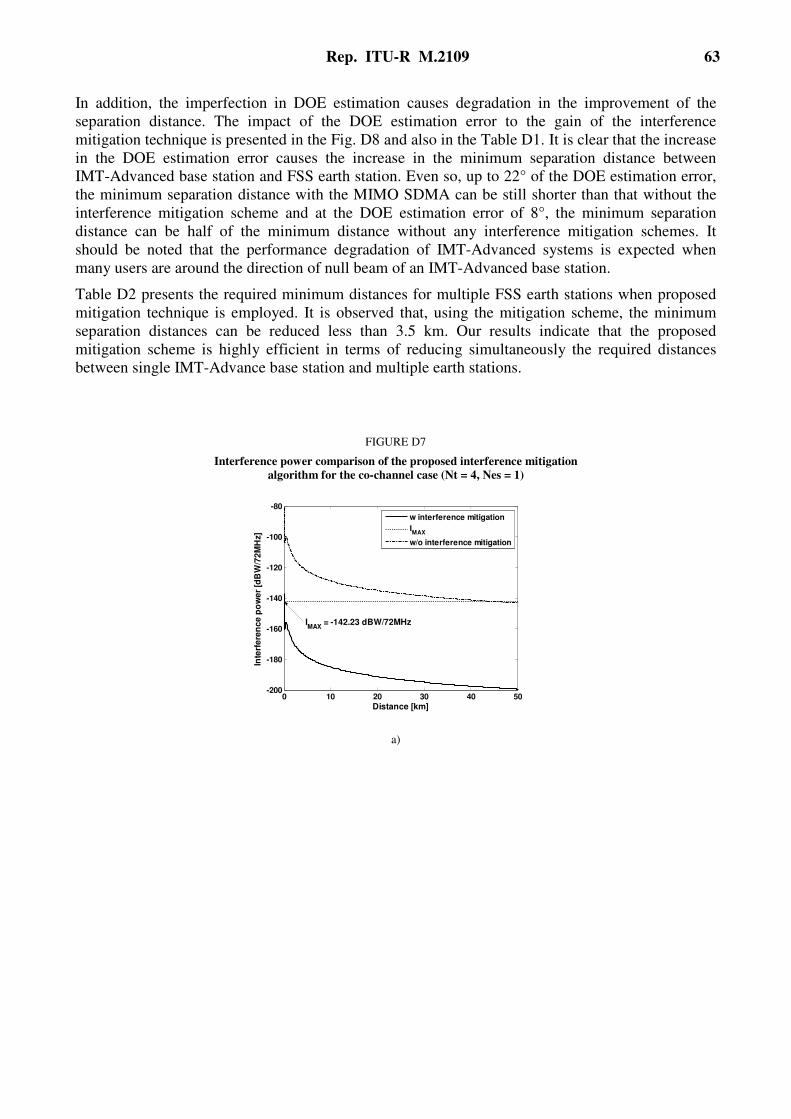
Rep. ITU-R M.2109 63
In addition, the imperfection in DOE estimation causes degradation in the improvement of the
separation distance. The impact of the DOE estimation error to the gain of the interference
mitigation technique is presented in the Fig. D8 and also in the Table D1. It is clear that the increase
in the DOE estimation error causes the increase in the minimum separation distance between
IMT-Advanced base station and FSS earth station. Even so, up to 22° of the DOE estimation error,
the minimum separation distance with the MIMO SDMA can be still shorter than that without the
interference mitigation scheme and at the DOE estimation error of 8°, the minimum separation
distance can be half of the minimum distance without any interference mitigation schemes. It
should be noted that the performance degradation of IMT-Advanced systems is expected when
many users are around the direction of null beam of an IMT-Advanced base station.
Table D2 presents the required minimum distances for multiple FSS earth stations when proposed
mitigation technique is employed. It is observed that, using the mitigation scheme, the minimum
separation distances can be reduced less than 3.5 km. Our results indicate that the proposed
mitigation scheme is highly efficient in terms of reducing simultaneously the required distances
between single IMT-Advance base station and multiple earth stations.
FIGURE D7
Interference power comparison of the proposed interference mitigation
algorithm for the co-channel case (Nt = 4, Nes = 1)
0 10 20 30 40 50-200
-180
-160
-140
-120
-100
-80
Distance [km]
Inte
rfe
ren
ce
po
we
r [d
BW
/72
MH
z]
IMAX
= -142.23 dBW/72MHz
w interference mitigation
IMAX
w/o interference mitigation
a)

64 Rep. ITU-R M.2109
0 0.01 0.02 0.03 0.04 0.05 0.06 0.07-148
-146
-144
-142
-140
-138
-136
Distance [km]
Inte
rfe
ren
ce
po
we
r[d
BW
/72
MH
z]
IMAX
= -142.23 dBW/72MHz
with interference mitigation
IMAX
b)
FIGURE D8
Minimum separation difstance versus direction of earth
station estimation error (Nt = 4, Nes = 1)
0 5 10 15 20 250
5
10
15
20
25
30
35
40
45
50
Drection of earth station estimation error [deg]
Min
imu
m s
ep
ara
tio
n d
ista
nc
e [
km
]
TABLE D1
Minimum required separation distance for different (Nt = 4, Nes = 1)
Simulation environments
Minimum separation
distance
(km)
With interference mitigation
techniques
DOE estimation error: 0° 0.035
DOE estimation error: 4° 12
DOE estimation error: 8° 22
Without interference mitigation techniques 50
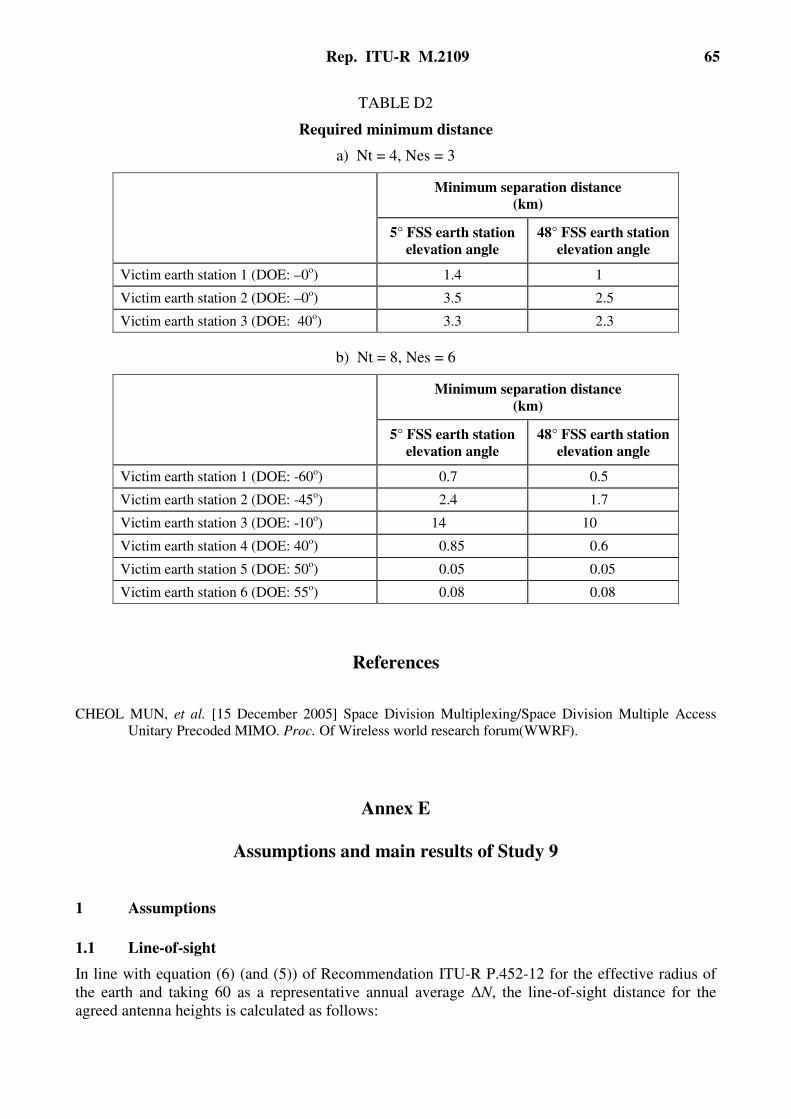
Rep. ITU-R M.2109 65
TABLE D2
Required minimum distance
a) Nt = 4, Nes = 3
Minimum separation distance
(km)
5° FSS earth station
elevation angle
48° FSS earth station
elevation angle
Victim earth station 1 (DOE: –0o) 1.4 1
Victim earth station 2 (DOE: –0o) 3.5 2.5
Victim earth station 3 (DOE: 40o) 3.3 2.3
b) Nt = 8, Nes = 6
Minimum separation distance
(km)
5° FSS earth station
elevation angle
48° FSS earth station
elevation angle
Victim earth station 1 (DOE: -60o) 0.7 0.5
Victim earth station 2 (DOE: -45o) 2.4 1.7
Victim earth station 3 (DOE: -10o) 14 10
Victim earth station 4 (DOE: 40o) 0.85 0.6
Victim earth station 5 (DOE: 50o) 0.05 0.05
Victim earth station 6 (DOE: 55o) 0.08 0.08
References
CHEOL MUN, et al. [15 December 2005] Space Division Multiplexing/Space Division Multiple Access
Unitary Precoded MIMO. Proc. Of Wireless world research forum(WWRF).
Annex E
Assumptions and main results of Study 9
1 Assumptions
1.1 Line-of-sight
In line with equation (6) (and (5)) of Recommendation ITU-R P.452-12 for the effective radius of
the earth and taking 60 as a representative annual average ∆N, the line-of-sight distance for the
agreed antenna heights is calculated as follows:

66 Rep. ITU-R M.2109
TABLE E1
Line-of-sight distance
(km)
FSS antenna
height (m)
Base station macro
Base station
micro User terminal
IMT-Advanced
station height (m) 30 5 1.5
Urban 30
Rural 3 50 35 30
33 18 13
It can be seen that the depending on the types of IMT-Advanced and FSS stations, the line-of-sight
distance will range from 50 to 13 km. Using other values of ∆N will change the line-of-sight
distance, but not significantly.
1.2 Far-field
Close to the antenna, the radiation pattern of an antenna will be characterized by the “near-field”
pattern. As the distances to the antenna increases, the “far-field” pattern will form. Using the
customary assumption for far-field conditions (a point source giving a phase variation of 22.5º over
the aperture of the antenna, i.e., d = 2D2/λ, where D is the antenna diameter), the minimum distance
to be in the far-field is shown in Fig. E1 (f = 3.8 GHz).
FIGURE E1
Required distance from antenna to have far-field conditions
(2*(D^2)/lambda)
0
0.5
1
1.5
2
2.5
3
3.5
4
0 2 4 6 8 10 12 14 16 18
Antenna diameter (m)
Far
field
dis
tan
ce (
km
)
All calculations in this text are based upon the assumption of far-field antenna patterns of the FSS
receive antenna. It can be seen that the required distance to be in the far-field ranges from some few
hundred metres for small antennas to some few kilometres for large antennas. If the distance
between the IMT-Advanced station and the FSS receive antenna is smaller than this, the assumed
far-field antenna pattern may not give correct calculated interference levels.
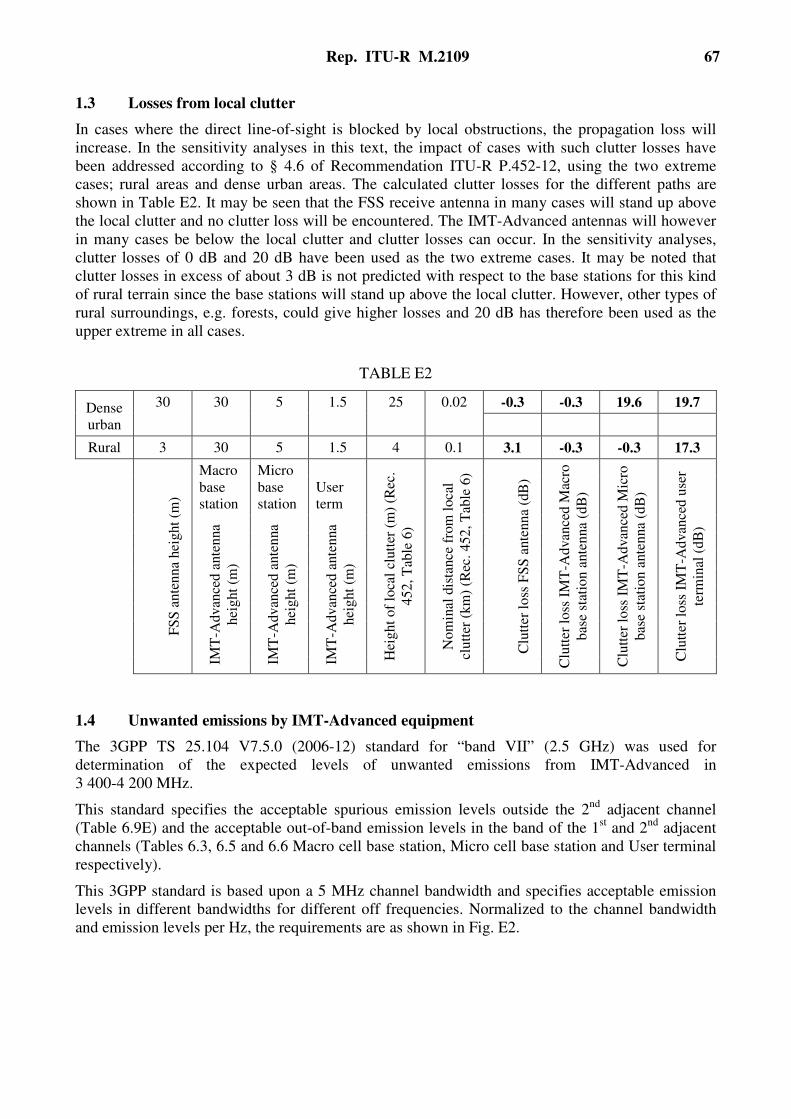
Rep. ITU-R M.2109 67
1.3 Losses from local clutter
In cases where the direct line-of-sight is blocked by local obstructions, the propagation loss will
increase. In the sensitivity analyses in this text, the impact of cases with such clutter losses have
been addressed according to § 4.6 of Recommendation ITU-R P.452-12, using the two extreme
cases; rural areas and dense urban areas. The calculated clutter losses for the different paths are
shown in Table E2. It may be seen that the FSS receive antenna in many cases will stand up above
the local clutter and no clutter loss will be encountered. The IMT-Advanced antennas will however
in many cases be below the local clutter and clutter losses can occur. In the sensitivity analyses,
clutter losses of 0 dB and 20 dB have been used as the two extreme cases. It may be noted that
clutter losses in excess of about 3 dB is not predicted with respect to the base stations for this kind
of rural terrain since the base stations will stand up above the local clutter. However, other types of
rural surroundings, e.g. forests, could give higher losses and 20 dB has therefore been used as the
upper extreme in all cases.
TABLE E2
Dense
urban
30 30 5 1.5 25 0.02 -0.3 -0.3 19.6 19.7
Rural 3 30 5 1.5 4 0.1 3.1 -0.3 -0.3 17.3
FS
S a
nte
nn
a hei
ght
(m)
Macro
base station
Micro
base station
User
term
Hei
gh
t o
f lo
cal
clutt
er (
m)
(Rec
.
45
2,
Tab
le 6
)
No
min
al d
ista
nce
fro
m l
oca
l
clu
tter
(k
m)
(Rec
. 4
52
, T
able
6)
Clu
tter
lo
ss F
SS
ante
nn
a (d
B)
Clu
tter
lo
ss I
MT
-Ad
van
ced M
acro
bas
e st
atio
n a
nte
nna
(dB
)
Clu
tter
lo
ss I
MT
-Ad
van
ced M
icro
bas
e st
atio
n a
nte
nna
(dB
)
Clu
tter
lo
ss I
MT
-Ad
van
ced u
ser
term
inal
(d
B)
IMT
-Adv
ance
d a
nte
nna
hei
ght
(m)
IMT
-Adv
ance
d a
nte
nna
hei
ght
(m)
IMT
-Adv
ance
d a
nte
nna
hei
ght
(m)
1.4 Unwanted emissions by IMT-Advanced equipment
The 3GPP TS 25.104 V7.5.0 (2006-12) standard for “band VII” (2.5 GHz) was used for
determination of the expected levels of unwanted emissions from IMT-Advanced in
3 400-4 200 MHz.
This standard specifies the acceptable spurious emission levels outside the 2nd
adjacent channel
(Table 6.9E) and the acceptable out-of-band emission levels in the band of the 1st and 2
nd adjacent
channels (Tables 6.3, 6.5 and 6.6 Macro cell base station, Micro cell base station and User terminal
respectively).
This 3GPP standard is based upon a 5 MHz channel bandwidth and specifies acceptable emission
levels in different bandwidths for different off frequencies. Normalized to the channel bandwidth
and emission levels per Hz, the requirements are as shown in Fig. E2.

68 Rep. ITU-R M.2109
FIGURE E2
Out-of-band and spurious emission masks
-95.0
-90.0
-85.0
-80.0
-75.0
-70.0
-65.0
-60.0
0 1 2 3 4 5 6 7 8 9 10 11 12 13 14 15
Frequency off channel centre frequency (normalized to
channel bandwidth)
EIR
P d
en
sit
y (
dB
m/H
z)
Macro cell base station
Micro cell base station
User terminal
RR Appendix 3
1st adjacent channel
2nd adjacent channel
It may be noted that in the spurious domain, the expected emission levels are the same for all types
of stations.
2 Results
The total received RF power from one single IMT-Advanced station and the noise increase (∆T/T)
due to unwanted emissions 50, 100 and 250 MHz off the edge of the last channels from one single
IMT-Advanced station were calculated as a function of distance between the FSS receiver and the
IMT-Advanced transmitter. The results are presented in the Figs. E3 and E4.

Rep. ITU-R M.2109 69
FIGURE E3
Overdrive of LNB
Earth station received power level
-80.0
-70.0
-60.0
-50.0
-40.0
-30.0
-20.0
0.01 0.1 1 10 100
Distance to BWA terminal (km)
Re
ce
ive
d p
ow
er
(dB
m)
One signle macro cell base station
One single micro cell base station
One single user terminal
-50 dBm (1 dB compression point)
-60 dBm (non-linear operation)

70 Rep. ITU-R M.2109
FIGURE E4
Unwanted emissions
Noise increase due to unwanted emissions from a single BWA station
50 MHz outside edge of channel bandwidth
(3GPP TS 25.104 V7.5.0 (2006-12) applied for 100 MHz channel
bandwidth at 3.8 GHz)
0.0
5.0
10.0
15.0
20.0
25.0
30.0
35.0
40.0
45.0
50.0
0 2 4 6 8 10 12 14 16 18 20 22 24 26 28 30
Distance (km)
dT
/T (
%)
Macro cell base station
Micro cell base station
User terminal
Noise increase due to unwanted emissions from a single BWA station
100 MHz outside edge of channel bandwidth
(3GPP TS 25.104 V7.5.0 (2006-12) applied for 100 MHz channel
bandwidth at 3.8 GHz)
0.0
5.0
10.0
15.0
20.0
25.0
30.0
35.0
40.0
45.0
50.0
0 2 4 6 8 10 12 14 16 18 20 22 24 26 28 30
Distance (km)
dT
/T (
%)
Macro cell base station
Micro cell base station
User terminal
Noise increase due to unwanted emissions from a single BWA station
250 MHz outside edge of channel bandwidth
(3GPP TS 25.104 V7.5.0 (2006-12) applied for 100 MHz channel
bandwidth at 3.8 GHz)
0.0
5.0
10.0
15.0
20.0
25.0
30.0
35.0
40.0
45.0
50.0
0 2 4 6 8 10 12 14 16 18 20 22 24 26 28 30
Distance (km)
dT
/T (
%) Macro cell base station
Micro cell base station
User terminal
RR Appendix 3

Rep. ITU-R M.2109 71
Annex F
Methodology “Interference Area Ratio” to be utilized with mitigation technique
Figure F1 shows the conceptual figure which indicates that the interference power level from an
IMT-Advanced transmitter is non-uniformly decreased over the 360-degree area due to the
shielding effect by terrain profile and clutter losses which may be observed in a real environment.
Due to the feature of non-uniformly distributed interference power level over the 360-degree area,
the required minimum separation distance can be reduced by using the additional mitigation
technique based on directional-beam antenna.
FIGURE F1
Shielding effect by terrain profile and clutter losses
Location of
IMT-Advanced transmitter
Interference power level is non-uniformly decreased due to shielding effect
Area where interference power level from IMT-Advanced
transmitter does not exceed the protection criteria for FSS
earth station receiver (i.e., sharing is possible)
Area where interference power level from IMT-Advanced
transmitter exceeds the protection criteria for FSS earth station
receiver (i.e., sharing is not possible)
Area where interference power level from IMT-Advanced
transmitter does not exceed the protection criteria for FSS
earth station receiver (i.e., sharing is possible)
Area where interference power level from IMT-Advanced
transmitter exceeds the protection criteria for FSS earth station
receiver (i.e., sharing is not possible)
In order to quantitatively evaluate this shileding effect, some studies use the methodology called
“interference area ratio”. Figure F2 shows a conceptual figure to explain the definition of
“interference area ratio”, where an IMT-Advanced transmitter is located at the center of the
calculation area. When using the interference area ratio, at each grid of the calculation area, we
calculate the interference power level caused by the IMT-Advanced transmitter and decide whether
its interference power level exceeds the protection criteria of the FSS earth station based on
Recommendation ITU-R SF.1006. If the interference power level exceeds the protection criteria,
this grid is judged as the interfered area. Consequently, the interference area ratio as a function of
distance, d, from the interferer, i.e., IMT-Advanced transmitter, is defined as the portion of the
interfered area between the distance of d and d + ∆d from the interferer divided by the ring-shaped
area between the distance of d and d + ∆d from the interferer. It should be noted that the analyses
using the interference area ratio are also applicable to the aggregated interference case from
multiple IMT-Advanced transmitters.

72 Rep. ITU-R M.2109
FIGURE F2
Definition of interference area ratio
Location of IMT-Advanced transmitter
Discrete point for calculation
Interfered area due to IMT-Advanced transmitter
Calculation area between d and d + ∆d
Interfered area between d and d + ∆d
Interfered area is non-uniformly distributed due to
shielding effect by terrain profile and clutter losses
Interference area ratio = Area of
Area of
Distance d ∆d
Location of IMT-Advanced transmitterLocation of IMT-Advanced transmitter
Discrete point for calculation
Interfered area due to IMT-Advanced transmitter
Calculation area between d and d + ∆d
Interfered area between d and d + ∆d
Discrete point for calculation
Interfered area due to IMT-Advanced transmitter
Calculation area between d and d + ∆d
Interfered area between d and d + ∆d
Interfered area is non-uniformly distributed due to
shielding effect by terrain profile and clutter losses
Interference area ratio = Area of
Area of Interference area ratio =
Area of
Area of
Area of
Area of
Distance d ∆d
When we derive the required separation distance for the interference area ratio of x%, we exclude
the x% of area that has the larger separation distance over d + ∆d. Then, the required separation
distance becomes d + ∆d. It should be noted that the additional mitigation technique based on
directional-beam antenna, such as the sectorized-antenna and adaptive-beamforming antenna at the
IMT-Advanced transmitters, is adopted in order to protect the FSS earth stations located in the x%
of the area. Figure F3 shows an example employing sectorized-antenna as a mitigation technique. In
this example, the transmission signal from the sector No. 6 of the IMT-Advanced transmitter No. 1
facing to the front direction of an FSS earth station antenna is stopped using a sectorized-antenna,
while other base station No. 2, which is not facing to the front direction of an FSS earth station
antenna, provides the services. It should be noted that the sectorized-antenna has been already
implemented in the current cellular mobile communication technologies. Furthermore, the adaptive-
beamforming has been also implemented in some cellular mobile communication systems.
Therefore, these mitigation techniques can be applied to the IMT-Advanced systems.
FIGURE F3
Mitigation technique by utilizing sectorization
IMT-Advanced transmitter #1
IMT-Advanced transmitter #2
FSS earth station receiver
Sector #1
#2
#3
#4
#5
#6
IMT-Advanced transmitter #1
IMT-Advanced transmitter #2
FSS earth station receiver
Sector #1
#2
#3
#4
#5
#6
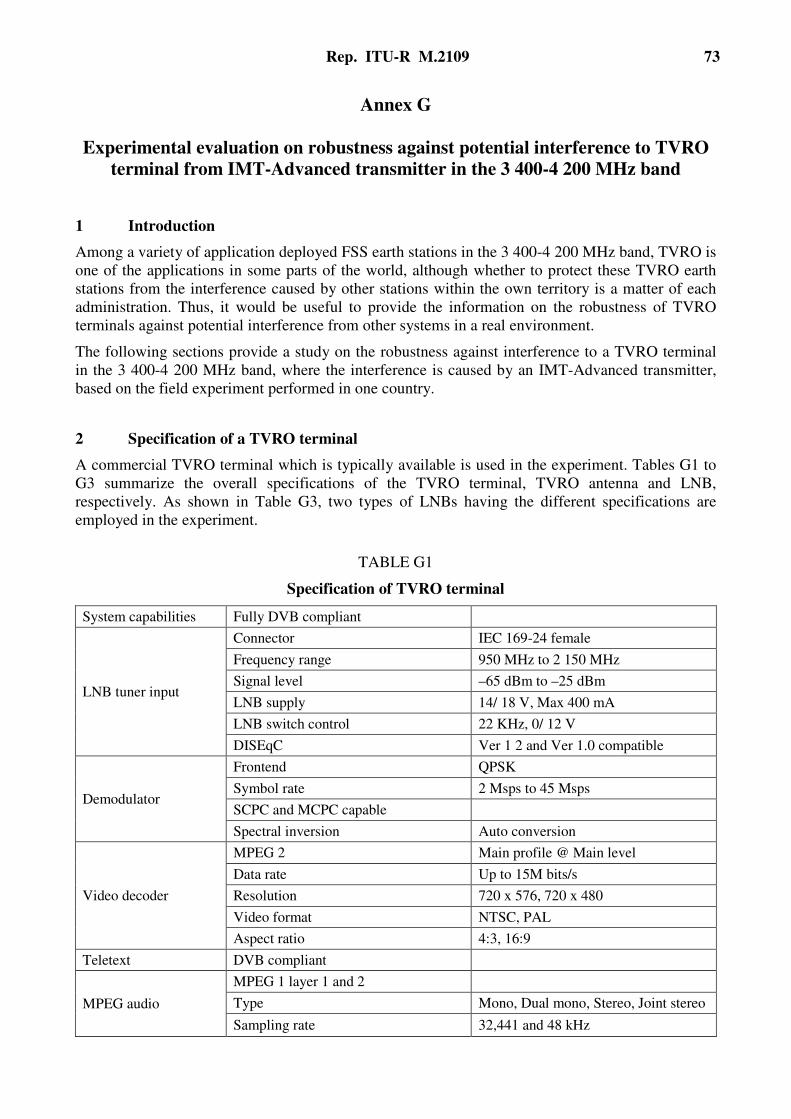
Rep. ITU-R M.2109 73
Annex G
Experimental evaluation on robustness against potential interference to TVRO
terminal from IMT-Advanced transmitter in the 3 400-4 200 MHz band
1 Introduction
Among a variety of application deployed FSS earth stations in the 3 400-4 200 MHz band, TVRO is
one of the applications in some parts of the world, although whether to protect these TVRO earth
stations from the interference caused by other stations within the own territory is a matter of each
administration. Thus, it would be useful to provide the information on the robustness of TVRO
terminals against potential interference from other systems in a real environment.
The following sections provide a study on the robustness against interference to a TVRO terminal
in the 3 400-4 200 MHz band, where the interference is caused by an IMT-Advanced transmitter,
based on the field experiment performed in one country.
2 Specification of a TVRO terminal
A commercial TVRO terminal which is typically available is used in the experiment. Tables G1 to
G3 summarize the overall specifications of the TVRO terminal, TVRO antenna and LNB,
respectively. As shown in Table G3, two types of LNBs having the different specifications are
employed in the experiment.
TABLE G1
Specification of TVRO terminal
System capabilities Fully DVB compliant
LNB tuner input
Connector IEC 169-24 female
Frequency range 950 MHz to 2 150 MHz
Signal level –65 dBm to –25 dBm
LNB supply 14/ 18 V, Max 400 mA
LNB switch control 22 KHz, 0/ 12 V
DISEqC Ver 1 2 and Ver 1.0 compatible
Demodulator
Frontend QPSK
Symbol rate 2 Msps to 45 Msps
SCPC and MCPC capable
Spectral inversion Auto conversion
Video decoder
MPEG 2 Main profile @ Main level
Data rate Up to 15M bits/s
Resolution 720 x 576, 720 x 480
Video format NTSC, PAL
Aspect ratio 4:3, 16:9
Teletext DVB compliant
MPEG audio
MPEG 1 layer 1 and 2
Type Mono, Dual mono, Stereo, Joint stereo
Sampling rate 32,441 and 48 kHz
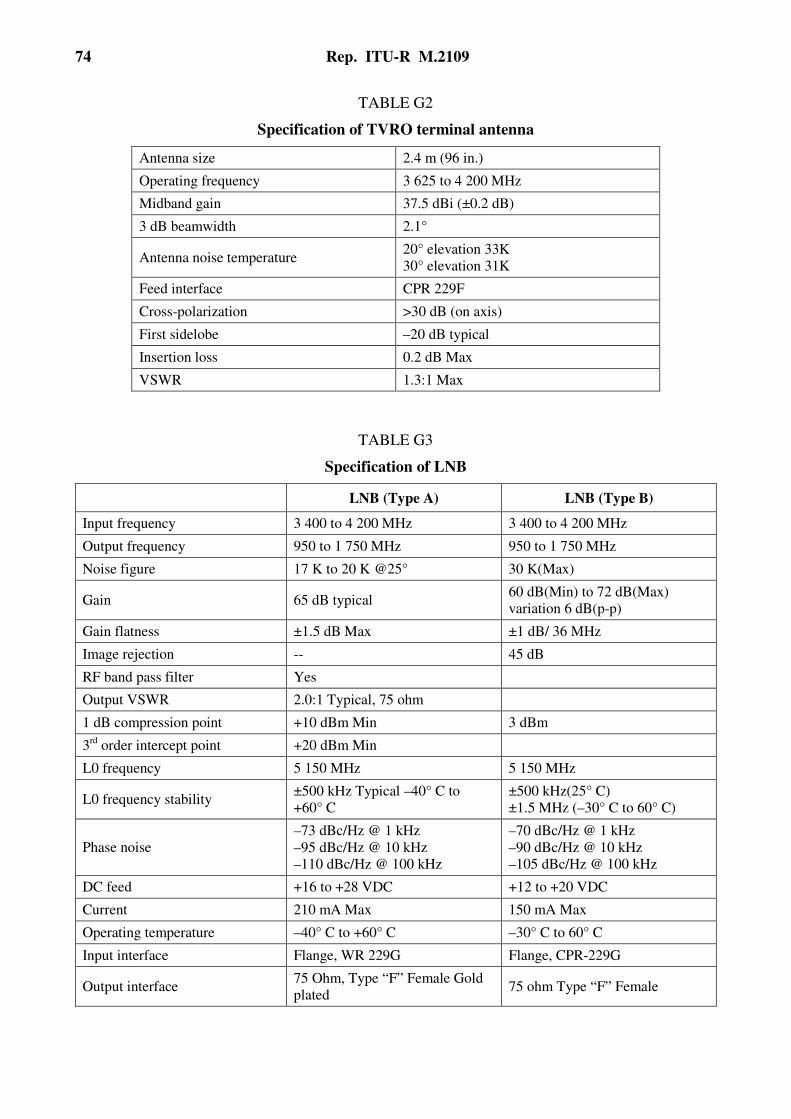
74 Rep. ITU-R M.2109
TABLE G2
Specification of TVRO terminal antenna
Antenna size 2.4 m (96 in.)
Operating frequency 3 625 to 4 200 MHz
Midband gain 37.5 dBi (±0.2 dB)
3 dB beamwidth 2.1°
Antenna noise temperature 20° elevation 33K
30° elevation 31K
Feed interface CPR 229F
Cross-polarization >30 dB (on axis)
First sidelobe –20 dB typical
Insertion loss 0.2 dB Max
VSWR 1.3:1 Max
TABLE G3
Specification of LNB
LNB (Type A) LNB (Type B)
Input frequency 3 400 to 4 200 MHz 3 400 to 4 200 MHz
Output frequency 950 to 1 750 MHz 950 to 1 750 MHz
Noise figure 17 K to 20 K @25° 30 K(Max)
Gain 65 dB typical 60 dB(Min) to 72 dB(Max)
variation 6 dB(p-p)
Gain flatness ±1.5 dB Max ±1 dB/ 36 MHz
Image rejection -- 45 dB
RF band pass filter Yes
Output VSWR 2.0:1 Typical, 75 ohm
1 dB compression point +10 dBm Min 3 dBm
3rd
order intercept point +20 dBm Min
L0 frequency 5 150 MHz 5 150 MHz
L0 frequency stability ±500 kHz Typical –40° C to
+60° C
±500 kHz(25° C)
±1.5 MHz (–30° C to 60° C)
Phase noise
–73 dBc/Hz @ 1 kHz
–95 dBc/Hz @ 10 kHz –110 dBc/Hz @ 100 kHz
–70 dBc/Hz @ 1 kHz
–90 dBc/Hz @ 10 kHz –105 dBc/Hz @ 100 kHz
DC feed +16 to +28 VDC +12 to +20 VDC
Current 210 mA Max 150 mA Max
Operating temperature –40° C to +60° C –30° C to 60° C
Input interface Flange, WR 229G Flange, CPR-229G
Output interface 75 Ohm, Type “F” Female Gold
plated 75 ohm Type “F” Female
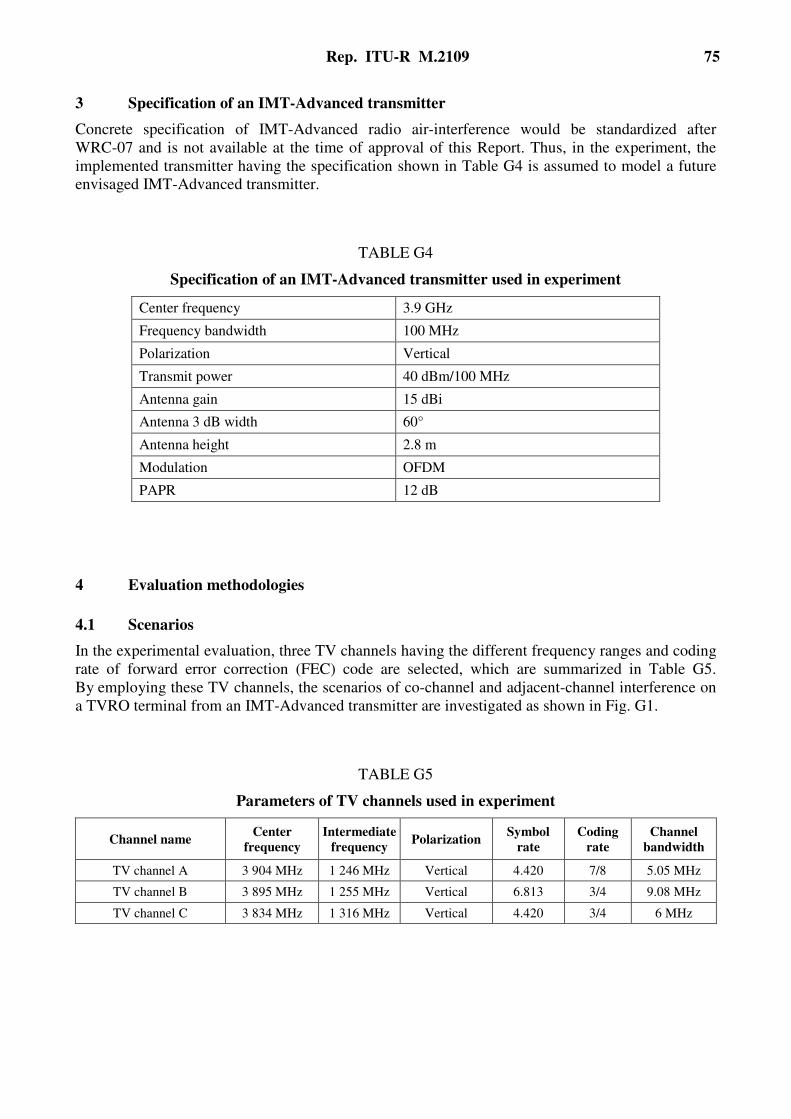
Rep. ITU-R M.2109 75
3 Specification of an IMT-Advanced transmitter
Concrete specification of IMT-Advanced radio air-interference would be standardized after
WRC-07 and is not available at the time of approval of this Report. Thus, in the experiment, the
implemented transmitter having the specification shown in Table G4 is assumed to model a future
envisaged IMT-Advanced transmitter.
TABLE G4
Specification of an IMT-Advanced transmitter used in experiment
Center frequency 3.9 GHz
Frequency bandwidth 100 MHz
Polarization Vertical
Transmit power 40 dBm/100 MHz
Antenna gain 15 dBi
Antenna 3 dB width 60°
Antenna height 2.8 m
Modulation OFDM
PAPR 12 dB
4 Evaluation methodologies
4.1 Scenarios
In the experimental evaluation, three TV channels having the different frequency ranges and coding
rate of forward error correction (FEC) code are selected, which are summarized in Table G5.
By employing these TV channels, the scenarios of co-channel and adjacent-channel interference on
a TVRO terminal from an IMT-Advanced transmitter are investigated as shown in Fig. G1.
TABLE G5
Parameters of TV channels used in experiment
Channel name Center
frequency
Intermediate
frequency Polarization
Symbol
rate
Coding
rate
Channel
bandwidth
TV channel A 3 904 MHz 1 246 MHz Vertical 4.420 7/8 5.05 MHz
TV channel B 3 895 MHz 1 255 MHz Vertical 6.813 3/4 9.08 MHz
TV channel C 3 834 MHz 1 316 MHz Vertical 4.420 3/4 6 MHz
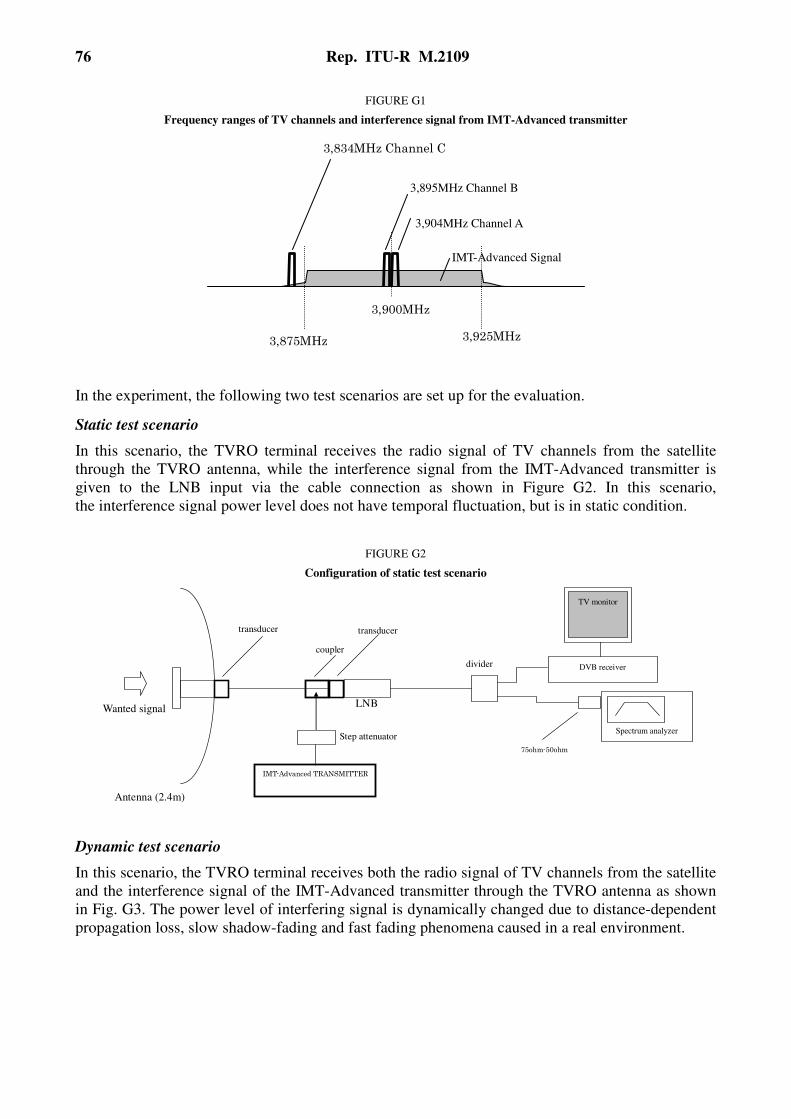
76 Rep. ITU-R M.2109
FIGURE G1
Frequency ranges of TV channels and interference signal from IMT-Advanced transmitter
3,900MHz
3,875MHz 3,925MHz
3,834MHz Channel C
3,904MHz Channel A
3,895MHz Channel B
IMT-Advanced Signal
In the experiment, the following two test scenarios are set up for the evaluation.
Static test scenario
In this scenario, the TVRO terminal receives the radio signal of TV channels from the satellite
through the TVRO antenna, while the interference signal from the IMT-Advanced transmitter is
given to the LNB input via the cable connection as shown in Figure G2. In this scenario,
the interference signal power level does not have temporal fluctuation, but is in static condition.
FIGURE G2
Configuration of static test scenario
DVB receiver
TV monitor
Spectrum analyzer
transducer transducer
75ohm-50ohm
IMT-Advanced TRANSMITTER
LNB
Antenna (2.4m)
Wanted signal
coupler
divider
Step attenuator
Dynamic test scenario
In this scenario, the TVRO terminal receives both the radio signal of TV channels from the satellite
and the interference signal of the IMT-Advanced transmitter through the TVRO antenna as shown
in Fig. G3. The power level of interfering signal is dynamically changed due to distance-dependent
propagation loss, slow shadow-fading and fast fading phenomena caused in a real environment.
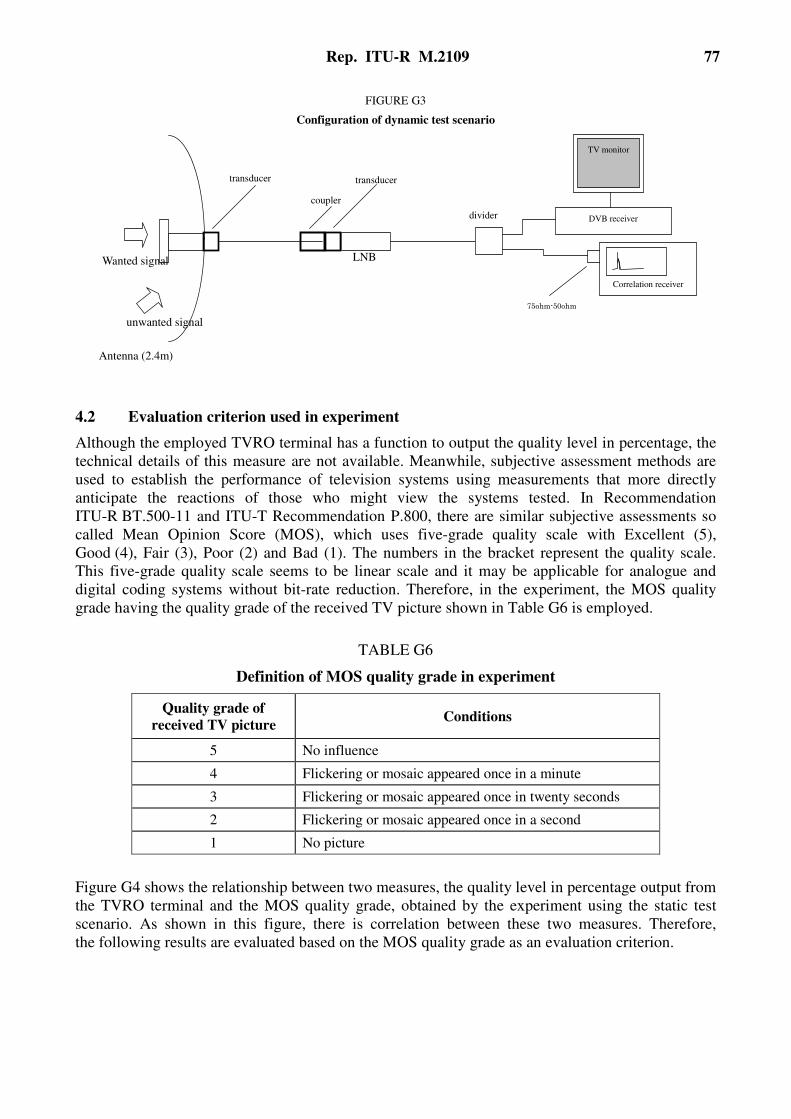
Rep. ITU-R M.2109 77
FIGURE G3
Configuration of dynamic test scenario
DVB receiver
TV monitor
transducer transducer
75ohm-50ohm
LNB
Antenna (2.4m)
Wanted signal
coupler
divider
Correlation receiver
unwanted signal
4.2 Evaluation criterion used in experiment
Although the employed TVRO terminal has a function to output the quality level in percentage, the
technical details of this measure are not available. Meanwhile, subjective assessment methods are
used to establish the performance of television systems using measurements that more directly
anticipate the reactions of those who might view the systems tested. In Recommendation
ITU-R BT.500-11 and ITU-T Recommendation P.800, there are similar subjective assessments so
called Mean Opinion Score (MOS), which uses five-grade quality scale with Excellent (5),
Good (4), Fair (3), Poor (2) and Bad (1). The numbers in the bracket represent the quality scale.
This five-grade quality scale seems to be linear scale and it may be applicable for analogue and
digital coding systems without bit-rate reduction. Therefore, in the experiment, the MOS quality
grade having the quality grade of the received TV picture shown in Table G6 is employed.
TABLE G6
Definition of MOS quality grade in experiment
Quality grade of
received TV picture Conditions
5 No influence
4 Flickering or mosaic appeared once in a minute
3 Flickering or mosaic appeared once in twenty seconds
2 Flickering or mosaic appeared once in a second
1 No picture
Figure G4 shows the relationship between two measures, the quality level in percentage output from
the TVRO terminal and the MOS quality grade, obtained by the experiment using the static test
scenario. As shown in this figure, there is correlation between these two measures. Therefore,
the following results are evaluated based on the MOS quality grade as an evaluation criterion.

78 Rep. ITU-R M.2109
FIGURE G4
Relationship between “quality level output from TVRO terminal” and “MOS quality grade”
0
1
2
3
4
5
6
0 10 20 30 40 50 60 70 80
Quality Level in TV receiver [%]
MO
S Q
ual
ity G
rade
co-channel FEC=7/8 (Type A)
co-channel FEC=3/4 (Type A)
Adjacent-channel FEC=3/4 (Type A)
co-channel FEC=7/8 (Type B)
co-channel FEC=3/4 (Type B)
Adjacent-channel FEC=3/4 (Type B)
poor
Excellent
5 Experimental results
5.1 Static test scenario
In this test scenario, the TVRO terminal with the antenna diameter of 2.4 m was placed at the
location of E139.40.32/ N35.13.27. The experiment was conducted under the conditions as shown
in Table G7.
TABLE G7
Test location of static test scenario
TVRO antenna location Yokosuka, E139.40.32/ N35.13.27
Antenna height (a.m.s.l) 128.8 m
Weather Shower
In the experiment, the measured LNB input channel power level, (C+N), was approximately
−94.1 dBm/5 MHz using the LNB of Type A. In this case, the corresponding (C+N)/N value
becomes approximately 17.5 dB assuming the noise temperature of 100 K.
Figures G5a) and b) show the quality of TV picture measured by the MOS quality grade as
a function of the (C+N)/(I+N) for LNB Type A and Type B, respectively, where (C+N), N, and I
represent the LNB input channel power level, thermal-noise power level, and interference power
level from an IMT-Advanced transmitter, respectively. In this figure, the interference power level
form an IMT-Advanced transmitter, I, is changed in the horizontal axis. As shown in the figure, the
quality of TV picture is degraded in accordance with the increase in the interference power level.
However, in order to maintain the same quality of TV picture, the FEC coding rate of 3/4 has more
robustness against the interference power level by approximately 2 dB compared to that of 7/8.

Rep. ITU-R M.2109 79
It should be noted that, according to the information on the TV channels provided by one satellite
operator, among the fifty-seven TV channels, two, two, forty-seven, three, and five TV channels
employ the FEC coding rate of 1/2, 2/3, 3/4, 5/6 and 7/8, respectively. Thus, in this case,
approximately 80% of fifty-seven TV channels employ the FEC coding rate of 3/4.
Furthermore, when the co-channel and adjacent-channel interference scenarios are compared,
the adjacent-channel interference scenario is more robust against the increase in the interference
power level by approximately 14 dB, as shown in these figures.
FIGURE G5
Quality of TV picture measured by MOS quality grade as a function of (C +N)/(I +N)
a) LNB Type A
1
2
3
4
5
-20
-18
-16
-14
-12
-10 -8 -6 -4 -2 0 2 4
(C+N)/(I+N) [dB]
MO
S Q
ual
ity G
rad
e
co-channel FEC=7/8 (Type A)
co-channel FEC=3/4 (Type A)
Adjacent-channel FEC=3/4 (Type A)
Poor
Excellent
b) LNB Type B
0
1
2
3
4
5
6
-20
-18
-16
-14
-12
-10 -8 -6 -4 -2 0 2 4 6
(C+N)/(I+N) [dB]
MO
S Q
ual
ity G
rade
co-channel FEC=7/8 (Type B)
co-channel FEC=3/4 (Type B)
Adjacent-channel FEC=3/4 (Type B)
Poor
Excellent
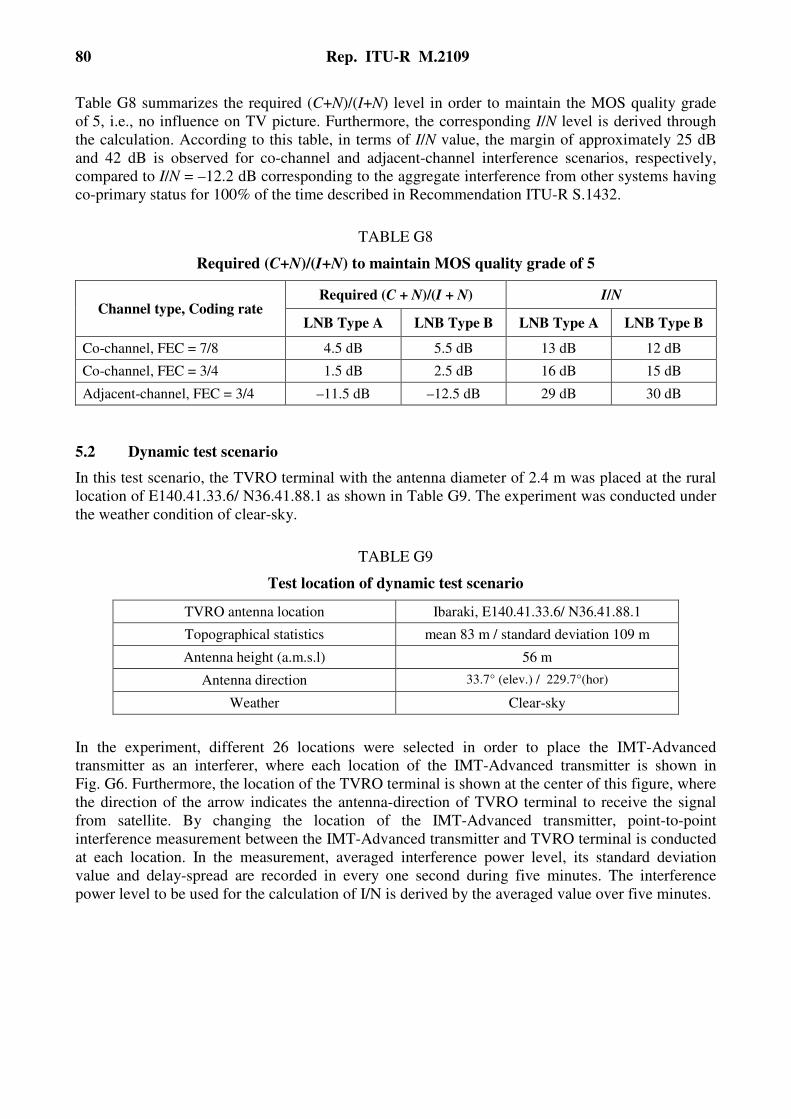
80 Rep. ITU-R M.2109
Table G8 summarizes the required (C+N)/(I+N) level in order to maintain the MOS quality grade
of 5, i.e., no influence on TV picture. Furthermore, the corresponding I/N level is derived through
the calculation. According to this table, in terms of I/N value, the margin of approximately 25 dB
and 42 dB is observed for co-channel and adjacent-channel interference scenarios, respectively,
compared to I/N = –12.2 dB corresponding to the aggregate interference from other systems having
co-primary status for 100% of the time described in Recommendation ITU-R S.1432.
TABLE G8
Required (C+N)/(I+N) to maintain MOS quality grade of 5
Channel type, Coding rate Required (C + N)/(I + N) I/N
LNB Type A LNB Type B LNB Type A LNB Type B
Co-channel, FEC = 7/8 4.5 dB 5.5 dB 13 dB 12 dB
Co-channel, FEC = 3/4 1.5 dB 2.5 dB 16 dB 15 dB
Adjacent-channel, FEC = 3/4 –11.5 dB –12.5 dB 29 dB 30 dB
5.2 Dynamic test scenario
In this test scenario, the TVRO terminal with the antenna diameter of 2.4 m was placed at the rural
location of E140.41.33.6/ N36.41.88.1 as shown in Table G9. The experiment was conducted under
the weather condition of clear-sky.
TABLE G9
Test location of dynamic test scenario
TVRO antenna location Ibaraki, E140.41.33.6/ N36.41.88.1
Topographical statistics mean 83 m / standard deviation 109 m
Antenna height (a.m.s.l) 56 m
Antenna direction 33.7° (elev.) / 229.7°(hor)
Weather Clear-sky
In the experiment, different 26 locations were selected in order to place the IMT-Advanced
transmitter as an interferer, where each location of the IMT-Advanced transmitter is shown in
Fig. G6. Furthermore, the location of the TVRO terminal is shown at the center of this figure, where
the direction of the arrow indicates the antenna-direction of TVRO terminal to receive the signal
from satellite. By changing the location of the IMT-Advanced transmitter, point-to-point
interference measurement between the IMT-Advanced transmitter and TVRO terminal is conducted
at each location. In the measurement, averaged interference power level, its standard deviation
value and delay-spread are recorded in every one second during five minutes. The interference
power level to be used for the calculation of I/N is derived by the averaged value over five minutes.

Rep. ITU-R M.2109 81
FIGURE G6
Location of TVRO terminal and IMT-Advanced transmitter in dynamic test scenario
TVRO antenna
1
2
3
4
5
6 7
8
9 10
11
12
13
19 15
16
17
18
14
20
21
22
23
24
25
26
IMT(interfering) location
TVRO(interfered) location
and direction
Altitude (a.m.s.l) [m]
Table G10 summarizes the quality of TV picture measured by the MOS quality grade obtained by
the measurement conducted at each location. As shown in the table, among 26 locations, the MOS
quality grade of 5, i.e., no influence on the received TV quality, is observed at 25 and 24 locations
in the case of co-channel interference scenarios with FEC coding rate of 3/4 and 7/8, respectively.
Furthermore, in the case of adjacent-channel interference scenario, no influence on the received TV
picture is observed at all the locations.

82 Rep. ITU-R M.2109
TABLE G10
MOS quality grade at respective locations
Location of
IMT-Advanced
transmitter
MOS quality grade
Co-channel,
FEC = 7/8
Co-channel,
FEC = 3/4
Adjacent-channel,
FEC = 3/4
1 5 5 5
2 5 5 5
3 5 5 5
4 5 5 5
5 1 5 5
6 5 5 5
7 5 5 5
8 5 5 5
9 5 5 5
10 5 5 5
11 5 5 5
12 5 5 5
13 5 5 5
14 1 1 5
15 5 5 5
16 5 5 5
17 5 5 5
18 5 5 5
19 5 5 5
20 5 5 5
21 5 5 5
22 5 5 5
23 5 5 5
24 5 5 5
25 5 5 5
26 5 5 5
Figure G8 summarizes the relationship of the (C+N)/(I+N) value and distance between the TVRO
terminal and IMT-Advanced transmitter. In the figure, the required (C+N)/(I+N) levels to maintain
the MOS quality grade of 5 that are obtained by the static test scenario are also depicted in the case
of FEC coding rate of 3/4 and 7/8, respectively. Furthermore, the required (C+N)/(I+N) level which
corresponds to I/N = –12.2 dB is shown for reference.

Rep. ITU-R M.2109 83
FIGURE G8
Relationship of (C +N)/(I +N) value and distance between the TVRO terminal
and IMT-Advanced transmitter
-20.0
-10.0
0.0
10.0
20.0
30.0
40.0
50.0
60.0
0 1000 2000 3000 4000 5000 6000
Distance from TVRO [m]
(C+
N)/
(I+
N)
[dB
]
FEC=7/8 Limit
FEC=3/4 Limit
Equivalent to I/N=-12.2dB
Finally, in Fig. G9, the experimental results and the results which are simulated by the required
protection criteria and propagation model by Recommendation ITU-R P.452 are compared.
In Fig. 9a) and b), the gradation color indicates the area where the received interference power level
at TVRO terminal exceeds the required protection criteria, when assuming I/N = –12.2 dB (from
ITU-R Recommendation for FSS systems carrying digital traffic) and +12 dB (from the
experiment), respectively. In the figure, the white color indicates the area where the received
interference power level at TVRO terminal does not exceed the protection criteria. The interference
power level is calculated by assuming the propagation model shown in Recommendation ITU-R
P.452 using the terrain data model and the additional clutter losses due to artificial objects.
Furthermore, the location of the IMT-Advanced transmitter in the experiment is also shown in these
figures, where the quality of the TV picture is damaged by the IMT-Advanced transmitter placed at
the location 5 and 14 in the case of co-channel interference scenario with FEC coding rate of 7/8.
As shown in Fig. 9a) assuming the criterion of I/N = –12.2 dB, most of locations of IMT-Advanced
transmitter are expected to impact the quality of the TV picture in this area, however, this is not the
case in the experiment in a real environment. Meanwhile, as shown in Fig. 9b) assuming the
criterion of I/N = +12 dB, the location of the IMT-Advanced transmitter which is expected to
impact the quality of TV picture is more accurately approximated compared with the area shown in
Fig. 9a).
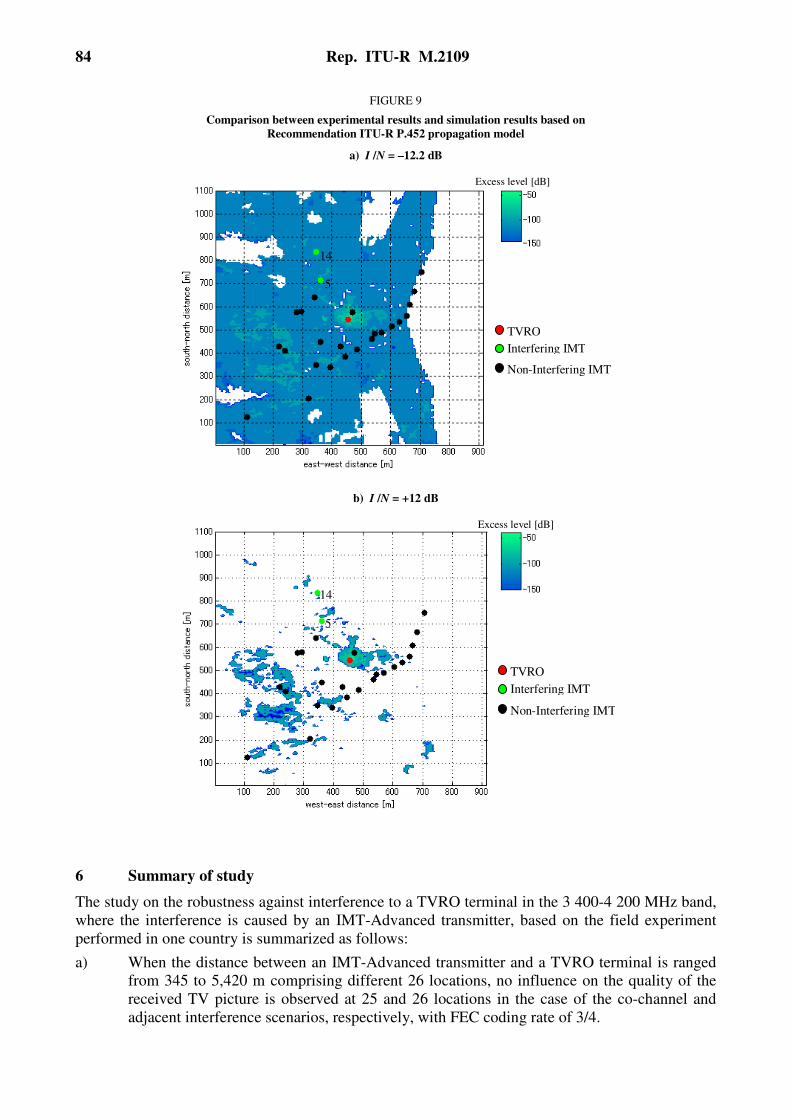
84 Rep. ITU-R M.2109
FIGURE 9
Comparison between experimental results and simulation results based on
Recommendation ITU-R P.452 propagation model
a) I /N = –12.2 dB
Excess level [dB]
5
14
TVRO
Interfering IMT
Non-Interfering IMT
b) I /N = +12 dB
Excess level [dB]
5
14
TVRO
Interfering IMT
Non-Interfering IMT
6 Summary of study
The study on the robustness against interference to a TVRO terminal in the 3 400-4 200 MHz band,
where the interference is caused by an IMT-Advanced transmitter, based on the field experiment
performed in one country is summarized as follows:
a) When the distance between an IMT-Advanced transmitter and a TVRO terminal is ranged
from 345 to 5,420 m comprising different 26 locations, no influence on the quality of the
received TV picture is observed at 25 and 26 locations in the case of the co-channel and
adjacent interference scenarios, respectively, with FEC coding rate of 3/4.

Rep. ITU-R M.2109 85
b) TV channel employing FEC coding rate of 3/4 has more robustness against the increase in
the co-channel interference power level by approximately 2 dB compared to that of 7/8 in
order to maintain the same quality of the received TV picture.
c) The influence on the quality of the received TV picture for adjacent-channel interference
scenario is smaller compared to that for co-channel scenario. In order to maintain the same
quality of the received TV picture, approximately 14 dB more power of an IMT-Advanced
transmitter is permitted in the adjacent-channel interference scenario compared to the co-
channel interference scenario.
Annex H
Adjacent band operations: Impact of the spurious emission
of a Single IMT-Advanced transmitter into FSS receivers
In accordance with RR Appendix 3, it is assumed that the IMT-Advanced transmitters would be
specified such that its spurious emission at frequency separation of 2.5x (Necessary Bandwidth)
from the center frequency of the IMT-Advanced carrier, measured in bandwidth of 1 MHz, would
be attenuated by 43 + 10 log(P) dB or 70 dBc, whichever is less stringent, below the transmitter
power level P, where P is in watts.
The analyses presented here are based on the propagation models described in ITU-R P.452-12.
Due to the generic nature of the analysis, for the long-term protection cases, the propagation is
calculated over a smooth earth surface, utilizing the propagation model described in § 4.3 of
ITU-R P.452-12. The models in ITU-R P.452-12 can include the effects of building losses and
clutter where the topography of surrounding obstacles etc. is known. However, due to lack of
information for these parameters, the building losses and clutter effects has been assumed to
represent suburban environment in these analyses.
Furthermore, Recommendation ITU-R S.1432 contains the apportionment of the allowable error
performance degradation to the FSS systems due to interference. This Recommendation states that
for all sources of long-term interference that is neither from FSS systems, nor from systems having
co-primary status, the allotted portion of the aggregate interference budget is 1%. This has been
expressed in other forums as a required protection criterion of I/N = -20 dB (i.e. ∆T/T ≤ 1%). The
unwanted emissions interference contribution from an adjacent band would be considered as one of
these “other sources of interference”. The analysis is based on:
Case A:
– The IMT-Advanced transmitter spurious emission limit of -43 dBW/MHz per RR
Appendix 3.
– For IMT-Advanced carrier bandwidths of 20 and 100 MHz, the above spurious emission
limit must be met at frequency separation of 40 and 200 MHz away from the edge of the
IMT-Advanced allocated band, respectively. In other words, these values represent the
necessary frequency separation between these services for the computed separation
distances.
– The FSS receiver antenna receives IMT-Advanced transmitter spurious emission at its 10º
off-axis gain.

86 Rep. ITU-R M.2109
– The analysis is based on the impact of a single IMT-Advanced transmitter.
Figures H1 and H2 depict the required minimum separation distance for a Single IMT-Advanced
transmitter from FSS receivers operating in an adjacent band to the IMT-Advanced system. The
minimum separation distance resulting in ∆T/T increase of ≤ 1%, are 18 km and 300 m for IMT-
Advanced Macro base station and mobile station, respectively. It should be noted that if the entire
allowable 1% noise increase is used up by the spurious emission interference from a single IMT-
Advanced transmitter, there would be no further allowances for any other sources of interference (in
practice, there are many other sources of interference that their operation would compound and
contribute to this 1% noise increase). Depending on the number of IMT-Advanced carriers and
simultaneous IMT-Advanced transmissions, the required minimum separation distance due to
aggregate impact of the spurious emission interference would be even larger. The ”�“ markers in
the figures point to the required minimum separation distances in relation to the ∆T/T increases of
1% and 0.5%.
FIGURE H1
Case A: Required minimum separation distance versus FSS earth station receiver ∆T/T
due to spurious emission interference from a single IMT-Advanced macro base station transmitter
(assuming LoS with diffraction path loss model)
0.0%
0.2%
0.4%
0.6%
0.8%
1.0%
1.2%
1.4%
16 17 18 19 20 21 25 30 35 40 45
Distance (km)
Del
ta T
/T
�
�

Rep. ITU-R M.2109 87
FIGURE H2
Case A: Required minimum separation distance versus FSS earth station receiver ∆T/T
due to spurious emission interference from a single IMT-Advanced mobile station transmitter
(assuming LoS with diffraction path loss model)
0.0%
0.5%
1.0%
1.5%
2.0%
2.5%
3.0%
0.2 0.25 0.3 0.35 0.4 0.45 0.5 0.55 0.6 0.65 0.7
Distance (km)
Del
ta T
/T
�
�
Case B:
– The IMT-Advanced transmitter spurious emission limit of -43 dBW/MHz per RR
Appendix 3.
– Assumed 10 dB additional reduction of IMT-Advanced transmitted spurious emission due
to implementation of special band-edge filters, additional blocking losses, other mitigation
techniques or a combination of them.
– For IMT-Advanced carrier bandwidths of 20 and 100 MHz, the above spurious emission
limit must be met at frequency separation of 40 and 200 MHz away from the edge of the
IMT-Advanced allocated band, respectively. In other words, these values represent the
necessary frequency separation between these services for the computed separation
distances.
– The FSS receiver antenna receives IMT-Advanced transmitter spurious emission at its 10º
off-axis gain.
– The analysis is based on the impact of a single IMT-Advanced transmitter.
Figures H3 and H4 depict the required minimum separation distance for a single IMT-Advanced
transmitter from FSS receivers operating in an adjacent band to the IMT-Advanced system. The
minimum separation distance resulting in ∆T/T increase of ≤ 1.0% assuming an additional 10 dB
reduction of IMT-Advanced transmitted spurious emission, are 5 km and 100 m for IMT-Advanced
Macro base station and mobile station, respectively. Depending on the number of IMT-Advanced
carriers and simultaneous IMT-Advanced transmissions, the required minimum separation distance
due to aggregate impact of the spurious emission interference would be even larger.
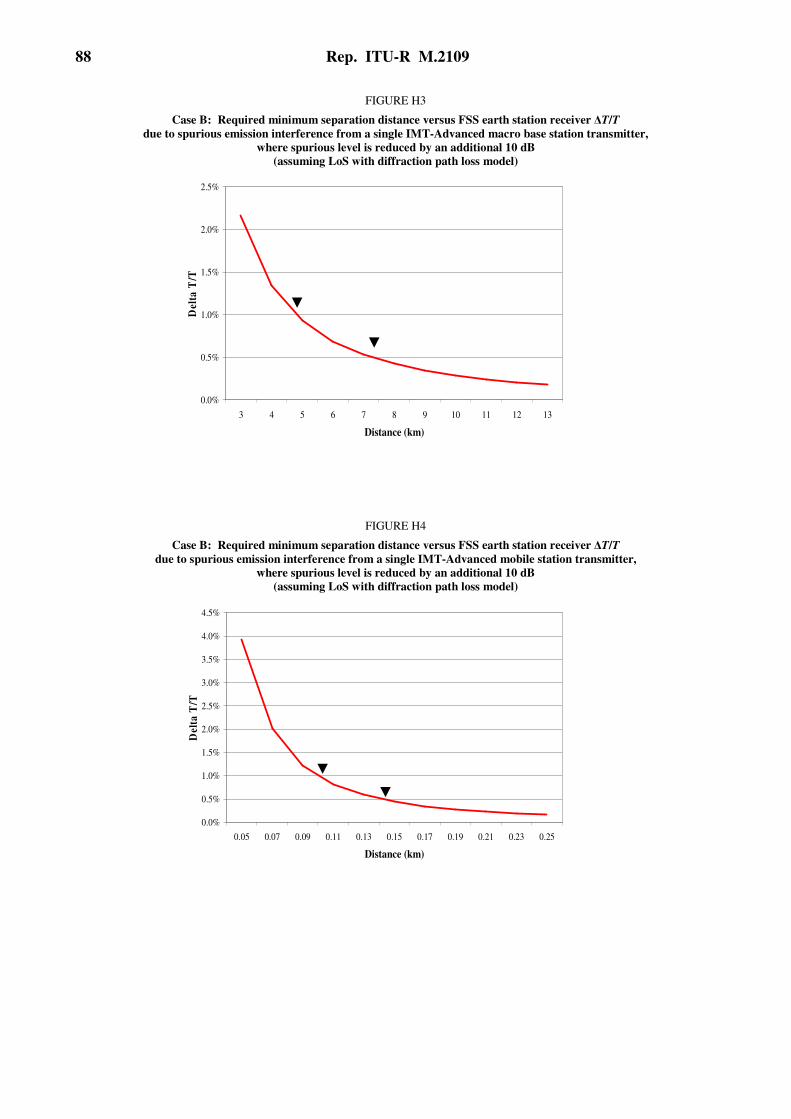
88 Rep. ITU-R M.2109
FIGURE H3
Case B: Required minimum separation distance versus FSS earth station receiver ∆T/T
due to spurious emission interference from a single IMT-Advanced macro base station transmitter,
where spurious level is reduced by an additional 10 dB
(assuming LoS with diffraction path loss model)
0.0%
0.5%
1.0%
1.5%
2.0%
2.5%
3 4 5 6 7 8 9 10 11 12 13
Distance (km)
Del
ta T
/T
�
�
FIGURE H4
Case B: Required minimum separation distance versus FSS earth station receiver ∆T/T
due to spurious emission interference from a single IMT-Advanced mobile station transmitter,
where spurious level is reduced by an additional 10 dB
(assuming LoS with diffraction path loss model)
0.0%
0.5%
1.0%
1.5%
2.0%
2.5%
3.0%
3.5%
4.0%
4.5%
0.05 0.07 0.09 0.11 0.13 0.15 0.17 0.19 0.21 0.23 0.25
Distance (km)
Del
ta T
/T
�
�

Rep. ITU-R M.2109 89
Case C:
– The IMT-Advanced transmitter spurious emission limit of -43 dBW/MHz per RR
Appendix 3.
– Assumed 40 dB and 50 dB additional reduction of IMT-Advanced transmitted spurious
emission due to implementation of special band-edge filters, additional blocking losses,
other mitigation techniques or a combination of them.
– For IMT-Advanced carrier bandwidths of 20 and 100 MHz, the above spurious emission
limit must be met at frequency separation of 40 and 200 MHz away from the edge of the
IMT-Advanced allocated band, respectively. In other words, these values represent the
necessary frequency separation between these services for the computed separation
distances.
– The FSS receiver antenna receives IMT-Advanced transmitter spurious emission at its 10º
off-axis gain.
– The analysis is based on the impact of a single IMT-Advanced transmitter.
Figures H5 and H6 depict the required minimum separation distance for a single IMT-Advanced
transmitter from FSS receivers operating in an adjacent band to the IMT-Advanced system
assuming the IMT-Advanced transmitter spurious emission level is reduced by an additional
amount of 40 dB and 50 dB. The minimum separation distance resulting in ∆T/T increase of ≤ 1.0%
would be in the range of 115 m to 35 m for IMT-Advanced macro base station. It should be noted
that depending on the number of IMT-Advanced carriers and simultaneous IMT-Advanced
transmissions, the required minimum separation distance due to aggregate impact of the spurious
emission interference would increase accordingly.
FIGURE H5
Case C: Required minimum separation distance versus FSS earth station receiver ∆T/T
due to spurious emission interference from a single IMT-Advanced macro base station transmitter,
where spurious level is reduced by an additional 40 dB
(assuming LoS with diffraction path loss model)
0.0%
0.2%
0.4%
0.6%
0.8%
1.0%
1.2%
1.4%
0.1 0.11 0.12 0.13 0.14 0.15 0.16 0.17 0.18 0.19 0.2
Distance (km)
De
lta
T/T
�
�
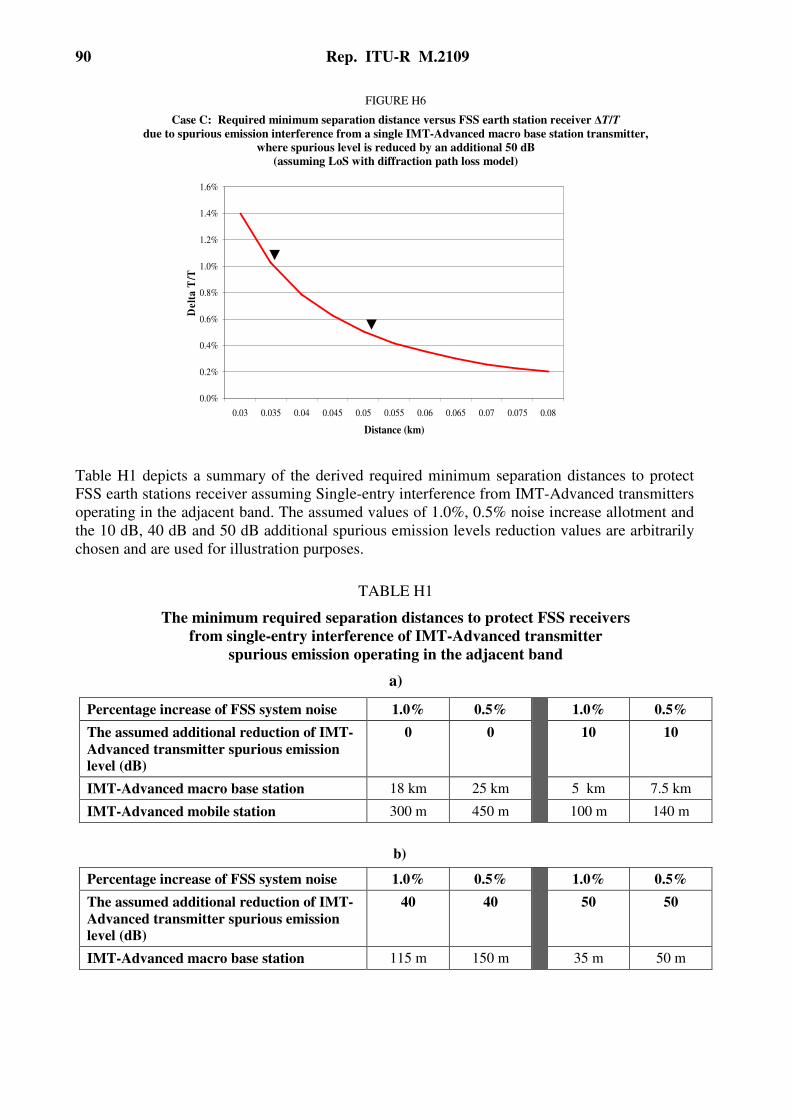
90 Rep. ITU-R M.2109
FIGURE H6
Case C: Required minimum separation distance versus FSS earth station receiver ∆T/T
due to spurious emission interference from a single IMT-Advanced macro base station transmitter,
where spurious level is reduced by an additional 50 dB
(assuming LoS with diffraction path loss model)
0.0%
0.2%
0.4%
0.6%
0.8%
1.0%
1.2%
1.4%
1.6%
0.03 0.035 0.04 0.045 0.05 0.055 0.06 0.065 0.07 0.075 0.08
Distance (km)
De
lta
T/T
�
�
Table H1 depicts a summary of the derived required minimum separation distances to protect
FSS earth stations receiver assuming Single-entry interference from IMT-Advanced transmitters
operating in the adjacent band. The assumed values of 1.0%, 0.5% noise increase allotment and
the 10 dB, 40 dB and 50 dB additional spurious emission levels reduction values are arbitrarily
chosen and are used for illustration purposes.
TABLE H1
The minimum required separation distances to protect FSS receivers
from single-entry interference of IMT-Advanced transmitter
spurious emission operating in the adjacent band
a)
Percentage increase of FSS system noise 1.0% 0.5% 1.0% 0.5%
The assumed additional reduction of IMT-
Advanced transmitter spurious emission
level (dB)
0 0 10 10
IMT-Advanced macro base station 18 km 25 km 5 km 7.5 km
IMT-Advanced mobile station 300 m 450 m 100 m 140 m
b)
Percentage increase of FSS system noise 1.0% 0.5% 1.0% 0.5%
The assumed additional reduction of IMT-
Advanced transmitter spurious emission
level (dB)
40 40 50 50
IMT-Advanced macro base station 115 m 150 m 35 m 50 m
Rep. ITU-R M.2109 91
The results of this study show that operation of IMT-Advanced systems and the FSS in adjacent
bands in the 4 GHz frequency range is very difficult and may not be feasible in the same
geographical area if the IMT-Advanced transmitter spurious emission is defined in accordance with
the limits specified in RR Appendix 3. As depicted in Table H1a), large separation distances would
be required to satisfy the long-term protection criterion of an FSS receiver from the spurious
emission of a single IMT-Advanced transmission in the adjacent band at a given frequency
separation. For example, the required minimum separation distance from FSS earth stations would
be 18 km for the case of transmission from only one IMT-Advanced base station transmitter,
assuming that the entire allowable FSS system noise increase due to other services is allocated to
IMT-Advanced equipment spurious emission. Even if the IMT-Advanced spurious emission was
reduced by an additional 10 dB from the specified limits of RR Appendix 3, the required minimum
separation distance from FSS earth stations would be 5 km for the case of transmission from only
one IMT-Advanced base station transmitter, assuming that the entire allowable FSS system noise
increase due to other services is allocated to IMT-Advanced systems. Depending on the number of
IMT-Advanced carriers and simultaneous IMT-Advanced transmissions, aggregate interference
from IMT-Advanced transmitters are expected to result in even larger required minimum separation
distances from FSS earth stations.
However, as depicted in Table H1b), if the IMT-Advanced transmitter spurious emission level is
reduced by an additional 40 to 50 dB from the specified limits in RR Appendix 3, then the required
separation distances due to interference from a single IMT-Advanced transmitter become very small
and it would facilitate the operation of IMT-Advanced and FSS systems in adjacent bands in the 4
GHz frequency range. The exact value of the required additional reduction of the spurious emission
level would depend on the expected aggregate interference from IMT-Advanced devices.
Additional information on the IMT-Advanced network design (e.g., cell size, mobile unit
distribution, access schemes, protocols, etc.) is required to be able to assess the expected aggregate
interference from IMT-Advanced networks into FSS receivers operating in adjacent frequency
bands.
Report ITU-R S.2199 (11/2010)
Studies on compatibility of broadband wireless access systems and fixed-satellite
service networks in the 3 400-4 200 MHz band
S Series
Fixed satellite service
ii Rep. ITU-R S.2199
Foreword
The role of the Radiocommunication Sector is to ensure the rational, equitable, efficient and economical use of the
radio-frequency spectrum by all radiocommunication services, including satellite services, and carry out studies without
limit of frequency range on the basis of which Recommendations are adopted.
The regulatory and policy functions of the Radiocommunication Sector are performed by World and Regional
Radiocommunication Conferences and Radiocommunication Assemblies supported by Study Groups.
Policy on Intellectual Property Right (IPR)
ITU-R policy on IPR is described in the Common Patent Policy for ITU-T/ITU-R/ISO/IEC referenced in Annex 1 of
Resolution ITU-R 1. Forms to be used for the submission of patent statements and licensing declarations by patent
holders are available from http://www.itu.int/ITU-R/go/patents/en where the Guidelines for Implementation of the
Common Patent Policy for ITU-T/ITU-R/ISO/IEC and the ITU-R patent information database can also be found.
Series of ITU-R Reports
(Also available online at http://www.itu.int/publ/R-REP/en)
Series Title
BO Satellite delivery
BR Recording for production, archival and play-out; film for television
BS Broadcasting service (sound)
BT Broadcasting service (television)
F Fixed service
M Mobile, radiodetermination, amateur and related satellite services
P Radiowave propagation
RA Radio astronomy
RS Remote sensing systems
S Fixed-satellite service
SA Space applications and meteorology
SF Frequency sharing and coordination between fixed-satellite and fixed service systems
SM Spectrum management
Note: This ITU-R Report was approved in English by the Study Group under the procedure detailed
in Resolution ITU-R 1.
Electronic Publication
Geneva, 2011
ITU 2011
All rights reserved. No part of this publication may be reproduced, by any means whatsoever, without written permission of ITU.

Rep. ITU-R S.2199 1
REPORT ITU-R S.2199
Studies on compatibility of broadband wireless access systems
and fixed-satellite service networks in the 3 400-4 200 MHz band1
(2010)
TABLE OF CONTENTS
Page
Executive summary .................................................................................................................. 4
1 Introduction .................................................................................................................... 6
2 Regulatory status of the services having allocations in the 3 400-4 200 MHz band ...... 6
2.1 Definitions .......................................................................................................... 6
2.2 Table of frequency allocations ............................................................................ 7
2.3 Coordination contours to protect FSS receive earth station ............................... 9
3 FSS systems in the 3 400-4 200 MHz band.................................................................... 11
3.1 Examples of FSS deployments ........................................................................... 11
3.2 Types of FSS receive earth stations .................................................................... 12
3.3 Unregistered earth stations ................................................................................. 13
3.4 Conclusions on satellite system use of the 3 400-4 200 MHz band ................... 13
4 Broadband wireless access systems in the 3 400-4 200 MHz band ............................... 13
5 Possible types of interference to the FSS ....................................................................... 14
6 Sharing and compatibility studies and results ................................................................ 15
6.1 Sharing between FSS and BWA (Co-frequency emission problem) .................. 15
6.2 Compatibility of FSS with interference resulting from unwanted BWA
emissions (Unwanted emission problem) ........................................................... 15
6.3 FSS receiver overload (FSS Receiver “saturation” problem) ........................... 16
7 Methods and techniques to enhance sharing and compatibility ..................................... 16
7.1 Individually licensed/registered FSS earth stations at specific locations ........... 16
7.2 BWA stations and/or FSS earth stations deployed in a ubiquitous manner
and/or without individual licensing or registration ............................................. 16
1 The characteristics of BWA can be fixed, mobile or nomadic.

2 Rep. ITU-R S.2199
Page
7.3 Possible techniques to avoid LNB saturation ..................................................... 16
7.4 Example of National Regulatory/Technical solutions ........................................ 17
8 Conclusions .................................................................................................................... 17
Annex A – FSS and BWA system parameters ......................................................................... 19
Attachment 1 to Annex A – Spectrum masks for BWA base stations ..................................... 26
Attachment 2 to Annex A – Spectrum emission mask for terminal station equipment
operating in the band 3 400-3 800 MHz ......................................................................... 27
Annex B – Description of studies ............................................................................................ 28
1 Introduction .................................................................................................................... 28
Attachment 1 to Annex B – Study A – Compatibility between BWA systems and FSS earth
stations ............................................................................................................................ 28
1 Introduction .................................................................................................................... 28
2 Compatibility study’s methodology and assumptions .................................................... 28
2.1 FSS system parameters ....................................................................................... 29
2.2 FSS earth station maximum permissible interference ........................................ 29
2.3 FSS ES antenna pattern ...................................................................................... 30
2.4 BWA system parameters .................................................................................... 30
2.5 BWA base station antenna pattern ...................................................................... 31
2.6 BWA terminal station antenna pattern ............................................................... 31
2.7 BWA base station and terminal station out-of-band emission ........................... 31
2.8 Propagation models ............................................................................................ 32
3 Results ............................................................................................................................ 33
3.1 BWA rural BS interfering with 32 m FSS ES .................................................... 33
3.2 BWA rural BS interfering with 8 m FSS ES ...................................................... 36
3.3 BWA rural BS interfering with 1.2 m FSS ES ................................................... 38
3.4 BWA urban BS interfering with 32 m FSS ES ................................................... 41
3.5 BWA urban BS interfering with 8 m FSS ES ..................................................... 42
3.6 BWA urban BS interfering with 1.2 m FSS ES .................................................. 43
3.7 BWA fixed-outdoor TS interfering with 32 m FSS ES ...................................... 44
3.8 BWA fixed-outdoor TS interfering with 8 m FSS ES ........................................ 45
3.9 BWA fixed-outdoor TS interfering with 1.2 m FSS ES ..................................... 47
Rep. ITU-R S.2199 3
Page
3.10 BWA fixed-indoor TS interfering with 32 m FSS ES ........................................ 48
3.11 BWA fixed-indoor TS interfering with 8 m FSS ES .......................................... 48
3.12 BWA fixed-indoor TS interfering with 1.2 m FSS ES ....................................... 49
4 Conclusions .................................................................................................................... 49
Attachment 2 to Annex B – Description of Study B – Evaluation of Study A with BWA
antenna patterns and propagation model parameters ...................................................... 51
1 Introduction .................................................................................................................... 51
2 Evaluation of parameters used in Recommendation ITU-R P.452-13 ........................... 51
3 Set-up of simulations ...................................................................................................... 53
4 Results of simulation ...................................................................................................... 56
4.1 Scenario 1 (BWA sectoral antenna, smooth earth) ............................................. 56
4.2 Scenario 2 (BWA sectoral antenna, actual terrain data) ..................................... 58
4.3 Scenario 3 (BWA omnidirectional antenna, smooth earth) ................................ 62
4.4 Scenario 4 (BWA omnidirectional antenna, actual terrain data) ........................ 63
5 Discussion of assumptions.............................................................................................. 64
5.1 Clutter parameters ............................................................................................... 65
5.2 Use of sectorized antennas .................................................................................. 66
5.3 Aggregate effect from multiple cells .................................................................. 67
6 Conclusions .................................................................................................................... 68
Attachment 3 to Annex B – Description of Study C – Simulations for interference from a
BWA system to FSS in The Netherlands ....................................................................... 69
1 Assumptions for simulation ............................................................................................ 69
2 Simulation results ........................................................................................................... 71
3 Conclusions .................................................................................................................... 74
Attachment 4 to Annex B – Description of Study D – Study of required separation
distances in order to avoid LNB saturation or non-linear behaviour ............................. 75
1 Introduction .................................................................................................................... 75
2 LNB operational range ................................................................................................... 75
3 Set-up of simulations ...................................................................................................... 75
4 Results of analysis .......................................................................................................... 77

4 Rep. ITU-R S.2199
Page
5 Discussion of results ....................................................................................................... 81
6 Aggregate effects ............................................................................................................ 82
7 Band-pass filters on LNBs .............................................................................................. 83
8 Conclusions .................................................................................................................... 83
Annex C ................................................................................................................................... 84
Annex D – Example of a national implementation FSS/BWA sharing arrangements in the
3 400-4 200 MHz band in Australia ............................................................................... 89
1 Introduction .................................................................................................................... 89
2 Summary of the main sharing rules ................................................................................ 89
3 Summary and conclusion................................................................................................ 93
Executive summary
The 3 400-4 200 MHz band or parts of the band, where implemented, can be heavily used by the
fixed-satellite service (FSS) for space-to-Earth transmissions. In some geographical regions, many
administrations are introducing broadband wireless access (BWA) systems in all or portions of this
frequency band. As BWA is being introduced, harmful interference and loss of service for FSS
receivers has been experienced. For these reasons, this Report examines the possibility of
compatibility between BWA and FSS networks in the range 3 400-4 200 MHz for both co-channel
and adjacent channel operations.
Appendix 7 of the Radio Regulations (RR) defines the methodology for calculating coordination
contours around FSS receiving earth stations inside which coordination is required for terrestrial
services. Such contours typically extend 400-1 000 km from the earth station. Implementation of
BWA networks in a country will require international coordination with any country that has filed
FSS earth stations whose coordination contour overlaps the service area of the BWA network.
Different types of FSS receive earth stations need to be considered in the compatibility studies.
This includes earth stations deployed ubiquitously, earth stations without individual licensing or
registration, individually-licensed2 earth stations, telemetry earth stations, and feeder link earth
stations for mobile-satellite systems.
Three possible types of interference have been identified and considered in this Report, namely:
1. co-frequency emissions from BWA causing in-band interference to FSS systems,
2. unwanted emissions from the BWA transmitters,
3. signals from nearby BWA transmitters causing overload to FSS earth station receivers
operating in adjacent bands.
2 The terms “licensed” and “registered” are used throughout this Report to refer to stations for which
location coordinates are known so their protection may be possible.
Rep. ITU-R S.2199 5
A set of parameters have been established that served as the basis for the compatibility studies.
These are parameters concerning BWA base station and terminal station parameters, BWA and FSS
antenna patterns, and FSS earth station parameters. Further a common set of propagation
parameters to be used in the propagation model of Recommendation ITU-R P.452-13 have been set.
A summary of the compatibility studies that were done based on the above parameters are presented
in this Report.
The results of these studies indicate that in order to provide protection to FSS earth station
receivers, some separation distance between the stations of the BWA network and the FSS earth
station receivers is required. The magnitude of the separation distance depends on the parameters of
the networks, the protection criteria of concerned satellite networks and the deployment of the two
services and whether the two services operate in the same or in adjacent frequency bands. With the
assumptions used in the studies, it was observed that when no particular shielding with respect to
the interfering signal could be guaranteed, and that when no other mitigation technique is applied by
the BWA network, the required separation distances would be ranging from several tens to in
excess of 100 km for the co-channel interference case, and in the order of a few kilometres for the
adjacent channel case. However, for co-channel compatibility, mitigation techniques for BWA have
not been studied in this Report.
Overall, from the studies reported in this text, it can be concluded that co-frequency operation of
BWA systems and FSS receive earth stations in the same geographic area is not feasible. The
implications are that BWA deployment would need to respect the above-mentioned separation
distances to protect existing FSS earth stations, which may adversely affect the future deployment
of BWA systems. In addition , when a BWA system is deployed, this creates an exclusion zone
within which future deployments of FSS earth stations would not be possible. This limitation would
adversely affect the future development in these zones of the infrastructure telecommunications/ICT
of those countries which rely on the FSS in this band as the main backbone for this infrastructure .
Operation of BWA in a channel immediately adjacent to the band used by an FSS earth station may
cause interference to receive earth stations through two different mechanisms:
i) Low Noise Block converter (LNB) saturation;
ii) unwanted emissions from BWA transmitters that fall within the band in which the FSS
earth station operates.
In certain cases, particularly if the separation distances mentioned above are not met, the
interference from BWA may block the reception of the earth station in the band in which it
operates. Mitigation techniques may be employed to reduce the likelihood of LNB saturation,
e.g. installation of a pass band filter at the front end of the FSS earth station and/or reduction of the
BWA power. It has been verified that when a BWA system operates in a band immediately next to
the band in which the FSS earth station operates, the effectiveness of the pass band filter is very
limited.
Accordingly, higher power BWA signals should not be operated in channels adjacent to the edge of
the operating FSS band, leaving the spectrum closer to that FSS band for use by BWA signals with
lower power. The potential for interference caused by unwanted emissions generated by BWA
transmitters could be reduced by limiting the level of such emissions.
To mitigate the LNB saturation interference, FSS earth stations could be also retrofitted with band
pass filters at the LNB. This would improve the situation with regard to reducing the earth station’s
susceptibility to interference. However, due to the large number of earth stations already deployed
throughout the 3 400-4 200 MHz band, this would have cost and implementation implications
which would also be significant. Introduction of band pass filters would introduce additional losses
in the FSS earth station receive path. In addition, introduction of filters does not improve the
sharing situation in the co-channel case. This would adversely affect the future development of

6 Rep. ITU-R S.2199
these FSS systems in this band. This is in particular relevant for the developing countries for which
the FSS forms the fundamental parts of their infrastructure for telecommunications/ICT networks.
When the FSS earth stations are individually licensed or registered such that the locations of the
stations are known and the location of the BWA base stations and user terminals can be controlled,
mitigation techniques to protect the FSS earth stations can be achieved by means of ensuring
a minimum separation distance, taking into account specific site shielding and propagation
conditions as a means to control and reduce the interference.
When the BWA stations and/or FSS earth stations are deployed in a ubiquitous manner and/or the
locations of the stations are not known, no minimum separation distance can be guaranteed. In this
case, compatibility of BWA networks operating within any part of the 3 400-4 200 MHz range and
FSS networks operating in this same range is not likely feasible within the same geographical area.
1 Introduction
The 3 400-4 200 MHz band is allocated worldwide on a primary basis to the FSS. This band or
parts of the band can be heavily used by the FSS for space-to-Earth transmissions. There are
primary allocations to the mobile service and to the fixed service within the 3 400-4 200 MHz band.
In various regions, many administrations are introducing BWA systems in all or portions of this
frequency band.
This Report examines the possible compatibility between BWA and FSS networks in the range
3 400-4 200 MHz. In addition, the potential of the FSS receiving harmful levels of interference due
to unwanted emissions from BWA systems is investigated.
2 Regulatory status of the services having allocations in the 3 400-4 200 MHz band
The ITU-R Radio Regulations define radiocommunication services and allocate different services to
different frequency bands. Administrations are free to select a subset of these allocations for use in
their own national spectrum allocations.
2.1 Definitions
Some selected definitions in Article 1 of the RR relevant for BWA and FSS applications include the
following. The numbers correspond to their number in the RR:
“1.20 Fixed service: A radiocommunication service between specified fixed points.
1.21 Fixed-satellite service: A radiocommunication service between earth stations at given
positions, when one or more satellites are used; the given position may be a specified fixed point or
any fixed point within specified areas; in some cases this service includes satellite-to-satellite links,
which may also be operated in the inter-satellite service; the fixed-satellite service may also include
feeder links for other space radiocommunication services.
1.24 Mobile service: A radiocommunication service between mobile and land stations,
or between mobile stations (CV).
1.26 Land mobile service: A mobile service between base stations and land mobile stations, or
between land mobile stations.
1.63 Earth station: A station located either on the Earth’s surface or within the major portion of
the Earth’s atmosphere and intended for communication:
– with one or more space stations; or
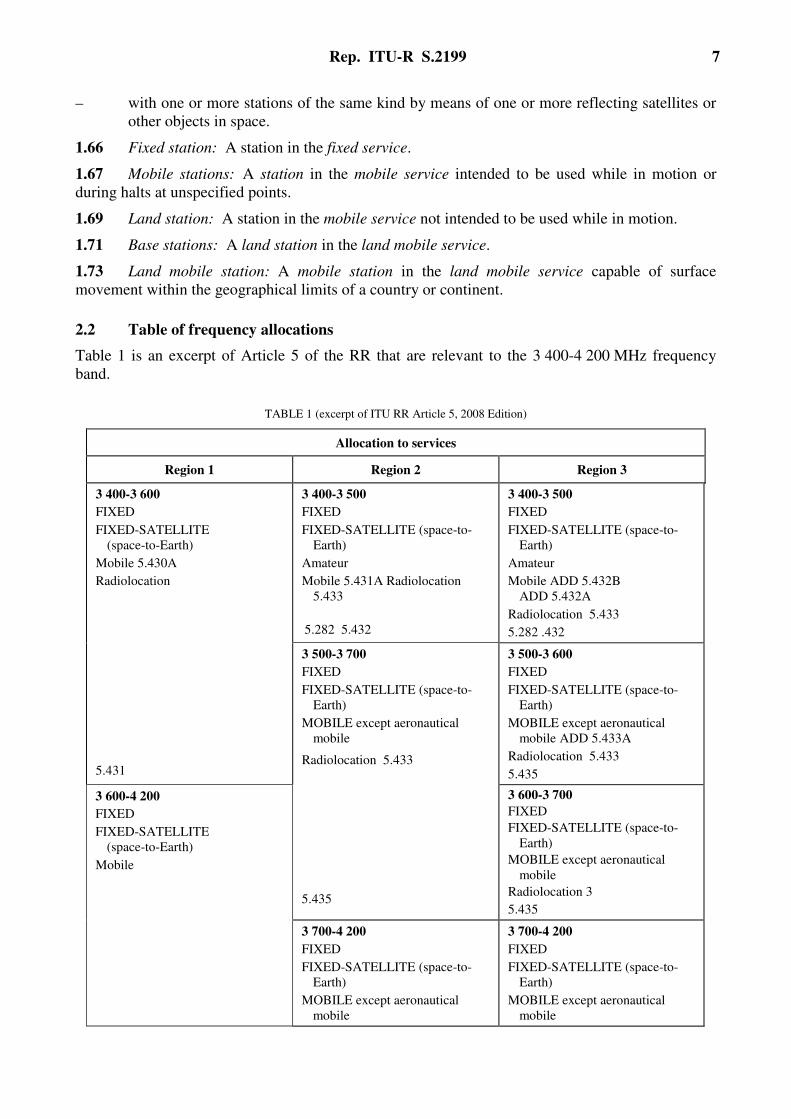
Rep. ITU-R S.2199 7
– with one or more stations of the same kind by means of one or more reflecting satellites or
other objects in space.
1.66 Fixed station: A station in the fixed service.
1.67 Mobile stations: A station in the mobile service intended to be used while in motion or
during halts at unspecified points.
1.69 Land station: A station in the mobile service not intended to be used while in motion.
1.71 Base stations: A land station in the land mobile service.
1.73 Land mobile station: A mobile station in the land mobile service capable of surface
movement within the geographical limits of a country or continent.
2.2 Table of frequency allocations
Table 1 is an excerpt of Article 5 of the RR that are relevant to the 3 400-4 200 MHz frequency
band.
TABLE 1 (excerpt of ITU RR Article 5, 2008 Edition)
Allocation to services
Region 1 Region 2 Region 3
3 400-3 600
FIXED
FIXED-SATELLITE
(space-to-Earth)
Mobile 5.430A
Radiolocation
5.431
3 400-3 500
FIXED
FIXED-SATELLITE (space-to-
Earth)
Amateur
Mobile 5.431A Radiolocation
5.433
5.282 5.432
3 400-3 500
FIXED
FIXED-SATELLITE (space-to-
Earth)
Amateur
Mobile ADD 5.432B
ADD 5.432A
Radiolocation 5.433
5.282 .432
3 500-3 700
FIXED
FIXED-SATELLITE (space-to-
Earth)
MOBILE except aeronautical
mobile
Radiolocation 5.433
3 500-3 600
FIXED
FIXED-SATELLITE (space-to-
Earth)
MOBILE except aeronautical
mobile ADD 5.433A
Radiolocation 5.433
5.435
3 600-4 200
FIXED
FIXED-SATELLITE
(space-to-Earth)
Mobile
5.435
3 600-3 700
FIXED
FIXED-SATELLITE (space-to-
Earth)
MOBILE except aeronautical
mobile
Radiolocation 3
5.435
3 700-4 200
FIXED
FIXED-SATELLITE (space-to-
Earth)
MOBILE except aeronautical
mobile
3 700-4 200
FIXED
FIXED-SATELLITE (space-to-
Earth)
MOBILE except aeronautical
mobile
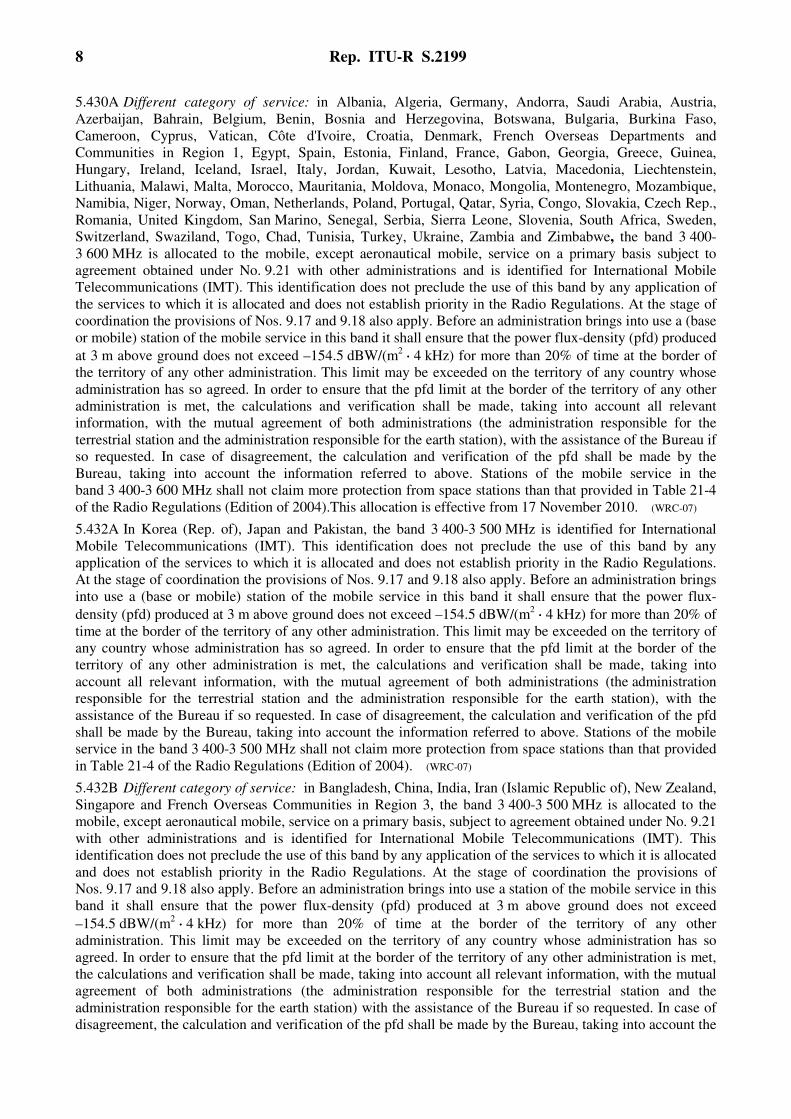
8 Rep. ITU-R S.2199
5.430A Different category of service: in Albania, Algeria, Germany, Andorra, Saudi Arabia, Austria,
Azerbaijan, Bahrain, Belgium, Benin, Bosnia and Herzegovina, Botswana, Bulgaria, Burkina Faso,
Cameroon, Cyprus, Vatican, Côte d'Ivoire, Croatia, Denmark, French Overseas Departments and
Communities in Region 1, Egypt, Spain, Estonia, Finland, France, Gabon, Georgia, Greece, Guinea,
Hungary, Ireland, Iceland, Israel, Italy, Jordan, Kuwait, Lesotho, Latvia, Macedonia, Liechtenstein,
Lithuania, Malawi, Malta, Morocco, Mauritania, Moldova, Monaco, Mongolia, Montenegro, Mozambique,
Namibia, Niger, Norway, Oman, Netherlands, Poland, Portugal, Qatar, Syria, Congo, Slovakia, Czech Rep.,
Romania, United Kingdom, San Marino, Senegal, Serbia, Sierra Leone, Slovenia, South Africa, Sweden,
Switzerland, Swaziland, Togo, Chad, Tunisia, Turkey, Ukraine, Zambia and Zimbabwe, the band 3 400-
3 600 MHz is allocated to the mobile, except aeronautical mobile, service on a primary basis subject to
agreement obtained under No. 9.21 with other administrations and is identified for International Mobile
Telecommunications (IMT). This identification does not preclude the use of this band by any application of
the services to which it is allocated and does not establish priority in the Radio Regulations. At the stage of
coordination the provisions of Nos. 9.17 and 9.18 also apply. Before an administration brings into use a (base
or mobile) station of the mobile service in this band it shall ensure that the power flux-density (pfd) produced
at 3 m above ground does not exceed –154.5 dBW/(m2 ⋅⋅⋅⋅ 4 kHz) for more than 20% of time at the border of
the territory of any other administration. This limit may be exceeded on the territory of any country whose
administration has so agreed. In order to ensure that the pfd limit at the border of the territory of any other
administration is met, the calculations and verification shall be made, taking into account all relevant
information, with the mutual agreement of both administrations (the administration responsible for the
terrestrial station and the administration responsible for the earth station), with the assistance of the Bureau if
so requested. In case of disagreement, the calculation and verification of the pfd shall be made by the
Bureau, taking into account the information referred to above. Stations of the mobile service in the
band 3 400-3 600 MHz shall not claim more protection from space stations than that provided in Table 21-4
of the Radio Regulations (Edition of 2004).This allocation is effective from 17 November 2010. (WRC-07)
5.432A In Korea (Rep. of), Japan and Pakistan, the band 3 400-3 500 MHz is identified for International
Mobile Telecommunications (IMT). This identification does not preclude the use of this band by any
application of the services to which it is allocated and does not establish priority in the Radio Regulations.
At the stage of coordination the provisions of Nos. 9.17 and 9.18 also apply. Before an administration brings
into use a (base or mobile) station of the mobile service in this band it shall ensure that the power flux-
density (pfd) produced at 3 m above ground does not exceed –154.5 dBW/(m2 ⋅⋅⋅⋅ 4 kHz) for more than 20% of
time at the border of the territory of any other administration. This limit may be exceeded on the territory of
any country whose administration has so agreed. In order to ensure that the pfd limit at the border of the
territory of any other administration is met, the calculations and verification shall be made, taking into
account all relevant information, with the mutual agreement of both administrations (the administration
responsible for the terrestrial station and the administration responsible for the earth station), with the
assistance of the Bureau if so requested. In case of disagreement, the calculation and verification of the pfd
shall be made by the Bureau, taking into account the information referred to above. Stations of the mobile
service in the band 3 400-3 500 MHz shall not claim more protection from space stations than that provided
in Table 21-4 of the Radio Regulations (Edition of 2004). (WRC-07)
5.432B Different category of service: in Bangladesh, China, India, Iran (Islamic Republic of), New Zealand,
Singapore and French Overseas Communities in Region 3, the band 3 400-3 500 MHz is allocated to the
mobile, except aeronautical mobile, service on a primary basis, subject to agreement obtained under No. 9.21
with other administrations and is identified for International Mobile Telecommunications (IMT). This
identification does not preclude the use of this band by any application of the services to which it is allocated
and does not establish priority in the Radio Regulations. At the stage of coordination the provisions of
Nos. 9.17 and 9.18 also apply. Before an administration brings into use a station of the mobile service in this
band it shall ensure that the power flux-density (pfd) produced at 3 m above ground does not exceed
–154.5 dBW/(m2 ⋅⋅⋅⋅ 4 kHz) for more than 20% of time at the border of the territory of any other
administration. This limit may be exceeded on the territory of any country whose administration has so
agreed. In order to ensure that the pfd limit at the border of the territory of any other administration is met,
the calculations and verification shall be made, taking into account all relevant information, with the mutual
agreement of both administrations (the administration responsible for the terrestrial station and the
administration responsible for the earth station) with the assistance of the Bureau if so requested. In case of
disagreement, the calculation and verification of the pfd shall be made by the Bureau, taking into account the
Rep. ITU-R S.2199 9
information referred to above. Stations of the mobile service in the band 3 400-3 500 MHz shall not claim
more protection from space stations than that provided in Table 21-4 of the Radio Regulations
(2004 edition). This allocation is effective from 17 November 2010. (WRC-07)
5.433A In Bangladesh, China, Korea (Rep. of), India, Iran (Islamic Republic of), Japan, New Zealand,
Pakistan and French Overseas Communities in Region 3, the band 3 500-3 600 MHz is identified for
International Mobile Telecommunications (IMT). This identification does not preclude the use of this band
by any application of the services to which it is allocated and does not establish priority in the Radio
Regulations. At the stage of coordination the provisions of Nos. 9.17 and 9.18 also apply. Before
an administration brings into use a station of the mobile service in this band it shall ensure that the power
flux-density (pfd) produced at 3 m above ground does not exceed –154.5 dBW/(m2 ⋅⋅⋅⋅ 4 kHz) for more than
20% of time at the border of the territory of any other administration. This limit may be exceeded on the
territory of any country whose administration has so agreed. In order to ensure that the pfd limit at the border
of the territory of any other administration is met, the calculations and verification shall be made, taking into
account all relevant information, with the mutual agreement of both administrations (the administration
responsible for the terrestrial station and the administration responsible for the earth station), with the
assistance of the Bureau if so requested. In case of disagreement, the calculation and verification of the pfd
shall be made by the Bureau, taking into account the information referred to above. Stations of the mobile
service in the band 3 500-3 600 MHz shall not claim more protection from space stations than that provided
in Table 21-4 of the Radio Regulations (Edition of 2004). (WRC-07)
5.431A Different category of service: in Argentina, Brazil, Chile, Costa Rica, Cuba, Dominican Republic,
El Salvador, Guatemala, Mexico, Paraguay, Suriname, Uruguay, Venezuela and French Overseas
Departments and Communities in Region 2, the band 3 400-3 500 MHz is allocated to the mobile, except
aeronautical mobile, service on a primary basis, subject to agreement obtained under No. 9.21. Stations of
the mobile service in the band 3 400-3 500 MHz shall not claim more protection from space stations than
that provided in Table 21-4 of the Radio Regulations (Edition of 2004). (WRC-07)
2.3 Coordination contours to protect FSS receive earth station
International protection of specific FSS earth stations and their coordination is governed by
RR Nos. 9.17, 9.18, and in certain cases 9.21. The thresholds/conditions that trigger coordination
are those specified in RR Appendix 5, together with the method of calculation for coordination
contours completed in accordance with Appendix 7 of the RR.
These coordination contours may extend far into other countries. It is up to each administration to
decide which stations within its own territory it wishes to protect in accordance with the RR.
For example, if an administration wishes to ensure the protection of specific receiving FSS earth
stations located within its territory from transmitting terrestrial stations located in the adjacent
countries and within the coordination area of the earth station(s), those earth stations should be
registered to ITU through the coordination and notification procedure under the provisions of RR
Articles 9 and 11.
Particularly, as specified in RR No. 9.6, an administration intending to bring into use terrestrial
services whose territory falls within the coordination contours of the earth stations under the
coordination or notification procedure or notified under RR Articles 9 and 11, shall effect
coordination with the administrations responsible for notifying these earth stations.
BWA networks in one country will need to be coordinated with all other countries having earth
stations with coordination contours overlapping with the intended service area of the BWA
network. Depending upon the specific terrain, BWA networks may need to be coordinated with FSS
earth stations. Typically coordination distances range from 400 to 1 000 km.
The coordination area is not an exclusion zone within which the sharing of frequencies between the
earth station and terrestrial stations or other earth stations is prohibited, but rather a means for
determining the area within which more detailed calculations need to be performed. A more
detailed analysis may show that sharing within the coordination area is possible since the procedure

10 Rep. ITU-R S.2199
for the determination of the coordination area is based on conservative assumptions with regard to
the interference potential (see § 1.1 of Appendix 7 of the RR). Through the bilateral coordination
process, it may be possible to identify one or more possible mechanisms to mitigate the interference
to acceptable levels (e.g. site shielding, BWA antenna pointing or other considerations) resulting in
smaller separation distances.
Calculation of a minimum coordination distance to protect an FSS earth station needs to take into
account additional propagation effects (diffraction, building/terrain scattering etc.) not taken into
account in the propagation model of RR Appendix 7. Minimum distances are usually in excess of
100 km depending on the latitude of the earth station. This means that regardless of the location of
the earth station, the coordination contour will never be smaller than about 100 km in any direction.
Table 2 with the associated figures provides two examples of Appendix 7 mode 1 and mode 2
coordination contours around earth stations that are available using data from the ITU Master
Register. These contours have been derived using the RR Appendix 7 methodology and criteria.
TABLE 2
Earth station information Satellite information
Name Longitude Latitude Satellite name
Longitude
(nominal)
1 SI RACHA 2 100 E 56 11 13 N 06 02 INTELSAT5 INDOC1 63
2 AGARTALA 91 E 16 00 23 N 48 00 INSAT-1B 74
Rep. ITU-R S.2199 11
3 FSS systems in the 3 400-4 200 MHz band
Representative FSS technical characteristics for use in BWA/FSS compatibility studies are provided
in Table 3 of Annex A to this Report.
The band 3 400-4 200 MHz has been used by the FSS for space-to-Earth links (downlinks) since the
1970’s. The technology is mature and equipment is available at low cost. This, together with the
wide coverage beams possible in this band, has lead to satellites in this band being an important part
of the telecommunications infrastructure in many developing countries. As of 2008 there are more
than 160 geostationary satellites worldwide operating in all or part of the band 3 400-4 200 MHz.
Most of these satellites operate in the 3 625-4 200 MHz band. Nearly two out of three of
commercial satellites manufactured in 2006 used FSS allocations in this part of the spectrum. In
addition, many satellites that operate in other bands have their telemetry operations (telemetry,
tracking and ranging) in the 3 400-4 200 MHz range, especially for the purposes of Launch and
Transfer Orbit Operations. This band, in particular the lower part of the band, is also used for feeder
links to satellites in the mobile-satellite service.
The low gaseous atmospheric absorption combined with lower attenuation due to rain in bands
below 7 GHz enables highly reliable space-to-Earth communication links with wide service area
coverage, particularly in, but not limited to, geographical areas with severe rain fade conditions.
As higher frequencies (i.e. 10-12 GHz or 19-20 GHz) are subject to severe rain fade conditions in
many countries, the 3 400-4 200 MHz band is the only downlink band where FSS services can be
provided efficiently with high availability and reliability. Also, for areas where the population is
low and scattered (e.g. the islands in the Pacific) the wide coverage beams of satellites in this band
may be one of the few options economically available. For these reasons, this band is the band of
choice in many regions for a multitude of services, including very small aperture terminal (VSAT)
networks, internet providers, point-to-multipoint links, satellite news gathering, TV and data
broadcasting to satellite master antenna television (SMATV) and direct-to-home (DTH) receivers.
In many countries receive only earth stations or VSAT terminals are not individually licensed and
their number, location or detailed characteristics are not typically available. Due to their wide
coverage characteristics, satellites operating in this band have been extensively employed for
disaster relief operations.
3.1 Examples of FSS deployments
FSS earth stations are deployed, in varying degrees, all around the world in the band 3 400-
4 200 MHz. Some examples of such deployment are provided below. Further details on earth
station deployments can be found in Annexes A and C.
– Information obtained from Intelsat and SES New Skies in mid-2006 showed that in Europe
there were approximately 830 earth stations operating to Intelsat satellites and 251 earth
stations operating to SES New Skies satellites, for a total of 1 081 earth stations using the
band 3 400-4 200 MHz. Updated information from the same sources showed that by late-
2008 the total number had increased to 1 431, an increase of 350 registered earth stations in
this band over the short two year period. Figure 20 of Annex C to this Report provides a
map showing this 2008 census.
– One major satellite operator has more than 9 900 registered earth stations, in its data base,
deployed across the globe operating in the 3 400-4 200 MHz band. The location of these
earth stations is shown in Figs 20 through 23 of Annex C to this Report3. These figures do
3 Source: Report ITU-R M.2109 – Sharing studies between IMT Advanced systems and geostationary
satellite networks in the fixed-satellite service in the 3 400-4 200 MHz and 4 500-4 800 MHz frequency
bands.
12 Rep. ITU-R S.2199
not include receive only FSS earth stations such as Television Receive-Only (TVRO)
terminals which may amount to several thousand more terminals.
– In Brazil, in the band 3 700-4 200 MHz there are more than 8 000 nationally registered
earth stations pointing to one of the Brazilian satellites and 12 000 nationally registered
earth stations pointing to one of the non-Brazilian satellites that cover the country, plus an
equal number of earth stations in the 3 625-3 700 MHz band (see Fig. 24 of Annex C).
There are also an estimated 20 million TVRO terminals deployed across the country.
– A provider of television programming in the United States of America delivers
programming via satellite directly to the general public in areas that are outside the
coverage area of its terrestrial television stations. As of December 2005, there were
approximately 122 000 receive-only earth stations that received programming from that
provider in that country.
– Members of one Broadcasting Association utilize more than 31 000 earth stations in
North America to reach over 66 million cable television households.
– In the Russian Federation, there are approximately 6 000 nationally registered earth stations
that receive transmissions in the 3 400-4 200 MHz band. These figures do not include
TVRO earth stations that are deployed across the country.
– In the Russian Federation there are more than 20 satellite networks operating in the band
3 400-4 200 MHz with global and semi-global coverage. These are the EXPRESS,
YAMAL and STATSIONAR networks.
3.2 Types of FSS receive earth stations
There are four different types of FSS receive earth stations:
a) Earth stations deployed ubiquitously and/or without individual licensing or registration
– Where deployed, these earth stations are typically in large numbers and their specific
locations are not known.
b) Individually licensed earth stations
– The location of these earth stations is known so that site shielding and other mitigation
techniques can possibly be implemented. International protection is provided to specific
earth stations (i.e. at specific geographic locations) which are filed and coordinated
pursuant to Article 9 of the RR.
c) Telemetry earth stations
– These earth stations are part of the control system for the satellite and are responsible
for its safe operation. This type of earth station can tolerate very little interference.
However, there are very few earth stations of this type and just like other individually
licensed earth stations, their specific location is known and can be taken into account to
possibly mitigate the interference.
d) Feeder links for mobile-satellite systems
– A number of mobile-satellite operators use a portion of the 3 400-4 200 MHz band for
their feeder links. Because of the nature of the service, a very high degree of
availability is required and very little interference can be tolerated. However, again
these are a limited number of earth stations in known locations and case-by-case
measures to reduce the interference can be implemented.
Rep. ITU-R S.2199 13
3.3 Unregistered earth stations
For earth station terminals that both transmit and receive, records of their key features such as
antenna size and geographical location are kept by the operators of the satellites serving them, for
example Intelsat and SES New Skies. Similar data is recorded by the licensing authorities of the
countries in which the terminals are located. However in most countries licences are not required
for terminals which receive but do not transmit, such as TVROs, and hence the great majority of
such terminals are not included in either industrial or governmental data-bases. Thus it is not
possible to state reliably the number of unregistered earth station terminals operating in Europe in
3 400-4 200 MHz.
It should be noted that in the United States of America and Canada, receive only earth stations are
not required to obtain a license or register. However, unregistered receive stations do not receive
protection from other services. Receive only earth stations may optionally seek protection on a
licensed basis in the 3 700-4 200 MHz band.
Although the number of users that have acquired TVROs to take advantage of the extensive
availability of 3 400-4 200 MHz-band TV carriers is unknown, it is likely to be a considerable
number.
3.4 Conclusions on satellite system use of the 3 400-4 200 MHz band
Bearing in mind that the earth station data does not include non-registered terminals, such as
TVROs, from the figures in Annex C it is reasonable to conclude that the use of the 3 400-
4 200 MHz band by satellite services is extensive and exhibited an increase in the number of user
terminals from 2006 to 2008 (see Fig. 20 of Annex C). However, Fig. 23 of Annex C indicates a
much lower density of earth stations in several countries in the band 3 400-3 625 MHz, which could
facilitate sharing between BWA applications and registered FSS earth stations in this sub-band. It
should also be noted that some countries have even no registered earth stations in this band. This is
likely reflective of national allocations decisions. At the technical level this still may not address the
situation of non-registered stations.
In case of bilateral or multilateral coordination or sharing discussions, administrations are
encouraged to make the most detailed information possible available concerning the FSS earth
station usage on their territory.
4 Broadband wireless access systems in the 3 400-4 200 MHz band
Representative Broadband wireless access (BWA) technical characteristics for use in BWA/FSS
compatibility studies are provided in Table 4 (Base station parameters) and Table 5 (Terminal
station parameters) of Annex A to this Report. Further, the description of the BWA base station
omnidirectional antenna is given in Fig. 1 of the same Annex. Figures 2 to 4 describe the BWA base
station sector antenna.
In broad terms, wireless access is an end-user radio connection(s) to core networks. Broadband
wireless access applications have connection capabilities that are higher than the primary rate –
e.g. 1 544 kbit/s (T1) or 2 048 kbit/s (E1). Fixed wireless access (FWA) is an application in which
the location of the end-user termination and the network access point to be connected to the end-
user are fixed, whereas mobile wireless access is an application in which the location of the end-
user termination is mobile. For nomadic wireless access (NWA), the location of the end-user
termination may be in different places but it is stationary while in use. Although the exact locations
of the mobile and nomadic terminals are in general unknown, they are restricted by the positions of
their respective base stations and the maximum distance between base station and terminal.
14 Rep. ITU-R S.2199
A number of BWA systems and applications, based on different standards, are available and the
suitability of each depends on usage (fixed, nomadic and/or mobile), and performance and
geographic requirements, among others. These standards are found in Recommendations
ITU-R F.1763 – Radio interface standards for broadband wireless access systems in the fixed
service operating below 66 GHz and ITU-R M.1801 – Radio interface standards for broadband
wireless access systems, including mobile and nomadic applications, in the mobile service operating
below 6 GHz.
Both of these Recommendations cover nomadic applications, which can operate in either fixed or
mobile service allocations. Moreover, advances in technologies have greatly enabled the
convergence of broadband and mobile.
In countries where wired infrastructure is not well established, wireless systems like BWA or FSS
can be more easily deployed to deliver services to population bases in dense urban environments as
well as those in more remote areas. Some users may only require broadband Internet access for
short ranges whereas others users may require broadband access over longer distances. Moreover,
these same users may require that their BWA applications be nomadic, mobile, fixed or a
combination of all three.
5 Possible types of interference to the FSS
Three possible types of interference have been identified as follows:
a) Co-frequency emissions from BWA
– Due to the long distance to the satellite and the power limitations of the satellite,
the incoming power flux density at the earth station location is very low. Terrestrial
(e.g. BWA) equipment which is much closer to the earth station can produce
significantly higher power levels at the input to the FSS receiver than the desired
satellite signal.
b) Unwanted emissions (either out-of-band or spurious) from BWA
– Due to the very low level of the incoming FSS signals and level of unwanted emissions
that may be generated by the BWA transmitters BWA operation in one part of the band
can create interference in other parts of the 3 400-4 200 MHz band used by the FSS.
More stringent requirements for filtering of the BWA transmissions will reduce the
impact on FSS reception, but will make BWA equipment more expensive.
c) Signals from nearby BWA transmitters causing FSS receiver overload to FSS earth station
receivers operating in adjacent bands
– FSS earth station Low Noise Amplifiers (LNAs) and Low Noise Block converters
(LNBs) are optimized for the reception of very low level satellite signals, and hence
have low noise figures and relatively low dynamic range. Typically, an LNA/LNB will
be saturated with a total input power of around–50 dBm. Accordingly, the LNA/LNBs
will start to show a non-linear behaviour, creating intermodulation products and
suppression of carriers at a total incoming power about 10 dB below the 1 dB
compression point at an input signal level of about –60 dBm.
Typically LNAs and LNBs receive throughout the entire 3 400-4 200 MHz band. LNAs
and LNBs specified for reception of only the 3 700-4 200 MHz band normally operate
over the entire 3 400-4 200 MHz and have the bandwidth defining filtering only at
Intermediate Frequency (IF). Therefore, terrestrial signals in any part of the 3 400-
4 200 MHz band can be received by the LNA/LNB and affect the operating point of the
LNA/LNB. Because of the potentially high signal power levels from BWA or other
allocated services, such as high power radiolocation in the 3 400-3 600 MHz band,
Rep. ITU-R S.2199 15
received by the FSS earth stations, the FSS receiver could be driven into their non-
linear operating range, thus preventing FSS reception.
Bandpass filters that can be mounted between the FSS receive antenna and the
LNA/LNB to filter out signals outside the wanted frequency band (e.g. 3 700-
4 200 MHz) are available. Field trials have indicated that an out-of-band BWA signal
can be reduced by about 10 dB. Such filters will however reduce the figure of merit
(G/T) for the FSS earth station and may necessitate the use of a larger earth station
antenna. Some earth stations, in particular smaller earth stations also commonly have
the LNB and the feedhorn moulded together in one unit. In this case, insertion of a
filter in between them is not possible. The cost of inserting filters also would add
considerably to the cost of many antenna installations.
6 Sharing and compatibility studies and results
Annex A to this Report contains, apart from the BWA and FSS parameters to be used in the
compatibility studies, also the parameters to be used in the propagation model of Recommendation
ITU-R P.452-13.
Several sharing studies, based on the parameters contained in Annex A, have been conducted with
regard to the interference potential of BWA systems into FSS networks operating in the 3 400-
4 200 MHz band. Studies to this extent are summarized in Annex B.
To ensure protection of the FSS earth station, the studies documented in Annex B show that FSS
receive earth stations in all cases of co-frequency interference need to be physically separated or
shielded from BWA base stations and user terminals. Additionally, in some cases of adjacent
channel interference there would also be a need for physical separation or shielding from BWA
base stations and user terminals, which, when implemented, could have significant cost impact on
the procurement and deployment of the FSS earth stations. The separation distance depends on the
system parameters in the various scenarios. In particular this section considers BWA stations
working in the 3 400-3 600 MHz band. Based on the sharing and compatibility studies, the worst-
case separation between the BWA transmitters and FSS earth stations working in the 3 400-
4 200 MHz band is summarized as follows:
6.1 Sharing between FSS and BWA (Co-frequency emission problem)
Interference may be caused by BWA operating in portions of the band 3 400-3 800 MHz to FSS
systems receiving satellite signals in the same frequencies. The studies conducted indicate that
separation distances of tens of kilometres, even in excess of 100 km in some cases, will be required
if no shielding arrangement can be implemented at the earth stations, and if no other mitigation
technique is applied to the BWA base station. However, for co-channel compatibility, mitigation
techniques for BWA have not been investigated in this Report. It should be noted that these values
reflect the long-term protection criterion only. In the co-frequency case, short-term protection
criterion should also be considered. In this case the required separation distances will be much
greater. The actual separation distance depends on the parameters of the stations and the actual
scenario involved.
6.2 Compatibility of FSS with interference resulting from unwanted BWA emissions
(Unwanted emission problem)
Unwanted emissions from BWA operating in portions of the 3 400-3 800 MHz band can affect FSS
systems intending to receive signals in the adjacent frequency band of 3 800-4 200 MHz In the case
where BWA equipment with out-of-band emissions conforming to European standards are
deployed, separation distances of up to a few kilometres between BWA transmitters and FSS

16 Rep. ITU-R S.2199
receiving stations would be required. If additional filtering can be implemented at the BWA base
stations to reduce the levels of unwanted emissions the distance between the BWA base station and
the FSS earth station may be shortened. It should be noted that it is important to have a sufficient
separation distance between BWA terminal stations and FSS earth stations. For specific earth
stations, clutter loss and shielding effects can also be taken into account to further reduce the
separation distance.
6.3 FSS receiver overload (FSS Receiver “saturation” problem)
Signals from nearby BWA equipment transmitting in portions of the 3 400-3 800 MHz band can
cause the overload of FSS receivers because their LNB typically receives over the entire
3 400-4 200 MHz range. Although there may be a number of technical solutions (e.g. BWA
filtering, shielding, etc.) available in principle to minimize/overcome the problem, the most
practical solution may be to add a bandpass filter in front of the FSS receiver (if possible, given the
physical configuration of the earth station). However this will add to the cost of the FSS
deployment. For those FSS systems not equipped with a band pass filter, separation distances of up
to several kilometres would be required. Administrations may not have required separation or
coordination distances for unwanted emissions.
7 Methods and techniques to enhance sharing and compatibility
7.1 Individually licensed/registered FSS earth stations at specific locations
Where FSS earth stations are individually licensed or registered such that the locations of the
stations are known, coordination of the BWA network and FSS earth stations may be possible. This
coordination can normally be facilitated by a combination of natural terrain features and local
shielding at either or both ends of potential interference paths, along with frequency coordination
and power reduction if necessary. According to the studies described, BWA systems within an area
of several to over 100 km around existing licensed earth stations operating in the same frequencies
may cause interference to the latter, indicating that careful coordination is necessary for co-
frequency operation. If detailed data/knowledge is available on the clutter environment around the
concerned BWA and FSS systems (e.g. in bilateral coordination), these can be taken into account,
and may reduce the separation distances. However, the studies in Annex B assumed local clutter
parameters, and the outcome was that “exclusion zones” still exist around earth stations where
BWA services cannot be provided in the band.
7.2 BWA stations and/or FSS earth stations deployed in a ubiquitous manner and/or
without individual licensing or registration
Protection by separation distance is only meaningful for fixed BWA stations or if locations of
nomadic or mobile stations can be controlled. However, when the locations of the BWA stations are
unknown no minimum separation distance can be guaranteed making compatibility between FSS
and BWA quite difficult . If no practical solution can be identified to prevent the risk of interference
by mobile BWA stations to FSS systems, it may be necessary to limit the operations of one service
or introduce band segmentation.
7.3 Possible techniques to avoid LNB saturation
To overcome interference due to the saturation and unwanted emission problems which may
potentially affect all FSS systems with LNA/LNBs operating in the 3 400-4 200 MHz range the
following mitigation techniques may be considered:
– retrofit the interfered-with FSS earth station with an LNB band pass filter;
Rep. ITU-R S.2199 17
– ensure that the use of BWA stations is coordinated via a combination of e.i.r.p. limits and
detailed coordination of BWA coverage areas.
7.4 Example of National Regulatory/Technical solutions
Annex D provides an example of a national implementation of BWA.
It provides details of the sharing arrangements between BWA and FSS in the 3 400-4 200 MHz
band in Australia. In Australia, which does not share any national borders, the technical rules for
sharing, including FSS Earth station and BWA base station filtering characteristics, are controlled
by the Administration, which improves the sharing situation. This situation might not be true for
other Administrations where additional measures may be required, such as cross-border
coordination to protect the FSS in the 3 400-4 200 MHz band, although the technical compatibility
criteria are applicable in other scenarios.
Furthermore, although the sharing arrangements can fully account for existing FSS systems at the
time of deployment, it will limit the future deployment of FSS stations in locations where BWA is
licensed.
The main licensing rules detailed in Example D-1 to ensure that BWA services in the 3 575-
3 700 MHz band will be compatible with existing licensed FSS earth stations in the 3 600-
4 200 MHz band may be summarized as follows:
– BWA is being licensed in regional and remote areas of Australia. Exclusion zones apply
around defined areas, such as major cities, in order to preserve future planning options in
these areas4.
– Regional and remote BWA base station transmitters must meet a number of minimum
performance characteristics; including an e.i.r.p. density mask above 3 700 MHz
(see Table 42 and Fig. 25 of Annex D).
– Regional and remote BWA base station transmitters are not be licensed within 20 km of an
existing licensed FSS earth station operating in the adjacent Standard C band (see Table 44
of Annex D).
– FSS earth station receivers are assumed to meet a number of minimum performance
characteristics (in addition to their licence requirements) (see Table 43 of Annex D).
– Regional and remote BWA frequency assignments are being undertaken using additional
coordination specific information (see Table 44 of Annex D).
8 Conclusions
Based on the studies that form the basis of this Report, the following conclusions are reached
regarding the compatibility of BWA and FSS in the 3 400-4 200 MHz band:
a) BWA networks may operate within the fixed or mobile services depending on the type of
technology and licensing regime adopted in individual administrations. BWA user
terminals deployed at unknown locations (i.e. without individual licensing of fixed user
terminals, ubiquitously deployed, nomadic or mobile) and the associated base stations
would operate in the mobile service. BWA user terminals deployed at fixed, specified
locations, and their associated gateway stations would operate in the fixed service.
4 Section 2 of the ACMA Spectrum Planning Discussion Paper 02/09 on the “Release of the 3.6 GHz band
for Wireless Access Services (WAS)”, http://www.acma.gov.au/webwr/_assets/main/lib310829/spp2009-
02_release_of_3.6ghz_band_for_was-disc_paper.pdf.
18 Rep. ITU-R S.2199
b) Appendix 7 of the RR defines the methodology for calculating coordination contours
around FSS receive earth stations within which coordination is required for terrestrial
services. Such contours typically extend 100-1 000 km from the earth station.
Implementation of BWA networks in a country will require international coordination with
any country that has filed FSS earth stations whose coordination contour overlaps the
service area of the BWA network.
c) Sharing and compatibility studies and field trials referenced in this Report have been
performed in relation to the co-existence of BWA networks being deployed in portions of
the 3 400-3 800 MHz band and FSS networks in the bands 3 400-4 200 MHz.
Three different types of interference were identified in these studies and tests:
– in-band interference – BWA interfering with FSS in overlapping frequency bands;
– unwanted emissions of BWA (out-of-band due to spectrum roll-off and spurious
emissions) interfering with FSS in other parts of the 3 400-4 200 MHz band;
– FSS receiver saturation – BWA power levels affecting the operating point of the FSS
receiver LNA or LNB so that it is driven into saturation or non-linear operation.
d) The studies indicate that to provide protection to FSS receive earth stations, some
separation distance between the stations of the BWA network and the FSS receive earth
stations is required. The magnitude of this separation distance depends on the parameters of
the networks, the protection criteria of concerned satellite networks and the deployment of
the two services and if the two services operate in the same or in adjacent frequency bands.
With the assumptions used in the studies, it was shown that when no particular shielding or
blocking with the respect to the interfering signal can be guaranteed, the approximate
required separation distances would be as follows:
– co-frequency: several tens to in excess of 100 km;
– out-of-band emissions: a few km;
– FSS receiver saturation: a few to several km.
e) When the FSS earth stations are individually licensed or registered such that the locations
of the stations are known and the location of the BWA base stations and user terminals can
be controlled, mitigation techniques to protect the FSS earth stations can be achieved by
means of ensuring a minimum separation distance, taking into account specific site
shielding and propagation conditions as a means to control and reduce the interference.
f) When the BWA stations and/or FSS earth stations are deployed in a ubiquitous manner
and/or without individual licensing or registration, the locations of the stations are not
known and hence, no minimum separation distance can be guaranteed. Compatibility of
BWA networks operating within any part of the 3 400-4 200 MHz range and FSS networks
operating in this same range is not feasible within the same geographical area.
g) The retrofit of FSS earth stations with band pass filters at the LNB could improve the
situation with regard to reducing the earth station susceptibility to interference, however
such measures may not be possible due to the specific design of the LNB/feed horn, would
be costly and could reduce performance of the earth station, and in any case may be
impractical due to the large number of earth stations already deployed in the 3 400-
4 200 MHz band
h) Deployment of BWA in any portion of the 3 400-4 200 MHz band would likely pose
limitations on future deployment of FSS earth stations in the entire 3 400-4 200 MHz band.
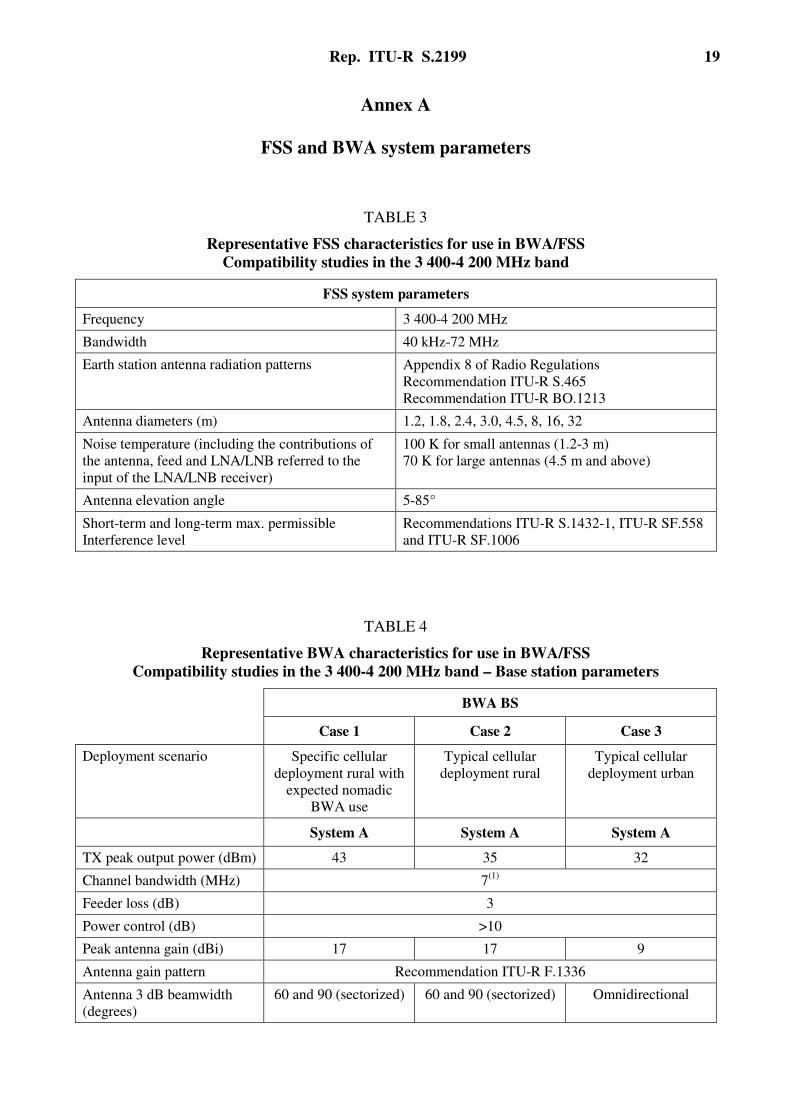
Rep. ITU-R S.2199 19
Annex A
FSS and BWA system parameters
TABLE 3
Representative FSS characteristics for use in BWA/FSS
Compatibility studies in the 3 400-4 200 MHz band
FSS system parameters
Frequency 3 400-4 200 MHz
Bandwidth 40 kHz-72 MHz
Earth station antenna radiation patterns Appendix 8 of Radio Regulations
Recommendation ITU-R S.465
Recommendation ITU-R BO.1213
Antenna diameters (m) 1.2, 1.8, 2.4, 3.0, 4.5, 8, 16, 32
Noise temperature (including the contributions of
the antenna, feed and LNA/LNB referred to the
input of the LNA/LNB receiver)
100 K for small antennas (1.2-3 m)
70 K for large antennas (4.5 m and above)
Antenna elevation angle 5-85°
Short-term and long-term max. permissible
Interference level
Recommendations ITU-R S.1432-1, ITU-R SF.558
and ITU-R SF.1006
TABLE 4
Representative BWA characteristics for use in BWA/FSS
Compatibility studies in the 3 400-4 200 MHz band – Base station parameters
BWA BS
Case 1 Case 2 Case 3
Deployment scenario Specific cellular
deployment rural with
expected nomadic
BWA use
Typical cellular
deployment rural
Typical cellular
deployment urban
System A System A System A
TX peak output power (dBm) 43 35 32
Channel bandwidth (MHz) 7(1)
Feeder loss (dB) 3
Power control (dB) >10
Peak antenna gain (dBi) 17 17 9
Antenna gain pattern Recommendation ITU-R F.1336
Antenna 3 dB beamwidth
(degrees)
60 and 90 (sectorized) 60 and 90 (sectorized) Omnidirectional
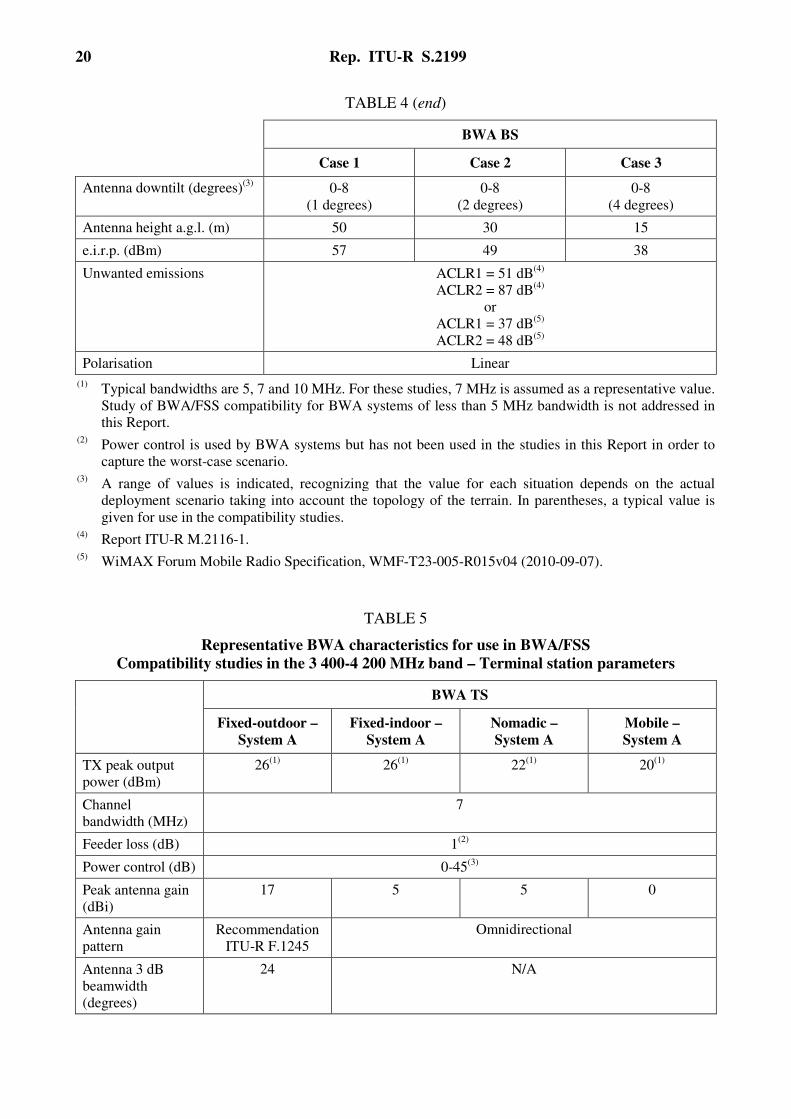
20 Rep. ITU-R S.2199
TABLE 4 (end)
BWA BS
Case 1 Case 2 Case 3
Antenna downtilt (degrees)(3)
0-8
(1 degrees)
0-8
(2 degrees)
0-8
(4 degrees)
Antenna height a.g.l. (m) 50 30 15
e.i.r.p. (dBm) 57 49 38
Unwanted emissions ACLR1 = 51 dB(4)
ACLR2 = 87 dB(4)
or
ACLR1 = 37 dB(5)
ACLR2 = 48 dB(5)
Polarisation Linear
(1) Typical bandwidths are 5, 7 and 10 MHz. For these studies, 7 MHz is assumed as a representative value.
Study of BWA/FSS compatibility for BWA systems of less than 5 MHz bandwidth is not addressed in
this Report. (2)
Power control is used by BWA systems but has not been used in the studies in this Report in order to
capture the worst-case scenario. (3)
A range of values is indicated, recognizing that the value for each situation depends on the actual
deployment scenario taking into account the topology of the terrain. In parentheses, a typical value is
given for use in the compatibility studies. (4)
Report ITU-R M.2116-1. (5)
WiMAX Forum Mobile Radio Specification, WMF-T23-005-R015v04 (2010-09-07).
TABLE 5
Representative BWA characteristics for use in BWA/FSS
Compatibility studies in the 3 400-4 200 MHz band – Terminal station parameters
BWA TS
Fixed-outdoor –
System A
Fixed-indoor –
System A
Nomadic –
System A
Mobile –
System A
TX peak output
power (dBm)
26(1)
26(1)
22(1)
20(1)
Channel
bandwidth (MHz)
7
Feeder loss (dB) 1
(2)
Power control (dB) 0-45(3)
Peak antenna gain
(dBi)
17 5 5 0
Antenna gain
pattern
Recommendation
ITU-R F.1245
Omnidirectional
Antenna 3 dB
beamwidth
(degrees)
24 N/A
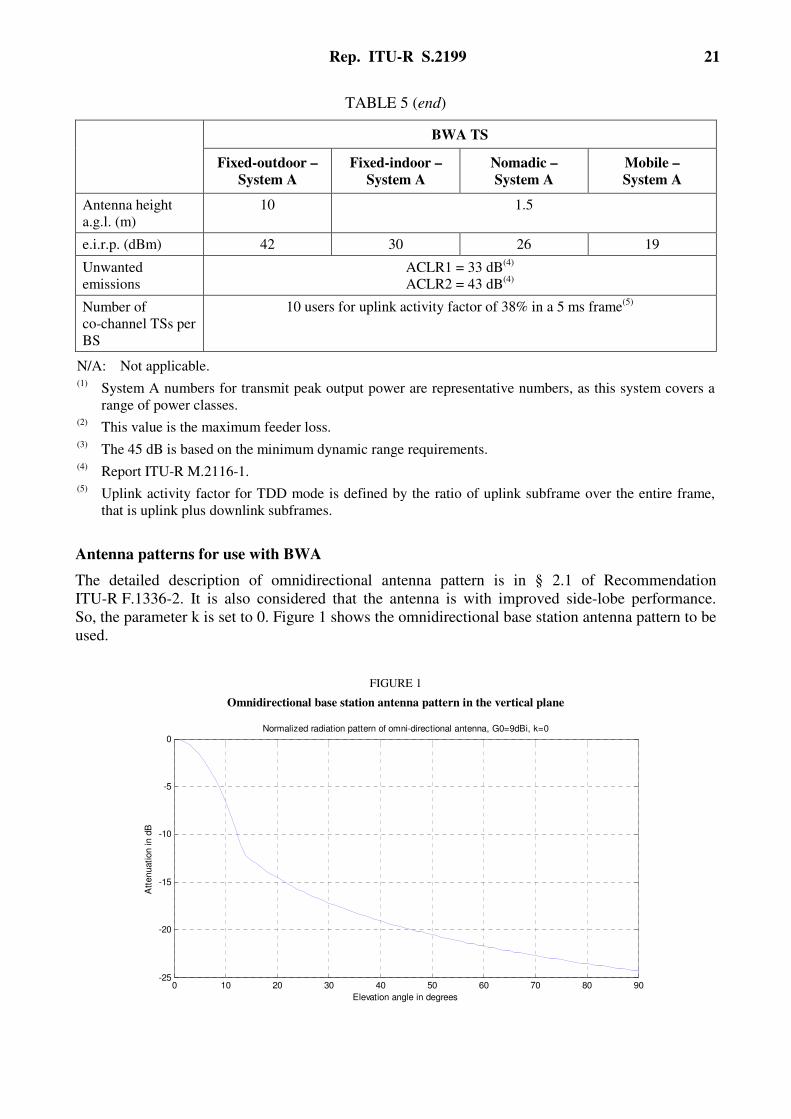
Rep. ITU-R S.2199 21
TABLE 5 (end)
BWA TS
Fixed-outdoor –
System A
Fixed-indoor –
System A
Nomadic –
System A
Mobile –
System A
Antenna height
a.g.l. (m)
10 1.5
e.i.r.p. (dBm) 42 30 26 19
Unwanted
emissions
ACLR1 = 33 dB(4)
ACLR2 = 43 dB(4)
Number of
co-channel TSs per
BS
10 users for uplink activity factor of 38% in a 5 ms frame(5)
N/A: Not applicable. (1)
System A numbers for transmit peak output power are representative numbers, as this system covers a
range of power classes. (2)
This value is the maximum feeder loss. (3)
The 45 dB is based on the minimum dynamic range requirements. (4)
Report ITU-R M.2116-1. (5)
Uplink activity factor for TDD mode is defined by the ratio of uplink subframe over the entire frame,
that is uplink plus downlink subframes.
Antenna patterns for use with BWA
The detailed description of omnidirectional antenna pattern is in § 2.1 of Recommendation
ITU-R F.1336-2. It is also considered that the antenna is with improved side-lobe performance.
So, the parameter k is set to 0. Figure 1 shows the omnidirectional base station antenna pattern to be
used.
FIGURE 1
Omnidirectional base station antenna pattern in the vertical plane
0 10 20 30 40 50 60 70 80 90-25
-20
-15
-10
-5
0Normalized radiation pattern of omni-directional antenna, G0=9dBi, k=0
Elevation angle in degrees
Att
enuation in d
B

22 Rep. ITU-R S.2199
The detailed description of sectoral antenna pattern is in § 3.1 of Recommendation ITU-R F.1336-2.
It is assumed that the antenna is with improved side-lobe performance. So, the parameter k is set
to 0. Figure 2 shows the base station sectoral antenna vertical pattern at the horizontal boresight.
Figure 3 shows the base station sectoral antenna vertical pattern at the horizontal 45° relative to the
boresight. Figure 4 shows the base station sectoral antenna horizontal pattern at the vertical
boresight.
FIGURE 2
Base station sectoral antenna vertical pattern at horizontal boresight
FIGURE 3
Base station sectoral antenna vertical pattern at horizontal 45°
relative to the boresight
0 10 20 30 40 50 60 70 80 90-30
-25
-20
-15
-10
-5
0Normalized radiation pattern of sectoral antenna at theta=0, G0=17dBi, k=0
Elevation angle in degrees
Att
enuation in d
B
0 10 20 30 40 50 60 70 80 90-30
-25
-20
-15
-10
-5
0Normalized radiation pattern of sectoral antenna at theta=45, G0=17dBi, k=0
Elevation angle in degrees
Att
enuation in d
B

Rep. ITU-R S.2199 23
FIGURE 4
Base station sectoral antenna horizontal pattern at vertical boresight
Propagation model parameter for use in compatibility studies
TABLE 6
Values of parameters for the use of Recommendation ITU-R P.452-13
Parameter Scenario Value Description
dk (km)
Rural for BS 0.025 Distance from nominal clutter point to rural BS
antenna; same distance for the interfered-with ES
Urban for BS 0.02 Distance from nominal clutter point to urban BS
antenna; same distance for the interfered-with ES
Outdoor for TS 0.02 Distance from nominal clutter point to fixed-outdoor
TS antenna; same distance for the interfered-with ES
Indoor for TS 0.02 Distance from nominal clutter point to fixed-indoor TS
antenna; same distance for the interfered-with ES
ha (m)
Rural for BS 9 Nominal clutter height above local ground level for
rural BS antenna
Urban for BS 20 Nominal clutter height above local ground level for
urban BS antenna
Outdoor for TS 12 Nominal clutter height above local ground level for
fixed-outdoor TS antenna
Indoor for TS 12 Nominal clutter height above local ground level for
fixed-indoor TS antenna
Diameter = 32 m 30 Nominal clutter height above local ground level for
32 m ES antenna
Diameter = 8 m 8 Nominal clutter height above local ground level for
8 m ES antenna
Diameter = 1.2 m 8 Nominal clutter height above local ground level for
1.2 m ES antenna
-200 -150 -100 -50 0 50 100 150 200-20
-18
-16
-14
-12
-10
-8
-6
-4
-2
0Normalized radiation pattern of sectoral antenna at phi=0, G0=17dBi, k=0
Horizontal angle in degrees
Att
enuation in d
B

24 Rep. ITU-R S.2199
TABLE 6 (continued)
Parameter Scenario Value Description
LP (dB) 8 Penetration loss, applied to fixed-indoor TS case
f (GHz) 3.6 Carrier frequency
p (%) 20 Required time percentage for which the calculated
basic transmission loss is not exceeded
φt, φr
(degrees)
40 Latitude of station
ψt, ψr
(degrees)
–100 Longitude of station
hg (m) 20 Smooth-Earth surface above sea level
hm (m) 10 Terrain roughness parameter which is the maximum
height of the terrain above the smooth-Earth surface in
the section of the path
dtm (km) 0.9d Longest continuous land (inland and coastal) section of
the great-circle path, d is the distance between TX and
RX
dlm (km) 0.8d Longest continuous inland section of the great-circle
path, d is the distance between TX and RX
dlt,dlr (km) 0.25d For a transhorizon path, distance from TX and RX to
their respective horizons. For a LoS path, each is set to
the distance from the terminal to the profile point
identified as the principal edge in the diffraction
method for 50% time, d is the distance between TX
and RX. In this study, this parameter is set to 0.25d
θt, θr (mrad) 17.45 For a transhorizon path, transmit and receive horizon
elevation angles respectively. For a LoS path, each is
set to the elevation angle of the other terminal. In this
study, these are set to +1°
θ (mrad) θt+ θr
+103d/αe
Path angular distance. αe is the median value of
effective Earth radius
db (km) 0 Aggregate length of the path sections over water
γo+γw(ρ)
(dB/km)
0.008 Read from Fig. 5 in Recommendation ITU-R P.676-7
(for simplicity)
∆N 50 Refractive index lapse-rate over the first 1 km of the
atmosphere, read from Figs 11 and 12 in
Recommendation ITU-R P.452-13
h1 (m) 15 The first edge height above ground level
h2 (m) 20 The second edge height above ground level
h3 (m) 15 The third edge height above ground level
d1 (km) 0.25d Distance between TX and the first edge
d2 (km) 0.5d Distance between TX and the second edge
d3 (km) 0.75d Distance between TX and the third edge
N0 310 Sea-level surface refractivity, read from Fig. 13 in
Recommendation ITU-R P.452-13
Rep. ITU-R S.2199 25
TABLE 6 (end)
Parameter Scenario Value Description
t (°C) 10 Annual average temperature
Pressure
(hPa)
1 013.25 Standard pressure
With respect to the clutter parameters referenced in Table 6, it should be noted that
Recommendation ITU-R P.452-13 indicates that “where there are doubts as to the certainty of the
clutter environment, the additional loss should not be included”.
Further, the nominal clutter height for the 8 m and 1.2 m FSS earth Station antenna may not be
reasonable to use when these antennas are operating at low elevation angles towards the spacecraft.
Operations at low elevations require site surveys to make sure that there are no obstacles in the path
between the spacecraft and the earth station. And therefore the nominal clutter height would
logically be lower.
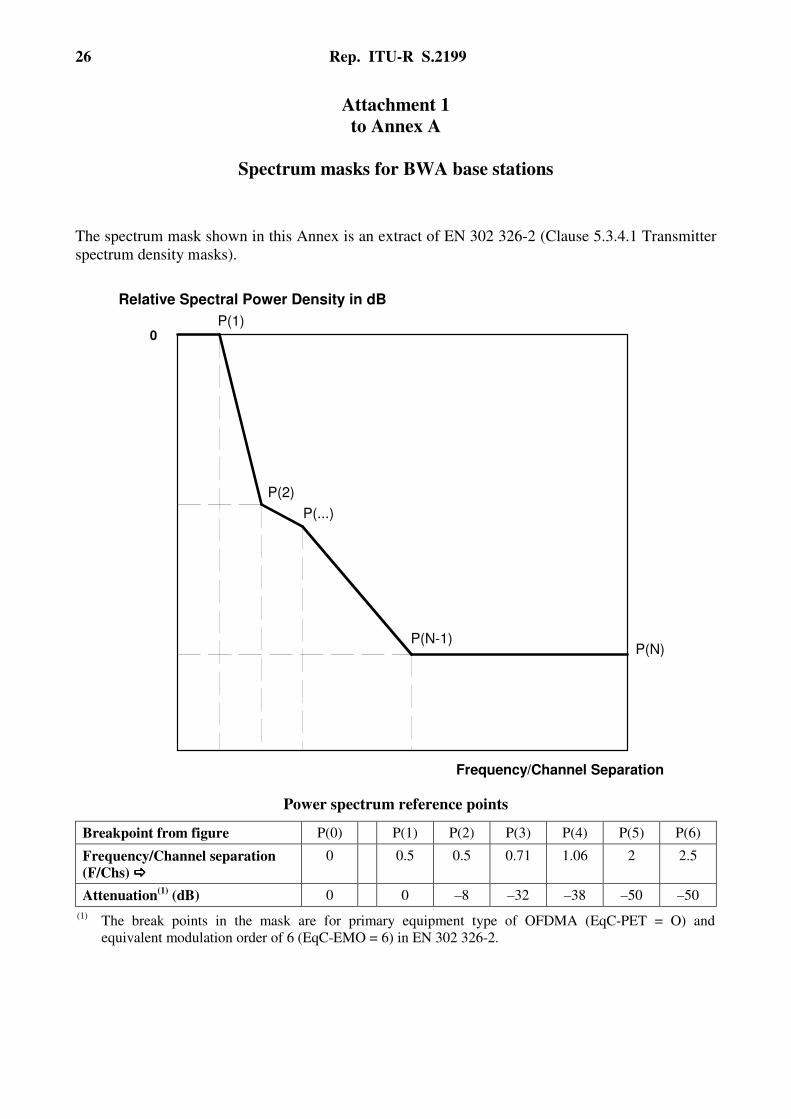
26 Rep. ITU-R S.2199
Attachment 1
to Annex A
Spectrum masks for BWA base stations
The spectrum mask shown in this Annex is an extract of EN 302 326-2 (Clause 5.3.4.1 Transmitter
spectrum density masks).
0
Relative Spectral Power Density in dB
P(1)
P(2)
P(...)
P(N-1)
Frequency/Channel Separation
P(N)
Power spectrum reference points
Breakpoint from figure P(0) P(1) P(2) P(3) P(4) P(5) P(6)
Frequency/Channel separation
(F/Chs) ����
0 0.5 0.5 0.71 1.06 2 2.5
Attenuation(1)
(dB) 0 0 –8 –32 –38 –50 –50
(1) The break points in the mask are for primary equipment type of OFDMA (EqC-PET = O) and
equivalent modulation order of 6 (EqC-EMO = 6) in EN 302 326-2.

Rep. ITU-R S.2199 27
Attachment 2
to Annex A
Spectrum emission mask for terminal station equipment
operating in the band 3 400-3 800 MHz
Emission mask for 7 MHz channel bandwidth
The spectrum emission mask of the terminal station applies to frequency offsets between 3.5 MHz
and 17.5 MHz on both sides of the terminal station centre carrier frequency. The out-of-channel
emission is specified as power level measured over the specified measurement bandwidth relative to
the total mean power of the terminal station carrier measured in the 7 MHz channel.
1. The terminal station emission shall not exceed the levels specified in Table 7. Assuming
specific power classes, relative requirements of Table 7 can be converted to absolute values
for testing purposes.
2. In additions, for centre carrier frequencies within 3 650-3 700 MHz range, all emission
levels shall not exceed –13 dBm/MHz.
TABLE 7
Spectrum emission mask requirement for 7 MHz channel bandwidth
Frequency offset ∆∆∆∆f Minimum requirement Measurement bandwidth
3.5 MHz to 4.75 MHz dBc5.3MHz
5.135.33
−
∆×−−
f 30 kHz
4.75 to 10.5 MHz dBc75.4MHz
5.00.35
−
∆×−−
f 1 MHz
10.5 to 11.9 MHz dBc5.10MHz
70.39
−
∆×−−
f 1 MHz
11.9 to 17.5 MHz –49.0 dBc 1 MHz
NOTE 1 – ∆f is the separation between the carrier frequency and the centre of the measuring filter.
NOTE 2 – The first measurement position with a 30 kHz filter is at ∆f equals to 3.515 MHz; the last is at ∆f
equals to 4.735 MHz.
NOTE 3 – The first measurement position with a 1 MHz filter is at ∆f equals to 5.25 MHz; the last is at ∆f
equals to 17 MHz. As a general rule, the resolution bandwidth of the measuring equipment should be equal
to the measurement bandwidth. To improve measurement accuracy, sensitivity and efficiency, the resolution
bandwidth can be different from the measurement bandwidth. When the resolution bandwidth is smaller
than the measurement bandwidth, the result should be integrated over the measurement bandwidth in order
to obtain the equivalent noise bandwidth of the measurement bandwidth.
NOTE 4 – Note that equivalent PSD type mask can be derived by applying 10*log ((7 MHz)/
(30 kHz)) = 23.7 dB and 10*log((7 MHz)/(1 MHz)) = 8.5 dB scaling factor for 30 kHz and 1 MHz
measurement bandwidth respectively.

28 Rep. ITU-R S.2199
Annex B
Description of studies
1 Introduction
This Annex contains a description of studies (Studies A, B, C and D) that have been provided to
ITU-R , based on the BWA and FSS parameters as contained in Annex A. Further, these studies all
took into account the propagation parameters as contained in that same Annex A. Where these
studies have taken different assumptions, it will be reflected in the relevant summaries.
Attachment 1 contains a description of Study A.
Attachment 2 contains a description of Study B.
Attachment 3 contains a description of Study C.
Attachment 4 contains a description of Study D.
Attachment 1
to Annex B
Study A – Compatibility between BWA systems and FSS earth stations
1 Introduction
This study provides for a selection of these deployment scenarios based on the parameters available
in Annex A of this Report.
The propagation models in Recommendation ITU-R P.452-13 are used in this study.
The assumptions on the parameters can be found in Annex A of this Report.
2 Compatibility study’s methodology and assumptions
In the deterministic case, for each deployment scenario, the minimum separation distance between
BWA BS/TS and FSS ES is derived according to the FSS ES receiver tolerance. The path loss has
to meet the following equation:
tolerancepRXRxMaxFLTXTxMax ILACLRdAPGTXdAPGTXdPL −−−++−++≥ )()()(
The separation distance, d, keeps increasing until the following equation is met,
tolerancepRxMaxFLTxMaxRXTX ILACLRGTXGTXdAPdAPdPL −−−+−+≥−− )()()(
where:
PL(d): Path loss between BWA BS/TS and FSS ES
APTX(d): Normalized BWA BS/TS antenna pattern

Rep. ITU-R S.2199 29
APRX(d): Normalized FSS ES antenna pattern
TX: BWA BS/TS TX power
GTxMax: BWA BS/TS maximum antenna gain
TXFL: BWA BS/TS transmitter feeder loss
GRxMax: FSS ES maximum antenna gain
ACLR: BWA BS/TS adjacent channel leakage ratio; set to 0 for co-channel case
Lp: Penetration loss, only applied to fixed-indoor TS case
Itolerance: Maximum interference FSS ES can tolerate.
2.1 FSS system parameters
The FSS system parameters used in this study are chosen from Table 3 in Annex A of this Report.
Table 8 summarizes the FSS system parameters.
TABLE 8
FSS system parameters
Frequency 3 400-4 200 MHz
(3 600 MHz is used in calculation)
Bandwidth 40 kHz-72 MHz
(7 MHz is used in calculation)
Earth station antenna radiation patterns Recommendation ITU-R S.465
Antenna diameter (m) 1.2 8 32
Maximum antenna gain (dBi) 32.8 47.7 59.8
Antenna centre height (m) 5 5 25
Noise temperature (including the
contributions of the antenna, feed and
LNA/LNB referred to the input of the
LNA/LNB receiver) (K)
100 70 70
Antenna elevation angle (degrees) 5 to 85
Short-term and long-term maximum
permissible Interference level Recommendations ITU-R SF.1006
2.2 FSS earth station maximum permissible interference
Recommendation ITU-R SF.1006 recommends a method to estimate the level of maximum
permissible interference at the input of FSS earth station. The long-term (20% of the time)
maximum permissible interference level is given by:
Pr(20%) = 10 log(kTrB) + J – W dBW
where:
k: Boltzmann’s constant: 1.38×10⁻²³
(J/K)
Tr: noise temperature of receiving system (K)
B: reference bandwidth (Hz) (bandwidth of concern to the FSS system over which
the interference power can be averaged)
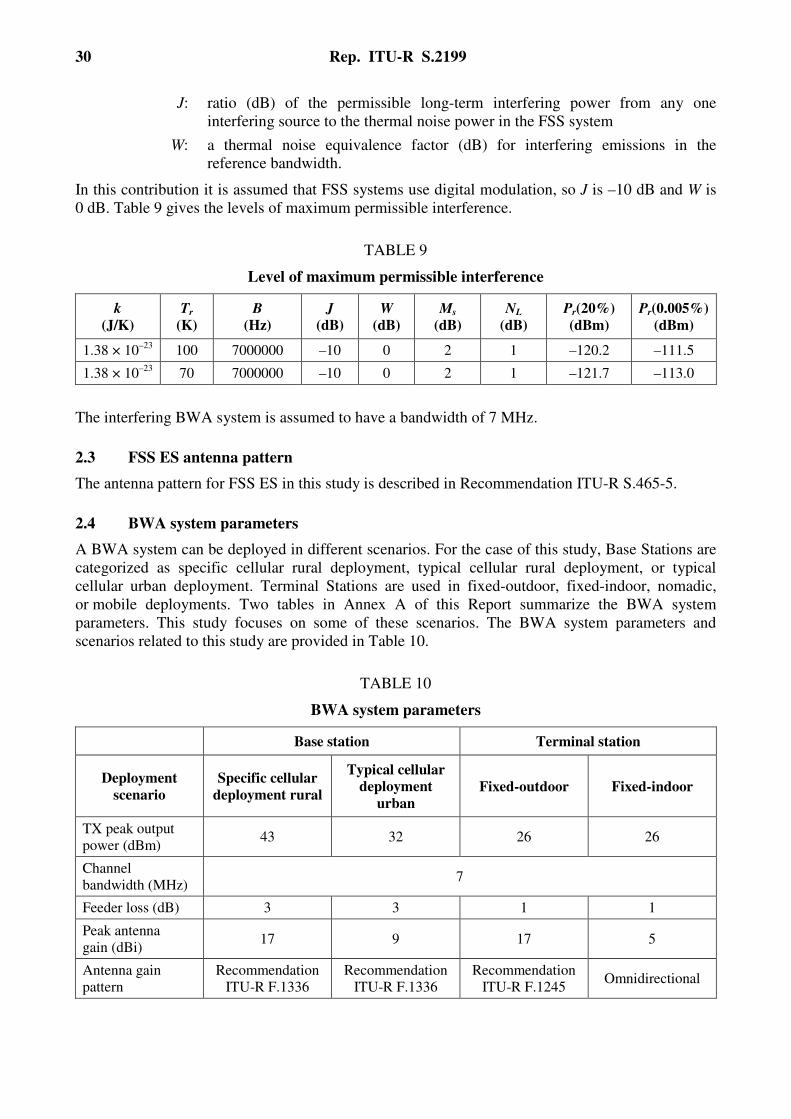
30 Rep. ITU-R S.2199
J: ratio (dB) of the permissible long-term interfering power from any one
interfering source to the thermal noise power in the FSS system
W: a thermal noise equivalence factor (dB) for interfering emissions in the
reference bandwidth.
In this contribution it is assumed that FSS systems use digital modulation, so J is –10 dB and W is
0 dB. Table 9 gives the levels of maximum permissible interference.
TABLE 9
Level of maximum permissible interference
k
(J/K)
Tr
(K)
B
(Hz)
J
(dB)
W
(dB)
Ms
(dB)
NL
(dB)
Pr(20%)
(dBm)
Pr(0.005%)
(dBm)
1.38 × 10⁻²³
100 7000000 –10 0 2 1 –120.2 –111.5
1.38 × 10⁻²³
70 7000000 –10 0 2 1 –121.7 –113.0
The interfering BWA system is assumed to have a bandwidth of 7 MHz.
2.3 FSS ES antenna pattern
The antenna pattern for FSS ES in this study is described in Recommendation ITU-R S.465-5.
2.4 BWA system parameters
A BWA system can be deployed in different scenarios. For the case of this study, Base Stations are
categorized as specific cellular rural deployment, typical cellular rural deployment, or typical
cellular urban deployment. Terminal Stations are used in fixed-outdoor, fixed-indoor, nomadic,
or mobile deployments. Two tables in Annex A of this Report summarize the BWA system
parameters. This study focuses on some of these scenarios. The BWA system parameters and
scenarios related to this study are provided in Table 10.
TABLE 10
BWA system parameters
Base station Terminal station
Deployment
scenario
Specific cellular
deployment rural
Typical cellular
deployment
urban
Fixed-outdoor Fixed-indoor
TX peak output
power (dBm) 43 32 26 26
Channel
bandwidth (MHz) 7
Feeder loss (dB) 3 3 1 1
Peak antenna
gain (dBi) 17 9 17 5
Antenna gain
pattern
Recommendation
ITU-R F.1336
Recommendation
ITU-R F.1336
Recommendation
ITU-R F.1245 Omnidirectional

Rep. ITU-R S.2199 31
TABLE 10 (end)
Base station Terminal station
Deployment
scenario
Specific cellular
deployment rural
Typical cellular
deployment
urban
Fixed-outdoor Fixed-indoor
Antenna 3 dB
beamwidth
(degrees)
60 (sectorized) Omnidirectional 24 N/A
Antenna downtilt
(degrees) 1 4 N/A
Antenna height
a.g.l. (m) 50 15 10 1.5
e.i.r.p. (dBm) 57 38 42 30
Unwanted
emissions
ACLR1 = 51 dB(1)
ACLR2 = 87 dB(1)
or
ACLR1 = 37 dB(2)
ACLR2 = 48 dB(2)
ACLR1 = 33 dB(3)
ACLR2 = 43 dB(3)
N/A: Not applicable. (1)
Report ITU-R M.2116-1. (2)
WiMAX Forum Mobile Radio Specification, WMF-T23-005-R015v04 (2010-09-07). (3)
Report ITU-R M.2116-1.
2.5 BWA base station antenna pattern
Two BWA base station antenna patterns are used in this study, which are described in
Recommendation ITU-R F.1336-2. The antenna for specific cellular rural deployment is a sectoral
antenna with 60° 3-dB beamwidth, while the antenna for typical cellular urban deployment is
considered omnidirectional.
The Figures in Annex A of this Report provide the details of the antenna patterns used.
2.6 BWA terminal station antenna pattern
For fixed-outdoor terminal station, the antenna pattern described in Recommendation ITU-R F.1245
is assumed in this study. For fixed-indoor terminal station, the antenna is considered to be
omnidirectional. Figure 5 shows the antenna pattern for fixed-out door terminal station.
2.7 BWA base station and terminal station out-of-band emission
Annex A of this Report has spectrum masks for BWA base station and terminal station. The
following table gives the ACLR values for base station and terminal station, which are used in this
study. ACLR1 and ACLR2 are for the first adjacent channel and the second adjacent channel
respectively.
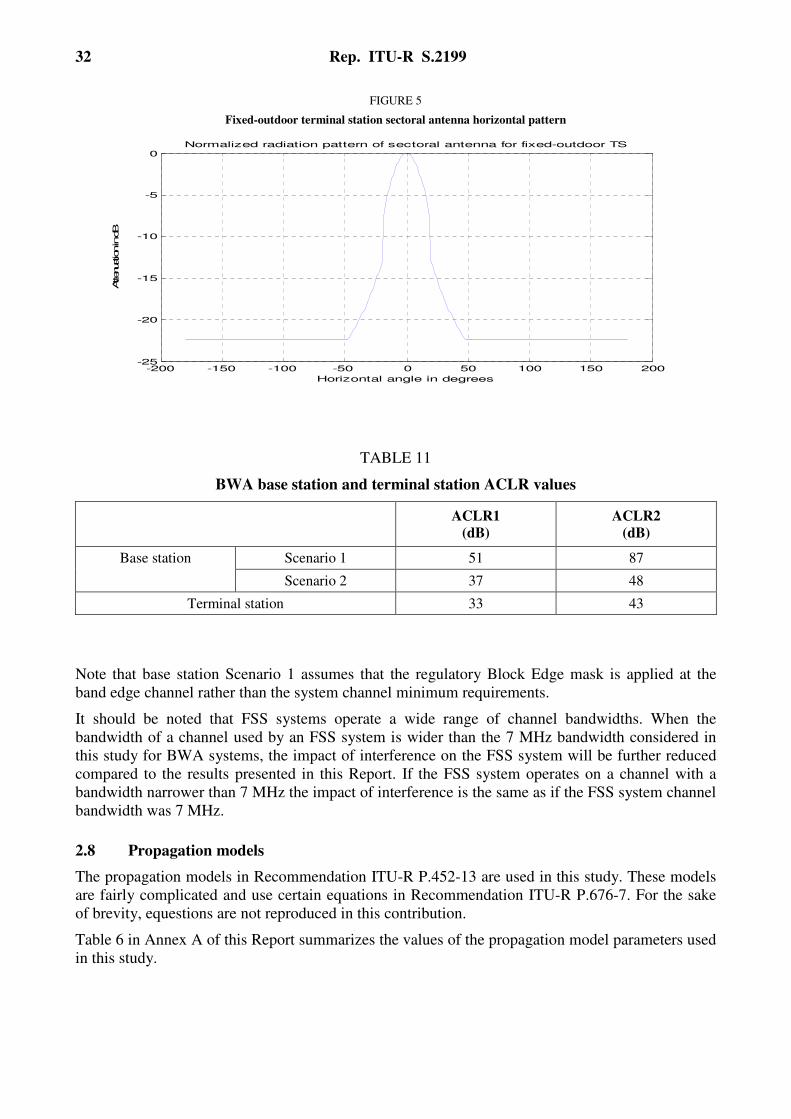
32 Rep. ITU-R S.2199
FIGURE 5
Fixed-outdoor terminal station sectoral antenna horizontal pattern
TABLE 11
BWA base station and terminal station ACLR values
ACLR1
(dB)
ACLR2
(dB)
Base station Scenario 1 51 87
Scenario 2 37 48
Terminal station 33 43
Note that base station Scenario 1 assumes that the regulatory Block Edge mask is applied at the
band edge channel rather than the system channel minimum requirements.
It should be noted that FSS systems operate a wide range of channel bandwidths. When the
bandwidth of a channel used by an FSS system is wider than the 7 MHz bandwidth considered in
this study for BWA systems, the impact of interference on the FSS system will be further reduced
compared to the results presented in this Report. If the FSS system operates on a channel with a
bandwidth narrower than 7 MHz the impact of interference is the same as if the FSS system channel
bandwidth was 7 MHz.
2.8 Propagation models
The propagation models in Recommendation ITU-R P.452-13 are used in this study. These models
are fairly complicated and use certain equations in Recommendation ITU-R P.676-7. For the sake
of brevity, equestions are not reproduced in this contribution.
Table 6 in Annex A of this Report summarizes the values of the propagation model parameters used
in this study.
-200 -150 -100 -50 0 50 100 150 200-25
-20
-15
-10
-5
0Normalized radiation pattern of sectoral antenna for fixed-outdoor TS
Horizontal angle in degrees
Attenuation in dB

Rep. ITU-R S.2199 33
3 Results
Figure 6 illustrates the assumption of horizontal locations and horizontal pointing directions of
interfering and interfered-with systems.
FIGURE 6
BWA BS/TS and FSS ES horizontal pointing positions
In each figure in this section, there are three curves; “co-channel” indicates two systems are
deployed on the same channel, “1st adj ch” indicates two systems are deployed on the adjacent
channels without any guardband, “2nd adj ch” indicates two systems are deployed with 7 MHz
guardband.
3.1 BWA rural BS interfering with 32 m FSS ES
The following three figures show the minimum required distance in km between BWA rural BS
with scenario 1 ACLR values and 32 m FSS ES with 5º, 25º, and 50º elevation pointing direction,
respectively. The BS antenna horizontal pointing direction is from 0º to 180º.
0 20 40 60 80 100 120 140 160 18010
-1
100
101
102
103
Interferer horizontal pointing angle in degree
R e q
m
i n
d i n k m
Required min distance for different channel spacing
co-channel
1st adj ch
2nd adj ch
BWA
BS/TS
FSS ES
0º
90º
180180
BWA BS/TS
omni-directional
FSS ES
180

34 Rep. ITU-R S.2199
The following three figures show the minimum required distance in km between BWA rural BS
with Scenario 2 ACLR values and 32 m FSS ES with 5º, 25º, and 50º elevation pointing direction,
respectively. The BS antenna horizontal pointing direction is from 0º to 180º.
0 20 40 60 80 100 120 140 160 18010
-1
100
101
102
103
Interferer horizontal pointing angle in degree
R e q
m
i n
d i n k m
Required min distance for different channel spacing
co-channel
1st adj ch
2nd adj ch
0 20 40 60 80 100 120 140 160 18010
-1
100
101
102
103
Interferer horizontal pointing angle in degree
R e q
m
i n
d i n k m
Required min distance for different channel spacing
co-channel
1st adj ch
2nd adj ch

Rep. ITU-R S.2199 35
0 20 40 60 80 100 120 140 160 18010
0
101
102
103
Interferer horizontal pointing angle in degree
R e q
m
i n
d i n k m
Required min distance for different channel spacing
co-channel
1st adj ch
2nd adj ch
0 20 40 60 80 100 120 140 160 18010
0
101
102
103
Interferer horizontal pointing angle in degree
R e q
m
i n
d i n k m
Required min distance for different channel spacing
co-channel
1st adj ch
2nd adj ch
0 20 40 60 80 100 120 140 160 18010
0
101
102
103
Interferer horizontal pointing angle in degree
R e q
m
i n
d i n k m
Required min distance for different channel spacing
co-channel
1st adj ch
2nd adj ch
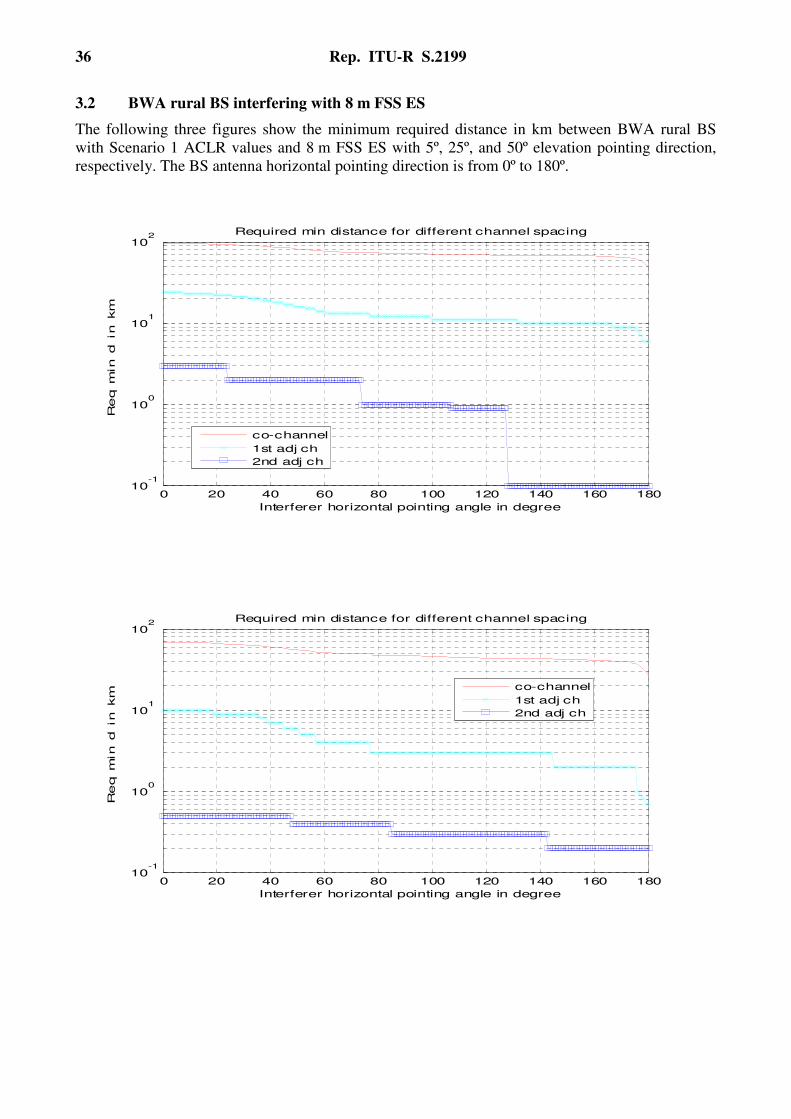
36 Rep. ITU-R S.2199
3.2 BWA rural BS interfering with 8 m FSS ES
The following three figures show the minimum required distance in km between BWA rural BS
with Scenario 1 ACLR values and 8 m FSS ES with 5º, 25º, and 50º elevation pointing direction,
respectively. The BS antenna horizontal pointing direction is from 0º to 180º.
0 20 40 60 80 100 120 140 160 18010
-1
100
101
102
Interferer horizontal pointing angle in degree
R e q
m
i n
d i n k m
Required min distance for different channel spacing
co-channel
1st adj ch
2nd adj ch
0 20 40 60 80 100 120 140 160 18010
-1
100
101
102
Interferer horizontal pointing angle in degree
R e q
m
i n
d i n k m
Required min distance for different channel spacing
co-channel
1st adj ch
2nd adj ch
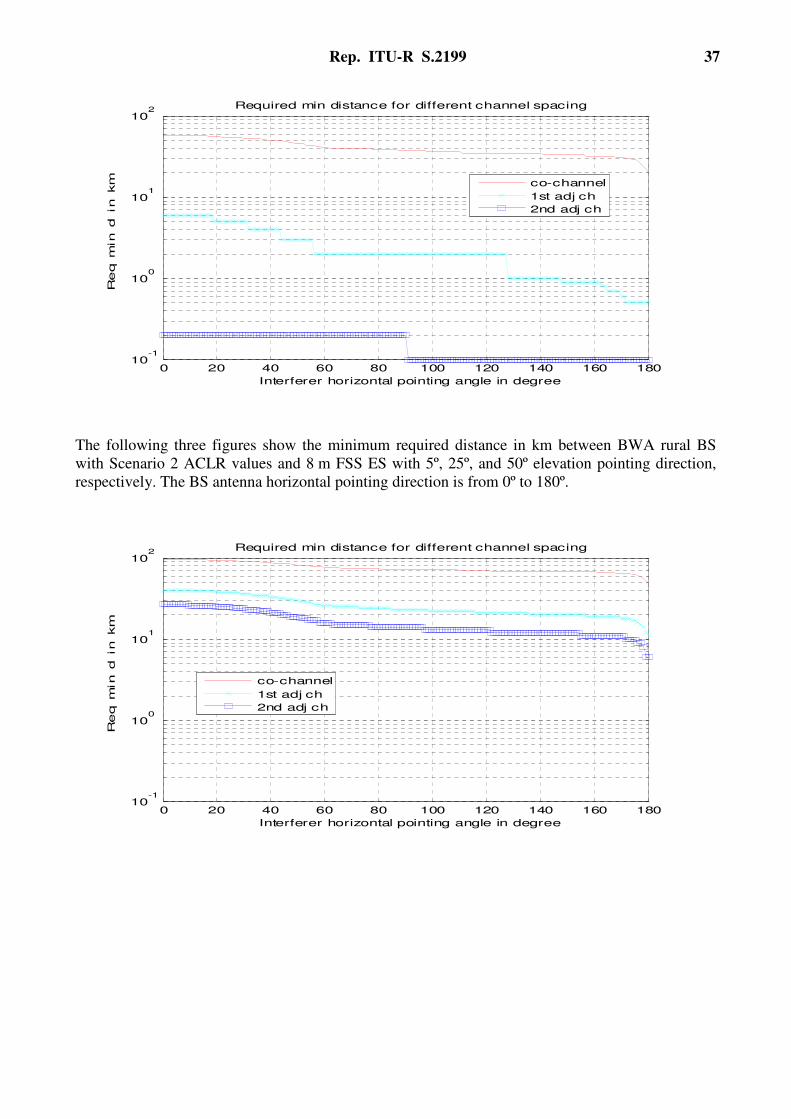
Rep. ITU-R S.2199 37
The following three figures show the minimum required distance in km between BWA rural BS
with Scenario 2 ACLR values and 8 m FSS ES with 5º, 25º, and 50º elevation pointing direction,
respectively. The BS antenna horizontal pointing direction is from 0º to 180º.
0 20 40 60 80 100 120 140 160 18010
-1
100
101
102
Interferer horizontal pointing angle in degree
R e q
m
i n
d i n k m
Required min distance for different channel spacing
co-channel
1st adj ch
2nd adj ch
0 20 40 60 80 100 120 140 160 18010
-1
100
101
102
Interferer horizontal pointing angle in degree
R e q
m
i n
d i n k m
Required min distance for different channel spacing
co-channel
1st adj ch
2nd adj ch

38 Rep. ITU-R S.2199
3.3 BWA rural BS interfering with 1.2 m FSS ES
The following three figures show the minimum required distance in km between BWA rural BS
with Scenario 1 ACLR values and 1.2 m FSS ES with 5º, 25º, and 50º elevation pointing direction,
respectively. The BS antenna horizontal pointing direction is from 0º to 180º.
0 20 40 60 80 100 120 140 160 18010
-1
100
101
102
Interferer horizontal pointing angle in degree
R e q
m
i n
d i n k m
Required min distance for different channel spacing
co-channel
1st adj ch
2nd adj ch
0 20 40 60 80 100 120 140 160 18010
-1
100
101
102
Interferer horizontal pointing angle in degree
R e q
m
i n
d i n k m
Required min distance for different channel spacing
co-channel
1st adj ch
2nd adj ch
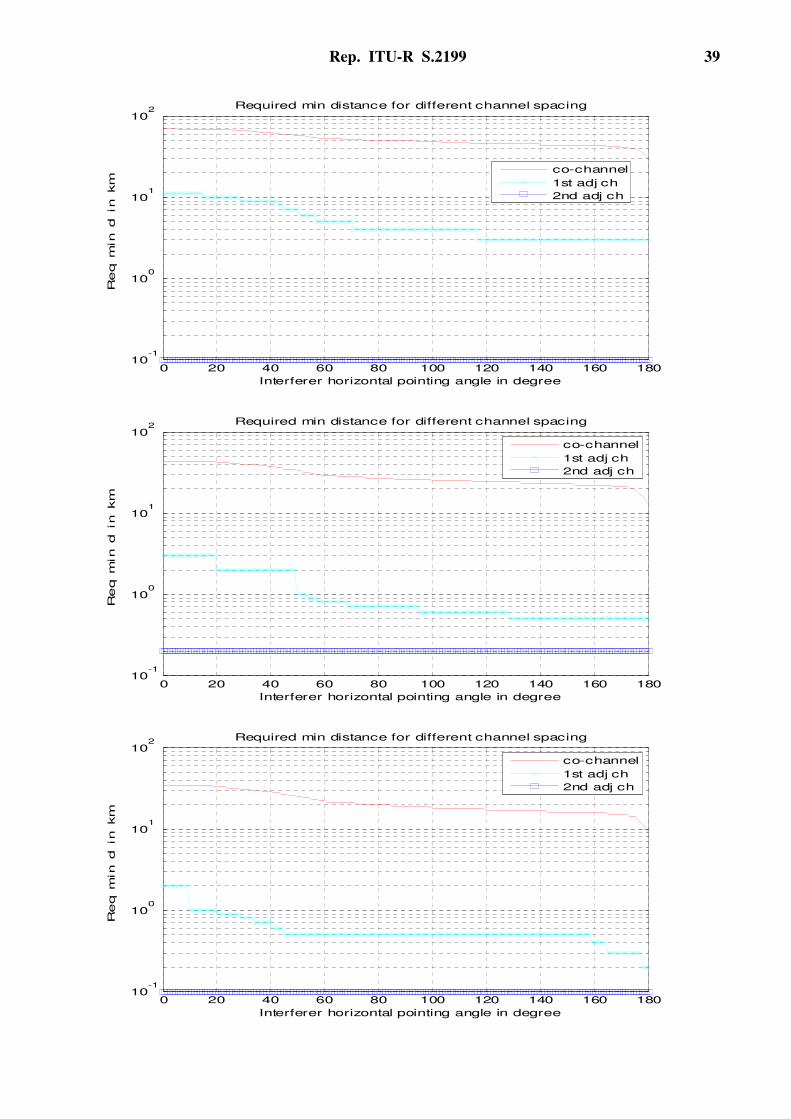
Rep. ITU-R S.2199 39
0 20 40 60 80 100 120 140 160 18010
-1
100
101
102
Interferer horizontal pointing angle in degree
R e q
m
i n
d i n k m
Required min distance for different channel spacing
co-channel
1st adj ch
2nd adj ch
0 20 40 60 80 100 120 140 160 18010
-1
100
101
102
Interferer horizontal pointing angle in degree
R e q
m
i n
d i n k m
Required min distance for different channel spacing
co-channel
1st adj ch
2nd adj ch
0 20 40 60 80 100 120 140 160 18010
-1
100
101
102
Interferer horizontal pointing angle in degree
R e q
m
i n
d i n k m
Required min distance for different channel spacing
co-channel
1st adj ch
2nd adj ch
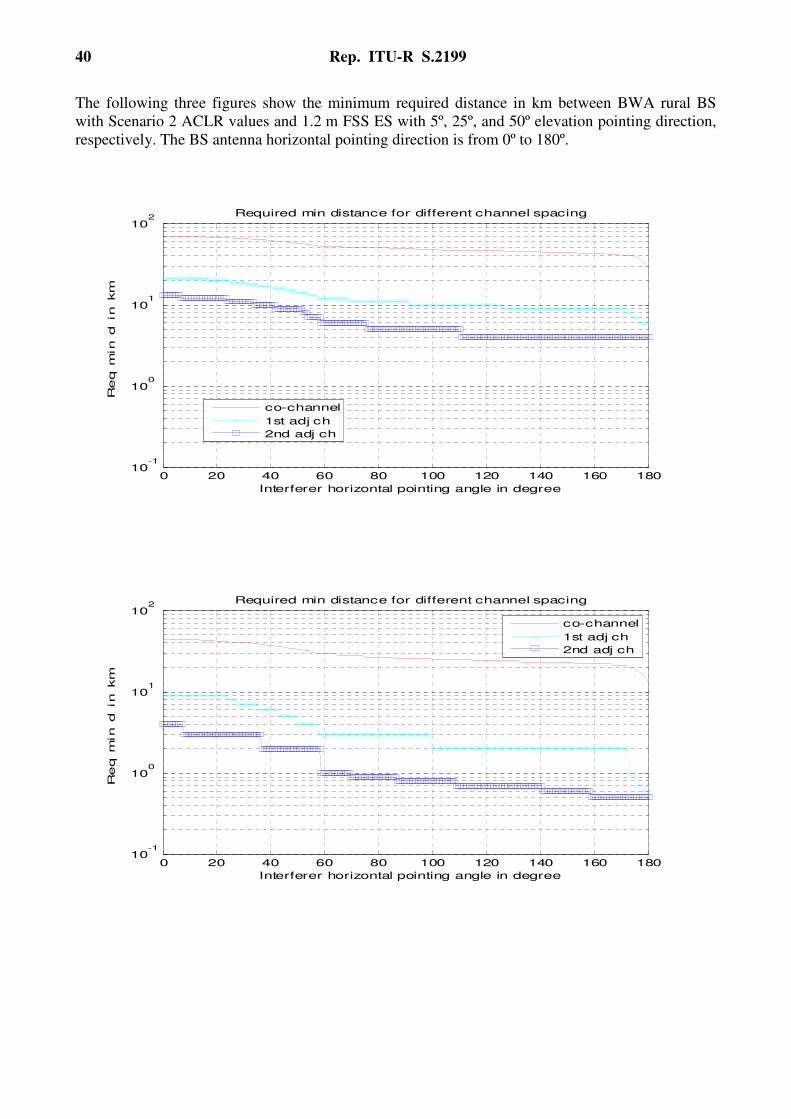
40 Rep. ITU-R S.2199
The following three figures show the minimum required distance in km between BWA rural BS
with Scenario 2 ACLR values and 1.2 m FSS ES with 5º, 25º, and 50º elevation pointing direction,
respectively. The BS antenna horizontal pointing direction is from 0º to 180º.
0 20 40 60 80 100 120 140 160 18010
-1
100
101
102
Interferer horizontal pointing angle in degree
R e q
m
i n
d i n k m
Required min distance for different channel spacing
co-channel
1st adj ch
2nd adj ch
0 20 40 60 80 100 120 140 160 18010
-1
100
101
102
Interferer horizontal pointing angle in degree
R e q
m
i n
d i n k m
Required min distance for different channel spacing
co-channel
1st adj ch
2nd adj ch

Rep. ITU-R S.2199 41
3.4 BWA urban BS interfering with 32 m FSS ES
The following figure shows the minimum required distance in km between BWA urban BS with
Scenario 1 ACLR values and 32 m FSS ES with 5º to 85º elevation pointing direction.
The following figure shows the minimum required distance in km between BWA urban BS with
Scenario 2 ACLR values and 32 m FSS ES with 5º to 85º elevation pointing direction.
0 20 40 60 80 100 120 140 160 18010
-1
100
101
102
Interferer horizontal pointing angle in degree
R e q
m
i n
d i n k m
Required min distance for different channel spacing
co-channel
1st adj ch
2nd adj ch
0 10 20 30 40 50 60 70 80 9010
-1
100
101
102
FSS ES elevation pointing angle in degree
R e q
m
i n
d i n k m
Required min distance for different channel spacing
co-channel
1st adj ch
2nd adj ch
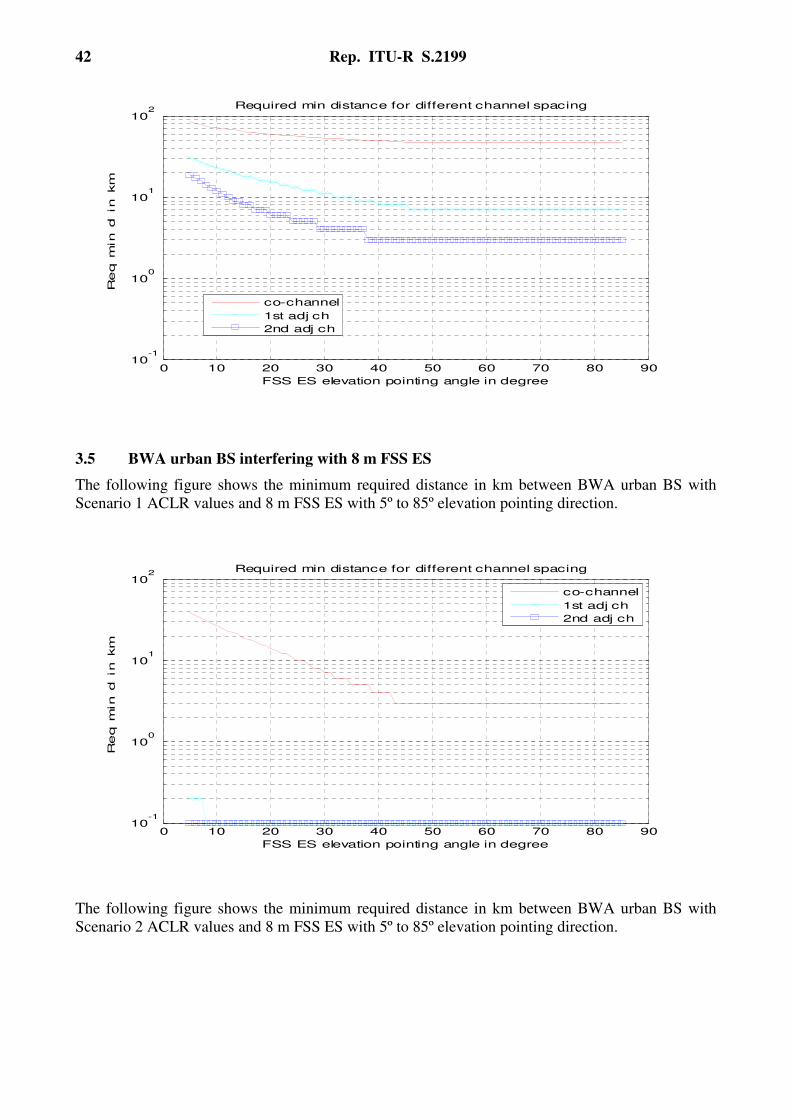
42 Rep. ITU-R S.2199
3.5 BWA urban BS interfering with 8 m FSS ES
The following figure shows the minimum required distance in km between BWA urban BS with
Scenario 1 ACLR values and 8 m FSS ES with 5º to 85º elevation pointing direction.
The following figure shows the minimum required distance in km between BWA urban BS with
Scenario 2 ACLR values and 8 m FSS ES with 5º to 85º elevation pointing direction.
0 10 20 30 40 50 60 70 80 9010
-1
100
101
102
FSS ES elevation pointing angle in degree
R e q
m
i n
d i n k m
Required min distance for different channel spacing
co-channel
1st adj ch
2nd adj ch
0 10 20 30 40 50 60 70 80 9010
-1
100
101
102
FSS ES elevation pointing angle in degree
R e q
m
i n
d i n k m
Required min distance for different channel spacing
co-channel
1st adj ch
2nd adj ch

Rep. ITU-R S.2199 43
Note that distances below 100 m are not considered in the calculation of required separation
distances.
3.6 BWA urban BS interfering with 1.2 m FSS ES
The following figure shows the minimum required distance in km between BWA urban BS with
Scenario 1 ACLR values and 1.2 m FSS ES with 5º to 85º elevation pointing direction.
The following figure shows the minimum required distance in km between BWA urban BS with
Scenario 2 ACLR values and 1.2 m FSS ES with 5º to 85º elevation pointing direction.
0 10 20 30 40 50 60 70 80 9010
-1
100
101
102
FSS ES elevation pointing angle in degree
R e q
m
i n
d i n k m
Required min distance for different channel spacing
co-channel
1st adj ch
2nd adj ch
0 10 20 30 40 50 60 70 80 9010
-1
100
101
102
FSS ES elevation pointing angle in degree
R e q
m
i n
d i n k m
Required min distance for different channel spacing
co-channel
1st adj ch
2nd adj ch
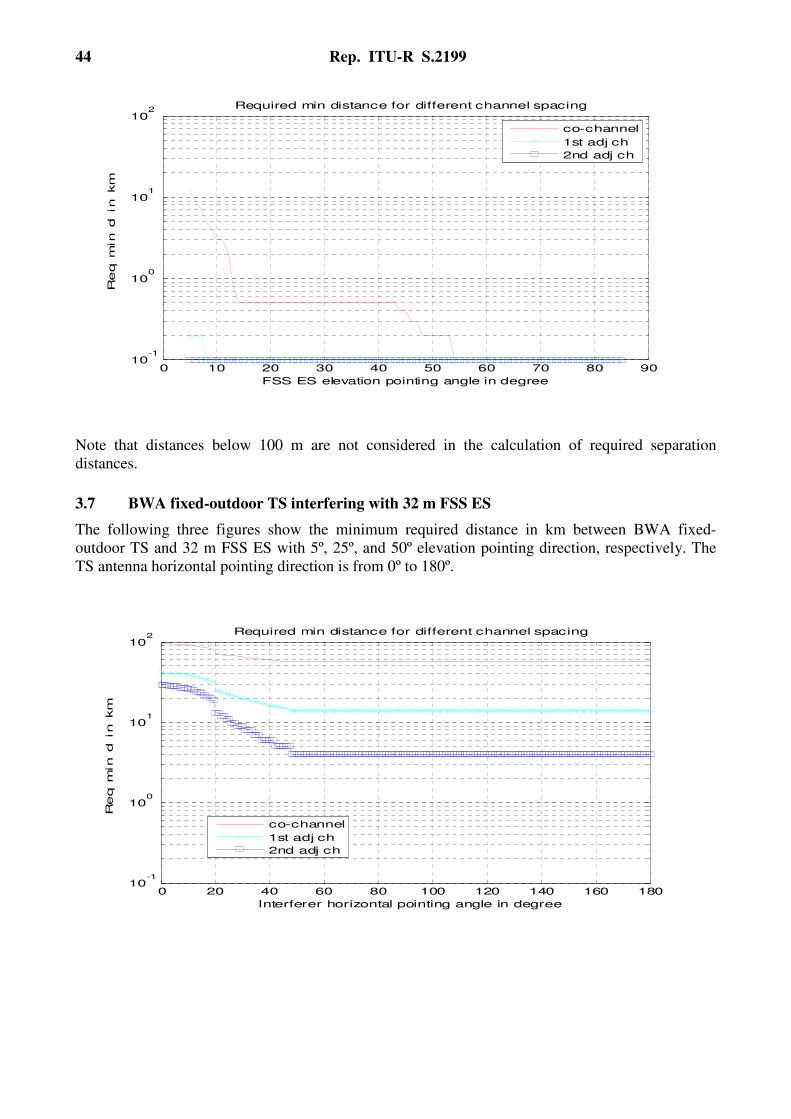
44 Rep. ITU-R S.2199
Note that distances below 100 m are not considered in the calculation of required separation
distances.
3.7 BWA fixed-outdoor TS interfering with 32 m FSS ES
The following three figures show the minimum required distance in km between BWA fixed-
outdoor TS and 32 m FSS ES with 5º, 25º, and 50º elevation pointing direction, respectively. The
TS antenna horizontal pointing direction is from 0º to 180º.
0 10 20 30 40 50 60 70 80 9010
-1
100
101
102
FSS ES elevation pointing angle in degree
R e q
m
i n
d i n k m
Required min distance for different channel spacing
co-channel
1st adj ch
2nd adj ch
0 20 40 60 80 100 120 140 160 18010
-1
100
101
102
Interferer horizontal pointing angle in degree
R e q m
i n d i n k m
Required min distance for different channel spacing
co-channel
1st adj ch
2nd adj ch

Rep. ITU-R S.2199 45
Note that distances below 100 m are not considered in the calculation of required separation
distances.
3.8 BWA fixed-outdoor TS interfering with 8 m FSS ES
The following three figures show the minimum required distance in km between BWA fixed-
outdoor TS and 8 m FSS ES with 5º, 25º, and 50º elevation pointing direction, respectively. The TS
antenna horizontal pointing direction is from 0º to 180º.
0 20 40 60 80 100 120 140 160 18010
-1
100
101
102
Interferer horizontal pointing angle in degree
R e q
m
i n
d i n k m
Required min distance for different channel spacing
co-channel
1st adj ch
2nd adj ch
0 20 40 60 80 100 120 140 160 18010
-1
100
101
102
Interferer horizontal pointing angle in degree
R e q
m
i n
d i n k m
Required min distance for different channel spacing
co-channel
1st adj ch
2nd adj ch

46 Rep. ITU-R S.2199
f
f
0 20 40 60 80 100 120 140 160 18010
-1
100
101
102
Interferer horizontal pointing angle in degree
R e q
m
i n
d i n k m
Required min distance for different channel spacing
co-channel
1st adj ch
2nd adj ch
0 20 40 60 80 100 120 140 160 18010
-1
100
101
102
Interferer horizontal pointing angle in degree
R e q
m
i n
d i n k m
Required min distance for different channel spacing
co-channel
1st adj ch
2nd adj ch
0 20 40 60 80 100 120 140 160 18010
-1
100
101
102
Interferer horizontal pointing angle in degree
R e q
m
i n
d i n k m
Required min distance for different channel spacing
co-channel
1st adj ch
2nd adj ch
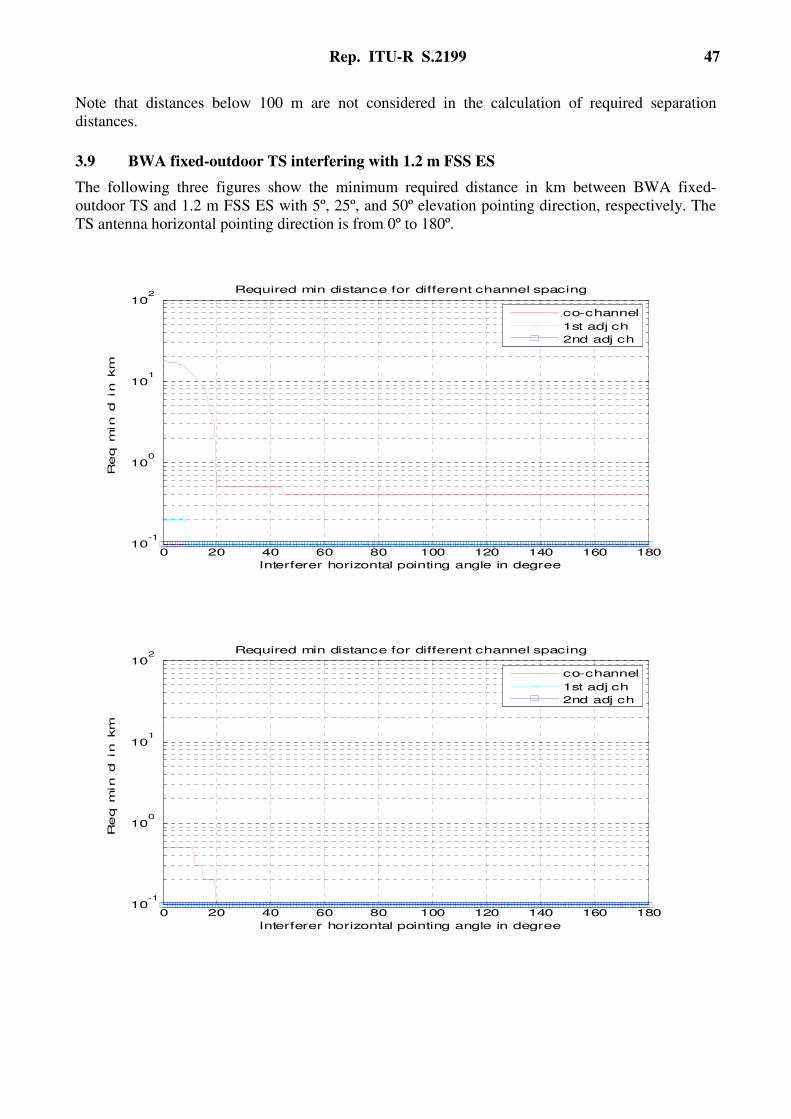
Rep. ITU-R S.2199 47
Note that distances below 100 m are not considered in the calculation of required separation
distances.
3.9 BWA fixed-outdoor TS interfering with 1.2 m FSS ES
The following three figures show the minimum required distance in km between BWA fixed-
outdoor TS and 1.2 m FSS ES with 5º, 25º, and 50º elevation pointing direction, respectively. The
TS antenna horizontal pointing direction is from 0º to 180º.
0 20 40 60 80 100 120 140 160 18010
-1
100
101
102
Interferer horizontal pointing angle in degree
R e q
m
i n
d i n k m
Required min distance for different channel spacing
co-channel
1st adj ch
2nd adj ch
0 20 40 60 80 100 120 140 160 18010
-1
100
101
102
Interferer horizontal pointing angle in degree
R e q
m
i n
d i n k m
Required min distance for different channel spacing
co-channel
1st adj ch
2nd adj ch

48 Rep. ITU-R S.2199
Note that distances below 100 m are not considered in the calculation of required separation
distances.
3.10 BWA fixed-indoor TS interfering with 32 m FSS ES
The following figure shows the minimum required distance in km between BWA fixed-indoor TS
and 32 m FSS ES with 5º to 85º elevation pointing direction.
Note that distances below 100 m are not considered in the calculation of required separation
distances.
3.11 BWA fixed-indoor TS interfering with 8 m FSS ES
The following figure shows the minimum required distance in km between BWA fixed-indoor TS
and 8 m FSS ES with 5º to 85º elevation pointing direction.
0 20 40 60 80 100 120 140 160 18010
-1
100
101
102
Interferer horizontal pointing angle in degree
R e q
m
i n
d i n k m
Required min distance for different channel spacing
co-channel
1st adj ch
2nd adj ch
0 10 20 30 40 50 60 70 80 9010
-1
100
101
102
FSS ES elevation pointing angle in degree
R e q
m
i n
d i n k m
Required min distance for different channel spacing
co-channel
1st adj ch
2nd adj ch
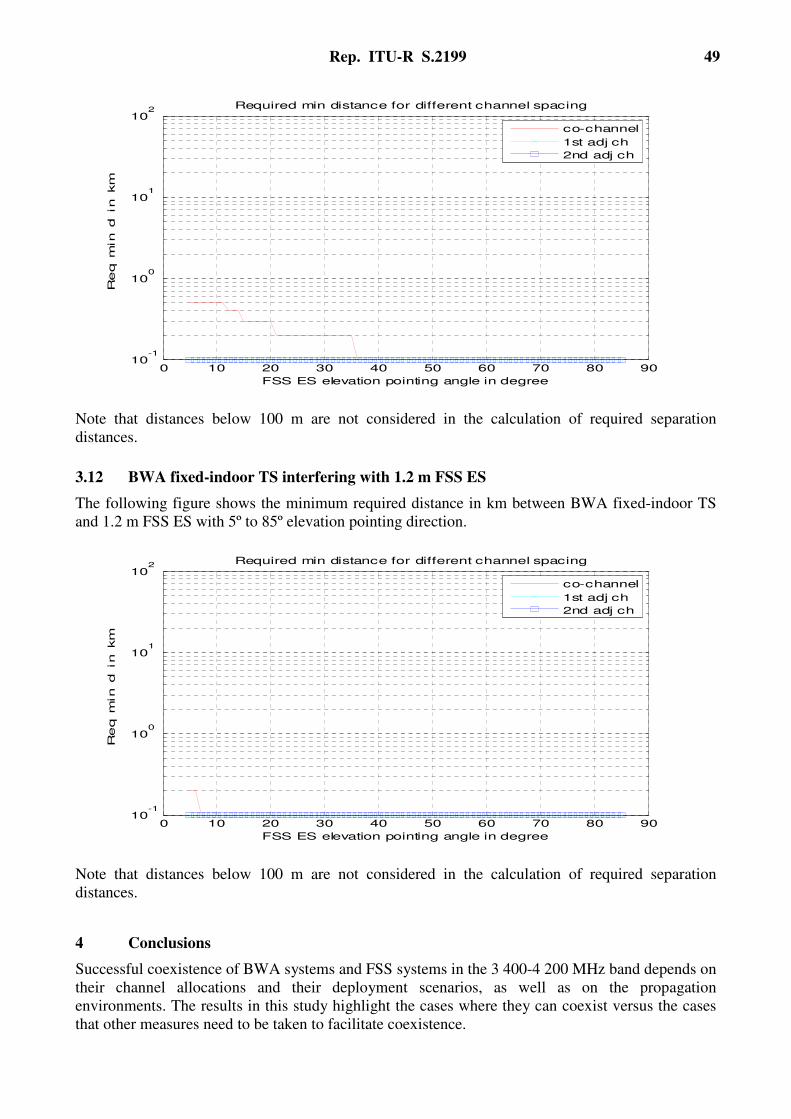
Rep. ITU-R S.2199 49
Note that distances below 100 m are not considered in the calculation of required separation
distances.
3.12 BWA fixed-indoor TS interfering with 1.2 m FSS ES
The following figure shows the minimum required distance in km between BWA fixed-indoor TS
and 1.2 m FSS ES with 5º to 85º elevation pointing direction.
Note that distances below 100 m are not considered in the calculation of required separation
distances.
4 Conclusions
Successful coexistence of BWA systems and FSS systems in the 3 400-4 200 MHz band depends on
their channel allocations and their deployment scenarios, as well as on the propagation
environments. The results in this study highlight the cases where they can coexist versus the cases
that other measures need to be taken to facilitate coexistence.
0 10 20 30 40 50 60 70 80 9010
-1
100
101
102
FSS ES elevation pointing angle in degree
R e q
m
i n
d i n k m
Required min distance for different channel spacing
co-channel
1st adj ch
2nd adj ch
0 10 20 30 40 50 60 70 80 9010
-1
100
101
102
FSS ES elevation pointing angle in degree
R e q
m
i n
d i n k m
Required min distance for different channel spacing
co-channel
1st adj ch
2nd adj ch
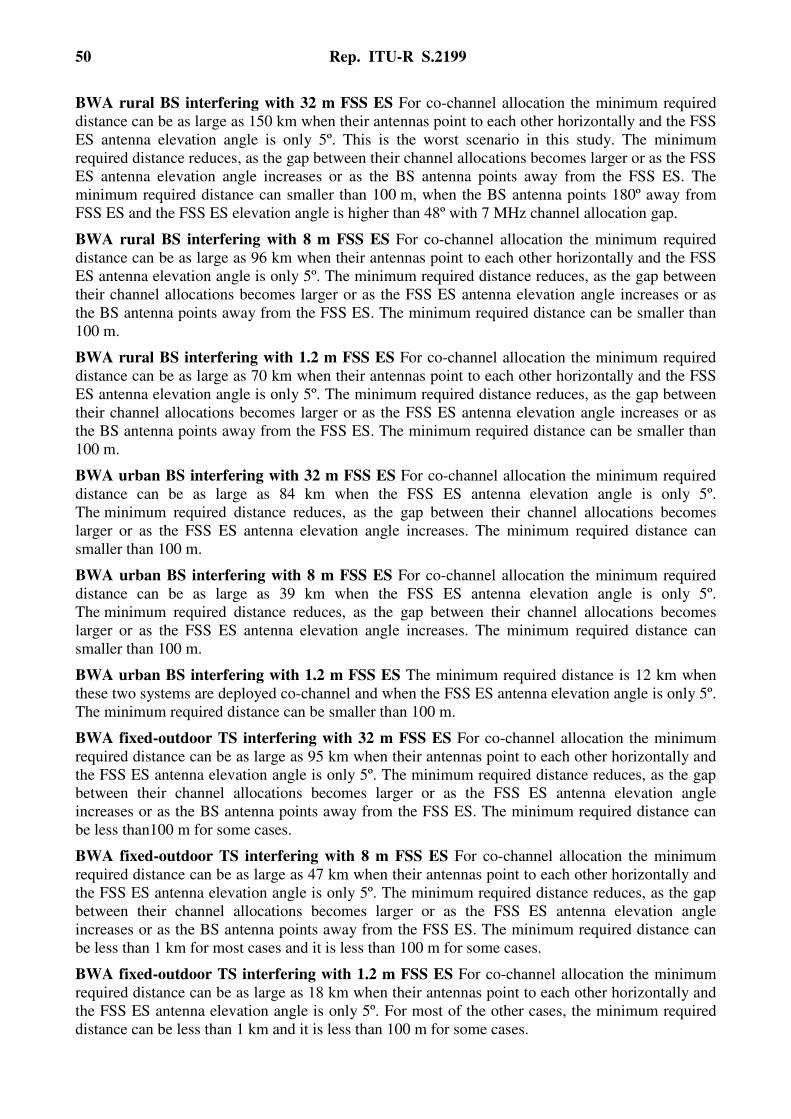
50 Rep. ITU-R S.2199
BWA rural BS interfering with 32 m FSS ES For co-channel allocation the minimum required
distance can be as large as 150 km when their antennas point to each other horizontally and the FSS
ES antenna elevation angle is only 5º. This is the worst scenario in this study. The minimum
required distance reduces, as the gap between their channel allocations becomes larger or as the FSS
ES antenna elevation angle increases or as the BS antenna points away from the FSS ES. The
minimum required distance can smaller than 100 m, when the BS antenna points 180º away from
FSS ES and the FSS ES elevation angle is higher than 48º with 7 MHz channel allocation gap.
BWA rural BS interfering with 8 m FSS ES For co-channel allocation the minimum required
distance can be as large as 96 km when their antennas point to each other horizontally and the FSS
ES antenna elevation angle is only 5º. The minimum required distance reduces, as the gap between
their channel allocations becomes larger or as the FSS ES antenna elevation angle increases or as
the BS antenna points away from the FSS ES. The minimum required distance can be smaller than
100 m.
BWA rural BS interfering with 1.2 m FSS ES For co-channel allocation the minimum required
distance can be as large as 70 km when their antennas point to each other horizontally and the FSS
ES antenna elevation angle is only 5º. The minimum required distance reduces, as the gap between
their channel allocations becomes larger or as the FSS ES antenna elevation angle increases or as
the BS antenna points away from the FSS ES. The minimum required distance can be smaller than
100 m.
BWA urban BS interfering with 32 m FSS ES For co-channel allocation the minimum required
distance can be as large as 84 km when the FSS ES antenna elevation angle is only 5º.
The minimum required distance reduces, as the gap between their channel allocations becomes
larger or as the FSS ES antenna elevation angle increases. The minimum required distance can
smaller than 100 m.
BWA urban BS interfering with 8 m FSS ES For co-channel allocation the minimum required
distance can be as large as 39 km when the FSS ES antenna elevation angle is only 5º.
The minimum required distance reduces, as the gap between their channel allocations becomes
larger or as the FSS ES antenna elevation angle increases. The minimum required distance can
smaller than 100 m.
BWA urban BS interfering with 1.2 m FSS ES The minimum required distance is 12 km when
these two systems are deployed co-channel and when the FSS ES antenna elevation angle is only 5º.
The minimum required distance can be smaller than 100 m.
BWA fixed-outdoor TS interfering with 32 m FSS ES For co-channel allocation the minimum
required distance can be as large as 95 km when their antennas point to each other horizontally and
the FSS ES antenna elevation angle is only 5º. The minimum required distance reduces, as the gap
between their channel allocations becomes larger or as the FSS ES antenna elevation angle
increases or as the BS antenna points away from the FSS ES. The minimum required distance can
be less than100 m for some cases.
BWA fixed-outdoor TS interfering with 8 m FSS ES For co-channel allocation the minimum
required distance can be as large as 47 km when their antennas point to each other horizontally and
the FSS ES antenna elevation angle is only 5º. The minimum required distance reduces, as the gap
between their channel allocations becomes larger or as the FSS ES antenna elevation angle
increases or as the BS antenna points away from the FSS ES. The minimum required distance can
be less than 1 km for most cases and it is less than 100 m for some cases.
BWA fixed-outdoor TS interfering with 1.2 m FSS ES For co-channel allocation the minimum
required distance can be as large as 18 km when their antennas point to each other horizontally and
the FSS ES antenna elevation angle is only 5º. For most of the other cases, the minimum required
distance can be less than 1 km and it is less than 100 m for some cases.

Rep. ITU-R S.2199 51
BWA fixed-indoor TS interfering with 32 m FSS ES For co-channel allocation the minimum
required distance can be as large as 27 km when the FSS ES antenna elevation angle is only 5º.
The minimum required distance reduces, as the gap between their channel allocations becomes
larger or as the FSS ES antenna elevation angle increases. The minimum required distance can be
less than 100 m for most cases.
BWA fixed-indoor TS interfering with 8 m FSS ES For co-channel allocation the minimum
required distance can be as large as 500 m when the FSS ES antenna elevation angle is very small.
For most of the other cases the minimum required distance is less than 100 m.
BWA fixed-indoor TS interfering with 1.2 m FSS ES The minimum required distance is 200 m
when these two systems are deployed co-channel and when the FSS ES antenna elevation angle is
only 5º or 6º. For all other cases the minimum required distance is less than 100 m.
Attachment 2
to Annex B
Description of Study B
Evaluation of Study A with BWA antenna
patterns and propagation model parameters
1 Introduction
This Report evaluates the results from the study in Attachment 1 of Annex B5 by comparing them
with results from simulations performed with a commercial off-the-shelf (COTS) software tool that
has the capability for implementing all of the BWA and FSS characteristics, as well as the BWA
base station antenna patterns and Recommendation ITU-R P.452-13.
2 Evaluation of parameters used in Recommendation ITU-R P.452-13
The software tool used for the simulations in this document has an implementation of
Recommendation ITU-R P.452-13. Most of the parameters that are used for this Recommendation
can be manually configured. However, as the software tool makes use of actual terrain data, when
available, not all the parameters related to a number of parameters can be manually configured.
Table 12 details for every parameter, as contained in Table 6 of Annex A of this Report, whether
the implementation of the Recommendation ITU-R P.452-13 allowed for manual configuration of
this parameter. In the case it was not possible, additional explanatory comments will be given.
5 The comparison referenced in this study is based on a comparison with the study A results based on
certain assumed ACLR values. It should be noted that, since this comparative study was made, the ACLR
values that were used in Study A have been revised as reflected in Tables 4 and 5 of Annex A to this
Report.
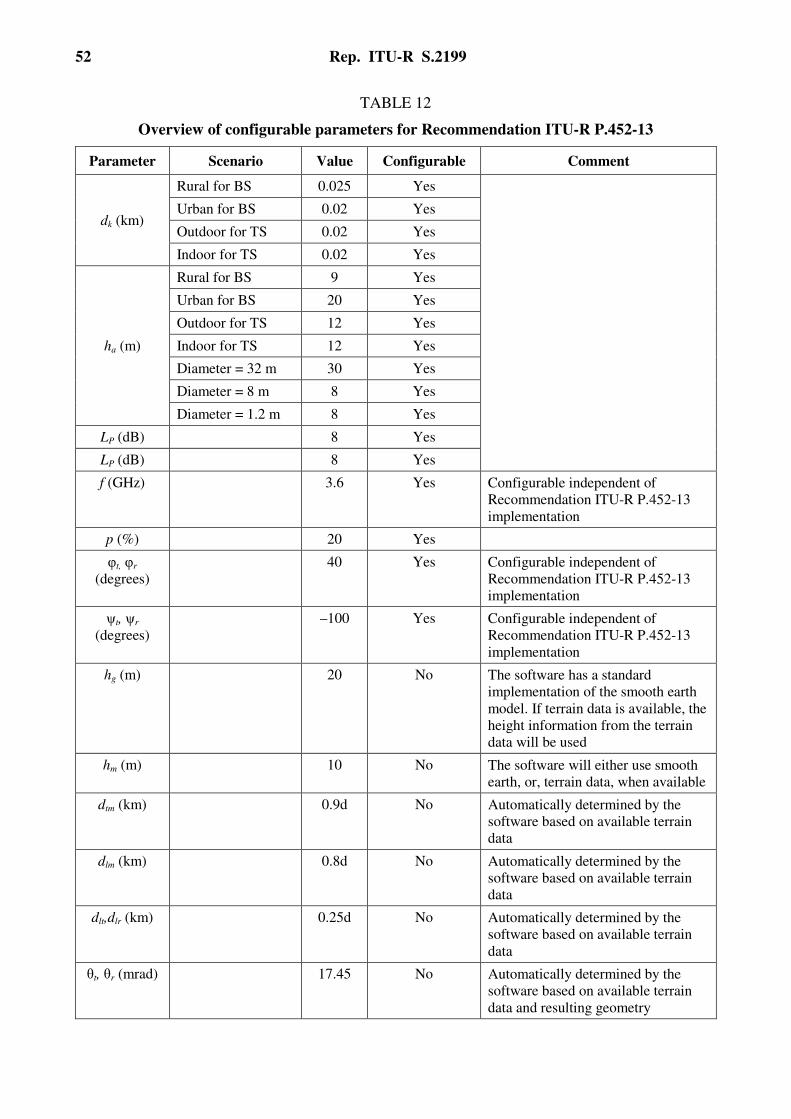
52 Rep. ITU-R S.2199
TABLE 12
Overview of configurable parameters for Recommendation ITU-R P.452-13
Parameter Scenario Value Configurable Comment
dk (km)
Rural for BS 0.025 Yes
Urban for BS 0.02 Yes
Outdoor for TS 0.02 Yes
Indoor for TS 0.02 Yes
ha (m)
Rural for BS 9 Yes
Urban for BS 20 Yes
Outdoor for TS 12 Yes
Indoor for TS 12 Yes
Diameter = 32 m 30 Yes
Diameter = 8 m 8 Yes
Diameter = 1.2 m 8 Yes
LP (dB) 8 Yes
LP (dB) 8 Yes
f (GHz) 3.6 Yes Configurable independent of
Recommendation ITU-R P.452-13
implementation
p (%) 20 Yes
φt, φr
(degrees)
40 Yes Configurable independent of
Recommendation ITU-R P.452-13
implementation
ψt, ψr
(degrees)
–100 Yes Configurable independent of
Recommendation ITU-R P.452-13
implementation
hg (m) 20 No The software has a standard
implementation of the smooth earth
model. If terrain data is available, the
height information from the terrain
data will be used
hm (m) 10 No The software will either use smooth
earth, or, terrain data, when available
dtm (km) 0.9d No Automatically determined by the
software based on available terrain
data
dlm (km) 0.8d No Automatically determined by the
software based on available terrain
data
dlt,dlr (km) 0.25d No Automatically determined by the
software based on available terrain
data
θt, θr (mrad) 17.45 No Automatically determined by the
software based on available terrain
data and resulting geometry
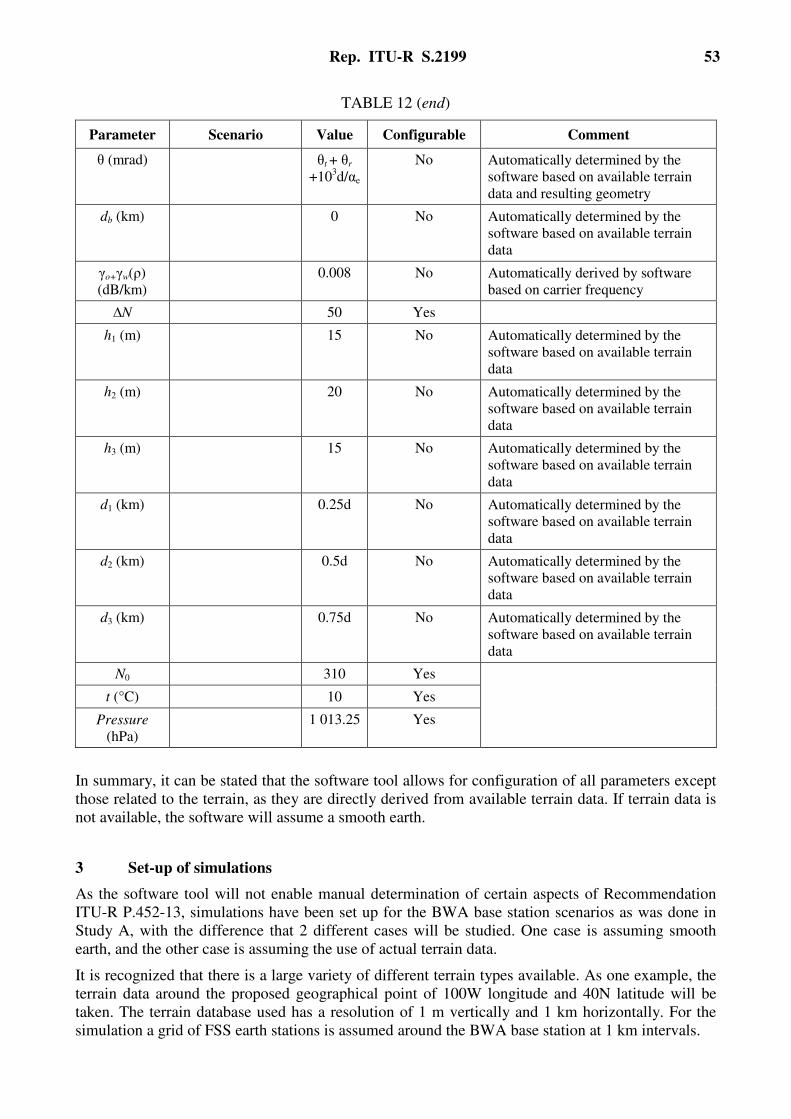
Rep. ITU-R S.2199 53
TABLE 12 (end)
Parameter Scenario Value Configurable Comment
θ (mrad) θt + θr
+103d/αe
No Automatically determined by the
software based on available terrain
data and resulting geometry
db (km) 0 No Automatically determined by the
software based on available terrain
data
γo+γw(ρ)
(dB/km)
0.008 No Automatically derived by software
based on carrier frequency
∆N 50 Yes
h1 (m) 15 No Automatically determined by the
software based on available terrain
data
h2 (m) 20 No Automatically determined by the
software based on available terrain
data
h3 (m) 15 No Automatically determined by the
software based on available terrain
data
d1 (km) 0.25d No Automatically determined by the
software based on available terrain
data
d2 (km) 0.5d No Automatically determined by the
software based on available terrain
data
d3 (km) 0.75d No Automatically determined by the
software based on available terrain
data
N0 310 Yes
t (°C) 10 Yes
Pressure
(hPa)
1 013.25 Yes
In summary, it can be stated that the software tool allows for configuration of all parameters except
those related to the terrain, as they are directly derived from available terrain data. If terrain data is
not available, the software will assume a smooth earth.
3 Set-up of simulations
As the software tool will not enable manual determination of certain aspects of Recommendation
ITU-R P.452-13, simulations have been set up for the BWA base station scenarios as was done in
Study A, with the difference that 2 different cases will be studied. One case is assuming smooth
earth, and the other case is assuming the use of actual terrain data.
It is recognized that there is a large variety of different terrain types available. As one example, the
terrain data around the proposed geographical point of 100W longitude and 40N latitude will be
taken. The terrain database used has a resolution of 1 m vertically and 1 km horizontally. For the
simulation a grid of FSS earth stations is assumed around the BWA base station at 1 km intervals.

54 Rep. ITU-R S.2199
Figure 7 depicts the details of the type of terrain that was used, together with contours indicating the
distance from the BWA base station in the centre of the plots, in 25 km intervals, from 25 km up to
125 km distance. The plots contained in the analysis results will not show the actual terrain in order
to make those plots more readable.
FIGURE 7
Details of terrain characteristics assumed in simulations
Simulations are run based on the scenarios identified in Table 13, assuming the parameters as
identified in Table 14 and Table 15. It should be noted that this study takes into account the BWA
base stations, but not the BWA terminal stations. Further, it is important to note that this study is
only considering the long term protection criteria as reflected in Recommendation ITU-R SF.1006.
The results from Study A are derived from the plots as depicted in their study, where distances
derived have been rounded to the nearest 5 km. Those results are then compared the results from the
simulations performed in this study.
TABLE 13
Overview of simulation scenarios
Scenario BWA antenna FSS antenna Terrain
1a
Specific rural sectoral
32 m
Smooth Earth 1b 8 m
1c 1.2 m
2a
Specific rural sectoral
32 m
Actual terrain 2b 8 m
2c 1.2 m
3a
Typical urban omnidirectional
32 m
Smooth Earth 3b 8 m
3c 1.2 m
4a
Typical urban omnidirectional
32 m
Actual terrain 4b 8 m
4c 1.2 m

Rep. ITU-R S.2199 55
TABLE 14
FSS system parameters
Frequency 3 400-4 200 MHz
(3 600 MHz is used in calculation)
Bandwidth 40 kHz-72 MHz
(7 MHz is used in calculation)
Earth station antenna radiation patterns Recommendation ITU-R S.465
Antenna diameter (m) 1.2 8 32
Maximum antenna gain (dBi) 31.2 47.7 59.8
Antenna centre height (m) 5 5 25
Noise temperature (including the
contributions of the antenna, feed and
LNA/LNB referred to the input of the
LNA/LNB receiver) (K)
100 70 70
Antenna elevation angle (degrees) 5 to 85
Short-term and long-term maximum
permissible Interference level
Recommendations ITU-R SF.1006 (this
study only considers the long-term levels)
TABLE 15
BWA base station system parameters
Base station
Deployment scenario Specific cellular
deployment rural
Typical cellular
deployment urban
TX peak output power (dBm) 43 32
Channel bandwidth (MHz) 7 7
Feeder loss (dB) 3 3
Peak antenna gain (dBi) 17 9
Antenna gain pattern Recommendation ITU-R F.1336 Recommendation ITU-R F.1336
Antenna 3 dB beamwidth
(degrees) 60 (sectorized) Omnidirectional
Antenna downtilt (degrees) 1 4
Antenna height a.g.l. (m) 50 15
e.i.r.p. (dBm) 57 38
Unwanted emissions TBD TBD

56 Rep. ITU-R S.2199
The adjacent channel leakage ratio (ACLR) values used in this study are depicted in the table below
It should be noted that the study contained in Attachment 1 to Annex B of this Report uses more
recent ACLR values.
BWA base station ACLR values used in this study
ACLR1
(dB)
ACLR2
(dB)
ACLR3
(dB)
BWA base station 22.0 47.8 50.0
Due to the small difference between the values for the second and third adjacent channels, this
study will only take into account the results for the first and second adjacent channels.
Further, in this study, for the BWA specific rural sectoral antenna case (Scenarios 1 and 2), not all
azimuth angles between 0° and 180° were studied, as was done in Study A, but a subset of this
range. The azimuth angles studied were 0°, 90° and 180°. It is believed that these values allow for
adequate comparison with the results obtained in Study A. Figure 8 depicts the geometrical
scenarios studied under Scenarios 1 and 2.
FIGURE 8
Geometric azimuth configurations studied under Scenarios 1 and 2
As for Scenarios 3 and 4, for the BWA typical urban omnidirectional antenna, where the azimuth
aspect of the antennas is not relevant, not all elevation angles for the FSS earth stations are studied,
but the same subset of elevation angles that were used in Scenarios 1 and 2, i.e. 5°, 25° and 50°
elevation.
4 Results of simulation
This section contains the results of the simulations and a comparison with the results from Study A.
Except for the values of ACLR1, the same assumed set of parameters was used to enable a
comparison of the results of the two studies. If the values of ACLR1 used in study A were used the
results would improve. However, § 5 contains a discussion on some of the parameters that were
assumed in this study.
4.1 Scenario 1 (BWA sectoral antenna, smooth earth)
Tables 16 to 18 in this section show the comparison of the results from Study A with the results of
the simulation done for this particular contribution, when a smooth earth is assumed. The tables also
show the difference between the two results. All distances are in kilometres. The results are
generally rounded to the nearest 5 km point, except for the cases when the separation distance was
about 1 km. When the distance was below 1 km, a separation distance of 0 km is indicated.
BWA antenna
0
90
180 180
FSS antenna

Rep. ITU-R S.2199 57
TABLE 16
Comparison of result for separation distances for Scenario 1a
Scenario 1a: BWA sectoral antenna, FSS 32 m antenna
Elevation 5 25 50
Azimuth 0 90 180 0 90 180 0 90 180
Stu
dy
A Co-channel 150 130 90 110 85 65 95 75 60
1st adjacent 110 80 60 75 60 40 65 50 35
2nd adjacent 60 50 35 45 30 15 40 20 5
Stu
dy
B Co-channel 100 75 65 75 60 50 70 55 40
1st adjacent 70 55 45 55 40 20 50 30 10
2nd adjacent 50 25 5 20 5 1 10 1 0
Del
ta Co-channel –50 –55 –25 –35 –25 –15 –25 –20 –20
1st adjacent –40 –25 –15 –20 –20 –20 –15 –20 –25
2nd adjacent –10 –25 –30 –25 –25 –14 –30 –19 –5
TABLE 17
Comparison of result for separation distances for Scenario 1b
Scenario 1b: BWA sectoral antenna, FSS 8 m antenna
Elevation 5 25 50
Azimuth 0 90 180 0 90 180 0 90 180
Stu
dy
A Co-channel 95 70 50 70 50 25 60 40 20
1st adjacent 60 40 25 40 20 10 30 15 5
2nd adjacent 30 15 5 10 5 1 10 1 0
Stu
dy
B Co-channel 75 60 45 55 40 30 50 35 20
1st adjacent 50 35 25 35 20 5 30 10 5
2nd adjacent 30 10 5 5 1 0 5 1 0
Del
ta Co-channel –20 –10 –5 –15 –10 5 –10 –5 0
1st adjacent –10 –5 0 –5 0 –5 0 –5 0
2nd adjacent 0 –5 0 –5 –4 –1 –5 0 0

58 Rep. ITU-R S.2199
TABLE 18
Comparison of result for separation distances Scenario 1c
Scenario 1c: BWA sectoral antenna, FSS 1.2 m antenna
Elevation 5 25 50
Azimuth 0 90 180 0 90 180 0 90 180
Stu
dy
A Co-channel 70 50 30 45 35 15 35 20 10
1st adjacent 40 20 10 20 10 5 15 5 1
2nd adjacent 15 5 5 5 1 1 10 1 0
Stu
dy
B Co-channel 75 55 40 55 40 25 45 35 20
1st adjacent 50 35 25 35 20 5 30 10 5
2nd adjacent 25 10 5 5 1 0 5 1 0
Del
ta Co-channel 5 5 10 10 5 10 10 15 10
1st adjacent 10 15 15 15 10 0 15 5 4
2nd adjacent 10 5 0 0 0 –1 –5 0 0
Generally speaking it can be observed that the separation distances calculated are of the same order
of magnitude.
However, when comparing the three scenarios in more detail, it seems that the results for
Scenario 1b (FSS earth station size of 8 m) are most similar to the results from Study A. Results
from Scenario 1a (FSS earth station size of 32 m) differ in the sense that the separation distances as
calculated in Study A are larger, and the separation distances for Scenario 1c (FSS earth station size
of 1.2 m) are lower.
4.2 Scenario 2 (BWA sectoral antenna, actual terrain data)
As indicated in § 3, in order to show an example of the impact of terrain on the simulation results, it
was decided to assume the terrain data available at the proposed geographical coordinates in the WP
5A liaison statement. It is realised that this will entail one example out of the many, but it was
believed to be a valuable addition to this study, also taking into account that the terrain around the
chosen coordinates is relatively smooth.
In this simulation, a grid of earth stations, 300 m apart, was created around the BWA base station.
From every location, the earth station’s azimuth was pointing towards the BWA base station, but
the elevation was fixed at predetermined values. Also the pointing of the BWA sectoral antenna was
configurable, so that it could be pointed at all times towards the FSS earth station, 90° and 180°
away from the FSS earth station. This set of simulations will then give an indication of variations of
separation distances around a BWA base station. The results of the simulations are shown in Fig. 9
for Scenario 2a, Fig. 10 for Scenario 2b and Fig. 11 for Scenario 2c. Each figure contains three
contours. The black contour corresponds to the co-channel case, the blue contour corresponds to the
1st adjacent channel case and the dark red contour corresponds to the 2nd adjacent channel case.
Further, on the figure a scale for the distance with respect to the BWA base station is reflected.
Lines are drawn in 25 km intervals, from 25 km to 125 km separation distance.

Rep. ITU-R S.2199 59
FIGURE 9
Results for Scenario 2a: 32 m FSS earth station
Azimuth = 0° (w.r.t. FSS e/s) Azimuth = 90° (w.r.t. FSS e/s) Azimuth = 180° (w.r.t. FSS e/s)
Ele
vat
ion
= 5
°
Ele
vat
ion
= 2
5°
Ele
vat
ion
= 5
0°

60 Rep. ITU-R S.2199
FIGURE 10
Results for Scenario 2b: 8 m FSS earth station
Azimuth = 0° (w.r.t. FSS e/s) Azimuth = 90° (w.r.t. FSS e/s) Azimuth = 180° (w.r.t. FSS e/s)
Ele
vat
ion
= 5
°
Ele
vat
ion
= 2
5°
Ele
vat
ion
= 5
0°