Embed Size (px)
DESCRIPTION
Shares Investment is the only financial/investment magazine that provides fundamental research on all listed companies in Singapore, in English and Chinese editions. Established since 1995, it is published through a stringent ISO9001:2008 certified process.
Citation preview

ISSUE 451 07/01/13 - 20/01/13 www.sharesinv.com
In Focus: Experts’ Picks
I S S N 0 2 1 8 - 8 7 1 6Other Features
MICA (P) 026/11/2012 · PPS 1687/07/2013(022975)
SI Portfolio Beats The STI For The Fourth Consecutive Quarter
2013 Market Outlook & Stock Picks:
EXPERTS’ FAVOURITES
��)HEUXDU\�������6DWXUGD\���DP�WR��SP
?Will the market of outperform 2012
8�g\ijg\Zk`m\�fe�k_\�>cfYXc�<Zfefd`Z�Flkcffb
2013யԨᆼ༎ၛࡘ2013 MARKET OUTLOOK CONFERENCE
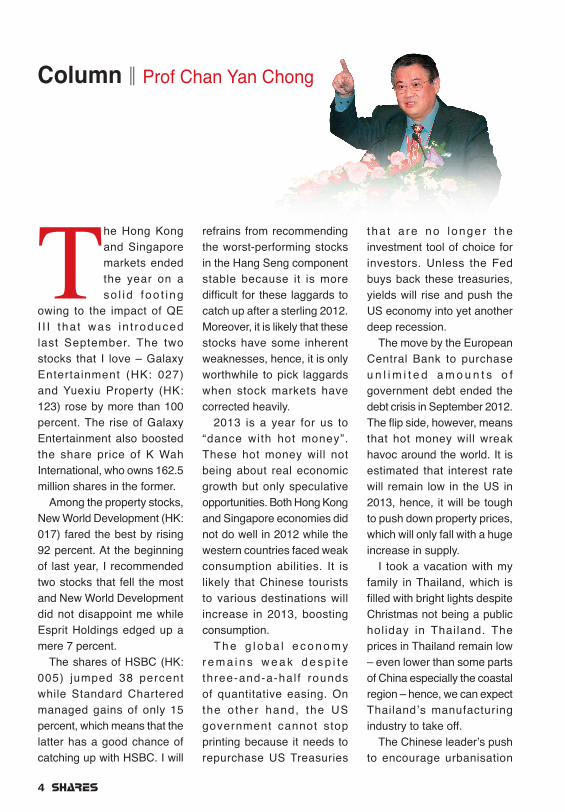
ProfessorChan Yan Chong
4
The Hong Kong and Singapore markets ended the year on a so l i d foo t i ng
owing to the impact of QE I I I tha t was in t roduced last September. The two stocks that I love – Galaxy Entertainment (HK: 027) and Yuexiu Property (HK: 123) rose by more than 100 percent. The rise of Galaxy Entertainment also boosted the share price of K Wah International, who owns 162.5 million shares in the former.
Among the property stocks, New World Development (HK: 017) fared the best by rising 92 percent. At the beginning of last year, I recommended two stocks that fell the most and New World Development did not disappoint me while Esprit Holdings edged up a mere 7 percent.
The shares of HSBC (HK: 005) jumped 38 percent while Standard Chartered managed gains of only 15 percent, which means that the latter has a good chance of catching up with HSBC. I will
refrains from recommending the worst-performing stocks in the Hang Seng component stable because it is more GLIÀFXOW� IRU� WKHVH�ODJJDUGV�WR�catch up after a sterling 2012. Moreover, it is likely that these stocks have some inherent weaknesses, hence, it is only worthwhile to pick laggards when stock markets have corrected heavily.
2013 is a year for us to “dance with hot money”. These hot money will not being about real economic growth but only speculative opportunities. Both Hong Kong and Singapore economies did not do well in 2012 while the western countries faced weak consumption abilities. It is likely that Chinese tourists to various destinations will increase in 2013, boosting consumption.
T h e g l o b a l e c o n o m y r e m a i n s w e a k d e s p i t e three-and-a-hal f rounds of quantitative easing. On the other hand, the US government cannot stop printing because it needs to repurchase US Treasuries
tha t a re no longer the investment tool of choice for investors. Unless the Fed buys back these treasuries, yields will rise and push the US economy into yet another deep recession.
The move by the European Central Bank to purchase u n l i m i t e d a m o u n t s o f government debt ended the debt crisis in September 2012. 7KH�ÁLS�VLGH��KRZHYHU��PHDQV�that hot money will wreak havoc around the world. It is estimated that interest rate will remain low in the US in 2013, hence, it will be tough to push down property prices, which will only fall with a huge increase in supply.
I took a vacation with my family in Thailand, which is ÀOOHG�ZLWK�EULJKW�OLJKWV�GHVSLWH�Christmas not being a public holiday in Thailand. The prices in Thailand remain low – even lower than some parts of China especially the coastal region – hence, we can expect Thailand ’s manufacturing industry to take off.
The Chinese leader’s push to encourage urbanisation
ColumnmProf Chan Yan Chong
SHE_4_5_Chan.indd 4 1/3/13 4:55 PM
5
of rural areas is to provide the service industry with more labour so as to depress wages. The rapid rise in wages has eroded China’s competitiveness but higher wages also mean stronger buying power. However, Chinese love to save and not spend and, thus, the huge number of Chinese tourists visiting the branded luxury shops are not representative of the entire China. 7KH�ÁRZLQJ�RI�KRW�PRQH\�
into Hong Kong will find its final destination in China because of the recent policy to open up RQF II (Renminbi 4XDOLÀHG�)RUHLJQ�,QVWLWXWLRQDO�Investor). Much will depend on the new leaders regarding this issue once they take over in March. It is always the case when the “caretaker” government tends to do nothing just like what George Bush did before Obama took over. QE I was introduced only when Obama took over White House.
I am concerned that the hot money will lose its patience wai t ing for the Chinese government to open up its ÀQDQFLDO�PDUNHW��$V�D�PDWWHU�of fact, Hong Kong equities are cheap so i t is qui te confusing why hot money is only interested in speculating WKH�$���&KLQD�(7)��7KHUH�are talks that retail investors are the ones buying up this particular ETF because of
rumours that hot money are buying up the same.
US equities are quite near historical high but are US companies making more PRQH\� WKDQ�����"�2Q� WKH�other hand, Hong Kong companies are really making more money than they did LQ�������KHQFH�� YDOXDWLRQV�are still attractive. It is only a matter of time before even PRUH�KRW�PRQH\�ZLOO�ÁRZ�IURP�US to Hong Kong.
W h e n t h e J a p a n e s e parliament was dissolved, the Yen started to weaken because it is expected that the Liberal Democratic Party will be swept into power. The moment the new Prime Min is ter took off ice, he SURPLVHG�WR�UDLVH� LQÁDWLRQ�WR�2 percent and the fastest way to do so will be to weaken the Yen. This is also expected WR� OHDG�WR�<HQ�ÁRZLQJ�RXW�RI�Japan into Hong Kong.
With widespread of money being printed by almost all the governments in the world except for China, there is a likelihood that such money will be used to purchase Chinese assets. This is bad for China because it has been using its vast reserves to purchase foreign assets, especially natural resources. But with prices of assets rising, the amount of money that China has can now buy lesser assets. It seems that not wanting to print more
money is a wrong move by the Chinese government.
China International Marine Conta iners Group (HK: ������ OLVWHG�RQ�+RQJ�.RQJ�by transferring mainland B shares into H shares. This is the first of its kind and failure is not accepted. If this new initiative proves to be a success, it will lead to more Chinese companies listing its shares in Hong Kong. This will be bullish for the shares of the VWRFN�H[FKDQJH� �+.��������The shares of the exchange fell when it took over London Mercantile Exchange but fears of earnings dilution have been overplayed. This is a good time to buy into shares of the Hong Kong Exchange.
Professor Chan will be the main speaker for o u r u p c o m i n g e v e n t ²� �����0DUNHW�2XWORRN�Conference. For those who are interested in attending the conference, online registration can be done through the event websitewww.sharesinv.com/moc2013si
6+(B�B�B&KDQ�LQGG���� ��������������30
7
PersPectivetext : Jade Lee, Louis Lee & Nicholas Tan
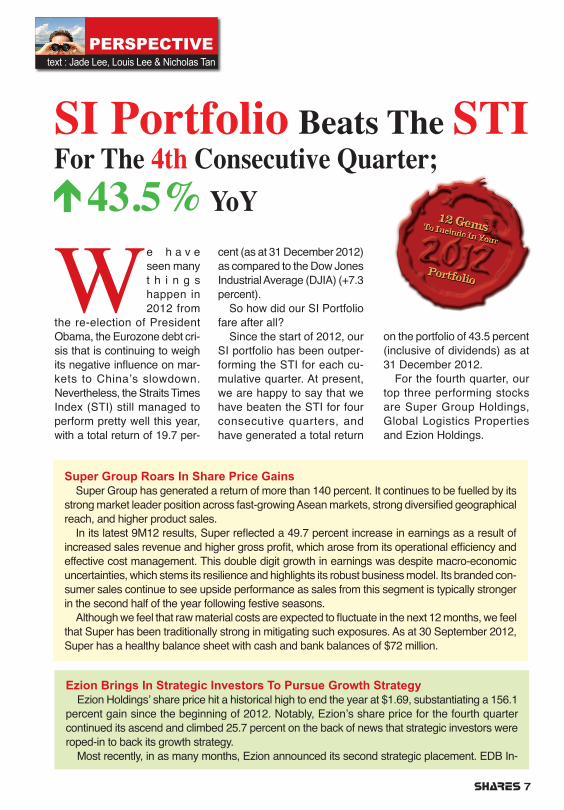
We h a v e seen many t h i n g s happen in 2012 from
the re-election of President Obama, the Eurozone debt cri-sis that is continuing to weigh LWV�QHJDWLYH�LQÁXHQFH�RQ�PDU-kets to China’s slowdown. Nevertheless, the Straits Times Index (STI) still managed to perform pretty well this year, with a total return of 19.7 per-
cent (as at 31 December 2012) as compared to the Dow Jones Industrial Average (DJIA) (+7.3 percent).
So how did our SI Portfolio fare after all?
Since the start of 2012, our SI portfolio has been outper-forming the STI for each cu-mulative quarter. At present, we are happy to say that we have beaten the STI for four consecutive quarters, and have generated a total return
on the portfolio of 43.5 percent (inclusive of dividends) as at 31 December 2012.
For the fourth quarter, our top three performing stocks are Super Group Holdings, Global Logistics Properties and Ezion Holdings.
SI Portfolio Beats The STI For The 4th Consecutive Quarter;
43.5% YoY
Super Group Roars In Share Price Gains Super Group has generated a return of more than 140 percent. It continues to be fuelled by its
VWURQJ�PDUNHW�OHDGHU�SRVLWLRQ�DFURVV�IDVW�JURZLQJ�$VHDQ�PDUNHWV��VWURQJ�GLYHUVLÀHG�JHRJUDSKLFDO�reach, and higher product sales.,Q�LWV�ODWHVW��0���UHVXOWV��6XSHU�UHÁHFWHG�D������SHUFHQW�LQFUHDVH�LQ�HDUQLQJV�DV�D�UHVXOW�RI�
LQFUHDVHG�VDOHV�UHYHQXH�DQG�KLJKHU�JURVV�SURÀW��ZKLFK�DURVH�IURP�LWV�RSHUDWLRQDO�HIÀFLHQF\�DQG�effective cost management. This double digit growth in earnings was despite macro-economic uncertainties, which stems its resilience and highlights its robust business model. Its branded con-sumer sales continue to see upside performance as sales from this segment is typically stronger in the second half of the year following festive seasons.$OWKRXJK�ZH�IHHO�WKDW�UDZ�PDWHULDO�FRVWV�DUH�H[SHFWHG�WR�ÁXFWXDWH�LQ�WKH�QH[W����PRQWKV��ZH�IHHO�
that Super has been traditionally strong in mitigating such exposures. As at 30 September 2012, Super has a healthy balance sheet with cash and bank balances of $72 million.
Ezion Brings In Strategic Investors To Pursue Growth StrategyEzion Holdings’ share price hit a historical high to end the year at $1.69, substantiating a 156.1
percent gain since the beginning of 2012. Notably, Ezion’s share price for the fourth quarter continued its ascend and climbed 25.7 percent on the back of news that strategic investors were roped-in to back its growth strategy.
Most recently, in as many months, Ezion announced its second strategic placement. EDB In-
SHE_7-9_PerspectiveB.indd 7 1/3/13 4:56 PM
8
GLP J-REIT Joins TSE; Likely Higher Yield Payout Than TSE REIT IndexModern warehouse provider GLP, which announced several big moves for the past couple of
months, has seen its share price jumped 10.8 percent for the three months ended 31 December 2012, further translating into a whopping 58.9 percent jump since beginning of the year.
Of the recent moves, the disposal of its 30 properties in Japan to set up a real estate investment corporation in Japan (GLP J-REIT) once again caught our eyes. In fact, the deal was earnings DFFUHWLYH�ZLWK�QHW�SURÀW�FRQWULEXWLRQ�RI�DURXQG�86�����PLOOLRQ��UHSUHVHQWLQJ�DSSUR[LPDWHO\����SHUFHQW�RI�*/3ҋV�FRQVROLGDWHG�QHW�SURÀWV�IRU�WKH�\HDU�HQGLQJ����0DUFK������
In view of the bleak Japanese economy, the listing of GLP J-REIT has unavoidably raised concern of continued buying interest. Yet, a comforting note is that the Bank of Japan has been EX\LQJ�5(,7V�VLQFH������DV�SDUW�RI�D����WULOOLRQ�\HQ��86�����ELOOLRQ��DVVHW�IXQG�WR�VXSSRUW�LWV�HFRQRP\��0RUHRYHU��-DSDQ�5(,7�,QGH[�KDV�JDLQHG������SHUFHQW�LQ������DQG�LV�VHW�IRU�LWV�ODUJHVW�gain since at least 2004.
The scarcity of modern warehouse in Japan would also further substantiate GLP J-REIT’s busi-ness rationale in the near future. Notably, Takeshi Akagi, head of research and advisory for Jones Land Lasalle mentioned that the demand for modern warehouses has been set to rise as more companies were outsourcing logistics business to cut costs and the volume of internet shopping WUDIÀF�ZDV�LQFUHDVLQJ��7R�GDWH��*/3�RZQV����SHUFHQW�LQWHUHVW�LQ�*/3�-�5(,7�DQG�ZLOO�DFW�DV�WKH�property and asset manager of the REIT.
Meanwhile, GLP J-REIT plans to enhance shareholders’ payout with money that Japanese 5(,7V�XVXDOO\�VHW�DVLGH�WR�FRYHU�GHSUHFLDWLRQ�H[SHQVHV��$FFRUGLQJ�WR�WKH�IRUHFDVW�SURYLGHG�E\�*/3��*/3�-�5(,7ҋV�GLYLGHQG�\LHOG�LQ�$XJXVW������KDV�EHHQ�OLIWHG�IURP���SHUFHQW�WR�DSSUR[LPDWHO\�6.8 percent based on the indicative price of 60,500 yen, as compared to average dividend yield IRU�7RN\R�6WRFN�([FKDQJH��76(��5(,7�,QGH[�RI�����SHUFHQW��7KLV�FRXOG�SRWHQWLDOO\�DWWUDFW�ERWK�local as well as international investors seeking high yield investments.
YHVWPHQWV��('%,���WKH�FRUSRUDWH�LQYHVWPHQW�DUP�RI�6LQJDSRUHҋV�(FRQRPLF�'HYHORSPHQW�%RDUG�VXEVFULEHG�WR�DSSUR[LPDWHO\������PLOOLRQ�QHZ�RUGLQDU\�VKDUHV�DQG�LQMHFWHG�����PLOOLRQ�LQWR�(]LRQ�WR�JURZ�FRPSHWLWLYH�EXVLQHVVHV�WR�EXLOG�VXVWDLQDEOH�LQGXVWU\�SLOODUV�IRU�6LQJDSRUH��,Q�RXU�YLHZ��WKH�backing of an esteemed partner like EDBI signals a positive vibe for the industry and will allow (]LRQ�WR�OHYHUDJH�RQ�('%,ҋV�H[WHQVLYH�QHWZRUN�RI�UHVRXUFHV�DQG�YDVW�H[SHULHQFH�WR�IXUWKHU�H[SDQG�its business in the vibrant offshore oil and gas industry.,Q�1RYHPEHU�������(]LRQ�VXFFHVVIXOO\�UDLVHG�������PLOOLRQ�IROORZLQJ�WKH�DFTXLVLWLRQ�RI����PLOOLRQ�
QHZ�VKDUHV�E\�LQGXVWU\�YHWHUDQ�7DQ�%R\�7HH��+DYLQJ�PRUH�WKDQ����\HDUV�RI�H[SHULHQFH�LQ�PDULQH�construction and engineering, we believe the engagement of Tan as a strategic partner and ad KRF�DGYLVRU�ZLOO�KHOS�WKH�ÀUP�LQ�VHFXULQJ�PRUH�QHZ�SURMHFWV��,Q�DGGLWLRQ��WKH�FRPSDQ\ҋV�MRLQW�YHQWXUH�ZLWK�.LP�6HQJ�+ROGLQJV�KDG�VHFXUHG�86�����PLOOLRQ�
worth of contracts to provide two service rigs over a seven year period to support the oil and gas activities of a national oil major in Central America, which will lead to earnings accretion from 1Q13 RQZDUGV��,WV�UHFHQWO\�DFTXLUHG�VWDNH�����SHUFHQW��LQ�<+0��D�FRPSDQ\�HQJDJHG�LQ�WKH�VFDIIROGLQJ�EXVLQHVV�FDWHULQJ�WR�WKH�FRQVWUXFWLRQ�DQG�PDULQH�LQGXVWULHV��DOVR�UHÁHFWV�D�V\QHUJLVWLF�DSSURDFK�E\�(]LRQ�WR�FRPSOHPHQW�LWV�FXUUHQW�EXVLQHVV�
ConclusionAs we move into the first
green patch of 2013, we are thankful for the gains that have been reaped in 2012. Although
ZH�KDYH�EHDWHQ�WKH�67,�E\�D�good 23.9 percentage points, we are humbled by such perfor-mance on our portfolio, as 2012 has indeed been a year that
has seen many different things which could break the market in D�ÀQJHU�VQDS��0RYLQJ�IRUZDUG��we will continue searching for stock gems in 2013 for you!
6+(B���B3HUVSHFWLYH%�LQGG���� 1/3/13 4:56 PM
9
Holdings
As At 30 Dec 2011 As At 31 Dec 2012 As At 28 Sep 2012
4Q Performance (%)
Share Price Amount Share
Price Amount Share Price
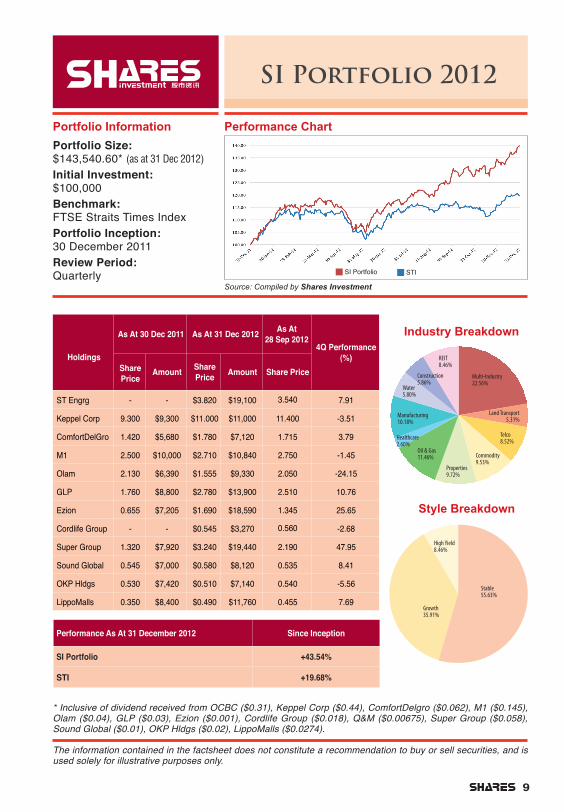
ST Engrg - - $3.820 $19,100 3.540 7.91
Keppel Corp 9.300 $9,300 $11.000 $11,000 11.400 -3.51
ComfortDelGro 1.420 $5,680 $1.780 $7,120 1.715 3.79
M1 2.500 $10,000 $2.710 $10,840 2.750 -1.45
Olam 2.130 $6,390 $1.555 $9,330 2.050 -24.15
GLP 1.760 $8,800 $2.780 $13,900 2.510 10.76
Ezion 0.655 $7,205 $1.690 $18,590 1.345 25.65
Cordlife Group - - $0.545 $3,270 0.560 -2.68
Super Group 1.320 $7,920 $3.240 $19,440 2.190 47.95
Sound Global 0.545 $7,000 $0.580 $8,120 0.535 8.41
OKP Hldgs 0.530 $7,420 $0.510 $7,140 0.540 -5.56
LippoMalls 0.350 $8,400 $0.490 $11,760 0.455 7.69
SI Portfolio 2012
Portfolio Information
Portfolio Size: $143,540.60* (as at 31 Dec 2012)Initial Investment: $100,000Benchmark: FTSE Straits Times IndexPortfolio Inception: 30 December 2011Review Period: Quarterly
The information contained in the factsheet does not constitute a recommendation to buy or sell securities, and is used solely for illustrative purposes only.
Performance Chart
Industry Breakdown
Style Breakdown
Source: Compiled by Shares Investment
* Inclusive of dividend received from OCBC ($0.31), Keppel Corp ($0.44), ComfortDelgro ($0.062), M1 ($0.145), Olam ($0.04), GLP ($0.03), Ezion ($0.001), Cordlife Group ($0.018), Q&M ($0.00675), Super Group ($0.058), Sound Global ($0.01), OKP Hldgs ($0.02), LippoMalls ($0.0274).
SI Portfolio STI
High Yield8.46%
Stable55.63%
Growth35.91%
Land Transport5.31%
Telco8.52%
Commodity9.53%
Properties9.72%
Manufacturing10.18%
Water5.80%
Oil & Gas11.46%
Healthcare2.60%
Construction5.86%
REIT8.46%
Multi-Industry22.56%
Performance As At 31 December 2012 Since Inception
SI Portfolio +43.54%
STI +19.68%
SHE_7-9_PerspectiveB.indd 9 1/3/13 4:57 PM
aaaaaaaaaaaaaaaaaaaaaaaaaaaaaaaaaaaaaaaaaaaaaa
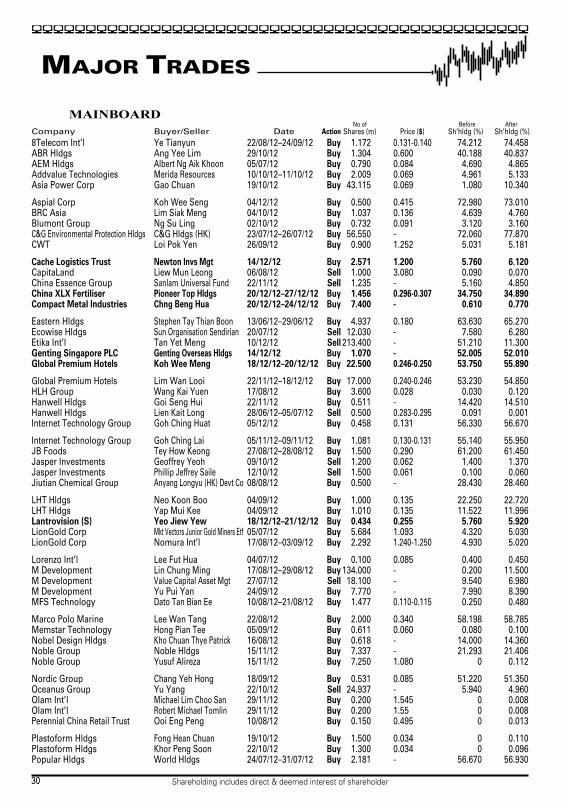
MAINBOARD
SEa30_mjtrd.indd 2013-1-4, 13:401
aaaaaaaaaaaaaaaaaaaaaaaaaaaaaaaaaaaaaaaaaaaaaa
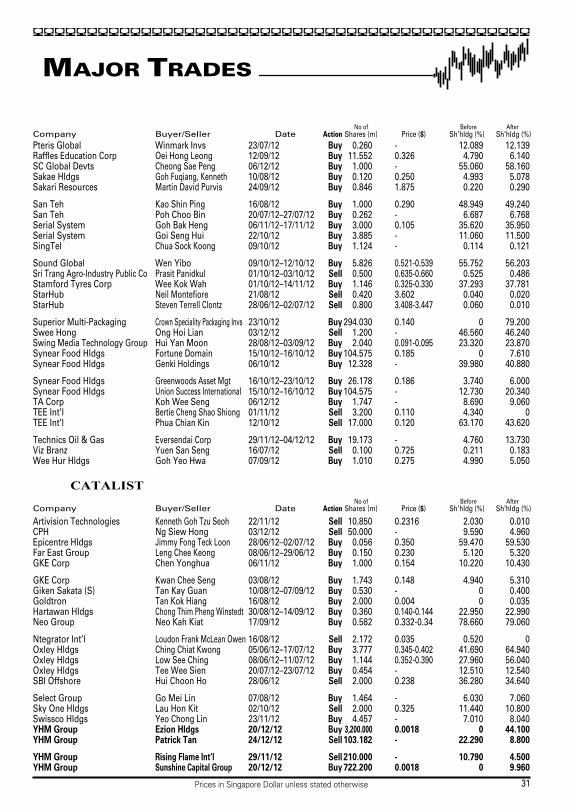
CATALIST
SEa31_mjtrd.indd 2013-1-4, 13:401
aaaaaaaaaaaaaaaaaaaaaaaaaaaaaaaaaaaaaaaaaaaaaa
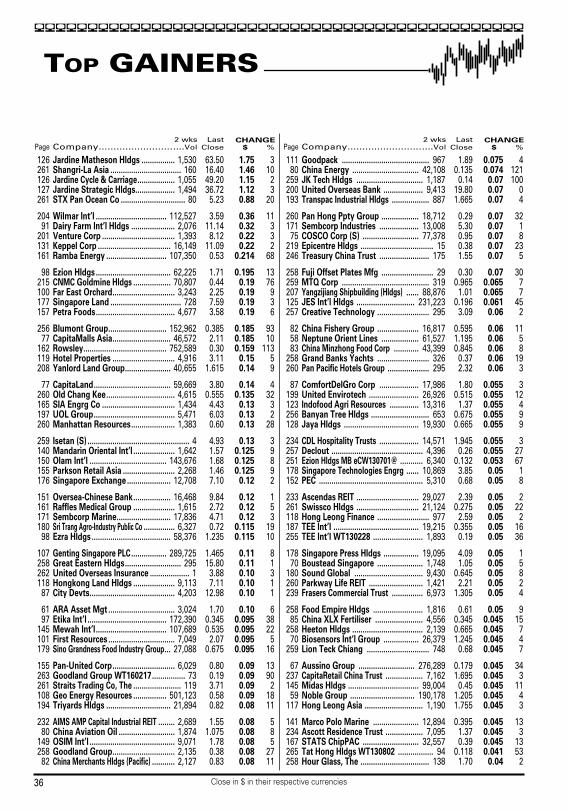
SEa36_gain.indd 2013-1-4, 18:041
aaaaaaaaaaaaaaaaaaaaaaaaaaaaaaaaaaaaaaaaaaaaaa
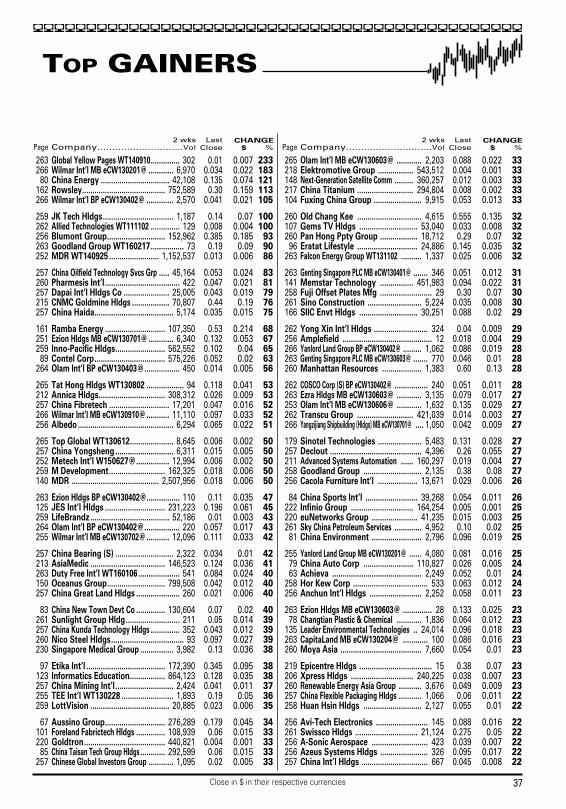
SEa37_gain.indd 2013-1-4, 18:051
aaaaaaaaaaaaaaaaaaaaaaaaaaaaaaaaaaaaaaaaaaaaaa
MANUFACTURING-1 (8.2)*
COMMERCE (9)*
MANUFACTURING-2 (12.9)*
SEa40_pe.indd 2013-1-4, 17:561
aaaaaaaaaaaaaaaaaaaaaaaaaaaaaaaaaaaaaaaaaaaaaa
CONSTRUCTION (6.4)*
MULTI-INDUSTRY (11)*
SERVICES (19.3)*
TPT/STORAGE/COMMS (15.3)*
FINANCE (13.7)*
HOTELS/RESTAURANTS (17.1)*
PROPERTIES (8)*
SEa41_pe.indd 2013-1-4, 17:471
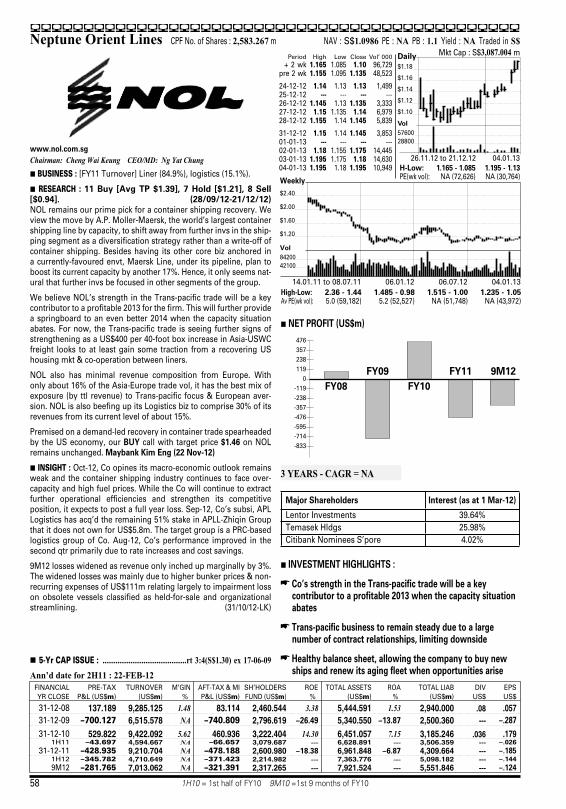
aaaaaaaaaaaaaaaaaaaaaaaaaaaaaaaaaaaaaaaaaaaaaaNeptune Orient Lines 2,583.267 1.0986 NA 1.1 NA S$
Chairman: Cheng Wai Keung CEO/MD: Ng Yat Chung
H
H
H
3,087.004
H
3 YEARS - CAGR = NA
H
K
K
K
Ann’d date for 2H11 : 22-FEB-12
H .............................................rt 3:4(S$1.30) ex 17-06-09
137.189 9,285.125 1.48 83.114 2,460.544 3.38 5,444.591 1.53 2,940.000 .08 .0576,515.578 NA 2,796.619 5,340.550 2,500.360 ---
529.822 9,422.092 5.62 460.936 3,222.404 14.30 6,451.057 7.15 3,185.246 .036 .1794,594.667 NA 3,079.687 --- 6,628.891 --- 3,506.359 ---9,210.704 NA 2,600.980 6,961.848 4,309.664 ---4,710.649 NA 2,214.982 --- 7,363.776 --- 5,098.182 ---7,013.062 NA 2,317.265 --- 7,921.524 --- 5,551.846 ---
SEb58.indd 2013-1-4, 17:531
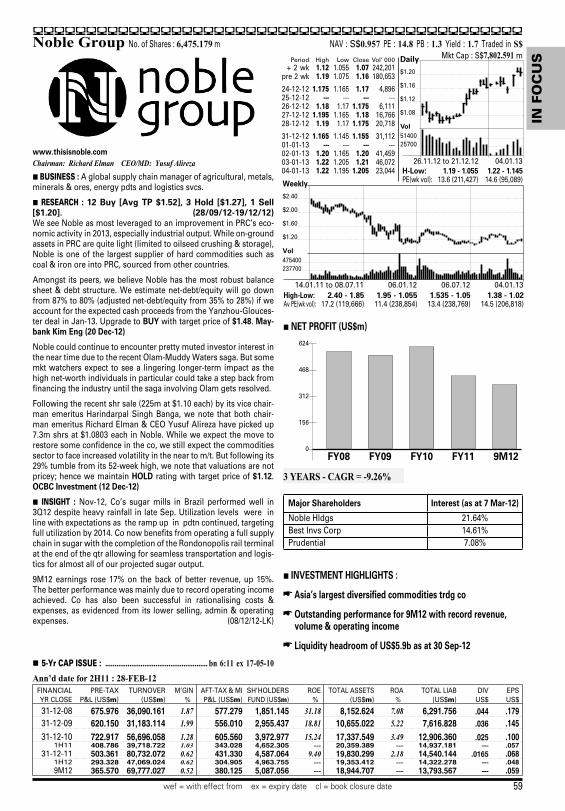
aaaaaaaaaaaaaaaaaaaaaaaaaaaaaaaaaaaaaaaaaaaaaaNoble Group 6,475.179 0.957 14.8 1.3 1.7 S$
Chairman: Richard Elman CEO/MD: Yusuf Alireza
H
H
H
7,802.591
H
3 YEARS - CAGR = -9.26%
H
K
K
K
Ann’d date for 2H11 : 28-FEB-12
H ....................................................... bn 6:11 ex 17-05-10
675.976 36,090.161 1.87 577.279 1,851.145 31.18 8,152.624 7.08 6,291.756 .044 .179620.150 31,183.114 1.99 556.010 2,955.437 18.81 10,655.022 5.22 7,616.828 .036 .145722.917 56,696.058 1.28 605.560 3,972.977 15.24 17,337.549 3.49 12,906.360 .025 .100408.786 39,718.722 1.03 343.028 4,652.305 --- 20,359.389 --- 14,937.181 --- .057503.361 80,732.072 0.62 431.330 4,587.064 9.40 19,830.299 2.18 14,540.144 .0165 .068293.328 47,069.024 0.62 304.905 4,963.755 --- 19,353.412 --- 14,322.278 --- .048365.570 69,777.027 0.52 380.125 5,087.056 --- 18,944.707 --- 13,793.567 --- .059
SEb59.indd 2013-1-4, 18:261
aaaaaaaaaaaaaaaaaaaaaaaaaaaaaaaaaaaaaaaaaaaaaa
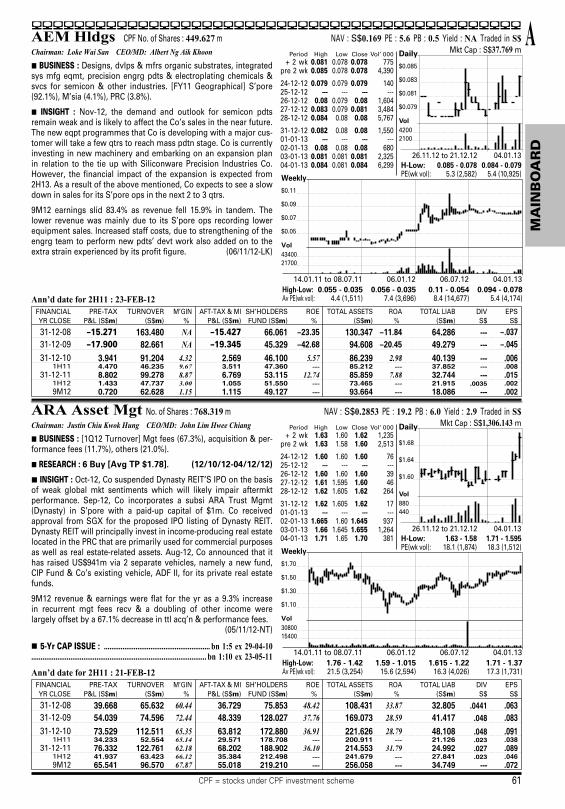
AAEM Hldgs 449.627 0.169 5.6 0.5 NA S$
Chairman: Loke Wai San CEO/MD: Albert Ng Aik KhoonH
H
37.769
Ann’d date for 2H11 : 23-FEB-12
163.480 NA 66.061 130.347 64.286 ---82.661 NA 45.329 94.608 49.279 ---
3.941 91.204 4.32 2.569 46.100 5.57 86.239 2.98 40.139 --- .0064.470 46.235 9.67 3.511 47.360 --- 85.212 --- 37.852 --- .0088.802 99.278 8.87 6.769 53.115 12.74 85.859 7.88 32.744 --- .0151.433 47.737 3.00 1.055 51.550 --- 73.465 --- 21.915 .0035 .0020.720 62.628 1.15 1.115 49.127 --- 93.664 --- 18.086 --- .002
ARA Asset Mgt 768.319 0.2853 19.2 6.0 2.9 S$
Chairman: Justin Chiu Kwok Hung CEO/MD: John Lim Hwee ChiangH
H
H
1,306.143
Ann’d date for 2H11 : 21-FEB-12
H ......................................................... bn 1:5 ex 29-04-10
.............................................................................................. bn 1:10 ex 23-05-11
39.668 65.632 60.44 36.729 75.853 48.42 108.431 33.87 32.805 .0441 .06354.039 74.596 72.44 48.339 128.027 37.76 169.073 28.59 41.417 .048 .08373.529 112.511 65.35 63.812 172.880 36.91 221.626 28.79 48.108 .048 .09134.233 52.554 65.14 29.571 178.708 --- 200.911 --- 21.126 .023 .03876.332 122.761 62.18 68.202 188.902 36.10 214.553 31.79 24.992 .027 .08941.937 63.423 66.12 35.384 212.498 --- 241.679 --- 27.841 .023 .04665.541 96.570 67.87 55.018 219.210 --- 256.058 --- 34.749 --- .072
SEb61.indd 2013-1-4, 18:111
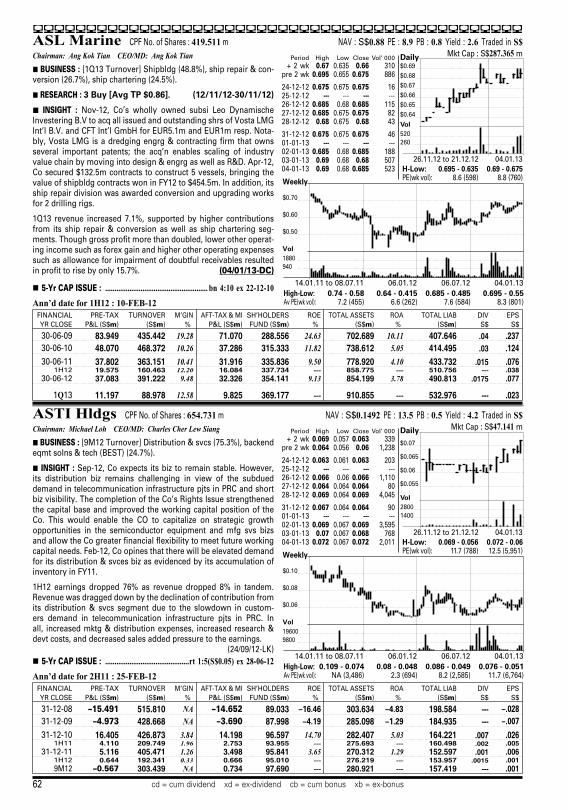
aaaaaaaaaaaaaaaaaaaaaaaaaaaaaaaaaaaaaaaaaaaaaaASL Marine 419.511 0.88 8.9 0.8 2.6 S$
Chairman: Ang Kok Tian CEO/MD: Ang Kok Tian
H
H
H
287.365
Ann’d date for 1H12 : 10-FEB-12
H ....................................................... bn 4:10 ex 22-12-10
83.949 435.442 19.28 71.070 288.556 24.63 702.689 10.11 407.646 .04 .23748.070 468.372 10.26 37.286 315.333 11.82 738.612 5.05 414.495 .03 .12437.802 363.151 10.41 31.916 335.836 9.50 778.920 4.10 433.732 .015 .07619.575 160.463 12.20 16.084 337.734 --- 858.775 --- 510.756 --- .03837.083 391.222 9.48 32.326 354.141 9.13 854.199 3.78 490.813 .0175 .077
Q 11.197 88.978 12.58 9.825 369.177 --- 910.855 --- 532.976 --- .023
ASTI Hldgs 654.731 0.1492 13.5 0.5 4.2 S$
Chairman: Michael Loh CEO/MD: Charles Cher Lew Siang
H
H
47.141
Ann’d date for 2H11 : 25-FEB-12
H .............................................rt 1:5(S$0.05) ex 28-06-12
515.810 NA 89.033 303.634 198.584 ---428.668 NA 87.998 285.098 184.935 ---
16.405 426.873 3.84 14.198 96.597 14.70 282.407 5.03 164.221 .007 .0264.110 209.749 1.96 2.753 93.955 --- 275.693 --- 160.498 .002 .0055.116 405.471 1.26 3.498 95.841 3.65 270.312 1.29 152.597 .001 .0060.644 192.341 0.33 0.666 95.010 --- 276.219 --- 153.957 .0015 .001
303.439 NA 0.734 97.690 --- 280.921 --- 157.419 --- .001
SEb62.indd 2013-1-4, 18:001