Embed Size (px)
DESCRIPTION
shareholding patterns
Citation preview
ASSIGNMENT
OF
CORPORATE & COMPETITION LAW
SUBMITTED TO:
PROF. HARI PARMESHWAR
SUBMITTED BY:
POOJA MATHUR
PGDM II (B)
68

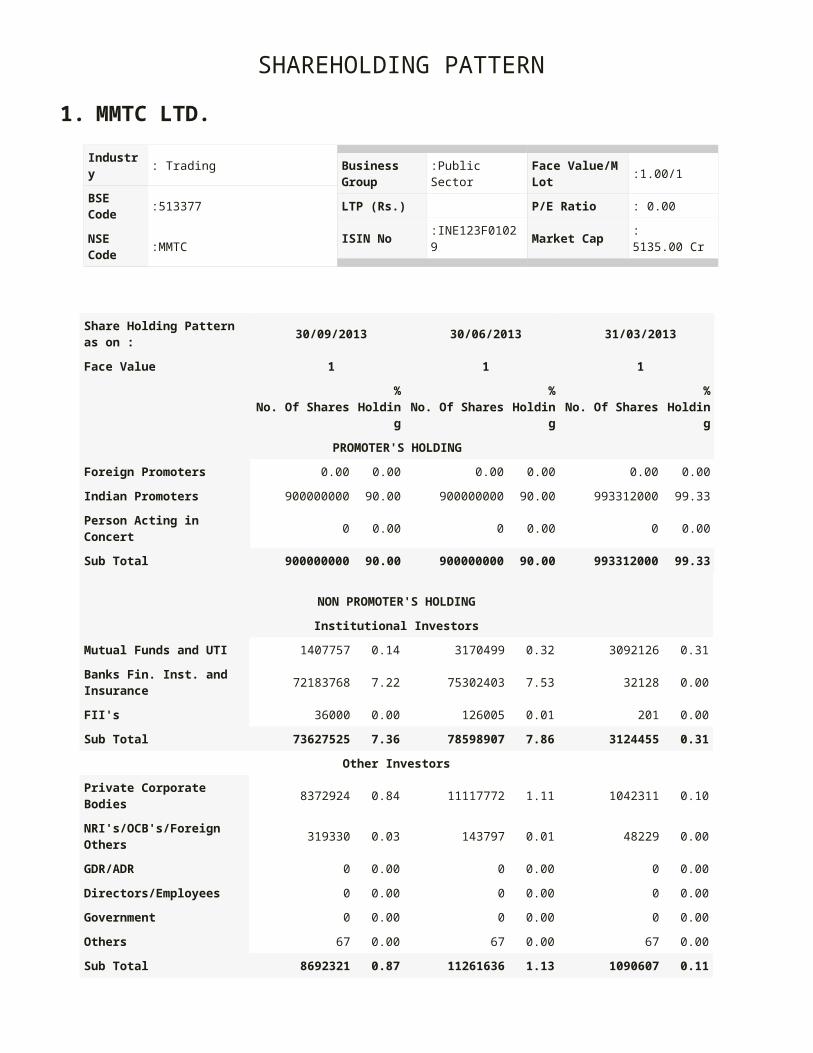
SHAREHOLDING PATTERN
1. MMTC LTD.
Industry : Trading
BSE Code :513377
NSE Code :MMTC
Business Group :Public Sector
LTP (Rs.)
ISIN No :INE123F01029
Face Value/M Lot :1.00/1
P/E Ratio : 0.00
Market Cap : 5135.00 Cr
Share Holding Pattern as on :
30/09/2013 30/06/2013 31/03/2013
Face Value 1 1 1
No. Of Shares%
Holding
No. Of Shares%
Holding
No. Of Shares%
Holding
PROMOTER'S HOLDING
Foreign Promoters 0.00 0.00 0.00 0.00 0.00 0.00
Indian Promoters 900000000 90.00 900000000 90.00 993312000 99.33
Person Acting in Concert 0 0.00 0 0.00 0 0.00
Sub Total 900000000 90.00 900000000 90.00 993312000 99.33
NON PROMOTER'S HOLDING
Institutional Investors
Mutual Funds and UTI 1407757 0.14 3170499 0.32 3092126 0.31
Banks Fin. Inst. and Insurance
72183768 7.22 75302403 7.53 32128 0.00
FII's 36000 0.00 126005 0.01 201 0.00
Sub Total 73627525 7.36 78598907 7.86 3124455 0.31
Other Investors
Private Corporate Bodies 8372924 0.84 11117772 1.11 1042311 0.10
NRI's/OCB's/Foreign Others 319330 0.03 143797 0.01 48229 0.00
GDR/ADR 0 0.00 0 0.00 0 0.00
Directors/Employees 0 0.00 0 0.00 0 0.00
Government 0 0.00 0 0.00 0 0.00
Others 67 0.00 67 0.00 67 0.00
Sub Total 8692321 0.87 11261636 1.13 1090607 0.11
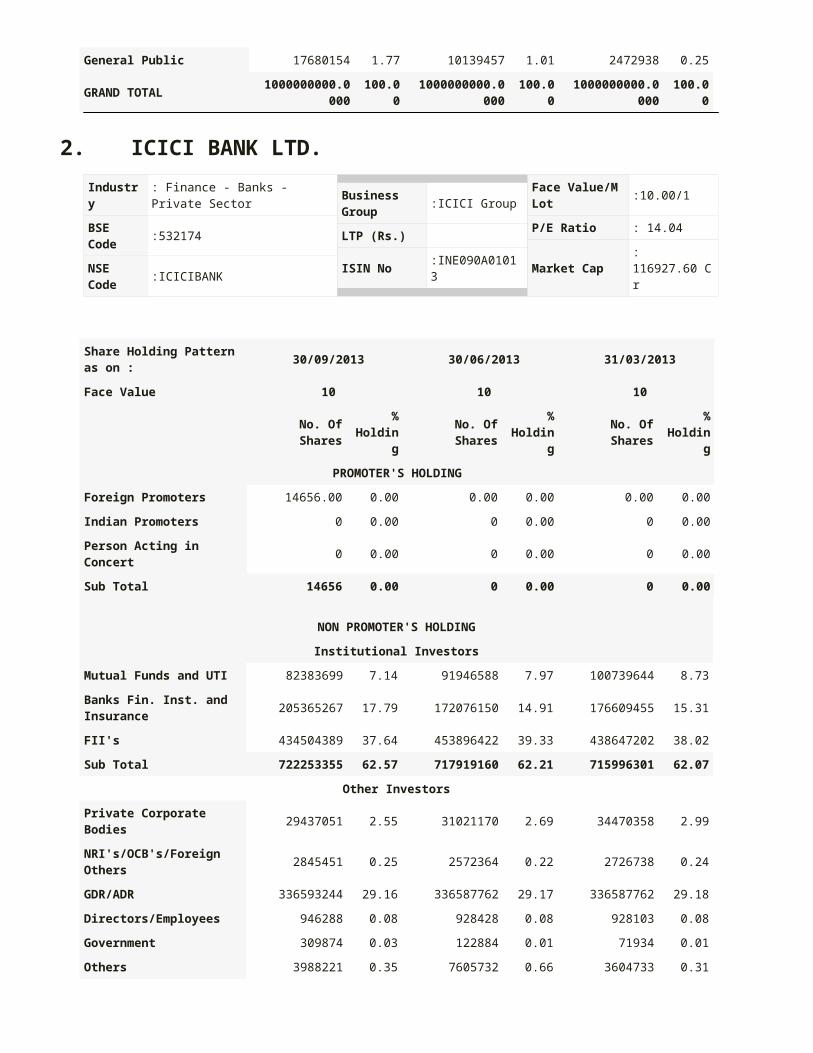
General Public 17680154 1.77 10139457 1.01 2472938 0.25
GRAND TOTAL 1000000000.000
0100.00
1000000000.0000
100.00 1000000000.000
0100.00
2. ICICI BANK LTD.
Industry : Finance - Banks - Private Sector
BSE Code :532174
NSE Code :ICICIBANK
Business Group :ICICI Group
LTP (Rs.)
ISIN No :INE090A01013
Face Value/M Lot :10.00/1
P/E Ratio : 14.04
Market Cap : 116927.60 Cr
Share Holding Pattern as on :
30/09/2013 30/06/2013 31/03/2013
Face Value 10 10 10
No. Of Shares%
HoldingNo. Of Shares
% Holding
No. Of Shares%
Holding
PROMOTER'S HOLDING
Foreign Promoters 14656.00 0.00 0.00 0.00 0.00 0.00
Indian Promoters 0 0.00 0 0.00 0 0.00
Person Acting in Concert 0 0.00 0 0.00 0 0.00
Sub Total 14656 0.00 0 0.00 0 0.00
NON PROMOTER'S HOLDING
Institutional Investors
Mutual Funds and UTI 82383699 7.14 91946588 7.97 100739644 8.73
Banks Fin. Inst. and Insurance
205365267 17.79 172076150 14.91 176609455 15.31
FII's 434504389 37.64 453896422 39.33 438647202 38.02
Sub Total 722253355 62.57 717919160 62.21 715996301 62.07
Other Investors
Private Corporate Bodies 29437051 2.55 31021170 2.69 34470358 2.99
NRI's/OCB's/Foreign Others
2845451 0.25 2572364 0.22 2726738 0.24
GDR/ADR 336593244 29.16 336587762 29.17 336587762 29.18
Directors/Employees 946288 0.08 928428 0.08 928103 0.08
Government 309874 0.03 122884 0.01 71934 0.01
Others 3988221 0.35 7605732 0.66 3604733 0.31
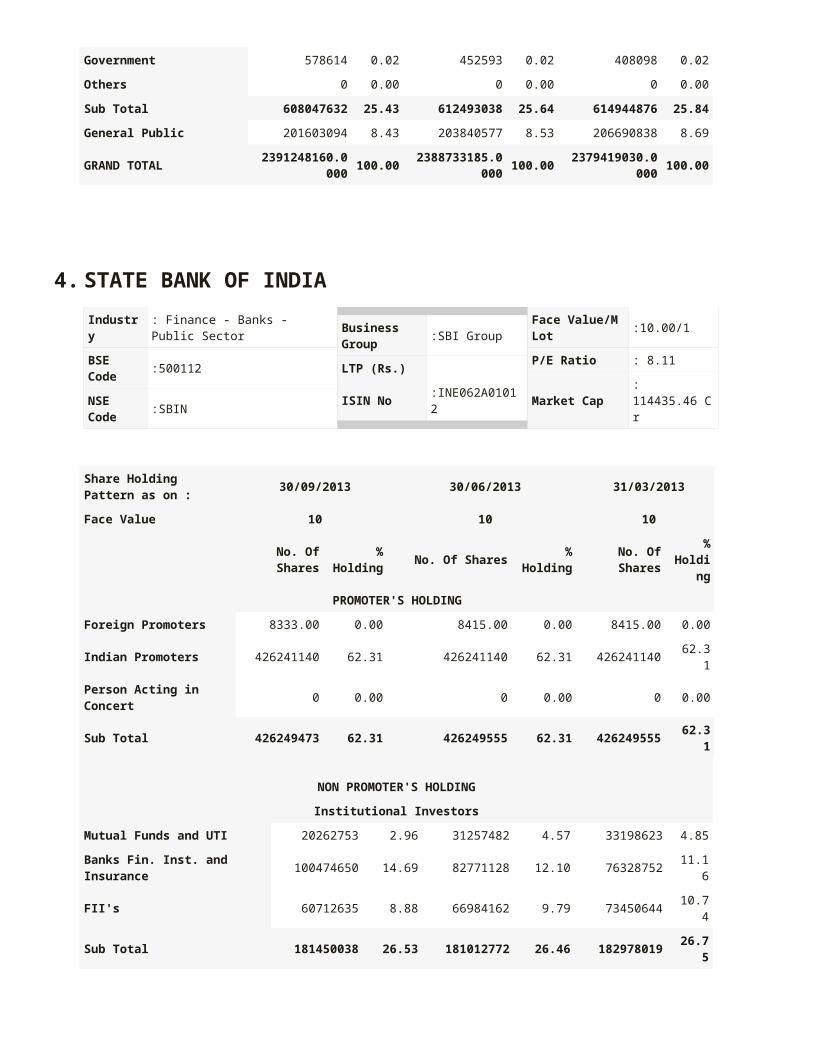
Sub Total 374120129 32.41 378838340 32.83 378389628 32.80
General Public 58006605 5.02 57297237 4.96 59195786 5.13
GRAND TOTAL 1154394745.00
00100.00
1154054737.0000
100.00 1153581715.00
00100.00
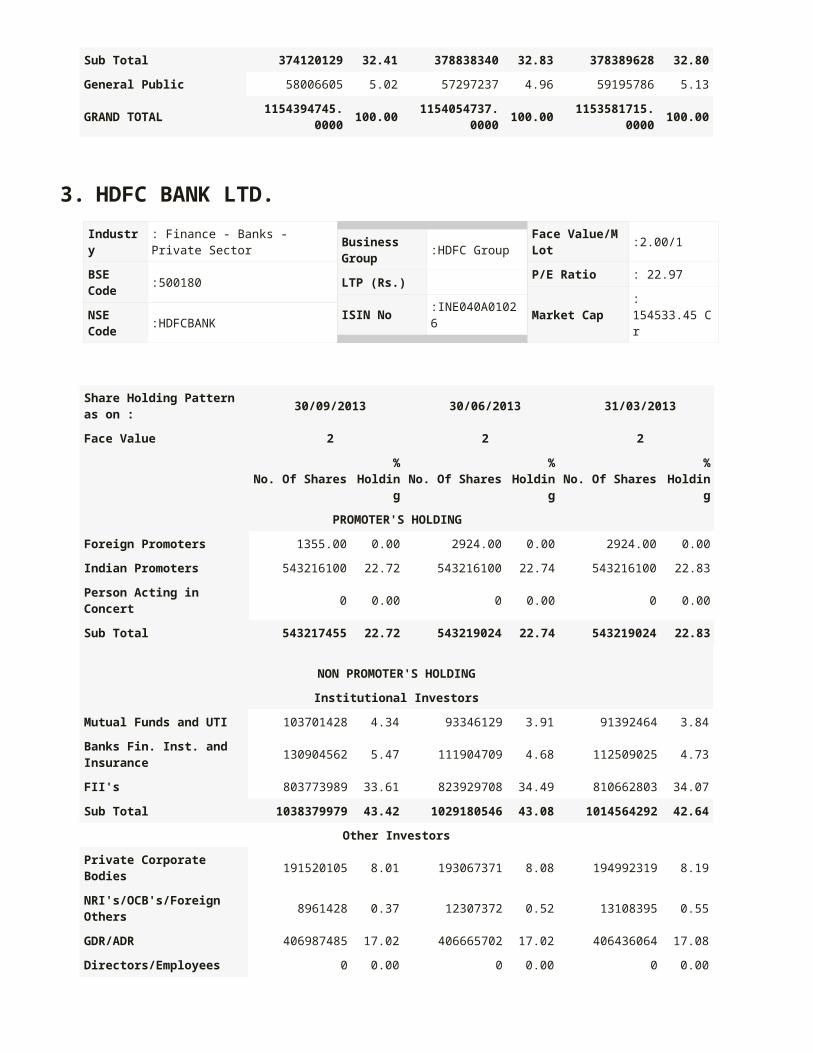
3. HDFC BANK LTD.
Industry : Finance - Banks - Private Sector
BSE Code :500180
NSE Code :HDFCBANK
Business Group :HDFC Group
LTP (Rs.)
ISIN No :INE040A01026
Face Value/M Lot :2.00/1
P/E Ratio : 22.97
Market Cap : 154533.45 Cr
Share Holding Pattern as on :
30/09/2013 30/06/2013 31/03/2013
Face Value 2 2 2
No. Of Shares % No. Of Shares % No. Of Shares %
Holding Holding Holding
PROMOTER'S HOLDING
Foreign Promoters 1355.00 0.00 2924.00 0.00 2924.00 0.00
Indian Promoters 543216100 22.72 543216100 22.74 543216100 22.83
Person Acting in Concert 0 0.00 0 0.00 0 0.00
Sub Total 543217455 22.72 543219024 22.74 543219024 22.83
NON PROMOTER'S HOLDING
Institutional Investors
Mutual Funds and UTI 103701428 4.34 93346129 3.91 91392464 3.84
Banks Fin. Inst. and Insurance
130904562 5.47 111904709 4.68 112509025 4.73
FII's 803773989 33.61 823929708 34.49 810662803 34.07
Sub Total 1038379979 43.42 1029180546 43.08 1014564292 42.64
Other Investors
Private Corporate Bodies 191520105 8.01 193067371 8.08 194992319 8.19
NRI's/OCB's/Foreign Others 8961428 0.37 12307372 0.52 13108395 0.55
GDR/ADR 406987485 17.02 406665702 17.02 406436064 17.08
Directors/Employees 0 0.00 0 0.00 0 0.00
Government 578614 0.02 452593 0.02 408098 0.02
Others 0 0.00 0 0.00 0 0.00
Sub Total 608047632 25.43 612493038 25.64 614944876 25.84
General Public 201603094 8.43 203840577 8.53 206690838 8.69
GRAND TOTAL 2391248160.000
0100.00
2388733185.0000
100.00 2379419030.000
0100.00
4.STATE BANK OF INDIA
Industry : Finance - Banks - Public Sector
BSE Code :500112
NSE Code :SBIN
Business Group :SBI Group
LTP (Rs.)
ISIN No :INE062A01012
Face Value/M Lot :10.00/1
P/E Ratio : 8.11
Market Cap : 114435.46 Cr
Share Holding Pattern as on :
30/09/2013 30/06/2013 31/03/2013
Face Value 10 10 10
No. Of Shares%
HoldingNo. Of Shares
% Holding
No. Of Shares%
Holding
PROMOTER'S HOLDING
Foreign Promoters 8333.00 0.00 8415.00 0.00 8415.00 0.00
Indian Promoters 426241140 62.31 426241140 62.31 426241140 62.31
Person Acting in Concert 0 0.00 0 0.00 0 0.00
Sub Total 426249473 62.31 426249555 62.31 426249555 62.31
NON PROMOTER'S HOLDING
Institutional Investors
Mutual Funds and UTI 20262753 2.96 31257482 4.57 33198623 4.85
Banks Fin. Inst. and Insurance 100474650 14.69 82771128 12.10 76328752 11.16
FII's 60712635 8.88 66984162 9.79 73450644 10.74
Sub Total 181450038 26.53 181012772 26.46 182978019 26.75
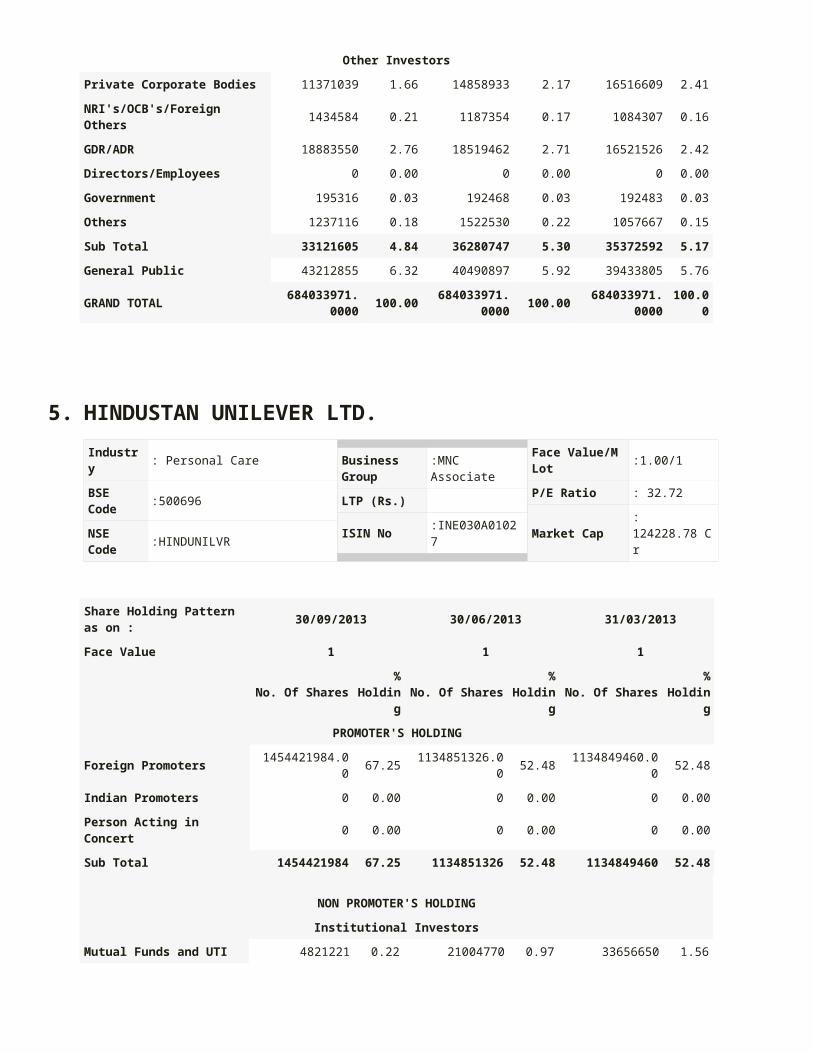
Other Investors
Private Corporate Bodies 11371039 1.66 14858933 2.17 16516609 2.41
NRI's/OCB's/Foreign Others 1434584 0.21 1187354 0.17 1084307 0.16
GDR/ADR 18883550 2.76 18519462 2.71 16521526 2.42
Directors/Employees 0 0.00 0 0.00 0 0.00
Government 195316 0.03 192468 0.03 192483 0.03
Others 1237116 0.18 1522530 0.22 1057667 0.15
Sub Total 33121605 4.84 36280747 5.30 35372592 5.17
General Public 43212855 6.32 40490897 5.92 39433805 5.76
GRAND TOTAL 684033971.00
00100.00
684033971.0000
100.00 684033971.00
00100.00
5. HINDUSTAN UNILEVER LTD.
Industry : Personal Care
BSE Code :500696
NSE Code :HINDUNILVR
Business Group :MNC Associate
LTP (Rs.)
ISIN No :INE030A01027
Face Value/M Lot :1.00/1
P/E Ratio : 32.72
Market Cap : 124228.78 Cr
Share Holding Pattern as on :
30/09/2013 30/06/2013 31/03/2013
Face Value 1 1 1
No. Of Shares%
Holding
No. Of Shares%
Holding
No. Of Shares%
Holding
PROMOTER'S HOLDING
Foreign Promoters 1454421984.00 67.25 1134851326.00 52.48 1134849460.00 52.48
Indian Promoters 0 0.00 0 0.00 0 0.00
Person Acting in Concert 0 0.00 0 0.00 0 0.00
Sub Total 1454421984 67.25 1134851326 52.48 1134849460 52.48
NON PROMOTER'S HOLDING
Institutional Investors
Mutual Funds and UTI 4821221 0.22 21004770 0.97 33656650 1.56
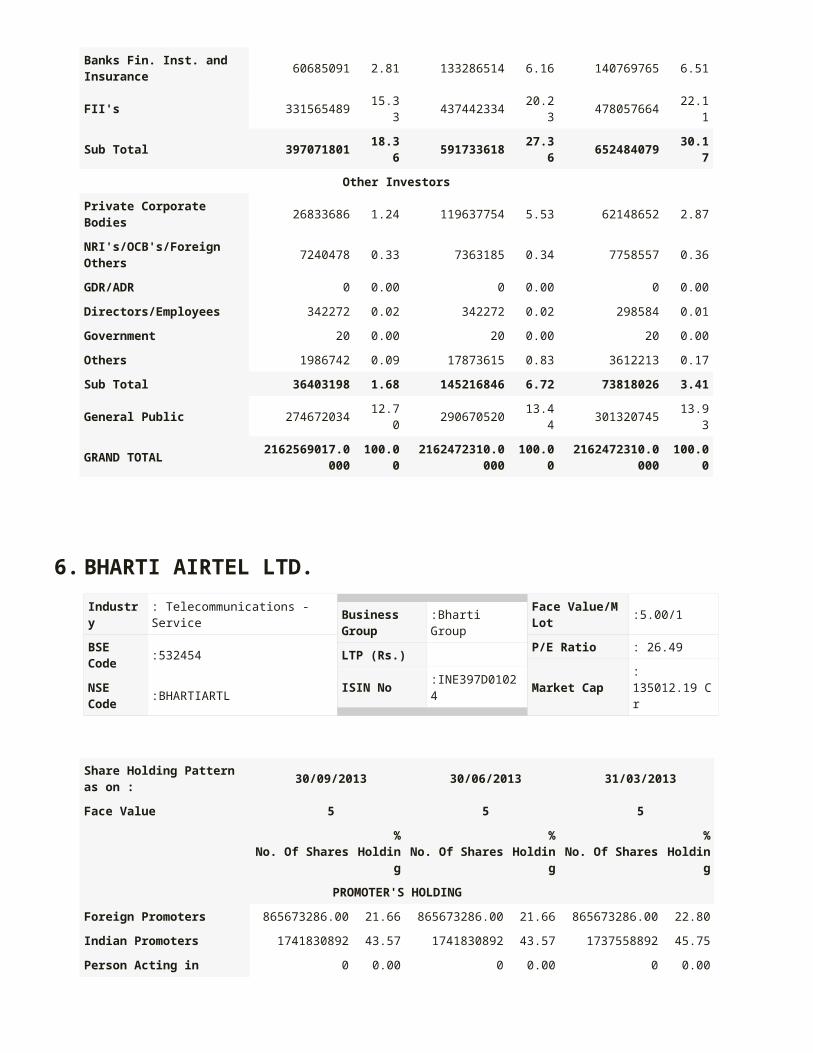
Banks Fin. Inst. and Insurance
60685091 2.81 133286514 6.16 140769765 6.51
FII's 331565489 15.33 437442334 20.23 478057664 22.11
Sub Total 397071801 18.36 591733618 27.36 652484079 30.17
Other Investors
Private Corporate Bodies 26833686 1.24 119637754 5.53 62148652 2.87
NRI's/OCB's/Foreign Others 7240478 0.33 7363185 0.34 7758557 0.36
GDR/ADR 0 0.00 0 0.00 0 0.00
Directors/Employees 342272 0.02 342272 0.02 298584 0.01
Government 20 0.00 20 0.00 20 0.00
Others 1986742 0.09 17873615 0.83 3612213 0.17
Sub Total 36403198 1.68 145216846 6.72 73818026 3.41
General Public 274672034 12.70 290670520 13.44 301320745 13.93
GRAND TOTAL 2162569017.000
0100.00
2162472310.0000
100.00 2162472310.000
0100.00
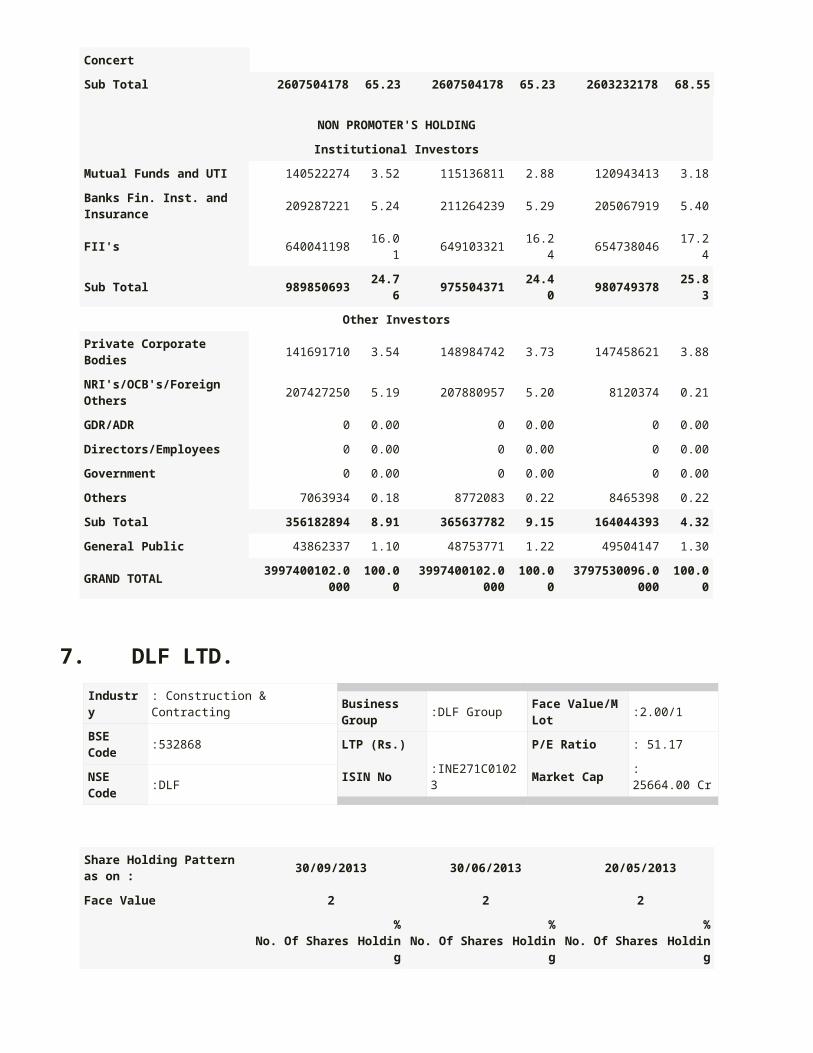
6. BHARTI AIRTEL LTD.
Industry : Telecommunications - Service
BSE Code :532454
NSE Code :BHARTIARTL
Business Group :Bharti Group
LTP (Rs.)
ISIN No :INE397D01024
Face Value/M Lot :5.00/1
P/E Ratio : 26.49
Market Cap : 135012.19 Cr
Share Holding Pattern as on :
30/09/2013 30/06/2013 31/03/2013
Face Value 5 5 5
No. Of Shares%
Holding
No. Of Shares%
Holding
No. Of Shares%
Holding
PROMOTER'S HOLDING
Foreign Promoters 865673286.00 21.66 865673286.00 21.66 865673286.00 22.80
Indian Promoters 1741830892 43.57 1741830892 43.57 1737558892 45.75
Person Acting in Concert 0 0.00 0 0.00 0 0.00
Sub Total 2607504178 65.23 2607504178 65.23 2603232178 68.55
NON PROMOTER'S HOLDING
Institutional Investors
Mutual Funds and UTI 140522274 3.52 115136811 2.88 120943413 3.18
Banks Fin. Inst. and Insurance
209287221 5.24 211264239 5.29 205067919 5.40
FII's 640041198 16.01 649103321 16.24 654738046 17.24
Sub Total 989850693 24.76 975504371 24.40 980749378 25.83
Other Investors
Private Corporate Bodies 141691710 3.54 148984742 3.73 147458621 3.88
NRI's/OCB's/Foreign Others 207427250 5.19 207880957 5.20 8120374 0.21
GDR/ADR 0 0.00 0 0.00 0 0.00
Directors/Employees 0 0.00 0 0.00 0 0.00
Government 0 0.00 0 0.00 0 0.00
Others 7063934 0.18 8772083 0.22 8465398 0.22
Sub Total 356182894 8.91 365637782 9.15 164044393 4.32
General Public 43862337 1.10 48753771 1.22 49504147 1.30
GRAND TOTAL 3997400102.000
0100.00
3997400102.0000
100.00 3797530096.000
0100.00
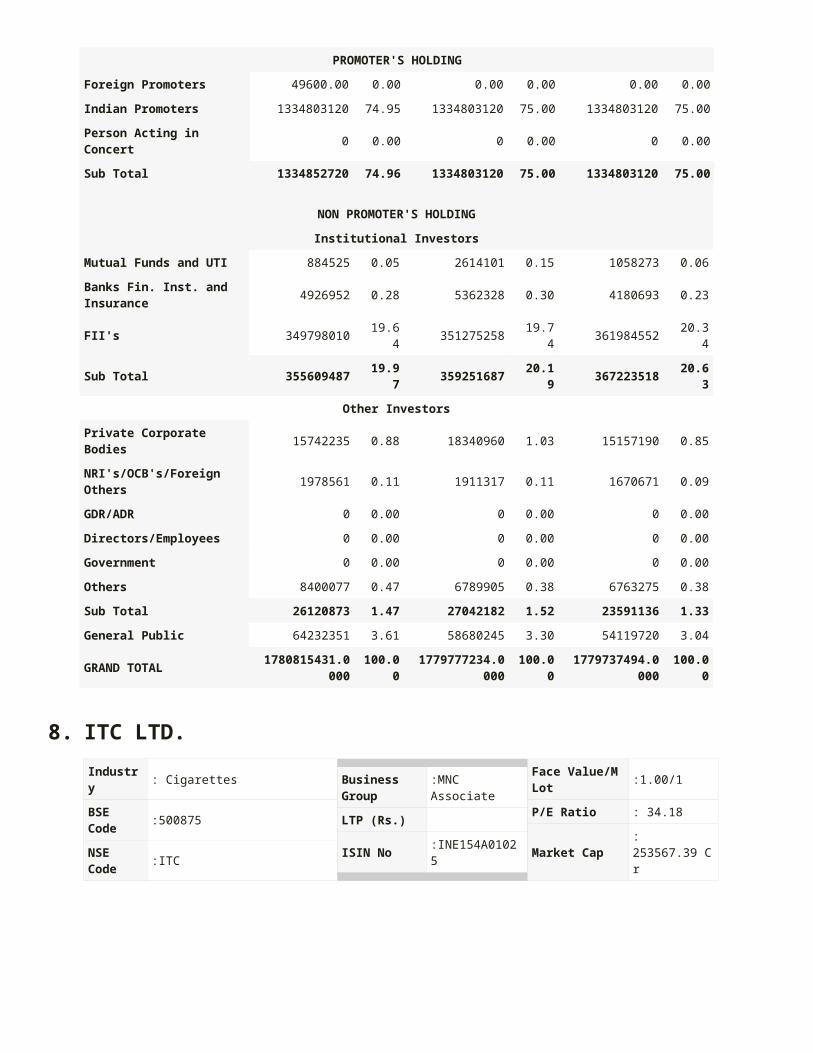
7.DLF LTD.
Industry : Construction & Contracting
BSE Code :532868
NSE Code :DLF
Business Group :DLF Group
LTP (Rs.)
ISIN No :INE271C01023
Face Value/M Lot :2.00/1
P/E Ratio : 51.17
Market Cap : 25664.00 Cr
Share Holding Pattern as on :
30/09/2013 30/06/2013 20/05/2013
Face Value 2 2 2
No. Of Shares%
Holding
No. Of Shares%
Holding
No. Of Shares%
Holding
PROMOTER'S HOLDING
Foreign Promoters 49600.00 0.00 0.00 0.00 0.00 0.00
Indian Promoters 1334803120 74.95 1334803120 75.00 1334803120 75.00
Person Acting in Concert 0 0.00 0 0.00 0 0.00
Sub Total 1334852720 74.96 1334803120 75.00 1334803120 75.00
NON PROMOTER'S HOLDING
Institutional Investors
Mutual Funds and UTI 884525 0.05 2614101 0.15 1058273 0.06
Banks Fin. Inst. and Insurance
4926952 0.28 5362328 0.30 4180693 0.23
FII's 349798010 19.64 351275258 19.74 361984552 20.34
Sub Total 355609487 19.97 359251687 20.19 367223518 20.63
Other Investors
Private Corporate Bodies 15742235 0.88 18340960 1.03 15157190 0.85
NRI's/OCB's/Foreign Others 1978561 0.11 1911317 0.11 1670671 0.09
GDR/ADR 0 0.00 0 0.00 0 0.00
Directors/Employees 0 0.00 0 0.00 0 0.00
Government 0 0.00 0 0.00 0 0.00
Others 8400077 0.47 6789905 0.38 6763275 0.38
Sub Total 26120873 1.47 27042182 1.52 23591136 1.33
General Public 64232351 3.61 58680245 3.30 54119720 3.04
GRAND TOTAL 1780815431.000
0100.00
1779777234.0000
100.00 1779737494.000
0100.00
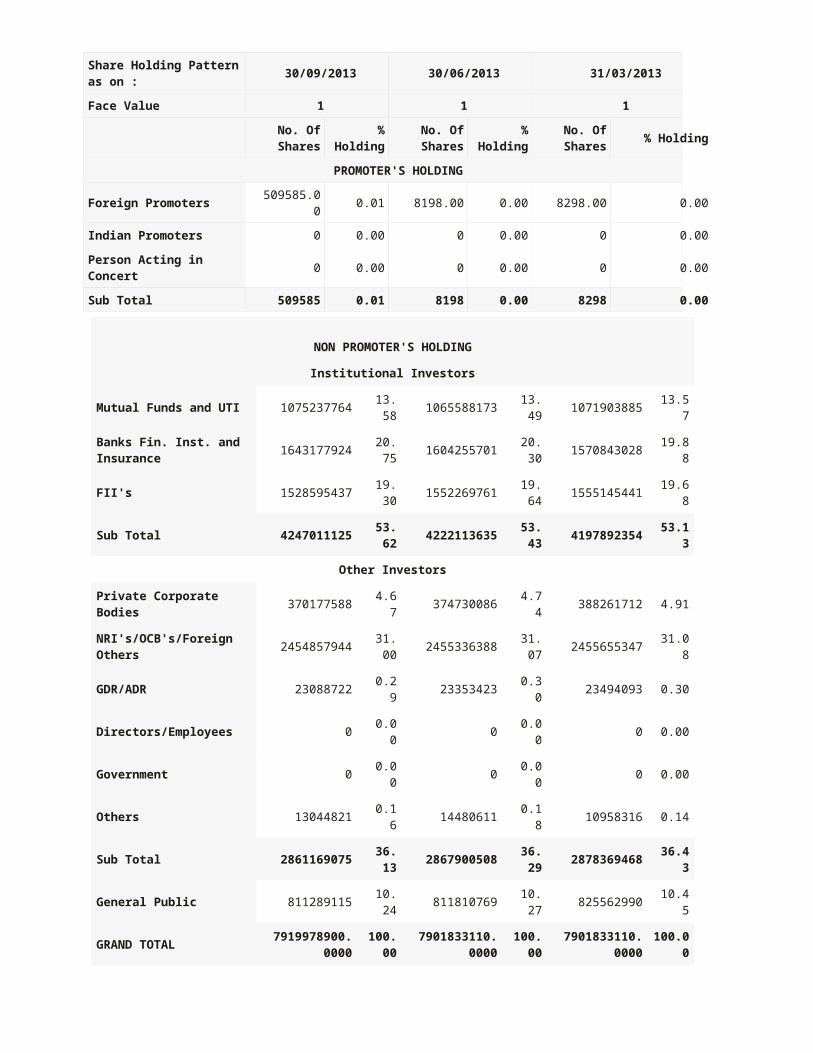
8. ITC LTD.
Industry : Cigarettes
BSE Code :500875
NSE Code :ITC
Business Group :MNC Associate
LTP (Rs.)
ISIN No :INE154A01025
Face Value/M Lot :1.00/1
P/E Ratio : 34.18
Market Cap : 253567.39 Cr
Share Holding Pattern as on : 30/09/2013 30/06/2013 31/03/2013
Face Value 1 1 1
No. Of Shares
% Holding
No. Of Shares
% HoldingNo. Of Shares
% Holding
PROMOTER'S HOLDING
Foreign Promoters 509585.00 0.01 8198.00 0.00 8298.00
Indian Promoters 0 0.00 0 0.00 0
Person Acting in Concert 0 0.00 0 0.00 0
Sub Total 509585 0.01 8198 0.00 8298
NON PROMOTER'S HOLDING
Institutional Investors
Mutual Funds and UTI 1075237764 13.58 1065588173 13.49 1071903885 13.57
Banks Fin. Inst. and Insurance
1643177924 20.75 1604255701 20.30 1570843028 19.88
FII's 1528595437 19.30 1552269761 19.64 1555145441 19.68
Sub Total 4247011125 53.62 4222113635 53.43 4197892354 53.13
Other Investors
Private Corporate Bodies 370177588 4.67 374730086 4.74 388261712 4.91
NRI's/OCB's/Foreign Others
2454857944 31.00 2455336388 31.07 2455655347 31.08
GDR/ADR 23088722 0.29 23353423 0.30 23494093 0.30
Directors/Employees 0 0.00 0 0.00 0 0.00
Government 0 0.00 0 0.00 0 0.00
Others 13044821 0.16 14480611 0.18 10958316 0.14
Sub Total 2861169075 36.13 2867900508 36.29 2878369468 36.43
General Public 811289115 10.24 811810769 10.27 825562990 10.45
GRAND TOTAL 7919978900.00
00100.0
0 7901833110.00
00100.0
0 7901833110.00
00100.00
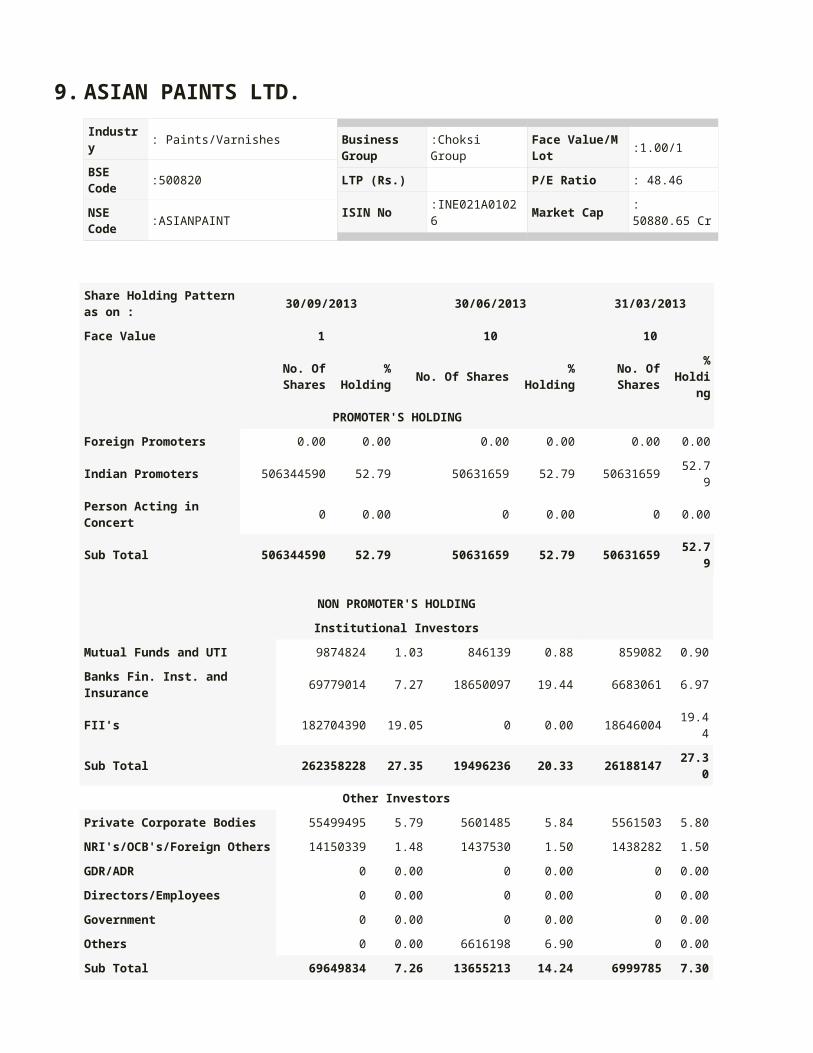
9. ASIAN PAINTS LTD.
Industry : Paints/Varnishes
BSE Code :500820
NSE Code :ASIANPAINT
Business Group :Choksi Group
LTP (Rs.)
ISIN No :INE021A01026
Face Value/M Lot :1.00/1
P/E Ratio : 48.46
Market Cap : 50880.65 Cr
Share Holding Pattern as on :
30/09/2013 30/06/2013 31/03/2013
Face Value 1 10 10
No. Of Shares%
HoldingNo. Of Shares
% Holding
No. Of Shares
% Holdin
g
PROMOTER'S HOLDING
Foreign Promoters 0.00 0.00 0.00 0.00 0.00 0.00
Indian Promoters 506344590 52.79 50631659 52.79 50631659 52.79
Person Acting in Concert 0 0.00 0 0.00 0 0.00
Sub Total 506344590 52.79 50631659 52.79 50631659 52.79
NON PROMOTER'S HOLDING
Institutional Investors
Mutual Funds and UTI 9874824 1.03 846139 0.88 859082 0.90
Banks Fin. Inst. and Insurance 69779014 7.27 18650097 19.44 6683061 6.97
FII's 182704390 19.05 0 0.00 18646004 19.44
Sub Total 262358228 27.35 19496236 20.33 26188147 27.30
Other Investors
Private Corporate Bodies 55499495 5.79 5601485 5.84 5561503 5.80
NRI's/OCB's/Foreign Others 14150339 1.48 1437530 1.50 1438282 1.50
GDR/ADR 0 0.00 0 0.00 0 0.00
Directors/Employees 0 0.00 0 0.00 0 0.00
Government 0 0.00 0 0.00 0 0.00
Others 0 0.00 6616198 6.90 0 0.00
Sub Total 69649834 7.26 13655213 14.24 6999785 7.30
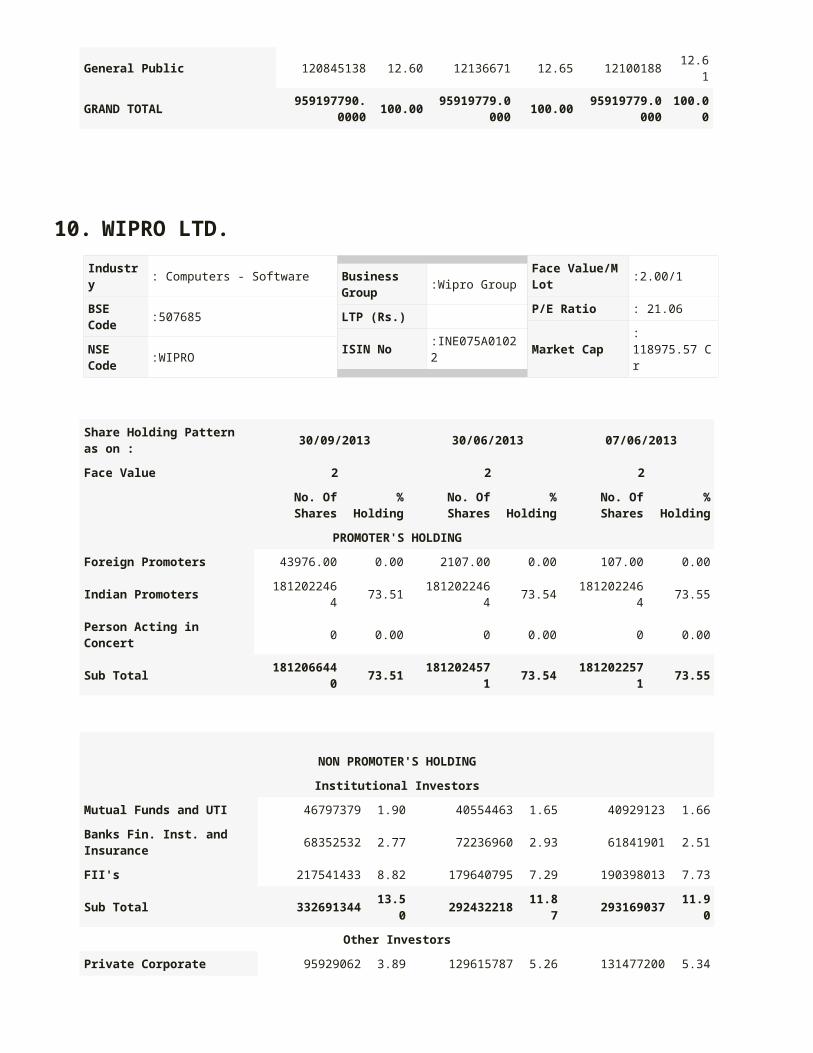
General Public 120845138 12.60 12136671 12.65 12100188 12.61
GRAND TOTAL 959197790.00
00100.00
95919779.0000
100.00 95919779.000
0100.00
10. WIPRO LTD.
Industry : Computers - Software
BSE Code :507685
NSE Code :WIPRO
Business Group :Wipro Group
LTP (Rs.)
ISIN No :INE075A01022
Face Value/M Lot :2.00/1
P/E Ratio : 21.06
Market Cap : 118975.57 Cr
Share Holding Pattern as on :
30/09/2013 30/06/2013 07/06/2013
Face Value 2 2 2
No. Of Shares
% Holding
No. Of Shares
% Holding
No. Of Shares
% Holding
PROMOTER'S HOLDING
Foreign Promoters 43976.00 0.00 2107.00 0.00 107.00 0.00
Indian Promoters 1812022464 73.51 1812022464 73.54 1812022464 73.55
Person Acting in Concert 0 0.00 0 0.00 0 0.00
Sub Total 1812066440 73.51 1812024571 73.54 1812022571 73.55
NON PROMOTER'S HOLDING
Institutional Investors
Mutual Funds and UTI 46797379 1.90 40554463 1.65 40929123 1.66
Banks Fin. Inst. and Insurance
68352532 2.77 72236960 2.93 61841901 2.51
FII's 217541433 8.82 179640795 7.29 190398013 7.73
Sub Total 332691344 13.50 292432218 11.87 293169037 11.90
Other Investors
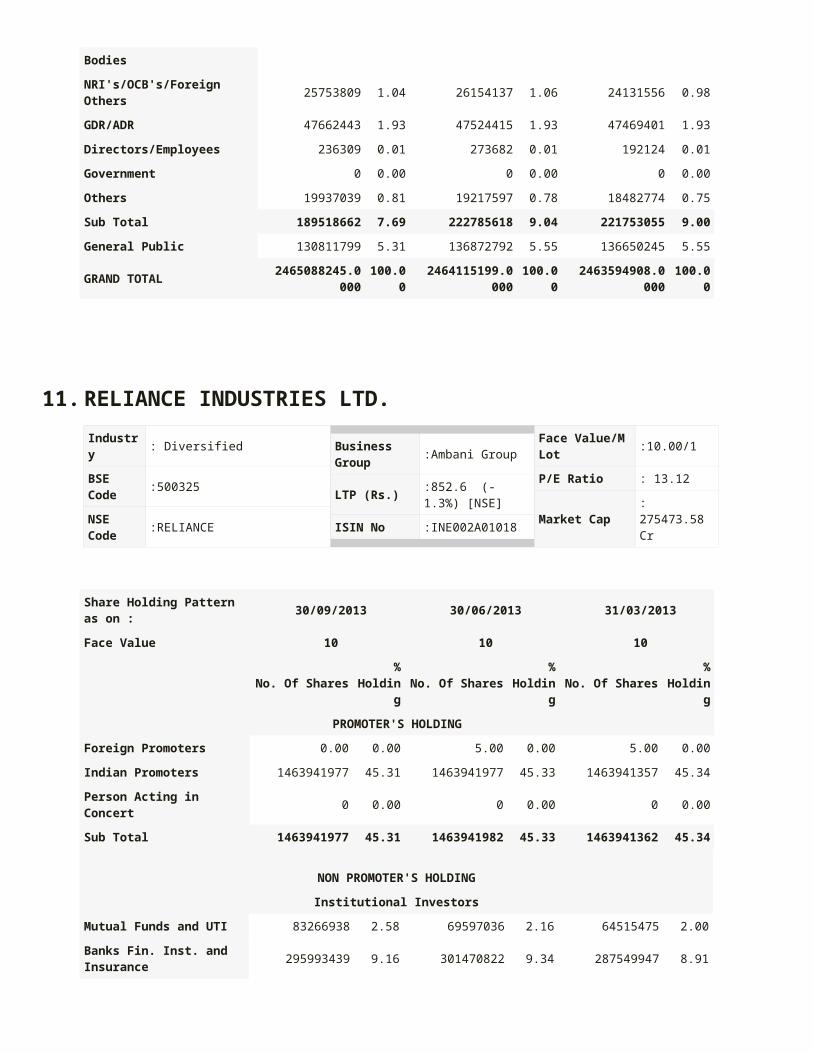
Private Corporate Bodies 95929062 3.89 129615787 5.26 131477200 5.34
NRI's/OCB's/Foreign Others 25753809 1.04 26154137 1.06 24131556 0.98
GDR/ADR 47662443 1.93 47524415 1.93 47469401 1.93
Directors/Employees 236309 0.01 273682 0.01 192124 0.01
Government 0 0.00 0 0.00 0 0.00
Others 19937039 0.81 19217597 0.78 18482774 0.75
Sub Total 189518662 7.69 222785618 9.04 221753055 9.00
General Public 130811799 5.31 136872792 5.55 136650245 5.55
GRAND TOTAL 2465088245.000
0100.00
2464115199.0000
100.00 2463594908.000
0100.00
11. RELIANCE INDUSTRIES LTD.
Industry : Diversified
BSE Code :500325
NSE Code :RELIANCE
Business Group :Ambani Group
LTP (Rs.) :852.6 (-1.3%) [NSE]
ISIN No :INE002A01018
Face Value/M Lot :10.00/1
P/E Ratio : 13.12
Market Cap : 275473.58 Cr
Share Holding Pattern as on :
30/09/2013 30/06/2013 31/03/2013
Face Value 10 10 10
No. Of Shares%
Holding
No. Of Shares%
Holding
No. Of Shares%
Holding
PROMOTER'S HOLDING
Foreign Promoters 0.00 0.00 5.00 0.00 5.00 0.00
Indian Promoters 1463941977 45.31 1463941977 45.33 1463941357 45.34
Person Acting in Concert 0 0.00 0 0.00 0 0.00
Sub Total 1463941977 45.31 1463941982 45.33 1463941362 45.34
NON PROMOTER'S HOLDING
Institutional Investors
Mutual Funds and UTI 83266938 2.58 69597036 2.16 64515475 2.00
Banks Fin. Inst. and Insurance
295993439 9.16 301470822 9.34 287549947 8.91
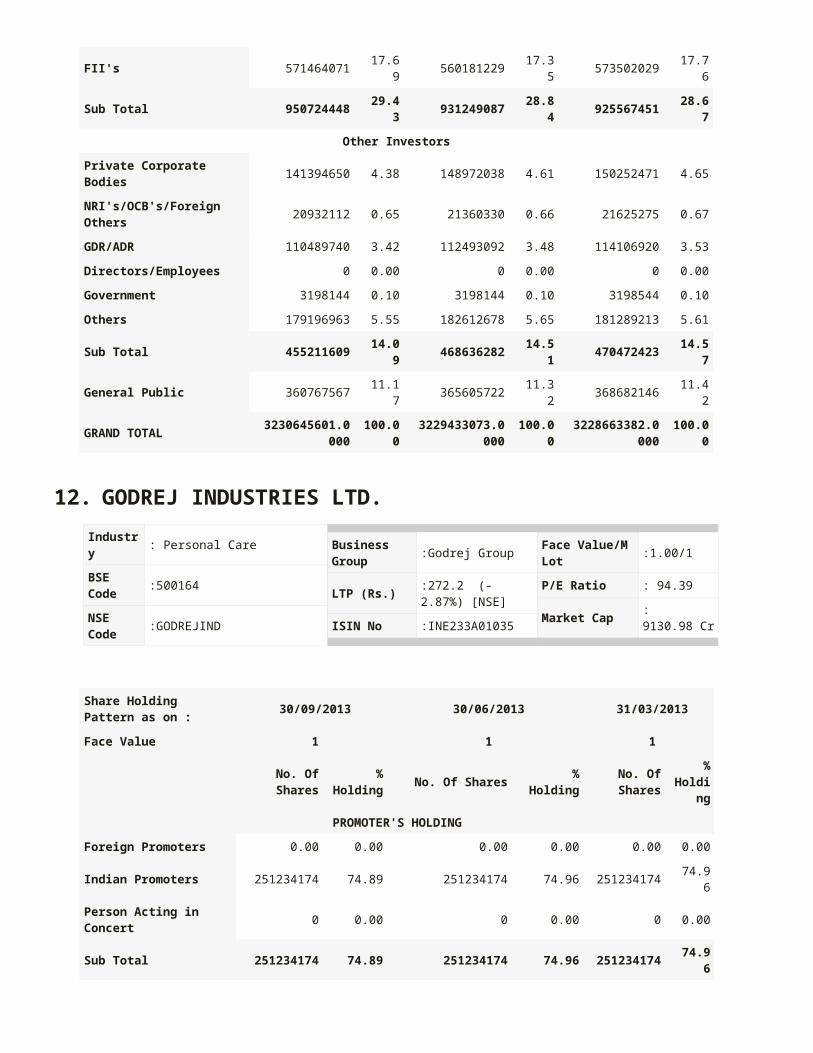
FII's 571464071 17.69 560181229 17.35 573502029 17.76
Sub Total 950724448 29.43 931249087 28.84 925567451 28.67
Other Investors
Private Corporate Bodies 141394650 4.38 148972038 4.61 150252471 4.65
NRI's/OCB's/Foreign Others 20932112 0.65 21360330 0.66 21625275 0.67
GDR/ADR 110489740 3.42 112493092 3.48 114106920 3.53
Directors/Employees 0 0.00 0 0.00 0 0.00
Government 3198144 0.10 3198144 0.10 3198544 0.10
Others 179196963 5.55 182612678 5.65 181289213 5.61
Sub Total 455211609 14.09 468636282 14.51 470472423 14.57
General Public 360767567 11.17 365605722 11.32 368682146 11.42
GRAND TOTAL 3230645601.000
0100.00
3229433073.0000
100.00 3228663382.000
0100.00
12. GODREJ INDUSTRIES LTD.
Industry : Personal Care
BSE Code :500164
NSE Code :GODREJIND
Business Group :Godrej Group
LTP (Rs.) :272.2 (-2.87%) [NSE]
ISIN No :INE233A01035
Face Value/M Lot :1.00/1
P/E Ratio : 94.39
Market Cap : 9130.98 Cr
Share Holding Pattern as on :
30/09/2013 30/06/2013 31/03/2013
Face Value 1 1 1
No. Of Shares
% Holding
No. Of Shares % HoldingNo. Of
Shares
% Holdin
g
PROMOTER'S HOLDING
Foreign Promoters 0.00 0.00 0.00 0.00 0.00 0.00
Indian Promoters 251234174 74.89 251234174 74.96 251234174 74.96
Person Acting in Concert 0 0.00 0 0.00 0 0.00
Sub Total 251234174 74.89 251234174 74.96 251234174 74.96
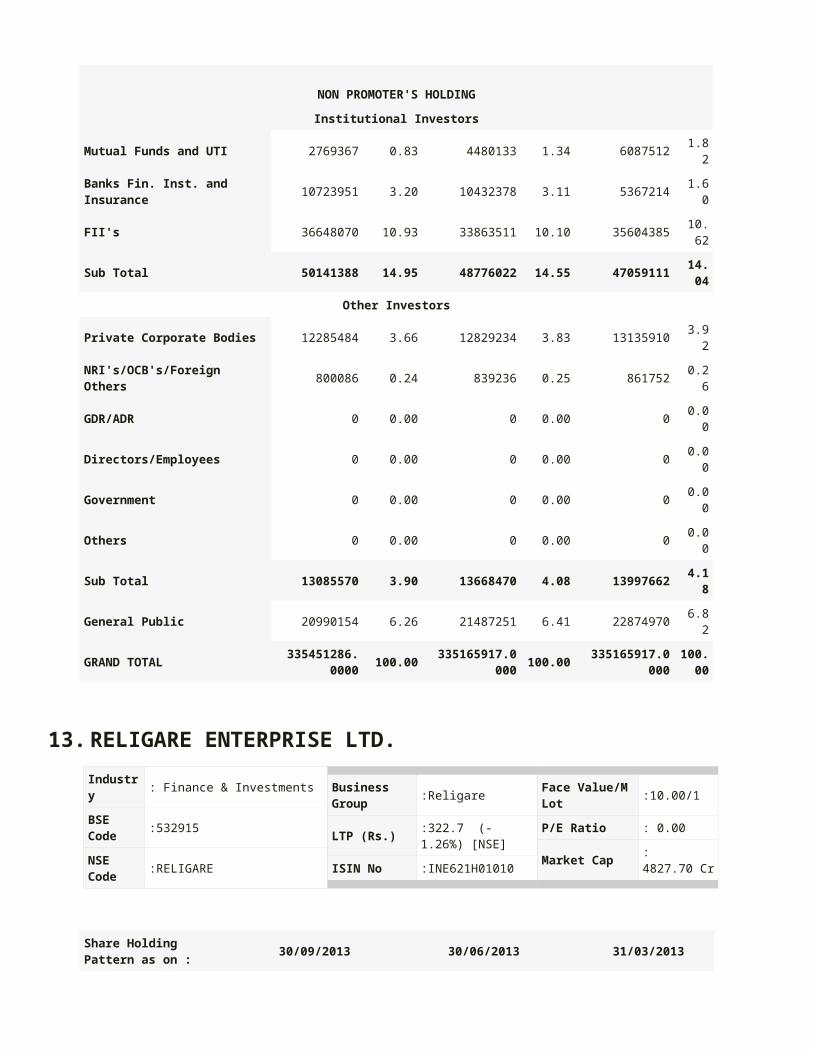
NON PROMOTER'S HOLDING
Institutional Investors
Mutual Funds and UTI 2769367 0.83 4480133 1.34 6087512 1.82
Banks Fin. Inst. and Insurance 10723951 3.20 10432378 3.11 5367214 1.60
FII's 36648070 10.93 33863511 10.10 35604385 10.6
2
Sub Total 50141388 14.95 48776022 14.55 47059111 14.0
4
Other Investors
Private Corporate Bodies 12285484 3.66 12829234 3.83 13135910 3.92
NRI's/OCB's/Foreign Others 800086 0.24 839236 0.25 861752 0.26
GDR/ADR 0 0.00 0 0.00 0 0.00
Directors/Employees 0 0.00 0 0.00 0 0.00
Government 0 0.00 0 0.00 0 0.00
Others 0 0.00 0 0.00 0 0.00
Sub Total 13085570 3.90 13668470 4.08 13997662 4.18
General Public 20990154 6.26 21487251 6.41 22874970 6.82
GRAND TOTAL 335451286.00
00100.00
335165917.0000
100.00 335165917.000
0100.0
0
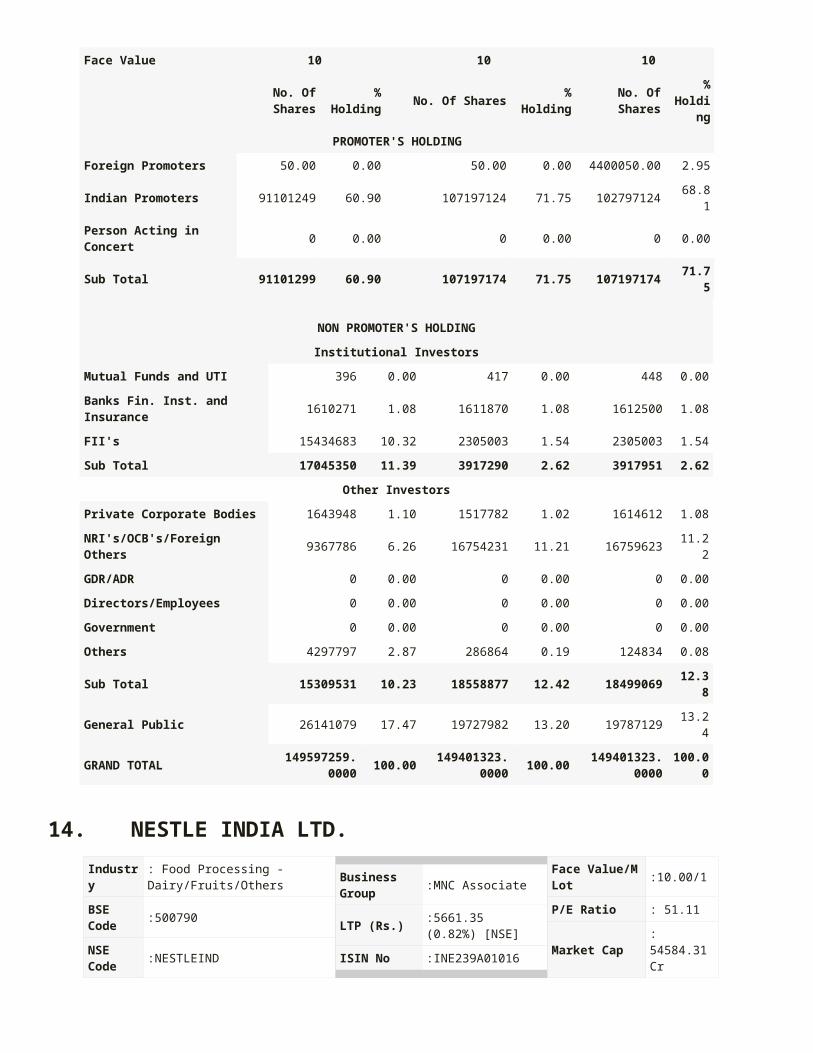
13. RELIGARE ENTERPRISE LTD.
Industry : Finance & Investments
BSE Code :532915
NSE Code :RELIGARE
Business Group :Religare
LTP (Rs.) :322.7 (-1.26%) [NSE]
ISIN No :INE621H01010
Face Value/M Lot :10.00/1
P/E Ratio : 0.00
Market Cap : 4827.70 Cr
Share Holding Pattern as on :
30/09/2013 30/06/2013 31/03/2013
Face Value 10 10 10
No. Of % No. Of Shares % No. Of Shares %
Shares Holding HoldingHoldin
g
PROMOTER'S HOLDING
Foreign Promoters 50.00 0.00 50.00 0.00 4400050.00 2.95
Indian Promoters 91101249 60.90 107197124 71.75 102797124 68.81
Person Acting in Concert 0 0.00 0 0.00 0 0.00
Sub Total 91101299 60.90 107197174 71.75 107197174 71.75
NON PROMOTER'S HOLDING
Institutional Investors
Mutual Funds and UTI 396 0.00 417 0.00 448 0.00
Banks Fin. Inst. and Insurance 1610271 1.08 1611870 1.08 1612500 1.08
FII's 15434683 10.32 2305003 1.54 2305003 1.54
Sub Total 17045350 11.39 3917290 2.62 3917951 2.62
Other Investors
Private Corporate Bodies 1643948 1.10 1517782 1.02 1614612 1.08
NRI's/OCB's/Foreign Others 9367786 6.26 16754231 11.21 16759623 11.22
GDR/ADR 0 0.00 0 0.00 0 0.00
Directors/Employees 0 0.00 0 0.00 0 0.00
Government 0 0.00 0 0.00 0 0.00
Others 4297797 2.87 286864 0.19 124834 0.08
Sub Total 15309531 10.23 18558877 12.42 18499069 12.38
General Public 26141079 17.47 19727982 13.20 19787129 13.24
GRAND TOTAL 149597259.00
00100.00
149401323.0000
100.00 149401323.00
00100.00
14. NESTLE INDIA LTD.
Industry: Food Processing - Dairy/Fruits/Others
BSE Code
:500790
NSE Code
:NESTLEIND
Business Group
:MNC Associate
LTP (Rs.):5661.35 (0.82%) [NSE]
ISIN No :INE239A01016
Face Value/M Lot
:10.00/1
P/E Ratio : 51.11
Market Cap: 54584.31 Cr
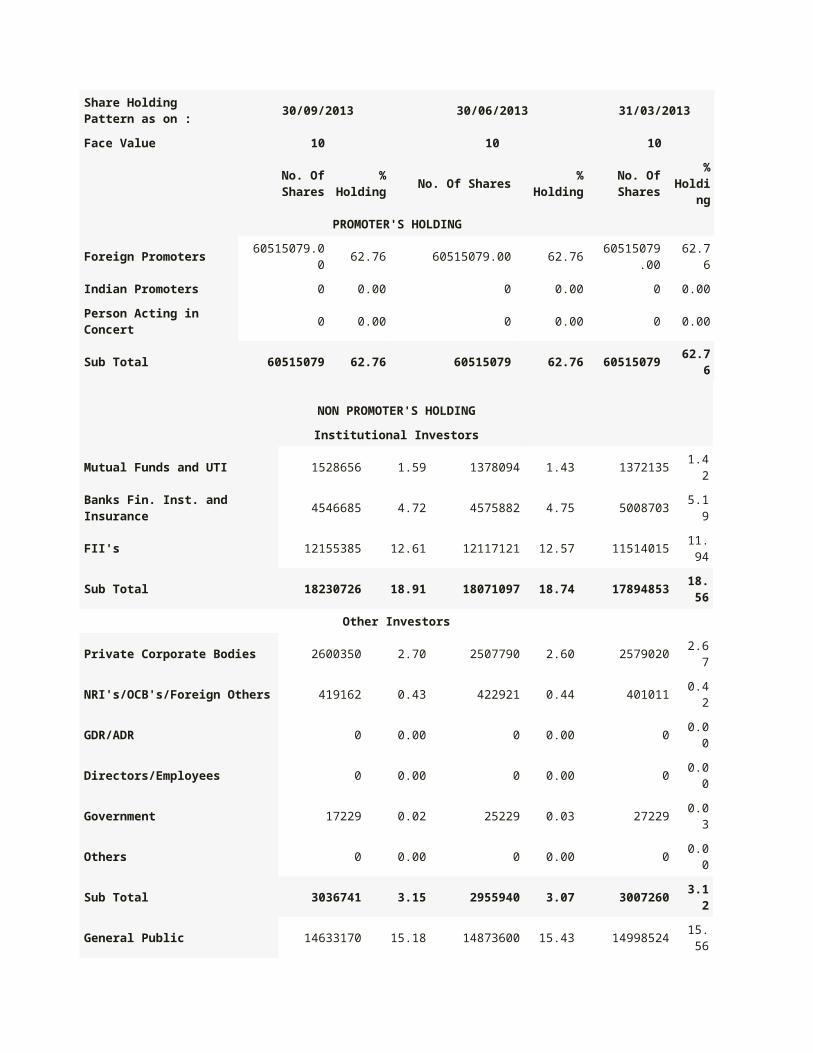
Share Holding Pattern as on :
30/09/2013 30/06/2013 31/03/2013
Face Value 10 10 10
No. Of Shares%
HoldingNo. Of Shares % Holding
No. Of Shares
% Holdin
g
PROMOTER'S HOLDING
Foreign Promoters 60515079.00 62.76 60515079.00 62.76 60515079.0
0 62.76
Indian Promoters 0 0.00 0 0.00 0 0.00
Person Acting in Concert 0 0.00 0 0.00 0 0.00
Sub Total 60515079 62.76 60515079 62.76 60515079 62.76
NON PROMOTER'S HOLDING
Institutional Investors
Mutual Funds and UTI 1528656 1.59 1378094 1.43 1372135 1.42
Banks Fin. Inst. and Insurance 4546685 4.72 4575882 4.75 5008703 5.19
FII's 12155385 12.61 12117121 12.57 11514015 11.9
4
Sub Total 18230726 18.91 18071097 18.74 17894853 18.5
6
Other Investors
Private Corporate Bodies 2600350 2.70 2507790 2.60 2579020 2.67
NRI's/OCB's/Foreign Others 419162 0.43 422921 0.44 401011 0.42
GDR/ADR 0 0.00 0 0.00 0 0.00
Directors/Employees 0 0.00 0 0.00 0 0.00
Government 17229 0.02 25229 0.03 27229 0.03
Others 0 0.00 0 0.00 0 0.00
Sub Total 3036741 3.15 2955940 3.07 3007260 3.12
General Public 14633170 15.18 14873600 15.43 14998524 15.5
6
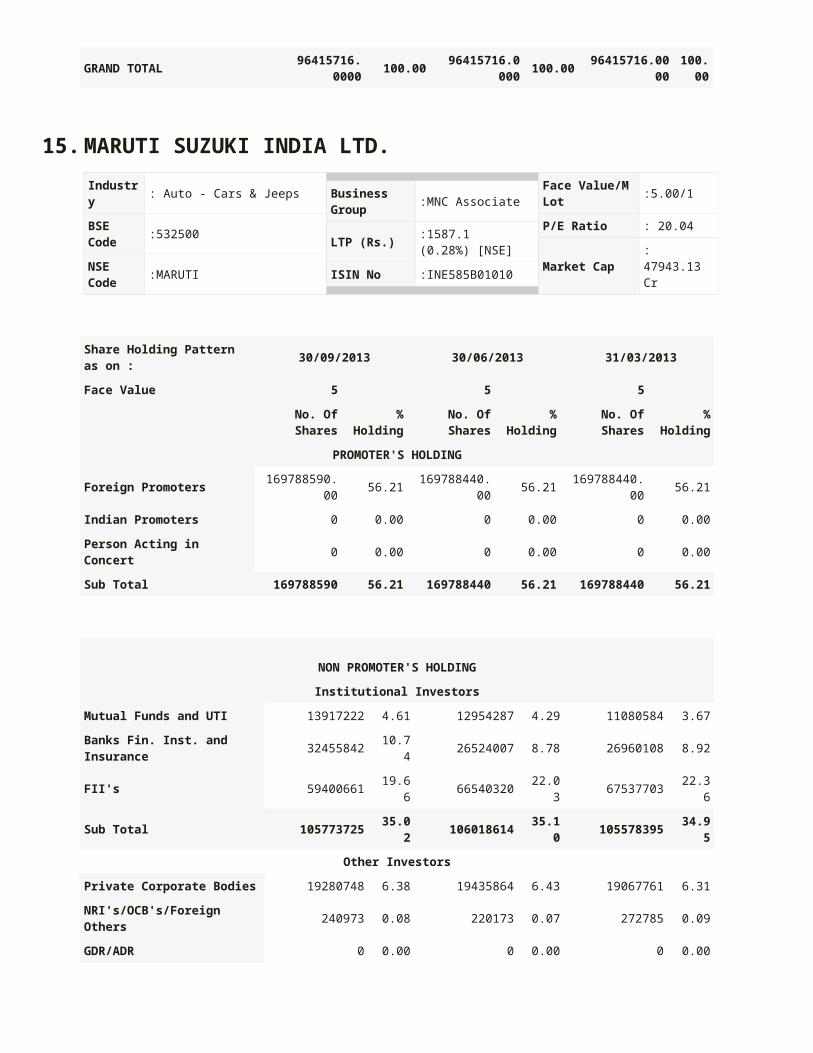
GRAND TOTAL 96415716.00
00100.00
96415716.0000
100.00 96415716.0000100.0
0
15. MARUTI SUZUKI INDIA LTD.
Industry : Auto - Cars & Jeeps
BSE Code :532500
NSE Code :MARUTI
Business Group :MNC Associate
LTP (Rs.) :1587.1 (0.28%) [NSE]
ISIN No :INE585B01010
Face Value/M Lot :5.00/1
P/E Ratio : 20.04
Market Cap : 47943.13 Cr
Share Holding Pattern as on :
30/09/2013 30/06/2013 31/03/2013
Face Value 5 5 5
No. Of Shares%
HoldingNo. Of Shares
% Holding
No. Of Shares%
Holding
PROMOTER'S HOLDING
Foreign Promoters 169788590.0
0 56.21
169788440.00
56.21 169788440.0
0 56.21
Indian Promoters 0 0.00 0 0.00 0 0.00
Person Acting in Concert 0 0.00 0 0.00 0 0.00
Sub Total 169788590 56.21 169788440 56.21 169788440 56.21
NON PROMOTER'S HOLDING
Institutional Investors
Mutual Funds and UTI 13917222 4.61 12954287 4.29 11080584 3.67
Banks Fin. Inst. and Insurance 32455842 10.74 26524007 8.78 26960108 8.92
FII's 59400661 19.66 66540320 22.03 67537703 22.36
Sub Total 105773725 35.02 106018614 35.10 105578395 34.95
Other Investors
Private Corporate Bodies 19280748 6.38 19435864 6.43 19067761 6.31
NRI's/OCB's/Foreign Others 240973 0.08 220173 0.07 272785 0.09
GDR/ADR 0 0.00 0 0.00 0 0.00
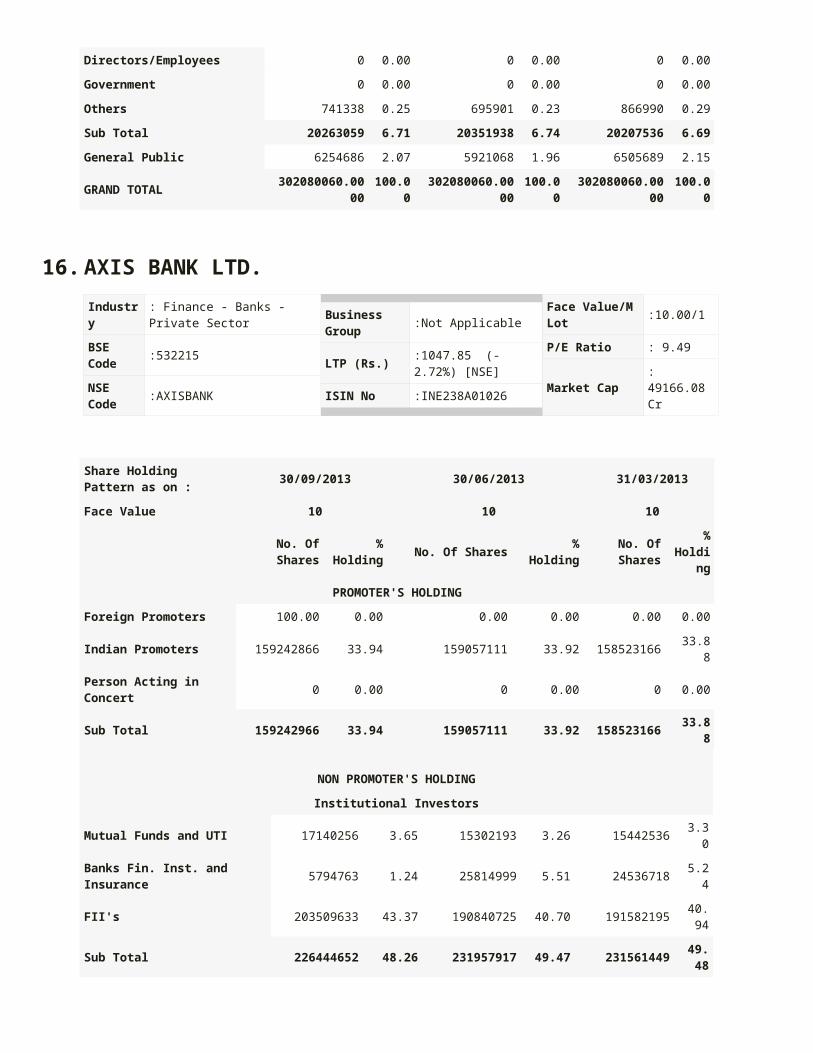
Directors/Employees 0 0.00 0 0.00 0 0.00
Government 0 0.00 0 0.00 0 0.00
Others 741338 0.25 695901 0.23 866990 0.29
Sub Total 20263059 6.71 20351938 6.74 20207536 6.69
General Public 6254686 2.07 5921068 1.96 6505689 2.15
GRAND TOTAL 302080060.0000 100.00 302080060.0000 100.00 302080060.0000 100.00
16. AXIS BANK LTD.
Industry : Finance - Banks - Private Sector
BSE Code :532215
NSE Code :AXISBANK
Business Group :Not Applicable
LTP (Rs.) :1047.85 (-2.72%) [NSE]
ISIN No :INE238A01026
Face Value/M Lot :10.00/1
P/E Ratio : 9.49
Market Cap : 49166.08 Cr
Share Holding Pattern as on :
30/09/2013 30/06/2013 31/03/2013
Face Value 10 10 10
No. Of Shares%
HoldingNo. Of Shares % Holding
No. Of Shares
% Holdin
g
PROMOTER'S HOLDING
Foreign Promoters 100.00 0.00 0.00 0.00 0.00 0.00
Indian Promoters 159242866 33.94 159057111 33.92 158523166 33.88
Person Acting in Concert 0 0.00 0 0.00 0 0.00
Sub Total 159242966 33.94 159057111 33.92 158523166 33.88
NON PROMOTER'S HOLDING
Institutional Investors
Mutual Funds and UTI 17140256 3.65 15302193 3.26 15442536 3.30
Banks Fin. Inst. and Insurance 5794763 1.24 25814999 5.51 24536718 5.24
FII's 203509633 43.37 190840725 40.70 191582195 40.9
4
Sub Total 226444652 48.26 231957917 49.47 231561449 49.4
8
Other Investors
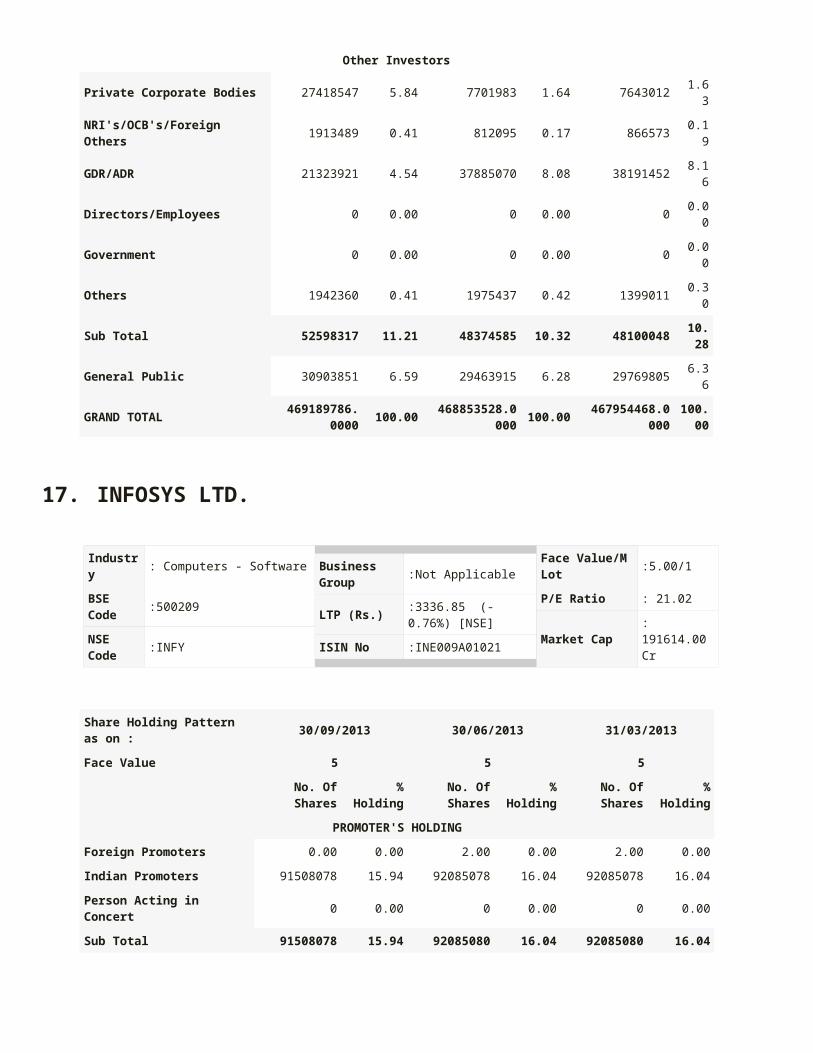
Private Corporate Bodies 27418547 5.84 7701983 1.64 7643012 1.63
NRI's/OCB's/Foreign Others 1913489 0.41 812095 0.17 866573 0.19
GDR/ADR 21323921 4.54 37885070 8.08 38191452 8.16
Directors/Employees 0 0.00 0 0.00 0 0.00
Government 0 0.00 0 0.00 0 0.00
Others 1942360 0.41 1975437 0.42 1399011 0.30
Sub Total 52598317 11.21 48374585 10.32 48100048 10.2
8
General Public 30903851 6.59 29463915 6.28 29769805 6.36
GRAND TOTAL 469189786.00
00100.00
468853528.0000
100.00 467954468.000
0100.0
0
17. INFOSYS LTD.
Industry : Computers - Software
BSE Code :500209
NSE Code :INFY
Business Group :Not Applicable
LTP (Rs.) :3336.85 (-0.76%) [NSE]
ISIN No :INE009A01021
Face Value/M Lot :5.00/1
P/E Ratio : 21.02
Market Cap : 191614.00 Cr
Share Holding Pattern as on :
30/09/2013 30/06/2013 31/03/2013
Face Value 5 5 5
No. Of Shares
% Holding
No. Of Shares
% Holding
No. Of Shares
% Holding
PROMOTER'S HOLDING
Foreign Promoters 0.00 0.00 2.00 0.00 2.00 0.00
Indian Promoters 91508078 15.94 92085078 16.04 92085078 16.04
Person Acting in Concert 0 0.00 0 0.00 0 0.00
Sub Total 91508078 15.94 92085080 16.04 92085080 16.04
NON PROMOTER'S HOLDING
Institutional Investors
Mutual Funds and UTI 30344521 5.28 31401072 5.47 31147526 5.42
Banks Fin. Inst. and Insurance 62442997 10.87 73534737 12.81 69445010 12.09
FII's 229275165 39.93 227132629 39.55 232653231 40.52
Sub Total 322062683 56.09 332068438 57.83 333245767 58.03
Other Investors
Private Corporate Bodies 3000408 0.52 2610752 0.45 3363588 0.59
NRI's/OCB's/Foreign Others 6745327 1.17 7106602 1.24 7364106 1.28
GDR/ADR 87051667 15.16 72049977 12.55 70883217 12.34
Directors/Employees 0 0.00 0 0.00 0 0.00
Government 0 0.00 0 0.00 0 0.00
Others 3541291 0.62 3393022 0.59 3141180 0.55
Sub Total 100338693 17.47 85160353 14.83 84752091 14.76
General Public 60326712 10.51 64922295 11.31 64153228 11.17
GRAND TOTAL 574236166.0000 100.00 574236166.0000 100.00 574236166.0000 100.00
18. PUNJAB NATIONAL BANK
Industry : Finance - Banks - Public Sector
BSE Code :532461
NSE Code :PNB
Business Group :Public Sector
LTP (Rs.) :505.1 (-2.5%) [NSE]
ISIN No :INE160A01014
Face Value/M Lot :10.00/1
P/E Ratio : 3.76
Market Cap : 17853.94 Cr
Share Holding Pattern as on :
30/09/2013 30/06/2013 31/03/2013
Face Value 10 10 10
No. Of Shares%
HoldingNo. Of Shares % Holding
No. Of Shares
% Holdin
g
PROMOTER'S HOLDING
Foreign Promoters 166.00 0.00 0.00 0.00 0.00 0.00
Indian Promoters 204571589 57.87 204571589 57.87 204571589 57.87
Person Acting in Concert 0 0.00 0 0.00 0 0.00
Sub Total 204571755 57.87 204571589 57.87 204571589 57.87
NON PROMOTER'S HOLDING
Institutional Investors
Mutual Funds and UTI 8576615 2.43 12607380 3.57 11244164 3.18
Banks Fin. Inst. and Insurance 56204655 15.90 54699840 15.47 55710632 15.7
6
FII's 63183663 17.88 63591790 17.99 63496746 17.9
6
Sub Total 127964933 36.20 130899010 37.03 130451542 36.9
1
Other Investors
Private Corporate Bodies 2815583 0.80 2510368 0.71 3682113 1.04
NRI's/OCB's/Foreign Others 63963 0.02 65410 0.02 67128 0.02
GDR/ADR 0 0.00 0 0.00 0 0.00
Directors/Employees 0 0.00 0 0.00 0 0.00
Government 100637 0.03 100637 0.03 100637 0.03
Others 1694708 0.48 848561 0.24 861125 0.24
Sub Total 4674891 1.32 3524976 1.00 4711003 1.33
General Public 16261817 4.60 14477821 4.10 13739262 3.89
GRAND TOTAL 353473396.00
00100.00
353473396.0000
100.00 353473396.000
0100.0
0
19. HCL TECHNOLOGIES LTD.
Industry : Computers - Software
BSE Code :532281
NSE Code :HCLTECH
Business Group :HCL Group
LTP (Rs.) :1097.4 (-0.41%) [NSE]
ISIN No :INE860A01027
Face Value/M Lot :2.00/1
P/E Ratio : 20.69
Market Cap : 76645.54 Cr
Share Holding Pattern as on :
30/09/2013 30/06/2013 31/03/2013
Face Value 2 2 2
No. Of Shares%
HoldingNo. Of Shares % Holding
No. Of Shares
% Holdin
g
PROMOTER'S HOLDING
Foreign Promoters 119586580.00 17.14 119548908.00 17.16 119548908.
00 17.17
Indian Promoters 311965376 44.71 311965376 44.77 311965376 44.82
Person Acting in Concert 0 0.00 0 0.00 0 0.00
Sub Total 431551956 61.85 431514284 61.92 431514284 61.99
NON PROMOTER'S HOLDING
Institutional Investors
Mutual Funds and UTI 20221607 2.90 17835735 2.56 19585735 2.81
Banks Fin. Inst. and Insurance 19587598 2.81 27336003 3.92 26125639 3.75
FII's 181470638 26.01 170413794 24.45 169264612 24.3
2
Sub Total 221279843 31.71 215585532 30.94 214975986 30.8
8
Other Investors
Private Corporate Bodies 15530956 2.23 18487311 2.65 18981330 2.73
NRI's/OCB's/Foreign Others 10648516 1.53 10847404 1.56 11340390 1.63
GDR/ADR 0 0.00 0 0.00 0 0.00
Directors/Employees 0 0.00 0 0.00 0 0.00
Government 0 0.00 0 0.00 0 0.00
Others 1645014 0.24 2392823 0.34 1742062 0.25
Sub Total 27824486 3.99 31727538 4.55 32063782 4.61
General Public 17139184 2.46 18042503 2.59 17563988 2.52
GRAND TOTAL 697795469.00
00100.00
696869857.0000
100.00 696118040.000
0100.0
0
20. AMBUJA CEMENTS LTD.
Industry : Cement
BSE Code :500425
NSE Code :AMBUJACEM
Business Group :Ambuja Group
LTP (Rs.)
ISIN No :INE079A01024
Face Value/M Lot :2.00/1
P/E Ratio : 20.57
Market Cap : 26683.30 Cr
Share Holding Pattern as on :
30/09/2013 30/06/2013 31/03/2013
Face Value 2 2 2
No. Of Shares%
Holding
No. Of Shares%
Holding
No. Of Shares%
Holding
PROMOTER'S HOLDING
Foreign Promoters 780373436.00 50.51 780308553.00 50.55 780308553.00 50.59
Indian Promoters 0 0.00 0 0.00 0 0.00
Person Acting in Concert 0 0.00 0 0.00 0 0.00
Sub Total 780373436 50.51 780308553 50.55 780308553 50.59
NON PROMOTER'S HOLDING
Institutional Investors
Mutual Funds and UTI 8947485 0.58 15249287 0.99 20083281 1.30
Banks Fin. Inst. and Insurance
138584776 8.97 142711052 9.24 111874680 7.25
FII's 465247464 30.11 443237758 28.71 463750057 30.07
Sub Total 612779725 39.66 601198097 38.94 595708018 38.62
Other Investors
Private Corporate Bodies 7212572 0.47 6396516 0.41 7569160 0.49
NRI's/OCB's/Foreign Others 14973332 0.97 15213281 0.99 15455317 1.00
GDR/ADR 25725099 1.67 34827481 2.26 37312647 2.42
Directors/Employees 0 0.00 0 0.00 0 0.00
Government 0 0.00 0 0.00 0 0.00
Others 829662 0.05 699168 0.05 616225 0.04
Sub Total 48740665 3.15 57136446 3.70 60953349 3.95
General Public 103017710 6.67 105120190 6.81 105502216 6.84
GRAND TOTAL 1544911536.000
0100.00
1543763286.0000
100.00 1542472136.000
0100.00
ANALYSIS OF SHAREHOLDING PATTERN
Analysing the holdings of various categories of investors would give you insights into the pattern of control in the company.
Rise or fall in promoters holding is to be studied by looking at two aspects. First what is purpose of promoters in raising or reducing their equity stakes and second, the methods promoters have adopted to increase or reduce their ownership.
If the promoters are increasing their stake to pay off debts and strengthen their balance sheet. This is certainly positive for the shareholders.
Companies that have gone for share buyback also see rise in promoter’s stake. The core objective of a buyback is to create wealth, but it also increases promoter’s equity stake at no additional cost. A rise in promoter’s stake due to merges or buyback means little for investors in real terms.
Promoters of companies that have opted for rights issue are forced to step in and bail out the unsubscribed portion just in case the rights are undersubscribed. Here, there will be an unintentional rise in promoter’s stake. Shareholders declining to subscribe to rights issue and promoters chipping to rescue the issue do not qualify to be positive development.
A decline in promoter holding should also be analyzed in detail. Decline in promoter holding can be due to various factors such as issuing fresh share towards employee stock option, or it could be due to offloading/issuing of fresh shares to strategic/financial partners. These changes should be carefully studied.
Promoters offloading their holdings in the open market are a warning signal. Some dubious companies announce positive development periodically; promoters keep on offloading equity stake at the same time. It is well laid-out trap for investors.
If you see promoters increasing their stakes in successive quarters, you know that the financial performance is going to be good and the stock prices would possibly be higher. However, it’s unusual to see promoters’ holding increase on a regular basis. They usually step in to buy after a sharp market decline to shore up their holdings.
A very high promoter holding is not a good sign. A diversified holding and a good presence of institutional investors indicates that promoters have little room to make and carry out random decisions that benefit them without gauging how it would affect earnings and other shareholders.
Very low stake of promoters is perceived as diminishing confidence of promoters. This results in rampant sell off which results in loss for investors.
FII holdings in stocks are used as indicators in stock selections; stocks with high FII holdings are largely favored. However, such stocks could take a hit should the FIIs decide to sell their stake. Retail investors may perceive such selling off to be a lack of faith in the stock by the FII.
Holding by mutual funds and insurance companies is an indicator on how favored a stock is. Multiple funds holding the stock could be a sign of growth potential. Therefore, such high institutional holding may mean your investment is a tad safer since that company may then be more professionally run.
While looking at the shareholding pattern, figures for a single period is also unlikely to tell you much. Compare holding patterns with those of the previous quarters to check how holdings have changed.
Along with holding patterns, companies also disclose the entities — other than the promoters — that hold more than 1 per cent in the share capital. Companies are also required to declare the promoters’ shares that have been pledged as debt collateral.