Embed Size (px)
Citation preview

Shareholder Say-on-Pay Voting and CEO Compensation
Martin J. Conyon∗
July, 2015
Abstract
The Dodd Frank Act (2010) empowered shareholders (i.e. gave them ‘voice’) by providing
mandatory but non-binding voting on executive compensation. This paper investigates the
relation between shareholder say-on-pay voting and CEO compensation. It contains several
findings. First, the study finds fewer than 3% of firms failed to pass their say-on-pay proposals,
using US data from 2010 to 2012. Second, shareholder opposition to the say-on-pay proposal is
higher in firms where CEO compensation is high or ‘excessive’, consistent with agency theory.
Third, shareholder dissent on CEO pay is higher in firms with poor performance, measured
by stock-market or accounting returns. Fourth, firms engaging one of the major compensation
consultants are less likely to receive shareholder opposition to the say-on-pay proposal. There
are fewer votes against the pay proposal in firms with better quality boardroom governance
(e.g. the presence of a non-CEO lead director). Lastly, the study shows the causal effect of
shareholder ‘voice’ on CEO pay. Shareholder opposition to the firm’s say-on-pay proposal is
associated with lower growth rates in CEO pay. Overall, the study shows the determinants of
shareholder voice on say-on-pay and its impact on CEO pay.
1 Introduction
This study investigates the relation between shareholder voting and CEO compensation in the wake
of new rules SEC rules promulgated by the Dodd Frank Act Dodd Frank (2010). The Dodd Frank
Act mandated non-binding advisory voting on executive compensation. These arrangements are
colloquially known as ‘say-on-pay’. This study addresses the following research questions. First,
do high levels of CEO compensation lead to more shareholder opposition to the firm’s say-on-pay
∗Bentley University and Senior Fellow at the Wharton School. Email: [email protected]. The results inthis working paper are preliminary. I would like to thank Matthew Bidwell, Jean Bedard, Niamh Brennan, Jill Brown,Peter Cappelli, Gina Dokko, Lerong He, Rani Hoitash, Kevin Murphy, Simon Peck, Graham Sadler, and seminarparticipants at Bentley University and University College Dublin. Research assistance was provided by Maiwei Gao.Support from the Center for Human Resources at the Wharton School is gratefully acknowledged.
1

proposal? More generally, what are the predictors of shareholder opposition to the firm’s say-on-
pay proposal. The study investigates the role of the firm’s economic performance (including market
and accounting returns) and the quality of the firm’s corporate governance arrangements (such
as the use of compensation consultants and the presence of independent directors). Second, does
shareholder opposition to the say-on-pay resolution lead to changes in CEO pay? Namely, do firms
respond to shareholder voice by subsequently reducing CEO pay (Conyon and Sadler, 2010; Ferri
and Maber, 2013)? The study contributes to a nascent dynamic (and multidisciplinary) literature
on the determinants and effects of shareholder voice and activism surrounding say-on-pay (Hillman
et al., 2011; Goranova and Ryan, 2014; Renneboog and Szilagyi, 2011; Gillan and Starks, 2007;
Yermack, 2010).
Say-on-pay initiatives are central to corporate governance because they can potentially promote
shareholder activism and give owners more voice and influence to shape boardroom pay arrange-
ments. In the US, the Dodd-Frank Act (2010) was the first time shareholders were given such
voice. Legislation giving shareholders’ ‘voice’ has sprung up in many countries including the United
Kingdom, Australia, the Netherlands, Norway, Sweden. Typically, the goal of say-on-pay policies is
to reduce alleged managerial excess and ensure pay strategies reflect shareholder interests (Conyon
and Sadler, 2010).
There are several reasons why CEO pay has become controversial and fueled the demand for
legislation and regulation. First, CEO pay has increased significantly in the last few decades.
For example, Murphy (2012) shows that inflation adjusted median CEO compensation at S&P500
firms increased from $2.9 million in 1992 to about $9.0 million in 2011. That is approximately
4% per annum, every year, for almost 30 years. Second, there is a widely-held perception that
CEO compensation is insufficiently linked to the performance of CEOs or their firms (Bebchuk
and Fried, 2003, 2004). Third, U.S. CEO pay growth far outpaces the growth of most American
household incomes. Kaplan (2008) has documented that U.S. CEO compensation increased from
approximately one hundred times the median household income in 1993 to more than two hundred
times the median household income in 2006. In general, widening income disparity has focused
critical attention on those at the top of the pay distribution. Recent evidence shows that in the
aftermath of the Great Recession the top 1% income shares rebounded in 2010 following a sharp
2

decline in 2008 and 2009. In the US total income going to the top 10% is once again approaching 50%
(Piketty and Saez, 2012). Fourth, there is a suspicion that corporate boards and their compensation
committees have failed to reign in alleged corporate excess (Bebchuk and Fried, 2003). Say-on-pay
gives shareholders a voice to influence CEO pay.
Recent US legislative changes have re-focused attention on corporate governance as a way of
making executive pay more transparent and accountable. The Dodd-Frank Act (2010), arising in
the wake of the financial crisis, is a significant attempt to fix ‘too big to fail’ and other corporate
governance problems. Among its many provisions, Dodd-Frank attempts to give owners more con-
trol over executive pay and to make boards of directors and their compensation committees more
independent and accountable. Importantly, Dodd-Frank provided investors with the opportunity to
vote on executive compensation – namely the so-called ‘say-on-pay’ provisions. It also required firms
to provide investors with more information about CEO pay setting, including the role of compen-
sation consultants. In drafting the Act, Congress presumably believed that corporate governance
arrangements prior to 2010 were weak or ineffective and more needed to be done to curb excess
executive compensation.1
This study makes the following contributions to the extant literature. First, the study finds that
(in general) shareholders robustly endorse the firm’s say-on-pay proposal, based on S&P1500 firms
from 2010 to 2012. Fewer than 3% of firms fail the say-on-pay vote (i.e. fail to attract more than
50% of the votes cast). Dodd Frank (2010) also required firms to reveal much more information on
how pay is set, particularly the role of compensation advisors. The study shows that the market
is dominated by few compensation consultants who receive the majority of available consulting
engagements. About eight compensation consulting firms account for approximately 70% of client
engagements at the S&P1500 firms between 2010 and 2012.
Second, the study documents the determinants of shareholder votes against the firm’s say-on-
pay proposal. It finds that shareholder dissent (measured as the percentage of votes against the
firm’s say-on-pay proposal) is positively correlated to high or ‘excess’ levels of CEO pay. The study
shows that firms with superior market performance (shareholder returns) or accounting performance
(return on assets) receive less shareholder opposition to executive pay arrangements. In addition,
1Prior to Dodd-Frank the Sarbanes Oxley Act (2002) addressed accounting and financial reforms in the wake ofEnron and other corporate scandals.
3

the results show that firms using one of the major compensation consultants (a signal of corporate
governance quality) attract less shareholder dissent on CEO pay resolutions. In addition, there is
evidence that firms with high quality boardroom governance structures (such as retaining a non-
CEO lead director or not combining the posts of CEO and chairperson) also receive less opposition
to the say-on-pay proposal. Lastly, the pattern of external ownership matters. Firms with concen-
trated share ownership structures are more likely to receive shareholder opposition to the say-on-pay
proposal.
Third, the study investigates the effect of shareholder opposition to the say-on-pay proposal on
subsequent CEO pay arrangements. We find that firms with high levels of shareholder opposition
to the say-on-pay proposal have lower subsequent rates of growth in CEO pay and lower excess
pay. A difference-in-difference estimation strategy is used to isolate the causal effect of shareholder
opposition to the say-on-pay proposal.
In summary, the study finds that dissent on say-on-pay proposals are determined by excess
CEO pay, compensation consultants and corporate governance quality. Importantly, the study
finds that CEO pay declines when shareholders vote against the firm’s say-on-pay proposal. We
conclude that there is an important role for shareholder activism in the arena of corporate governance
and compensation strategy. The rest of the paper is organized as follows. Section 2 outlines the
theoretical context and hypotheses development. Section 3 describes the data and methods. Section
4 presents the empirical results. Section 5 concludes the study.
2 Theoretical context and hypotheses
2.1 Shareholder voice and executive compensation
Executive compensation is central to corporate governance as a potential mechanism to resolve
moral hazard and align shareholder and CEO interests (Cannella et al., 2008; Murphy, 1999; Fryd-
man and Saks, 2010; Conyon and Peck, 1998). There are two broadly competing models of executive
pay. The standard model is the ‘optimal contracting’ approach arising from principal-agent con-
siderations (Holmstrom, 1979; Holmstrom and Milgrom, 1987). Shareholders solve a latent moral
hazard problem by designing an incentive compatible contract that motivates CEO effort. Theo-
retically, agency models predict that at least part of the executive compensation contract contains
4

‘risky’ pay as a signal of managerial effort (such as bonuses, stock options, or restricted stock). The
optimal contracting model asserts that even though contracts may not be perfect, they nevertheless
minimize the myriad contracting costs that shareholders and managers face in the real world of
imperfect and asymmetric information (Edmans et al., 2009; Core and Guay, 2010). If shareholders
consider CEO pay is appropriately determined they are less likely to vote against it, provided they
have voice.
An alternative approach to CEO pay is the ‘managerial power’ model. It claims that executive
pay is too high and contracts are poorly (inappropriately) designed (Bebchuk and Fried, 2004;
Bertrand and Mullainathan, 2001). In consequence, CEOs and executives might exercise significant
bargaining strength over their boards and compensation committees that leads to contracts that are
not in the best interests of shareholders or they benefit from good luck and not high effort levels.
If so, CEO pay might be too high, and/or insufficiently aligned to CEO and firm performance. If
shareholders consider CEO pay is the results of managerial power, or is ‘excessive’, they might vote
against it, again assuming that they have voice.
The Hirschman (1970) ‘exit-voice’ model provides insight for understanding shareholder ac-
tivism. Dissatisfied shareholders have various options open to them. First, they can ‘exit’ by selling
their shares. Second, shareholders can instead exercise ‘voice’ and communicate their preferences
to management. Third, they can do nothing. Shareholders have several forms of ‘voice’ open to
them including ‘vote-no’ campaigns, shareholder activist proposals, and initiating change on social
issues. We focus on shareholder say-on-pay. The shareholder ‘voice’ option is important because
managerial slack might have resulted in equity values that are less than their otherwise optimal
levels. In such contexts an ‘exit’ strategy will result in shareholders releasing shares at a discount
relative to their ‘true’ value. In consequence, ‘voice’ is an important mechanism for shareholders
to engage with management and to encourage value increasing change. This might be especially
important for institutions that own large parcels of equity capital, such as institutional investors.
For example, Conyon and Leech (1994) argue that ownership concentration affects both shareholder
power and voice and, in turn, this affects the design of compensation contracts.
More generally, the determinants of shareholder ‘voice’ depends on the quality of corporate
governance institutions at the focal firm. In the context of CEO compensation, shareholders do
5

not set pay directly. Instead, they delegate decision-making to the board of directors, and typically
the compensation committee, to act on their behalf (Conyon and Peck, 1998; Cannella et al.,
2008; Adams et al., 2010; Hermalin and Weisbach, 1998).2 This suggests that the quality of board
governance perceived by shareholders might also act as a driver of shareholder voting & voice.
Shareholders who are dissatisfied with the quality of board governance (e.g. the use of particular
compensation consultants, leadership structure, or the role of independent directors) might be more
willing to vote against executive compensation, given the opportunity. Generally, shareholder voting
(voice) acts as a signal to management regarding shareholder preferences.
2.2 Dodd Frank
This study uses recent changes in US legislation to identify the determinants and effects of share-
holder voting on executive compensation. The Dodd Frank Act (2010)3 was introduced in the wake
of the 2008 financial crisis. Its objectives included ending too-big-to-fail, curb excessive risk-taking,
but more generally to improve the accountability, transparency and governance of US public firms.
The relevant corporate governance sections are contained in Title IX of the Act, subtitles E (relating
to accountability and executive compensation) and G (relating to the strengthening of corporate
governance).
Dodd Frank (2010) requires a non-binding advisory vote on executive compensation at least once
every three years. The arrangements are colloquially known as ‘say-on-pay’. The precise rules are
outlined in Dodd Frank Act (2010) Title IX, subtitle E, Sec. 951 and augments Section 14A to the
Securities Exchange Act of 1934. The Congress delegated rule-making authority to the Securities
and Exchange Commission (SEC).4 For the purposes of the act, executive compensation refers to
the pay of the named executive officers whose compensation is disclosed pursuant to Item 402 of
Regulation S-K. The determination of whether the say-on-pay vote is to be held annually, or every
two or three years is also put to an advisory shareholder vote. This is sometimes referred to as ‘say-
on-frequency’. The results of the say-on-pay and say-on-frequency votes must be reported within
2Indeed, US corporation law imposes a fiduciary duty of care and loyalty on members of the board of directors.Their responsibility is to safeguard shareholder / owner interests.
3The 1000+ page Dodd-Frank Act (H.R. 4173Ñ848) is available at http://www.sec.gov/about/laws/
wallstreetreform-cpa.pdf4It issued its final rules in 2011. Securities and Exchange Commission at: http://www.sec.gov/rules/final/
2011/33-9178.pdf
6

four business days following the annual meeting (using Form 8-K).5 Dodd Frank, then, provides a
potentially important mechanism to curb excess pay arrangements (real or perceived). Shareholders
who are unhappy with executive pay arrangements can send a signal to management and vote ‘No’.
The Dodd-Frank Act (2010) also contains other governance provisions relevant to this study.
Section 952 of Dodd Frank deals explicitly with boards and compensation committee independence
and the use of compensation consultants.6 It requires publicly listed firms to evaluate the indepen-
dence of the compensation consultant (and other advisors). This is the first time US firms have
been required to report this information to shareholders in the proxy statement. Independence is
evaluated according to any other services that are provided by the consultant, the amount of fees
that are paid to the advisor, business or personal relationships, company stock held by the com-
mittee adviser, and conflicts of interest policies and procedures. In addition, the Act (section 952
paragraph C) gives the compensation committee sole discretion to retain or obtain the advice of a
compensation consultant. The compensation committee is directly responsible for the appointment,
compensation, and oversight of the work of a compensation consultant. In summary, the Dodd-
Frank Act significantly upgrades standards of corporate governance and empowers shareholders by
mandating say-on-pay. In addition, the provisions related to independent compensation commit-
tees and compensation consultants are designed to improve independence and mitigate conflicts of
interest.7
5In addition, section 951 requires a non-binding vote on golden parachute payments in connection with ‘an acqui-sition, merger, consolidation, sale or other disposition of all or substantially all the assets of an issuer’.
6Specifically, Section 952 of the Dodd-Frank Act asserts: (A) the provision of other services to the issuer by theperson that employs the compensation consultant, legal counsel, or other adviser; (B) the amount of fees received fromthe issuer by the person that employs the compensation consultant, legal counsel, or other adviser, as a percentageof the total revenue of the person that employs the compensation consultant, legal counsel, or other adviser; (C) thepolicies and procedures of the person that employs the compensation consultant, legal counsel, or other adviser thatare designed to prevent conflicts of interest; (D) any business or personal relationship of the compensation consultant,legal counsel, or other adviser with a member of the compensation committee; and (E) any stock of the issuer ownedby the compensation consultant, legal counsel, or other adviser.
7The various national securities exchanges, too, have listing standards with respect to corporate governance,board and compensation committee independence. For example, the New York Stock Exchange listing standardsSection 303A deals explicitly with corporate governance standards. Section 303A.01 specifies that boards must havea majority of independent directors and Section 303A.02 addresses the relevant independence tests. Directors are notindependent unless the board affirms that the director has no material relationship with the company. A director isdeemed not to be independent if various conditions apply: i) the director, or an immediate family member, has beenan employee of the company in the last three years ii) the director has received fees above a threshold during thelast three years iii) the director is a partner or employee of the company’s auditor iv) there has been an interlockingrelationship between the director and the firm via membership of the compensation committee v) the director has amaterial financial relationship with the company.
7

2.3 Proxy voting agencies
Proxy voting agencies (such as Institutional Shareholder Services (ISS) and Glass Lewis) also shape
shareholder voting patterns, and governance arrangements. Previous research has critically evalu-
ated such proxy voting agencies in terms of their legitimacy role and potential conflicts of interests
(Clark and Van Buren, 2013). In the context of this study, Institutional Shareholder Services (ISS)
issues policy guidelines on corporate governance, including executive compensation. Institutional
Shareholder Services voting guidelines assert they will recommend a vote against or withhold votes
from the members of the Compensation Committee and full board if ‘The board fails to respond
adequately to a previous MSOP [Management Say On Pay] proposal that received less than 70
percent support of votes cast” (ISS, 2014). Similarly, Glass Lewis recommends recommends voting
against firms with previous failed say-on-pay resolutions and considers voting against in cases where
previous dissent is severe, interpreted as more than 25% votes against (Glass-Lewis, 2014). These
voting thresholds have been found to be important in previous say-on-pay research (Ertimur et al.,
2013; Larcker et al., 2014). In the empirical work below, the effect of general shareholder say-on-pay
dissent on CEO pay is evaluated. But given these known thresholds the effects of ‘severe’ dissent
(greater than 30%) is also tested.
2.4 Prior studies
A nascent literature is emerging on the causes and consequences of shareholder voting on say-on-
pay (Conyon and Sadler, 2010). This literature is related to other research on shareholder activism
and corporate social responsibility (Goranova and Ryan, 2014; Gillan and Starks, 2007; Brown and
Forster, 2013).
Many say-on-pay studies have used UK data, where legislation was introduced in 2002. Conyon
and Sadler (2010) showed that few UK say-on-pay resolutions fail (i.e. most resolutions attract
more than 50% of shareholder votes). They showed that shareholders are more likely to vote against
executive pay resolutions compared to other non-pay resolutions (such as appointing directors to the
board). They found say-on-pay dissent was positively related to CEO pay. However, there was little
evidence that CEO pay practices changed in response to negative shareholder voting. In contrast,
Ferri and Maber (2013) found that the announcement of UK say-on-pay legislation was associated
8

with a positive stock price reaction at firms with weak penalties for poor CEO performance. They
also showed that negative say-on-pay voting lead to the removal of potentially controversial CEO
pay practices, such as generous severance contracts for executives. These UK studies suggest that
say-on-pay regulations add value to shareholders and other stakeholders and provide them with
valuable ‘voice’.
US say-on-pay research is much more recent. Cai and Walkling (2011) found that stock prices
reacted positively in firms with excess CEO pay (or low pay-for-performance sensitivity) when
the House passed the say-on-pay bill. They also showed that stock prices reacted negatively to
labor sponsored say-on-pay proposal announcements and positively when such proposals that were
defeated. Ertimur et al. (2013) investigated the effect of proxy advisors in the context of say-on-pay.
They found that proxy advisors recommended voting against say-on-pay when CEO pay was high or
when firm performance was weak. They also showed that votes against say-on-pay were positively
correlated to ISS and Glass-Lewis ‘vote against pay’ recommendations. Larcker et al. (2014) also
investigated the relation between proxy advisory firms and say-on-pay. They found that advisory
firms recommendations determined say-on-pay voting outcomes. The evidence showed that firms
altered their compensation programs before the actual shareholder vote to appease proxy advisory
firms and avoid a potential negative voting recommendation. They also found a negative stock
market reaction to these changes in CEO pay design, suggesting that advisory firm recommendations
might not in the interests of owners. The emerging US evidence has not investigated the effect of
pay consultants or board governance in driving say-on-pay voting, or the effect of adverse voting on
subsequent CEO pay growth.
In related research, Krause et al. (2014) conducted two laboratory experiments to simulate a
shareholder say-on-pay vote. The authors did not use observational data on say-on-pay voting or
CEO compensation. Instead, data were generated in a laboratory context where subjects responded
to statements regarding agency theory and potential voting choices. Krause et al. (2014) found that
the probability of shareholder voting approval on say-on-pay is lower if CEO pay was high or
if shareholder returns were low, consistent with agency theoretic predictions. The findings were
consistent with UK field and observational data (Conyon and Sadler, 2010; Ferri and Maber, 2013).
Other studies have investigated shareholder voting more generally. Ertimur et al. (2011) inves-
9

tigated approximately 150 ‘vote-no’ campaigns and 1000 shareholder proposals related to executive
pay in the ten years up to 2007. They found that activists targeted firms with high CEO pay,
regardless of whether it was ‘excessive’ or not when compared to an appropriate control group.
They found that firms with ‘excess CEO’ pay targeted by ‘vote-no’ campaigns experienced a fall
in CEO pay. Hillman et al. (2011) studied director elections in 2006, but not ‘say-on-pay’. The
study was focused more generally on shareholder voice and director monitoring. They found that
shareholders were more likely to withhold votes on director nominees if CEO compensation was
high and the board of directors was large. The findings supported agency theoretic explanations
that shareholder voice (in this case opposition to director elections) is correlated to the quality
of boardroom governance. Correa and Lel (2014) studied the effect of say-on-pay laws using data
from around the world. They found that say-on-pay laws reduced CEO pay growth rates in the
firms studied. Also, they found that such laws decreased the portion of total top management pay
captured by CEOs.
Previous research explicitly investigating the link between say-on-pay and the presence of com-
pensation consultants does not exist. Also, there is little evidence on the relation between share-
holder voice on say-on-pay and the quality of corporate governance. However, compensation con-
sultants have been shown to be important in setting CEO pay and so might be important for
shareholder voice. Murphy and Sandino (2010) (using US and Canadian data) found that CEO pay
is higher in firms where pay consultants provided other services. Other studies, however, have found
little evidence that CEO pay is higher when pay consultants also supplied other services (Cadman
et al., 2010; Conyon et al., 2009). Murphy and Sandino (2010) also tested whether CEO pay is higher
when the consultant worked for management rather than for the board of directors. Contrary to
expectations, the found CEO pay was actually higher in such cases. In summary, compensation
consultants are a major institutional mechanism in the determination of CEO pay. If consultants
influence CEO pay, and shareholders express a view on pay, then we expect that consultants might
affect shareholder voting decisions on pay practices.
10

2.5 Hypotheses development
An important predictor of shareholder voice and opposition to the say-on-pay proposal is CEO
compensation itself (Conyon and Sadler, 2010; Ertimur et al., 2011; Bebchuk and Fried, 2003).
There has been an intense debate over executive compensation and alleged board failures to align
CEO pay packages with shareholder interests. Some commentators argue that CEO pay is not so
much a solution to the agency problem, but is actually part of the problem (Bebchuk and Fried,
2004). Managerial power models and rent seeking theories argue that CEOs are able to use their
positional power to capture the board and the pay-setting process (Bebchuk and Fried, 2003, 2004).
In consequence this leads to too high levels of CEO pay. For example, CEOs might appoint too
‘friendly’ outside directors, or CEOs of other firms, who might be inclined to recommend pay
packages that are more in the interests of the CEO and not the firm’s owners. In such contexts,
CEO pay is not optimal from a market or shareholder perspective. Shareholders that perceive that
CEO pay is ‘too high’ are more likely to be outraged and express their voice by voting against CEO
pay.
A particular challenge in the executive compensation research is how to determine whether or
not CEO pay is ‘too high’. There are various solutions. One is to simply use the observed level of
CEO pay as a predictor variable. In our empirical work several candidate variables are used, ranging
from cash pay to total CEO pay. These are consistent with previous studies Murphy (2012). This
also seems appropriate as absolute levels of compensation appear to be an important practical factor
in proxy advisor voting recommendations (Glass-Lewis, 2014; ISS, 2014). Another solution is to
benchmark CEO pay relative to a suitable measure of normal pay (Ertimur et al., 2011). The
empirical strategy in this study, therefore, uses such an ‘excess CEO pay’ measure. The strategy is
to estimate a standard CEO pay regression that controls for important determinants such as firm
performance, firm size, and industry level factors. Deviations from the predicted level of CEO pay
in the statistical model (i.e. the model residuals) represent ‘excess CEO pay’. These are the CEO
pay levels that are not accounted for by the model covariates. This approach has been used in
the previous corporate governance literature (Core et al., 1999; Ertimur et al., 2011). In summary,
the empirical shareholder voting model contains several different measures of CEO pay to test the
following broad hypothesis:
11
Hypothesis 1: If Chief Executive Officer (CEO) compensation is high, then shareholder dissent
on the firm’s say-on-pay proposal is expected to increase.
Firm level performance is also expected to be an important predictor of shareholder voice and
opposition to the firm’s say-on-pay proposal. It is hypothesized that higher-performing firms (in
terms of market-based or accounting-based measures) are less likely to attract shareholder opposition
to CEO pay. This is because good economic performance signals to investors that CEO effort is
high and that shareholder and manager interests are being aligned (Jensen and Meckling, 1976;
Jensen and Murphy, 1990; Krause et al., 2014). In consequence, shareholders are less likely to
think that incentive arrangements provided through compensation plans are inappropriate. It is
predicted that shareholder opposition to CEO pay is inversely related to measures of the firm’s
economic performance (Krause et al., 2014). It is consistent with previous studies asserting that
poor firm performance is a predictor of shareholder voting against director nominees (Conyon and
Sadler, 2010; Hillman et al., 2011).
Hypothesis 2: If the firm’s economic performance increases, then shareholder dissent on the
firm’s say-on-pay proposal is expected to decline.
The next hypothesis predicts the relation between shareholder opposition to say-on-pay propos-
als and the presence of compensation consultants. Compensation consultants are hired by the Board
of Directors to recommend both the level and structure of CEO pay. Baker et al. (1988) argued
that compensation consultants supply valuable market information to boards and that compensa-
tion committees. They provide important information about trends in compensation, the design of
compensation packages, performance evaluation criteria and so on. The market for compensation
consultants is oligopolistic. Generally, there are few pay consulting firms each with many client
firms (Conyon et al., 2009). The expectation is that firms using one of the major or prominent
compensation consultants signal to shareholders the quality of their CEO pay-setting process (Mur-
phy and Sandino, 2010; Conyon et al., 2009). It provides legitimacy. At the same time, the major
consulting firms suffer a greater reputation loss if they provide ineffective services or if they are
perceived as colluding with management. Client firms using major compensation consultants, then,
are less likely to attract opposition to say-on-pay resolutions compared to firms not using them.8
8A parallel accounting literature argues that the major accounting firms provide higher quality audits becauselarger firms suffer reputation loss.
12

In addition, pay consultants might face potential conflicts of interest, depending upon their con-
tractual engagement with the client firm. Some pay consultants are engaged solely by the company
board or compensation committee (Murphy and Sandino, 2010). Others are retained by manage-
ment. If pay consultants advise both management and the board then potential conflicts might
exist (for example, consultants might be concerned about repeat business rather than optimizing
pay in shareholder interests). Shareholders who perceive potential consultant conflicts of interest
are more likely to dissent on the say-on-pay resolution. Hence, it is predicted that dissent on the
say-on-pay resolution is positively correlated to the presence of pay consultants at the firm advising
both management and the board.
Hypothesis 3a: If the firm retains a major compensation consultant, then shareholder dissent
on the firm’s say-on-pay proposal is expected to decline.
Hypothesis 3b: If the firm’s pay consultants advise both board and management, then share-
holder dissent on the firm’s say-on-pay proposal is expected to increase.
The likelihood that shareholders vote against the say-on-pay resolution is also related to the
quality of corporate governance at the focal firm (Hillman et al., 2011). Many prior studies show that
the quality of corporate governance has an effect on executive compensation outcomes (Core et al.,
1999; Conyon, 1997). Generally, previous research has shown that board structure and governance
impacts corporate outcomes (Adams et al., 2010; Cannella et al., 2008; Bedard et al., 2014; Hermalin
and Weisbach, 1998). In the context of this study, firms that adhere to best practice governance
arrangements are more likely to have executive compensation arrangements that are aligned to
shareholder interests. In consequence, firms with best practice corporate governance arrangements
are less likely to attract shareholder opposition to say-on-pay proposals and more likely to meet
with shareholder approval (Conyon and Sadler, 2010).
Several structural variables are used to measure the quality corporate governance in the empirical
work, consistent with prior research on governance and CEO pay. First, the size of the firm’s board
is predicted to be negatively associated with governance quality. CEOs may be able to control
large boards more easily or they suffer from ‘free-rider’ problems in director monitoring (Hillman
et al., 2011). However, set against this is the fact that larger boards might be more diverse and
increase talent in the boardroom and so attract shareholder approval. This is tested below. Second,
13

the proportion of independent outside directors on the board is positively correlated to governance
quality (Conyon and Peck, 1998; Adams et al., 2010; Cannella et al., 2008). Independent directors
safeguard shareholder interests (and have a fiduciary duty to do so). Third, firms that combine
the posts of CEO and chairperson provide a signal of potential weak governance quality (Cannella
et al., 2008). Combining these roles opens up potential conflicts of interest between the CEO in the
executive role (as manager) and in his monitoring role (as chair of the board). However, the presence
of a non-CEO lead director is positively associated with governance quality. A senior non-executive
independent director is able to add balance and gravitas to the board, hence improving monitoring
quality. These governance factors have been found to be important in previous corporate governance
research (Conyon, 1997; Core et al., 1999; Cannella et al., 2008). It is predicted that:
Hypothesis 4a: Firms with larger boards are expected to receive more shareholder dissent on
the firm’s say-on-pay proposal.
Hypothesis 4b: Firms with a higher proportion of independent directors on the board are
expected to receive less shareholder dissent on the firm’s say-on-pay proposal.
Hypothesis 4c: Firms that combine the posts of CEO and Chairperson are expected to receive
more shareholder dissent on the firm’s say-on-pay proposal.
Hypothesis 4d: Firms that retain a non-CEO lead director are expected to receive less share-
holder dissent on the firm’s say-on-pay proposal.
This study also predicts that shareholder ownership structure itself determines shareholder vot-
ing patterns on CEO pay. Previous studies have shown that shareholder concentration (represent-
ing power, influence and monitoring capabilities) affects executive compensation (e.g. Conyon and
Leech, 1994; Core et al., 1999). Concentrated share ownership facilities monitoring and activism.
This is because it increases the incremental benefits to engagement and at the same time it lowers
the free-riding costs associated with diffuse ownership. In short, shareholder concentration leads
to better monitoring by owners. This study tests whether more concentrated institutional share
ownership is associated with more shareholder voice and opposition to CEO pay.
Hypothesis 5: Firms with concentrated institutional share ownership are expected to receive
more shareholder dissent on the firm’s say-on-pay proposal.
The discussion up to this point has evaluated the predictors of shareholder voting dissent (in-
14

cluding the role of excess CEO pay, firm performance, and corporate governance). Next, the effect
of shareholder opposition to say-on-pay proposal is considered. Previous studies have shown that
say-on-pay is valuable to shareholders (Cai and Walkling, 2011) and so we would expect voting
patterns to have real effects. Is shareholder voice effective? Do firm’s revise their CEO pay plans
if they receive significant opposition on the management say-on-pay proposal? If voting against
the say-on-pay proposal is effective one would expect to see changes to CEO pay following share-
holder dissent (Conyon and Sadler, 2010). In addition, we would expect that shareholder voting
dissent on executive compensation is also associated with greater future alignment between owner
and manager interests. To test this claim, we investigate whether the fraction of total CEO pay
that is comprised of stock options and other equity payments is higher in firms that previously
received high levels of voting opposition to CEO pay. Our study is different to others (e.g. Ertimur
et al., 2011; Conyon and Sadler, 2010) by focusing on alternative measures of CEO compensation,
including total expected CEO pay, CEO realized pay, a measure of excess CEO pay and finally the
CEO equity pay mix. The following related hypotheses are tested:
Hypothesis 6a: If previous shareholder voting dissent on the firm’s say-on-pay proposal is high,
then CEO pay is expected to decline.
Hypothesis 6b: If previous shareholder voting dissent on the firm’s say-on-pay proposal is high,
then the proportion of CEO pay in the form of equity compensation is expected to increase.
3 Data and methods
3.1 Data
The study investigated S&P 1500 firms for the period spanning 2010 to 2012. Shareholder voting
data was obtained from Equilar Inc. Specifically, the percentage of votes both ‘for’ and ‘against’ the
firms say-on-pay resolution were acquired. Compensation consultant data were also obtained from
Equilar Inc. This included the name of each pay consultant retained by the firm and whether the
board or management was responsible for hiring the consultant. CEO compensation data (salary,
bonus, stock options and restricted stock) were derived from Compustat’s Executive Compensation
data base. Financial data (on firm revenues, stock returns, return on assets) were derived from
Standard & Poors. Corporate governance data on board size, independent directors, and leadership
15

structure were secured from RiskMetrics. Institutional ownership data (used to measure external
shareholder power) were derived from Thomson-Reuters Institutional (13F) Holdings.
As noted, the data were collected from 2010 to 2012 for constituents of the S&P1500 index.9
Complete data on the dependent and independent variables were required to be in the sample. The
final data set, for estimation purposes, consisted of 3,205 firm-year observations from 2010 to 2012.
This represented 1,264 unique firms.
3.2 Shareholder voting model
The following shareholder voting (voice) model was estimated:
Sit = α+ β1Pit + β2Fit + β3Cit + β4Git ++β5Oit + β6xit + θt + ǫit (1)
where the dependent variable Sit is the proportion of votes against the say-on-pay resolution
in firm ‘i’ at time ‘t’ and is continuous in the zero to one range. This measure is consistent
with previous studies (Conyon and Sadler, 2010; Hillman et al., 2011; Thomas and Cotter, 2007).
The OLS estimator can (and does) predict probabilities outside this 0-1 range and is therefore
inappropriate (Greene, 2012). A traditional solution is to perform a logistic transformation to the
fractional response outcome variable Sit (which maps to the real line) and then estimate using
OLS.10 A better solution is to estimate a General Linear Model (GLM) using the binomial family
and use an appropriate logit link function (Papke and Wooldridge, 1996). In the tables reported
below, the coefficient estimates are transformed to marginal effects for ease of interpretation.
The voting model included measures of CEO pay in firm ‘i’ at time ‘t’ (Pit). It also included
measures firm level performance (Fit), measures of compensation consultants (Cit), measures of cor-
porate governance quality (Git), shareholder ownership concentration (Oit), and a set of other con-
trol variables (xit). The statistical model included θt time dummies to control for macro-economic
shock. The term ǫit is an i.i.d stochastic error term.
Four CEO pay (Pit) variables were used based on previous studies (Conyon et al., 2011; Jensen
9In the results section below, descriptive statistics on the time series evolution of CEO pay is presented from 1992onwards (source: Execucomp).
10i.e Make the transformation logit Sit = ln(
Sit
1−Sit
)
and then estimate using OLS on the set of covariates. Note
the function is not defined at the boundary conditions and so any zeros and ones in the data will be dropped in anysubsequent estimation.
16

and Murphy, 1990; Murphy, 1999). The first was total cash compensation, defined as the sum
of salary and annual cash bonus. The second measure was total expected CEO compensation,
calculated as the sum of the annual salary, bonus, other annual pay, the value of restricted stock
granted, the Black-Scholes value of stock options granted, long-term incentive payouts, and all
other compensation.11 This is the value granted by the board and represents its estimate of the
opportunity costs of resource allocation, including the grants of equity. This measure includes the
expected value of granting the CEO stock options. This is the opportunity cost forgone by the firm
of not selling the option in the open market.12 A reasonable approximation of this value is the
Black-Scholes (1973) option price. The value of a European call option paying dividends is given as:
c = Se−qtN(d1)−Xe−rtN(d2), where c is the option call-value and d1 = ln(S/X)+(r−q+σ2t)/2/√t
and d2 = d1 − σ√t where S is the stock price, X is the exercise price, t is the maturity term, r is
the risk free rate, q is the dividend yield, σ is the asset price volatility and N(.) is the cumulative
normal probability distribution function for a standardized normal random variable. There has
been a debate as to whether Black-Scholes is the appropriate way to value an option granted to
an executive (Lambert et al., 1991; Murphy, 1999). Most US firms reporting to the SEC use the
Black-Scholes method to assign a fair value to grants of options, Equilar (2012).13
The third CEO pay measure was total realized CEO compensation, defined as the sum of salary,
bonus, other annual compensation, restricted stock grants, long-term incentive payouts, all other
compensation and the value of stock options exercised.14 The difference between these two measures
is that the former measured the expected value of an option granted to the executive and the latter
measured the realized value from exercising those stock options. Both are useful in understanding
executive pay outcomes. The last CEO pay measure used was an estimate of ‘excess CEO compen-
sation’. It was derived from a standard CEO pay regression. The log of CEO pay was regressed
11This is ExecuComp item TDC1.12One can think of this as the value the firm assigns to CEO talent.13The Black-Scholes method provides a current estimate of the expected future value of the option assuming the
underlying assumptions of the model are valid. However, the assumptions might not hold. First, executives aretypically risk averse, undiversified, and prevented from trading their stock options or, indeed, hedging their risk byshort-selling activities. In consequence, they will place a lower value on the stock option compared to the Black-Scholescost to the company (Murphy, 1999). The higher Black Scholes value compared to the lower executive valuation isan implicit ‘premium’ paid by the firm for issuing the option. The firm must pay the executive this premium toaccept the risky option versus alternative riskless cash compensation. Second, options granted to executives are likeAmerican call options in that they can be exercised any time between the vesting and maturity date, rather than atthe maturity date as in the European call option. Each scenario creates a potential wedge between the executivespersonal valuation and the Black Scholes value.
14This is ExecuComp item TDC2.
17

on firm performance, firm size and a set of industry dummy variables using OLS. Deviations from
the predicted level of CEO pay in such a model (i.e. the model residuals) provided an estimate
of ‘excess’ CEO pay. This approach has been used in the previous corporate governance literature
(Core et al., 1999).15
Two measures of firm performance (Fit) were included in the model. The first was a market-
based measure, total shareholder returns to shareholders. The second was an accounting-based
measure, return on assets. Both have been used in the prior executive compensation literature as
important signals of CEO performance and effort (Core et al., 1999; Murphy, 1999). In addition,
prior studies of shareholder voice have also included these (Hillman et al., 2011; Conyon and Sadler,
2010). The expectation was that β2 < 0, shareholders were less likely to vote against executive
compensation in firms that are performing well.
Compensation consultant quality (Cit) was measured by the number (i.e. count) of major
compensation consultants used by the focal firm. Specifically, a major compensation consultant
was Frederic W. Cook & Co., Hewitt Associates, Mercer, Meridian Compensation, Pay Governance,
Pearl Meyer & Partners, Radford, and Towers Watson (Conyon et al., 2009). In addition, because
most firms used consultants, an indicator variable equal to one was included for the presence of any
pay consultants, zero otherwise (Conyon et al., 2009; Cadman et al., 2010). Conflict of interests
between the pay consultants and the firm’s owners was measured as indicator variable equal to one
if any of the firm’s consultants advised management as well as the board of directors, zero otherwise
(Murphy and Sandino, 2010). Governance quality (Git) was measured in a number of ways. The
model included the size of the board, measured as the number of board directors. It included the
fraction of independent directors, expressed as a percentage of firm size (Core et al., 1999; Murphy
and Sandino, 2010). Independent directors were identified by RiskMetrics as independent and free
from conflict of interests. The model included a CEO-Chair duality to reflect potential conflicts
of interest arising from holding both positions (i.e. an inverse measure of board quality). It was
defined as an indicator variable equal to one if the CEO is also the chair of the board (Conyon,
1997). In addition, the quality of board leadership was measured by the presence of non-CEO
lead director. This was an indicator variable equal to one for the presence of a non-CEO lead
15In the regression models reported below the results are not overly sensitive to how this excess pay equation is isdetermined in terms of included right hand side variables. The results are not sensitive to using either total residualsfrom the CEO pay model, or only positive residuals – those above the predicted regression line.
18

director. Shareholder ownership power (Oit) was measured by the Herfindahl index of institutional
share ownership concentration. Data were collected from Thomson-Reuters Institutional (13F)
Holdings.16
In addition, the shareholder voice model contained a set of control variables. These were the
log of firm size and an indicator variable signaling membership of the S&P500 to filter out any
scale effects in shareholder voting (Hillman et al., 2011; Conyon and Sadler, 2010). The models also
contained a set of industry dummy variables to control for inter-industry specific effects in share-
holder voting patterns (e.g. voting differences that might arise between utilities, or manufacturing
or banks and finance institutions) as in Conyon and Sadler (2010). Finally, the shareholder voice
model contained time-dummies to filter out macro-economic shocks over the estimation period.
3.3 CEO compensation model
The study also tested whether the effect of shareholder dissent on changes in CEO compensation.
Specifically, it tested the effect of shareholder say-on-pay dissent at time t− 1 on changes in CEO
pay at time t (Conyon and Sadler, 2010; Ertimur et al., 2011). The following first-difference equation
was estimated:
∆yit = α+ γ1Si,t−1 + γ2∆xit + ϕit (2)
where yit is (log) CEO compensation and ∆ is the first-difference operator such that ∆yit =
yi,t − yi,t−1 is the change in (log) CEO compensation.
Compensation was measured in a number of ways. As before, we used total expected CEO pay,
total realized pay, and an estimate of ‘excess’ CEO pay. We also used the fraction of CEO pay that
is made up of equity compensation including the grant-date value of stock options and restricted
stock. This is the equity pay mix. Si,t−1 was the pre-determined measure of shareholder voting
dissent in period t − 1. It was measured in two ways. First, it was defined as the percentage of
votes against the firm’s say-on-pay proposal. Second, we defined a dummy variable equal to one if
shareholder dissent is ≥ 30%, and zero otherwise. This mean that support for the firms’ executive
16The data are reported quarterly and so the year-end data (December) was selected. The fractional ownership wascomputed as the number of shares owned by the institution divided by common shares outstanding. The Herfindahlindex of ownership concentration (Oit) was then calculated as the sum of each institution’s fractional ownershipsquared (i.e. Oit =
∑
(sit)2 where sit = shares ownedit/total common sharesit).
19

pay policy was less than 70%.17 The parameter γ1 identified the difference-in-difference (causal)
effect of shareholder voting dissent on CEO compensation. Specifically, it isolated the effect of ‘high’
levels of shareholder voting dissent (the treatment group) on CEO pay relative to ‘low’ levels of
shareholder dissent (the control group).18 It was expected that γ1 < 0 for total pay and positive for
equity proportion. The term xit contained the model covariates. These included shareholder value,
firm size, and corporate governance factors. In the difference-in-difference equation these control
variables entered as difference terms (i.e. ∆xit). The term ϕit was the equation error term.
4 Results
4.1 Executive compensation
To put the study in context, Table 1 shows CEO compensation in fiscal year 2012. Data are
presented for the S&P500, the Mid Cap, and Small Cap firms. Total (expected) CEO pay is about
$6.3 million, where total pay is measured as the sum of salaries, bonuses, the grant date value of
stock option grants, the value of restricted stock grants, and other payments. The data show that
average CEO compensation is always higher than the median (e.g. for the S&P1500 as a whole
it is $6.3m versus $4.7m). This is because there are a sufficiently few high paid CEOs who pull
the average up. Also, CEO compensation increases with firm size. For example, median CEO
compensation of a S&P 500 firm is approximately $9 million compared to $2.5 million at a Small
Cap firm.
Table 1 shows the structure of CEO pay. A significant portion of CEO compensation is from
performance related pay in the form of an annual bonus, stock options, and restricted stock. In
addition, guaranteed compensation in the form of salary as a percentage of total pay is higher in
smaller firms compared to S&P500 firms (e.g. about 30% in small-cap firms compared to about 14%
in the S&P500). For CEOs of S&P500 companies stock options and restricted stock account for
over 50% of total pay. Most of CEO compensation comes in the form of stock options and restricted
stock. Note also, restricted stock grants are important relative to stock option grants in this year.
17This reflects that about 30% is considered a threshold where proxy voting agencies might recommend votingagainst say-on-pay (Glass-Lewis, 2014; ISS, 2014).
18Alternatively, in this context it can be interpreted as the effect of receiving shareholder opposition to say-on-payproposal on the growth in CEO compensation.
20

The time-series pattern shows US executive pay has increased significantly from 1992 to 2012.19
Figure 1 plots total compensation for the CEOs at S&P 1500 firms. Average CEO compensation
was about $4.2 million in 1992 and this rose steeply to about $10.4 million in 2000. From year 2000
onwards average CEO compensation fell before picking up again in the mid-2000s. However, with
the onset of the Great Recession average CEO compensation fell again in 2008 and 2009. In 2012
average CEO pay stood at approximately $6 millions. The findings are consistent with prior studies,
(Murphy, 2012). In addition, from 1992 to 2012 CEO compensation has shifted away from fixed
types of compensation to variable (uncertain) compensation such as stock options and restricted
stock. Figure 2 plots equity pay as percentage of total compensation for S&P1500 CEOs. In 1992
stock options and restricted stock accounted for approximately 22% of CEO pay. This increased
significantly during the 1990s and by 2001 options and restricted stock together accounted for
approximately half of CEO compensation. In 2012 grants of stock options and restricted stock
accounted for about half of total CEO pay. So, although there has been a marked increase in US
executive compensation, this has been accompanied by a greater alignment between shareholders
and managers in the form of more ‘pay-for-performance’.20 The data also show that a shift away
from stock options to restricted stock from around 2004 onwards.21
4.2 Shareholder voting
Dodd-Frank (2010) gave shareholders a mandatory, but advisory, vote on executive compensation.
Table 2 provides examples of advisory shareholder voting on three S&P 1500 companies. These are
Apple, General Electric, and Kilroy Realty. The number of votes in favor of the advisory shareholder
resolution is given, along with votes against, abstentions, and the percentage for and against. For
19FAS 123 required firms to provide a fair market value estimate of the grants of options. This had the effect of mak-ing grants of stock options and restricted stock equally attractive from an accounting perspective \citep{Hayes:2012,Murphy:2012Review.
20I show the change in executive compensation from 1992 onwards for completeness. In the regression models Ican only use data from 2010 to 2012 because of the availability and consistency of the required corporate governancedata on compensation consultants and on shareholder voting.
21Figure 2 shows that in 1992 stock options accounted for about 18% of total expected pay and restricted stockabout 4% (together they are about 22% of total expected CEO compensation). By 2001 stock options accounted for42% of total pay and restricted stock 6%. Indeed, before 2002 restricted stock never accounted for more than 10%of total pay of the typical CEO. From 2004 the importance of restricted stock, measured by the percentage of totalpay, increased. In 2012 restricted stock accounts for approximately 35% of total pay and stock options 14%. Thesubstitution of restricted stock for stock options does not imply lower equity pay overall in the CEO’s compensationpackage. The height of the bars shows that when combined both options and restricted stock form the largest shareof executive compensation aligning the owner and manager interests.
21

example, in 2010 the percentage votes in favor of Apple Inc say on pay resolution was 98.06%. The
votes against what a remarkably small 1.65%. In the case of Apple, we see that the percentage
of votes for the say on pay resolution has declined over time. In 2012 the percentage of votes in
favor of say on pay was 59.7%. The converse trend is observed for General Electric. In 2010 the
percentage votes for the say on pay resolution was approximately 78% and the percentage against
was about 20%. However, in 2012 shareholder approval was approximately 94% and the percentage
votes against was about 5%. The last case example illustrates a failed say on pay vote. In 2010
Kilroy Realty received 48.51% shareholder approval and approximately 51% against. This trend
has continued downwards ever since. In 2012 shareholder approval was approximately 22% and
opposition was about 77%. Are these typical?
Table 3 shows that shareholders generally endorse executive compensation plans at S&P1500
firms. Shareholder opposition to CEO pay is generally low. For this sample, there are approximately
3900 shareholder resolutions from 2010 to 2012.22 About 97% of firms in the sample received greater
than 50% votes in favor of the pay resolution. Equivalently, fewer than 3% of S&P1500 firms failed
to pass the say-on-pay resolution (i.e. shareholder voter dissent greater than 50%). The data
show that more than 70% of companies receive say-on-pay votes greater than, or equal to, 80%.
Remarkably, about 45% of firms received ‘yes’ votes on say-on-pay greater than 95%.
Figure 3 shows this broad pattern of results too. The histogram illustrates the strong positive
skew in the data and a low percentage of votes against say-on-pay resolutions. Since the percentage
of voting abstentions is low, this also corresponds to a generally high level of ‘yes’ votes to say on pay.
The prima facia evidence, then, is that shareholders (owners) are reasonably content with executive
compensation arrangements at large publicly traded US firms. This does not mean that say-on-pay
has not changed the dynamics of shareholder and board relations or that pay arrangements cannot
be improved upon. It is important also to look at both the antecedents and consequences of say-on-
pay. Indeed, one consequence of the new say-on-pay regulations is that there may be more dialogue
between shareholders, boards, compensation committees and pay advisors perhaps leading to better
designed pay-packages in advance of any shareholder vote on executive pay
22As noted, votes in favor of the pay resolution are expressed as a percentage of ‘votes for’ plus ‘votes against’ plus‘votes abstained
22

4.3 Compensation consultants
Another feature of Dodd Frank was enhanced disclosure of compensation consultant information.
Table 4 shows the market for compensation consultants in 2012, based on the constituents of the
S&P 1500 index. The data show that the market is highly concentrated. The five largest firms
have a cumulative market share (measured by engagements) of approximately 50%. The largest
eight compensation consultants account for just under 70% of the total market in terms of client
engagements. These are the major consultants. Approximately 33% of all other client engagements
are distributed amongst 76 other pay consultants. 23
Table 4 also speaks to the potential conflicts of interests arising from consultants advising both
the board and management. The data show that overwhelmingly compensation consultants advise
the board of directors. In aggregate, approximately 91% of compensation consultant engagements
are with the board of directors and only about 9% of engagements with management. The data
also illustrate that only a minority of firms do not use a compensation consultant. Approximately
5.1% of firms do not use a compensation consultant. Finally, we note there are in excess of 2200
consulting engagements, indicating that in the given year client firms sometimes retain more than
one consultant.
4.4 Shareholder voting regressions
Table 5 presents the descriptive statistics. Total expected CEO pay (based on fair market value
when the board grants stock) is less than realized pay (from the sale of stock and options). These are
both significantly larger than cash compensation (salary plus bonus). Opposition to the say-on-pay
resolution has a mean of about 10%. One-year stock returns are about 15% and return on an assets
about 5%. About 83% of firms use one of the major pay consultants and about 9% of firms have
consultants advising both the board and management. As expected, about 93% of firms use some
form of external pay consultant. In terms of internal corporate governance, boards size is about
10 members and boards contain about 80% independent outside directors. Approximately 55% of
firms combine the posts of CEO and chair, whereas about 88% of firms appoint a non-CEO lead
23Since the passage of Dodd-Frank the market for compensation consultants has consolidated, for example with themerger of Towers Perrin with Watson Wyatt in 2010 to create the combined firm Towers Watson. It is now the leadingsupplier of executive compensation advice, and the data show it has a engagement market share of approximately16% across all S&P 1500 firms.
23

director. The Herfindahl index of concentration is about 0.04 (ownership is diffuse) and finally the
CEO equity pay mix is about 49%.
Table 6 shows the determinants of shareholder voting dissent on the management say-on-pay
proposal. It shows that high levels of CEO pay are associated with high levels of shareholder
opposition to the firm’s say-on-pay proposal. Hypothesis 1 is confirmed. This finding is robust to
the measurement of CEO compensation. The results in Table 6 show that shareholder voting dissent
on the say-on-pay resolution is positively correlated to CEO cash compensation (salary plus bonus),
total expected compensation (which includes the ex ante value of grants of equity and restricted
pay), CEO realized pay (which includes ex post gains from the sales of options and restricted stock),
and lastly a measure of ‘excess’ pay.24 Table 6 shows that high levels of ‘excess pay’ are associated
with fewer votes in favor of the firm’s CEO pay policy.
Table 6 also shows that the firm’s economic performance predicts shareholder voting dissent on
the say-on-pay vote. The results show that as firm performance increases, shareholder opposition
to the firm’s say-on-pay resolution declines. Hypothesis 2 is therefore confirmed. Specifically,
there is a robust and significantly negative correlation between the percentage of votes against the
firm’s say-on-pay proposal and market performance (one-year shareholder returns) and accounting
performance (return on assets).
Hypothesis 3a predicted that if the firm retains a major compensation consultant, then share-
holder dissent on the firm’s say-on-pay proposal is expected to decline. The results in Table 6
confirm this. There is a negative and significant correlation between shareholder opposition to ex-
ecutive pay and the firm’s use of one of the major pay consulting firms. Hypothesis 3b predicted
that if any of the firm’s pay consultants advises both board and management, then shareholder
dissent on the firm’s say-on-pay proposal is expected to increase. The evidence in Table 6 show this
variable is insignificant, so the hypothesis is not confirmed. It is noteworthy, too, that the presence
of a consultant (usually) is associated with more shareholder opposition to executive pay.
Hypothesis 4a predicted that firms with larger boards would receive more shareholder dissent
on the firm’s say-on-pay proposal. This hypothesis is not supported. On the contrary, shareholders
24In addition, I estimated several other standard CEO pay equations that included a wider set of control variables.The residuals from these alternative models were also used as candidate measures of excess CEO pay. Qualitatively,the results did not change from those reported in the table. There was a negative correlation between shareholdervoting and the residuals from these alternatively specified CEO pay equations. Results available upon request.
24

appear to value larger boards. There is a significantly negative association between board size and
shareholder opposition to executive pay. Hypothesis 4b predicted that firms with a higher proportion
of independent directors on the board would receive less shareholder dissent on the firm’s say-on-pay
proposal. Hypothesis 4b is not supported. The percentage of the independent members on the board
is insignificant in the shareholder voting model. Hypothesis 4c predicted that firms that combine
the posts of CEO and Chairperson would receive more shareholder dissent on the firm’s say-on-
pay proposal. Hypothesis 4c is supported. There is a positive and significant correlation between
combined CEO-Chair leadership and shareholder dissent on executive pay. Lastly, hypothesis 4d
predicted that firms that retain a non-CEO lead director are expected to receive less shareholder
dissent on the firm’s say-on-pay proposal. This hypothesis is confirmed. Overall, the evidence on
board governance and shareholder opposition to executive pay is mixed. There is some evidence
that ‘best practice’ governance arrangements are approved of by shareholders and reflected in less
opposition to executive pay arrangements. Hypothesis 5 predicted that firms with concentrated
institutional share ownership are expected to receive more shareholder dissent on the firm’s say-
on-pay proposal. The hypothesis is confirmed. Concentrated share ownership is positively and
significantly related to shareholder opposition to executive pay.
Regarding other covariates, the data show that shareholder voice is determined by firm size.
Larger firms are less likely to attract shareholder opposition to the say-on-pay proposal. This is
seen by the negative sign on the S&500 indicator variable as well as the log sales variable. Lastly,
after controlling for other determinants of shareholder voting it is found that (average) shareholder
dissent has declined in 2011 and 2012 relative the base year in 2010. There is less shareholder
opposition (on average) to executive pay over this time period, other things equal.
4.5 CEO compensation and shareholder voice
The results up to this point show the endogenous determination of shareholder voting. Next, the
causal effect of shareholder voting on CEO compensation is analyzed using a simple difference-in-
difference estimator. Do firms that receive high levels of voting dissent subsequently adjust their
CEO compensation relative to a control group of firms that received shareholder approval?25
25Firms might attract high levels of votes against compensation arrangements, for example, but then subsequentlydo nothing regarding CEO pay because voting is non-binding. Hence, identifying the causal effect of say on pay
25

Table 7 and Figure 4 show the basic findings. The treatment group is firms that attract greater
than 30% shareholder votes against executive pay in t − 1. CEO compensation in the treatment
group (shareholder dissent on pay) and control group (shareholder approval of pay) is shown at
time t− 1 and time t.26 In the voting dissent group (treatment) average CEO pay is approximately
$11 million in t− 1 and falls to $8.7 million in period t. This is a difference of approximately $2.3
million. In the shareholder approval group (control) CEO pay is $5.9 million in t−1 and about $6.2
million in period t. The difference is about $0.3 million. The difference-in-difference estimate in the
unconditional means is approximately minus $2.6 million. CEO pay declines following an adverse
shareholder vote on the say-on-pay proposal relative to a control group of firms that attracted
shareholder approval.27 The box plots in Figure 4 illustrate the same story. Median growth in the
CEO pay is negative for the high dissent (treatment) group and slightly positive for the low dissent
(control) group. The implied difference-in-difference is negative.
The basic difference-in-difference estimates, of course, do not control for changes in other po-
tential covariates. Table 8 presents the difference-in-difference estimates in a regression framework.
In general, and regardless of the measure of compensation, there is a negative correlation between
the growth in CEO pay and previous high levels of opposition to the firm’s say-on-pay resolution.
Hypothesis 6a is confirmed. In column 1 there is a negative association between total CEO pay
(which includes the grant date value of options and stock) and shareholder voting dissent on say-
on-pay proposal. In column 2 there there is a negative and significant correlation between CEO
realized pay (including proceeds from the sale of stock and options) and previous shareholder voting
opposition to CEO pay. In column 3, the results show that ‘excess’ CEO pay is lower in firms that
previously received high levels of shareholder voting dissent on the say-on-pay proposal. The results
overall support hypothesis 6a. In column 4 the effect of shareholder opposition to pay on the CEO
equity pay mix is isolated. It shows the CEO equity pay mix falls in firms that previously received
high levels of votes against the executive pay resolution. Hypothesis 6b is not confirmed. All these
voting on subsequent CEO arrangements is particularly salient.26It is important to note that the basic empirical finding established here is not influenced by the 30% cut off point.
The findings hold in the regression results below using a continuous shareholder voting dissent measure.27Note that the negative effect of the difference-in-difference estimate dominates the difference in means between
the treatment and control groups. At t− 1 the level of CEO pay in the treatment group is higher than the mean inthe control group. Namely, $11m versus about $5.9m and a difference of approximately $5.2m. In time period ‘t’ thedifference in means is still positive (i.e. about $8.7m minus about $6.2m = approximately $2.5m. The difference-in-difference, though, is negative since the growth in CEO pay in the treatment group of firms is negative and is slightlypositive in the control group.
26

results control for other firm level variables as well as macro-shock and industry dummy variables.
The results in Table 8 measure shareholder dissent as a continuous variable. However, it might
be extreme levels of shareholder dissent that matter most (Glass-Lewis, 2014; ISS, 2014). Table
9 therefore measures dissent using an indicator variable if previous shareholder votes against the
say-on-pay resolution exceed 30% (i.e. support of less than 70%). The results isolated in Table 8
are found to be robust. After controlling for other economic and governance factors, CEO pay is
lower in firms that received previous high levels of dissent on it’s say-on-pay proposal. Hypothesis
6a is confirmed. Similarly, the hypothesized positive correlation between the CEO equity pay mix
and previous shareholder dissent is not found. Hypothesis 6b is not confirmed.
It is also worth mentioning some of the other covariates in Tables 8 and 9. The first difference
models also show the change in the log of CEO pay is positively correlated to firm performance.
Specifically, CEO pay is positively correlated to market measures of firm performance (i.e. the
one-year change in shareholder value) and (partially) to accounting performance (measured by the
firm’s return on assets). The empirical results also show that CEO pay is positively and significantly
related to firm size (measured by firm revenues). In general, the governance variables are less
precisely estimated. Their non-significance is likely attributed to the short nature of the panel data
and the fact that corporate governance factors evolve only slowly over time. In consequence, the
few (small) changes are unlikely to impact changes in CEO pay given that this statistical model
identifies within (rather than between) unit variation.
5 Conclusions
This study contributes to the corporate governance literature by investigating shareholder voting
and CEO pay. It showed an evolving corporate governance landscape following Dodd Frank Act
(2010). First, using data on S&P1500 firms from 2010 to 2012 the paper showed that shareholders
robustly endorse the firm’s say-on-pay proposal. Fewer than 3% of firms were found to fail the say-
on-pay vote (i.e. received less than 50% of the votes cast). Dodd Frank (2010) also required firms
to reveal much more information on how CEO pay was set, particularly the role of compensation
advisors. The study showed that the market for pay advice is oligopolistic. It is dominated by few
compensation consultants who received the majority of available consulting engagements. About
27

eight compensation consulting firms accounted for approximately 70% of client engagements at the
sample S&P1500 firms between 2010 and 2012.
Second, the study documented the determinants of shareholder votes against the firm’s say-on-
pay proposal. It found that shareholder dissent (measured as the percentage of votes against the
firm’s say-on-pay proposal) was positively related to high or excess levels of CEO pay. The study,
in this regard, confirmed UK studies (Conyon and Sadler, 2010; Yermack, 2010). The study showed
that firms with superior market performance (shareholder returns) or accounting performance (re-
turn on assets) were less likely to receive shareholder opposition to executive pay arrangements.
In addition, the results showed that firms that used one of the major compensation consultants (a
signal of corporate governance quality) were less likely to attract shareholder dissent on CEO pay.
In addition, there was evidence that firms with high quality boardroom governance structures (such
as retaining a non-CEO lead director or not combining the posts of CEO and chairperson) were
less likely to attract shareholder say on pay dissent. Lastly, the study found that the pattern of
external ownership matters. Firms with concentrated share ownership were more likely to receive
shareholder opposition to executive pay. The findings were consistent with other studies showing
shareholder activism affects corporate governance and CEO pay (Hillman et al., 2011; Krause et al.,
2014).
Third, the study investigated the effects of shareholder dissent on say-on-pay. It found that
firms with high levels of shareholder opposition to the say-on-pay proposal had lower rates growth
in CEO pay and lower excess pay. The study therefore contrasted to findings in the UK where the
evidence on the effects of non-binding say-on-pay are mixed (Conyon and Sadler, 2010; Ferri and
Maber, 2013). The study used a difference-in-difference estimating strategy to isolate the causal
effect of shareholder opposition to the say-on-pay proposal on CEO pay.
As with all studies, there are limitations that should be acknowledged. First, we have con-
trolled for differences in shareholder ownership by controlling for the concentration of institutional
ownership. However, different owners and shareholders might have different preferences and time
horizons which might give rise to different patterns of voting. Future studies might want to consider
the effects of different types of owners on shareholder voice. Second, another limitation in the study
is that only one type of shareholder voice is analyzed, namely shareholder voting on say-on-pay. It
28

may be the case that shareholder voice is expressed on different corporate outcomes, for example
the election of directors to the board. Other studies have suggested that voting patterns might be
different for non-CEO pay related resolutions (Conyon and Sadler, 2010). Third, this study focused
on publicly recorded votes on say-on-pay. It is feasible that management engage with sharehold-
ers privately behind the scenes to avoid management implementing compensation strategies that
alienate owners. Understanding the process of compensation setting, including the complex inter-
relationships between owners, boards, compensation committees and their advisors, is central to a
complete understanding of shareholder voice. Fourth, the study only investigated the consequences
of shareholder opposition to executive pay proposals in terms of how it affects levels of CEO pay.
However, other elements of CEO pay design are important. These include how say-on-pay affects
changes in performance triggers, the introduction CEO ownership guidelines, changes in severance
arrangements and so on. These have yet to be considered and are a fruitful avenue for future re-
search. Lastly, the study has not considered the market reaction to shareholder say-on-pay proposal
and whether these are different according to different types of corporate governance arrangements
in place at the firm. Again, this is an important future research topic.
In summary, this study documented important interrelationships between say-on-pay voting and
CEO compensation. It showed that excess CEO pay, firm-performance, compensation consultants
and corporate governance quality are important drivers of shareholder voice in the area of say-
on-pay. In addition, shareholder opposition to say-on-pay proposals affects the dynamics of CEO
compensation. It is hoped the findings will stimulate further research on value creation, shareholder
voice, corporate governance and CEO pay.
29

Table 1: CEO compensation in 2012
Index Average CEO Median CEO Salary Bonus Options Stock OtherPay $000s Pay $000s % % % % %
S&P500 10,596.9 9,172.1 13.6 23.2 18.2 41.3 3.7Mid Cap 5,264.9 4,704.0 20.5 24.0 13.5 37.9 4.0Small Cap 3,098.6 2,551.9 30.4 23.1 12.0 29.3 5.2
Total 6,330.1 4,787.0 21.8 23.4 14.6 35.9 4.3
Notes: Data are from Execucomp (2012). Total executive compensation (Execucomp TDC1) isthe sum of salaries, bonus, grant date value of stock options and restricted stock, and other pay,measured in $000s; ‘Salary %’ is the base salary as a percentage of total executive compensation.‘Bonus %’ is the value of the annual bonus and non-equity incentive compensation as a percentageof total executive compensation; ‘Option %’ is the Black-Scholes (1973) grant-date value of stockoptions as a percentage of total compensation; ‘Stock %’ is the fair market value of restricted stockas a percentage of total executive pay; ‘Other %’ is the value of other pay and deferred compensationas a percentage of total executive compensation. CEOs are indicated as the current CEO of thecompany (Execucomp item ceoann).
30

Figure 1: CEO Pay at S&P1500 Firms 1992 to 2012
4.23.6 3.8 3.8
5.1
6.6
7.8 7.6
10.4
8.5
7.06.2
7.0 7.1 6.86.1 5.6
5.16.0 6.3 6.1
02
46
810
CE
O C
ompe
nsat
ion
(mill
ions
)
1992
1993
1994
1995
1996
1997
1998
1999
2000
2001
2002
2003
2004
2005
2006
2007
2008
2009
2010
2011
2012
Average CEO Compensation
Notes: Data source: Execucomp data. CEO Compensation is the sum of salary, bonus, the exceptedvalue of stock option grants using the Black Scholes (1973) pricing method, the fair market valueof restricted stock and other payments. I used the S&P execucomp variable TDC1. It is expressedin constant 2012 US dollars deflating by the CPI. Calculations are for the CEOs of the S&P1500firms in the Execucomp data base.
31

Figure 2: CEO Pay Structure from 1992 to 2012
18
4
21
4
24
4
23
5
27
4
30
5
34
5
38
4
39
5
42
6
39
6
32
9
31
11
28
14
20
20
19
23
20
25
18
25
16
28
17
32
14
35
010
2030
4050
1992
1993
1994
1995
1996
1997
1998
1999
2000
2001
2002
2003
2004
2005
2006
2007
2008
2009
2010
2011
2012
Options and Restricted Stock as Percentage of Total Pay
Options Restricted Stock
newlineData source: Execucomp data. Total Pay is the sum of salary, bonus, the excepted value of stockoption grants using the Black Scholes (1973) pricing method, the fair market value of restrictedstock and other payments. I used the S&P execucomp variable TDC1. Options are the value ofoption awards in a given year. Restricted Stock is the value of restricted stock. Calculations arefor the CEOs of the S&P500, Mid-Cap and Small-Cap firms CEOs of S&P firms in the Execucompdata base. The percentage of options and restricted stock pay for each is calculated and the averageacross all CEOs reported.
32

Table 2: Advisory Shareholder Voting: Say-on-Pay Case Examples.
Company Year Votes for Votes against Abstain For (%) Against (%)
Apple Inc 2010 564545821 9516759 1667313 98.06 1.65
Apple Inc 2011 485842380 97982153 2912421 82.80 16.70
Apple Inc 2012 323257477 206194772 12062890 59.70 38.08
General Electric Co 2010 4802235894 1238198783 103342463 78.16 20.15
General Electric Co 2011 5674295274 456878236 134361982 90.56 7.29
General Electric Co 2012 5750914459 328555105 71228678 93.50 5.34
Kilroy Realty Corp 2010 23020825 24059119 378198 48.51 50.70
Kilroy Realty Corp 2011 18652334 43700760 7626 29.90 70.10
Kilroy Realty Corp 2012 15588108 53834128 7983 22.45 77.54
Notes: Voting outcomes for selected companies between 2010 and 2012. The table presents thenumber of advisory votes in favor of the shareholder resolution on executive compensation, thenumber against, the number of abstentions, the percentage for and the percentage against.
33
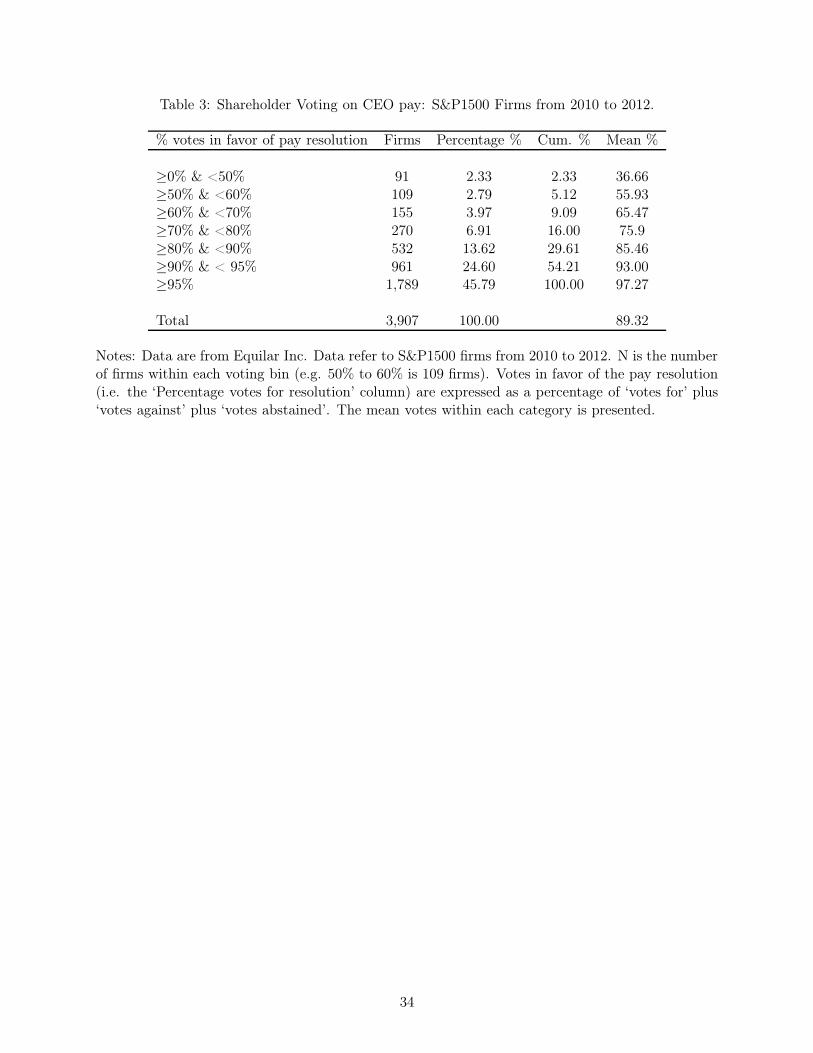
Table 3: Shareholder Voting on CEO pay: S&P1500 Firms from 2010 to 2012.
% votes in favor of pay resolution Firms Percentage % Cum. % Mean %
≥0% & <50% 91 2.33 2.33 36.66≥50% & <60% 109 2.79 5.12 55.93≥60% & <70% 155 3.97 9.09 65.47≥70% & <80% 270 6.91 16.00 75.9≥80% & <90% 532 13.62 29.61 85.46≥90% & < 95% 961 24.60 54.21 93.00≥95% 1,789 45.79 100.00 97.27
Total 3,907 100.00 89.32
Notes: Data are from Equilar Inc. Data refer to S&P1500 firms from 2010 to 2012. N is the numberof firms within each voting bin (e.g. 50% to 60% is 109 firms). Votes in favor of the pay resolution(i.e. the ‘Percentage votes for resolution’ column) are expressed as a percentage of ‘votes for’ plus‘votes against’ plus ‘votes abstained’. The mean votes within each category is presented.
34

Figure 3: Say on pay: Shareholder Voting Dissent
0.0
5.1
.15
Den
sity
0 20 40 60 80 100Shareholder Votes Against Firm’s Say−on−Pay Proposal (%)
S&P1500 firms; Data source: Equilar, Inc.
Shareholder Dissent on Say−on−Pay
Notes: Data are from Equilar Inc. Data refer to S&P1500 firms from 2010 to 2012. Histogramshows shareholder voting dissent (i.e. the percentage of votes against the company’s say-on-payresolution).
35

Table 4: US Compensation Consultant Market in 2012
Consultant Engagements Percent Board % Management %
Frederic W. Cook & Co. 254 11.4% 245 11.0% 9 0.4%
Hewitt Associates 137 6.1% 117 5.2% 20 0.9%
Mercer 213 9.5% 197 8.8% 16 0.7%
Meridian Compensation 111 5.0% 101 4.5% 10 0.4%
Pay Governance 118 5.3% 113 5.1% 5 0.2%
Pearl Meyer & Partners 153 6.9% 149 6.7% 4 0.2%
Radford 139 6.2% 123 5.5% 16 0.7%
Towers Watson 367 16.4% 318 14.2% 49 2.2%
76 other pay consultants 741 33.2% 674 30.2% 67 3.0%
Total 2,233 100.0% 2,037 91.2% 196 8.8%
No Consulting Firm 113 5.1% 0 0.0% 0 0.0%
Notes: Data are from Equilar. Data refer to S&P 1500 firms in 2012. Engagements are number ofassignments for the named consultant. Each consultant engagement is expressed as a percentage oftotal engagements. Client companies can engage more than one consulting firm so total engagementsis greater than the number of S&P 1500 firms. The number of engagements by the board andmanagement are given separately.
36

Table 5: Descriptive StatisticsVariable Mean Median SD
CEO expected pay ($000s) 6,344.97 4,728.32 6286.40CEO realized pay ($000s) 7,722.07 4,776.55 10457.03CEO cash pay ($000s) 2,416.27 1,813.00 2251.32log CEO expected pay 8.39 8.46 0.99log CEO realized pay 8.44 8.47 1.13log cash pay 7.48 7.50 1.03Support for say-on-pay proposal 0.89 0.94 0.13Opposition to say-on-pay proposal 0.10 0.04 0.13Stock returns (1-year) 14.86 12.70 32.62Return on assets 5.31 4.58 6.90Major pay consultant 0.83 1.00 0.73Consultants advising board and management 0.09 0.00 0.29Consultant presence (1/0) 0.93 1.00 0.25Board size 9.55 9.00 2.36Board independence director ratio 79.96 81.82 10.28Combined CEO and chair 0.54 1.00 0.50Non-CEO lead director 0.88 1.00 0.33Inst. ownership (H-index) 0.04 0.03 0.48Log sales 7.71 7.54 1.54CEO equity pay mix 0.49 0.53 0.23
Notes: Total expected pay (Execucomp: TDC1) is the sum of salaries, bonus, grant date value ofstock options and restricted stock, and other pay (measured in $000s). Stock options are valuedusing the Black-Scholes (1973) method at grant-date. CEO realized pay (Execucomp: TDC2) isthe sum of salaries, bonus, value of stock options and restricted stock sold in the period, and otherpay (measured in $000s.); CEO cash pay is the sum of salary, bonus and other cash pay (measuredin $000s). ‘Support for say-on-pay proposal’ is the number of votes in favor of say on pay divided bythe sum of votes for say-on-pay, votes against say-on-pay and abstentions (Source: Equilar Inc.);‘Opposition to say-on-pay proposal’ is the number of votes against say-on-pay divided by the sum ofvotes for say-on-pay, votes against say-on-pay and abstentions (Source: Equilar Inc.); Stock returnsare one-year stock-returns (dividends reinvested); Return on assets are accounting performancescaled by book value of assets; Major pay consultant is the number of the major consultants engagedby the firm. The ‘majors’ are identified in Table 4. Advises board and management is a dummyvariable equal to one (1) if the firm’s pay consultant advises both the board of directors andmanagement. Consultant is a dummy variable (1) if the firm uses a pay consultant, zero (0)otherwise; Board size is the sum of board directors (Source: RiskMetrics); Board independenceratio is the number of independent directors divided by board size (Source: RiskMetrics); CombinedCEO and chair is a dummy variable equal to one (1) if the CEO is also the board chair (Source:RiskMetrics); Non-CEO lead director is a dummy variable equal to 1 if the firm has identifiedan independent lead director who is not the CEO (Source: RiskMetrics). Inst. Ownership is theHerfindahl index of institutional share ownership; Sales are firm revenues in fiscal year. CEO equitypay mix is the percentage of total compensation made up of stock option and restricted stock grants(at fair market value).
37

Table 6: Shareholder Dissent on CEO Say-on-Pay Proposals 2010 to 2012.Voting Voting Voting Votingdissent dissent dissent dissent
Log cash pay 0.031**(0.009)
Log total pay 0.067**(0.005)
Log realized pay 0.034**(0.004)
Excess CEO pay 0.067**(0.005)
Stock returns (1 year) -0.001** -0.001** -0.001** -0.001**(0.000) (0.000) (0.000) (0.000)
Return on assets -0.002** -0.002** -0.002** -0.002**(0.000) (0.000) (0.000) (0.000)
Major pay consultant -0.009** -0.007* -0.008** -0.007*(0.003) (0.003) (0.003) (0.003)
Advises board and management 0.010 0.003 0.007 0.003(0.007) (0.007) (0.007) (0.007)
Consultant (1/0) 0.028* 0.007 0.026* 0.007(0.011) (0.011) (0.011) (0.011)
Board size -0.004** -0.002 -0.003* -0.002(0.001) (0.001) (0.001) (0.001)
Independent directors 0.000 -0.000 0.000 -0.000(0.000) (0.000) (0.000) (0.000)
Combined CEO chair 0.015** 0.012** 0.014** 0.012**(0.005) (0.004) (0.005) (0.004)
Non-CEO lead director -0.019* -0.017* -0.017* -0.017*(0.007) (0.007) (0.007) (0.007)
Inst. ownership (H-index) 0.007** 0.007** 0.006** 0.007**(0.001) (0.001) (0.001) (0.001)
Log sales 0.001 -0.011** -0.001 0.015**(0.003) (0.003) (0.002) (0.002)
SP 500 indicator -0.005 -0.025** -0.014* -0.025**(0.006) (0.006) (0.006) (0.006)
Year=2011 -0.019** -0.023** -0.023** -0.023**(0.005) (0.005) (0.005) (0.005)
Year=2012 -0.013* -0.017** -0.019** -0.017**(0.006) (0.005) (0.005) (0.005)
Observations 3,205 3,205 3,205 3,205Notes: Dependent variable is shareholding voting dissent on the firm’s say-on-pay resolution. itis the votes against the firm’s say-on-pay proposal expressed as a percentage of total votes cast(i.e. votes for, votes against, and abstentions). Other variable definitions given in Table 5 andtext. Models are estimated using GLM. Marginal effects reported and robust standard errors inparentheses. Significance ** p<0.01, * p<0.05, + p<0.10.
38

Table 7: Shareholder Say-on-Pay Votes and CEO Compensation
Shareholder Shareholder Difference-Approval: Dissent: in-difference
Shareholder votes Shareholder votesagainst pay <30% against pay ≥30%
Compensation in period (t− 1) $5,868.7 $11,077.8 $5,209.1
Compensation in period t $6,171.1 $8,722.1 $2,551.1
$302.3 -$2,355.7 -$2,658.0
Notes: Average CEO total pay is measured in $000 and given in each cell. Total Pay is the sumof salary, bonus, the excepted value of stock option grants using the Black and Scholes (1973)pricing method, the fair market value of restricted stock and other payments. (Execucomp variable:TDC1). Treatment is a dummy variable = 1 if shareholder opposition to the say-on-pay proposalin t−1 is greater than 30%, zero otherwise (i.e. dissent). Calculations are for the CEOs of the S&P1500 firms. Data on shareholder voting come from Equilar Inc.
39
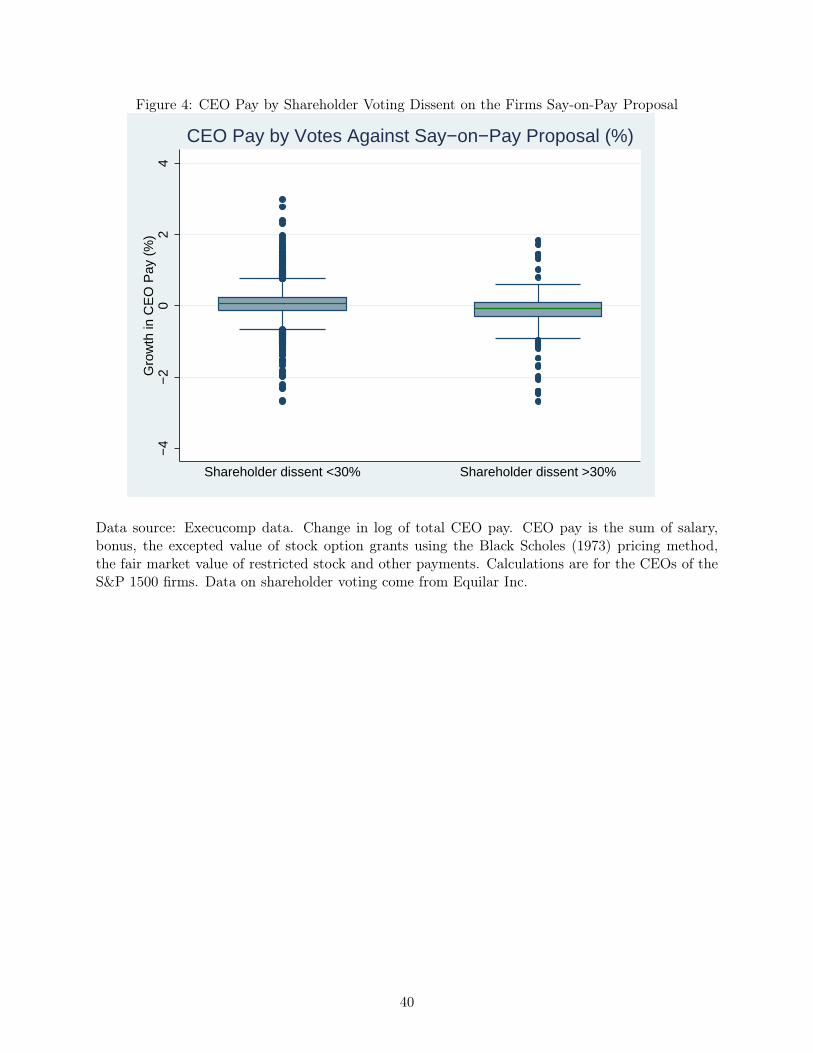
Figure 4: CEO Pay by Shareholder Voting Dissent on the Firms Say-on-Pay Proposal
−4
−2
02
4G
row
th in
CE
O P
ay (
%)
Shareholder dissent <30% Shareholder dissent >30%
CEO Pay by Votes Against Say−on−Pay Proposal (%)
Data source: Execucomp data. Change in log of total CEO pay. CEO pay is the sum of salary,bonus, the excepted value of stock option grants using the Black Scholes (1973) pricing method,the fair market value of restricted stock and other payments. Calculations are for the CEOs of theS&P 1500 firms. Data on shareholder voting come from Equilar Inc.
40

Table 8: CEO Pay and Shareholder Dissent on Say-on-Pay Resolutions
∆ log total ∆ log realized ∆ log excess ∆ EquityCEO pay CEO pay CEO pay pay mix
Voting dissent (%) -0.633** -0.280+ -0.673** -0.205**(0.114) (0.149) (0.114) (0.043)
∆Log sales 0.182+ 0.371+ -0.174 0.058(0.106) (0.192) (0.108) (0.038)
∆Shareholder value (1-year) 0.002** 0.004** 0.001* -0.000*(0.000) (0.001) (0.000) (0.000)
∆Return on assets 0.003 0.006+ -0.001 -0.002+(0.002) (0.004) (0.002) (0.001)
∆Consultant (1/0) 0.073 0.066 0.073 0.034(0.067) (0.083) (0.067) (0.037)
∆Major pay consultant 0.013 0.023 0.013 0.005(0.019) (0.028) (0.019) (0.007)
∆Advises board and management -0.068 -0.167* -0.069 -0.018(0.048) (0.082) (0.048) (0.017)
∆Inst. ownership (H-index) 0.106 0.223 0.105 -0.208*(0.247) (0.279) (0.244) (0.087)
∆Board size 0.004 0.014 0.005 0.008+(0.011) (0.018) (0.011) (0.004)
∆Independent directors 0.002 0.007+ 0.002 -0.000(0.002) (0.003) (0.002) (0.001)
∆Combined CEO chair 0.046 0.133* 0.047 0.002(0.042) (0.058) (0.042) (0.017)
∆Non-CEO lead director 0.008 0.007 0.009 -0.024(0.038) (0.059) (0.038) (0.018)
Year=2012 -0.067* -0.072 -0.081** -0.026*(0.027) (0.045) (0.027) (0.011)
Constant 0.525+ 0.584** 0.541+ 0.158(0.297) (0.124) (0.297) (0.206)
Observations 1,943 1,943 1,943 1,943R-squared 0.068 0.055 0.052 0.044
Notes: Variable definitions given in text and Table 5. ∆ is a first difference operator (i.e. ∆xit=xit-xi,t−1). Dependent variable is the change in measures of CEO compensation. Voting dissent is thepercentage votes against the management say-on-pay resolution. Estimation by OLS with robuststandard errors in parenthesis. Significance ** p<0.01, * p<0.05, + p<0.10.
41

Table 9: CEO Pay and Shareholder Dissent on Say-on-Pay Resolutions
∆ log total ∆ log realized ∆ log excess ∆ EquityCEO pay CEO pay CEO pay pay mix
Voting dissent ≥30% (1/0) -0.196** -0.099 -0.212** -0.064**(0.049) (0.061) (0.049) (0.019)
∆Log sales 0.218* 0.387* -0.135 0.069+(0.104) (0.189) (0.107) (0.037)
∆shareholder value (1-year) 0.002** 0.004** 0.001* -0.000*(0.000) (0.001) (0.000) (0.000)
∆Return on assets 0.002 0.006+ -0.002 -0.002+(0.002) (0.004) (0.002) (0.001)
∆Consultant (1/0) 0.077 0.069 0.078 0.036(0.068) (0.084) (0.069) (0.037)
∆Major pay consultant 0.012 0.023 0.012 0.005(0.019) (0.028) (0.019) (0.007)
∆Advises board and management -0.074 -0.169* -0.074 -0.020(0.048) (0.082) (0.048) (0.017)
∆Inst. ownership (H-index) 0.050 0.157 0.042 -0.186*(0.249) (0.269) (0.250) (0.085)
∆Board size 0.004 0.014 0.005 0.008+(0.011) (0.018) (0.011) (0.004)
∆Independent directors 0.001 0.007+ 0.001 -0.000(0.002) (0.003) (0.002) (0.001)
∆Combined CEO chair 0.054 0.137* 0.056 0.004(0.043) (0.058) (0.043) (0.018)
∆Non-CEO lead director 0.006 0.006 0.007 -0.025(0.039) (0.059) (0.039) (0.018)
Year=2012 -0.063* -0.071 -0.078** -0.025*(0.027) (0.044) (0.027) (0.011)
Constant 0.226 0.155 0.244 -0.096(0.181) (0.195) (0.181) (0.088)
Observations 1,944 1,944 1,944 1,944R-squared 0.052 0.055 0.034 0.034
Notes: ∆ is a first difference operator (i.e. ∆xit=xit-xi,t−1). Dependent variable is the change inmeasures of CEO compensation. Voting dissent ≥30% is a dummy variable=1 if percentage of votesagainst the management say-on-pay resolutions is ≥30%, zero otherwise (i.e. support of less than70%). Variable definitions given in text and Table 5. Estimation by OLS with robust standarderrors in parenthesis. Significance ** p<0.01, * p<0.05, + p<0.10.
42

References
Adams, R. B., B. E. Hermalin, and M. S. Weisbach (2010). The role of boards of directors in
corporate governance: A conceptual framework and survey. Journal of Economic Literature 48 (1),
58–107.
Baker, G. P., M. C. Jensen, and K. J. Murphy (1988). Compensation and incentives: Practice vs.
theory. Journal of Finance 43 (3), 593–616.
Bebchuk, L. A. and J. M. Fried (2003). Executive compensation as an agency problem. Journal of
Economic Perspectives 17 (3), 71–92.
Bebchuk, L. A. and J. M. Fried (2004). Pay without Performance: The Unfulfilled Promise of
Executive Compensation. Harvard University Press.
Bedard, J. C., R. Hoitash, and U. Hoitash (2014). Chief financial officers as inside directors.
Contemporary Accounting Research 31 (3), 787–817.
Bertrand, M. and S. Mullainathan (2001). Are CEOs rewarded for luck? the ones without principals
are.. Quarterly Journal of Economics 116 (3), 901–932.
Black, F. and M. Scholes (1973). The pricing of options and corporate liabilities. Journal of Political
Economy 81, 637–659.
Brown, J. and W. Forster (2013). CSR and stakeholder theory: A tale of Adam Smith. Journal of
Business Ethics 112 (2), 301 – 312.
Cadman, B., M. E. Carter, and S. Hillegeist (2010). The incentives of compensation consultants
and CEO pay. Journal of Accounting and Economics 49 (3), 263–280.
Cai, J. and R. A. Walkling (2011). Shareholders say on pay: Does it create value?. Journal of
Financial & Quantitative Analysis 46 (2), 299–339.
Cannella, B., S. Finkelstein, and D. C. Hambrick (2008). Strategic Leadership: Theory and Research
on Executives, Top Management Teams, and Boards. Oxford University Press.
43

Clark, C. and H. Van Buren (2013). Compound conflicts of interest in the us proxy system. Journal
of Business Ethics 116 (2), 355 – 371.
Conyon, M. and G. Sadler (2010). Shareholder voting and directors’ remuneration report legislation:
Say on pay in the UK. Corporate Governance: An International Review 18 (4), 296–312.
Conyon, M. J. (1997). Corporate governance and executive compensation. International Journal of
Industrial Organization 15 (4), 493–509.
Conyon, M. J., J. E. Core, and W. R. Guay (2011). Are U.S. CEOs paid more than U.K. CEOs?
inferences from risk-adjusted pay. Review of Financial Studies 24 (2), 402–438.
Conyon, M. J. and D. Leech (1994). Top pay, company performance and corporate governance.
Oxford Bulletin of Economics & Statistics 56 (3), 229 – 247.
Conyon, M. J. and S. I. Peck (1998). Board control, remuneration committees, and top management
compensation. Academy of Management Journal 41 (2), 146 – 157.
Conyon, M. J., S. I. Peck, and G. V. Sadler (2009). Compensation consultants and executive pay:
Evidence from the United States and the United Kingdom. Academy of Management Perspec-
tives 23 (1), 43–55.
Core, J. E. and W. R. Guay (2010). Is CEO pay too high and are incentives too low? a wealth-based
contracting framework. Academy of Management Perspectives 24 (1), 5–19.
Core, J. E., R. W. Holthausen, and D. F. Larcker (1999). Corporate governance, chief executive
officer compensation, and firm performance. Journal of Financial Economics 51 (3), 371–406.
Correa, R. and U. Lel (2014). Say on pay laws, executive compensation, pay slice, and firm value
around the world. SSRN: http://ssrn.com/abstract=2243921 .
Dodd Frank (2010). Dodd Frank Wall Street Reform and Consumer Protection Act.
Edmans, A., X. Gabaix, and A. Landier (2009). A multiplicative model of optimal CEO incentives
in market equilibrium. Review of Financial Studies 22 (12), 4881–4917.
Equilar Inc (2012). Equity Trends Report 2012.
44

Ertimur, Y., F. Ferri, and V. Muslu (2011). Shareholder activism and CEO pay. Review of Financial
Studies 24 (2), 535–592.
Ertimur, Y., F. Ferri, and D. Oesch (2013). Shareholder votes and proxy advisors: Evidence from
say on pay. Journal of Accounting Research 51 (5), 951–996.
Ferri, F. and D. A. Maber (2013). Say on pay votes and CEO compensation: Evidence from the
UK. Review of Finance 17 (2), 527–563.
Frydman, C. and R. E. Saks (2010). Executive compensation: A new view from a long-term
perspective, 1936–2005. Review of Financial Studies 23 (5), 2099–2138.
Gillan, S. and L. Starks (2007). The evolution of shareholder activism in the United States. Journal
of Applied Corporate Finance 19, 55–73.
Glass-Lewis (2014). Proxy Paper Guidelines: United States.
Goranova, M. and L. V. Ryan (2014). Shareholder activism: A multidisciplinary review. Journal
of Management 40 (5), 1230–1268.
Greene, W. H. (2012). Econometric Analysis (Seventh ed.). Prentice Hall.
Hermalin, B. E. and M. S. Weisbach (1998). Endogenously chosen boards of directors and their
monitoring of the CEO. American Economic Review 88 (1), 96–118.
Hillman, A. J., C. Shropshire, S. T. Certo, D. R. Dalton, and C. M. Dalton (2011). What i like
about you: A multilevel study of shareholder discontent with director monitoring. Organization
Science 22 (3), 675–687.
Hirschman, A. O. (1970). Exit, Voice, and Loyalty: Responses to Decline in Firms, Organizations,
and States. Harvard University Press; New Ed edition.
Holmstrom, B. (1979). Moral hazard and observability. Bell Journal of Economics 10 (1), 74–91.
Holmstrom, B. and P. Milgrom (1987). Aggregation and linearity in the provision of intertemporal
incentives. Econometrica 55 (2), 303–328.
ISS (2014). 2014 U.S. Proxy Voting Summary Guidelines.
45

Jensen, M. C. and W. H. Meckling (1976). Theory of the firm: Managerial behavior, agency costs
and ownership structure. Journal of Financial Economics 3 (4), 305–360.
Jensen, M. C. and K. J. Murphy (1990). Performance pay and top-management incentives. Journal
of Political Economy 98 (2), 225–264.
Kaplan, S. N. (2008). Are U.S. CEOs overpaid? a response to Bogle and Walsh. Academy of
Management Perspectives 22 (3), 28–34.
Krause, R., K. A. Whitler, and M. Semadeni (2014). Power to the principals! an experimental look
at shareholder say-on-pay voting. Academy of Management Journal 57 (1), 94–115.
Lambert, R. A., D. F. Larcker, and R. E. Verrecchia (1991). Portfolio considerations in valuing
executive compensation. Journal of Accounting Research 29 (1), 129 – 149.
Larcker, D. F., A. L. McCall, and G. Ormazabal (2014). Outsourcing shareholder voting to proxy
advisory firms. Stanford University Graduate School of Business Research Paper No. 14-27;
SSRN: http://ssrn.com/abstract=2101453 .
Murphy, K. J. (1999). Executive compensation. In O. Ashenfelter and D. Card (Eds.), Handbook
of Labor Economics (1 ed.), Volume 3, Part B, Chapter 38, pp. 2485–2563. Elsevier.
Murphy, K. J. (2012). Executive Compensation: Where We are, and How We Got There. SSRN:
http://ssrn.com/abstract=2041679 .
Murphy, K. J. and T. Sandino (2010). Executive pay and independent compensation consultants.
Journal of Accounting and Economics 49 (3), 247–262.
Papke, L. E. and J. M. Wooldridge (1996). Econometric methods for fractional response variables
with an application to 401(k) plan participation rates. Journal of Applied Econometrics 11 (6),
619 – 632.
Piketty, T. and E. Saez (2012). Top Incomes and the Great Recession: Recent Evolutions and
Policy Implications. Working paper .
Renneboog, L. and P. G. Szilagyi (2011). The role of shareholder proposals in corporate governance.
Journal of Corporate Finance 17 (1), 167–188.
46

Thomas, R. S. and J. F. Cotter (2007). Shareholder proposals in the new millennium: Shareholder
support, board response, and market reaction. Journal of Corporate Finance 13 (2/3), 368–391.
Yermack, D. (2010). Shareholder Voting and Corporate Governance. Annual Review of Financial
Economics 2, 103–25.
47


![Shareholder Voting as Veto - Indiana University …ilj.law.indiana.edu/articles/15-Kang1.pdf2013] SHAREHOLDER VOTING AS VETO 1301 incumbent performance. Just like the typical shareholder,](https://img.pdfslide.us/doc/110x75/5b00130d7f8b9a0c028c2b57/shareholder-voting-as-veto-indiana-university-iljlaw-shareholder-voting-as.jpg)