Embed Size (px)
Citation preview

The Gabelli Equity Income FundShareholder Commentary – March 31, 2010
Morningstar® rated The Gabelli Equity Income Fund Class AAA Shares 5 stars overall and 5 stars for the three, five and ten year periods ended March 31, 2010 among 1,115;
1,115; 929; and 471 Large Value funds, respectively.
To Our Shareholders,For the first quarter of 2010, the net asset value (“NAV”) per Class AAA Share of The Gabelli Equity
Income Fund rose 5.6%, versus an increase of 5.4% for the Standard & Poor’s (“S&P”) 500 Index. The Fund’sannualized total returns for the one year, five year, ten year, fifteen year, and since inception periods were52.4%, 4.1%, 6.0%, 9.6%, and 9.9%, respectively.
Comparative Results
Average Annual Returns through March 31, 2010 (a)(b) (Unaudited) SinceInception
Quarter 1 Year 3 Year 5 Year 10 Year 15 Year (1/2/92)Gabelli Equity Income Fund Class AAA . . . . . . . 5.63% 52.35% (1.74)% 4.10% 6.02% 9.63% 9.94%S&P 500 Index . . . . . . . . . . . . . . . . . . . . . . . . . . . . . . 5.39 49.73 (4.16) 1.92 (0.65) 7.75 7.95The expense ratio in the current prospectus is 1.50% for the Fund’s Class AAA Shares. Class AAA Shares donot have a sales charge.(a) Returns represent past performance and do not guarantee future results. Total returns and average annual returns
reflect changes in share price and reinvestment of distributions and are net of expenses. Investment returns and theprincipal value of an investment will fluctuate. When shares are redeemed, they may be worth more or less than theiroriginal cost. Performance returns for periods of less than one year are not annualized. Current performance may belower or higher than the performance data presented. Visit www.gabelli.com for performance information as of the mostrecent month end. Investors should carefully consider the investment objectives, risks, charges, and expensesof the Fund before investing. The prospectus contains more information about this and other matters andshould be read carefully before investing. See page 7 for performance of other classes of shares.The S&P 500 Indexis an unmanaged indicator of stock market performance. Dividends are considered reinvested.You cannot invest directlyin an index.
(b) The Fund’s fiscal year ends September 30.
Morningstar Rating™ is based on risk-adjusted returns. The Overall Morningstar Rating is derived from a weighted averageof the performance figures associated with a fund’s three, five, and ten year (if applicable) Morningstar Rating metrics. Forfunds with at least a three year history, a Morningstar Rating is based on a risk-adjusted return measure (including the effectsof sales charges, loads, and redemption fees) placing more emphasis on downward variations and rewarding consistentperformance. That accounts for variations in a fund’s monthly performance. The top 10% of funds in each category receive 5stars, the next 22.5% 4 stars, the next 35% 3 stars, the next 22.5% 2 stars, and the bottom 10% 1 star. (Each share class iscounted as a fraction of one fund within this scale and rated separately, which may cause slight variations in the distributionpercentages.) Morningstar Rating is for the AAA Share class only; other classes may have different performancecharacteristics. Ratings reflect relative performance. Results for certain periods were negative. ©2009 Morningstar, Inc. AllRights Reserved. The information contained herein: (1) is proprietary to Morningstar and/or its content providers; (2) may notbe copied or distributed; and (3) is not warranted to be accurate, complete or timely. Neither Morningstar nor its contentproviders are responsible for any damages or losses arising from any use of this information.
Mario Gabelli, CFA
Monthly Distributions — $0.03 per shareThe Gabelli Equity Income Fund has a $0.03 per share monthly distribution policy in place. For more specific
dividend and tax information, please visit our website at www.gabelli.com or call 800-GABELLI (800-422-3554).Shareholders should be aware that a portion of the distribution may represent a non-taxable return of capital. Suchdistributions will reduce the cost basis of your shares if you hold them in a taxable account.

2
COMMENTARY
The Economy
Stocks continued their march upward in the first quarter as signs of an economic recovery grew stronger.Unemployment began to fall, dropping back below 10%. Industrial production continued to expand and retailsales, helped by favorable weather, increased sharply in March. As cash accumulates on corporate balancesheets, acquisitions and investment in capital equipment, inventories, and jobs should follow.
The “Three B’s” – Barack, Bernanke and Beijing – loomed large in the quarter in their influence on theeconomy and stock market. Stocks suffered a mid quarter pullback due in part to jitters over China’s attemptsto cool its economy as well as concerns over the fiscal troubles of Greece and the other “PIIGS” of Europe(Portugal, Italy, and Ireland). Debate over Obama’s healthcare bill dominated news coverage throughout thequarter, but ultimately a scaled down bill was signed into law by President Obama in late March. The FederalReserve continued to keep rates at record lows, although it has now completed its purchase of agencymortgage backed securities and agency debt.
One key function of the Federal Reserve is to gather, array, and project the data on the U.S. economy.Chairman Ben Bernanke and members of the Federal Open Market Committee must then interpret this dataas they set monetary policy. While most of this data is stable to improving, the economic picture remainsfragile: at 9.7%, unemployment remains the highest in twenty years; home foreclosures are increasing andcommercial real estate vacancies are at a record high; more ominously, commodity prices – notably for oil –are rising, potentially impacting consumer spending; finally, the existing budget deficit and new healthcare actwill likely lead to higher future tax rates. The Fed must balance its goal of price stability with snuffing out anascent return to economic growth.
Like the Fed, (y)our research team at Gabelli gathers, arrays, and projects data from a variety of sourceseach day. Our company by company analysis suggests that order rates are increasing, advertising spendinghas resumed, and employment has begun to expand. Like Chairman Bernanke, our job as portfolio managersis to interpret what this means for stocks. Normally, rising interest rates are bad for stocks. In this case, however,other dynamics may dominate. Rates remain historically low. A return of consumer demand should translateinto both higher revenues and much stronger earnings, as now-leaner corporations benefit from operatingleverage.
While risks remain, we believe our focus on Private Market Value with a Catalyst™ and seeking a marginof safety, will benefit fund shareholders over the long term.
Deals, Deals, Deals – The Fifth Wave
As we have written previously, merger and acquisition (“M&A”) activity is slowly increasing, as corporatebuyers are using acquisitions to add global growth and scale. The strong are taking advantage of lowvaluations, excess cash, and attractive financing terms to become stronger. Notably, private equity firms, largelyabsent from M&A over the last two years, have begun to return. Financial engineering is also being used againby companies to surface value.
As we have written previously, merger and acquisition activity is slowly increasing, as corporate buyersare using acquisitions to add global growth and scale. The strong are taking advantage of low valuations,excess cash, and attractive financing terms to become stronger.

3
Several Fund holdings were the subject of M&A activity during the quarter. Early in the quarter, FEMSA(0.1% of net assets as of March 31, 2010) agreed to sell its beer business to Heineken (0.5%) in exchange fora 20% interest in the combined company. After a lengthy standoff, Kraft (2.2%) completed its acquisition ofCadbury with sweetened terms to its original offer. Coca-Cola (2.1%) announced that it will acquire the NorthAmerican bottling assets of its largest bottler, Coca-Cola Enterprises (CCE), in exchange for $10 in cash anda share of “New CCE”, which will be focused on continental Europe. PepsiCo (0.1%) completed the acquisitionof its two primary bottlers, Pepsi Bottling Group and PepsiAmericas, in late March. Broadview Security, thealarm monitoring company spun off from The Brink’s Company in October 2008, announced an agreement tobe acquired by its largest competitor, ADT, itself owned by Tyco Ltd. (0.5%). Cablevision Systems (0.3%) spunoff Madison Square Garden (0.1%) to shareholders on a one-for-four basis in February 2010, allowingmanagement to focus on other potential strategic actions, including a sale of the Rainbow cable networks anda strategic merger with Time Warner Cable, which could surface additional value in the future.
Investment Scorecard
The largest contributors to return in the first quarter included Boeing (+34%) (1.1%), Rockwell Automation(+20%) (1.5%), and General Electric (+20%) (1.1%). A stronger outlook for advertising and healthcare goodsdrove Viacom (+16%) (0.8%) and CVS Caremark (+14%) (1.1%), respectively. Other notable strong contributorsincluded Macy’s (+30%) (0.8%), Dr Pepper Snapple Group (+24%) (0.3%), and Kraft (+11%) (2.2%).
Detractors to performance were limited, but included Verizon (–6%) (0.6%), Pfizer (–6%) (1.2%), Coca-Cola (–4%) (2.1%), and Diageo (–3%) (0.3%).
Let’s Talk Stocks
The following are stock specifics on selected holdings of our Fund. Favorable earnings prospects do notnecessarily translate into higher stock prices, but they do express a positive trend that we believe will developover time. Individual securities mentioned are not necessarily representative of the entire portfolio. For thefollowing holdings, the share prices are stated in U.S. dollar equivalents as of March, 31, 2010.
The Boeing Company (1.1% of net assets as of March 31, 2010) (BA - $72.61 - NYSE) is one of twomanufacturers of commercial aircraft. The commercial aerospace industry is in the midst of a strong recovery.While the current economic weakness has reduced air travel, we believe that emerging economies of China,Russia, India, and Brazil (CRIB nations) will create 3.5 billion new middle class consumers who will travel moreand thereby increase the demand for new aircraft. The CRIB nations have considerable strengths that shouldallow their economies to snap back quickly, namely increased disposable income driven by the strongeconomic growth in the past decade, high levels of foreign exchange reserves, and lower inflation should boostconsumption and economic growth. We continue to believe that this group should provide long-term growthopportunities for Boeing.
CVS Caremark Corp. (1.1%) (CVS - $36.56 - NYSE) continues to operate the best retail pharmacy chain in thecountry, posting the fastest same-store sales growth and highest profit margins in the industry. While itsCaremark Pharmacy Benefits Manager (PBM) unit struggled with high client losses last year, new managementhas improved operations and begun to win new contracts again. CVS should benefit from the recently passedhealthcare bill with stable reimbursement and significantly higher volume over time from the 32 millionAmericans who will gain insurance coverage. With over $2 billion in free cash flow, CVS has the flexibility toinvest in its stores, pay down debt, and return significant amounts of cash to shareholders via dividends andshare repurchases.

4
The Coca-Cola Company (2.1%) (KO - $55.00 - NYSE), headquartered in Atlanta, GA, is the global leader in non-alcoholic beverages. Anchored by its iconic Coca-Cola brand, the company holds double volume global shareadvantage over its nearest competitor. The company owns or licenses nearly 500 brands and sells close to 3,000different sparkling and still beverages in over 200 countries.The U.S. market remains Coke’s largest single marketdespite it generating over 80% of its operating profits internationally. We view Coke’s recent decision to acquireCoca-Cola Enterprises’ North America operation, Coke’s anchor U.S. bottler, as the right strategic conclusion tomaximizing system profits in North America. We believe an integrated North America Coke system is betterpositioned to exploit the strength and innovation of the Coca-Cola brands, while the company’s position as theglobal beverage leader provides Coca-Cola with an opportunity to benefit from emerging markets trend towardsconsuming more ready to drink beverages. We expect average annual EPS growth of 12% through 2014 and findthe current Coca-Cola shares valuation compelling, including the 3.2% current return.
General Electric. (1.1%) (GE - $18.20 - NYSE), is one of the largest and most diversified technology, media, andfinancial services corporations in the world. Its products and services range from aircraft engines, power generation,water processing, and security technology to medical imaging, business and consumer financing, media contentand industrial products. In December 2009, GE and Comcast announced a joint venture which would eventuallygive Comcast control over NBC Universal. The deal is expected to close by the fourth quarter of 2010, and shouldprovide GE with additional liquidity as well as allow it to focus on its Infrastructure businesses. Currently, GE tradesat a discount to its private market value, given concerns about its financing business. We believe GE’s industrialbusinesses will continue to perform well over time. Further, any improvement in the financing unit, or a separationof that unit from the industrial businesses, will help unlock the hidden value in GE stock.
Genuine Parts (0.8%) (GPC - $42.24 - NYSE), based in Atlanta, GA, is a distributor of automotive and industrialreplacement parts, office products, and electrical & electronic components. We expect Genuine Parts to benefitfrom continued tailwinds in the automotive aftermarket, including dealer consolidation and increasing vehicularage. Additionally, sales at the company’s non-automotive related segments should rise as industrial capacityutilization increases and employment levels improve. Genuine Parts management has shown consistentdedication to shareholder value via share repurchases and increasing its dividend.
Halliburton Company (0.8%) (HAL - $30.13 - NYSE), is the world’s second largest integrated service providerto the oil and gas industry. Halliburton provides various products and services used in the drilling, evaluation,completion, and production of oil and natural gas wells both onshore and offshore around the world. Thecompany has the leading market share in cementing and pressure pumping, where demand is increasing asnatural gas from North American shale regions is being produced. Demand for Halliburton’s products andservices will fluctuate with spending by national, integrated, and independent oil and gas companies, which willbe influenced by oil and natural gas prices in the short-term. We believe demand for the company’s productsand services that enhance customers’ ability to extract oil and gas from increasingly challenging regions,including deepwater and shale, will continue to grow which will increase the value of Halliburton stock.
Intel Corp. (1.0%) (INTC - $22.26 - Nasdaq), based in Santa Clara, CA, is the world leading semiconductorcompany.The company delivered $35 billion of revenue and commanded a market share lead of 80% in 2009. Intelreported an extremely strong first quarter of 2010. Intel’s capital investment in 32-nm process technology ahead ofeconomic recovery is positioning the company’s product technology ahead of AMD and enabled the company toscore record gross margin in the fourth quarter of 2009 and first quarter of 2010. Management is expecting a recordgross margin of a mid-point of 64% this year. Management reported positive signs of recovery in corporatespending, strengths across all geographies, positive pricing outlook, and strong demand in both consumer andenterprise customers. We continue to remain upbeat on Intel’s financial performance as we expect favorabledemand upsides coming from corporate PC refresh, Windows 7 upgrade, corporate IT spending recovery, andcontinuing strengths in emerging markets.
5
Pfizer (1.2%) (PFE - $17.15 - Nasdaq), headquartered in New York, NY, is the world’s largest pharmaceuticalcompany. The company recently completed its $68 billion acquisition of Wyeth, which added biologics and aconsumer healthcare business, along with additional scale to the company’s core pharmaceuticals business.Pfizer continues to be plagued by concerns about the loss of exclusivity for Lipitor, the company’s $11.4 billionblockbuster cholesterol drug that will face generic competition in the U.S. in 2011. The addition of Wyeth shouldhelp offset that loss and the company continues to be active in business development with smaller deals forlate stage pipeline products. Pfizer’s $0.72 dividend represents a 4.2% current return.
Rockwell Automation (1.5%) (ROK - $56.36 - NYSE), based in Milwaukee, WI, is a leading global provider ofindustrial automation solutions that help end users and OEMs across industries to become more energyefficient, maximize asset utilization, and improve time to market. Rockwell’s products include automation andcontrol software and platforms, motion control systems, motor starters, sensors, and industrial computers. Infiscal year 2009, Rockwell generated revenues of $4.3 billion and EBITDA of roughly $500 million. With globalenergy and commodity prices rising, Rockwell’s products should become more appealing to OEMs, as they lookto reduce costs and enhance productivity by becoming more efficient. The company could also be potentiallyattractive to strategic buyers, particularly European industrial companies looking to expand in North America.
The Rolls-Royce Group (0.9%) (RR - $9.04 - London Stock Exchange) is a leading manufacturer of commercialaircraft and military jet engines. The company also provides marine propulsion for commercial and navalvessels and gas turbines to the industrial and oil and gas industries. RR has an installed base of about 55,000engines in service. With more than 50% of annual revenues derived from the installed base, RR can generatestrong, predictable cash flow that should allow them to maintain their current research and developmentexpenditures to support future growth. As a result of previous investments, the company is providing jet engineson several new aircrafts, including the Boeing 787 Dreamliner, Boeing stretch version of the wide-body 747aircraft, Airbus A380 jumbo jet and Airbus A350 airplane that will complete with the Boeing 787. These newprograms should well position the company for future growth.
Swedish Match AB (2.2%) (SWMA.SS - $23.90 - Stockholm Exchange) produces tobacco products that includesnus and snuff, chewing tobacco, cigars, and lights. The company has been benefiting from the growth of thesmokeless tobacco market in both Scandinavia and the U.S., as public smoking bans and health concerns aredriving consumers to seek alternative tobacco products to cigarettes. In response to excise tax increases in2007 and 2008, the company raised prices in Sweden, demonstrating that it can utilize its pricing power in orderto increase profits for its snuff division. In February 2009, Swedish Match created a joint venture with PhilipMorris International in order to sell Swedish snus in markets around the world, taking advantage of SwedishMatch’s brands and production capabilities and Philip Morris International’s distribution network. In September2009, the company sold its South African pipe tobacco business to Philip Morris International for about 1.9billion SEK, and is using most of the proceeds to repurchase shares. In January 2010, Swedish Matchannounced that it will combine its European and premium cigar portfolios with Scandinavian cigar and pipetobacco company STG, creating a new company that will benefit from enhanced scale and synergies.
Viacom Inc. (0.8%) (VIA - $36.68 - NYSE) is a pure play content company that owns a global stable of cablenetworks, including MTV, Nickelodeon, MTV, VH1, MTV, and BET, and the Paramount movie studio. Thecompany was spun off from former parent “old Viacom”, now known as CBS Corp., on December 31, 2005.Viacom’s cable networks generate revenue from advertising sales, fixed monthly subscriber fees, and ancillaryrevenue from toy licensing, etc. The company has seen an improvement in its viewership and continues to reapthe benefits of the shift in audience from broadcast networks to cable. Paramount has posted a series of boxoffice successes with franchises such as Star Trek, Iron Man, and Transformers. Viacom is also building a newfranchise with its Rock Band video game, including the popular Beatles version of the game, which could resultin a substantial stream of recurring revenue from song purchases. We believe the company will resume itsshare repurchase program in 2010.

6
Conclusion
We think an environment in which generally flat market performance is punctuated by occasionalcorporate transactions is ideal for our Private Market Value (“PMV”) with a Catalyst™ investment approach. Wefirst and foremost select stocks based on their fundamentals. We seek an adequate margin of safety and oneor more catalysts that can surface the intrinsic value of a security. To the extent that a takeover provides thatcatalyst, it adds an extra element of return to the portfolio.
Sincerely,
Mario J. Gabelli, CFAPortfolio Manager and Chief Investment Officer
May 6, 2010
Note: The views expressed in this Shareholder Commentary reflect those of the Portfolio Manager onlythrough the end of the period stated in this Shareholder Commentary. The Portfolio Manager’s views aresubject to change at any time based on market and other conditions. The information in this Portfolio Manager’sShareholder Commentary represents the opinions of the individual Portfolio Managers and is not intended tobe a forecast of future events, a guarantee of future results, or investment advice. Views expressed are thoseof the Portfolio Manager and may differ from those of other portfolio managers or of the Firm as a whole. ThisShareholder Commentary does not constitute an offer of any transaction in any securities. Anyrecommendation contained herein may not be suitable for all investors. Information contained in thisShareholder Commentary has been obtained from sources we believe to be reliable, but cannot be guaranteed.
Portfolio Manager CompensationMr. Gabelli’s incentive-based, variable compensation structure and dollar amount have been fully
disclosed each year since April of 2000 in GAMCO Investors, Inc.’s (NYSE: GBL) annual proxy statement.Mr. Gabelli receives no base salary, no annual bonus, and no options.
As founder and portfolio manager of The Gabelli Equity Income Fund, Mr. Gabelli received $2,798,516 incalendar 2009. In 1992, the Fund’s first year of operation starting in January, Mr. Gabelli received less than$165,000. As beneficial owner, he had $5,775,083 invested in The Gabelli Equity Income Fund as of December 31, 2009, which includes the holdings of GBL and GGCP, Inc., GBL’s parent holding company.
Minimum Initial Investment – $1,000The Fund’s minimum initial investment for regular accounts is $1,000. There are no subsequent
investment minimums. No initial minimum is required for those establishing an Automatic Investment PlanAdditionally, the Fund and other Gabelli/GAMCO Funds are available through the no-transaction fee programsat many major brokerage firms. The Fund imposes a 2% redemption fee on shares sold in seven days or lessof a purchase. See the prospectus for more details.
www.gabelli.com
Please visit us on the Internet. Our homepage at www.gabelli.com contains information about GAMCOInvestors, Inc., the Gabelli/GAMCO Mutual Funds, IRAs, 401(k)s, current and historical quarterly reports, closingprices, and other current news. We welcome your comments and questions via e-mail at [email protected].
You may sign up for our e-mail alerts at www.gabelli.com and receive early notice of quarterly reportavailability, news events, media sightings, and mutual fund prices and performance.

7
The Fund’s daily net asset value is available in the financial press and each evening after 7:00 PM(Eastern Time) by calling 800-GABELLI (800-422-3554). The Fund’s Nasdaq symbol is GABEX for Class AAAShares. Please call us during the business day for further information.
e-delivery
We are pleased to offer electronic delivery of Gabelli fund documents. Direct shareholders of our open-end mutual funds can now elect to receive their Annual, Semiannual, and Quarterly Fund Reports, ManagerCommentaries, and Prospectuses via e-delivery. For more information or to sign up for e-delivery, please visitour website at www.gabelli.com.
Multi-Class Shares
The Gabelli Equity Income Fund began offering additional classes of Fund shares on December 31, 2003.Class AAA Shares are no-load shares offered directly by selected broker/dealers. Class A and Class C Sharesare targeted to the needs of investors who seek advice through financial consultants. Class I Shares are availablesolely to certain institutions which initially invest directly with the Fund. The minimum initial investment amount forClass I Shares is $500,000.The Board of Directors determined that expanding the types of Fund shares availablethrough various distribution options will enhance the ability of the Fund to attract additional investors.
The Gabelli Equity Income Fund Average Annual Returns – March 31, 2010 (a)(b)Class AAA Shares Class A Shares Class B Shares Class C Shares Class I Shares
1 Year . . . . . . . . . . . . . . . . . 52.35% 52.32% 51.15% 51.28% 52.66%43.56(c) 46.15(d) 50.28(e)
5 Year . . . . . . . . . . . . . . . . . 4.10 4.10 3.32 3.34 4.242.87(c) 2.97(d) 3.34
10 Year . . . . . . . . . . . . . . . . 6.02 6.02 5.53 5.54 6.095.39(c) 5.53 5.54
Life of Fund (f) . . . . . . . . . . 9.94 9.94 9.66 9.67 9.989.58(c) 9.66 9.67
Current Expense Ratio . . 1.50 1.50 2.25 2.25 1.25Maximum Sales Charge . . None 5.75 5.00 1.00 None(a) Returns represent past performance and do not guarantee future results. Total returns and average annual
returns reflect changes in share price and reinvestment of distributions and are net of expenses. Investment returnsand the principal value of an investment will fluctuate. When shares are redeemed, they may be worth more or lessthan their original cost. Current performance may be lower or higher than the performance data presented. Visitwww.gabelli.com for performance information as of the most recent month end. Investors should carefully considerthe investment objectives, risks, charges, and expenses of the Fund before investing. The prospectuscontains more information about this and other matters and should be read carefully before investing.The Class AAA Shares’ NAVs per share are used to calculate performance for the periods prior to the issuance of ClassA Shares, Class B Shares, and Class C Shares on December 31, 2003 and Class I Shares on January 11, 2008. Theactual performance for the Class B Shares and Class C Shares would have been lower and Class I Shares would havebeen higher due to the differences in expenses associated with these classes of shares.
(b) The Fund’s fiscal year ends September 30.(c) Includes the effect of the maximum 5.75% sales charge at the beginning of the period.(d) Performance results include the deferred sales charges for the Class B Shares upon redemption at the end of the one
year and five year periods of 5% and 2%, respectively, of the Fund’s NAV per share at the time of purchase or sale,whichever is lower. Class B Shares are not available for new purchases.
(e) Performance results include the deferred sales charges for the Class C Shares upon redemption at the end of the oneyear period of 1% of the Fund’s NAV per share at the time of purchase or sale, whichever is lower.
(f) Performance is calculated from inception of Class AAA Shares on January 2, 1992.
We have separated the portfolio manager’s commentary from the financial statements and investment portfoliodue to corporate governance regulations stipulated by the Sarbanes-Oxley Act of 2002. We have done this toensure that the content of the portfolio manager’s commentary is unrestricted. The financial statements andinvestment portfolio are mailed separately from the commentary. Both the commentary and the financialstatements, including the portfolio of investments, will be available on our website at www.gabelli.com/funds.
The
GabelliEquityIncomeFundMorningstar® rated The Gabelli Equity Income Fund
Class AAA Shares 5 stars overall and 5 stars for the three, five and ten year periods ended
March 31, 2010 among 1,115; 1,115; 929;and 471 Large Value funds, respectively.
Gabelli Equity Series Funds, Inc.The Gabelli Equity Income Fund
One Corporate CenterRye, New York 10580-1422
800-GABELLI 800-422-3554
fax: 914-921-5118website: www.gabelli.come-mail: [email protected]
Net Asset Value per share available daily by calling800-GABELLI after 7:00 P.M.
Board of Directors
Mario J. Gabelli, CFA Robert J. MorrisseyChairman and Chief Attorney-at-LawExecutive Officer Morrissey, Hawkins & LynchGAMCO Investors, Inc.
Kuni NakamuraAnthony J. Colavita PresidentPresident Advanced Polymer, Inc.Anthony J. Colavita, P.C.
Anthony R. PustorinoVincent D. Enright Certified Public Accountant,Former Senior Vice President Professor Emeritusand Chief Financial Officer Pace UniversityKeySpan Corp.
Anthonie C. van EkrisJohn D. Gabelli ChairmanSenior Vice President BALMAC International, Inc.Gabelli & Company, Inc.
Salvatore J. ZizzaChairman Zizza & Co., Ltd.
Officers
Bruce N. Alpert Agnes MulladyPresident and Secretary Treasurer
Peter D. GoldsteinChief Compliance Officer
DistributorGabelli & Company, Inc.
Custodian, Transfer Agent, and Dividend AgentState Street Bank and Trust Company
Legal CounselSkadden, Arps, Slate, Meagher & Flom LLP
This report is submitted for the general information of theshareholders of The Gabelli Equity Income Fund. It is not authorizedfor distribution to prospective investors unless preceded oraccompanied by an effective prospectus.
GAB444Q110SC
SHAREHOLDER COMMENTARYMARCH 31, 2010
CASH FLOW
R E S E A R C H
MP
V
EPS
MANAGEMENT

To Our Shareholders,For the quarter ended March 31, 2010, the net asset value (“NAV”) per share of The Gabelli Equity Income
Fund’s (the “Fund”) Class AAA Shares rose 5.63% versus increases in the Standard & Poor’s (“S&P”) 500 Index of5.39%, and the Lipper Equity Income Fund Average of 4.69%.Comparative Results
Average Annual Returns through March 31, 2010 (a)(b) (Unaudited) SinceInception
Quarter 1 Year 3 Year 5 Year 10 Year 15 Year (1/2/92)Gabelli Equity Income Fund Class AAA . . . . . 5.63% 52.35% (1.74)% 4.10% 6.02% 9.63% 9.94%S&P 500 Index. . . . . . . . . . . . . . . . . . . . . . . . . . . 5.39 49.73 (4.16) 1.92 (0.65) 7.75 7.95Lipper Equity Income Fund Average . . . . . . . . . . 4.69 46.52 (4.35) 2.23 3.26 7.37 7.91Class A . . . . . . . . . . . . . . . . . . . . . . . . . . . . . . . . 5.64 52.32 (1.72) 4.10 6.02 9.62 9.94
(0.43)(c) 43.56(c) (3.64)(c) 2.87(c) 5.39(c) 9.19(c) 9.58(c)Class B . . . . . . . . . . . . . . . . . . . . . . . . . . . . . . . . 5.43 51.15 (2.48) 3.32 5.53 9.28 9.66
0.43(d) 46.15(d) (3.46)(d) 2.97(d) 5.53 9.28 9.66Class C . . . . . . . . . . . . . . . . . . . . . . . . . . . . . . . . 5.50 51.28 (2.46) 3.34 5.54 9.29 9.67
4.50(e) 50.28(e) (2.46) 3.34 5.54 9.29 9.67Class I . . . . . . . . . . . . . . . . . . . . . . . . . . . . . . . . . 5.70 52.66 (1.52) 4.24 6.09 9.68 9.98In the current prospectus, the expense ratios for Class AAA, A, B, C, and I Shares are 1.50%, 1.50%, 2.25%,2.25%, and 1.25%, respectively. Class AAA and I Shares do not have a sales charge. The maximum salescharge for Class A, B, and C Shares is 5.75%, 5.00%, and 1.00%, respectively.(a) The Fund’s fiscal year ends September 30.(b) Returns represent past performance and do not guarantee future results. Total returns and average annual
returns reflect changes in share price and reinvestment of distributions and are net of expenses. Investment returnsand the principal value of an investment will fluctuate. When shares are redeemed, they may be worth more or lessthan their original cost. Performance returns for periods of less than one year are not annualized. Currentperformance may be lower or higher than the performance data presented. Visit www.gabelli.com for performanceinformation as of the most recent month end. Investors should carefully consider the investment objectives,risks, charges, and expenses of the Fund before investing. The prospectus contains more informationabout this and other matters and should be read carefully before investing.The Class AAA Share NAVs per share are used to calculate performance for the periods prior to the issuance of ClassA Shares, Class B Shares, and Class C Shares on December 31, 2003 and Class I Shares on January 11, 2008. Theactual performance for the Class B Shares and Class C Shares would have been lower and Class I Shares would havebeen higher due to the differences in expenses associated with these classes of shares. The S&P 500 Index is anunmanaged indicator of stock market performance, while the Lipper Equity Income Fund Average reflects the averageperformance of mutual funds classified in this particular category. Dividends are considered reinvested. You cannotinvest directly in an index.
(c) Performance results include the effect of the maximum 5.75% sales charge at the beginning of the period.(d) Performance results include the deferred sales charges for the Class B Shares upon redemption at the end of the
quarter, one year, three year, and five year periods of 5%, 5%, 3%, and 2%, respectively, of the Fund’s NAV per shareat the time of purchase or sale, whichever is lower. Class B Shares are not available for new purchases.
(e) Performance results include the deferred sales charges for the Class C Shares upon redemption at the end of the quarterand one year periods of 1% of the Fund’s NAV per share at the time of purchase or sale, whichever is lower.
The Gabelli Equity Income FundSemi-Annual Report (a) – March 31, 2010
Morningstar® rated The Gabelli Equity Income Fund Class AAA Shares 5 stars overall and 5 stars for the three, five and ten year periods ended March 31, 2010 among 1,115;
1,115; 929; and 471 Large Value funds, respectively.
Morningstar Rating™ is based on risk-adjusted returns. The Overall Morningstar Rating is derived from a weighted averageof the performance figures associated with a fund’s three, five, and ten year (if applicable) Morningstar Rating metrics. Forfunds with at least a three year history, a Morningstar Rating is based on a risk-adjusted return measure (including the effectsof sales charges, loads, and redemption fees) placing more emphasis on downward variations and rewarding consistentperformance. That accounts for variations in a fund’s monthly performance. The top 10% of funds in each category receive 5stars, the next 22.5% 4 stars, the next 35% 3 stars, the next 22.5% 2 stars, and the bottom 10% 1 star. (Each share class iscounted as a fraction of one fund within this scale and rated separately, which may cause slight variations in the distributionpercentages.) Morningstar Rating is for the AAA Share class only; other classes may have different performancecharacteristics. Ratings reflect relative performance. Results for certain periods were negative. ©2009 Morningstar, Inc. AllRights Reserved. The information contained herein: (1) is proprietary to Morningstar and/or its content providers; (2) may notbe copied or distributed; and (3) is not warranted to be accurate, complete or timely. Neither Morningstar nor its contentproviders are responsible for any damages or losses arising from any use of this information.
Mario Gabelli, CFA

2
We believe it is important for you to understand theimpact of fees and expenses regarding yourinvestment. All mutual funds have operating expenses.As a shareholder of a fund, you incur ongoing costs,which include costs for portfolio management,administrative services, and shareholder reports (likethis one), among others. Operating expenses, whichare deducted from a fund’s gross income, directlyreduce the investment return of a fund. When a fund’sexpenses are expressed as a percentage of itsaverage net assets, this figure is known as theexpense ratio. The following examples are intended tohelp you understand the ongoing costs (in dollars) ofinvesting in your Fund and to compare these costswith those of other mutual funds. The examples arebased on an investment of $1,000 made at thebeginning of the period shown and held for the entireperiod.
The Expense Table below illustrates your Fund’s costsin two ways:
Actual Fund Return: This section providesinformation about actual account values and actualexpenses. You may use this section to help you toestimate the actual expenses that you paid over theperiod after any fee waivers and expensereimbursements.The “Ending Account Value” shown isderived from the Fund’s actual return during the pastsix months, and the “Expenses Paid During Period”shows the dollar amount that would have been paid byan investor who started with $1,000 in the Fund. Youmay use this information, together with the amountyou invested, to estimate the expenses that you paidover the period.
To do so, simply divide your account value by $1,000(for example, an $8,600 account value divided by$1,000 = 8.6), then multiply the result by the numbergiven for your Fund under the heading “Expenses PaidDuring Period” to estimate the expenses you paidduring this period.
Hypothetical 5% Return: This section providesinformation about hypothetical account values andhypothetical expenses based on the Fund’s actualexpense ratio. It assumes a hypothetical annualizedreturn of 5% before expenses during the period shown.In this case – because the hypothetical return used isnot the Fund’s actual return – the results do not applyto your investment and you cannot use the hypotheticalaccount value and expense to estimate the actualending account balance or expenses you paid for theperiod. This example is useful in making comparisonsof the ongoing costs of investing in the Fund and otherfunds.To do so, compare this 5% hypothetical examplewith the 5% hypothetical examples that appear inshareholder reports of other funds.
Please note that the expenses shown in the table aremeant to highlight your ongoing costs only and do notreflect any transactional costs such as sales charges(loads), redemption fees, or exchange fees, if any,which are described in the Prospectus. If these costswere applied to your account, your costs would behigher. Therefore, the 5% hypothetical return is usefulin comparing ongoing costs only, and will not help youdetermine the relative total costs of owning differentfunds.
Beginning Ending Annualized ExpensesAccount Value Account Value Expense Paid During
10/01/09 3/31/10 Ratio Period*
The Gabelli Equity Income Fund
Actual Fund ReturnClass AAA $1,000.00 $1,105.10 1.43% $ 7.51Class A $1,000.00 $1,105.40 1.43% $ 7.51Class B $1,000.00 $1,100.80 2.18% $11.42Class C $1,000.00 $1,101.50 2.18% $11.42Class I $1,000.00 $1,106.80 1.18% $ 6.20
Hypothetical 5% ReturnClass AAA $1,000.00 $1,017.80 1.43% $ 7.19Class A $1,000.00 $1,017.80 1.43% $ 7.19Class B $1,000.00 $1,014.06 2.18% $10.95Class C $1,000.00 $1,014.06 2.18% $10.95Class I $1,000.00 $1,019.05 1.18% $ 5.94* Expenses are equal to the Fund’s annualized expense ratio for the
last six months multiplied by the average account value over theperiod, multiplied by the number of days in the most recent fiscalhalf-year (182 days), then divided by 365.
The Gabelli Equity Income FundDisclosure of Fund Expenses (Unaudited)For the Six Month Period from October 1, 2009 through March 31, 2010 Expense Table

3
Summary of Portfolio Holdings (Unaudited)
The following table presents portfolio holdings as a percent of total net assets as of March 31, 2010:
Food and Beverage . . . . . . . . . . . . . . . . 12.4%Financial Services . . . . . . . . . . . . . . . . . 12.2%Health Care . . . . . . . . . . . . . . . . . . . . . . . 11.1%Consumer Products . . . . . . . . . . . . . . . . 6.9%Retail . . . . . . . . . . . . . . . . . . . . . . . . . . . . 6.3%Energy and Utilities: Oil . . . . . . . . . . . . . 5.7%Telecommunications . . . . . . . . . . . . . . . . 5.2%Diversified Industrial . . . . . . . . . . . . . . . . 4.0%Aerospace . . . . . . . . . . . . . . . . . . . . . . . . 3.6%Energy and Utilities: Integrated . . . . . . . . 2.8%U.S. Government Obligations . . . . . . . . . 2.5%Metals and Mining . . . . . . . . . . . . . . . . . 2.2%Energy and Utilities: Services . . . . . . . . . 1.9%Computer Hardware . . . . . . . . . . . . . . . . 1.9%Specialty Chemicals . . . . . . . . . . . . . . . . 1.8%Electronics . . . . . . . . . . . . . . . . . . . . . . . 1.7%Entertainment . . . . . . . . . . . . . . . . . . . . . 1.6%Equipment and Supplies . . . . . . . . . . . . . 1.5%Energy and Utilities: Natural Gas . . . . . . 1.5%Hotels and Gaming . . . . . . . . . . . . . . . . . 1.5%Automotive: Parts and Accessories . . . . 1.5%
Machinery . . . . . . . . . . . . . . . . . . . . . . . . 1.4%Computer Software and Services . . . . . . 1.3%Energy and Utilities: Electric . . . . . . . . . . 1.1%Agriculture . . . . . . . . . . . . . . . . . . . . . . . . 1.0%Communications Equipment . . . . . . . . . . 0.9%Cable and Satellite . . . . . . . . . . . . . . . . . 0.8%Business Services . . . . . . . . . . . . . . . . . 0.7%Wireless Communications . . . . . . . . . . . 0.6%Automotive . . . . . . . . . . . . . . . . . . . . . . . 0.5%Broadcasting . . . . . . . . . . . . . . . . . . . . . . 0.4%Environmental Services . . . . . . . . . . . . . 0.4%Aviation: Parts and Services . . . . . . . . . . 0.3%Transportation . . . . . . . . . . . . . . . . . . . . . 0.3%Exchange Traded Funds . . . . . . . . . . . . . 0.1%Publishing . . . . . . . . . . . . . . . . . . . . . . . . 0.1%Consumer Services . . . . . . . . . . . . . . . . 0.1%Energy and Utilities: Water . . . . . . . . . . . 0.0%Real Estate . . . . . . . . . . . . . . . . . . . . . . . 0.0%Other Assets and Liabilities (Net) . . . . . . 0.2%
100.0%
The Gabelli Equity Income Fund
The Fund files a complete schedule of portfolio holdings with the Securities and Exchange Commission (the“SEC”) for the first and third quarters of each fiscal year on Form N-Q, the last of which was filed for the quarterended December 31, 2009. Shareholders may obtain this information at www.gabelli.com or by calling theFund at 800-GABELLI (800-422-3554). The Fund’s Form N-Q is available on the SEC’s website atwww.sec.gov and may also be reviewed and copied at the SEC’s Public Reference Room in Washington, DC.Information on the operation of the Public Reference Room may be obtained by calling 1-800-SEC-0330.
Proxy Voting
The Fund files Form N-PX with its complete proxy voting record for the twelve months ended June 30th, nolater than August 31st of each year. A description of the Fund’s proxy voting policies, procedures, and how theFund voted proxies relating to portfolio securities is available without charge, upon request, by (i) calling 800-GABELLI (800-422-3554); (ii) writing to The Gabelli Funds at One Corporate Center, Rye, NY 10580-1422;or (iii) visiting the SEC’s website at www.sec.gov.

4
See accompanying notes to financial statements.
COMMON STOCKS — 95.9%Aerospace — 3.6%
2,000 Lockheed Martin Corp. . . . . $ 47,350 $ 166,44010,000 Raytheon Co. . . . . . . . . . . . 279,250 571,200
377,000 Rockwell Automation Inc. . . 18,648,492 21,247,7202,000 Rockwell Collins Inc. . . . . . 15,844 125,180
1,400,000 Rolls-Royce Group plc† . . . 9,952,358 12,651,372208,000 The Boeing Co. . . . . . . . . . . 11,882,858 15,102,880
----------------------------------------------- -----------------------------------------------40,826,152 49,864,792
----------------------------------------------- -----------------------------------------------Agriculture — 1.0%
99,000 Archer-Daniels-Midland Co. 2,838,337 2,861,100138,000 Monsanto Co. . . . . . . . . . . . 1,827,431 9,855,96012,000 The Mosaic Co. . . . . . . . . . 186,246 729,240
----------------------------------------------- -----------------------------------------------4,852,014 13,446,300
----------------------------------------------- -----------------------------------------------Automotive — 0.5%
160,000 Ford Motor Co.† . . . . . . . . . 1,712,849 2,011,200124,000 Navistar International Corp.† 4,373,721 5,546,520
----------------------------------------------- -----------------------------------------------6,086,570 7,557,720
----------------------------------------------- -----------------------------------------------Automotive: Parts and Accessories — 1.4%
250,000 Genuine Parts Co. . . . . . . . 8,986,399 10,560,0006,000 Johnson Controls Inc. . . . . 50,425 197,940
48,000 Modine Manufacturing Co.† 452,081 539,520145,000 O’Reilly Automotive Inc.† . . 4,161,709 6,047,95055,100 Tenneco Inc.† . . . . . . . . . . . 840,371 1,303,115
140,000 The Pep Boys - Manny, Moe & Jack . . . . 1,583,944 1,407,000
----------------------------------------------- -----------------------------------------------16,074,929 20,055,525
----------------------------------------------- -----------------------------------------------Aviation: Parts and Services — 0.3%
53,200 Curtiss-Wright Corp. . . . . . 578,882 1,851,36040,000 GenCorp Inc.† . . . . . . . . . . 321,556 230,4006,000 Precision Castparts Corp. . . 520,007 760,260
21,000 United Technologies Corp. . . 609,942 1,545,810----------------------------------------------- -----------------------------------------------
2,030,387 4,387,830----------------------------------------------- -----------------------------------------------
Broadcasting — 0.3%250,000 CBS Corp., Cl. A, Voting . . . 4,663,897 3,485,00040,000 CBS Corp., Cl. B, Non-Voting 413,475 557,600
132 Granite Broadcasting Corp.† 10,795 0----------------------------------------------- -----------------------------------------------
5,088,167 4,042,600----------------------------------------------- -----------------------------------------------
Business Services — 0.7%20,000 Automatic Data
Processing Inc. . . . . . . . 771,222 889,400180,000 Diebold Inc. . . . . . . . . . . . . 6,421,528 5,716,800
4,000 Landauer Inc. . . . . . . . . . . . 134,546 260,88010,000 MasterCard Inc., Cl. A . . . . 743,059 2,540,000
----------------------------------------------- -----------------------------------------------8,070,355 9,407,080
----------------------------------------------- -----------------------------------------------Cable and Satellite — 0.8%
155,000 Cablevision Systems Corp., Cl. A . . . . . . . . . . . . . . . . 2,189,427 3,741,700
60,000 DIRECTV, Cl. A† . . . . . . . . . $ 1,596,912 $ 2,028,600155,000 DISH Network Corp., Cl. A . . 3,065,608 3,227,10016,000 EchoStar Corp., Cl. A† . . . . 478,839 324,48055,000 Scripps Networks
Interactive Inc., Cl. A . . . 2,303,601 2,439,250----------------------------------------------- -----------------------------------------------
9,634,387 11,761,130----------------------------------------------- -----------------------------------------------
Communications Equipment — 0.8%250,000 Corning Inc. . . . . . . . . . . . . 3,735,647 5,052,500100,000 Motorola Inc.† . . . . . . . . . . 830,109 702,000120,000 Thomas & Betts Corp.† . . . 3,448,817 4,708,800
----------------------------------------------- -----------------------------------------------8,014,573 10,463,300
----------------------------------------------- -----------------------------------------------Computer Hardware — 1.8%
175,000 International Business Machines Corp. . . . . . . . 14,192,891 22,443,750
210,000 Xerox Corp. . . . . . . . . . . . . 1,857,744 2,047,500----------------------------------------------- -----------------------------------------------
16,050,635 24,491,250----------------------------------------------- -----------------------------------------------
Computer Software and Services — 1.3%120,000 Fidelity National Information
Services Inc. . . . . . . . . . 1,968,404 2,812,800445,000 Microsoft Corp. . . . . . . . . . 12,557,079 13,025,150170,000 Yahoo! Inc.† . . . . . . . . . . . . 4,527,883 2,810,100
----------------------------------------------- -----------------------------------------------19,053,366 18,648,050
----------------------------------------------- -----------------------------------------------Consumer Products — 6.9%
45,000 Altria Group Inc. . . . . . . . . . 538,092 923,400130,000 Avon Products Inc. . . . . . . 3,737,161 4,403,10015,000 Clorox Co. . . . . . . . . . . . . . 823,581 962,10010,000 Compagnie Financiere
Richemont SA, Cl. A . . . 268,687 387,234890,000 Eastman Kodak Co.† . . . . . 7,461,569 5,153,10063,000 Energizer Holdings Inc.† . . 2,834,133 3,953,880
140,000 Fortune Brands Inc. . . . . . . 6,716,892 6,791,4005,000 Hanesbrands Inc.† . . . . . . . 108,950 139,100
45,000 Harman International Industries Inc.† . . . . . . . 1,576,465 2,105,100
240,000 Kimberly-Clark Corp. . . . . . 15,357,266 15,091,2006,500 National Presto
Industries Inc. . . . . . . . . 191,184 772,91510,000 Pactiv Corp.† . . . . . . . . . . . 161,895 251,80050,000 Philip Morris
International Inc. . . . . . . 1,501,172 2,608,000100,000 Reckitt Benckiser Group plc 3,154,703 5,488,787
1,310,000 Swedish Match AB . . . . . . . 17,235,919 31,314,018215,000 The Procter & Gamble Co. . . 12,428,616 13,603,05078,000 Unilever NV - NY Shares,
ADR . . . . . . . . . . . . . . . . 1,542,066 2,352,480----------------------------------------------- -----------------------------------------------
75,638,351 96,300,664----------------------------------------------- -----------------------------------------------
Consumer Services — 0.1%67,500 Rollins Inc. . . . . . . . . . . . . . 386,886 1,463,400
----------------------------------------------- -----------------------------------------------
MarketShares Cost Value——–— —— ——–—
MarketShares Cost Value——–— —— ——–—
The Gabelli Equity Income FundSchedule of Investments — March 31, 2010 (Unaudited)

5
See accompanying notes to financial statements.
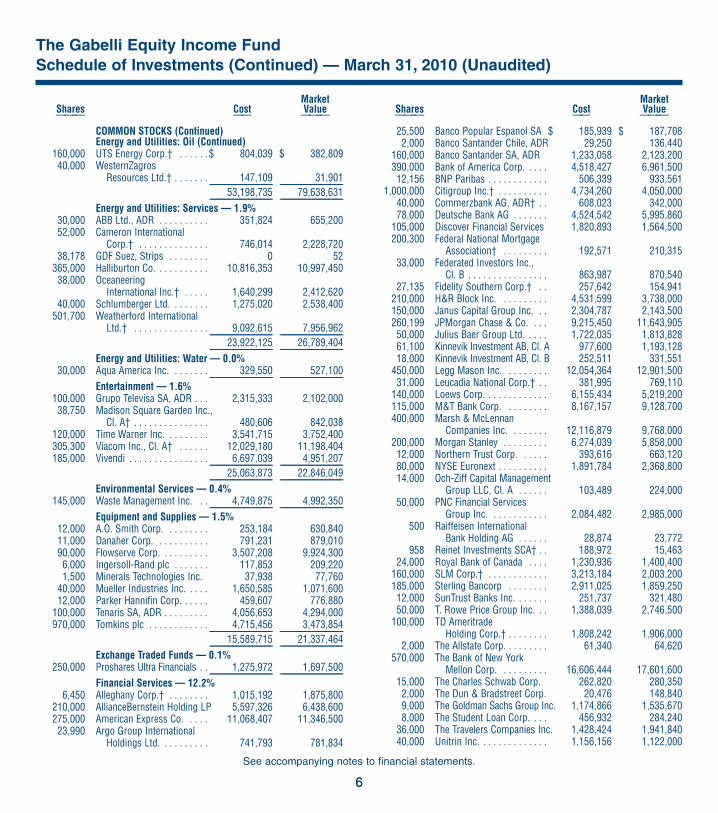
The Gabelli Equity Income FundSchedule of Investments (Continued) — March 31, 2010 (Unaudited)
COMMON STOCKS (Continued)Diversified Industrial — 3.5%
5,000 3M Co. . . . . . . . . . . . . . . . . $ 213,645 $ 417,8504,000 Acuity Brands Inc. . . . . . . . 42,447 168,8405,000 Alstom SA . . . . . . . . . . . . . 430,734 311,799
65,000 Baldor Electric Co. . . . . . . . 2,002,927 2,431,000100,000 Cooper Industries plc . . . . . 2,857,977 4,794,00096,000 Crane Co. . . . . . . . . . . . . . . 3,275,285 3,408,000
870,000 General Electric Co. . . . . . . 19,149,328 15,834,000210,000 Honeywell International Inc. 6,310,986 9,506,70030,000 ITT Corp. . . . . . . . . . . . . . . 1,489,518 1,608,3008,000 Jardine Matheson
Holdings Ltd. . . . . . . . . . 241,476 266,40030,000 Jardine Strategic
Holdings Ltd. . . . . . . . . . 530,196 577,200413,003 National Patent Development
Corp.† (a) . . . . . . . . . . . 1,017,559 578,204120,000 Textron Inc. . . . . . . . . . . . . 763,372 2,547,600
6,000 Trinity Industries Inc. . . . . . 82,100 119,760175,000 Tyco International Ltd. . . . . 6,826,748 6,693,750
----------------------------------------------- -----------------------------------------------45,234,298 49,263,403
----------------------------------------------- -----------------------------------------------Electronics — 1.7%
615,000 Intel Corp. . . . . . . . . . . . . . 12,560,656 13,689,900340,000 LSI Corp.† . . . . . . . . . . . . . 3,105,578 2,080,800190,000 Texas Instruments Inc. . . . . 4,127,219 4,649,300
6,000 Thermo Fisher Scientific Inc.† . . . . . . . . 174,665 308,640
130,250 Tyco Electronics Ltd. . . . . . 4,305,304 3,579,270----------------------------------------------- -----------------------------------------------
24,273,422 24,307,910----------------------------------------------- -----------------------------------------------
Energy and Utilities: Electric — 1.1%30,000 American Electric
Power Co. Inc. . . . . . . . . 932,060 1,025,40014,000 DTE Energy Co. . . . . . . . . . 606,560 624,40085,000 El Paso Electric Co.† . . . . . 670,852 1,751,00080,000 FPL Group Inc. . . . . . . . . . . 3,608,192 3,866,40095,000 Great Plains Energy Inc. . . . 2,378,283 1,764,15060,000 Korea Electric Power Corp.,
ADR† . . . . . . . . . . . . . . . 977,409 974,40056,087 Mirant Corp.† . . . . . . . . . . . 936,815 609,105
1,200,000 Mirant Corp., Escrow† (b) . . 0 0150,000 Northeast Utilities . . . . . . . . 3,148,300 4,146,00080,000 The AES Corp.† . . . . . . . . . 268,400 880,00013,333 UIL Holdings Corp. . . . . . . 293,785 366,658
----------------------------------------------- -----------------------------------------------13,820,656 16,007,513
----------------------------------------------- -----------------------------------------------Energy and Utilities: Integrated — 2.8%
50,000 Allegheny Energy Inc. . . . . 586,698 1,150,00044,000 BP plc, ADR . . . . . . . . . . . . 1,030,211 2,511,08046,000 CH Energy Group Inc. . . . . 1,881,549 1,878,64080,000 Constellation Energy
Group Inc. . . . . . . . . . . . 2,406,564 2,808,800
70,000 Dominion Resources Inc. . . $ 2,831,458 $ 2,877,700100,000 DPL Inc. . . . . . . . . . . . . . . . 2,637,051 2,719,000200,000 Duke Energy Corp. . . . . . . . 2,462,844 3,264,000400,000 El Paso Corp. . . . . . . . . . . . 4,614,299 4,336,00029,000 ENI SpA . . . . . . . . . . . . . . . 304,221 680,36712,269 Iberdrola SA, ADR . . . . . . . 510,847 415,30625,000 Integrys Energy Group Inc. 1,192,522 1,184,50080,000 NSTAR . . . . . . . . . . . . . . . . 1,282,183 2,833,60072,000 OGE Energy Corp. . . . . . . . 1,955,611 2,803,680
100,000 PNM Resources Inc. . . . . . 1,042,460 1,253,00075,000 Progress Energy Inc. . . . . . 3,196,534 2,952,00015,000 Progress Energy Inc., CVO† 7,800 2,2507,200 Public Service Enterprise
Group Inc. . . . . . . . . . . . 156,820 212,54430,000 Suncor Energy Inc.,
New York . . . . . . . . . . . . 785,965 976,20021,000 Suncor Energy Inc., Toronto 908,497 682,94250,000 TECO Energy Inc. . . . . . . . . 652,639 794,500
140,000 Westar Energy Inc. . . . . . . . 2,333,669 3,122,000----------------------------------------------- -----------------------------------------------
32,780,442 39,458,109----------------------------------------------- -----------------------------------------------
Energy and Utilities: Natural Gas — 1.5%13,000 AGL Resources Inc. . . . . . . 242,114 502,45023,000 Atmos Energy Corp. . . . . . . 597,868 657,110
137,200 National Fuel Gas Co. . . . . . 5,667,127 6,935,46073,000 ONEOK Inc. . . . . . . . . . . . . 1,642,426 3,332,45024,000 Piedmont Natural
Gas Co. Inc. . . . . . . . . . . 394,017 661,920110,000 Southern Union Co. . . . . . . 2,047,400 2,790,70065,000 Southwest Gas Corp. . . . . . 1,365,198 1,944,800
200,000 Spectra Energy Corp. . . . . . 4,249,072 4,506,000----------------------------------------------- -----------------------------------------------
16,205,222 21,330,890----------------------------------------------- -----------------------------------------------
Energy and Utilities: Oil — 5.7%157,000 Anadarko Petroleum Corp. . . 8,247,254 11,434,31038,000 Canadian Oil Sands Trust . . 1,117,252 1,139,270
190,000 Chevron Corp. . . . . . . . . . . 8,702,369 14,407,700185,000 ConocoPhillips . . . . . . . . . . 5,343,273 9,466,45022,000 Denbury Resources Inc.† . . 369,472 371,14049,000 Devon Energy Corp. . . . . . . 2,021,181 3,157,070
149,000 Exxon Mobil Corp. . . . . . . . 4,735,083 9,980,02035,000 Marathon Oil Corp. . . . . . . . 1,477,598 1,107,40027,000 Nexen Inc. . . . . . . . . . . . . . 832,021 668,0552,000 Niko Resources Ltd. . . . . . . 114,911 213,322
94,000 Occidental Petroleum Corp. 3,654,851 7,946,76011,000 PetroChina Co. Ltd., ADR . . 767,997 1,289,420
126,000 Petroleo Brasileiro SA, ADR 5,203,754 5,605,74033,000 Repsol YPF SA, ADR . . . . . 689,095 784,740
120,000 Royal Dutch Shell plc, Cl. A, ADR . . . . . . . . . . . 5,536,435 6,943,200
25,000 Statoil ASA, ADR . . . . . . . . 327,939 583,25017,518 Total SA, ADR . . . . . . . . . . 290,564 1,016,39436,000 Transocean Ltd.† . . . . . . . . 2,816,538 3,109,680
MarketShares Cost Value——–— —— ——–—
MarketShares Cost Value——–— —— ——–—
6
See accompanying notes to financial statements.
COMMON STOCKS (Continued)Energy and Utilities: Oil (Continued)
160,000 UTS Energy Corp.† . . . . . . $ 804,039 $ 382,80940,000 WesternZagros
Resources Ltd.† . . . . . . . 147,109 31,901----------------------------------------------- -----------------------------------------------
53,198,735 79,638,631----------------------------------------------- -----------------------------------------------
Energy and Utilities: Services — 1.9%30,000 ABB Ltd., ADR . . . . . . . . . . 351,824 655,20052,000 Cameron International
Corp.† . . . . . . . . . . . . . . 746,014 2,228,72038,178 GDF Suez, Strips . . . . . . . . 0 52
365,000 Halliburton Co. . . . . . . . . . . 10,816,353 10,997,45038,000 Oceaneering
International Inc.† . . . . . 1,640,299 2,412,62040,000 Schlumberger Ltd. . . . . . . . 1,275,020 2,538,400
501,700 Weatherford International Ltd.† . . . . . . . . . . . . . . . 9,092,615 7,956,962
----------------------------------------------- -----------------------------------------------23,922,125 26,789,404
----------------------------------------------- -----------------------------------------------Energy and Utilities: Water — 0.0%
30,000 Aqua America Inc. . . . . . . . 329,550 527,100----------------------------------------------- -----------------------------------------------
Entertainment — 1.6%100,000 Grupo Televisa SA, ADR . . . 2,315,333 2,102,00038,750 Madison Square Garden Inc.,
Cl. A† . . . . . . . . . . . . . . . 480,606 842,038120,000 Time Warner Inc. . . . . . . . . 3,541,715 3,752,400305,300 Viacom Inc., Cl. A† . . . . . . 12,029,180 11,198,404185,000 Vivendi . . . . . . . . . . . . . . . . 6,697,039 4,951,207
----------------------------------------------- -----------------------------------------------25,063,873 22,846,049
----------------------------------------------- -----------------------------------------------Environmental Services — 0.4%
145,000 Waste Management Inc. . . 4,749,875 4,992,350----------------------------------------------- -----------------------------------------------
Equipment and Supplies — 1.5%12,000 A.O. Smith Corp. . . . . . . . . 253,184 630,84011,000 Danaher Corp. . . . . . . . . . . 791,231 879,01090,000 Flowserve Corp. . . . . . . . . . 3,507,208 9,924,3006,000 Ingersoll-Rand plc . . . . . . . 117,853 209,2201,500 Minerals Technologies Inc. 37,938 77,760
40,000 Mueller Industries Inc. . . . . 1,650,585 1,071,60012,000 Parker Hannifin Corp. . . . . . 459,607 776,880
100,000 Tenaris SA, ADR . . . . . . . . . 4,056,653 4,294,000970,000 Tomkins plc . . . . . . . . . . . . 4,715,456 3,473,854
----------------------------------------------- -----------------------------------------------15,589,715 21,337,464
----------------------------------------------- -----------------------------------------------Exchange Traded Funds — 0.1%
250,000 Proshares Ultra Financials . . 1,275,972 1,697,500----------------------------------------------- -----------------------------------------------
Financial Services — 12.2%6,450 Alleghany Corp.† . . . . . . . . 1,015,192 1,875,800
210,000 AllianceBernstein Holding LP 5,597,326 6,438,600275,000 American Express Co. . . . . 11,068,407 11,346,50023,990 Argo Group International
Holdings Ltd. . . . . . . . . . 741,793 781,834
25,500 Banco Popular Espanol SA $ 185,939 $ 187,7082,000 Banco Santander Chile, ADR 29,250 136,440
160,000 Banco Santander SA, ADR 1,233,058 2,123,200390,000 Bank of America Corp. . . . . 4,518,427 6,961,50012,156 BNP Paribas . . . . . . . . . . . . 506,339 933,561
1,000,000 Citigroup Inc.† . . . . . . . . . . 4,734,260 4,050,00040,000 Commerzbank AG, ADR† . . 608,023 342,00078,000 Deutsche Bank AG . . . . . . . 4,524,542 5,995,860
105,000 Discover Financial Services 1,820,893 1,564,500200,300 Federal National Mortgage
Association† . . . . . . . . . 192,571 210,31533,000 Federated Investors Inc.,
Cl. B . . . . . . . . . . . . . . . . 863,987 870,54027,135 Fidelity Southern Corp.† . . 257,642 154,941
210,000 H&R Block Inc. . . . . . . . . . 4,531,599 3,738,000150,000 Janus Capital Group Inc. . . 2,304,787 2,143,500260,199 JPMorgan Chase & Co. . . . 9,215,450 11,643,90550,000 Julius Baer Group Ltd. . . . . 1,722,035 1,813,82861,100 Kinnevik Investment AB, Cl. A 977,600 1,193,12818,000 Kinnevik Investment AB, Cl. B 252,511 331,551
450,000 Legg Mason Inc. . . . . . . . . 12,054,364 12,901,50031,000 Leucadia National Corp.† . . 381,995 769,110
140,000 Loews Corp. . . . . . . . . . . . . 6,155,434 5,219,200115,000 M&T Bank Corp. . . . . . . . . 8,167,157 9,128,700400,000 Marsh & McLennan
Companies Inc. . . . . . . . 12,116,879 9,768,000200,000 Morgan Stanley . . . . . . . . . 6,274,039 5,858,00012,000 Northern Trust Corp. . . . . . 393,616 663,12080,000 NYSE Euronext . . . . . . . . . . 1,891,784 2,368,80014,000 Och-Ziff Capital Management
Group LLC, Cl. A . . . . . . 103,489 224,00050,000 PNC Financial Services
Group Inc. . . . . . . . . . . . 2,084,482 2,985,000500 Raiffeisen International
Bank Holding AG . . . . . . 28,874 23,772958 Reinet Investments SCA† . . 188,972 15,463
24,000 Royal Bank of Canada . . . . 1,230,936 1,400,400160,000 SLM Corp.† . . . . . . . . . . . . 3,213,184 2,003,200185,000 Sterling Bancorp . . . . . . . . 2,911,025 1,859,25012,000 SunTrust Banks Inc. . . . . . . 251,737 321,48050,000 T. Rowe Price Group Inc. . . 1,388,039 2,746,500
100,000 TD Ameritrade Holding Corp.† . . . . . . . . 1,808,242 1,906,000
2,000 The Allstate Corp. . . . . . . . . 61,340 64,620570,000 The Bank of New York
Mellon Corp. . . . . . . . . . 16,606,444 17,601,60015,000 The Charles Schwab Corp. 262,820 280,3502,000 The Dun & Bradstreet Corp. 20,476 148,8409,000 The Goldman Sachs Group Inc. 1,174,866 1,535,6708,000 The Student Loan Corp. . . . 456,932 284,240
36,000 The Travelers Companies Inc. 1,428,424 1,941,84040,000 Unitrin Inc. . . . . . . . . . . . . . 1,156,156 1,122,000
MarketShares Cost Value——–— —— ——–—
MarketShares Cost Value——–— —— ——–—
The Gabelli Equity Income FundSchedule of Investments (Continued) — March 31, 2010 (Unaudited)
6

7
See accompanying notes to financial statements.
The Gabelli Equity Income FundSchedule of Investments (Continued) — March 31, 2010 (Unaudited)
COMMON STOCKS (Continued)Financial Services (Continued)
170,000 Waddell & Reed Financial Inc., Cl. A . . . . . . . . . . . . . . . . $ 3,708,122 $ 6,126,800
480,000 Wells Fargo & Co. . . . . . . . 14,589,727 14,937,600110,000 Wilmington Trust Corp. . . . 3,068,652 1,822,700
5,000 Zenith National Insurance Corp. . . . . . . . 189,000 191,600
----------------------------------------------- -----------------------------------------------160,268,838 171,056,566
----------------------------------------------- -----------------------------------------------Food and Beverage — 12.4%
20,000 American Dairy Inc.† . . . . . 479,386 383,00030,000 Anheuser-Busch InBev NV 496,266 1,511,18364,000 Brown-Forman Corp., Cl. A 2,899,384 4,019,20013,500 Brown-Forman Corp., Cl. B 825,918 802,575
150,000 Campbell Soup Co. . . . . . . 4,421,041 5,302,50040,000 Coca-Cola Amatil Ltd., ADR 246,845 824,00016,000 Coca-Cola Femsa SAB de CV,
ADR . . . . . . . . . . . . . . . . 565,411 1,063,200200,000 Constellation Brands Inc.,
Cl. A† . . . . . . . . . . . . . . . 2,611,207 3,288,00020,000 Corn Products
International Inc. . . . . . . 317,298 693,200136,389 Danone S.A. . . . . . . . . . . . . 6,897,164 8,215,983295,000 Dean Foods Co.† . . . . . . . . 5,741,566 4,628,55050,000 Del Monte Foods Co. . . . . . 508,821 730,00062,000 Diageo plc, ADR . . . . . . . . . 2,742,932 4,181,900
100,000 Dr. Pepper Snapple Group Inc. . . . . . . . . . . . 2,159,483 3,517,000
140,000 Fomento Economico Mexicano SAB de CV, ADR . . . . . . . 3,316,409 6,654,200
110,000 General Mills Inc. . . . . . . . . 5,457,146 7,786,900800,000 Grupo Bimbo SAB de CV, Cl. A 2,557,333 7,143,464122,000 H.J. Heinz Co. . . . . . . . . . . 4,325,482 5,564,420125,000 Heineken NV . . . . . . . . . . . . 5,566,367 6,424,066200,000 ITO EN Ltd. . . . . . . . . . . . . 4,311,208 3,095,518
3,000 Kellogg Co. . . . . . . . . . . . . . 92,580 160,2901,000,700 Kraft Foods Inc., Cl. A . . . . 29,536,272 30,261,168
100,000 Nestlé SA . . . . . . . . . . . . . . 2,083,075 5,121,396105,000 NISSIN FOODS HOLDINGS
CO. LTD. . . . . . . . . . . . . . 3,438,629 3,532,1962,600,000 Parmalat SpA . . . . . . . . . . . 7,398,007 7,119,992
25,953 PepsiCo Inc. . . . . . . . . . . . . 1,615,574 1,717,05034,507 Pernod-Ricard SA . . . . . . . 2,637,794 2,930,19140,000 Remy Cointreau SA . . . . . . 2,267,718 2,066,506
150,000 Sapporo Holdings Ltd. . . . . 1,005,195 782,971523,000 The Coca-Cola Co. . . . . . . . 25,482,714 28,765,00080,000 The Hershey Co. . . . . . . . . . 3,371,585 3,424,80062,076 Tootsie Roll Industries Inc. 1,474,230 1,677,915
320,000 Tyson Foods Inc., Cl. A . . . 4,688,431 6,128,00028,000 Wimm-Bill-Dann Foods
OJSC, ADR . . . . . . . . . . . 249,970 627,760
135,000 YAKULT HONSHA Co. Ltd. . . $ 3,659,573 $ 3,641,780----------------------------------------------- -----------------------------------------------
145,448,014 173,785,874----------------------------------------------- -----------------------------------------------Health Care — 11.1%
45,000 Abbott Laboratories . . . . . . 2,036,200 2,370,60025,000 Aetna Inc. . . . . . . . . . . . . . . 870,832 877,75030,000 Alcon Inc. . . . . . . . . . . . . . . 4,659,449 4,846,800
125,000 Baxter International Inc. . . . 4,878,406 7,275,000100,000 Becton, Dickinson and Co. 6,601,932 7,873,000650,000 Boston Scientific Corp.† . . 6,603,580 4,693,000225,000 Bristol-Myers Squibb Co. . . 5,525,976 6,007,500280,000 Covidien plc . . . . . . . . . . . . 10,538,875 14,078,400410,000 Eli Lilly & Co. . . . . . . . . . . . 17,290,465 14,850,20011,276 GlaxoSmithKline plc, ADR . . 515,984 434,35222,000 Henry Schein Inc.† . . . . . . . 566,365 1,295,800
100,000 Hospira Inc.† . . . . . . . . . . . 3,605,739 5,665,000312,000 Johnson & Johnson . . . . . . 19,772,353 20,342,40017,000 Laboratory Corp. of
America Holdings† . . . . . 1,207,808 1,287,070105,000 Mead Johnson Nutrition Co. 4,674,992 5,463,15024,000 Medco Health Solutions Inc.† 613,992 1,549,440
180,000 Merck & Co. Inc. . . . . . . . . 4,422,633 6,723,00045,800 Millipore Corp.† . . . . . . . . . 4,817,516 4,836,4805,000 Nobel Biocare Holding AG . . 139,480 133,725
145,000 Novartis AG, ADR . . . . . . . . 7,919,877 7,844,50035,000 Patterson Companies Inc. . . 1,211,543 1,086,750
966,700 Pfizer Inc. . . . . . . . . . . . . . . 20,702,986 16,578,90572,000 St. Jude Medical Inc.† . . . . 2,959,242 2,955,600
740,000 Tenet Healthcare Corp.† . . . 5,076,159 4,232,800265,000 UnitedHealth Group Inc. . . . 11,318,511 8,657,55018,000 William Demant Holding
A/S† . . . . . . . . . . . . . . . . 880,509 1,273,63144,000 Zimmer Holdings Inc.† . . . 2,690,494 2,604,800
----------------------------------------------- -----------------------------------------------152,101,898 155,837,203
----------------------------------------------- -----------------------------------------------Hotels and Gaming — 1.5%
125,000 International Game Technology . . . . . . . . . . . 2,928,329 2,306,250
1,204,352 Ladbrokes plc . . . . . . . . . . . 8,974,480 2,905,885300,000 Las Vegas Sands Corp.† . . 1,669,152 6,345,000385,000 MGM Mirage† . . . . . . . . . . 4,942,071 4,620,00080,000 Starwood Hotels & Resorts
Worldwide Inc. . . . . . . . . 1,673,543 3,731,20015,000 Wynn Resorts Ltd. . . . . . . . 579,316 1,137,450
----------------------------------------------- -----------------------------------------------20,766,891 21,045,785
----------------------------------------------- -----------------------------------------------Machinery — 1.4%
6,000 Caterpillar Inc. . . . . . . . . . . 35,181 377,100320,400 Deere & Co. . . . . . . . . . . . . 15,974,668 19,050,98410,009 Mueller Water Products Inc.,
Cl. A . . . . . . . . . . . . . . . . 121,460 47,843----------------------------------------------- -----------------------------------------------
16,131,309 19,475,927----------------------------------------------- -----------------------------------------------
MarketShares Cost Value——–— —— ——–—
MarketShares Cost Value——–— —— ——–—

8
See accompanying notes to financial statements.
COMMON STOCKS (Continued)Metals and Mining — 2.2%
500,000 Alcoa Inc. . . . . . . . . . . . . . . $ 10,005,982 $ 7,120,00010,000 Carpenter Technology Corp. 327,255 366,000
125,000 Freeport-McMoRan Copper & Gold Inc. . . . . . . . . . . 3,080,698 10,442,500
190,000 Newmont Mining Corp. . . . 7,722,899 9,676,70045,000 Peabody Energy Corp. . . . . 1,713,246 2,056,5002,000 Royal Gold Inc. . . . . . . . . . 88,166 92,4206,615 Teck Resources Ltd., Cl. B† 533,053 288,203
----------------------------------------------- -----------------------------------------------23,471,299 30,042,323
----------------------------------------------- -----------------------------------------------Publishing — 0.1%
5,000 Idearc Inc.† (b) . . . . . . . . . 268 176,016 News Corp., Cl. B . . . . . . . . 70,881 102,332
30,000 The McGraw-Hill Companies Inc. . . . . . . . 1,225,693 1,069,500
800 The Washington Post Co., Cl. B . . . . . . . . . . . . . . . . 465,710 355,344
3,000 Value Line Inc. . . . . . . . . . . 113,776 69,270----------------------------------------------- -----------------------------------------------
1,876,328 1,596,463----------------------------------------------- -----------------------------------------------Real Estate — 0.0%
10,000 Griffin Land & Nurseries Inc. 224,290 290,500----------------------------------------------- -----------------------------------------------
Retail — 6.0%7,500 AutoZone Inc.† . . . . . . . . . . 1,120,476 1,298,175
33,000 Copart Inc.† . . . . . . . . . . . . 1,043,287 1,174,800225,000 Costco Wholesale Corp. . . . 11,676,234 13,434,750410,000 CVS Caremark Corp. . . . . . 14,818,784 14,989,60080,000 Ingles Markets Inc., Cl. A . . 1,547,485 1,202,400
510,000 Macy’s Inc. . . . . . . . . . . . . . 8,225,055 11,102,700170,000 Safeway Inc. . . . . . . . . . . . . 3,593,397 4,226,200
500 Sears Holdings Corp.† . . . . 40,733 54,215270,000 SUPERVALU Inc. . . . . . . . . 4,774,655 4,503,600210,000 The Great Atlantic &
Pacific Tea Co. Inc.† . . . 3,360,029 1,610,700100,000 The Home Depot Inc. . . . . . 2,853,861 3,235,00065,000 Tractor Supply Co. . . . . . . . 2,355,113 3,773,250
234,000 Wal-Mart Stores Inc. . . . . . 11,089,210 13,010,400155,000 Walgreen Co. . . . . . . . . . . . 5,237,292 5,748,95010,000 Weis Markets Inc. . . . . . . . 300,480 363,600
100,000 Whole Foods Market Inc.† . . 3,392,986 3,615,000----------------------------------------------- -----------------------------------------------
75,429,077 83,343,340----------------------------------------------- -----------------------------------------------
Specialty Chemicals — 1.7%44,000 Albemarle Corp. . . . . . . . . . 576,219 1,875,72045,000 Ashland Inc. . . . . . . . . . . . . 1,712,728 2,374,65085,000 E. I. du Pont de
Nemours and Co. . . . . . . 3,637,924 3,165,400260,000 Ferro Corp.† . . . . . . . . . . . . 2,722,418 2,285,400
2,000 FMC Corp. . . . . . . . . . . . . . 64,790 121,08052,500 H.B. Fuller Co. . . . . . . . . . . 1,084,497 1,218,525
167,000 International Flavors & Fragrances Inc. . . . . . . . $ 7,707,089 $ 7,960,890
3,500 NewMarket Corp. . . . . . . . . 13,508 360,46575,000 Omnova Solutions Inc.† . . . 485,875 588,7505,000 Quaker Chemical Corp. . . . 90,412 135,550
40,000 Sensient Technologies Corp. 822,757 1,162,400100,000 The Dow Chemical Co. . . . . 3,887,859 2,957,000
4,000 Zep Inc. . . . . . . . . . . . . . . . 17,026 87,520----------------------------------------------- -----------------------------------------------
22,823,102 24,293,350----------------------------------------------- -----------------------------------------------
Telecommunications — 5.1%500,000 3Com Corp.† . . . . . . . . . . . 3,681,250 3,845,000375,000 AT&T Inc. . . . . . . . . . . . . . . 10,014,334 9,690,000500,000 BCE Inc. . . . . . . . . . . . . . . . 11,268,358 14,675,00046,000 Belgacom SA . . . . . . . . . . . 1,592,123 1,796,8074,495 Bell Aliant Regional
Communications Income Fund (a)(b) . . . . . . . . . . . 117,429 112,458
50,000 BT Group plc . . . . . . . . . . . 204,914 94,00920,000 BT Group plc, ADR . . . . . . . 617,465 374,20035,000 CenturyTel Inc. . . . . . . . . . . 1,150,298 1,241,100
400,000 Cincinnati Bell Inc.† . . . . . . 2,039,696 1,364,000380,000 Deutsche Telekom AG, ADR 6,454,129 5,130,00018,000 France Telecom SA, ADR . . 508,264 432,540
1,000,000 Qwest Communications International Inc. . . . . . . 4,612,175 5,220,000
2,000,000 Sprint Nextel Corp.† . . . . . . 9,611,438 7,600,0009,195 Telefonica SA, ADR . . . . . . 161,475 653,765
320,000 Telekom Austria AG . . . . . . 4,947,083 4,473,379144,500 Telephone & Data
Systems Inc. . . . . . . . . . 5,307,372 4,891,32512,000 TELUS Corp. . . . . . . . . . . . 185,454 446,61120,000 TELUS Corp., Non-Voting . . 937,513 716,400
260,000 Verizon Communications Inc. 9,316,901 8,065,200----------------------------------------------- -----------------------------------------------
72,727,671 70,821,794----------------------------------------------- -----------------------------------------------
Transportation — 0.3%137,600 GATX Corp. . . . . . . . . . . . . 5,017,853 3,942,240
----------------------------------------------- -----------------------------------------------Wireless Communications — 0.6%
140,000 Cable & Wireless Communications plc . . . 106,768 117,591
140,000 Cable & Wireless Worldwide plc† . . . . . . . 166,997 195,454
31,000 Millicom International Cellular SA . . . . . . . . . . . 2,340,951 2,763,650
2,400 NTT DoCoMo Inc. . . . . . . . 3,485,733 3,655,57860,000 Turkcell Iletisim Hizmetleri
A/S, ADR . . . . . . . . . . . . 984,965 903,600----------------------------------------------- -----------------------------------------------
7,085,414 7,635,873----------------------------------------------- -----------------------------------------------
TOTAL COMMON STOCKS . . 1,171,622,641 1,343,253,202----------------------------------------------- -----------------------------------------------
MarketShares Cost Value——–— —— ——–—
Shares/ MarketUnits Cost Value——–— —— ——–—
The Gabelli Equity Income FundSchedule of Investments (Continued) — March 31, 2010 (Unaudited)
8

9
See accompanying notes to financial statements.
PREFERRED STOCKS — 0.2%Communications Equipment — 0.1%
1,100 Lucent Technologies Capital Trust I, 7.750% Cv. Pfd. $ 759,000 $ 875,600
----------------------------------------------- -----------------------------------------------Energy and Utilities: Integrated — 0.0%
300 El Paso Corp., 4.990% Cv. Pfd. (a) . . . . 293,192 288,213
----------------------------------------------- -----------------------------------------------Entertainment — 0.0%
3,000 Metromedia International Group Inc., 7.250% Pfd.† 5,310 57,000
----------------------------------------------- -----------------------------------------------Telecommunications — 0.1%
33,000 Cincinnati Bell Inc., 6.750% Cv. Pfd., Ser. B . . 918,894 1,288,650
----------------------------------------------- -----------------------------------------------TOTAL
PREFERRED STOCKS . . 1,976,396 2,509,463----------------------------------------------- -----------------------------------------------
WARRANTS — 0.0%Broadcasting — 0.0%
330 Granite Broadcasting Corp., Ser. A, expire 06/04/12† (b) . . . . . . . . . 0 0
330 Granite Broadcasting Corp., Ser. B, expire 06/04/12† (b) . . . . . . . . . 0 0
----------------------------------------------- -----------------------------------------------TOTAL WARRANTS . . . . . . 0 0
----------------------------------------------- -----------------------------------------------PrincipalAmount
--------------------
CORPORATE BONDS — 1.2%Automotive: Parts and Accessories — 0.1%
$ 800,000 Standard Motor Products Inc., Sub. Deb. Cv.,15.000%, 04/15/11 . . . . 778,286 812,000
----------------------------------------------- -----------------------------------------------Broadcasting — 0.1%
2,200,000 Sinclair Broadcast Group Inc., Sub. Deb. Cv.,6.000%, 09/15/12 . . . . . 1,974,374 2,095,500
200,000 Young Broadcasting Inc., Sub. Deb.,10.000%, 03/01/11† . . . 154,752 1,400
----------------------------------------------- -----------------------------------------------2,129,126 2,096,900
----------------------------------------------- -----------------------------------------------Computer Hardware — 0.1%
2,000,000 SanDisk Corp., Cv.,1.000%, 05/15/13 . . . . . 1,534,633 1,737,500
----------------------------------------------- -----------------------------------------------Diversified Industrial — 0.5%
6,000,000 Griffon Corp., Sub. Deb. Cv.,4.000%, 01/15/17 (a) . . 6,000,000 6,510,000
----------------------------------------------- -----------------------------------------------
Energy and Utilities: Electric — 0.0%$ 100,000 Texas Competitive Electric
Holdings Co. LLC, Ser. B (STEP),10.250%, 11/01/15 . . . . $ 65,863 $ 70,000
----------------------------------------------- -----------------------------------------------Retail — 0.3%
4,400,000 The Great Atlantic & Pacific Tea Co. Inc., Cv.,5.125%, 06/15/11 . . . . . 4,319,698 4,262,500
----------------------------------------------- -----------------------------------------------Specialty Chemicals — 0.1%
950,000 Ferro Corp., Cv.,6.500%, 08/15/13 . . . . . 530,452 919,125
----------------------------------------------- -----------------------------------------------TOTAL CORPORATE BONDS 15,358,058 16,408,025
----------------------------------------------- -----------------------------------------------U.S. GOVERNMENT OBLIGATIONS — 2.5%U.S. Treasury Bills — 1.2%
17,611,000 U.S. Treasury Bills, 0.061% to 0.127%††, 04/22/10 to 07/08/10 . . . 17,608,963 17,608,828
----------------------------------------------- -----------------------------------------------U.S. Treasury Cash Management Bills — 1.2%
16,270,000 U.S. Treasury Cash Management Bills, 0.106% to 0.157%††, 06/10/10 to 07/15/10 . . . 16,265,321 16,264,732
----------------------------------------------- -----------------------------------------------U.S. Treasury Notes — 0.1%
1,500,000 U.S. Treasury Note,4.125%, 08/15/10 . . . . . 1,521,842 1,522,442
----------------------------------------------- -----------------------------------------------TOTAL U.S. GOVERNMENT
OBLIGATIONS . . . . . . . . 35,396,126 35,396,002----------------------------------------------- -----------------------------------------------
TOTAL INVESTMENTS — 99.8% $1,224,353,221 1,397,566,692
----------------------------------------------------------------------------------------------Other Assets and Liabilities (Net) — 0.2% 2,227,310
-----------------------------------------------NET ASSETS — 100.0% . . . . . . . . . . . . . . . $1,399,794,002
------------------------------------------------------------------------------------------------------------------------------------------------------------(a) Security exempt from registration under Rule 144A of the Securities Act
of 1933, as amended. These securities may be resold in transactionsexempt from registration, normally to qualified institutional buyers. AtMarch 31, 2010, the market value of Rule 144A securities amounted to$7,488,875 or 0.54% of net assets.
(b) Security fair valued under procedures established by the Board ofDirectors. The procedures may include reviewing available financialinformation about the company and reviewing the valuation ofcomparable securities and other factors on a regular basis. At March 31,2010, the market value of fair valued securities amounted to $112,475 or0.01% of net assets.
† Non-income producing security.†† Represents annualized yield at date of purchase.ADR American Depositary ReceiptCVO Contingent Value ObligationSTEP Step coupon bond. The rate disclosed is that in effect at March 31, 2010.
MarketShares Cost Value——–— —— ——–—
Principal MarketAmount Cost Value——–— —— ——–—
The Gabelli Equity Income FundSchedule of Investments (Continued) — March 31, 2010 (Unaudited)

10
See accompanying notes to financial statements.
Statement of OperationsFor the Six Months Ended March 31, 2010 (Unaudited)
Investment Income:Dividends (net of foreign taxes of $179,619) . . . $ 13,360,043Interest . . . . . . . . . . . . . . . . . . . . . . . . . . . . . . . . 500,548Total Investment Income . . . . . . . . . . . . . . . . . 13,860,591
Expenses:Investment advisory fees . . . . . . . . . . . . . . . . . . 6,312,971Distribution fees – Class AAA . . . . . . . . . . . . . . 1,486,452Distribution fees – Class A . . . . . . . . . . . . . . . . . 48,173Distribution fees – Class B . . . . . . . . . . . . . . . . . 591Distribution fees – Class C . . . . . . . . . . . . . . . . . 127,300Shareholder services fees . . . . . . . . . . . . . . . . . 718,181Shareholder communications expenses . . . . . . 193,569Custodian fees . . . . . . . . . . . . . . . . . . . . . . . . . . 88,507Registration expenses . . . . . . . . . . . . . . . . . . . . 43,663Legal and audit fees . . . . . . . . . . . . . . . . . . . . . . 31,617Accounting fees . . . . . . . . . . . . . . . . . . . . . . . . . 22,500Directors’ fees . . . . . . . . . . . . . . . . . . . . . . . . . . . 19,595Interest expense . . . . . . . . . . . . . . . . . . . . . . . . . 18Miscellaneous expenses . . . . . . . . . . . . . . . . . . 50,202Total Expenses . . . . . . . . . . . . . . . . . . . . . . . . . 9,143,339Less:
Custodian fee credits . . . . . . . . . . . . . . . . . . . (242)Net Expenses . . . . . . . . . . . . . . . . . . . . . . . . . . 9,143,097Net Investment Income . . . . . . . . . . . . . . . . . . 4,717,494
Net Realized and Unrealized Gain/(Loss) on Investments, Swap Contracts, and Foreign Currency:Net realized loss on investments . . . . . . . . . . . . (4,147,931)Net realized gain on swap contracts . . . . . . . . . 69,134Net realized gain on foreign currency
transactions . . . . . . . . . . . . . . . . . . . . . . . . . . . 2,312Net realized loss on investments, swap contracts,
and foreign currency transactions . . . . . . . . . . (4,076,485)Net change in unrealized appreciation/depreciation:
on investments . . . . . . . . . . . . . . . . . . . . . . . . 127,792,611on swap contracts . . . . . . . . . . . . . . . . . . . . . . 11,034on foreign currency translations . . . . . . . . . . . (4,406)
Net change in unrealized appreciation/depreciation on investments, swap contracts, and foreign currency translations . . . . . . . . . . . . . . . . . . . . 127,799,239
Net Realized and Unrealized Gain/(Loss) on Investments, Swap Contracts, and Foreign Currency . . . . . . . . . . . . . . . . . . . . . 123,722,754
Net Increase in Net Assets Resulting from Operations . . . . . . . . . . . . . . . . . . . . . $128,440,248
Statement of Assets and LiabilitiesMarch 31, 2010 (Unaudited)
Assets:Investments, at value (cost $1,224,353,221) . . $1,397,566,692Foreign currency, at value (cost $1,735) . . . . . 1,758Receivable for Fund shares sold . . . . . . . . . . . 4,002,877Receivable for investments sold . . . . . . . . . . . 515,540Unrealized appreciation on swap contracts . . . 19,586Dividends and interest receivable . . . . . . . . . . 3,011,624Prepaid expenses . . . . . . . . . . . . . . . . . . . . . . 91,647Total Assets . . . . . . . . . . . . . . . . . . . . . . . . . . 1,405,209,724
Liabilities:Payable to custodian . . . . . . . . . . . . . . . . . . . . 25,651Payable for Fund shares redeemed . . . . . . . . . 1,756,375Payable for investments purchased . . . . . . . . . 1,370,688Payable for investment advisory fees . . . . . . . 1,162,534Payable for distribution fees . . . . . . . . . . . . . . . 307,543Payable for accounting fees . . . . . . . . . . . . . . . 11,250Payable for shareholder services fees . . . . . . . 471,874Other accrued expenses . . . . . . . . . . . . . . . . . 309,807Total Liabilities . . . . . . . . . . . . . . . . . . . . . . . . 5,415,722Net Assets applicable to 74,738,339
shares outstanding . . . . . . . . . . . . . . . . . . . . $1,399,794,002Net Assets Consist of:
Paid-in capital . . . . . . . . . . . . . . . . . . . . . . . . . $1,330,283,287Accumulated distributions in excess of
net investment income . . . . . . . . . . . . . . . . . (8,246,856)Accumulated net realized loss on investments,
swap contracts, and foreign currency transactions . . . . . . . . . . . . . . . . . . . . . . . . . (95,474,778)
Net unrealized appreciation on investments . . 173,213,471Net unrealized appreciation on swap contracts 19,586Net unrealized depreciation on foreign
currency translations . . . . . . . . . . . . . . . . . . . (708)Net Assets . . . . . . . . . . . . . . . . . . . . . . . . . . . $1,399,794,002
Shares of Capital Stock:Class AAA:Net Asset Value, offering, and redemption price per
share ($1,308,769,191 ÷ 69,792,862 shares outstanding, at $0.001 par value; 150,000,000 shares authorized) . . . . . . . . . . . . . . . . . . . . $18.75
Class A:Net Asset Value and redemption price per share
($49,237,612 ÷ 2,633,297 shares outstanding, at $0.001 par value; 50,000,000 shares authorized) $18.70
Maximum offering price per share (NAV ÷ 0.9425, based on maximum sales charge of 5.75% of the offering price) . . . . . . . . . . . . . . . . . . . . . . . . $19.84
Class B:Net Asset Value and offering price per share
($125,221 ÷ 7,023 shares outstanding, at $0.001 par value; 50,000,000 shares authorized) . . $17.83(a)
Class C:Net Asset Value and offering price per share
($31,456,041 ÷ 1,764,543 shares outstanding, at $0.001 par value; 50,000,000 shares authorized) $17.83(a)
Class I:Net Asset Value, offering, and redemption price per share
($10,205,937 ÷ 540,614 shares outstanding, at $0.001 par value; 50,000,000 shares authorized) . . $18.88
(a) Redemption price varies based on the length of time held.
The Gabelli Equity Income Fund

11
See accompanying notes to financial statements.
Statement of Changes in Net Assets
Six Months EndedMarch 31, 2010 Year Ended
(Unaudited) September 30, 2009————––––——––————— ————––––——––—————
Operations:Net investment income . . . . . . . . . . . . . . . . . . . . . . . . . . . . . . . . . . . . . . . . . . . . . . . . . . . $ 4,717,494 $ 13,352,410Net realized loss on investments, swap contracts, and foreign currency transactions . . . (4,076,485) (73,688,314)Net change in unrealized appreciation/depreciation on investments, swap contracts,
and foreign currency translations . . . . . . . . . . . . . . . . . . . . . . . . . . . . . . . . . . . . . . . . . . 127,799,239 19,511,806------------------------------------------------------- -------------------------------------------------------
Net Increase/(Decrease) in Net Assets Resulting from Operations . . . . . . . . . . . . . . 128,440,248 (40,824,098)------------------------------------------------------- -------------------------------------------------------
Distributions to Shareholders:Net investment income
Class AAA . . . . . . . . . . . . . . . . . . . . . . . . . . . . . . . . . . . . . . . . . . . . . . . . . . . . . . . . . . . (12,147,847) (12,708,696)Class A . . . . . . . . . . . . . . . . . . . . . . . . . . . . . . . . . . . . . . . . . . . . . . . . . . . . . . . . . . . . . (402,852) (332,367)Class B . . . . . . . . . . . . . . . . . . . . . . . . . . . . . . . . . . . . . . . . . . . . . . . . . . . . . . . . . . . . . (1,259) (2,539)Class C . . . . . . . . . . . . . . . . . . . . . . . . . . . . . . . . . . . . . . . . . . . . . . . . . . . . . . . . . . . . . (275,987) (263,177)Class I . . . . . . . . . . . . . . . . . . . . . . . . . . . . . . . . . . . . . . . . . . . . . . . . . . . . . . . . . . . . . . (94,325) (93,966)
------------------------------------------------------- -------------------------------------------------------(12,922,270) (13,400,745)
------------------------------------------------------- -------------------------------------------------------Return of capital
Class AAA . . . . . . . . . . . . . . . . . . . . . . . . . . . . . . . . . . . . . . . . . . . . . . . . . . . . . . . . . . . — (9,214,213)Class A . . . . . . . . . . . . . . . . . . . . . . . . . . . . . . . . . . . . . . . . . . . . . . . . . . . . . . . . . . . . . — (240,977)Class B . . . . . . . . . . . . . . . . . . . . . . . . . . . . . . . . . . . . . . . . . . . . . . . . . . . . . . . . . . . . . — (1,841)Class C . . . . . . . . . . . . . . . . . . . . . . . . . . . . . . . . . . . . . . . . . . . . . . . . . . . . . . . . . . . . . — (190,811)Class I . . . . . . . . . . . . . . . . . . . . . . . . . . . . . . . . . . . . . . . . . . . . . . . . . . . . . . . . . . . . . . — (68,128)
------------------------------------------------------- -------------------------------------------------------— (9,715,970)
------------------------------------------------------- -------------------------------------------------------Total Distributions to Shareholders . . . . . . . . . . . . . . . . . . . . . . . . . . . . . . . . . . . . . . . (12,922,270) (23,116,715)
------------------------------------------------------- -------------------------------------------------------Capital Share Transactions
Class AAA . . . . . . . . . . . . . . . . . . . . . . . . . . . . . . . . . . . . . . . . . . . . . . . . . . . . . . . . . . . 111,403,056 18,397,736Class A . . . . . . . . . . . . . . . . . . . . . . . . . . . . . . . . . . . . . . . . . . . . . . . . . . . . . . . . . . . . . 14,479,124 8,036,701Class B . . . . . . . . . . . . . . . . . . . . . . . . . . . . . . . . . . . . . . . . . . . . . . . . . . . . . . . . . . . . . 613 (110,470)Class C . . . . . . . . . . . . . . . . . . . . . . . . . . . . . . . . . . . . . . . . . . . . . . . . . . . . . . . . . . . . . 6,253,384 4,589,115Class I . . . . . . . . . . . . . . . . . . . . . . . . . . . . . . . . . . . . . . . . . . . . . . . . . . . . . . . . . . . . . . 526,691 6,354,700
------------------------------------------------------- -------------------------------------------------------Net Increase in Net Assets from Capital Share Transactions . . . . . . . . . . . . . . . . . . . 132,662,868 37,267,782
------------------------------------------------------- -------------------------------------------------------Redemption Fees . . . . . . . . . . . . . . . . . . . . . . . . . . . . . . . . . . . . . . . . . . . . . . . . . . . . . . 2,146 1,178
------------------------------------------------------- -------------------------------------------------------Net Increase/(Decrease) in Net Assets . . . . . . . . . . . . . . . . . . . . . . . . . . . . . . . . . . . . . 248,182,992 (26,671,853)
Net Assets:Beginning of period . . . . . . . . . . . . . . . . . . . . . . . . . . . . . . . . . . . . . . . . . . . . . . . . . . . . . . 1,151,611,010 1,178,282,863
------------------------------------------------------- -------------------------------------------------------End of period (including undistributed net investment income of
$0 and $0, respectively) . . . . . . . . . . . . . . . . . . . . . . . . . . . . . . . . . . . . . . . . . . . . . . . . . $ 1,399,794,002 $1,151,611,010------------------------------------------------------- -------------------------------------------------------------------------------------------------------------- -------------------------------------------------------
The Gabelli Equity Income Fund

12
See
acc
ompa
nyin
g no
tes
to f
inan
cial
sta
tem
ents
.
Th
e G
abel
li E
qu
ity
Inco
me
Fu
nd
Fin
anci
al H
igh
ligh
ts
Sel
ecte
d da
ta fo
r a
shar
e of
cap
ital s
tock
out
stan
ding
thro
ugho
ut e
ach
perio
d:R
atio
s to
Ave
rage
Net
Ass
ets/
Inco
me
fro
m In
vest
men
t O
per
atio
ns
Dis
trib
uti
on
sS
uppl
emen
tal D
ata
——
——
——
——
——
——
——
——
——
——
——
——
——
––—
——
——
——
—––
–––—
——
——
——
——
——
––——
——
——
——
——
——
——
——
Net
Net A
sset
Real
ized
and
Tota
lNe
tNe
t Ass
etNe
t Ass
ets
Perio
dVa
lue,
Net
Unre
alize
dfro
mNe
tRe
alize
dRe
turn
Valu
e,En
d of
Net
Portf
olio
Ende
dBe
ginn
ing
Inve
stm
ent
Gain
(Los
s) o
nIn
vest
men
tIn
vest
men
tGa
in o
nof
Tota
lRe
dem
ptio
nEn
d of
Tota
lPe
riod
Inve
stm
ent
Oper
atin
gTu
rnov
erSe
ptem
ber 3
0of
Per
iod
Inco
me(
a)In
vest
men
tsOp
erat
ions
Inco
me
Inve
stm
ents
Capi
tal
Dist
ribut
ions
Fees
(a)
Perio
dRe
turn
†(in
000
’s)In
com
eEx
pens
es††
Rate
†††
——
——
——
——
——
——
—–—
——
——
——
——
——
——
——
——
——
——
——
——
——
——
——
——
——
——
——
——
——
——
——
——
——
——
——
——
––—
——
—–––
——
——
—–—
——
Cla
ss A
AA
2010
(b)
$17.
14$0
.07
$ 1.
72$
1.79
$(0.
18)
——
$(0.
18)
$0.0
0(c)
$18.
7510
.51%
$1,3
08,7
690.
76%
(d)
1.43
%(d
)8%
2009
18.0
00.
21(0
.71)
(0.5
0)(0
.21)
—$(
0.15
)(0
.36)
0.00
(c)
17.1
4(2
.34)
1,08
8,65
51.
461.
5017
2008
22.9
80.
18(4
.43)
(4.2
5)(0
.17)
$(0.
40)
(0.1
6)(0
.73)
0.00
(c)
18.0
0(1
8.95
)1,
135,
543
0.87
1.43
2220
0720
.23
0.22
3.37
3.59
(0.3
9)(0
.45)
—(0
.84)
0.00
(c)
22.9
818
.19
1,19
1,35
11.
011.
4312
2006
18.7
20.
381.
682.
06(0
.36)
(0.1
9)—
(0.5
5)0.
00(c
)20
.23
11.2
579
4,37
51.
981.
4514
2005
16.7
30.
242.
412.
65(0
.24)
(0.4
2)—
(0.6
6)0.
00(c
)18
.72
16.0
958
0,08
11.
331.
4611
Cla
ss A
2010
(b)
$17.
09$0
.07
$ 1.
72$
1.79
$(0.
18)
——
$(0.
18)
$0.0
0(c)
$18.
7010
.54%
$49
,238
0.78
%(d
)1.
43%
(d)
8%20
0917
.95
0.21
(0.7
1)(0
.50)
(0.2
1)—
$(0.
15)
(0.3
6)0.
00(c
)17
.09
(2.3
4)31
,104
1.46
1.50
1720
0822
.91
0.18
(4.4
1)(4
.23)
(0.1
7)$(
0.40
)(0
.16)
(0.7
3)0.
00(c
)17
.95
(18.
92)
22,9
790.
881.
4322
2007
20.1
70.
223.
363.
58(0
.39)
(0.4
5)—
(0.8
4)0.
00(c
)22
.91
18.2
015
,313
1.00
1.43
1220
0618
.66
0.39
1.67
2.06
(0.3
6)(0
.19)
—(0
.55)
0.00
(c)
20.1
711
.29
8,37
92.
021.
4514
2005
16.7
20.
202.
432.
63(0
.27)
(0.4
2)—
(0.6
9)0.
00(c
)18
.66
15.9
93,
644
1.08
1.50
11C
lass
B20
10(b
)$1
6.37
$0.0
0(c)
$ 1.
64$
1.64
$(0.
18)
——
$(0.
18)
$0.0
0(c)
$17.
8310
.08%
$ 12
50.
00%
(d)
2.18
%(d
)8%
2009
17.3
40.
10(0
.71)
(0.6
1)(0
.21)
—$(
0.15
)(0
.36)
0.00
(c)
16.3
7(3
.07)
114
0.73
2.25
1720
0822
.32
0.02
(4.2
7)(4
.25)
(0.1
7)$(
0.40
)(0
.16)
(0.7
3)0.
00(c
)17
.34
(19.
54)
252
0.12
2.18
2220
0719
.82
0.06
3.28
3.34
(0.3
9)(0
.45)
—(0
.84)
0.00
(c)
22.3
217
.28
344
0.29
2.18
1220
0618
.48
0.36
1.53
1.89
(0.3
6)(0
.19)
—(0
.55)
0.00
(c)
19.8
210
.46
352
1.91
2.20
1420
0516
.62
0.04
2.46
2.50
(0.2
2)(0
.42)
—(0
.64)
0.00
(c)
18.4
815
.28
320.
202.
2211
Cla
ss C
2010
(b)
$16.
36$0
.00(
c)$
1.65
$ 1.
65$(
0.18
)—
—$(
0.18
)$0
.00(
c)$1
7.83
10.1
5%$
31,4
560.
02%
(d)
2.18
%(d
)8%
2009
17.3
30.
10(0
.71)
(0.6
1)(0
.21)
—$(
0.15
)(0
.36)
0.00
(c)
16.3
6(3
.07)
22,9
190.
702.
2517
2008
22.3
10.
03(4
.28)
(4.2
5)(0
.17)
$(0.
40)
(0.1
6)(0
.73)
0.00
(c)
17.3
3(1
9.55
)18
,547
0.13
2.18
2220
0719
.81
0.05
3.29
3.34
(0.3
9)(0
.45)
—(0
.84)
0.00
(c)
22.3
117
.29
17,2
790.
242.
1812
2006
18.4
70.
241.
651.
89(0
.36)
(0.1
9)—
(0.5
5)0.
00(c
)19
.81
10.4
68,
044
1.26
2.20
1420
0516
.64
0.07
2.43
2.50
(0.2
5)(0
.42)
—(0
.67)
0.00
(c)
18.4
715
.24
3,37
40.
372.
2411
Cla
ss I
2010
(b)
$17.
23$0
.09
$ 1.
74$
1.83
$(0.
18)
——
$(0.
18)
$0.0
0(c)
$18.
8810
.68%
$10
,206
1.00
%(d
)1.
18%
(d)
8%20
0918
.04
0.25
(0.7
0)(0
.45)
(0.2
1)—
$(0.
15)
(0.3
6)0.
00(c
)17
.23
(2.0
5)8,
819
1.71
1.25
1720
08(e
)21
.42
0.19
(3.3
0)(3
.11)
(0.1
4)—
(0.1
3)(0
.27)
0.00
(c)
18.0
4(1
4.65
)96
21.
31(d
)1.
18(d
)22
†To
tal r
etur
n re
pres
ents
agg
rega
te t
otal
ret
urn
of a
hyp
othe
tical
$1,
000
inve
stm
ent
at t
he b
egin
ning
of
the
perio
d an
d so
ld a
t th
e en
d of
the
per
iod
incl
udin
g re
inve
stm
ent
of d
istr
ibut
ions
and
doe
s no
t re
flect
app
licab
le s
ales
cha
rges
.Tot
al r
etur
n fo
r a
perio
d of
less
tha
n on
e ye
ar is
not
ann
ualiz
ed.
††T
he r
atio
s in
clud
e a
redu
ctio
n fo
r cu
stod
ian
fee
cred
its o
n ca
sh b
alan
ces
mai
ntai
ned
with
the
cus
todi
an (
“Cus
todi
an F
ee C
redi
ts”)
.His
toric
ally
, th
e ra
tios
refle
cted
ope
ratin
g ex
pens
es b
efor
e th
e re
duct
ion
for
Cus
todi
an F
ee C
redi
ts.I
f the
rat
ios
did
not r
efle
ct a
red
uctio
n fo
r C
usto
dian
Fee
Cre
dits
, the
rat
ios
for
the
year
end
ed S
epte
mbe
r 30
, 200
6 w
ould
hav
e be
en 1
.46%
, 1.4
6%, 2
.21%
, and
2.2
1% fo
r C
lass
AA
A, C
lass
A, C
lass
B, a
nd C
lass
C, r
espe
ctiv
ely.
For
the
six
mon
ths
ende
d M
arch
31,
201
0 an
d th
e ye
ars
ende
d S
epte
mbe
r 30
, 20
09,
2008
, 20
07,
and
2005
, th
e ef
fect
of
the
Cus
todi
anFe
eC
redi
ts w
asm
inim
al.
†††
Effe
ctiv
e in
200
8, a
cha
nge
in a
ccou
ntin
g po
licy
was
ado
pted
with
reg
ard
to t
he c
alcu
latio
n of
the
por
tfolio
tur
nove
r ra
te t
o in
clud
e ca
sh p
roce
eds
due
to m
erge
rs.H
ad th
is p
olic
y be
en a
dopt
ed r
etro
activ
ely,
the
port
folio
turn
over
rat
e fo
r th
e ye
ars
ende
d S
epte
mbe
r 30
, 200
7, 2
006,
and
200
5 w
ould
hav
ebe
en 2
0%,
34%
, an
d 26
%,
resp
ectiv
ely.
(a)
Per
sha
re a
mou
nts
have
bee
n ca
lcul
ated
usi
ng t
he a
vera
ge s
hare
s ou
tsta
ndin
g m
etho
d.(b
)F
or t
he s
ix m
onth
s en
ded
Mar
ch 3
1, 2
010,
una
udite
d.(c
)A
mou
nt r
epre
sent
s le
ss t
han
$0.0
05 p
er s
hare
.(d
)A
nnua
lized
.(e
)Fr
om t
he c
omm
ence
men
t of
offe
ring
Cla
ss I
Sha
res
on J
anua
ry 1
1, 2
008
thro
ugh
Sep
tem
ber
30,
2008
.

13
1. Organization. The Gabelli Equity Income Fund (the “Fund”) is a series of Gabelli Equity Series Funds, Inc.(the “Corporation”), which was organized on July 25, 1991 as a Maryland corporation. The Fund is a diversifiedopen-end management investment company registered under the Investment Company Act of 1940, asamended (the “1940 Act”), and one of three separately managed portfolios (collectively, the “Portfolios”) of theCorporation. The Fund’s primary objective is to seek a high level of total return with an emphasis on income. TheFund commenced investment operations on January 2, 1992.
2. Significant Accounting Policies. The Financial Accounting Standards Board (“FASB”) AccountingStandards Codification (“ASC”) has become the exclusive reference of authoritative United States of America(“U.S.”) generally accepted accounting principles (“GAAP”) recognized by the FASB to be applied bynongovernmental entities. Rules and interpretive releases of the SEC under authority of federal laws are alsosources of authoritative GAAP for SEC registrants. The ASC has superseded all existing non-SEC accountingand reporting standards. The Fund’s financial statements are prepared in accordance with GAAP, which mayrequire the use of management estimates and assumptions. Actual results could differ from those estimates.Thefollowing is a summary of significant accounting policies followed by the Fund in the preparation of its financialstatements.
Security Valuation. Portfolio securities listed or traded on a nationally recognized securities exchange or tradedin the U.S. over-the-counter market for which market quotations are readily available are valued at the last quotedsale price or a market’s official closing price as of the close of business on the day the securities are beingvalued. If there were no sales that day, the security is valued at the average of the closing bid and asked pricesor, if there were no asked prices quoted on that day, then the security is valued at the closing bid price on thatday. If no bid or asked prices are quoted on such day, the security is valued at the most recently available priceor, if the Board of Directors (the “Board”) so determines, by such other method as the Board shall determine ingood faith to reflect its fair market value. Portfolio securities traded on more than one national securitiesexchange or market are valued according to the broadest and most representative market, as determined byGabelli Funds, LLC (the “Adviser”).
Portfolio securities primarily traded on a foreign market are generally valued at the preceding closing values ofsuch securities on the relevant market, but may be fair valued pursuant to procedures established by the Boardif market conditions change significantly after the close of the foreign market but prior to the close of businesson the day the securities are being valued. Debt instruments with remaining maturities of sixty days or less thatare not credit impaired are valued at amortized cost, unless the Board determines such amount does not reflectthe securities’ fair value, in which case these securities will be fair valued as determined by the Board. Debtinstruments having a maturity greater than sixty days for which market quotations are readily available are valuedat the average of the latest bid and asked prices. If there were no asked prices quoted on such day, the securityis valued using the closing bid price. Futures contracts are valued at the closing settlement price of the exchangeor board of trade on which the applicable contract is traded.
Securities and assets for which market quotations are not readily available are fair valued as determined by theBoard. Fair valuation methodologies and procedures may include, but are not limited to: analysis and review ofavailable financial and non-financial information about the company; comparisons with the valuation andchanges in valuation of similar securities, including a comparison of foreign securities with the equivalent U.S.
The Gabelli Equity Income FundNotes to Financial Statements (Unaudited)
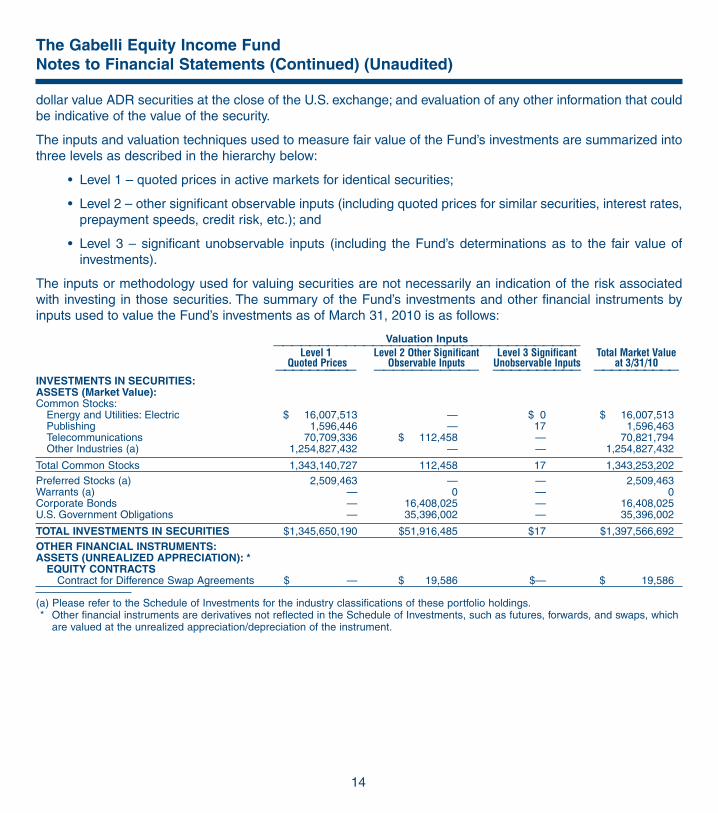
dollar value ADR securities at the close of the U.S. exchange; and evaluation of any other information that couldbe indicative of the value of the security.
The inputs and valuation techniques used to measure fair value of the Fund’s investments are summarized intothree levels as described in the hierarchy below:
• Level 1 – quoted prices in active markets for identical securities;
• Level 2 – other significant observable inputs (including quoted prices for similar securities, interest rates,prepayment speeds, credit risk, etc.); and
• Level 3 – significant unobservable inputs (including the Fund’s determinations as to the fair value ofinvestments).
The inputs or methodology used for valuing securities are not necessarily an indication of the risk associatedwith investing in those securities. The summary of the Fund’s investments and other financial instruments byinputs used to value the Fund’s investments as of March 31, 2010 is as follows:
Valuation Inputs——————————————————————————————————
Level 1 Level 2 Other Significant Level 3 Significant Total Market ValueQuoted Prices Observable Inputs Unobservable Inputs at 3/31/10
—————————— ——————————— —————————— ——————————INVESTMENTS IN SECURITIES:ASSETS (Market Value):Common Stocks:
Energy and Utilities: Electric $ 16,007,513 — $ 0 $ 16,007,513Publishing 1,596,446 — 17 1,596,463Telecommunications 70,709,336 $ 112,458 — 70,821,794Other Industries (a) 1,254,827,432 — — 1,254,827,432
Total Common Stocks 1,343,140,727 112,458 17 1,343,253,202Preferred Stocks (a) 2,509,463 — — 2,509,463Warrants (a) — 0 — 0Corporate Bonds — 16,408,025 — 16,408,025U.S. Government Obligations — 35,396,002 — 35,396,002
TOTAL INVESTMENTS IN SECURITIES $1,345,650,190 $51,916,485 $17 $1,397,566,692OTHER FINANCIAL INSTRUMENTS:ASSETS (UNREALIZED APPRECIATION): *
EQUITY CONTRACTSContract for Difference Swap Agreements $ — $ 19,586 $— $ 19,586
(a) Please refer to the Schedule of Investments for the industry classifications of these portfolio holdings.* Other financial instruments are derivatives not reflected in the Schedule of Investments, such as futures, forwards, and swaps, which
are valued at the unrealized appreciation/depreciation of the instrument.
The Gabelli Equity Income FundNotes to Financial Statements (Continued) (Unaudited)
14

15
The following is a reconciliation of Level 3 investments for which significant unobservable inputs were used todetermine fair value: Net change
in unrealizedappreciation/depreciation
Change in during theBalance Accrued Realized unrealized Net Transfers in Balance period on Level 3
as of discounts/ gain/ appreciation/ purchases/ and/or out as of investments held9/30/09 (premiums) (loss) depreciation† (sales) of Level 3 3/31/10 at 3/31/10†
INVESTMENTS IN SECURITIES:ASSETS (Market Value):Common Stocks:
Broadcasting $ 0 $— $— $ — $— $ (0) $— $ —Energy and Utilities: Electric 0 — — — — — 0 —Publishing — — — (108) — 125 17 (108)
Total Common Stocks 0 — — (108) — 125 17 (108)Warrants:
Broadcasting 3 — — — — (3) — —Total Warrants 3 — — — — (3) — —TOTAL INVESTMENTS IN SECURITIES $ 3 $— $— $(108) $— $122 $17 $(108)
† Net change in unrealized appreciation/depreciation on investments is included in the related amounts in the Statement of Operations.
Derivative Financial Instruments.The Fund may engage in various portfolio investment strategies by investing in a number of derivative financialinstruments for the purposes of increasing the income of the Fund, hedging against changes in the value of itsportfolio securities and in the value of securities it intends to purchase, or hedging against a specific transactionwith respect to either the currency in which the transaction is denominated or another currency. Investing in certainderivative financial instruments, including participation in the options, futures, or swap markets, entails certainexecution, liquidity, hedging, tax, and securities, interest, credit, or currency market risks. Losses may arise if theAdviser’s prediction of movements in the direction of the securities, foreign currency, and interest rate markets isinaccurate. Losses may also arise if the counterparty does not perform its duties under a contract, or that, in theevent of default, the Fund may be delayed in or prevented from obtaining payments or other contractual remediesowed to it under derivative contracts. The creditworthiness of the counterparties is closely monitored in order tominimize these risks. Participation in derivative transactions involves investment risks, transaction costs, andpotential losses to which the Fund would not be subject absent the use of these strategies. The consequences ofthese risks, transaction costs, and losses may have a negative impact on the Fund’s ability to pay distributions.
Swap Agreements. The Fund may enter into equity and contract for difference swap transactions for thepurpose of increasing the income of the Fund or hedging or protecting its exposure to interest rate movementsand movements in the securities market. The use of swaps is a highly specialized activity that involvesinvestment techniques and risks different from those associated with ordinary portfolio security transactions. Ina swap, a set of future cash flows is exchanged between two counterparties. One of these cash flow streams willtypically be based on a reference interest rate combined with the performance of a notional value of shares of astock. The other will be based on the performance of the shares of a stock. Depending on the general state ofshort-term interest rates and the returns on the Fund’s portfolio securities at the time a swap transaction reachesits scheduled termination date, there is a risk that the Fund will not be able to obtain a replacement transactionor that the terms of the replacement will not be as favorable as on the expiring transaction.
The Gabelli Equity Income FundNotes to Financial Statements (Continued) (Unaudited)

Unrealized gains related to swaps are reported as an asset and unrealized losses are reported as a liability in theStatement of Assets and Liabilities. The change in the value of swaps, including the accrual of periodic amounts ofinterest to be paid or received on swaps, is reported as unrealized gain or loss in the Statement of Operations. Arealized gain or loss is recorded upon payment or receipt of a periodic payment or termination of swap agreements.
The Fund has entered into equity contract for difference swap agreements with The Goldman Sachs Group, Inc.Details of the swaps at March 31, 2010 are as follows:
Notional Equity Security Interest Rate/ Termination Net UnrealizedAmount Received Equity Security Paid Date Appreciation
Market Value One month LIBOR plus 90 bps plusAppreciation on: Market Value Depreciation on:
$239,892 (140,000 Shares) Rank Group plc Rank Group plc 6/25/10 $ 9,834170,900 (20,000 Shares) Rolls-Royce Group plc Rolls-Royce Group plc 6/25/10 9,752
—–––———$19,586 —–––————–––———
The Fund’s volume of activity in equity contract for difference swap agreements during the six months endedMarch 31, 2010 had an average monthly notional amount of approximately $362,974.
As of March 31, 2010, the value of equity contract for difference swap agreements that were held with equity riskexposure can be found in the Statement of Assets and Liabilities under Assets, Unrealized appreciation on swapcontracts.
For the six months ended March 31, 2010, the effect of equity contract for difference swap agreements withequity risk exposure can be found in the Statement of Operations, under Net Realized and UnrealizedGain/(Loss) on Investments, Swap Contracts, and Foreign Currency, Net realized gain on swap contracts andNet change in unrealized appreciation/depreciation on swap contracts.
Futures Contracts. The Fund may engage in futures contracts for the purpose of hedging againstchanges in the value of its portfolio securities and in the value of securities it intends to purchase. Upon enteringinto a futures contract, the Fund is required to deposit with the broker an amount of cash or cash equivalentsequal to a certain percentage of the contract amount.This is known as the “initial margin.” Subsequent payments(“variation margin”) are made or received by the Fund each day, depending on the daily fluctuations in the valueof the contract, and are included in unrealized appreciation/depreciation on futures contracts. The Fundrecognizes a realized gain or loss when the contract is closed.
There are several risks in connection with the use of futures contracts as a hedging instrument. The change invalue of futures contracts primarily corresponds with the value of their underlying instruments, which may notcorrelate with the change in value of the hedged investments. In addition, there is the risk that the Fund may notbe able to enter into a closing transaction because of an illiquid secondary market. During the six months endedMarch 31, 2010, the Fund had no investments in futures contracts.
Forward Foreign Exchange Contracts. The Fund may engage in forward foreign exchange contracts forthe purpose of hedging a specific transaction with respect to either the currency in which the transaction isdenominated or another currency as deemed appropriate by the Adviser. Forward foreign exchange contractsare valued at the forward rate and are marked-to-market daily. The change in market value is included inunrealized appreciation/depreciation on foreign currency translations. When the contract is closed, the Fundrecords a realized gain or loss equal to the difference between the value of the contract at the time it was openedand the value at the time it was closed.
The Gabelli Equity Income FundNotes to Financial Statements (Continued) (Unaudited)
16

17
The use of forward foreign exchange contracts does not eliminate fluctuations in the underlying prices of theFund’s portfolio securities, but it does establish a rate of exchange that can be achieved in the future. Althoughforward foreign exchange contracts limit the risk of loss due to a decline in the value of the hedged currency, theyalso limit any potential gain that might result should the value of the currency increase. In addition, the Fund couldbe exposed to risks if the counterparties to the contracts are unable to meet the terms of their contracts. Duringthe six months ended March 31, 2010, the Fund had no investments in forward foreign exchange contracts.
Securities Sold Short. The Fund may enter into short sale transactions. Short selling involves selling securitiesthat may or may not be owned and, at times, borrowing the same securities for delivery to the purchaser, withan obligation to replace such borrowed securities at a later date. The proceeds received from short sales arerecorded as liabilities and the Fund records an unrealized gain or loss to the extent of the difference betweenthe proceeds received and the value of an open short position on the day of determination. The Fund records arealized gain or loss when the short position is closed out. By entering into a short sale, the Fund bears themarket risk of an unfavorable change in the price of the security sold short. Dividends on short sales arerecorded as an expense by the Fund on the ex-dividend date and interest expense is recorded on the accrualbasis. At March 31, 2010, there were no open securities sold short.
Repurchase Agreements. The Fund may enter into repurchase agreements with primary governmentsecurities dealers recognized by the Federal Reserve Board, with member banks of the Federal ReserveSystem, or with other brokers or dealers that meet credit guidelines established by the Adviser and reviewed bythe Board. Under the terms of a typical repurchase agreement, the Fund takes possession of an underlying debtobligation subject to an obligation of the seller to repurchase, and the Fund to resell, the obligation at an agreed-upon price and time, thereby determining the yield during the Fund’s holding period. It is the policy of the Fundto receive and maintain securities as collateral whose market value is at least equal to the dollar amount investedby the Fund in each agreement. The Fund will make payment for such securities only upon physical delivery orupon evidence of book entry transfer of the collateral to the account of the custodian. To the extent that anyrepurchase transaction exceeds one business day, the value of the collateral is marked-to-market on a dailybasis to maintain the adequacy of the collateral. If the seller defaults and the value of the collateral declines orif bankruptcy proceedings are commenced with respect to the seller of the security, realization of the collateralby the Fund may be delayed or limited. At March 31, 2010, there were no open repurchase agreements.
Foreign Currency Translations. The books and records of the Fund are maintained in U.S. dollars. Foreigncurrencies, investments, and other assets and liabilities are translated into U.S. dollars at the current exchangerates. Purchases and sales of investment securities, income, and expenses are translated at the exchange rateprevailing on the respective dates of such transactions. Unrealized gains and losses that result from changes inforeign exchange rates and/or changes in market prices of securities have been included in unrealizedappreciation/depreciation on investments and foreign currency translations. Net realized foreign currency gainsand losses resulting from changes in exchange rates include foreign currency gains and losses between tradedate and settlement date on investment securities transactions, foreign currency transactions, and the differencebetween the amounts of interest and dividends recorded on the books of the Fund and the amounts actuallyreceived. The portion of foreign currency gains and losses related to fluctuation in exchange rates between theinitial purchase trade date and subsequent sale trade date is included in realized gain/loss on investments.
Foreign Securities. The Fund may directly purchase securities of foreign issuers. Investing in securities offoreign issuers involves special risks not typically associated with investing in securities of U.S. issuers.The risks
The Gabelli Equity Income FundNotes to Financial Statements (Continued) (Unaudited)

include possible revaluation of currencies, the inability to repatriate funds, less complete financial informationabout companies, and possible future adverse political and economic developments. Moreover, securities ofmany foreign issuers and their markets may be less liquid and their prices more volatile than those of securitiesof comparable U.S. issuers.
Foreign Taxes. The Fund may be subject to foreign taxes on income, gains on investments, or currencyrepatriation, a portion of which may be recoverable.The Fund will accrue such taxes and recoveries as applicable,based upon its current interpretation of tax rules and regulations that exist in the markets in which it invests.
Restricted and Illiquid Securities. The Fund may invest up to 15% of its net assets in securities for which themarkets are illiquid. Illiquid securities include securities the disposition of which is subject to substantial legal orcontractual restrictions. The sale of illiquid securities often requires more time and results in higher brokeragecharges or dealer discounts and other selling expenses than does the sale of securities eligible for trading onnational securities exchanges or in the over-the-counter markets. Restricted securities may sell at a price lowerthan similar securities that are not subject to restrictions on resale. Securities freely saleable among qualifiedinstitutional investors under special rules adopted by the SEC may be treated as liquid if they satisfy liquiditystandards established by the Board. The continued liquidity of such securities is not as well assured as that ofpublicly traded securities, and accordingly the Board will monitor their liquidity.
Securities Transactions and Investment Income. Securities transactions are accounted for on the trade datewith realized gain or loss on investments determined by using the identified cost method. Interest income(including amortization of premium and accretion of discount) is recorded on the accrual basis. Premiums anddiscounts on debt securities are amortized using the effective yield to maturity method. Dividend income isrecorded on the ex-dividend date except for certain dividends which are recorded as soon as the Fund isinformed of the dividend.
Determination of Net Asset Value and Calculation of Expenses. Certain administrative expenses arecommon to, and allocated among, various affiliated funds. Such allocations are made on the basis of each fund’saverage net assets or other criteria directly affecting the expenses as determined by the Adviser pursuant toprocedures established by the Board.
In calculating the NAV per share of each class, investment income, realized and unrealized gains and losses,redemption fees, and expenses other than class specific expenses are allocated daily to each class of sharesbased upon the proportion of net assets of each class at the beginning of each day. Distribution expenses areborne solely by the class incurring the expense.
Custodian Fee Credits and Interest Expense. When cash balances are maintained in the custody account,the Fund receives credits which are used to offset custodian fees. The gross expenses paid under the custodyarrangement are included in custodian fees in the Statement of Operations with the corresponding expenseoffset, if any, shown as “custodian fee credits.” When cash balances are overdrawn, the Fund is charged anoverdraft fee equal to 2.00% above the federal funds rate on outstanding balances. This amount, if any, wouldbe included in “interest expense” in the Statement of Operations.
Distributions to Shareholders. Distributions to shareholders are recorded on the ex-dividend date.Distributions to shareholders are based on income and capital gains as determined in accordance with federalincome tax regulations, which may differ from income and capital gains as determined under U.S. generally
The Gabelli Equity Income FundNotes to Financial Statements (Continued) (Unaudited)
18
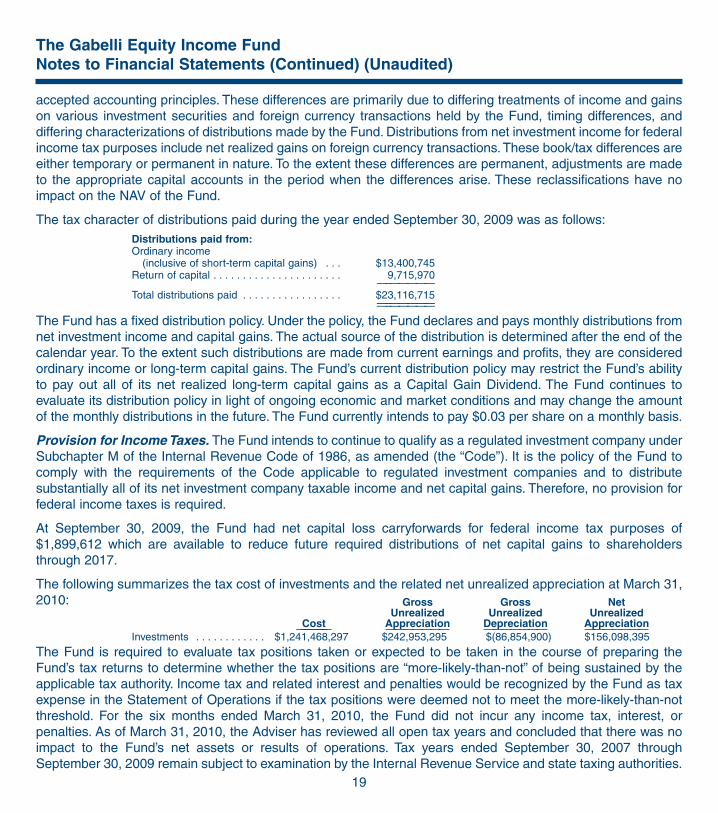
19
accepted accounting principles. These differences are primarily due to differing treatments of income and gainson various investment securities and foreign currency transactions held by the Fund, timing differences, anddiffering characterizations of distributions made by the Fund. Distributions from net investment income for federalincome tax purposes include net realized gains on foreign currency transactions. These book/tax differences areeither temporary or permanent in nature. To the extent these differences are permanent, adjustments are madeto the appropriate capital accounts in the period when the differences arise. These reclassifications have noimpact on the NAV of the Fund.
The tax character of distributions paid during the year ended September 30, 2009 was as follows:Distributions paid from:Ordinary income
(inclusive of short-term capital gains) . . . $13,400,745Return of capital . . . . . . . . . . . . . . . . . . . . . . 9,715,970
—–—————Total distributions paid . . . . . . . . . . . . . . . . . $23,116,715
—–——————–—————
The Fund has a fixed distribution policy. Under the policy, the Fund declares and pays monthly distributions fromnet investment income and capital gains. The actual source of the distribution is determined after the end of thecalendar year. To the extent such distributions are made from current earnings and profits, they are consideredordinary income or long-term capital gains. The Fund’s current distribution policy may restrict the Fund’s abilityto pay out all of its net realized long-term capital gains as a Capital Gain Dividend. The Fund continues toevaluate its distribution policy in light of ongoing economic and market conditions and may change the amountof the monthly distributions in the future. The Fund currently intends to pay $0.03 per share on a monthly basis.
Provision for Income Taxes. The Fund intends to continue to qualify as a regulated investment company underSubchapter M of the Internal Revenue Code of 1986, as amended (the “Code”). It is the policy of the Fund tocomply with the requirements of the Code applicable to regulated investment companies and to distributesubstantially all of its net investment company taxable income and net capital gains. Therefore, no provision forfederal income taxes is required.
At September 30, 2009, the Fund had net capital loss carryforwards for federal income tax purposes of$1,899,612 which are available to reduce future required distributions of net capital gains to shareholdersthrough 2017.
The following summarizes the tax cost of investments and the related net unrealized appreciation at March 31,2010: Gross Gross Net
Unrealized Unrealized UnrealizedCost Appreciation Depreciation Appreciation——————— ——————— ——————— ———————
Investments . . . . . . . . . . . . $1,241,468,297 $242,953,295 $(86,854,900) $156,098,395
The Fund is required to evaluate tax positions taken or expected to be taken in the course of preparing theFund’s tax returns to determine whether the tax positions are “more-likely-than-not” of being sustained by theapplicable tax authority. Income tax and related interest and penalties would be recognized by the Fund as taxexpense in the Statement of Operations if the tax positions were deemed not to meet the more-likely-than-notthreshold. For the six months ended March 31, 2010, the Fund did not incur any income tax, interest, orpenalties. As of March 31, 2010, the Adviser has reviewed all open tax years and concluded that there was noimpact to the Fund’s net assets or results of operations. Tax years ended September 30, 2007 throughSeptember 30, 2009 remain subject to examination by the Internal Revenue Service and state taxing authorities.
The Gabelli Equity Income FundNotes to Financial Statements (Continued) (Unaudited)

20
On an ongoing basis, the Adviser will monitor the Fund’s tax positions to determine if adjustments to thisconclusion are necessary.
3. Investment Advisory Agreement and Other Transactions. The Fund has entered into an investmentadvisory agreement (the “Advisory Agreement”) with the Adviser which provides that the Fund will pay theAdviser a fee, computed daily and paid monthly, at the annual rate of 1.00% of the value of its average daily netassets. In accordance with the Advisory Agreement, the Adviser provides a continuous investment program forthe Fund’s portfolio, oversees the administration of all aspects of the Fund’s business and affairs, and pays thecompensation of all Officers and Directors of the Fund who are affiliated persons of the Adviser.
The Corporation pays each Director who is not considered an affiliated person an annual retainer of $9,000 plus$1,000 for each Board meeting attended. Each Director is reimbursed by the Corporation for any out of pocketexpenses incurred in attending meetings. All Board committee members receive $500 per meeting attended andthe Chairman of the Audit Committee and the Lead Director each receive an annual fee of $1,000. A Directormay receive a single meeting fee, allocated among the participating funds, for participation in certain meetingsheld on behalf of multiple funds. Directors who are directors or employees of the Adviser or an affiliated companyreceive no compensation or expense reimbursement from the Corporation.
4. Distribution Plan. The Fund’s Board has adopted a distribution plan (the “Plan”) for each class of shares,except for Class I Shares, pursuant to Rule 12b-1 under the 1940 Act. Gabelli & Company, Inc. (“Gabelli & Co.”),an affiliate of the Adviser, serves as Distributor of the Fund. Under the Class AAA, Class A, Class B, and ClassC Share Plans, payments are authorized to Gabelli & Co. at annual rates of 0.25%, 0.25%, 1.00%, and 1.00%,respectively, of the average daily net assets of those classes, the annual limitations under each Plan. Suchpayments are accrued daily and paid monthly.
5. Portfolio Securities. Purchases and sales of securities for the six months ended March 31, 2010, other thanshort-term securities and U.S. Government obligations, aggregated $220,675,054 and $92,328,464, respectively.
6. Transactions with Affiliates. During the six months ended March 31, 2010, the Fund paid brokeragecommissions on security trades of $265,970 to Gabelli & Co. Additionally, Gabelli & Co. informed the Fund thatit retained $29,732 from investors representing commissions (sales charges and underwriting fees) on sales andredemptions of Fund shares.
The cost of calculating the Fund’s NAV per share is a Fund expense pursuant to the Advisory Agreementbetween the Fund and the Adviser. During the six months ended March 31, 2010, the Fund paid or accrued$22,500 to the Adviser in connection with the cost of computing the Fund’s NAV.
7. Line of Credit. The Fund participates in an unsecured line of credit of up to $75,000,000 under which it mayborrow up to 10% of its net assets from the custodian for temporary borrowing purposes. Borrowings under thisarrangement bear interest at the higher of the sum of the overnight LIBOR plus 100 basis points or the sum ofthe federal funds rate plus 100 basis points at the time of borrowing. This amount, if any, would be included in“interest expense” in the Statement of Operations. During the six months ended March 31, 2010, there were noborrowings under the line of credit.
8. Capital Stock. The Fund offers five classes of shares – Class AAA Shares, Class A Shares, Class B Shares,Class C Shares, and Class I Shares. Class AAA Shares are offered without a sales charge only to investors whoacquire them directly from Gabelli & Co., through selected broker/dealers, or the transfer agent. Class I Sharesare offered through Gabelli & Co. and selected broker/dealers to foundations, endowments, institutions, and
The Gabelli Equity Income FundNotes to Financial Statements (Continued) (Unaudited)

21
employee benefit plans without a sales charge. Class A Shares are subject to a maximum front-end sales chargeof 5.75%. Class B Shares are subject to a contingent deferred sales charge (“CDSC”) upon redemption withinsix years of purchase and automatically convert to Class A Shares approximately eight years after the originalpurchase.The applicable CDSC is equal to a declining percentage of the lesser of the NAV per share at the dateof the original purchase or at the date of redemption, based on the length of time held. Class C Shares aresubject to a 1.00% CDSC for one year after purchase. Class B Shares are available only through exchange ofClass B Shares of other funds distributed by Gabelli & Co. Class I Shares were first issued on January 11, 2008.
The Fund imposes a redemption fee of 2.00% on all classes of shares that are redeemed or exchanged on orbefore the seventh day after the date of a purchase.The redemption fee is deducted from the proceeds otherwisepayable to the redeeming shareholders and is retained by the Fund. The redemption fees retained by the Fundduring the six months ended March 31, 2010 and the year ended September 30, 2009 amounted to $2,146 and$1,178, respectively. The redemption fee does not apply to redemptions of shares where (i) the shares werepurchased through automatic reinvestment of distributions, (ii) the redemption was initiated by the Fund, (iii) theshares were purchased through programs that collect the redemption fee at the program level and remit them tothe Fund, or (iv) the shares were purchased through programs that the Adviser determines to have appropriateanti-short-term trading policies in place or as to which the Adviser has received assurances that look-throughredemption fee procedures or effective anti-short-term trading policies and procedures are in place.
Transactions in shares of capital stock were as follows:Six Months Ended
March 31, 2010 Year Ended (Unaudited) September 30, 2009
———————————————————————— ————————————————————————Shares Amount Shares Amount
———————————— ———————————— ———————————— ——————————————Class AAAShares sold . . . . . . . . . . . . . . . . . . . . . . . . . . . . . . . . . . . . 12,919,147 $ 229,825,063 20,754,130 $ 302,088,224Shares issued upon reinvestment of distributions . . . . . . . 635,703 11,306,518 1,423,010 20,241,888Shares redeemed . . . . . . . . . . . . . . . . . . . . . . . . . . . . . . . (7,288,798) (129,728,525) (21,736,561) (303,932,376)
—–————— ——–—–———— —–————— —––——————Net increase . . . . . . . . . . . . . . . . . . . . . . . . . . . . . . . . . . 6,266,052 $ 111,403,056 440,579 $ 18,397,736
—–————— ——–—–———— —–————— —––———————–————— ——–—–———— —–————— —––——————Class AShares sold . . . . . . . . . . . . . . . . . . . . . . . . . . . . . . . . . . . . 1,086,035 $ 19,332,127 1,152,325 $ 16,776,961Shares issued upon reinvestment of distributions . . . . . . . 19,926 353,893 36,073 513,106Shares redeemed . . . . . . . . . . . . . . . . . . . . . . . . . . . . . . . (292,965) (5,206,896) (648,443) (9,253,366)
—–————— ——–—–———— —–————— —––——————Net increase . . . . . . . . . . . . . . . . . . . . . . . . . . . . . . . . . . 812,996 $ 14,479,124 539,955 $ 8,036,701
—–————— ——–—–———— —–————— —––———————–————— ——–—–———— —–————— —––——————Class BShares sold . . . . . . . . . . . . . . . . . . . . . . . . . . . . . . . . . . . . — — 1,088 $ 13,188Shares issued upon reinvestment of distributions . . . . . . . 74 $ 1,250 316 4,257Shares redeemed . . . . . . . . . . . . . . . . . . . . . . . . . . . . . . . (38) (637) (8,965) (127,915)
—–————— ——–—–———— —–————— —––——————Net increase/(decrease) . . . . . . . . . . . . . . . . . . . . . . . . . 36 $ 613 (7,561) $ (110,470)
—–————— ——–—–———— —–————— —––———————–————— ——–—–———— —–————— —––——————Class CShares sold . . . . . . . . . . . . . . . . . . . . . . . . . . . . . . . . . . . . 557,296 $ 9,494,620 757,678 $ 10,228,605Shares issued upon reinvestment of distributions . . . . . . . 13,393 227,076 29,522 402,548Shares redeemed . . . . . . . . . . . . . . . . . . . . . . . . . . . . . . . (207,081) (3,468,312) (456,330) (6,042,038)
—–————— ——–—–———— —–————— —––——————Net increase . . . . . . . . . . . . . . . . . . . . . . . . . . . . . . . . . . 363,608 $ 6,253,384 330,870 $ 4,589,115
—–————— ——–—–———— —–————— —––———————–————— ——–—–———— —–————— —––——————Class IShares sold . . . . . . . . . . . . . . . . . . . . . . . . . . . . . . . . . . . . 129,225 $ 2,324,923 675,326 $ 9,395,435Shares issued upon reinvestment of distributions . . . . . . . 5,230 93,543 5,494 84,446Shares redeemed . . . . . . . . . . . . . . . . . . . . . . . . . . . . . . . (105,679) (1,891,775) (222,311) (3,125,181)
—–————— ——–—–———— —–————— —––——————Net increase . . . . . . . . . . . . . . . . . . . . . . . . . . . . . . . . . . 28,776 $ 526,691 458,509 $ 6,354,700
—–————— ——–—–———— —–————— —––———————–————— ——–—–———— —–————— —––——————
The Gabelli Equity Income FundNotes to Financial Statements (Continued) (Unaudited)

22
The Gabelli Equity Income FundNotes to Financial Statements (Continued) (Unaudited)
9. Indemnifications. The Fund enters into contracts that contain a variety of indemnifications. The Fund’smaximum exposure under these arrangements is unknown. However, the Fund has not had prior claims orlosses pursuant to these contracts and expects the risk of loss to be remote.
10. Other Matters. On April 24, 2008, the Adviser entered into an administrative settlement with the SEC toresolve the SEC’s inquiry regarding prior frequent trading activity in shares of the GAMCO Global Growth Fund(the “Global Growth Fund”) by one investor who was banned from the Global Growth Fund in August 2002. Inthe settlement, the SEC found that the Adviser had violated Section 206(2) of the Investment Advisers Act,Section 17(d) of the 1940 Act, and Rule 17d-1 thereunder, and had aided and abetted and caused violations ofSection 12(d)(1)(B)(i) of the 1940 Act. Under the terms of the settlement, the Adviser, while neither admitting nordenying the SEC’s findings and allegations, agreed, among other things, to pay the previously reserved total of$16 million (including a $5 million penalty), of which at least $11 million will be distributed to shareholders of theGlobal Growth Fund in accordance with a plan developed by an independent distribution consultant andapproved by the independent directors of the Global Growth Fund and the staff of the SEC, and to cease anddesist from future violations of the above referenced federal securities laws. The settlement will not have amaterial adverse impact on the Adviser or its ability to fulfill its obligations under the Advisory Agreement. On thesame day, the SEC filed a civil action against the Executive Vice President and Chief Operating Officer of theAdviser, alleging violations of certain federal securities laws arising from the same matter. The officer is also anofficer of the Global Growth Fund and other funds in the Gabelli/GAMCO fund complex including the Fund. Theofficer denies the allegations and is continuing in his positions with the Adviser and the funds. The Advisercurrently expects that any resolution of the action against the officer will not have a material adverse impact onthe Fund or the Adviser or its ability to fulfill its obligations under the Advisory Agreement.
11. Subsequent Events. Management has evaluated the impact on the Fund of all subsequent events throughthe date the financial statements were issued and has determined that there were no subsequent eventsrequiring recognition or disclosure in the financial statements.
We have separated the portfolio manager’s commentary from the financial statements and investment portfolio due tocorporate governance regulations stipulated by the Sarbanes-Oxley Act of 2002. We have done this to ensure that thecontent of the portfolio manager’s commentary is unrestricted. The financial statements and investment portfolio aremailed separately from the commentary. Both the commentary and the financial statements, including the portfolio ofinvestments, will be available on our website at www.gabelli.com/funds.

23
The Gabelli Equity Income FundBoard Consideration and Re-Approval of Advisory Agreement (Unaudited)
During the six months ended March 31, 2010, the Board of Directors of the Corporation approved thecontinuation of the investment advisory agreement with the Adviser for the Fund on the basis of therecommendation by the directors (the “Independent Board Members”) who are not “interested persons” of theFund. The following paragraphs summarize the material information and factors considered by the IndependentBoard Members as well as their conclusions relative to such factors.
Nature, Extent, and Quality of Services. The Independent Board Members considered information regardingthe portfolio manager, the depth of the analyst pool available to the Adviser and the portfolio manager, the scopeof administrative, shareholder, and other services supervised or provided by the Adviser, and the absence ofsignificant service problems reported to the Board. The Independent Board Members noted the experience,length of service, and reputation of the portfolio manager.
Investment Performance. The Independent Board Members reviewed the short, medium, and long-termperformance of the Fund against a peer group of equity income funds. The Independent Board Members notedthat the Fund’s performance was in or near the top one-third of the funds in its category for the one, three, andfive year periods.
Profitability. The Independent Board Members reviewed summary data regarding the profitability of the Fundto the Adviser both with an administrative overhead charge and without such a charge. The Independent BoardMembers also noted that a substantial portion of the Fund’s portfolio transactions were executed by an affiliatedbroker, that the affiliated broker received distribution fees and minor amounts of sales commissions, and that theAdviser received a moderate level of soft dollar research benefits through the Fund’s portfolio brokerage.
Economies of Scale. The Independent Board Members discussed the major elements of the Adviser’s coststructure and the relationship of those elements to potential economies of scale.
Sharing of Economies of Scale. The Independent Board Members noted that the investment management feeschedule for the Fund does not take into account any potential economies of scale that may develop.
Service and Cost Comparisons. The Independent Board Members compared the expense ratios of theinvestment management fee, other expenses, and total expenses of the Fund to similar expense ratios of the peergroup of equity income funds and noted that the Adviser’s management fee includes substantially alladministrative services of the Fund as well as investment advisory services. The Independent Board Membersnoted that the Fund’s expense ratios were above average within this group.The Independent Board Members alsonoted that the Fund’s size was average within this group. The Independent Board Members also noted that themanagement fee structure was the same as that in effect for most of the Gabelli funds. The Independent BoardMembers did not compare the management fee with the fee for other types of accounts managed by the Adviser.
Conclusions. The Independent Board Members concluded that the Fund enjoyed highly experienced portfoliomanagement services, good ancillary services, and a good performance record. The Independent BoardMembers also concluded that the Fund’s expense ratios and the profitability to the Adviser of managing the Fundwere reasonable, particularly in light of the Fund’s performance, and that economies of scale were not asignificant factor in their thinking at this time. The Independent Board Members did not view the potentialprofitability of ancillary services as material to their decision. On the basis of the foregoing and without assigningparticular weight to any single conclusion, the Independent Board Members determined to recommendcontinuation of the investment management agreement to the full Board.

Gabelli Equity Series Funds, Inc.The Gabelli Equity Income Fund
One Corporate CenterRye, New York 10580-1422
800-GABELLI 800-422-3554
fax: 914-921-5118website: www.gabelli.come-mail: [email protected]
Net Asset Value per share available daily by calling800-GABELLI after 7:00 P.M.
Board of Directors
Mario J. Gabelli, CFA Robert J. MorrisseyChairman and Chief Attorney-at-LawExecutive Officer Morrissey, Hawkins & LynchGAMCO Investors, Inc.
Kuni NakamuraAnthony J. Colavita PresidentPresident Advanced Polymer, Inc.Anthony J. Colavita, P.C.
Anthony R. PustorinoVincent D. Enright Certified Public Accountant,Former Senior Vice President Professor Emeritusand Chief Financial Officer Pace UniversityKeySpan Corp.
Anthonie C. van EkrisJohn D. Gabelli ChairmanSenior Vice President BALMAC International, Inc.Gabelli & Company, Inc.
Salvatore J. ZizzaChairman Zizza & Co., Ltd.
Officers
Bruce N. Alpert Agnes MulladyPresident and Secretary Treasurer
Peter D. GoldsteinChief Compliance Officer
DistributorGabelli & Company, Inc.
Custodian, Transfer Agent, and Dividend AgentState Street Bank and Trust Company
Legal CounselSkadden, Arps, Slate, Meagher & Flom LLP
This report is submitted for the general information of theshareholders of The Gabelli Equity Income Fund. It is not authorizedfor distribution to prospective investors unless preceded oraccompanied by an effective prospectus.
GAB444Q110SR
SEMI ANNUAL REPORTMARCH 31, 2010
The
GabelliEquityIncomeFundMorningstar® rated The Gabelli Equity Income Fund
Class AAA Shares 5 stars overall and 5 stars for the three, five and ten year periods ended
March 31, 2010 among 1,115; 1,115; 929;and 471 Large Value funds, respectively.
CASH FLOW
R E S E A R C H
MP
V
EPS
MANAGEMENT