Embed Size (px)
Citation preview
Shared Use
Operational Review
2012 Notice
This report was produced by Atkins for Department for Transport. It may not be used by any person other than the core project team and Department for Transport without Department for Transport’s express permission. In any event, Atkins accepts no liability for any costs, liabilities or losses arising as a result of the use of or reliance upon the contents of this report by any person other than Department for Transport.
Contents Section Page 1. Executive Summary 4
1.1 Introduction 4
1.2 Activity and speed 4
1.3 Route width and capacity 5
1.4 Observed interaction and perceived behaviour 5
1.5 Summary 6
2. Introduction 8
3. Our Approach 9
3.2 Case Study Methodology (Cambridge and Norwich) 9
3.3 Support Evidence Methodology 10
4. Case Studies: Cambridge 11
4.1 Locations 11
4.2 Survey Details 12
4.3 Design Characteristics 13
4.4 Pedestrian and Cyclist Activity 15
4.5 User Perceptions 19
4.6 Cyclist Speeds 23
4.7 Interactions 25
5. Case Studies: Norwich 26
5.1 Location 26
5.2 Survey Details 27
5.3 Design Characteristics 28
5.4 Pedestrian and Cyclist Activity 30
5.5 User Perceptions 34
5.6 Cyclist Speeds 38
5.7 Interactions 40
6. Support Site – Bristol 41
6.1 Location 41
6.2 Survey Details 41
6.3 Design Characteristics 42
6.4 Pedestrian and Cyclist Activity 43
6.5 Cyclist Speeds 45
6.6 Key Findings 45
7. Support Site – Newcastle 46
7.1 Location 46
7.2 Survey Details 46
7.3 Design Characteristics 47
7.4 Pedestrian and Cyclist Activity 48
7.5 Cyclist Speeds 50
7.6 Key Findings 50
2
8. Support Site – Peterborough 51
8.1 Location 51
8.2 Survey Details 51
8.3 Design Characteristics 52
8.4 Pedestrian and Cyclist Activity 53
8.5 Cyclist Speeds 55
8.6 Key Findings 55
9. Support Site – York 56
9.1 Location 56
9.2 Survey Details 56
9.3 Design Characteristics 57
9.4 Pedestrian and Cyclist Activity 58
9.5 Cyclist Speeds 60
9.6 Key Findings 60
10. Summary of Key Findings 61
10.1 Activity and speed 61
10.2 Route width and capacity 5
10.3 Observed interaction and perceived behaviour 5
10.4 Summary 63
11. Appendix A: Questionnaire 65
12. Appendix B: Interaction Descriptions (Norwich) 68
13. Appendix C: Interaction Descriptions (Cambridge) 72
14. Appendix D: Pedestrian Level of Service 75
3
1. Executive Summary
1.1 Introduction
1.1.1 Atkins was commissioned as part of a multidisciplinary project team which includes MVA Consultancy, Phil Jones Associates and TRL to carry out evidence based research into the factors which influence the design and operation of segregated and unsegregated pedestrian and cyclist shared use facilities. The research project helped inform the preparation of a new Local Transport Note on shared use routes for pedestrians and cyclists.
1.1.2 At the core of this research are user behavioural studies to support an understanding of how pedestrians and cyclists interact on unsegregated and segregated shared use facilities.
1.1.3 This technical note presents the findings of research into the factors which affect the operation and quality of shared use facilities adjacent-to-road. An evidence based approach was used to undertake comprehensive case studies in Norwich and Cambridge, supported by additional evidence from Bristol, York, Peterborough and Newcastle.
1.2 Activity and speed
1.2.1 During weekday peak periods, pedestrian and cyclist activity profiles on the segregated and unsegregated shared use facilities studied showed activity typical of utility cycling and functional walking, with movement strongly directional to/from urban centres in the morning and evening peak periods respectively. At such times, the vast majority of users are travelling as individuals.
1.2.2 At the weekend, there are less well defined peak periods for cyclist and pedestrian activity, and the profiles of both user groups tend to follow similar patterns. More users travel in groups of two or more people than during weekday peak periods. When pedestrians travel in groups, compliance with segregation (where present) is lower than when they travel as individuals, irrespective of activity levels.
1.2.3 Pedestrians walking in larger groups tend to lead to a significant proportion of their number walking in the cycle track (on a segregated shared use facility in York, one third of pedestrians walk in the cycle track at the weekend).
1.2.4 Segregation by white line was found to be ineffective at supporting full compliance with segregation by pedestrians and cyclists. Based on the data collected in this study, there appears to be a weak inverse relationship between compliance and user flows, in that compliance tends to deteriorate with increasing flows. This relationship appears to be intuitively correct - as flows of pedestrians or cyclists increase, and especially as group sizes increase, people can be expected to use more of the width available. This is likely to be at the expense of compliance with the segregating feature.
1.2.5 Findings indicate that average cycle speeds are not significantly faster on segregated routes compared with unsegregated ones. Cycle speeds on segregated routes are likely to be influenced by a combination of factors, including pedestrians walking in the cycle track.
4
1.2.6 Observations indicate that maximum cycle speed decreases as pedestrian flow increases on unsegregated shared use routes. This suggests that cyclists moderate their behaviour in the presence of pedestrians. Maximum cycle speeds were also seen to decrease on segregated routes when pedestrians were present, although to a lesser extent than on unsegregated routes.
1.2.7 At some of the locations studied, there were clear differences in cycle speeds between weekday commuting periods and out-of-commuting periods at the weekend, when cyclists tended to travel slower. In general, cycle speed is likely to be influenced by other factors, such as user density on the route and the nature of the route as a corridor for movement or a destination.
1.2.8 Some cyclists were observed to cycle on-road rather than use adjacent-to-road (on-highway) shared use routes in Norwich and Cambridge. The decision to cycle on-road is likely to be dependent on many factors which could include journey preferences (such as the importance of journey time or journey ambience), confidence levels and perceived safety. This suggests that adjacent-to-road shared use facilities do not operate as effectively as the equivalent on-road route for some cyclists.
1.3 Route width and capacity
1.3.1 On shared use routes, segregating cyclists and pedestrians reduces the width available to each user group. This reduction could have implications for the level of comfort for all users.
1.3.2 Level of Service techniques have been developed elsewhere for standardising and measuring pedestrian capacity and level of comfort. In this context, and taking into account the presence of cyclists, the methodology included an assessment of the peaks of pedestrian activity and the amount of usable space available. Platoon Level of Service for pedestrians on each route is categorised on a scale from A (open movement) to F (jammed). To date, this technique has only been developed and standardised for pedestrian movement.
1.3.3 In Cambridge the Level of Service for pedestrians on the unsegregated route during the weekday morning peak and weekend peak is B, indicating that it has sufficient capacity for pedestrians but comfort may be affected at busy times or when more than one cyclist is passing.
1.3.4 In Norwich the Level of Service for pedestrians on the unsegregated route during the weekday morning peak and weekend peak is A, indicating that it has sufficient capacity at current levels of pedestrian activity.
1.3.5 On the segregated routes in Cambridge and Norwich, the Level of Service for pedestrians during the weekday morning and weekend peaks is A, indicating there is sufficient capacity on the footway side of these routes for current activity.
1.3.6 Equivalent techniques to measure the Level of Service of cyclists have not been developed for the UK. Cyclist Level of Service is likely to be influenced by range of factors that could include journey time.
1.4 Observed interaction and perceived behaviour
1.4.1 This assessment considered shared use environments only, and did not take into account interaction between pedestrians or cyclists and other vehicles. It should be noted that adjacent-to-carriageway facilities can introduce new “junctions” and crossing
5
points (e.g. across side roads) for cyclists, which can lead to increased interaction and potential for conflict with motor vehicles, but this was outside the scope of the research.
1.4.2 Using categories of user interaction based on empirical analysis in the Norwich and Cambridge case studies, the difference in the potential for conflict on segregated and unsegregated routes was found to be minimal.
1.4.3 The project involved on-site interviews with pedestrians and cyclists in Norwich and Cambridge. Both groups were generally comfortable using the segregated and unsegregated routes studied.
1.4.4 Behaviour by both pedestrians and cyclists on segregated and unsegregated routes was judged to be considerate by both user groups. Agreement was strongest on unsegregated routes, suggesting that behaviour is more considerate on these routes, where the requirement to interact with other types of user is clearer.
1.4.5 Despite perceived non-compliance with segregation by both pedestrians and cyclists on weekdays and weekends, both groups were comfortable on the segregated route in Cambridge. In Norwich, perceived user comfort on the segregated shared use facility was lower than on the unsegregated facility.
1.4.6 Of the people interviewed, cyclists generally used the shared use routes more regularly than pedestrians. In Cambridge low lighting levels affected use by both pedestrians and cyclists at certain times of the day. In Norwich the impact of low levels of lighting affected pedestrians more than cyclists.
1.4.7 No collisions, and no conflict of any significance took place during the video surveys. Most of the interaction recorded was relatively inconsequential, where one or more users adjusted their speed/position. The most severe category of interaction observed was that of marginal conflict, where cyclists or pedestrians slowed down or changed direction but movement was calm and controlled.
1.4.8 Only 5 instances of marginal conflict were recorded and they took place on the two unsegregated routes. However, both these of routes were relatively narrow at 2.2m (the two segregated routes were 3m and 4m wide). Limited width increases the need for users to make allowances for other users, and it would be reasonable to expect that the level of interaction would reduce with increasing width. Regardless of this, the incidents recorded were relatively benign in nature.
1.4.9 In Cambridge, two people (4% of sample) said they had experienced a collision on the segregated route, and two people using the unsegregated route (3% of sample) said likewise. In Norwich, three people (3%) said they had experienced a collision on the segregated route - there were no reports of collisions on the unsegregated route. The findings suggest that there is is no material difference in levels of collisions regardless of segregation.
1.5 Summary
1.5.1 No collisions, and no conflict of any significance were observed during the study period. The vast majority of cases of interaction observed were relatively inconsequential and only 5 cases of marginal conflict were recorded, with these exclusively being instances of users adjusting to one-another’s presence.
1.5.2 The findings of this project suggest that collisions are no more likely on unsegregated routes than segregated ones, while the need to interact with other users is likely to
6

increase. However, the data also suggest that where there is sufficient route capacity to provide a good level of service, conflict is less likely to be an issue, regardless of whether the route is segregated (by white line) or not.
1.5.3 As such, it is reasonable to conclude that where capacity is adequate, the difference in the potential for conflict on segregated and unsegregated routes is likely to be minimal.
7
2. Introduction 2.1.1 Atkins was commissioned as part of a multidisciplinary project team which includes MVA
Consultancy, Phil Jones Associates and TRL to carry out evidence based research into the factors which influence the design and operation of segregated and unsegregated pedestrian and cyclist shared use facilities. The research project helped inform the preparation of a new Local Transport Note on shared use routes for pedestrians and cyclists.
2.1.2 At the core of this research are user behavioural studies to support an understanding of how pedestrians and cyclists interact on unsegregated and segregated shared use facilities.
2.1.3 This technical note presents the findings of research into the factors which affect the operation and quality of shared use facilities adjacent-to-road. An evidence based approach was used to undertake comprehensive case studies in Norwich and Cambridge, supported by additional evidence from Bristol, York, Peterborough and Newcastle.
2.1.4 The technical note is structured as follows:
Chapter 3: Our Approach
Chapter 4: Case Study: Cambridge
Chapter 5: Case Study: Norwich
Chapter 6: Support Site: Bristol
Chapter 7: Support Site: Newcastle
Chapter 8: Support Site: Peterborough
Chapter 9: Support Site: York
Chapter 10: Summary of key findings
Appendix A: Questionnaire
Appendix B: Interaction study descriptions: Norwich
Appendix C: Interaction study descriptions: Cambridge
Appendix D: Pedestrian Level of Service
8
3. Our Approach 3.1.1 Data collection, analysis and interpretation for this project were undertaken for four
shared use case study sites, all of which were adjacent-to-road. Data has been undertaken at:
Two sites in Cambridge, one of which was segregated
Two sites in Norwich, one of which was segregated
3.1.2 Additional data was collected at segregated shared use facilities in Bristol, York, Newcastle and Peterborough to provide support evidence for comprehensive analysis in Cambridge and Norwich.
3.2 Case Study Methodology (Cambridge and Norwich)
3.2.1 Design Characteristics were recorded on-site at each facility according to a number of criteria, including:
Width
Gradient
Crossfall
Bounding
Surface
Alignment, sightlines and visibility
3.2.2 Pedestrian and cycle activity was assessed using video recordings made at each survey location. Flow data was captured for the peak three-hour weekday morning period and peak weekend period. Data collected included:
Pedestrian and cyclist directional time profiles
Pedestrian and cyclists compliance with segregation (if present)
Cyclist activity on the shared use facility relative to cyclist activity on-road (if applicable)
3.2.3 An assessment of cycle speeds was undertaken by capturing a sample of cyclists on video. Speeds were calculated by recording the time taken to pass through sections of known length. By recording the number of users within the same study area on the route, cycle speeds were compared with user density.
3.2.4 An interaction study of pedestrian and cyclist behaviour was undertaken using videos recorded during peak periods, and following an evidence-based, empirical approach. The types of interaction between cyclists and pedestrians were categorised according to their effect. This methodology has been used in previous interaction studies on shared use routes. In this method, the interaction assessment technique is based on that used in a TRL conflict study with a few alterations. The TRL study “Behaviour at Cycle Advance Stop Lines” (carried out in 2002) used five categories to classify interactions:
Precautionary braking/lane change,
9
Controlled braking/lane change,
Rapid deceleration/lane change resulting in a near miss,
Emergency braking/violent swerve resulting in a near miss,
Emergency action followed by collision.
3.2.5 Some of the categories were considered to overlap for the purposes of this research and the least severe category, "Precautionary braking/lane change" did not capture lesser interactions. Given this, and the difficulty in consistently determining the degree of interaction by video analysis, four broad categories were established:
Minor interaction; arising when one or more users adjust their speed/position to allow others to pass,
Marginal conflict; unplanned interaction where cyclist/pedestrian slow down or change direction to allow for other users, but movement is calm and controlled,
Conflict; arising from unexpected interaction (e.g. cyclist/pedestrian has to take emergency action to avoid contact),
Collision.
3.2.6 Interaction events were categorised subjectively. It was considered preferable to assess observed behaviour and judge user interactions in this way rather than define them using only an external quantitative measure, in order to capture the wider context and specific details of each interaction.
3.2.7 On unsegregated shared use routes, cyclists tended to weave around pedestrians, making frequent adjustments to their speed and direction as they went. This general interaction between cyclists and pedestrians is generally not identified as hazardous.
3.2.8 A user perception study was undertaken by carrying out on-site questionnaire surveys at the same locations as video data collection, with an option for respondents to provide a postal response in order to improve the response rate. Key questions were based on:
Perceived quality of the pedestrian/cyclist environment
Perceived comfort
3.2.9 The results of this survey provide a qualitative assessment of the perceptions of users on existing shared use facilities.
3.3 Support Evidence Methodology
3.3.1 On-site data collection and interpretation were undertaken at an additional four segregated shared use facilities across the UK (Bristol, Newcastle, Peterborough and York) to provide support evidence for trends emerging from the comprehensive assessments of the Norwich and Cambridge case studies.
3.3.2 Pedestrian and cyclist activity (including compliance) was recorded over the same time periods as used in Norwich and Cambridge.. The level of cycling on the road was also recorded.
3.3.3 A representative sample of cycle speeds on the shared use facility was recorded.
10
4. Case Study: Cambridge
4.1 Locations
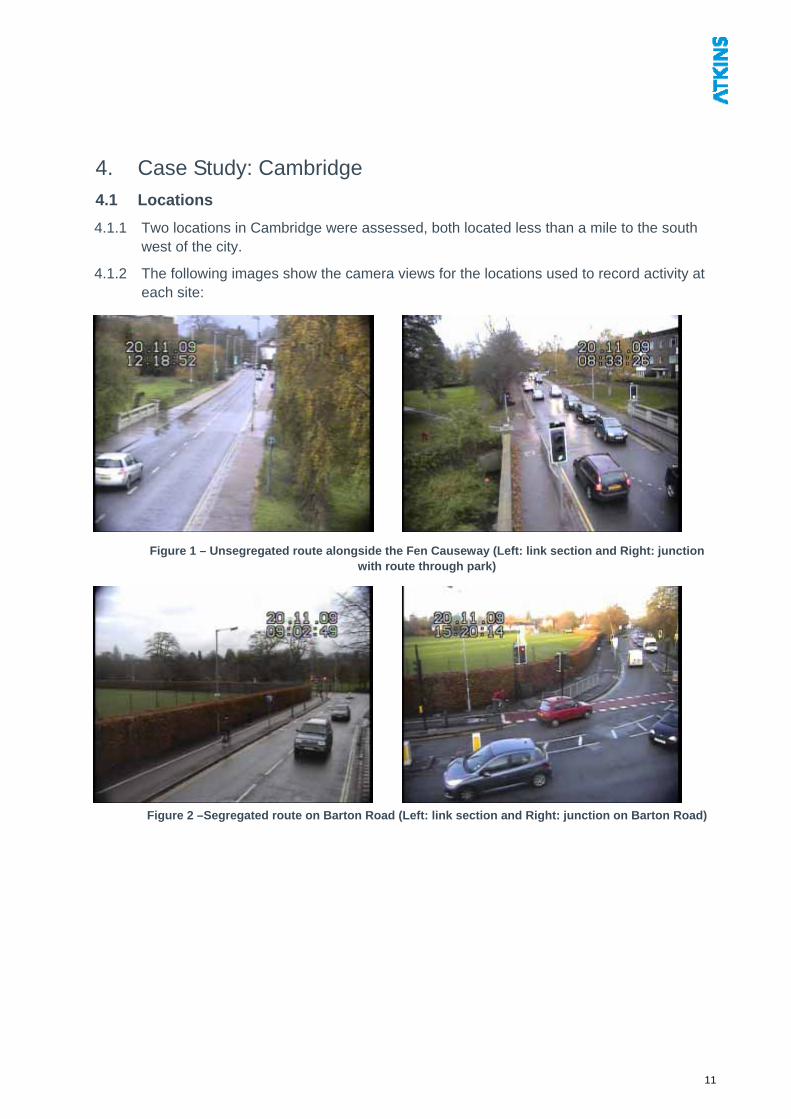
4.1.1 Two locations in Cambridge were assessed, both located less than a mile to the south west of the city.
4.1.2 The following images show the camera views for the locations used to record activity at each site:
Figure 1 – Unsegregated route alongside the Fen Causeway (Left: link section and Right: junction with route through park)
Figure 2 –Segregated route on Barton Road (Left: link section and Right: junction on Barton Road)
11
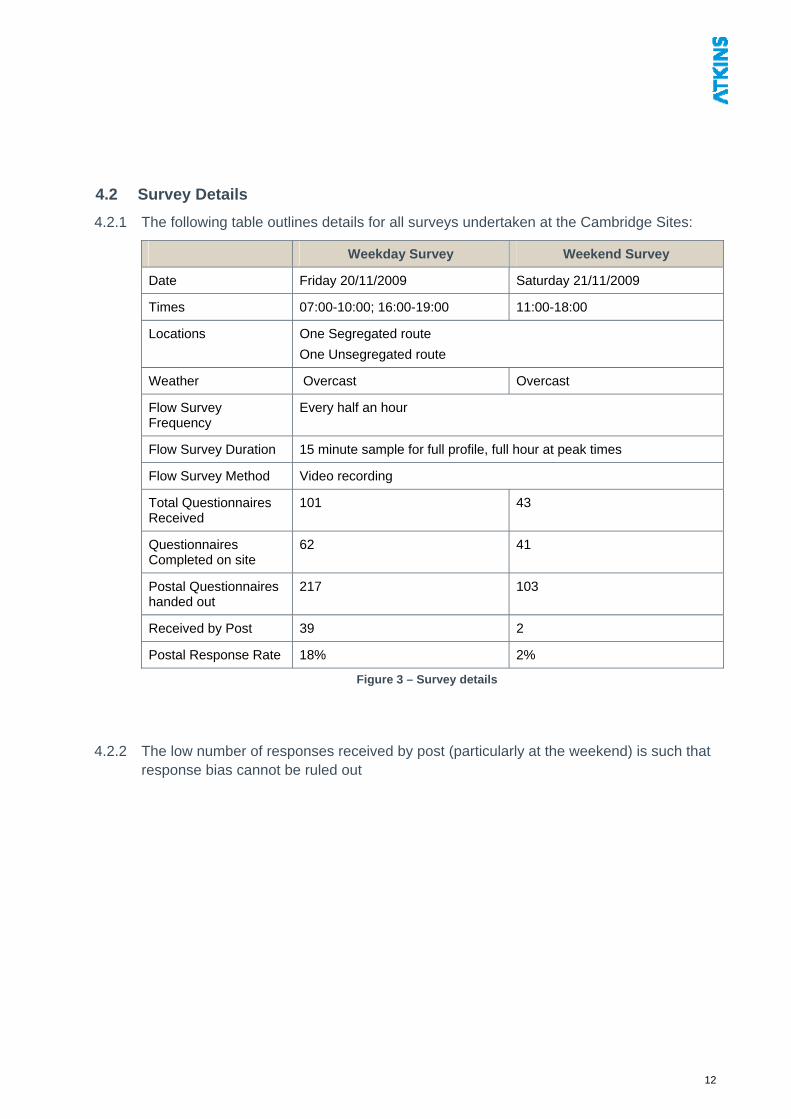
4.2 Survey Details
4.2.1 The following table outlines details for all surveys undertaken at the Cambridge Sites:
Weekday Survey Weekend Survey
Date Friday 20/11/2009 Saturday 21/11/2009
Times 07:00-10:00; 16:00-19:00 11:00-18:00
Locations One Segregated route
One Unsegregated route
Weather Overcast Overcast
Flow Survey Frequency
Every half an hour
Flow Survey Duration 15 minute sample for full profile, full hour at peak times
Flow Survey Method Video recording
Total Questionnaires Received
101 43
Questionnaires Completed on site
62 41
Postal Questionnaires handed out
217 103
Received by Post 39 2
Postal Response Rate 18% 2%
Figure 3 – Survey details
4.2.2 The low number of responses received by post (particularly at the weekend) is such that response bias cannot be ruled out
12
4.3 Design Characteristics
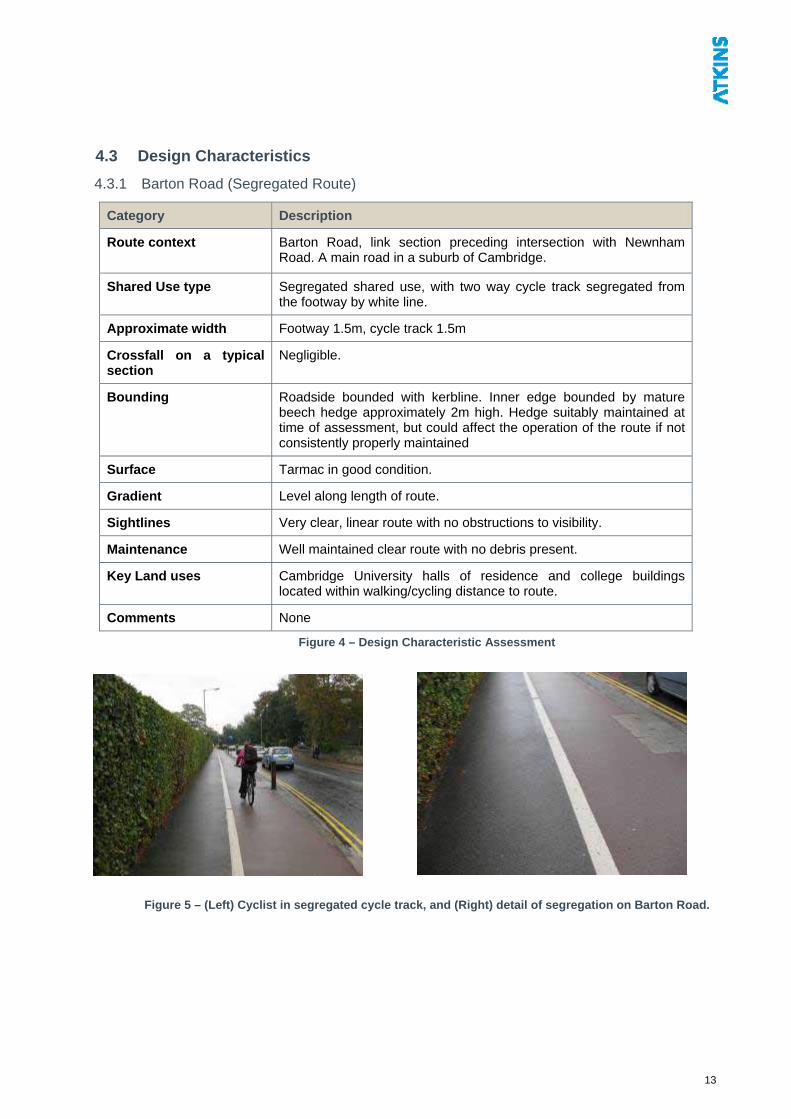
4.3.1 Barton Road (Segregated Route)
Category Description
Route context Barton Road, link section preceding intersection with Newnham Road. A main road in a suburb of Cambridge.
Shared Use type Segregated shared use, with two way cycle track segregated from the footway by white line.
Approximate width Footway 1.5m, cycle track 1.5m
Crossfall on a typical section
Negligible.
Bounding Roadside bounded with kerbline. Inner edge bounded by mature beech hedge approximately 2m high. Hedge suitably maintained at time of assessment, but could affect the operation of the route if not consistently properly maintained
Surface Tarmac in good condition.
Gradient Level along length of route.
Sightlines Very clear, linear route with no obstructions to visibility.
Maintenance Well maintained clear route with no debris present.
Key Land uses Cambridge University halls of residence and college buildings located within walking/cycling distance to route.
Comments None
Figure 4 – Design Characteristic Assessment
Figure 5 – (Left) Cyclist in segregated cycle track, and (Right) detail of segregation on Barton Road.
13
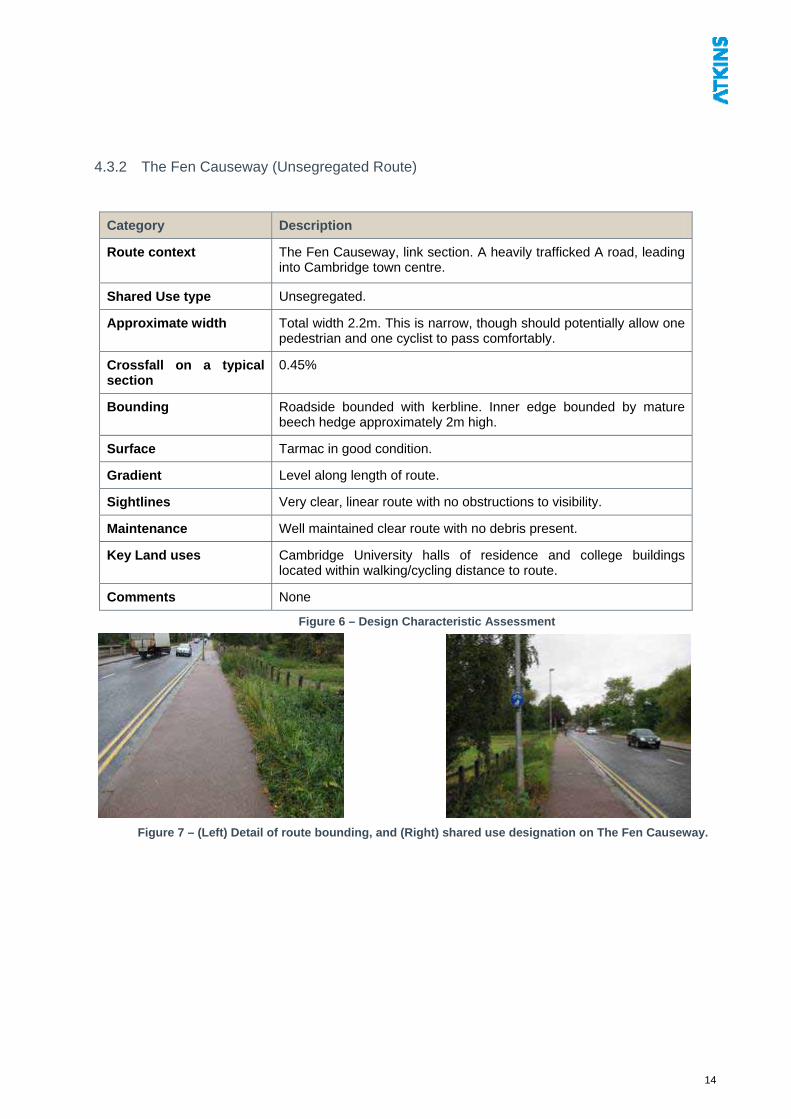
4.3.2 The Fen Causeway (Unsegregated Route)
Category Description
Route context The Fen Causeway, link section. A heavily trafficked A road, leading into Cambridge town centre.
Shared Use type Unsegregated.
Approximate width Total width 2.2m. This is narrow, though should potentially allow one pedestrian and one cyclist to pass comfortably.
Crossfall on a typical section
0.45%
Bounding Roadside bounded with kerbline. Inner edge bounded by mature beech hedge approximately 2m high.
Surface Tarmac in good condition.
Gradient Level along length of route.
Sightlines Very clear, linear route with no obstructions to visibility.
Maintenance Well maintained clear route with no debris present.
Key Land uses Cambridge University halls of residence and college buildings located within walking/cycling distance to route.
Comments None
Figure 6 – Design Characteristic Assessment
Figure 7 – (Left) Detail of route bounding, and (Right) shared use designation on The Fen Causeway.
14
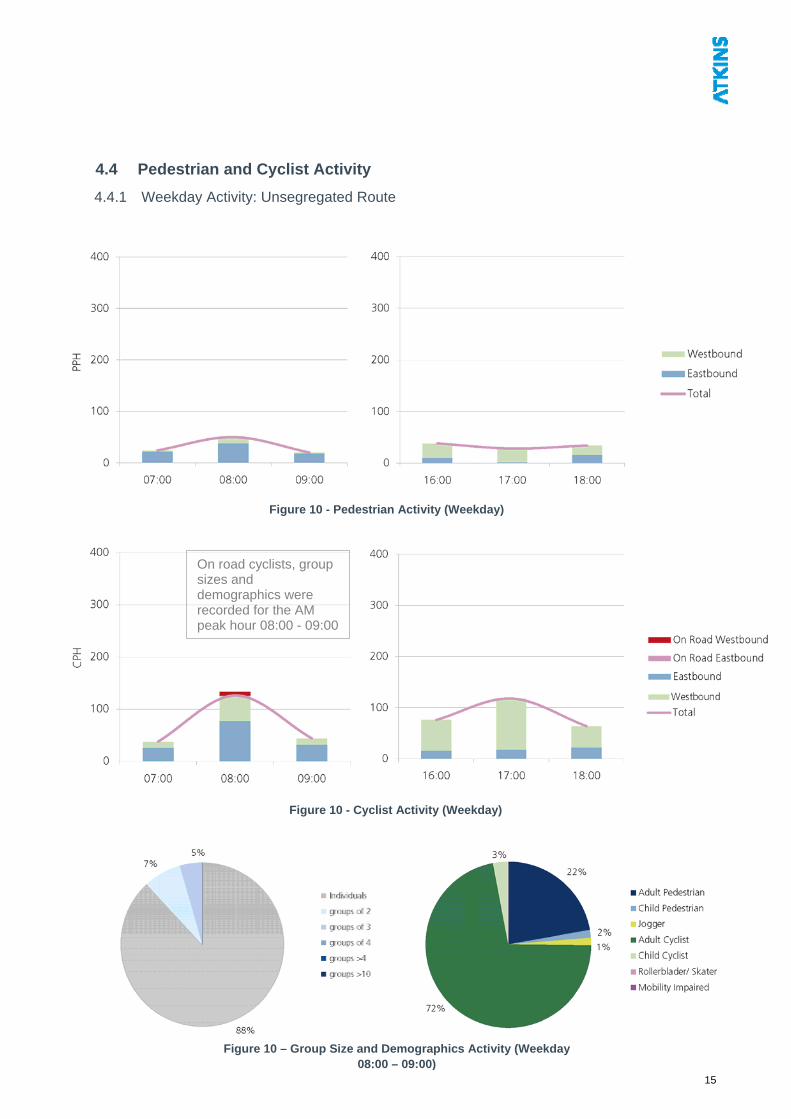
4.4 Pedestrian and Cyclist Activity
4.4.1 Weekday Activity: Unsegregated Route
Figure 10 - Pedestrian Activity (Weekday)
Figure 10 – Group Size and Demographics Activity (Weekday 08:00 – 09:00)
Figure 10 - Cyclist Activity (Weekday)
On road cyclists, group sizes and demographics were recorded for the AM peak hour 08:00 - 09:00
15
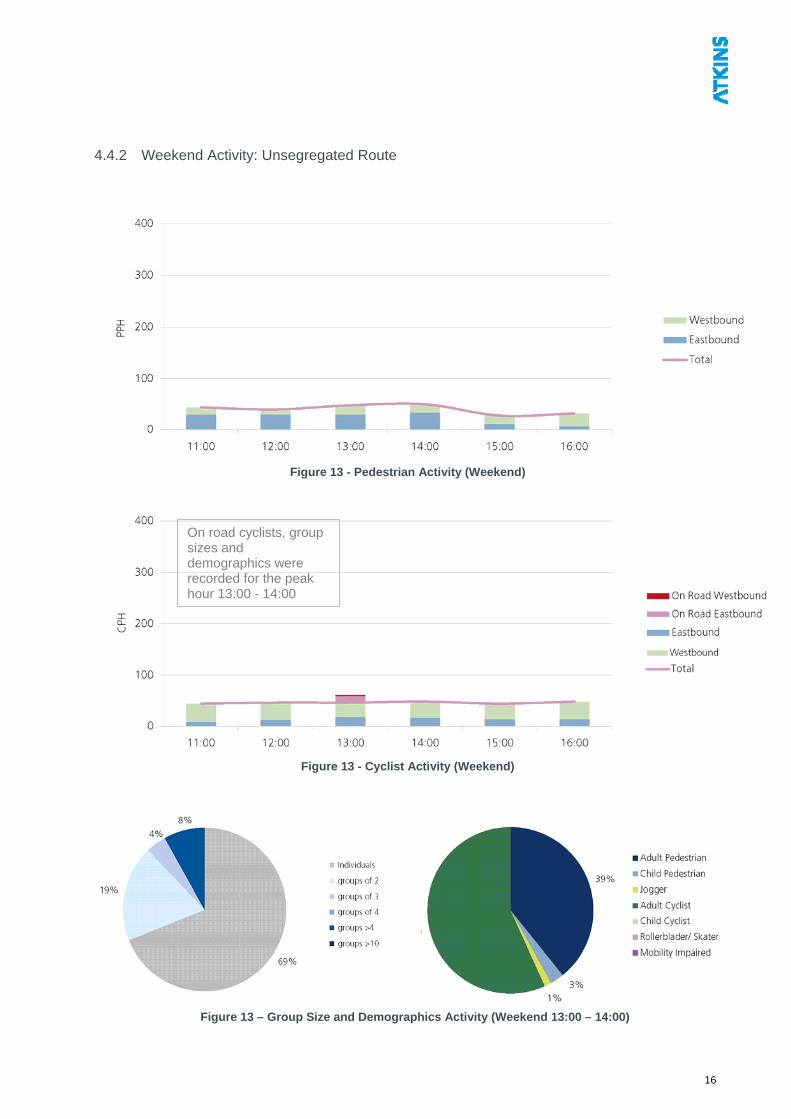
4.4.2 Weekend Activity: Unsegregated Route
Figure 13 - Pedestrian Activity (Weekend)
On road cyclists, group sizes and demographics were recorded for the peak hour 13:00 - 14:00
Figure 13 - Cyclist Activity (Weekend)
Figure 13 – Group Size and Demographics Activity (Weekend 13:00 – 14:00)
16
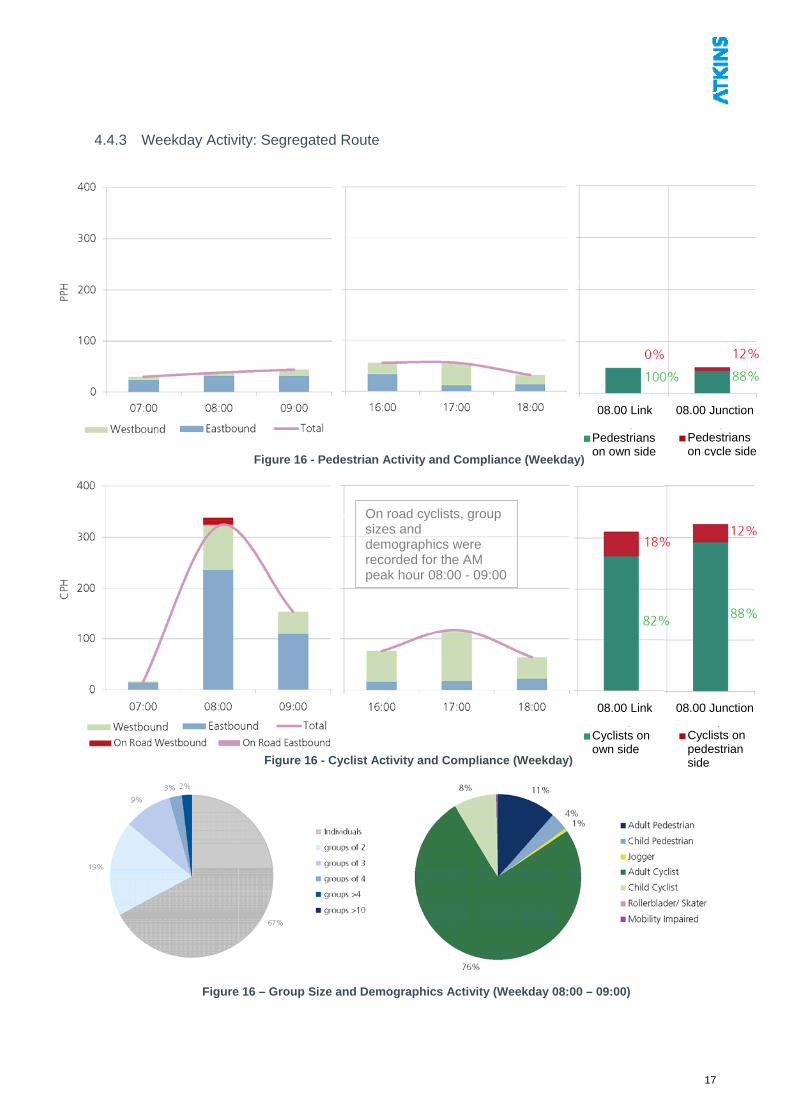
4.4.3 Weekday Activity: Segregated Route
08.00 Link 08.00 Junction
Pedesn strians
ide Poon ow
edesn c
trians ycle side
On road cyclists, group sizes and demographics were recorded for the AM peak hour 08:00 - 09:00
08.00 Link 08.00 Junction
Pedestrians on own side
Pedestrians on cycle side
08.00 Link 08.00 Junction
Cyclists on own side
Figure 16 - Pedestrian Activity and Compliance (Weekday)
Cyclists on pedestrian side Figure 16 - Cyclist Activity and Compliance (Weekday)
Figure 16 – Group Size and Demographics Activity (Weekday 08:00 – 09:00)
17
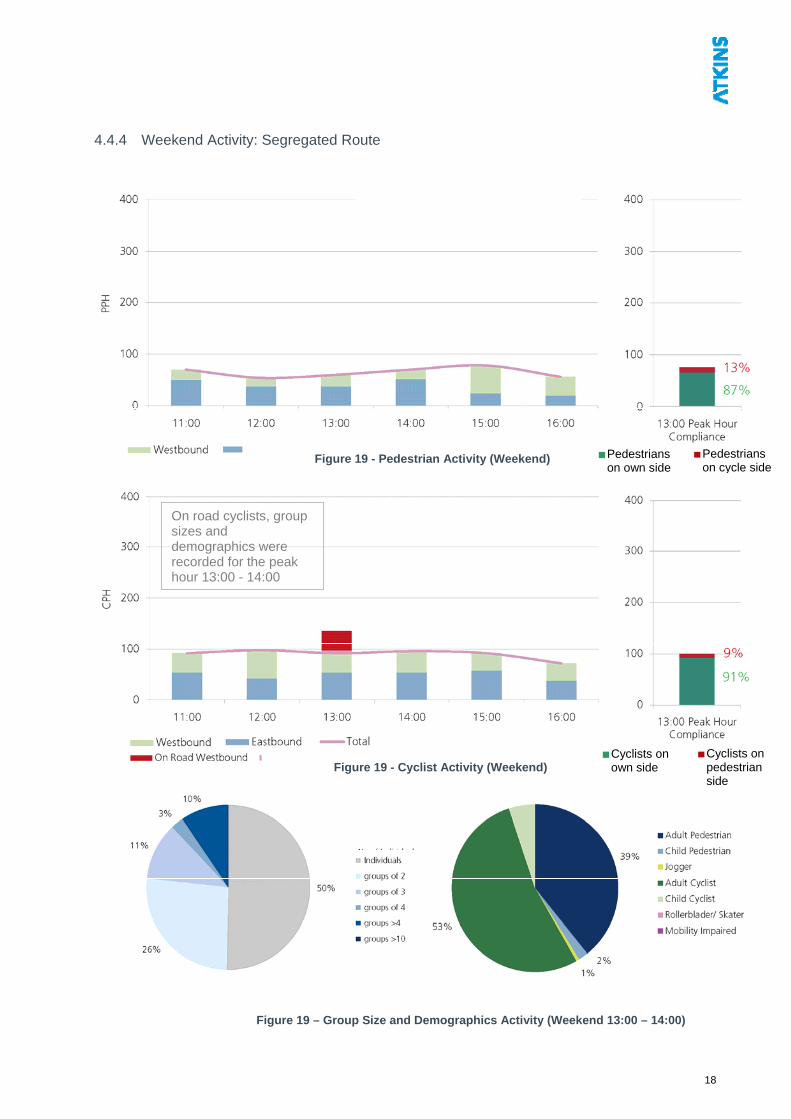
4.4.4 Weekend Activity: Segregated Route
Figure 19 - Pedestrian Activity (Weekend) Pedestrians on own side
Pedestrians on cycle side
On road cyclists, group sizes and demographics were recorded for the peak hour 13:00 - 14:00
Cyclists on own side
Cyclists on pedestrian side
Figure 19 - Cyclist Activity (Weekend)
Figure 19 – Group Size and Demographics Activity (Weekend 13:00 – 14:00)
18
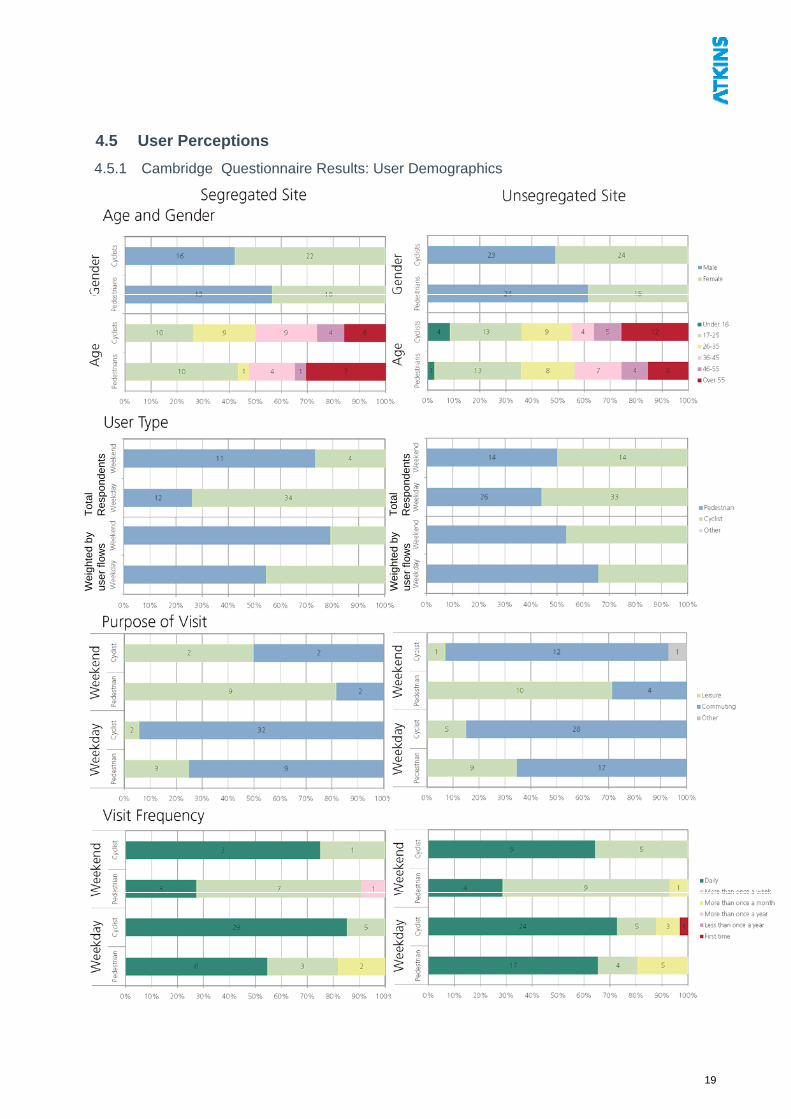
4.5 User Perceptions
4.5.1 Cambridge Questionnaire Results: User Demographics
Tot
al
Res
pond
ents
Tot
al
Res
pond
ents
Wei
ghte
d by
us
er fl
ows
Wei
ghte
d by
us
er fl
ows
19
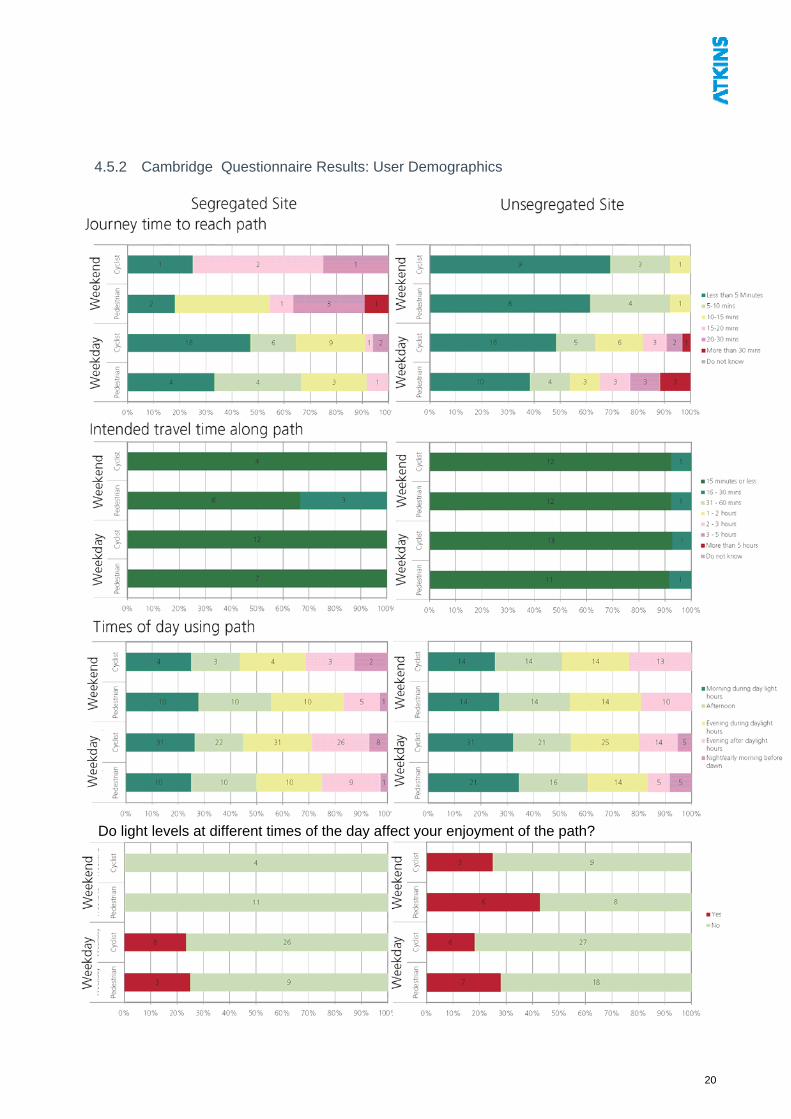
4.5.2 Cambridge Questionnaire Results: User Demographics
Do light levels at different times of the day affect your enjoyment of the path?
20
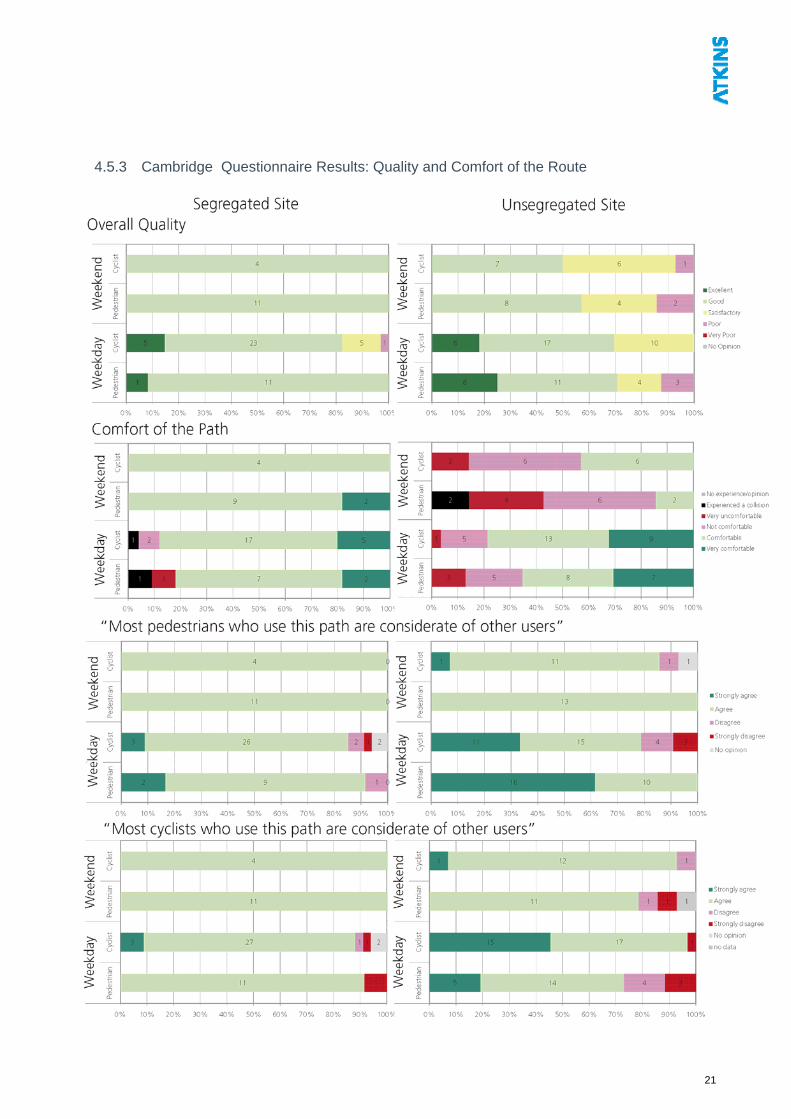
4.5.3 Cambridge Questionnaire Results: Quality and Comfort of the Route
21
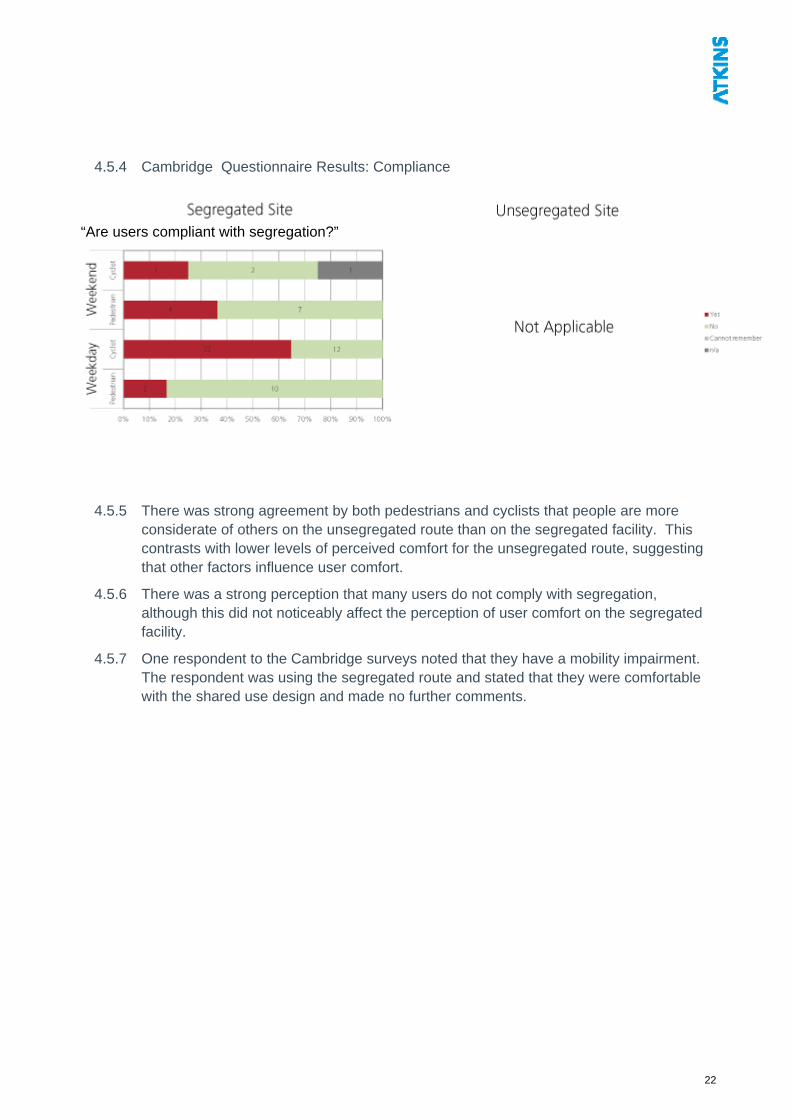
4.5.4 Cambridge Questionnaire Results: Compliance
“Are users compliant with segregation?”
4.5.5 There was strong agreement by both pedestrians and cyclists that people are more considerate of others on the unsegregated route than on the segregated facility. This contrasts with lower levels of perceived comfort for the unsegregated route, suggesting that other factors influence user comfort.
4.5.6 There was a strong perception that many users do not comply with segregation, although this did not noticeably affect the perception of user comfort on the segregated facility.
4.5.7 One respondent to the Cambridge surveys noted that they have a mobility impairment. The respondent was using the segregated route and stated that they were comfortable with the shared use design and made no further comments.
22
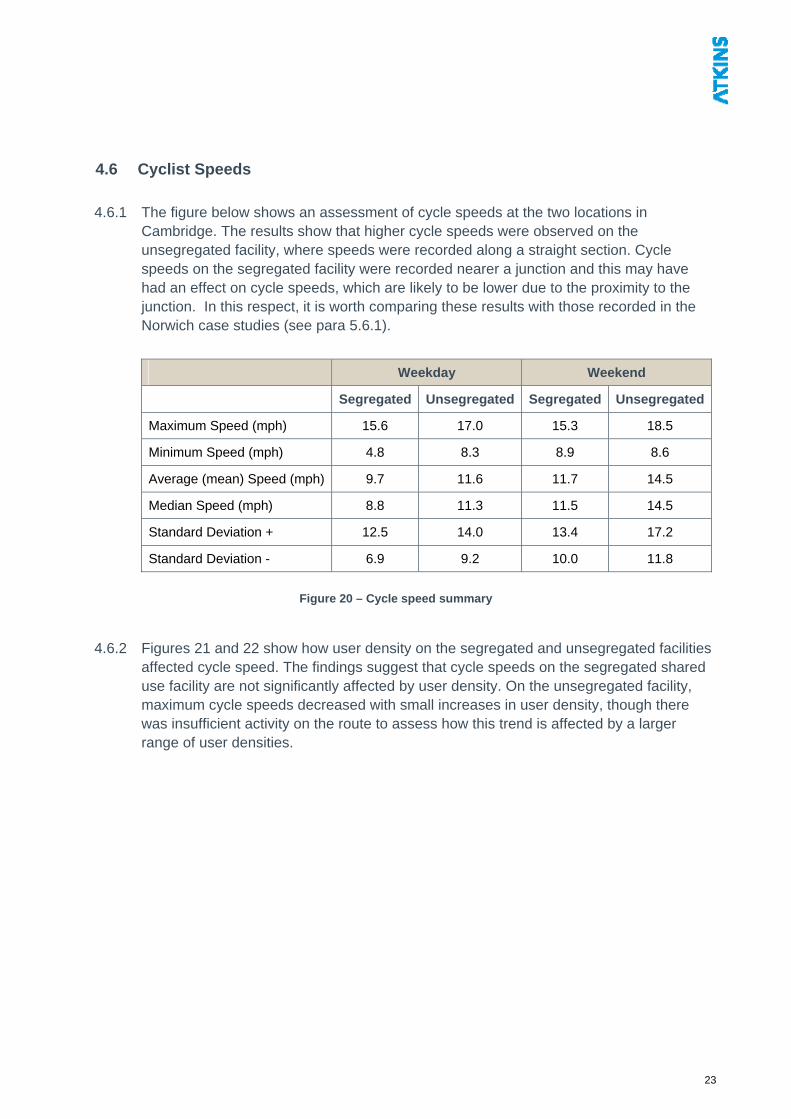
4.6 Cyclist Speeds
4.6.1 The figure below shows an assessment of cycle speeds at the two locations in
Cambridge. The results show that higher cycle speeds were observed on the unsegregated facility, where speeds were recorded along a straight section. Cycle speeds on the segregated facility were recorded nearer a junction and this may have had an effect on cycle speeds, which are likely to be lower due to the proximity to the junction. In this respect, it is worth comparing these results with those recorded in the Norwich case studies (see para 5.6.1).
Weekday Weekend
Segregated Unsegregated Segregated Unsegregated
Maximum Speed (mph) 15.6 17.0 15.3 18.5
Minimum Speed (mph) 4.8 8.3 8.9 8.6
Average (mean) Speed (mph) 9.7 11.6 11.7 14.5
Median Speed (mph) 8.8 11.3 11.5 14.5
Standard Deviation + 12.5 14.0 13.4 17.2
Standard Deviation - 6.9 9.2 10.0 11.8
Figure 20 – Cycle speed summary
4.6.2 Figures 21 and 22 show how user density on the segregated and unsegregated facilities affected cycle speed. The findings suggest that cycle speeds on the segregated shared use facility are not significantly affected by user density. On the unsegregated facility, maximum cycle speeds decreased with small increases in user density, though there was insufficient activity on the route to assess how this trend is affected by a larger range of user densities.
23
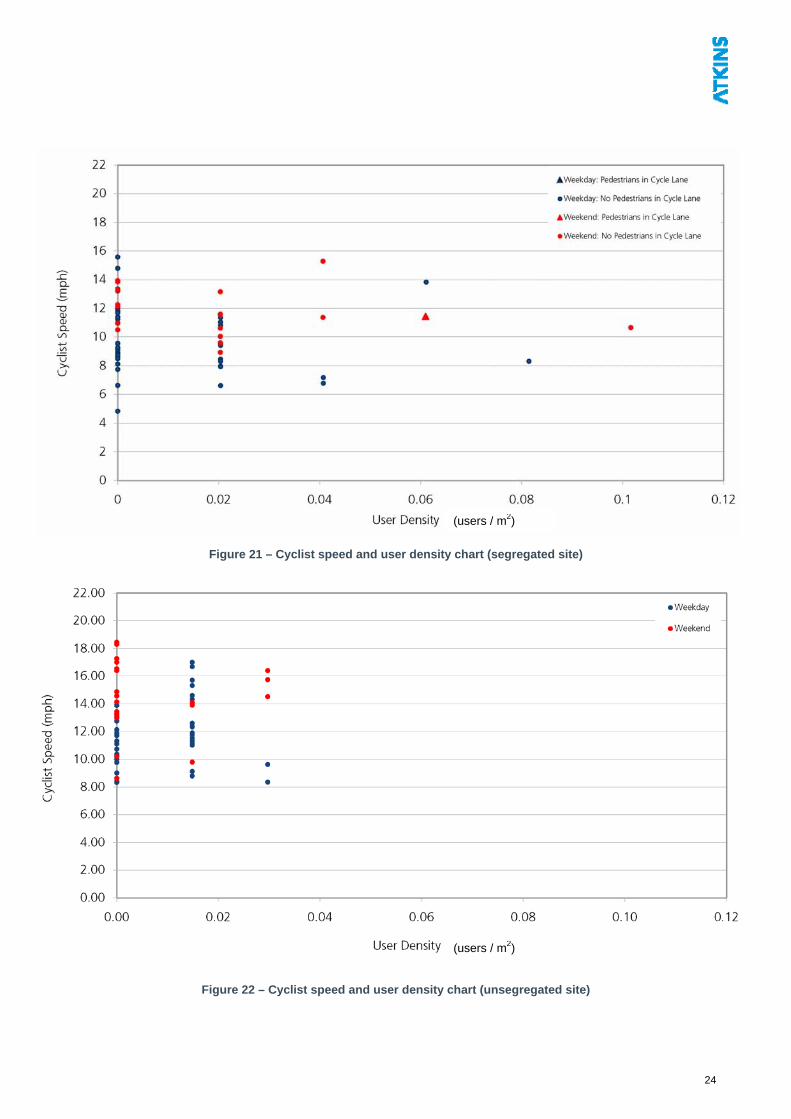
Figure 21 – Cyclist speed and user density chart (segregated site)
(users / m2)
(users / m2)
Figure 22 – Cyclist speed and user density chart (unsegregated site)
24
4.7 Interactions
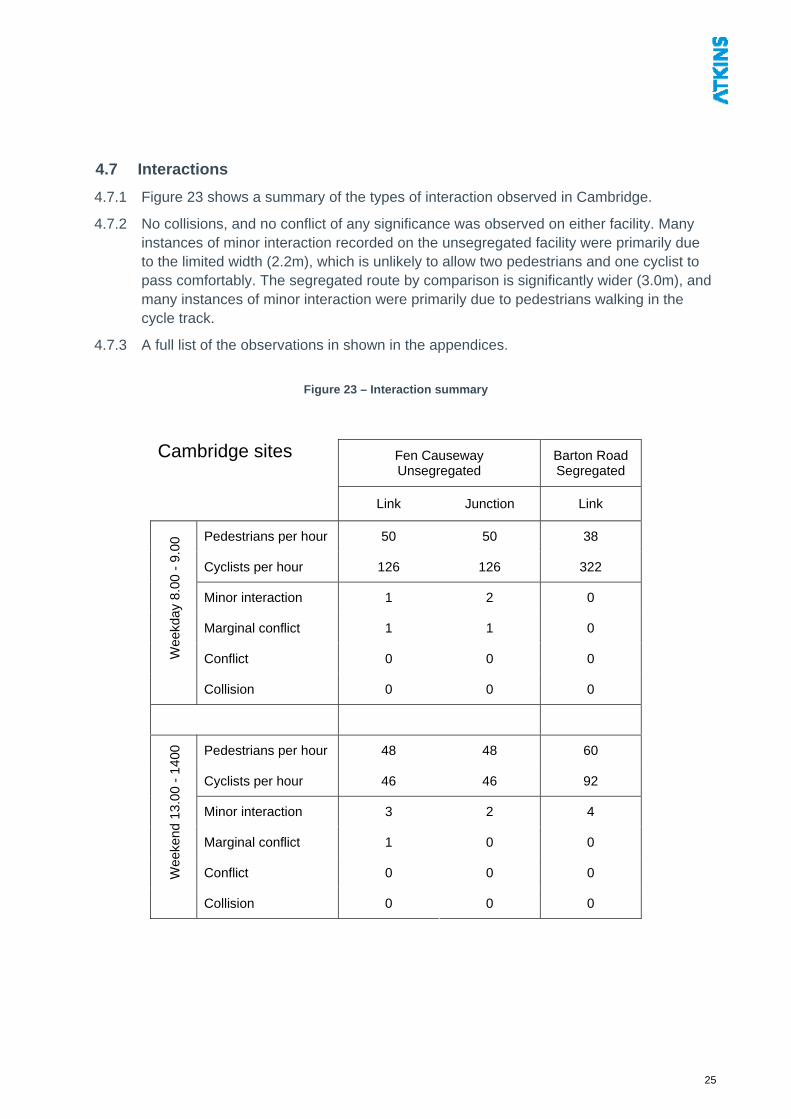
4.7.1 Figure 23 shows a summary of the types of interaction observed in Cambridge.
4.7.2 No collisions, and no conflict of any significance was observed on either facility. Many instances of minor interaction recorded on the unsegregated facility were primarily due to the limited width (2.2m), which is unlikely to allow two pedestrians and one cyclist to pass comfortably. The segregated route by comparison is significantly wider (3.0m), and many instances of minor interaction were primarily due to pedestrians walking in the cycle track.
4.7.3 A full list of the observations in shown in the appendices.
Figure 23 – Interaction summary
Cambridge sites Fen Causeway Unsegregated
Barton Road Segregated
Link Junction Link
Pedestrians per hour 50 50 38
Cyclists per hour 126 126 322
Minor interaction 1 2 0
Marginal conflict 1 1 0
Conflict 0 0 0 Wee
kday
8.0
0 -
9.00
Collision 0 0 0
Pedestrians per hour 48 48 60
Cyclists per hour 46 46 92
Minor interaction 3 2 4
Marginal conflict 1 0 0
Conflict 0 0 0 Wee
kend
13.
00 -
140
0
Collision 0 0 0
25
5. Case Study: Norwich Shared Use Routes
5.1 Location
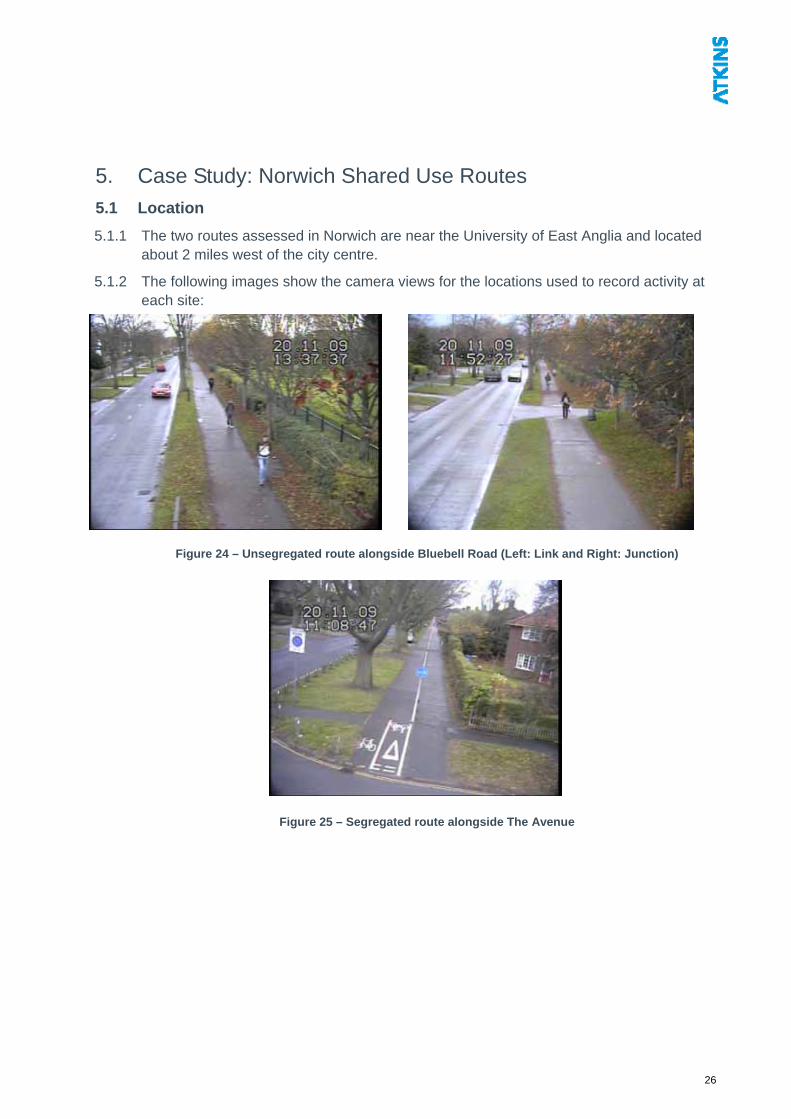
5.1.1 The two routes assessed in Norwich are near the University of East Anglia and located about 2 miles west of the city centre.
5.1.2 The following images show the camera views for the locations used to record activity at each site:
Figure 24 – Unsegregated route alongside Bluebell Road (Left: Link and Right: Junction)
Figure 25 – Segregated route alongside The Avenue
26
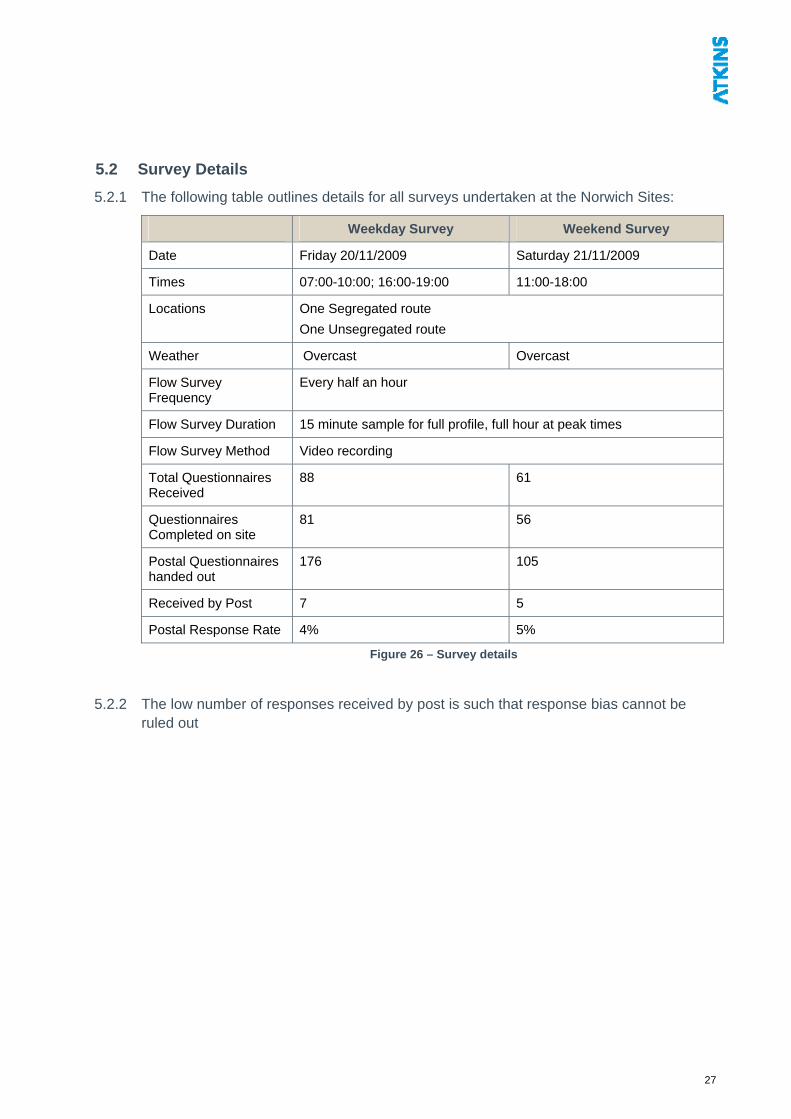
5.2 Survey Details
5.2.1 The following table outlines details for all surveys undertaken at the Norwich Sites:
Weekday Survey Weekend Survey
Date Friday 20/11/2009 Saturday 21/11/2009
Times 07:00-10:00; 16:00-19:00 11:00-18:00
Locations One Segregated route
One Unsegregated route
Weather Overcast Overcast
Flow Survey Frequency
Every half an hour
Flow Survey Duration 15 minute sample for full profile, full hour at peak times
Flow Survey Method Video recording
Total Questionnaires Received
88 61
Questionnaires Completed on site
81 56
Postal Questionnaires handed out
176 105
Received by Post 7 5
Postal Response Rate 4% 5%
Figure 26 – Survey details
5.2.2 The low number of responses received by post is such that response bias cannot be ruled out
27
5.3 Design Characteristics
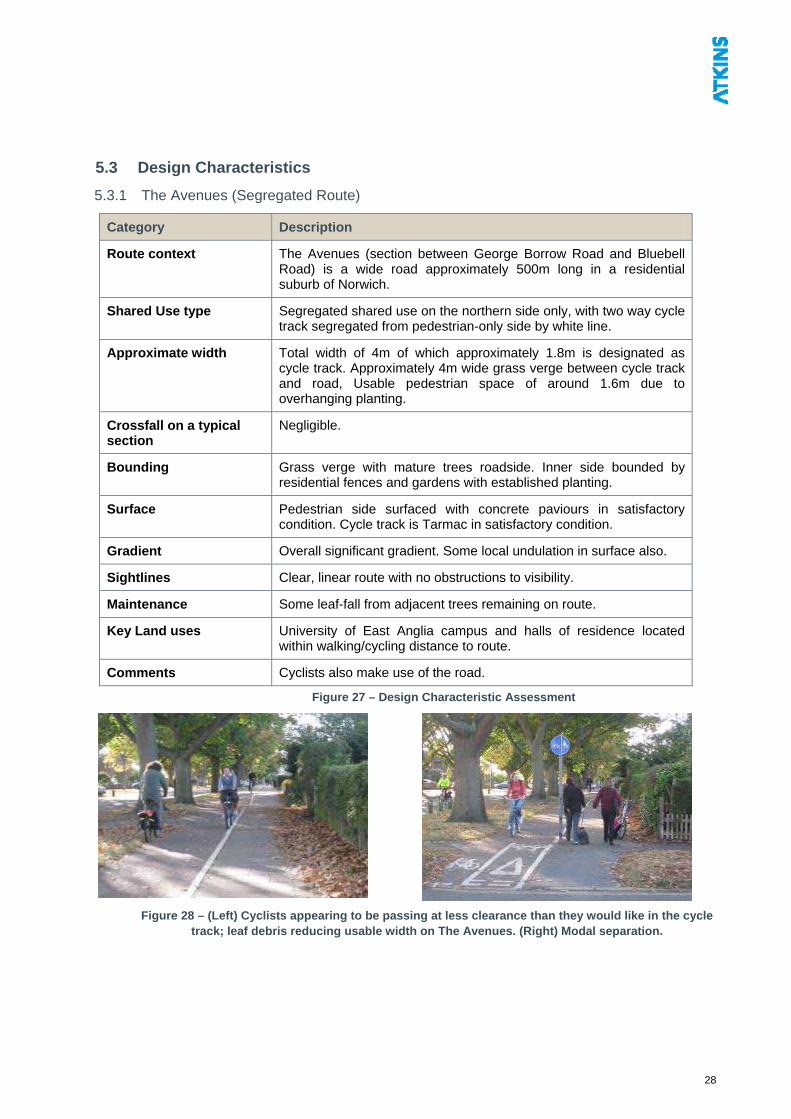
5.3.1 The Avenues (Segregated Route)
Category Description
Route context The Avenues (section between George Borrow Road and Bluebell Road) is a wide road approximately 500m long in a residential suburb of Norwich.
Shared Use type Segregated shared use on the northern side only, with two way cycle track segregated from pedestrian-only side by white line.
Approximate width Total width of 4m of which approximately 1.8m is designated as cycle track. Approximately 4m wide grass verge between cycle track and road, Usable pedestrian space of around 1.6m due to overhanging planting.
Crossfall on a typical section
Negligible.
Bounding Grass verge with mature trees roadside. Inner side bounded by residential fences and gardens with established planting.
Surface Pedestrian side surfaced with concrete paviours in satisfactory condition. Cycle track is Tarmac in satisfactory condition.
Gradient Overall significant gradient. Some local undulation in surface also.
Sightlines Clear, linear route with no obstructions to visibility.
Maintenance Some leaf-fall from adjacent trees remaining on route.
Key Land uses University of East Anglia campus and halls of residence located within walking/cycling distance to route.
Comments Cyclists also make use of the road.
Figure 27 – Design Characteristic Assessment
Figure 28 – (Left) Cyclists appearing to be passing at less clearance than they would like in the cycle track; leaf debris reducing usable width on The Avenues. (Right) Modal separation.
28
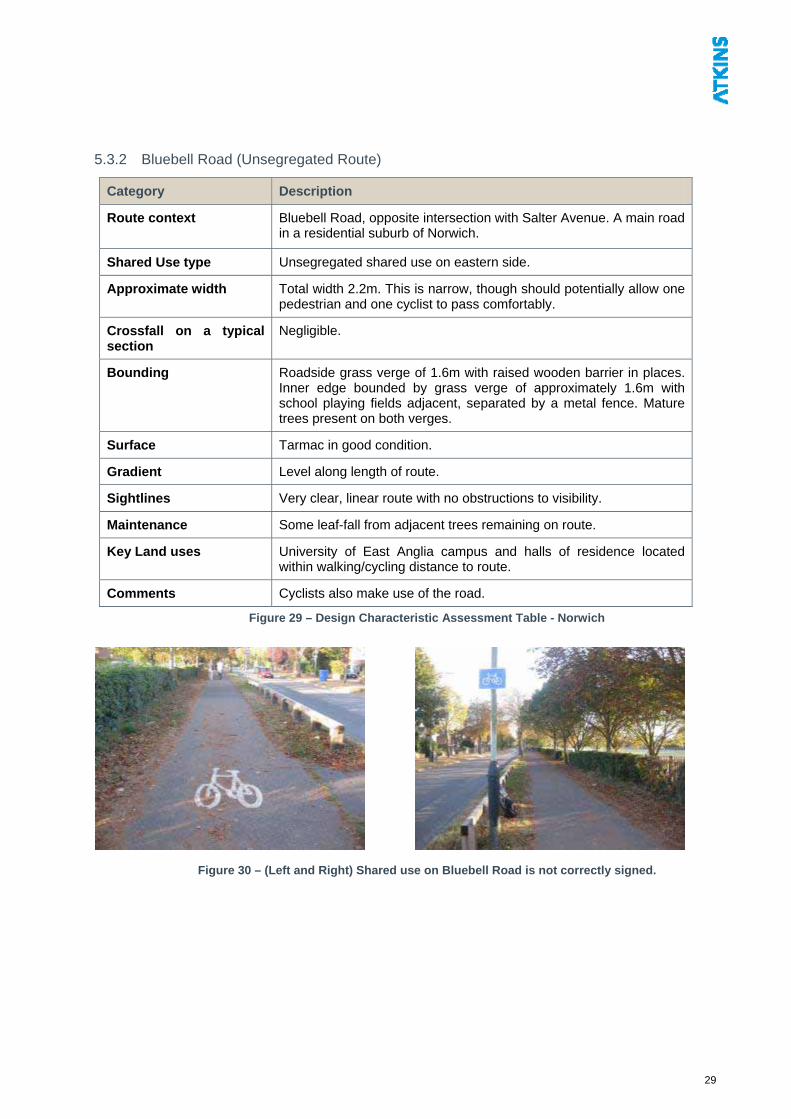
5.3.2 Bluebell Road (Unsegregated Route)
Category Description
Route context Bluebell Road, opposite intersection with Salter Avenue. A main road in a residential suburb of Norwich.
Shared Use type Unsegregated shared use on eastern side.
Approximate width Total width 2.2m. This is narrow, though should potentially allow one pedestrian and one cyclist to pass comfortably.
Crossfall on a typical section
Negligible.
Bounding Roadside grass verge of 1.6m with raised wooden barrier in places. Inner edge bounded by grass verge of approximately 1.6m with school playing fields adjacent, separated by a metal fence. Mature trees present on both verges.
Surface Tarmac in good condition.
Gradient Level along length of route.
Sightlines Very clear, linear route with no obstructions to visibility.
Maintenance Some leaf-fall from adjacent trees remaining on route.
Key Land uses University of East Anglia campus and halls of residence located within walking/cycling distance to route.
Comments Cyclists also make use of the road.
Figure 29 – Design Characteristic Assessment Table - Norwich
Figure 30 – (Left and Right) Shared use on Bluebell Road is not correctly signed.
29
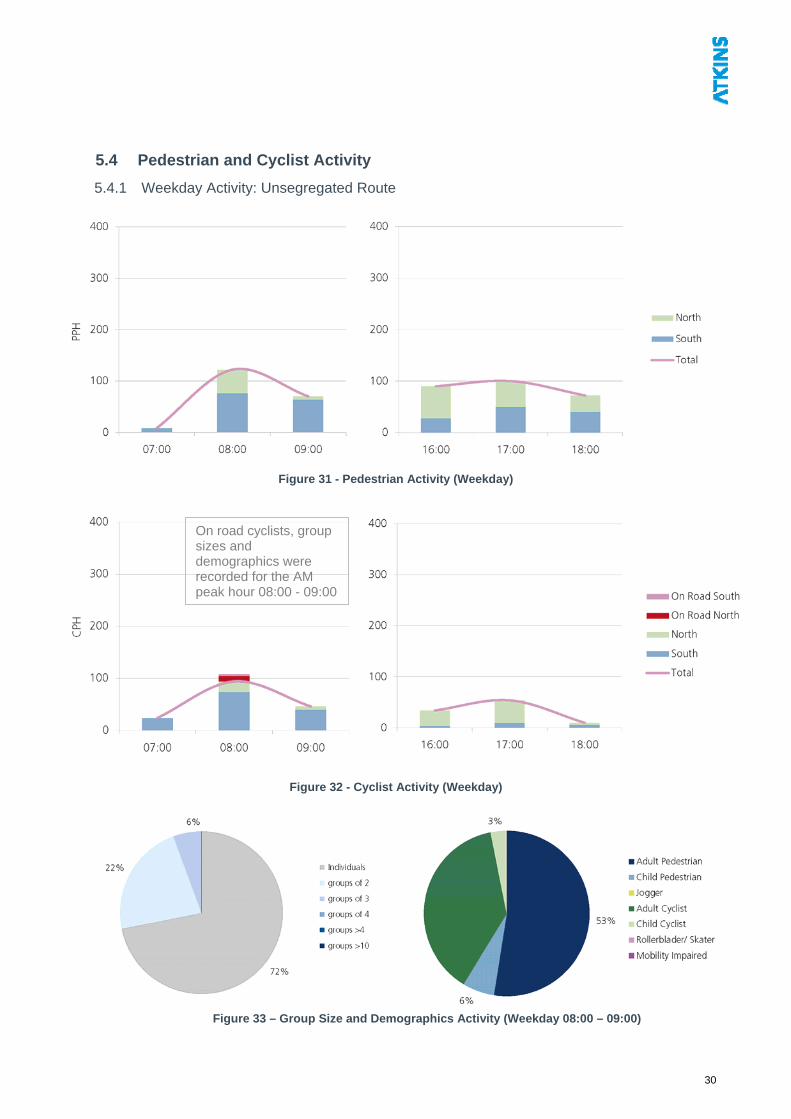
5.4 Pedestrian and Cyclist Activity
5.4.1 Weekday Activity: Unsegregated Route
Figure 31 - Pedestrian Activity (Weekday)
On road cyclists, group sizes and demographics were recorded for the AM peak hour 08:00 - 09:00
Figure 32 - Cyclist Activity (Weekday)
Figure 33 – Group Size and Demographics Activity (Weekday 08:00 – 09:00)
30
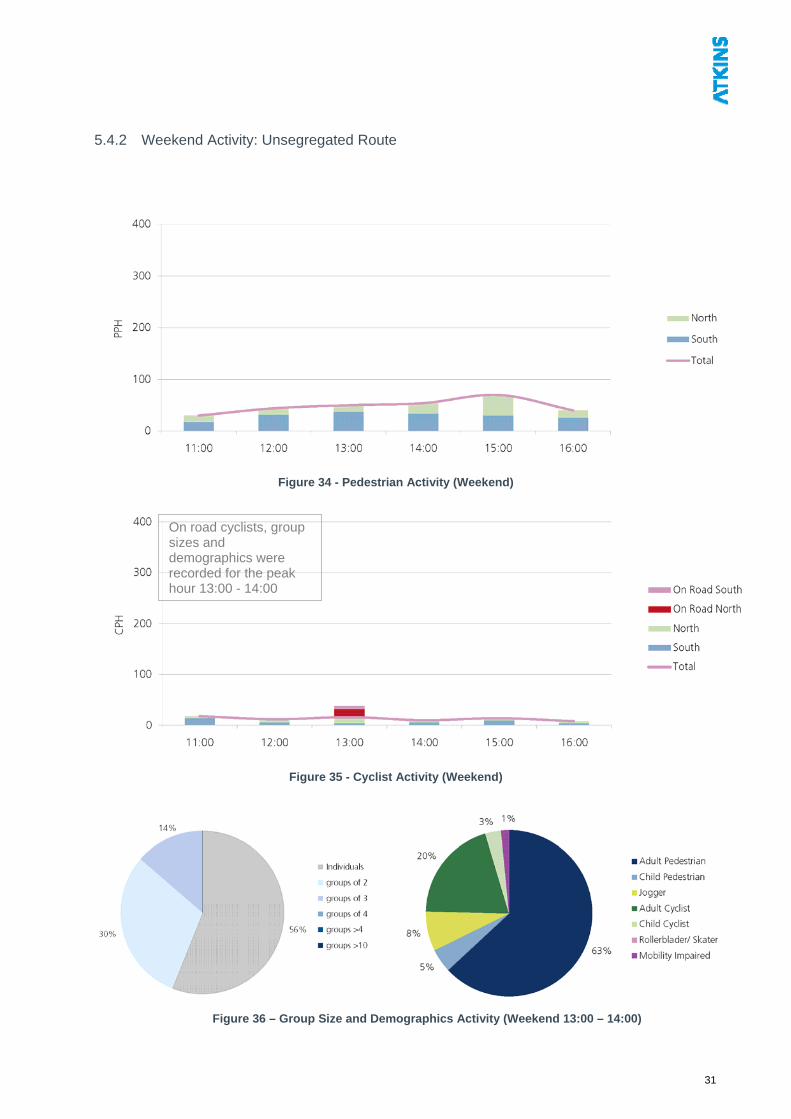
5.4.2 Weekend Activity: Unsegregated Route
Figure 34 - Pedestrian Activity (Weekend)
On road cyclists, group sizes and demographics were recorded for the peak hour 13:00 - 14:00
Figure 35 - Cyclist Activity (Weekend)
Figure 36 – Group Size and Demographics Activity (Weekend 13:00 – 14:00)
31
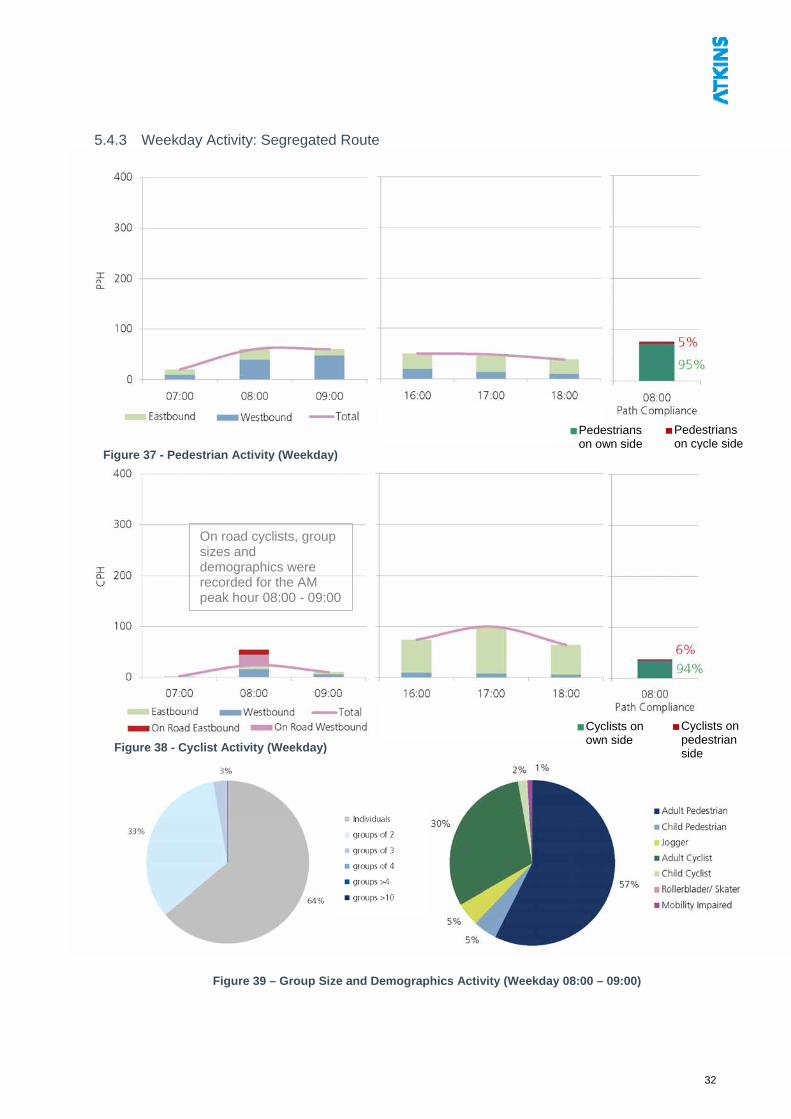
5.4.3 Weekday Activity: Segregated Route
Pedestrians on cycle
Pedestrians on own side
side
Figure 37 - Pedestrian Activity (Weekday)
On road cyclists, group sizes and demographics were recorded for the AM peak hour 08:00 - 09:00
Cyclists on pedestrian side
Cyclists on own side
Figure 38 - Cyclist Activity (Weekday)
Figure 39 – Group Size and Demographics Activity (Weekday 08:00 – 09:00)
32
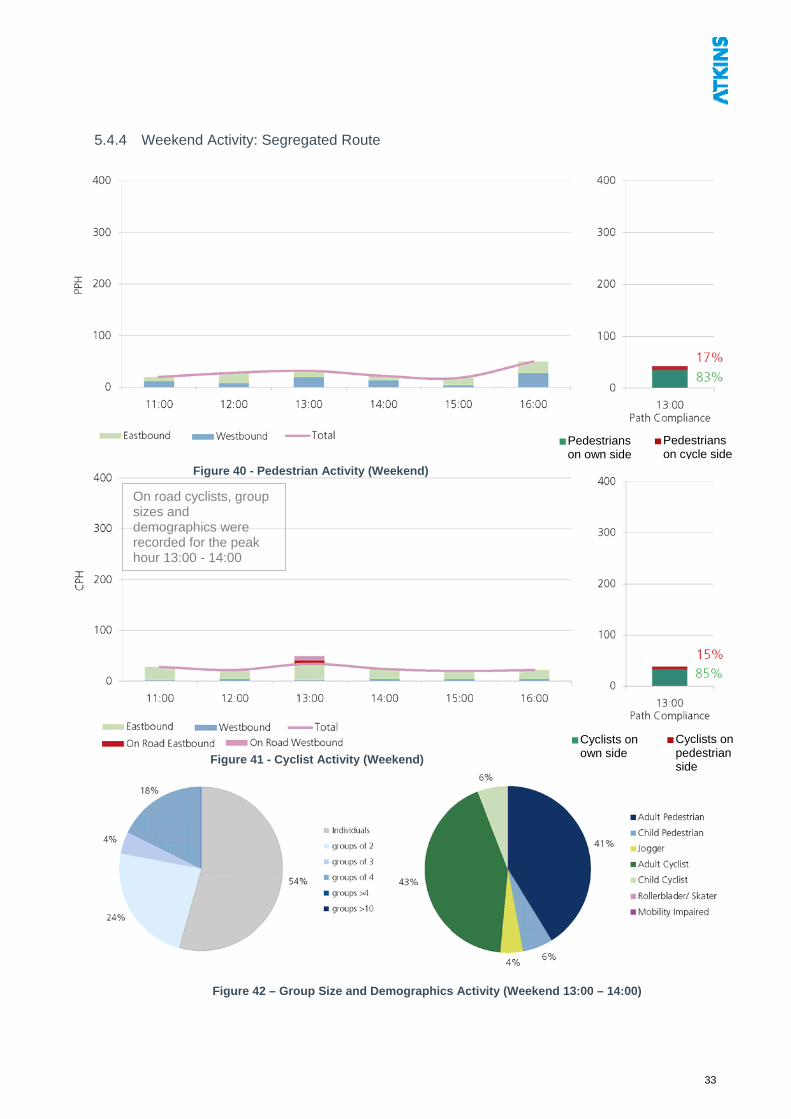
5.4.4 Weekend Activity: Segregated Route
Pedestrians on cycle
Pedestrians on own side side
Figure 40 - Pedestrian Activity (Weekend)
On road cyclists, group sizes and demographics were recorded for the peak hour 13:00 - 14:00
Cyclists on pedestrian side
Cyclists on own side Figure 41 - Cyclist Activity (Weekend)
Figure 42 – Group Size and Demographics Activity (Weekend 13:00 – 14:00)
33
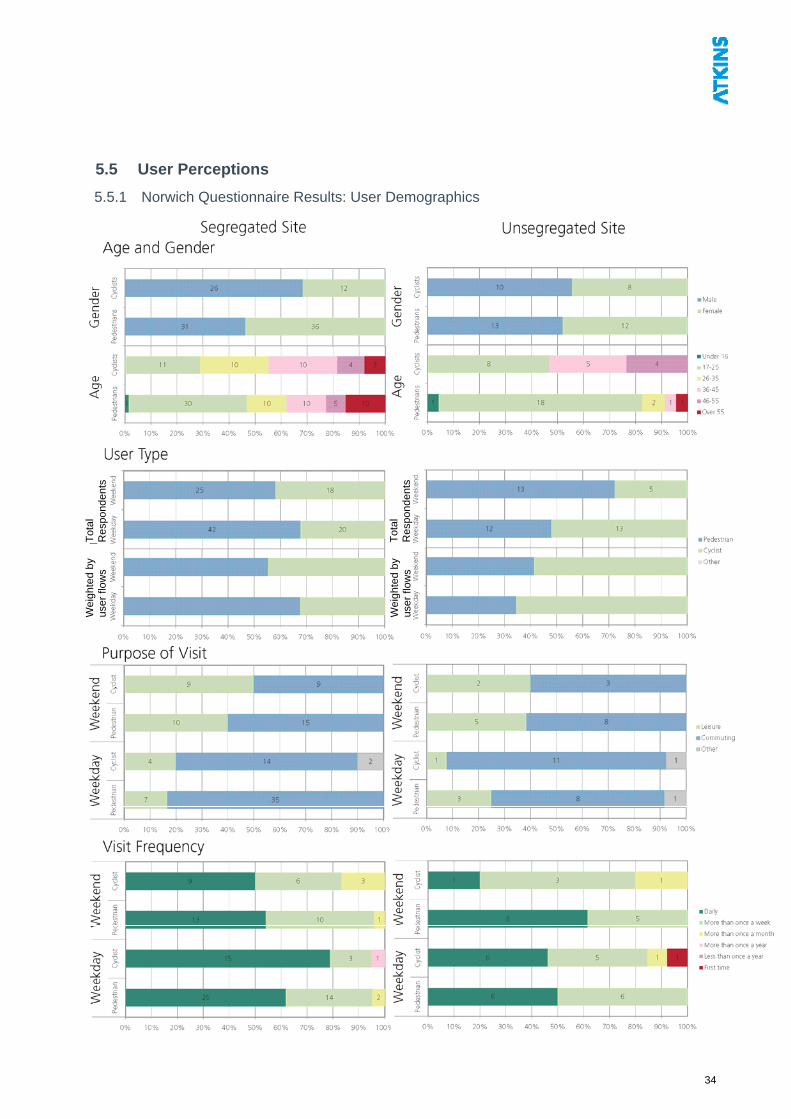
5.5 User Perceptions
5.5.1 Norwich Questionnaire Results: User Demographics
Tot
al
Res
pond
ents
Tot
al
Res
pond
ents
Wei
ghte
d by
us
er fl
ows
Wei
ghte
d by
us
er fl
ows
34
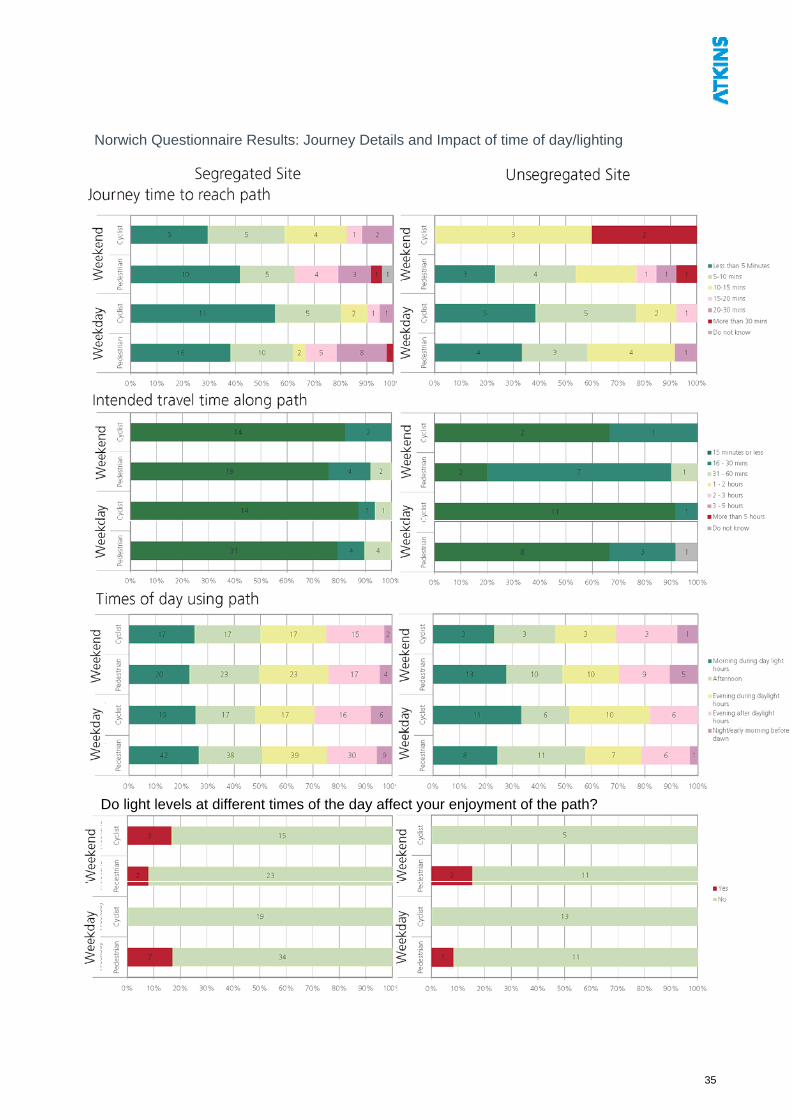
Norwich Questionnaire Results: Journey Details and Impact of time of day/lighting
Do light levels at different times of the day affect your enjoyment of the path?
35
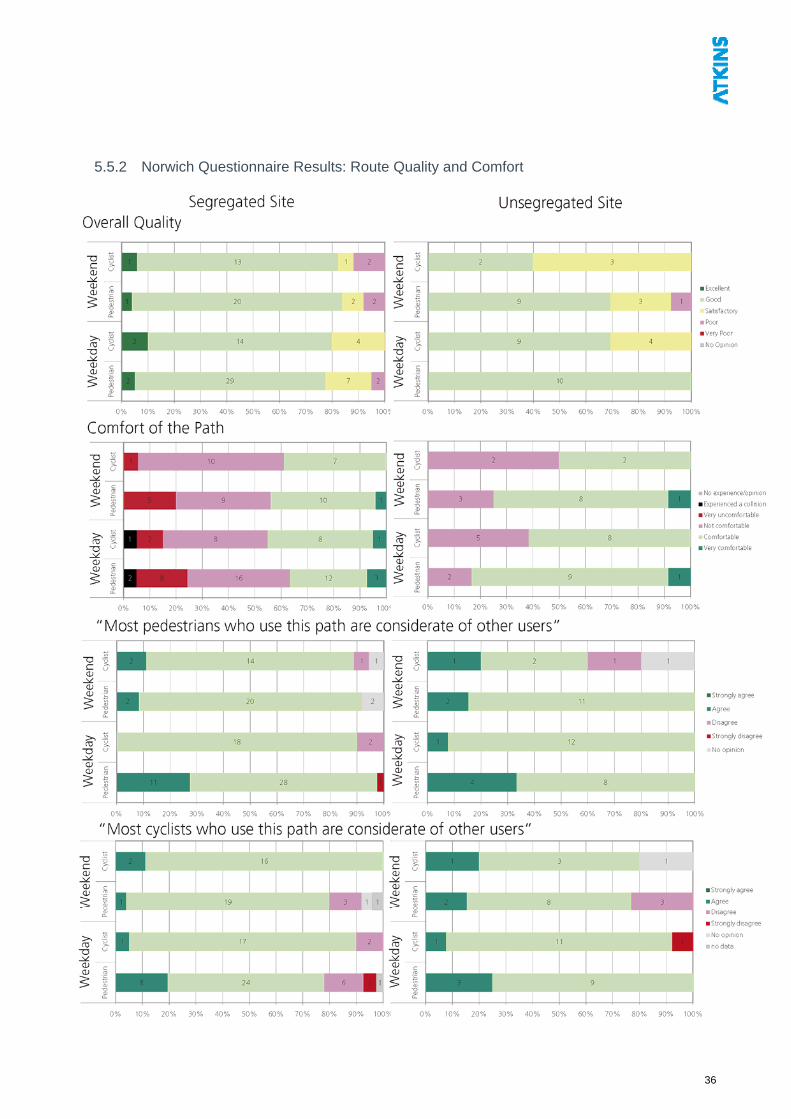
5.5.2 Norwich Questionnaire Results: Route Quality and Comfort
36
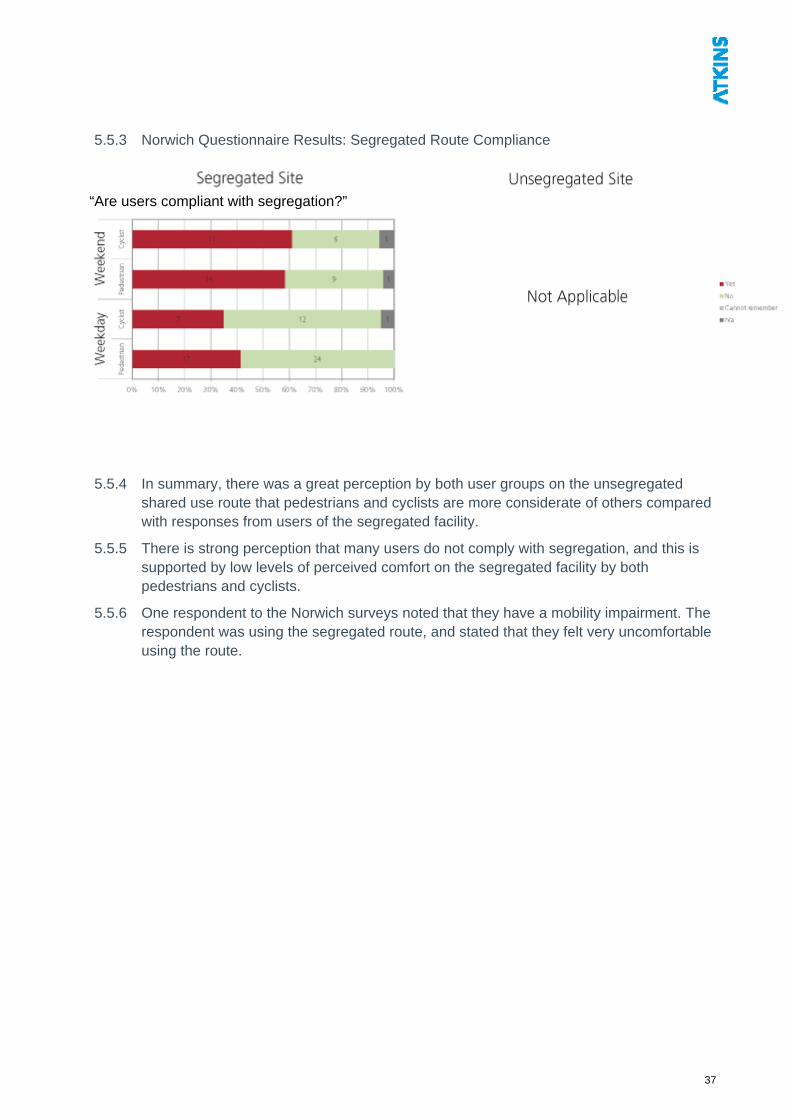
5.5.3 Norwich Questionnaire Results: Segregated Route Compliance
“Are users compliant with segregation?”
5.5.4 In summary, there was a great perception by both user groups on the unsegregated shared use route that pedestrians and cyclists are more considerate of others compared with responses from users of the segregated facility.
5.5.5 There is strong perception that many users do not comply with segregation, and this is supported by low levels of perceived comfort on the segregated facility by both pedestrians and cyclists.
5.5.6 One respondent to the Norwich surveys noted that they have a mobility impairment. The respondent was using the segregated route, and stated that they felt very uncomfortable using the route.
37
5.6 Cyclist Speeds
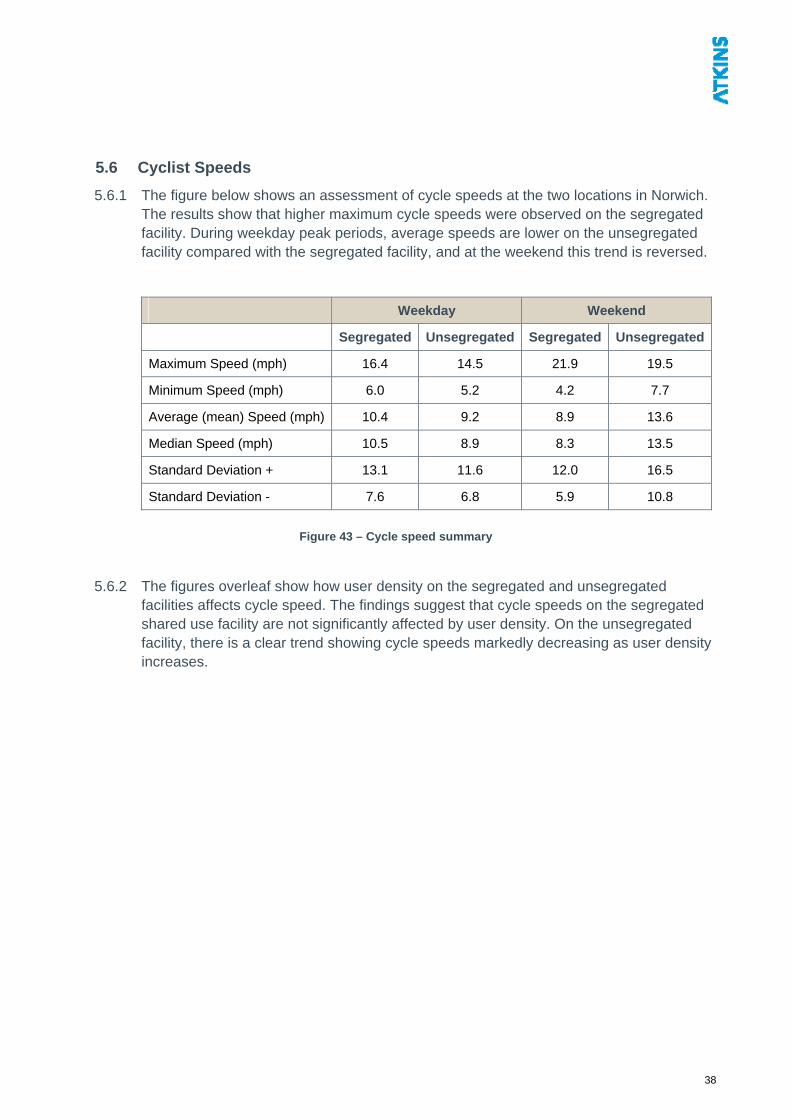
5.6.1 The figure below shows an assessment of cycle speeds at the two locations in Norwich. The results show that higher maximum cycle speeds were observed on the segregated facility. During weekday peak periods, average speeds are lower on the unsegregated facility compared with the segregated facility, and at the weekend this trend is reversed.
Weekday Weekend
Segregated Unsegregated Segregated Unsegregated
Maximum Speed (mph) 16.4 14.5 21.9 19.5
Minimum Speed (mph) 6.0 5.2 4.2 7.7
Average (mean) Speed (mph) 10.4 9.2 8.9 13.6
Median Speed (mph) 10.5 8.9 8.3 13.5
Standard Deviation + 13.1 11.6 12.0 16.5
Standard Deviation - 7.6 6.8 5.9 10.8
Figure 43 – Cycle speed summary
5.6.2 The figures overleaf show how user density on the segregated and unsegregated facilities affects cycle speed. The findings suggest that cycle speeds on the segregated shared use facility are not significantly affected by user density. On the unsegregated facility, there is a clear trend showing cycle speeds markedly decreasing as user density increases.
38
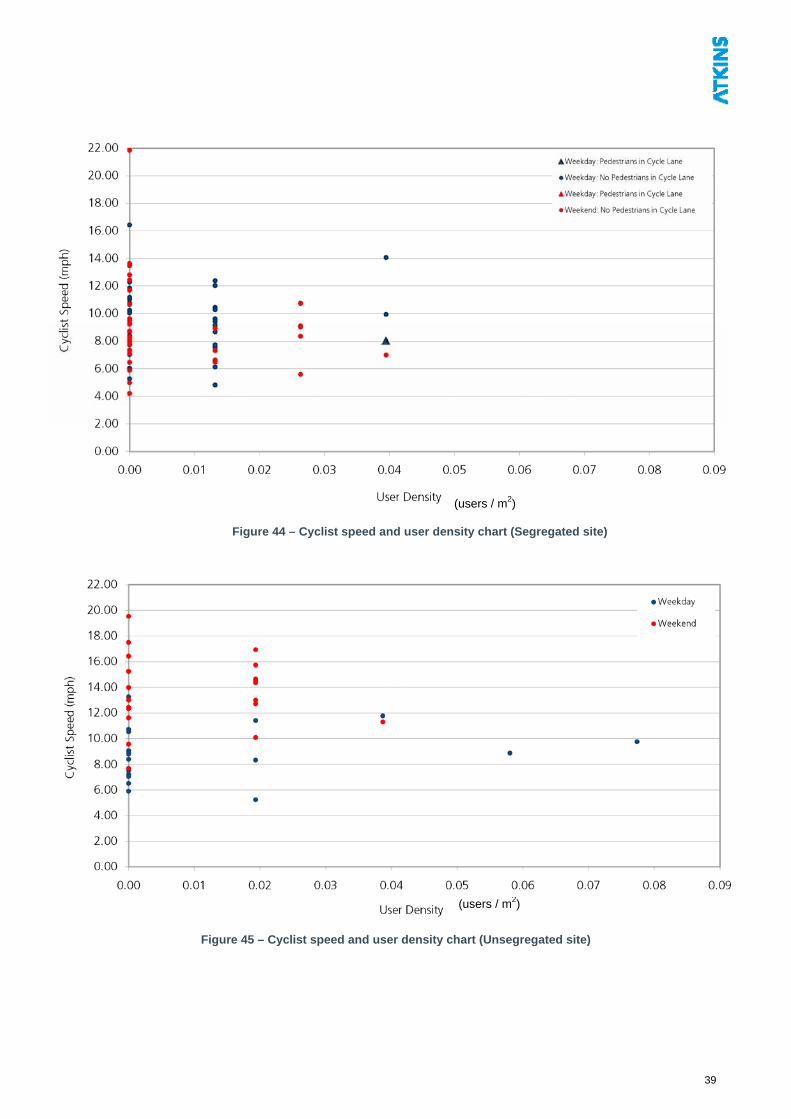
Figure 44 – Cyclist speed and user density chart (Segregated site)
(users / m2)
(users / m2)
Figure 45 – Cyclist speed and user density chart (Unsegregated site)
39
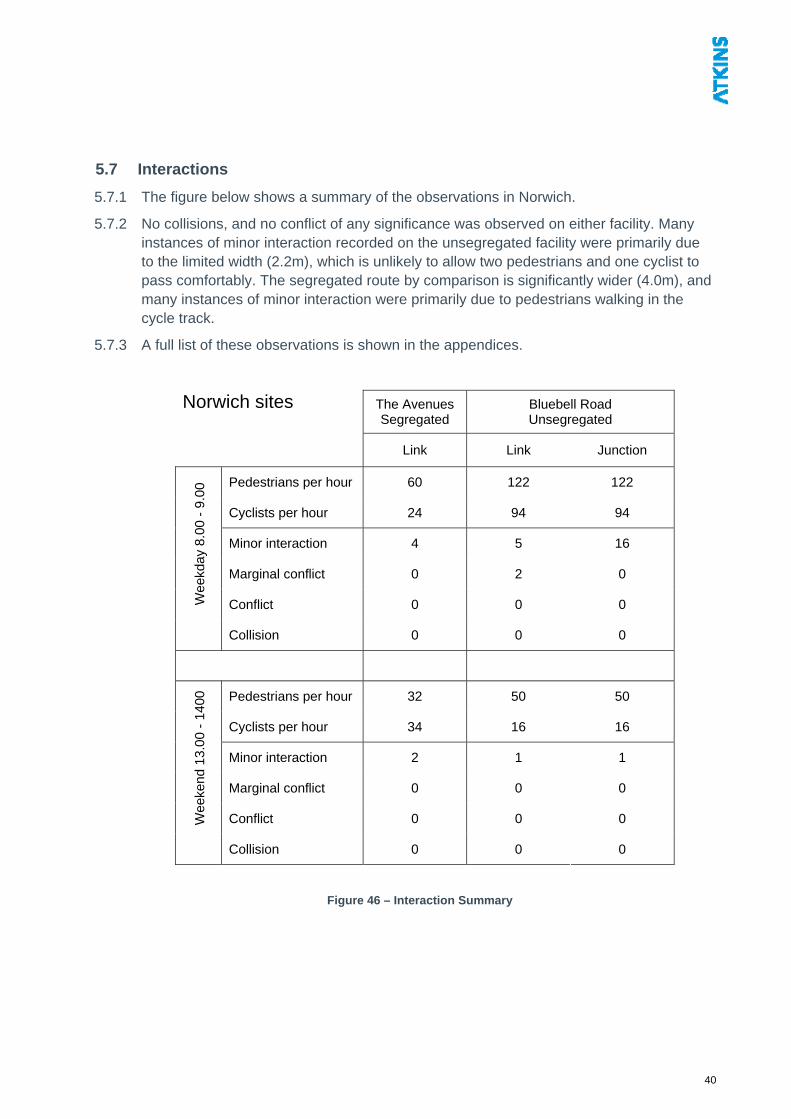
5.7 Interactions
5.7.1 The figure below shows a summary of the observations in Norwich.
5.7.2 No collisions, and no conflict of any significance was observed on either facility. Many instances of minor interaction recorded on the unsegregated facility were primarily due to the limited width (2.2m), which is unlikely to allow two pedestrians and one cyclist to pass comfortably. The segregated route by comparison is significantly wider (4.0m), and many instances of minor interaction were primarily due to pedestrians walking in the cycle track.
5.7.3 A full list of these observations is shown in the appendices.
Norwich sites The Avenues Segregated
Bluebell Road Unsegregated
Link Link Junction
Pedestrians per hour 60 122 122
Cyclists per hour 24 94 94
Minor interaction 4 5 16
Marginal conflict 0 2 0
Conflict 0 0 0 Wee
kday
8.0
0 -
9.00
Collision 0 0 0
Pedestrians per hour 32 50 50
Cyclists per hour 34 16 16
Minor interaction 2 1 1
Marginal conflict 0 0 0
Conflict 0 0 0 Wee
kend
13.
00 -
140
0
Collision 0 0 0
Figure 46 – Interaction Summary
40
6. Support Site – Bristol
6.1 Location
6.1.1 Cattle Market Road, link section, north-east of Bath Bridge Roundabout. The eastern side is segregated shared use. No footway on southern side.
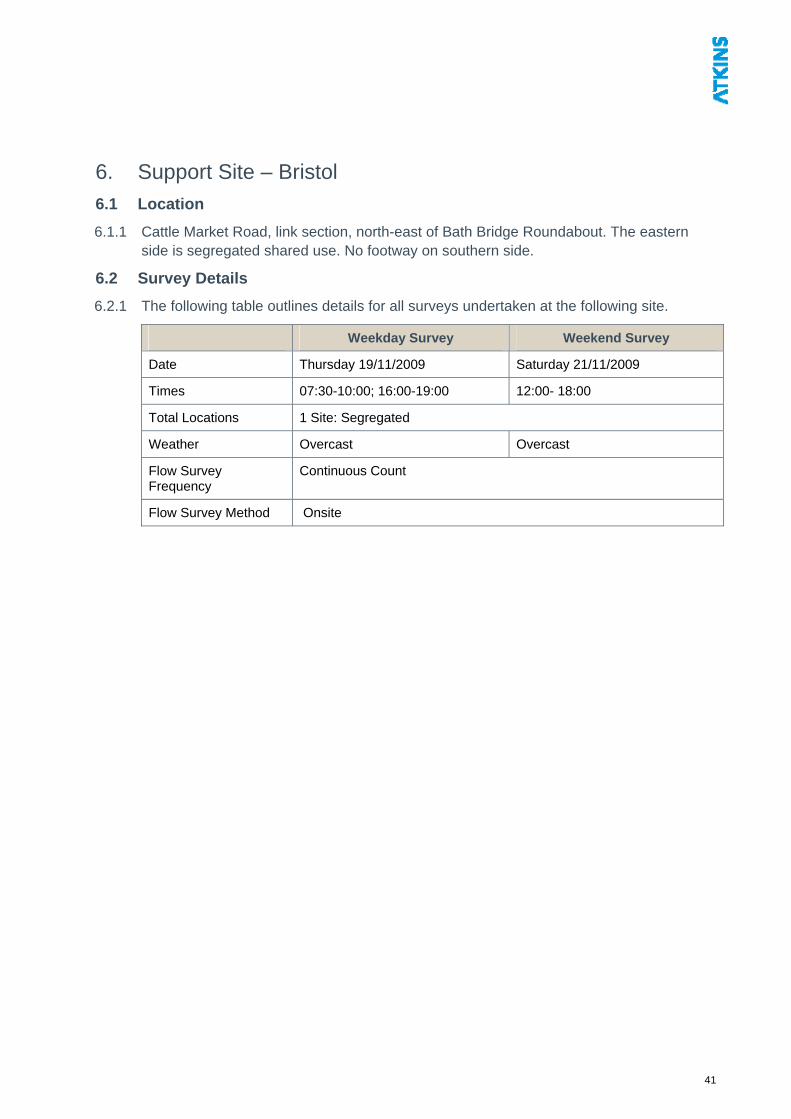
6.2 Survey Details
6.2.1 The following table outlines details for all surveys undertaken at the following site.
Weekday Survey Weekend Survey
Date Thursday 19/11/2009 Saturday 21/11/2009
Times 07:30-10:00; 16:00-19:00 12:00- 18:00
Total Locations 1 Site: Segregated
Weather Overcast Overcast
Flow Survey Frequency
Continuous Count
Flow Survey Method Onsite
41
6.3 Design Characteristics
Category Description
Route context Cattle Market Road, link section, north-east of Bath Bridge Roundabout.
Cycle track type Single cycle track segregated from pedestrian space by raised white line. Cycle track is immediately adjacent to road.
Approximate width Footway <1.5m and cycle track <1.5m
Crossfall on a typical section
Negligible.
Bounding Roadside bounded by kerb. Building side bounded by continuous wall of building edge.
Surface Tarmac in average condition.
Gradient Slight.
Sightlines Clear sightlines with no obstructions
Maintenance Route shows signs of degradation.
Key Land uses Urban town centre land use
Comments None
Figure 47 – Design Characteristic Assessment Table - Bristol
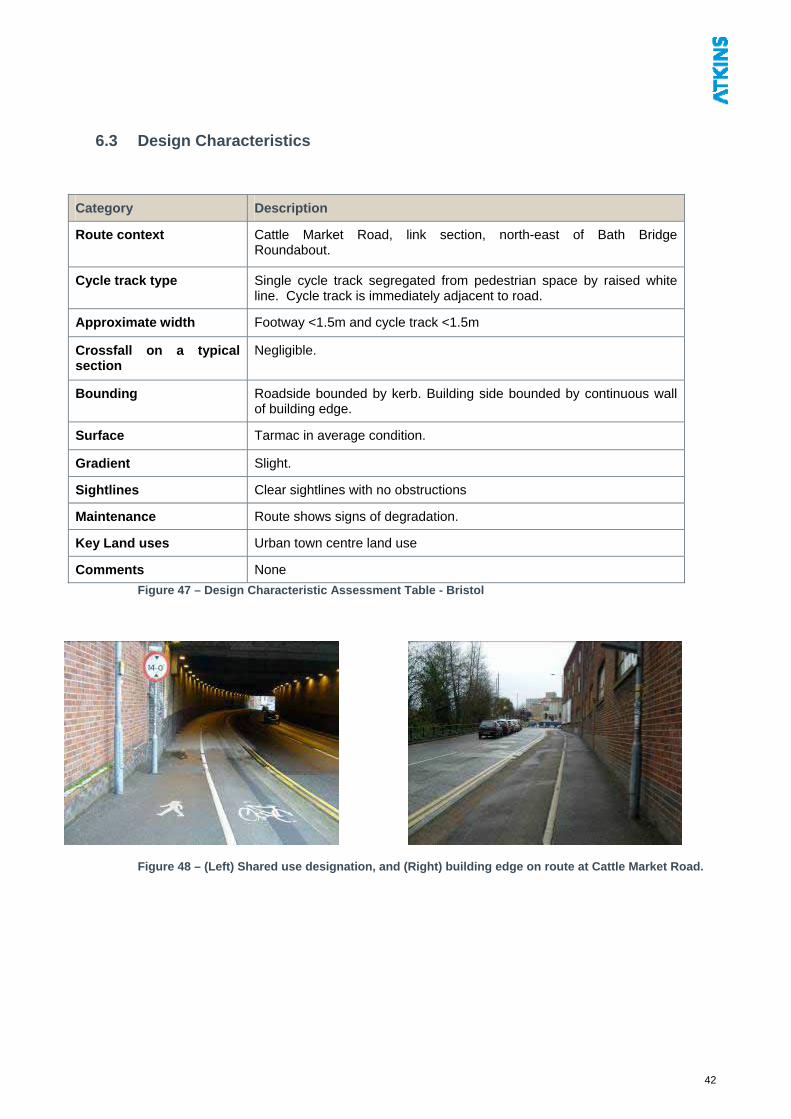
Figure 48 – (Left) Shared use designation, and (Right) building edge on route at Cattle Market Road.
42
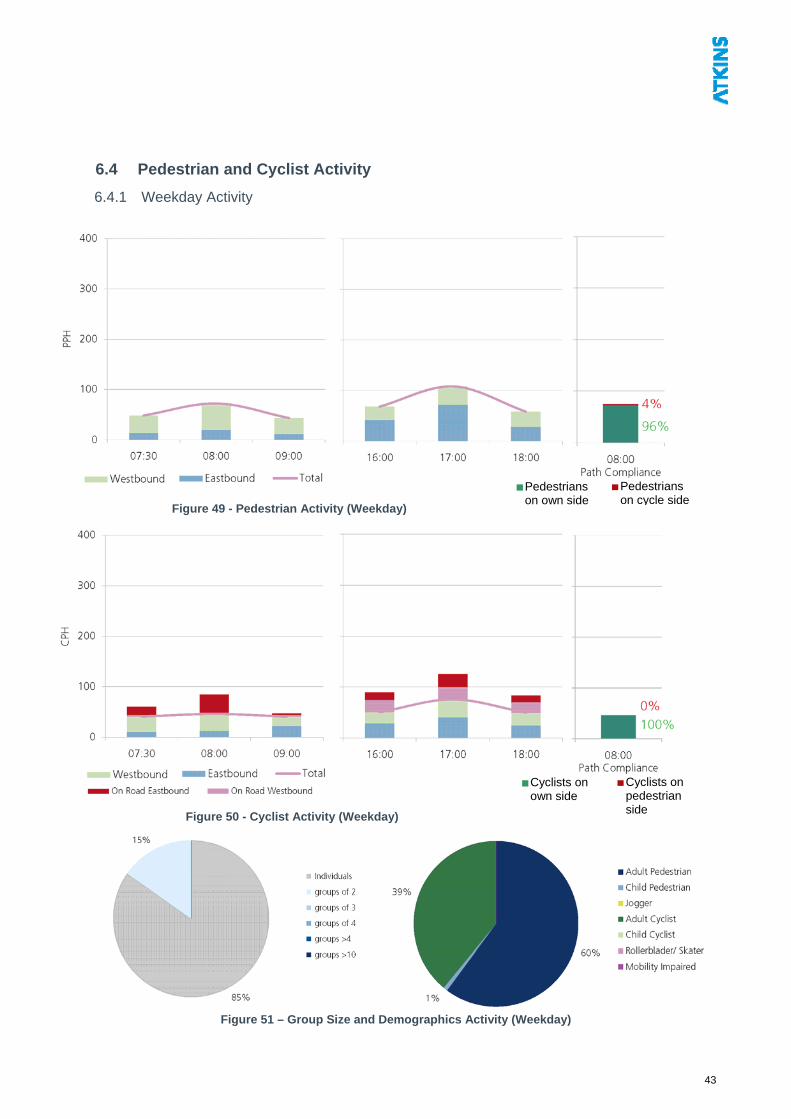
6.4 Pedestrian and Cyclist Activity
6.4.1 Weekday Activity
Pedestrians on cycle
Pedestrians on own side side
Figure 49 - Pedestrian Activity (Weekday)
Cyclists on pedestrian side
Cyclists on own side
Figure 50 - Cyclist Activity (Weekday)
Figure 51 – Group Size and Demographics Activity (Weekday)
43
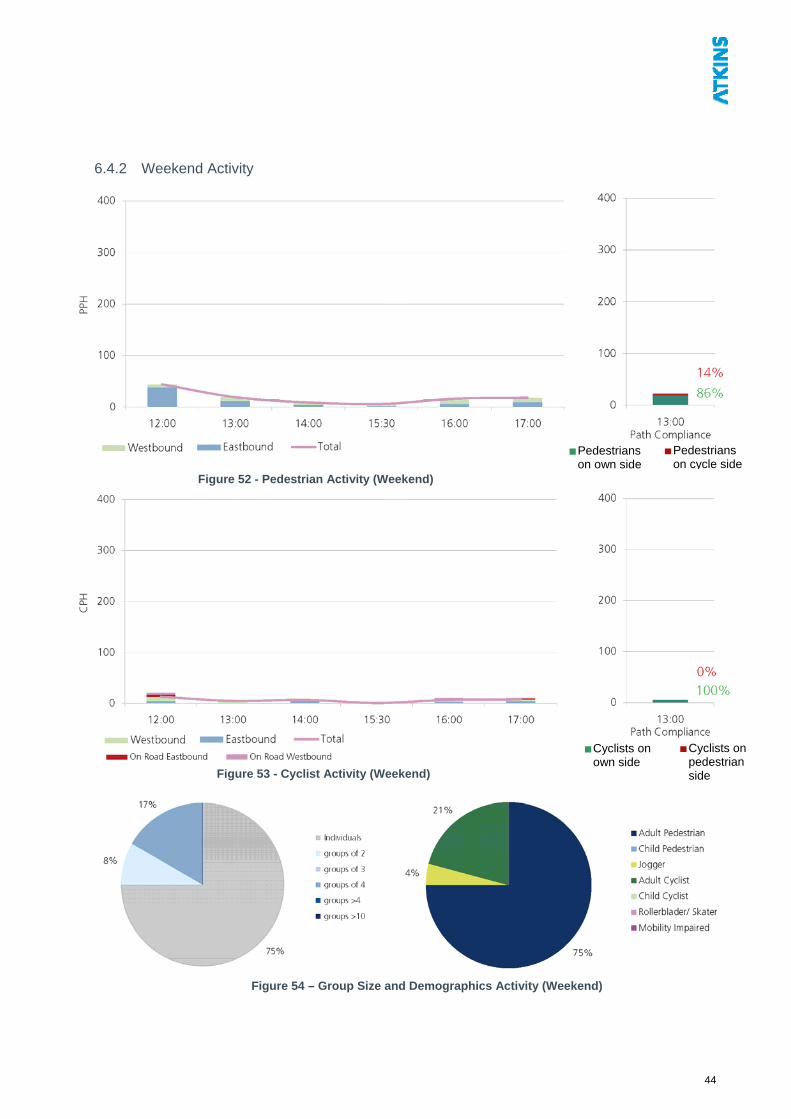
6.4.2 Weekend Activity
Pedestrians on cycle
Pedestrians on own side side
Figure 52 - Pedestrian Activity (Weekend)
Cyclists on pedestrian side
Cyclists on own side
Figure 53 - Cyclist Activity (Weekend)
Figure 54 – Group Size and Demographics Activity (Weekend)
44
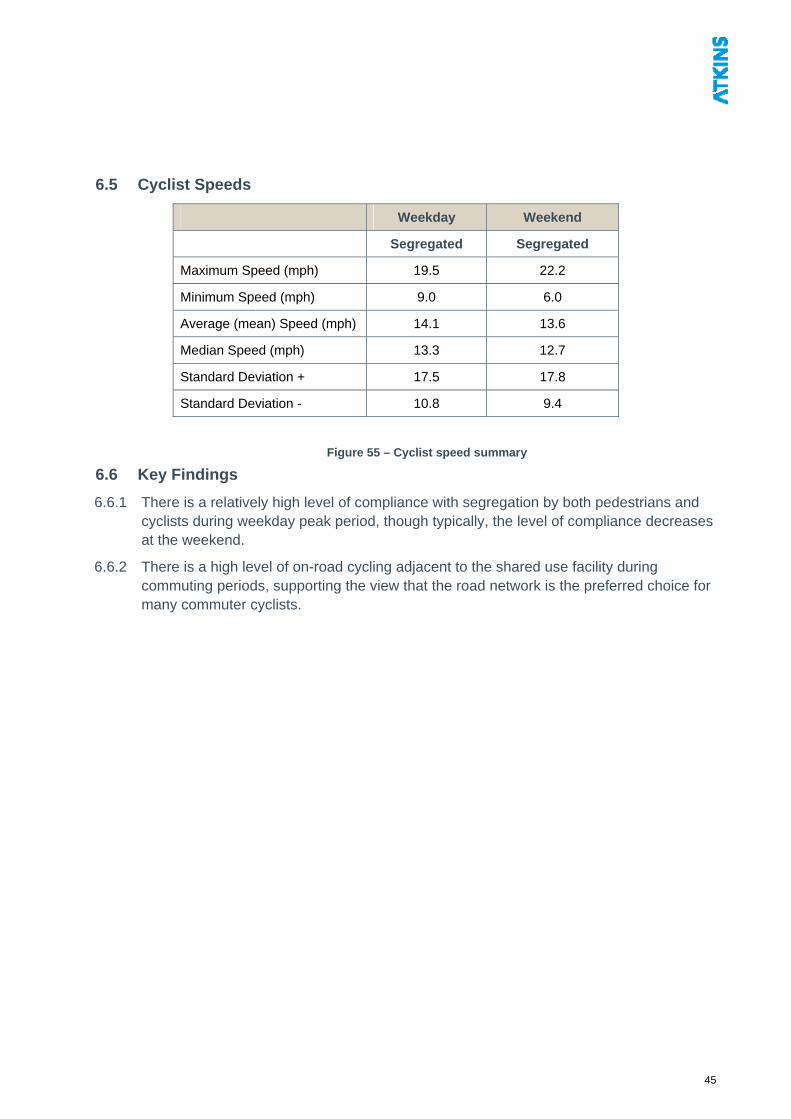
6.5 Cyclist Speeds
Weekday Weekend
Segregated Segregated
Maximum Speed (mph) 19.5 22.2
Minimum Speed (mph) 9.0 6.0
Average (mean) Speed (mph) 14.1 13.6
Median Speed (mph) 13.3 12.7
Standard Deviation + 17.5 17.8
Standard Deviation - 10.8 9.4
Figure 55 – Cyclist speed summary
6.6 Key Findings
6.6.1 There is a relatively high level of compliance with segregation by both pedestrians and cyclists during weekday peak period, though typically, the level of compliance decreases at the weekend.
6.6.2 There is a high level of on-road cycling adjacent to the shared use facility during commuting periods, supporting the view that the road network is the preferred choice for many commuter cyclists.
45
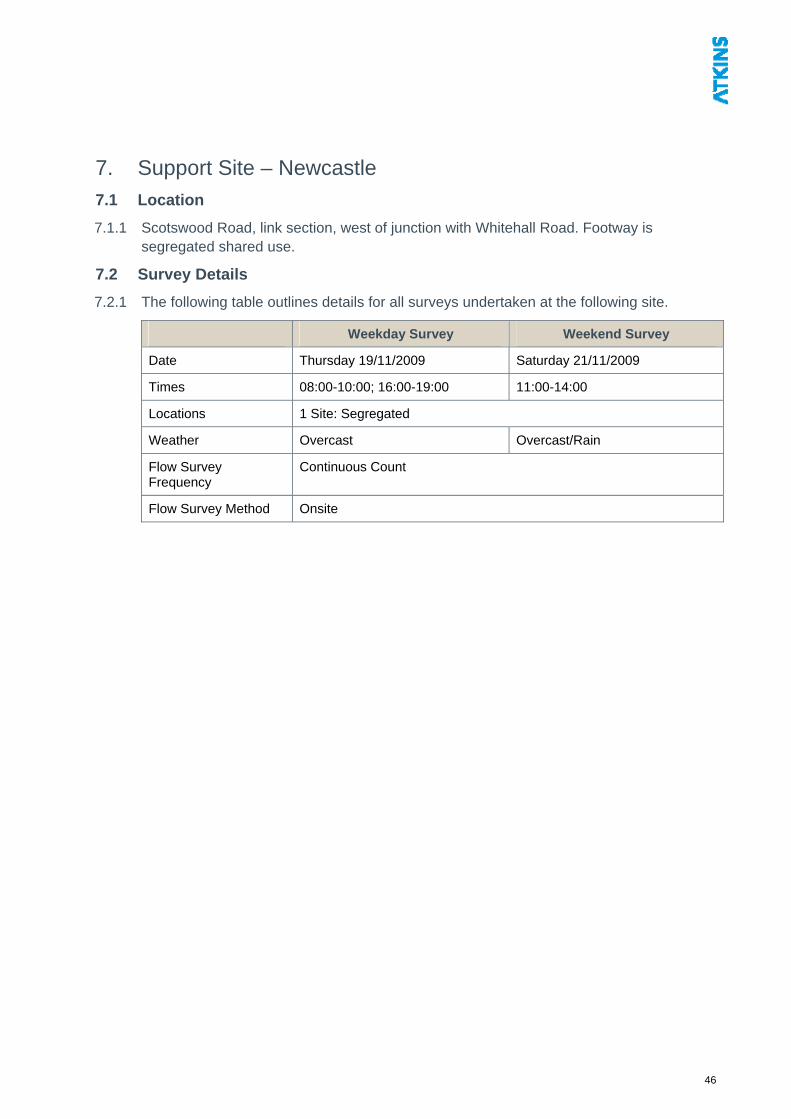
7. Support Site – Newcastle
7.1 Location
7.1.1 Scotswood Road, link section, west of junction with Whitehall Road. Footway is segregated shared use.
7.2 Survey Details
7.2.1 The following table outlines details for all surveys undertaken at the following site.
Weekday Survey Weekend Survey
Date Thursday 19/11/2009 Saturday 21/11/2009
Times 08:00-10:00; 16:00-19:00 11:00-14:00
Locations 1 Site: Segregated
Weather Overcast Overcast/Rain
Flow Survey Frequency
Continuous Count
Flow Survey Method Onsite
46
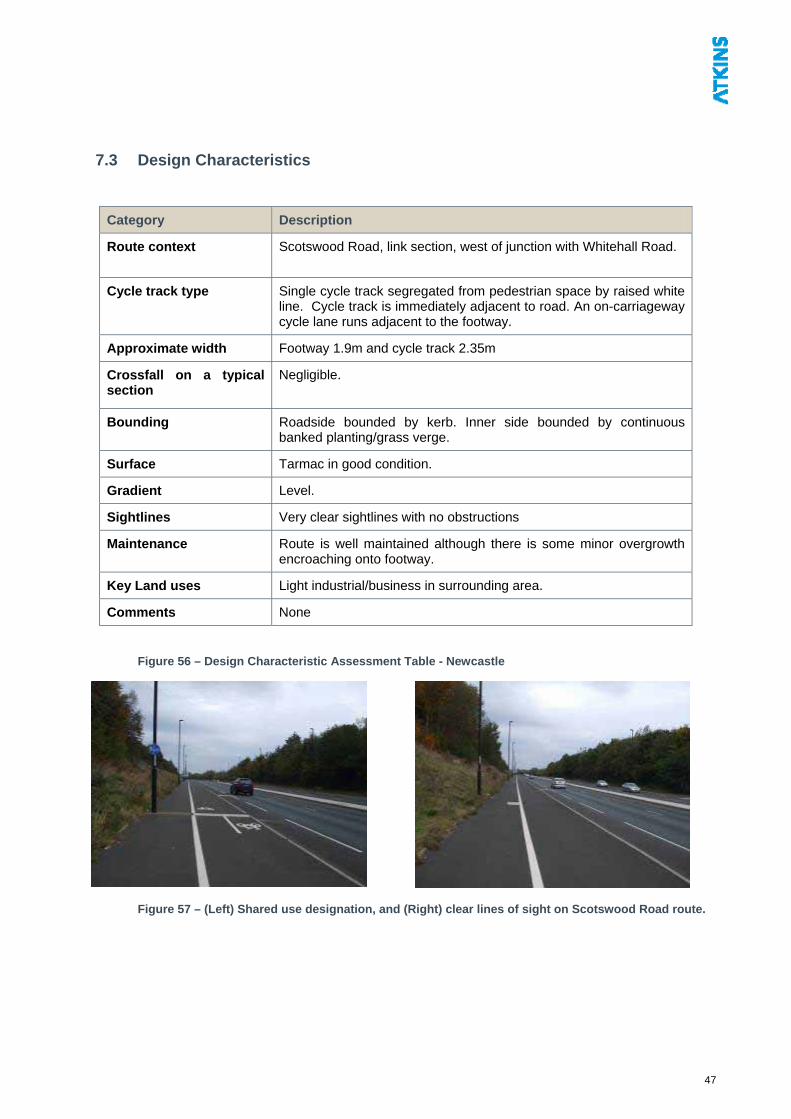
7.3 Design Characteristics
Figure 56 – Design Characteristic Assessment Table - Newcastle
Figure 57 – (Left) Shared use designation, and (Right) clear lines of sight on Scotswood Road route.
Category Description
Route context Scotswood Road, link section, west of junction with Whitehall Road.
Cycle track type Single cycle track segregated from pedestrian space by raised white line. Cycle track is immediately adjacent to road. An on-carriageway cycle lane runs adjacent to the footway.
Approximate width Footway 1.9m and cycle track 2.35m
Crossfall on a typical section
Negligible.
Bounding Roadside bounded by kerb. Inner side bounded by continuous banked planting/grass verge.
Surface Tarmac in good condition.
Gradient Level.
Sightlines Very clear sightlines with no obstructions
Maintenance Route is well maintained although there is some minor overgrowth encroaching onto footway.
Key Land uses Light industrial/business in surrounding area.
Comments None
47
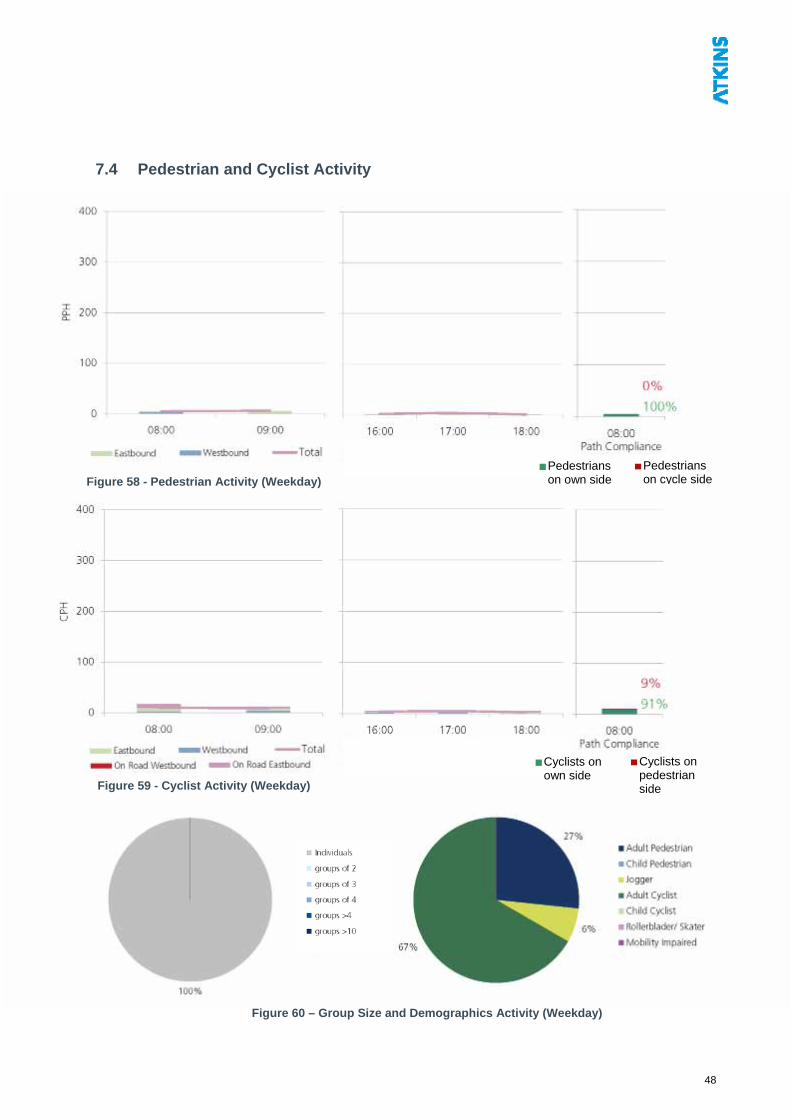
7.4 Pedestrian and Cyclist Activity
Pedestrians on cycle s
Pedestrians on own side ideFigure 58 - Pedestrian Activity (Weekday)
Cyclists on pedestrian side
Cyclists on own side
Figure 59 - Cyclist Activity (Weekday)
Figure 60 – Group Size and Demographics Activity (Weekday)
48
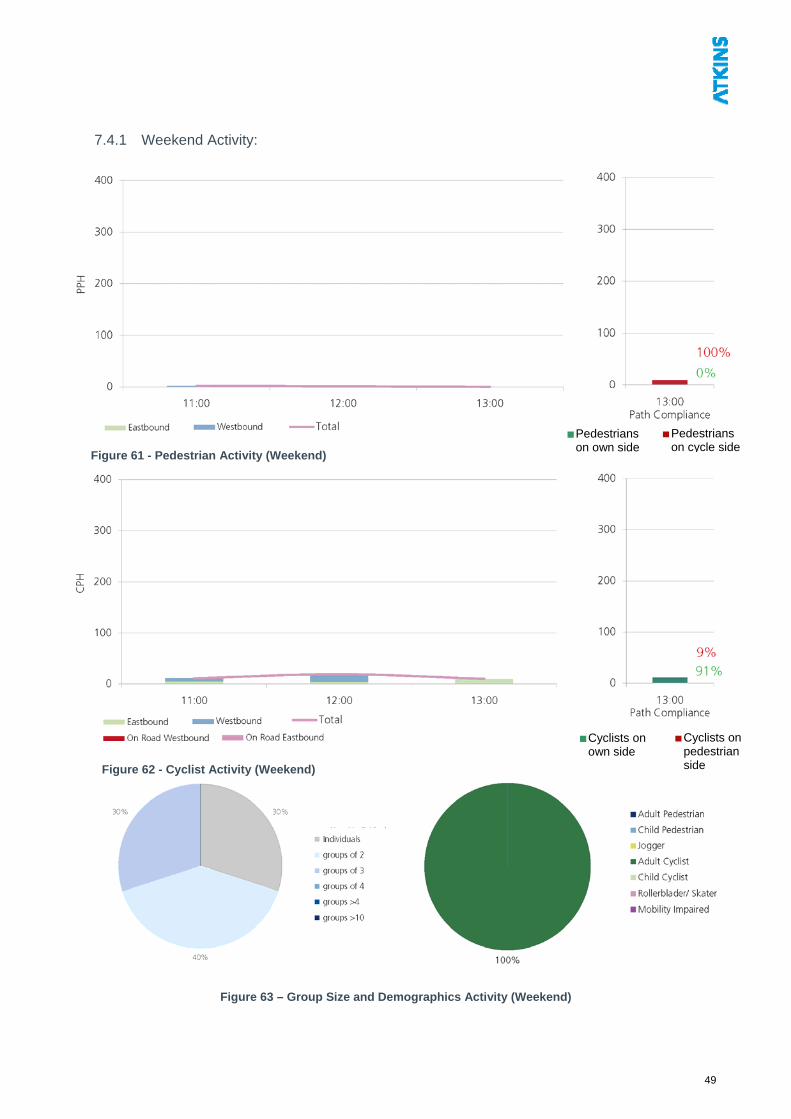
7.4.1 Weekend Activity:
Figure 61 - Pedestrian Activity (Weekend)
Figure 62 - Cyclist Activity (Weekend)
Figure 63 – Group Size and Demographics Activity (Weekend)
Cyclists on own side
Pedestrians on cycle s
Pedestrians on own side ide
Cyclists on pedestrian side
49
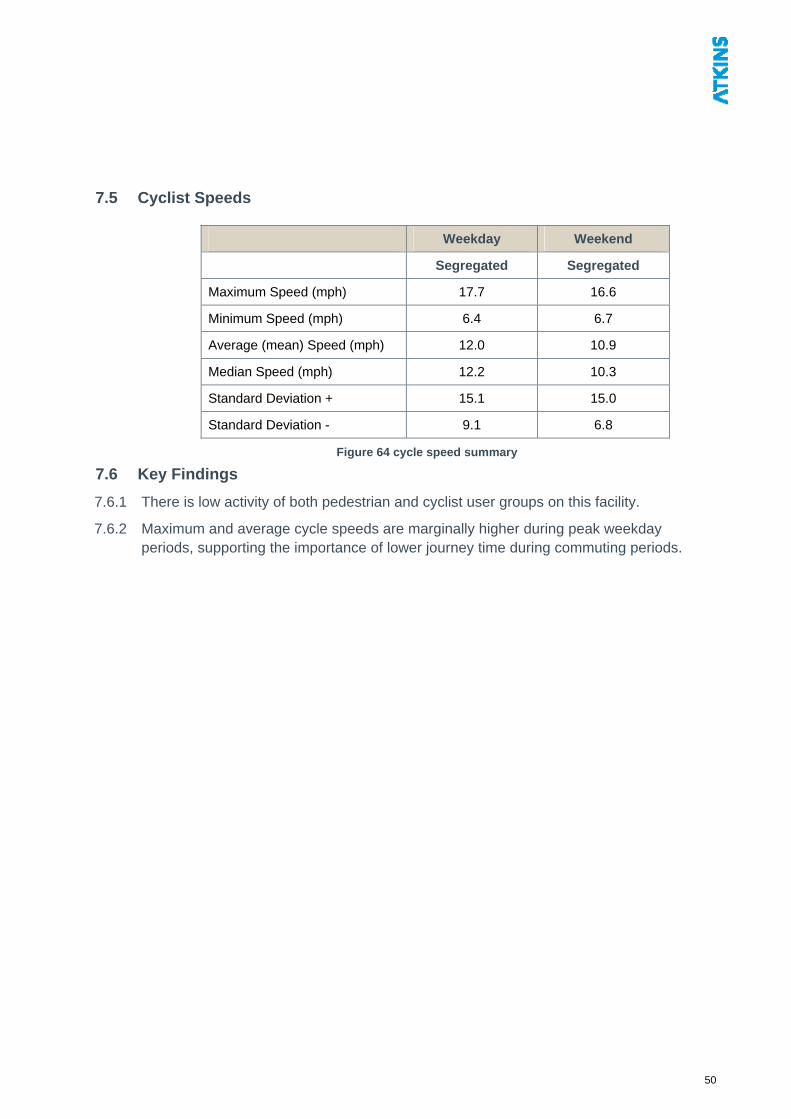
7.5 Cyclist Speeds
Weekday Weekend
Segregated Segregated
Maximum Speed (mph) 17.7 16.6
Minimum Speed (mph) 6.4 6.7
Average (mean) Speed (mph) 12.0 10.9
Median Speed (mph) 12.2 10.3
Standard Deviation + 15.1 15.0
Standard Deviation - 9.1 6.8
Figure 64 cycle speed summary
7.6 Key Findings
7.6.1 There is low activity of both pedestrian and cyclist user groups on this facility.
7.6.2 Maximum and average cycle speeds are marginally higher during peak weekday periods, supporting the importance of lower journey time during commuting periods.
50
8. Support Site – Peterborough
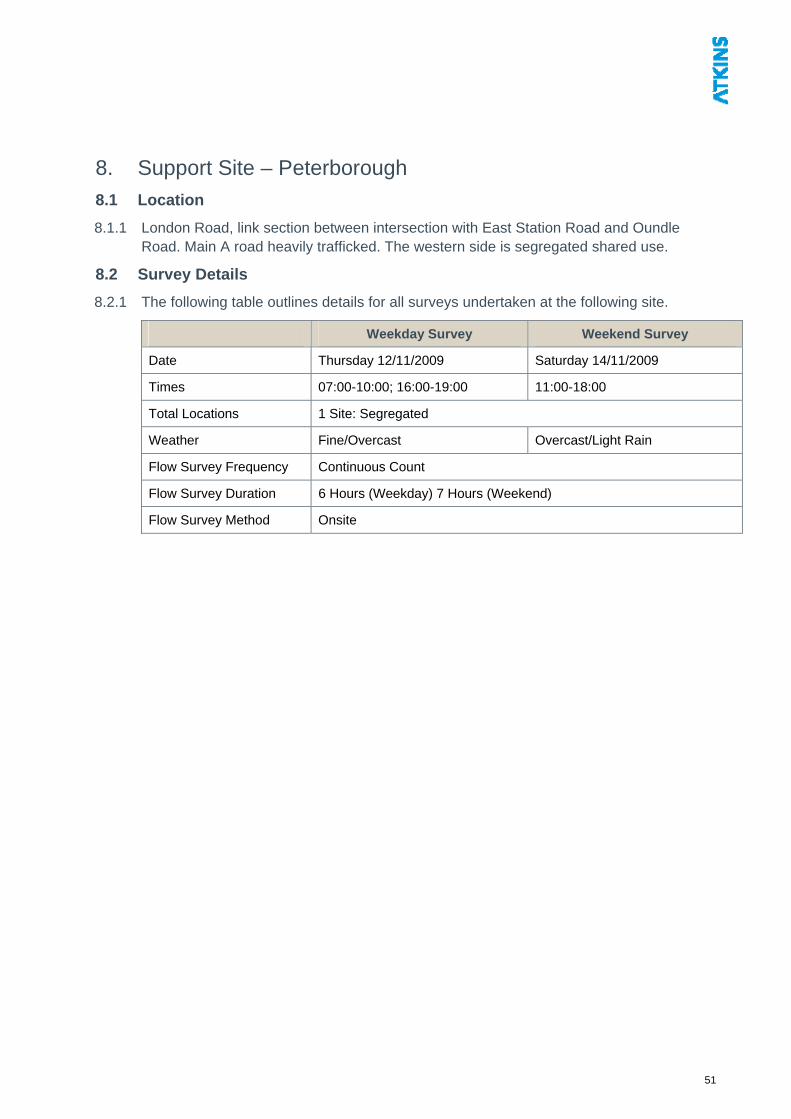
8.1 Location
8.1.1 London Road, link section between intersection with East Station Road and Oundle Road. Main A road heavily trafficked. The western side is segregated shared use.
8.2 Survey Details
8.2.1 The following table outlines details for all surveys undertaken at the following site.
Weekday Survey Weekend Survey
Date Thursday 12/11/2009 Saturday 14/11/2009
Times 07:00-10:00; 16:00-19:00 11:00-18:00
Total Locations 1 Site: Segregated
Weather Fine/Overcast Overcast/Light Rain
Flow Survey Frequency Continuous Count
Flow Survey Duration 6 Hours (Weekday) 7 Hours (Weekend)
Flow Survey Method Onsite
51
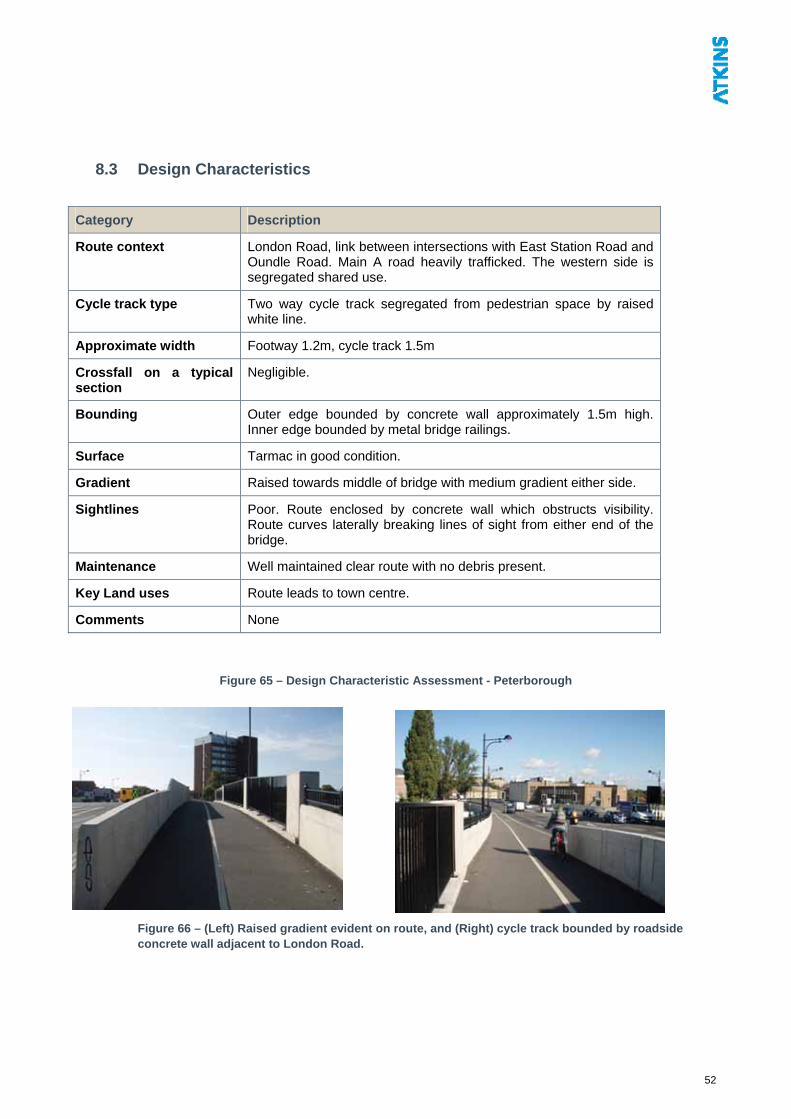
8.3 Design Characteristics
Category Description
Route context London Road, link between intersections with East Station Road and Oundle Road. Main A road heavily trafficked. The western side is segregated shared use.
Cycle track type Two way cycle track segregated from pedestrian space by raised white line.
Approximate width Footway 1.2m, cycle track 1.5m
Crossfall on a typical section
Negligible.
Bounding Outer edge bounded by concrete wall approximately 1.5m high. Inner edge bounded by metal bridge railings.
Surface Tarmac in good condition.
Gradient Raised towards middle of bridge with medium gradient either side.
Sightlines Poor. Route enclosed by concrete wall which obstructs visibility. Route curves laterally breaking lines of sight from either end of the bridge.
Maintenance Well maintained clear route with no debris present.
Key Land uses Route leads to town centre.
Comments None
Figure 65 – Design Characteristic Assessment - Peterborough
Figure 66 – (Left) Raised gradient evident on route, and (Right) cycle track bounded by roadside concrete wall adjacent to London Road.
52
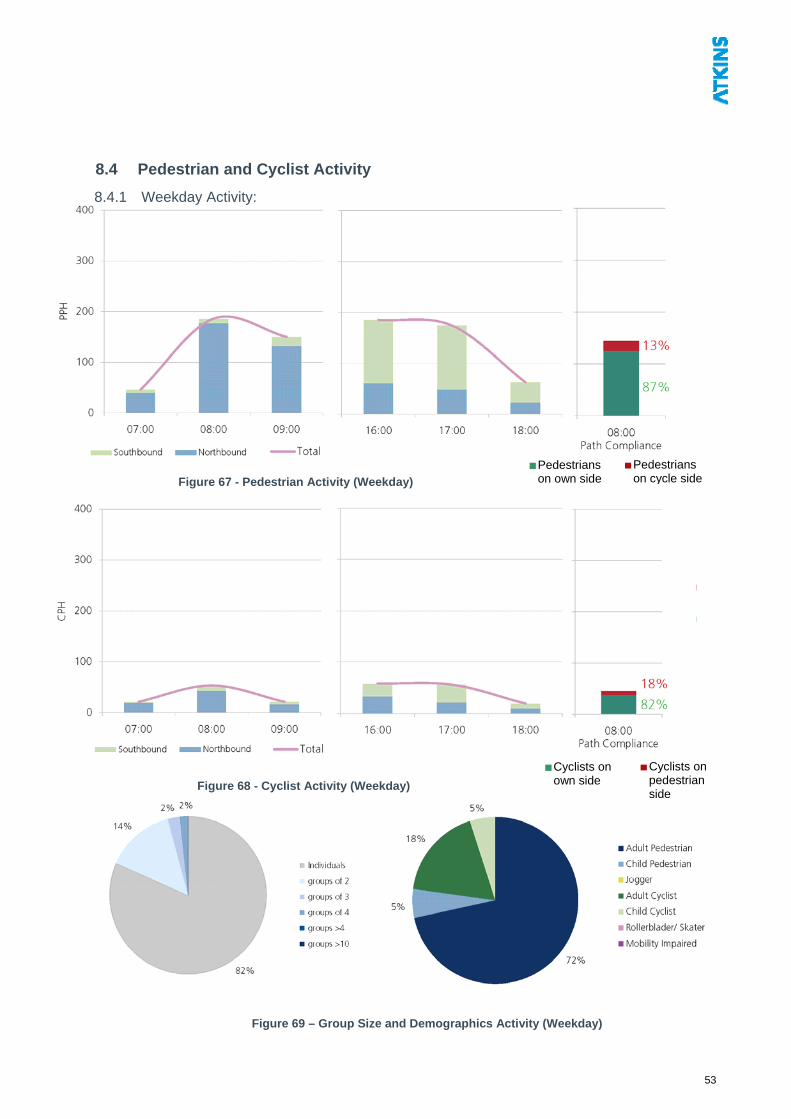
8.4 Pedestrian and Cyclist Activity
8.4.1 Weekday Activity:
Pedestrians
on cycle Pedestrians on own side sideFigure 67 - Pedestrian Activity (Weekday)
Cyclists on pedestrian side
Cyclists on own side Figure 68 - Cyclist Activity (Weekday)
Figure 69 – Group Size and Demographics Activity (Weekday)
53
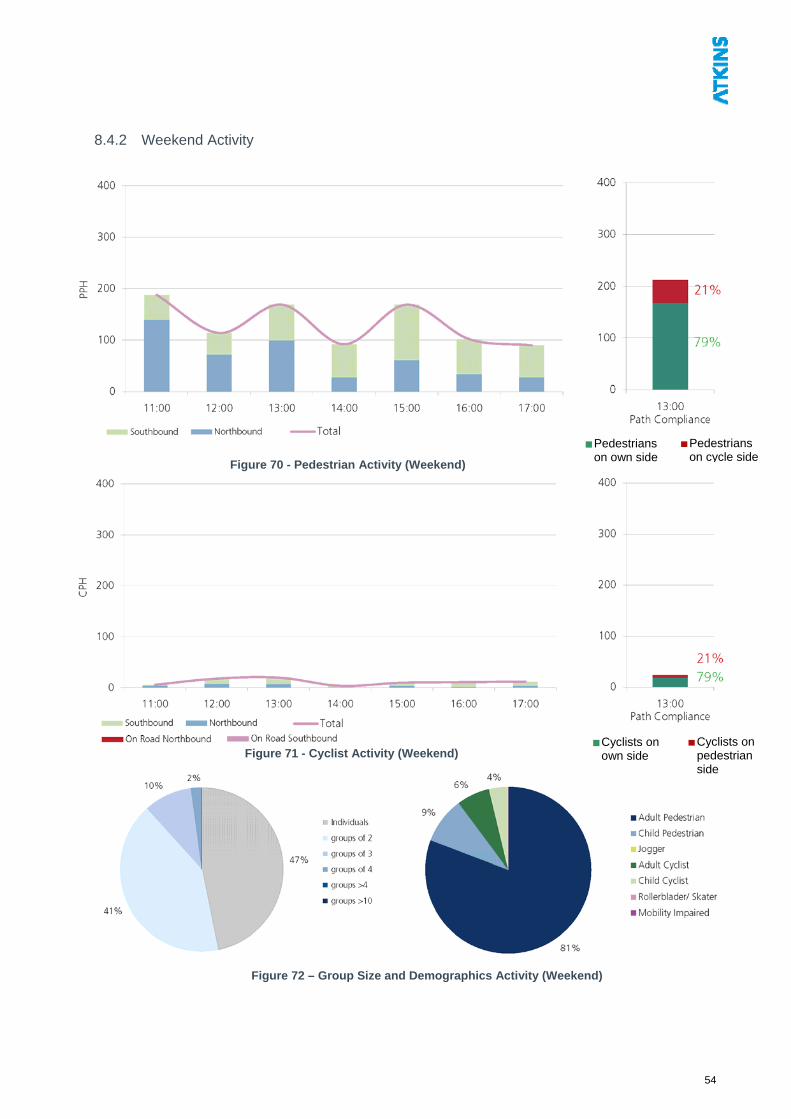
8.4.2 Weekend Activity
Pedestrians on cycle
Pedestrians on own side side
Figure 70 - Pedestrian Activity (Weekend)
Cyclists on pedestrian side
Cyclists on own side Figure 71 - Cyclist Activity (Weekend)
Figure 72 – Group Size and Demographics Activity (Weekend)
54
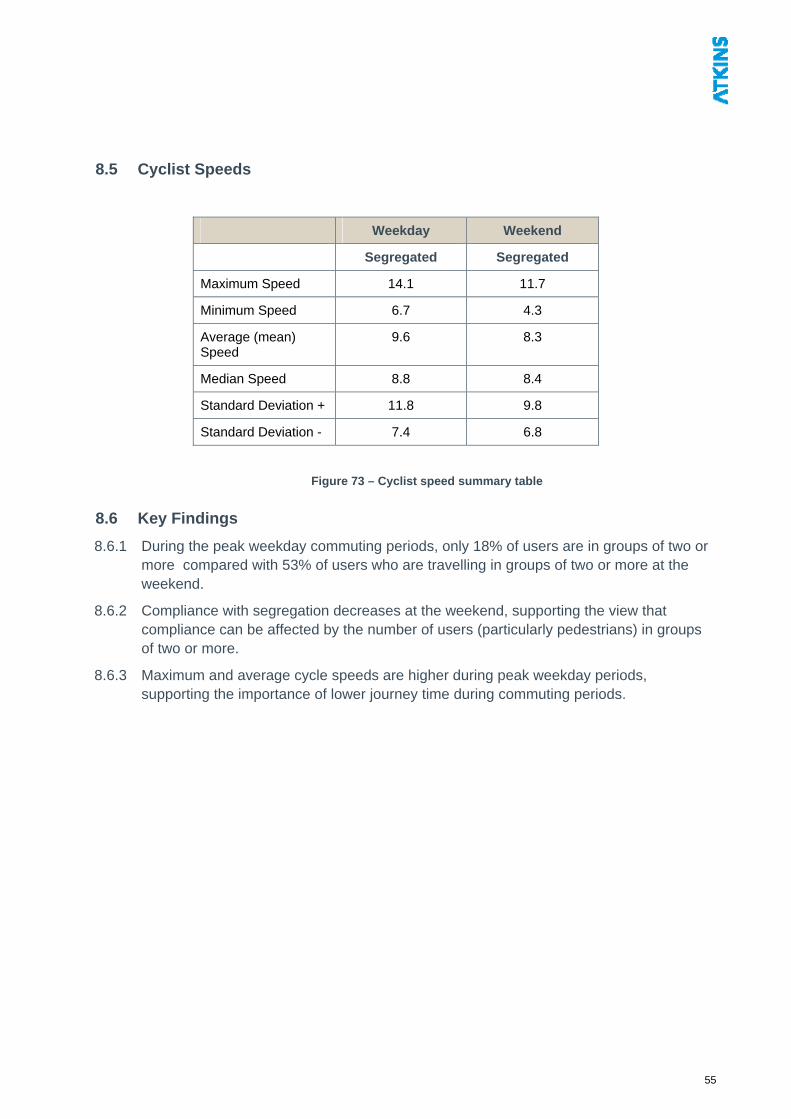
8.5 Cyclist Speeds
Weekday Weekend
Segregated Segregated
Maximum Speed 14.1 11.7
Minimum Speed 6.7 4.3
Average (mean) Speed
9.6 8.3
Median Speed 8.8 8.4
Standard Deviation + 11.8 9.8
Standard Deviation - 7.4 6.8
Figure 73 – Cyclist speed summary table
8.6 Key Findings
8.6.1 During the peak weekday commuting periods, only 18% of users are in groups of two or more compared with 53% of users who are travelling in groups of two or more at the weekend.
8.6.2 Compliance with segregation decreases at the weekend, supporting the view that compliance can be affected by the number of users (particularly pedestrians) in groups of two or more.
8.6.3 Maximum and average cycle speeds are higher during peak weekday periods, supporting the importance of lower journey time during commuting periods.
55
9. Support Site – York
9.1 Location
9.1.1 Hull Road, linear section between intersection with Tang Hall Lane and Carlton Avenue. Main A road heavily trafficked. The northern side is segregated shared use.
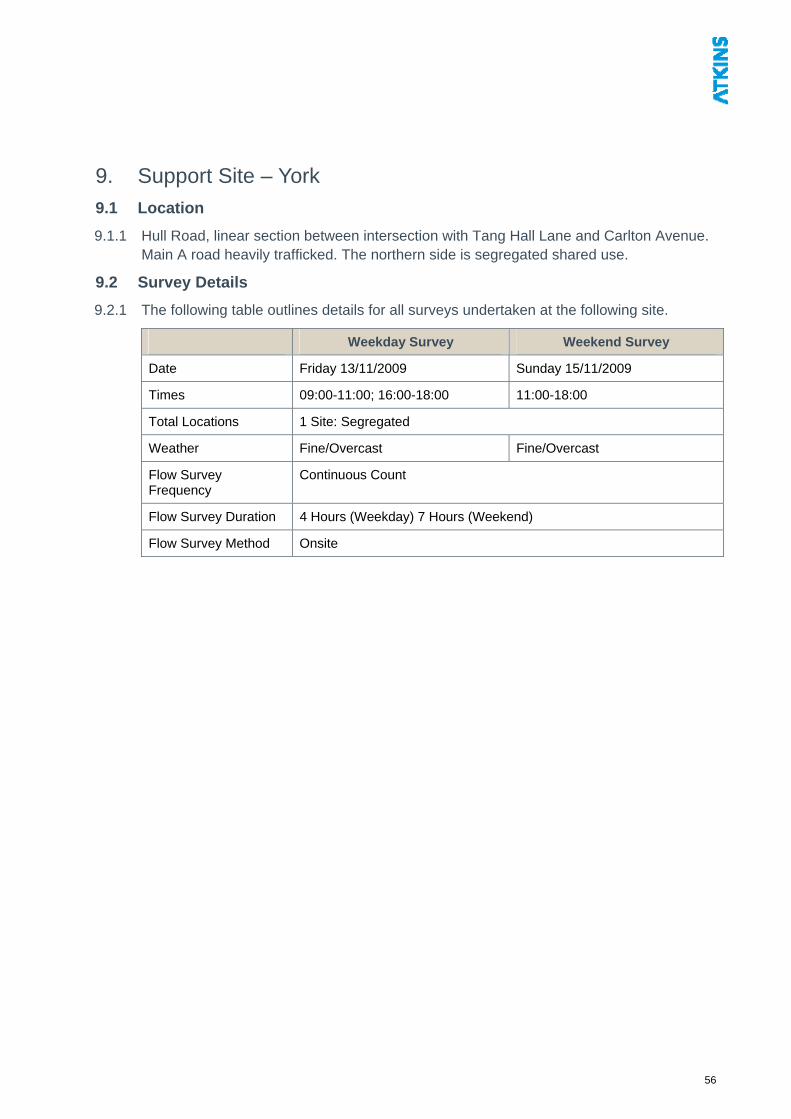
9.2 Survey Details
9.2.1 The following table outlines details for all surveys undertaken at the following site.
Weekday Survey Weekend Survey
Date Friday 13/11/2009 Sunday 15/11/2009
Times 09:00-11:00; 16:00-18:00 11:00-18:00
Total Locations 1 Site: Segregated
Weather Fine/Overcast Fine/Overcast
Flow Survey Frequency
Continuous Count
Flow Survey Duration 4 Hours (Weekday) 7 Hours (Weekend)
Flow Survey Method Onsite
56
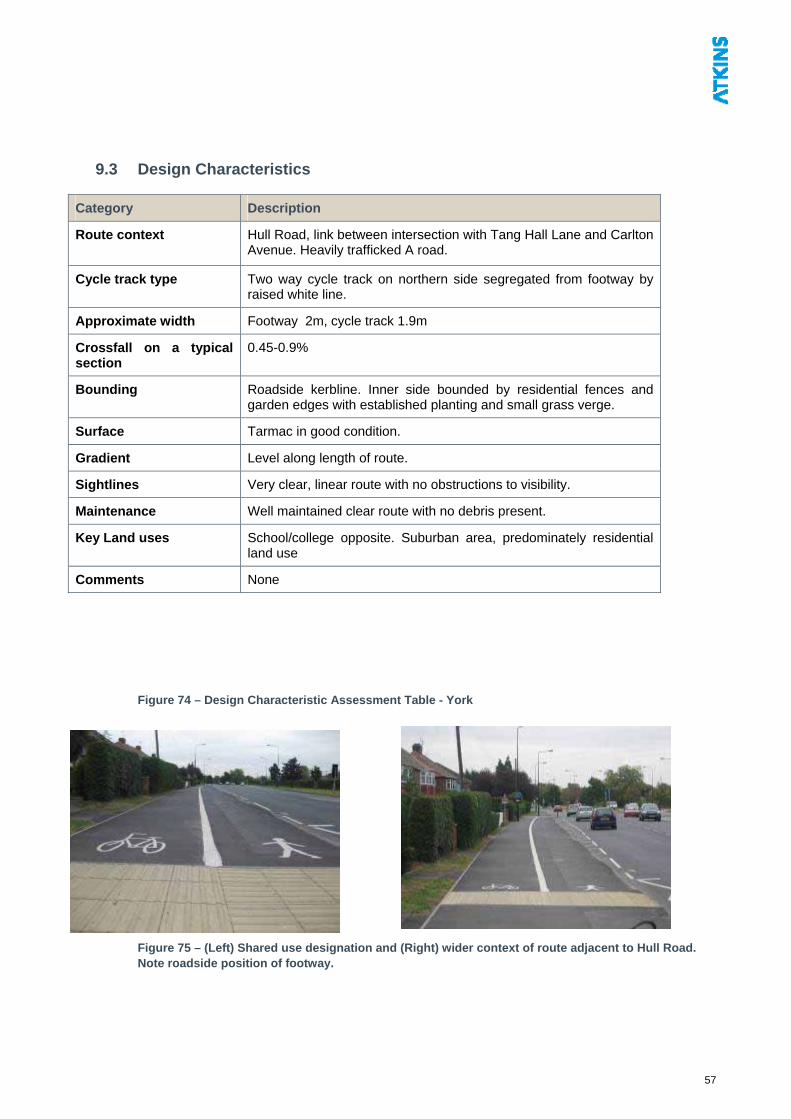
9.3 Design Characteristics
Category Description
Route context Hull Road, link between intersection with Tang Hall Lane and Carlton Avenue. Heavily trafficked A road.
Cycle track type Two way cycle track on northern side segregated from footway by raised white line.
Approximate width Footway 2m, cycle track 1.9m
Crossfall on a typical section
0.45-0.9%
Bounding Roadside kerbline. Inner side bounded by residential fences and garden edges with established planting and small grass verge.
Surface Tarmac in good condition.
Gradient Level along length of route.
Sightlines Very clear, linear route with no obstructions to visibility.
Maintenance Well maintained clear route with no debris present.
Key Land uses School/college opposite. Suburban area, predominately residential land use
Comments None
Figure 74 – Design Characteristic Assessment Table - York
Figure 75 – (Left) Shared use designation and (Right) wider context of route adjacent to Hull Road. Note roadside position of footway.
57
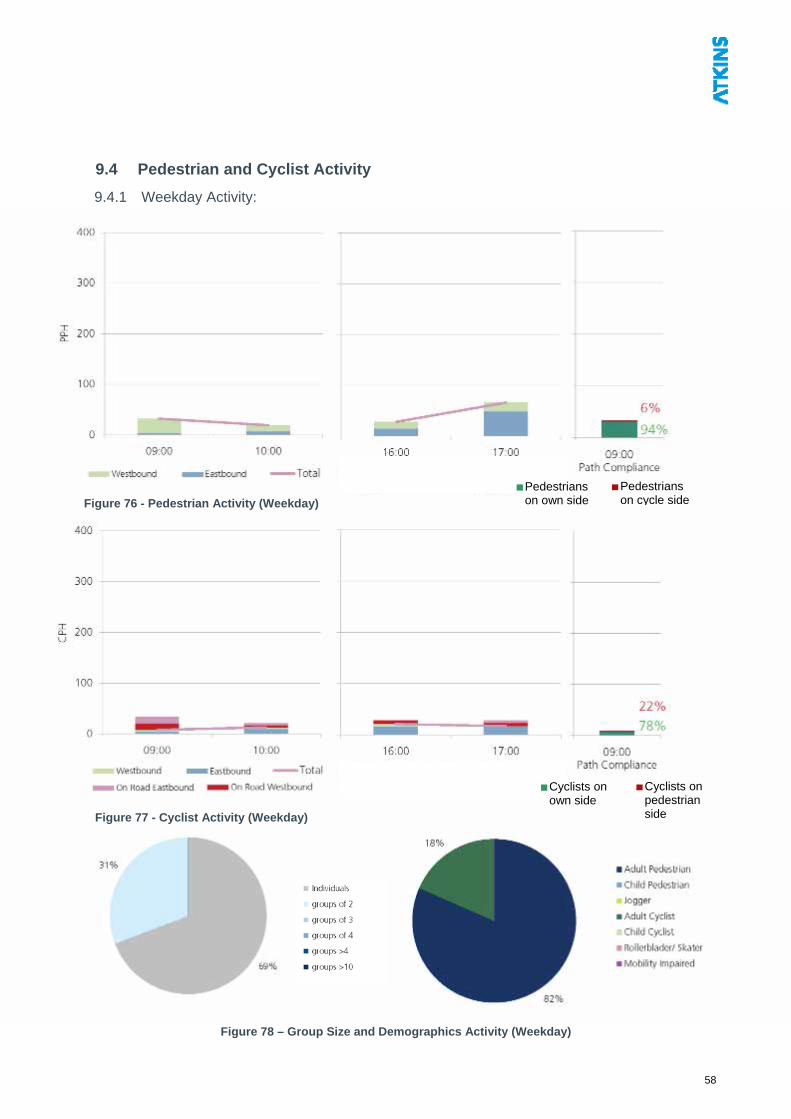
9.4 Pedestrian and Cyclist Activity
9.4.1 Weekday Activity:
Pedestrians on cycle s
Pedestrians on own side ideFigure 76 - Pedestrian Activity (Weekday)
Cyclists on
pedestrian side
Cyclists on own side
Figure 77 - Cyclist Activity (Weekday)
Figure 78 – Group Size and Demographics Activity (Weekday)
58
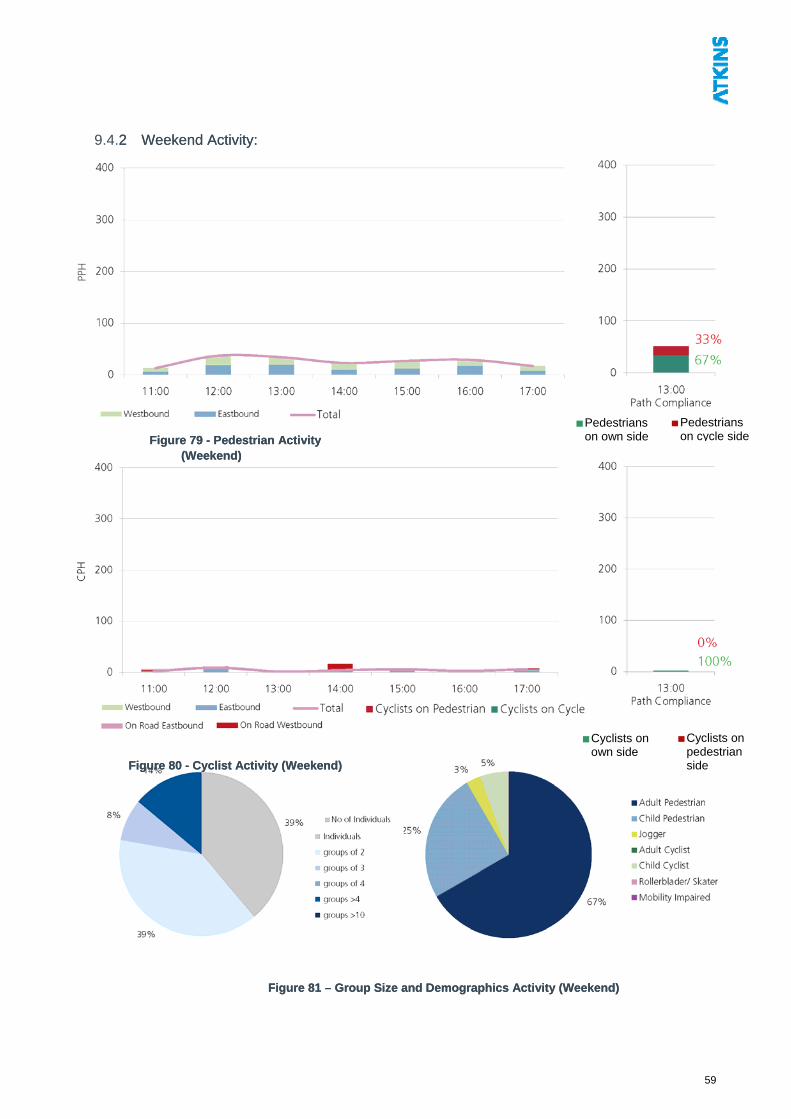
9.4.2 Weekend Activity: 2 Weekend Activity:
Pedestrians
on cycle sPedestrians on own side ide Figure 79 - Pedestrian Activity
(Weekend) Figure 79 - Pedestrian Activity
(Weekend)
Cyclists on
own side Cyclists on pedestrian side
Figure 80 - Cyclist Activity (Weekend) Figure 80 - Cyclist Activity (Weekend)
Figure 81 – Group Size and Demographics Activity (Weekend) Figure 81 – Group Size and Demographics Activity (Weekend)
59
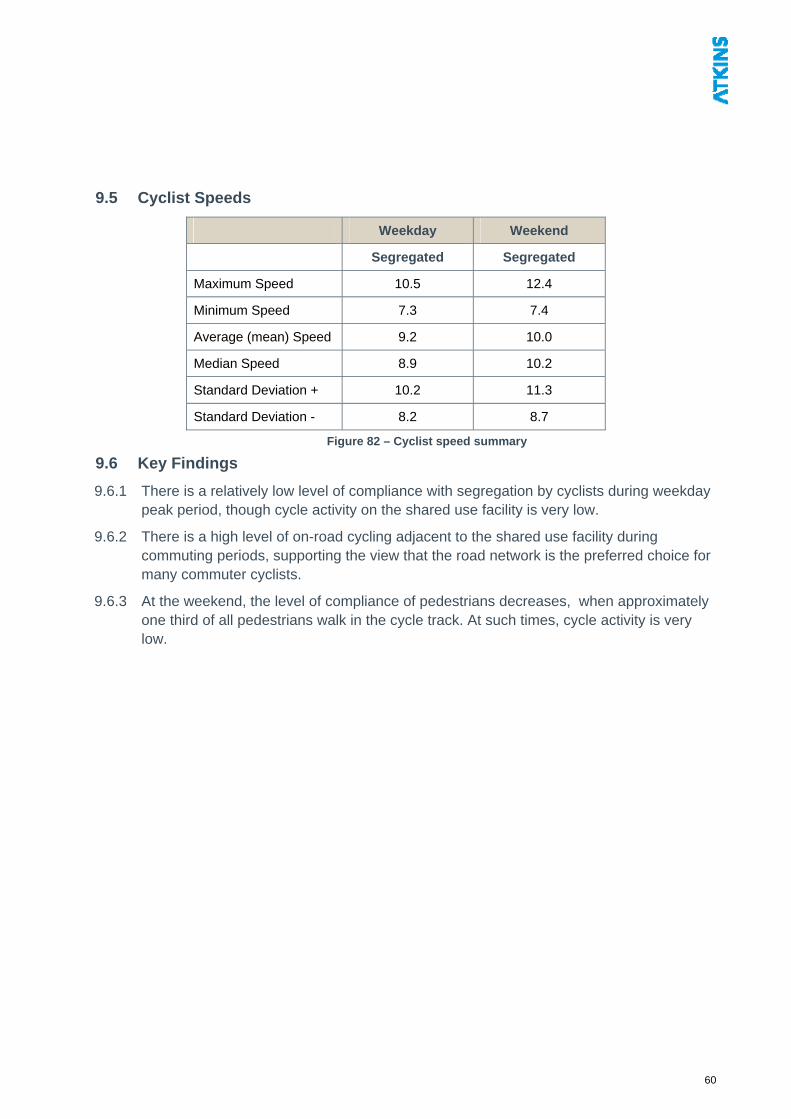
9.5 Cyclist Speeds
Weekday Weekend
Segregated Segregated
Maximum Speed 10.5 12.4
Minimum Speed 7.3 7.4
Average (mean) Speed 9.2 10.0
Median Speed 8.9 10.2
Standard Deviation + 10.2 11.3
Standard Deviation - 8.2 8.7
Figure 82 – Cyclist speed summary
9.6 Key Findings
9.6.1 There is a relatively low level of compliance with segregation by cyclists during weekday peak period, though cycle activity on the shared use facility is very low.
9.6.2 There is a high level of on-road cycling adjacent to the shared use facility during commuting periods, supporting the view that the road network is the preferred choice for many commuter cyclists.
9.6.3 At the weekend, the level of compliance of pedestrians decreases, when approximately one third of all pedestrians walk in the cycle track. At such times, cycle activity is very low.
60
10. Summary of Key Findings
10.1 Activity and speed
10.1.1 During weekday peak periods, pedestrian and cyclist activity profiles on the segregated and unsegregated shared use facilities studied showed activity typical of utility cycling and functional walking, with movement strongly directional to/from urban centres in the morning and evening peak periods respectively. At such times, the vast majority of users are travelling as individuals.
10.1.2 At the weekend, there are less well defined peak periods for cyclist and pedestrian activity, and the profiles of both user groups tend to follow similar patterns. More users travel in groups of two or more people than during weekday peak periods. When pedestrians travel in groups, compliance with segregation (where present) is lower than when they travel as individuals, irrespective of activity levels.
10.1.3 Pedestrians walking in larger groups tend to lead to a significant proportion of their number walking in the cycle track (on a segregated shared use facility in York, one third of pedestrians walk in the cycle track at the weekend).
10.1.4 Segregation by white line was found to be ineffective at supporting full compliance with segregation by pedestrians and cyclists. Based on the data collected in this study, there appears to be a weak inverse relationship between compliance and user flows, in that compliance tends to deteriorate with increasing flows. This relationship appears to be intuitively correct - as flows of pedestrians or cyclists increase, and especially as group sizes increase, people can be expected to use more of the width available. This is likely to be at the expense of compliance with the segregating feature.
10.1.5 Findings indicate that average cycle speeds are not significantly faster on segregated routes compared with unsegregated ones. Cycle speeds on segregated routes are likely to be influenced by a combination of factors, including pedestrians walking in the cycle track.
10.1.6 Observations indicate that maximum cycle speed decreases as pedestrian flow increases on unsegregated shared use routes. This suggests that cyclists moderate their behaviour in the presence of pedestrians. Maximum cycle speeds were also seen to decrease on segregated routes when pedestrians were present, although to a lesser extent than on unsegregated routes.
10.1.7 At some of the locations studied, there were clear differences in cycle speeds between weekday commuting periods and out-of-commuting periods at the weekend, when cyclists tended to travel slower. In general, cycle speed is likely to be influenced by other factors, such as user density on the route and the nature of the route as a corridor for movement or a destination.
10.1.8 Some cyclists were observed to cycle on-road rather than use adjacent-to-road (on-highway) shared use routes in Norwich and Cambridge. The decision to cycle on-road is likely to be dependent on many factors which could include journey preferences (such as the importance of journey time or journey ambience), confidence levels and perceived safety. This suggests that adjacent-to-road shared use facilities do not operate as effectively as the equivalent on-road route for some cyclists.
61
10.2 Route width and capacity
10.2.1 On shared use routes, segregating cyclists and pedestrians reduces the width available to each user group. This reduction could have implications for the level of comfort for all users.
10.2.2 Level of Service techniques have been developed elsewhere for standardising and measuring pedestrian capacity and level of comfort. In this context, and taking into account the presence of cyclists, the methodology included an assessment of the peaks of pedestrian activity and the amount of usable space available. Platoon Level of Service for pedestrians on each route is categorised on a scale from A (open movement) to F (jammed). To date, this technique has only been developed and standardised for pedestrian movement.
10.2.3 In Cambridge the Level of Service for pedestrians on the unsegregated route during the weekday morning peak and weekend peak is B, indicating that it has sufficient capacity for pedestrians but comfort may be affected at busy times or when more than one cyclist is passing.
10.2.4 In Norwich the Level of Service for pedestrians on the unsegregated route during the weekday morning peak and weekend peak is A, indicating that it has sufficient capacity at current levels of pedestrian activity.
10.2.5 On the segregated routes in Cambridge and Norwich, the Level of Service for pedestrians during the weekday morning and weekend peaks is A, indicating there is sufficient capacity on the footway side of these routes for current activity.
10.2.6 Equivalent techniques to measure the Level of Service of cyclists have not been developed for the UK. Cyclist Level of Service is likely to be influenced by range of factors that could include journey time.
10.3 Observed interaction and perceived behaviour
10.3.1 This assessment considered shared use environments only, and did not take into account interaction between pedestrians or cyclists and other vehicles. It should be noted that adjacent-to-carriageway facilities can introduce new “junctions” and crossing points (e.g. across side roads) for cyclists, which can lead to increased interaction and potential for conflict with motor vehicles, but this was outside the scope of the research.
10.3.2 Using categories of user interaction based on empirical analysis in the Norwich and Cambridge case studies, the difference in the potential for conflict on segregated and unsegregated routes was found to be minimal.
10.3.3 The project involved on-site interviews with pedestrians and cyclists in Norwich and Cambridge. Both groups were generally comfortable using the segregated and unsegregated routes studied.
10.3.4 Behaviour by both pedestrians and cyclists on segregated and unsegregated routes was judged to be considerate by both user groups. Agreement was strongest on unsegregated routes, suggesting that behaviour is more considerate on these routes, where the requirement to interact with other types of user is clearer.
62
10.3.5 Despite perceived non-compliance with segregation by both pedestrians and cyclists on weekdays and weekends, both groups were comfortable on the segregated route in Cambridge. In Norwich, perceived user comfort on the segregated shared use facility was lower than on the unsegregated facility.
10.3.6 Of the people interviewed, cyclists generally used the shared use routes more regularly than pedestrians. In Cambridge low lighting levels affected use by both pedestrians and cyclists at certain times of the day. In Norwich the impact of low levels of lighting affected pedestrians more than cyclists.
10.3.7 No collisions, and no conflict of any significance took place during the video surveys. Most of the interaction recorded was relatively inconsequential, where one or more users adjusted their speed/position. The most severe category of interaction observed was that of marginal conflict, where cyclists or pedestrians slowed down or changed direction but movement was calm and controlled.
10.3.8 Only 5 instances of marginal conflict were recorded and they took place on the two unsegregated routes. However, both these of routes were relatively narrow at 2.2m (the two segregated routes were 3m and 4m wide). Limited width increases the need for users to make allowances for other users, and it would be reasonable to expect that the level of interaction would reduce with increasing width. Regardless of this, the incidents recorded were relatively benign in nature.
10.3.9 In Cambridge, two people (4% of sample) said they had experienced a collision on the segregated route, and two people using the unsegregated route (3% of sample) said likewise. In Norwich, three people (3%) said they had experienced a collision on the segregated route - there were no reports of collisions on the unsegregated route. The findings suggest that there is is no material difference in levels of collisions regardless of segregation.
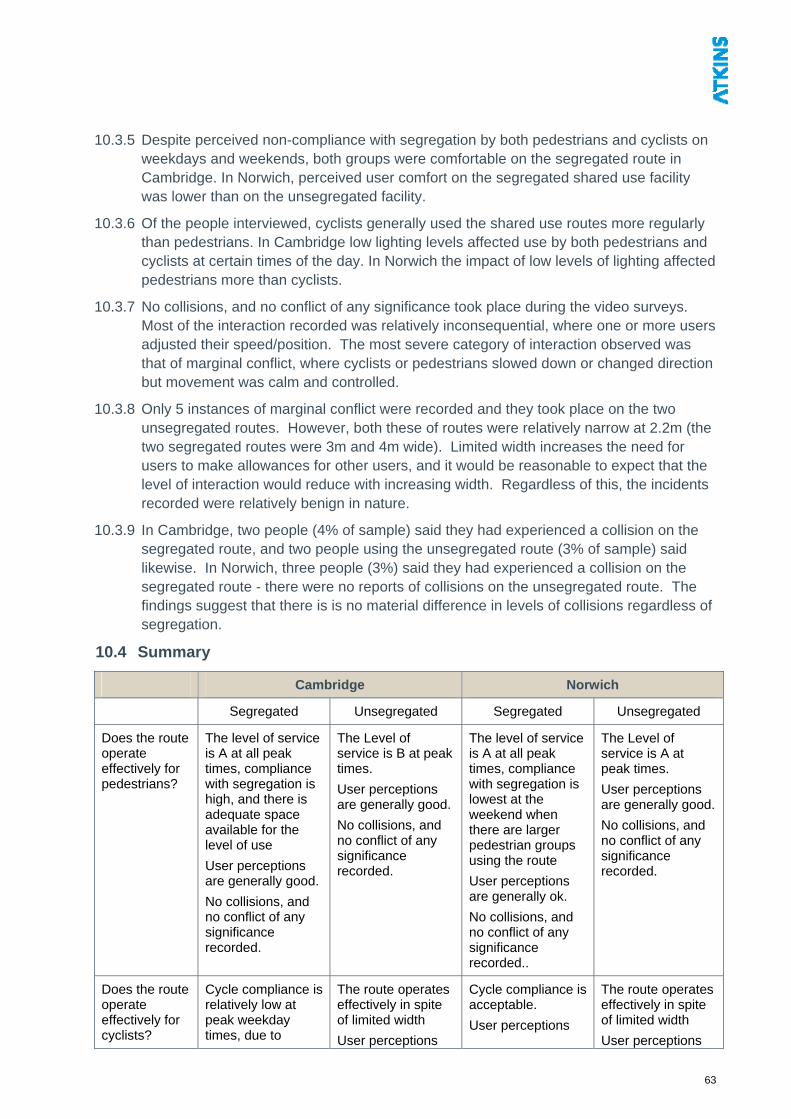
10.4 Summary
Cambridge Norwich
Segregated Unsegregated Segregated Unsegregated
Does the route operate effectively for pedestrians?
The level of service is A at all peak times, compliance with segregation is high, and there is adequate space available for the level of use
User perceptions are generally good.
No collisions, and no conflict of any significance recorded.
The Level of service is B at peak times.
User perceptions are generally good.
No collisions, and no conflict of any significance recorded.
The level of service is A at all peak times, compliance with segregation is lowest at the weekend when there are larger pedestrian groups using the route
User perceptions are generally ok.
No collisions, and no conflict of any significance recorded..
The Level of service is A at peak times.
User perceptions are generally good.
No collisions, and no conflict of any significance recorded.
Does the route operate effectively for cyclists?
Cycle compliance is relatively low at peak weekday times, due to
The route operates effectively in spite of limited width
User perceptions
Cycle compliance is acceptable.
User perceptions
The route operates effectively in spite of limited width
User perceptions
63
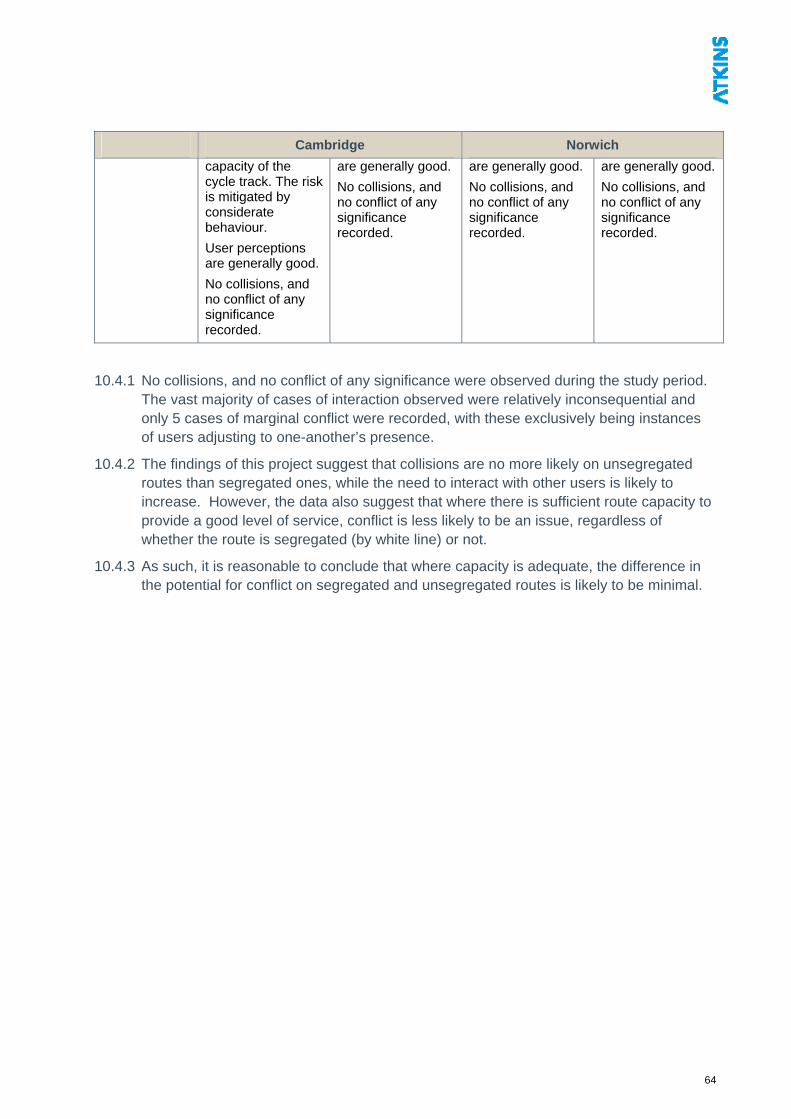
Cambridge Norwich
capacity of the cycle track. The risk is mitigated by considerate behaviour.
User perceptions are generally good.
No collisions, and no conflict of any significance recorded.
are generally good.
No collisions, and no conflict of any significance recorded.
are generally good.
No collisions, and no conflict of any significance recorded.
are generally good.
No collisions, and no conflict of any significance recorded.
10.4.1 No collisions, and no conflict of any significance were observed during the study period. The vast majority of cases of interaction observed were relatively inconsequential and only 5 cases of marginal conflict were recorded, with these exclusively being instances of users adjusting to one-another’s presence.
10.4.2 The findings of this project suggest that collisions are no more likely on unsegregated routes than segregated ones, while the need to interact with other users is likely to increase. However, the data also suggest that where there is sufficient route capacity to provide a good level of service, conflict is less likely to be an issue, regardless of whether the route is segregated (by white line) or not.
10.4.3 As such, it is reasonable to conclude that where capacity is adequate, the difference in the potential for conflict on segregated and unsegregated routes is likely to be minimal.
64
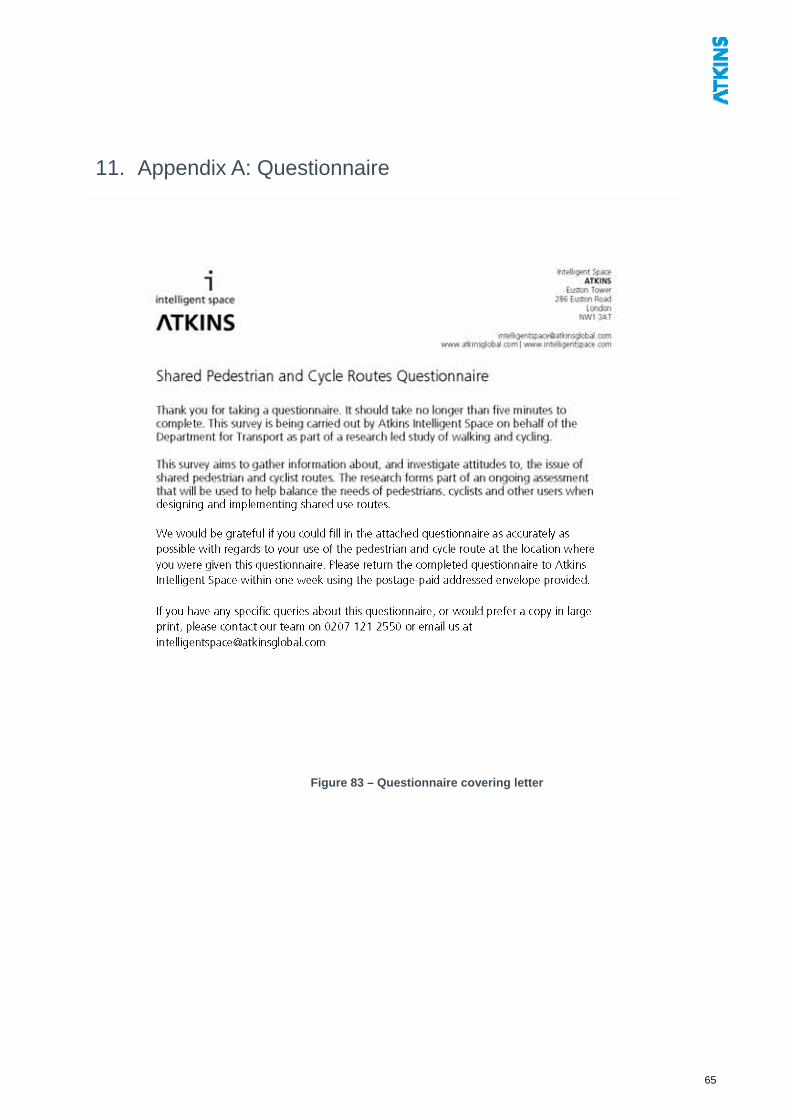
11. Appendix A: Questionnaire
Figure 83 – Questionnaire covering letter
65
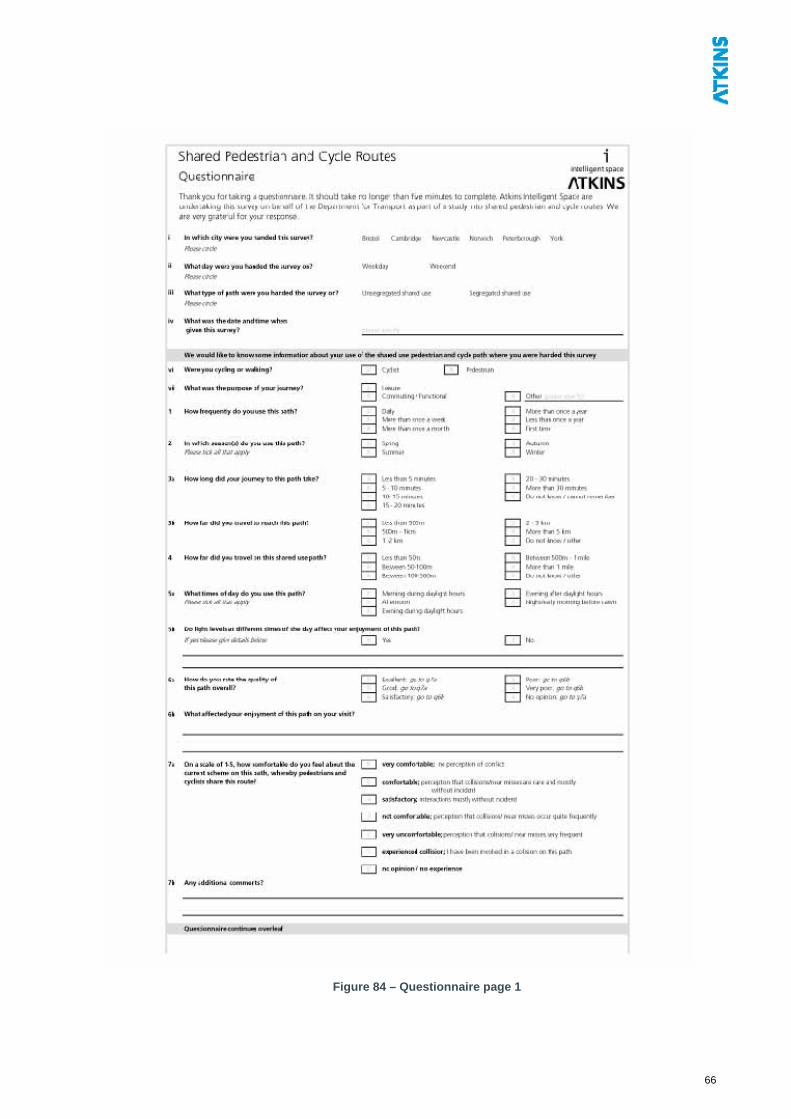
Figure 84 – Questionnaire page 1
66
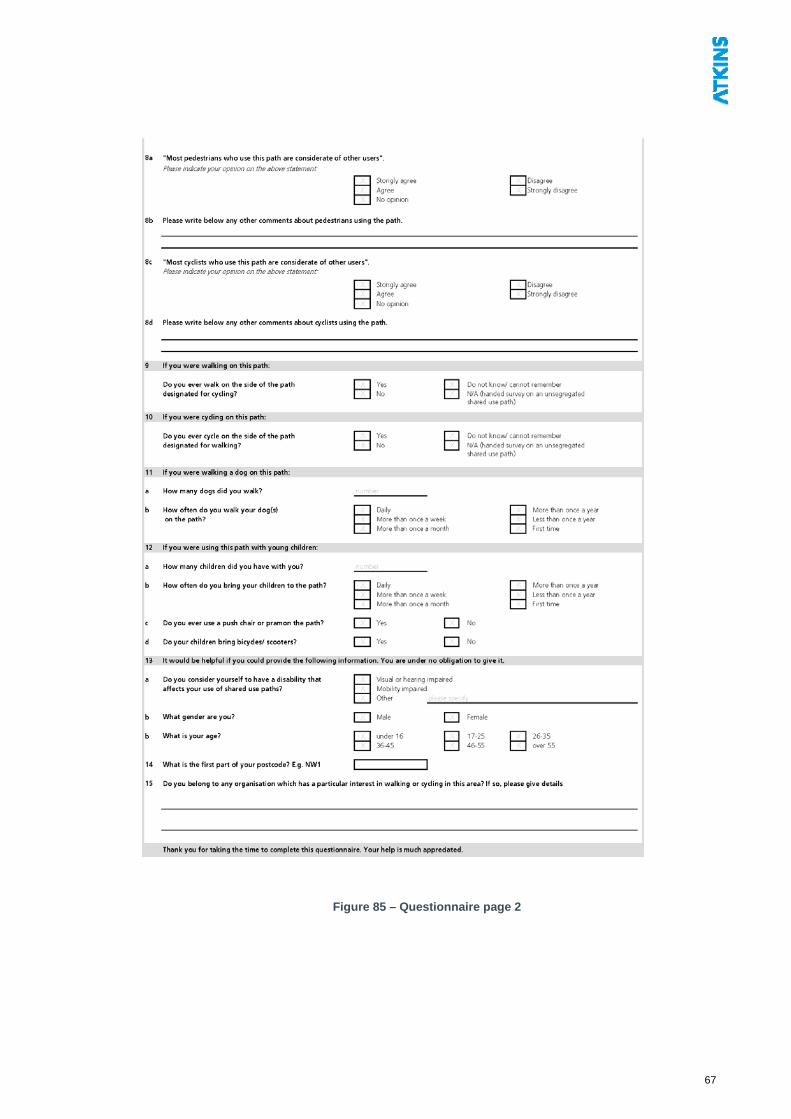
Figure 85 – Questionnaire page 2
67
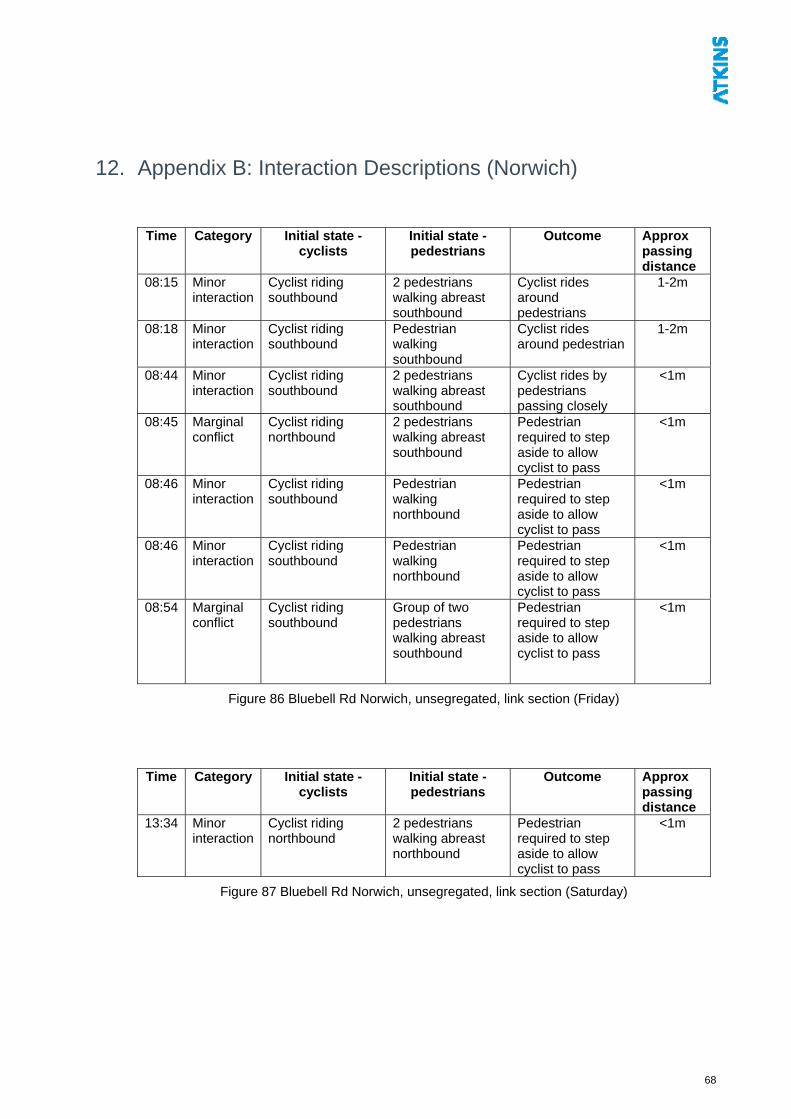
12. Appendix B: Interaction Descriptions (Norwich)
Time Category Initial state - cyclists
Initial state - pedestrians
Outcome Approx passing distance
08:15 Minor interaction
Cyclist riding southbound
2 pedestrians walking abreast southbound
Cyclist rides around pedestrians
1-2m
08:18 Minor interaction
Cyclist riding southbound
Pedestrian walking southbound
Cyclist rides around pedestrian
1-2m
08:44 Minor interaction
Cyclist riding southbound
2 pedestrians walking abreast southbound
Cyclist rides by pedestrians passing closely
<1m
08:45 Marginal conflict
Cyclist riding northbound
2 pedestrians walking abreast southbound
Pedestrian required to step aside to allow cyclist to pass
<1m
08:46 Minor interaction
Cyclist riding southbound
Pedestrian walking northbound
Pedestrian required to step aside to allow cyclist to pass
<1m
08:46 Minor interaction
Cyclist riding southbound
Pedestrian walking northbound
Pedestrian required to step aside to allow cyclist to pass
<1m
08:54 Marginal conflict
Cyclist riding southbound
Group of two pedestrians walking abreast southbound
Pedestrian required to step aside to allow cyclist to pass
<1m
Figure 86 Bluebell Rd Norwich, unsegregated, link section (Friday)
Time Category Initial state - cyclists
Initial state - pedestrians
Outcome Approx passing distance
13:34 Minor interaction
Cyclist riding northbound
2 pedestrians walking abreast northbound
Pedestrian required to step aside to allow cyclist to pass
<1m
Figure 87 Bluebell Rd Norwich, unsegregated, link section (Saturday)
68
Time Category Initial state - cyclists
Initial state - pedestrians
Outcome Approx passing distance
08:14 Minor interaction
Eastbound cyclist travelling fairly quickly in cycle track
2 westbound pedestrians in footway
Pedestrian nearest cyclist moves to one side slightly
1-2m
08:32 Minor interaction
Two cyclists (one in track, one in footway) approach oncoming cyclist in track
N/a Cycling pair move to single file to allow approaching cyclist to pass
1-2m
08:37 Minor interaction
Cyclist in track and child cyclist in footway approach oncoming cyclist in track
N/a Cyclists in track pass each other without deviating significantly
<1m
08:53 Minor interaction
Westbound cyclist N/a Overtaken by another cyclist
1-2m
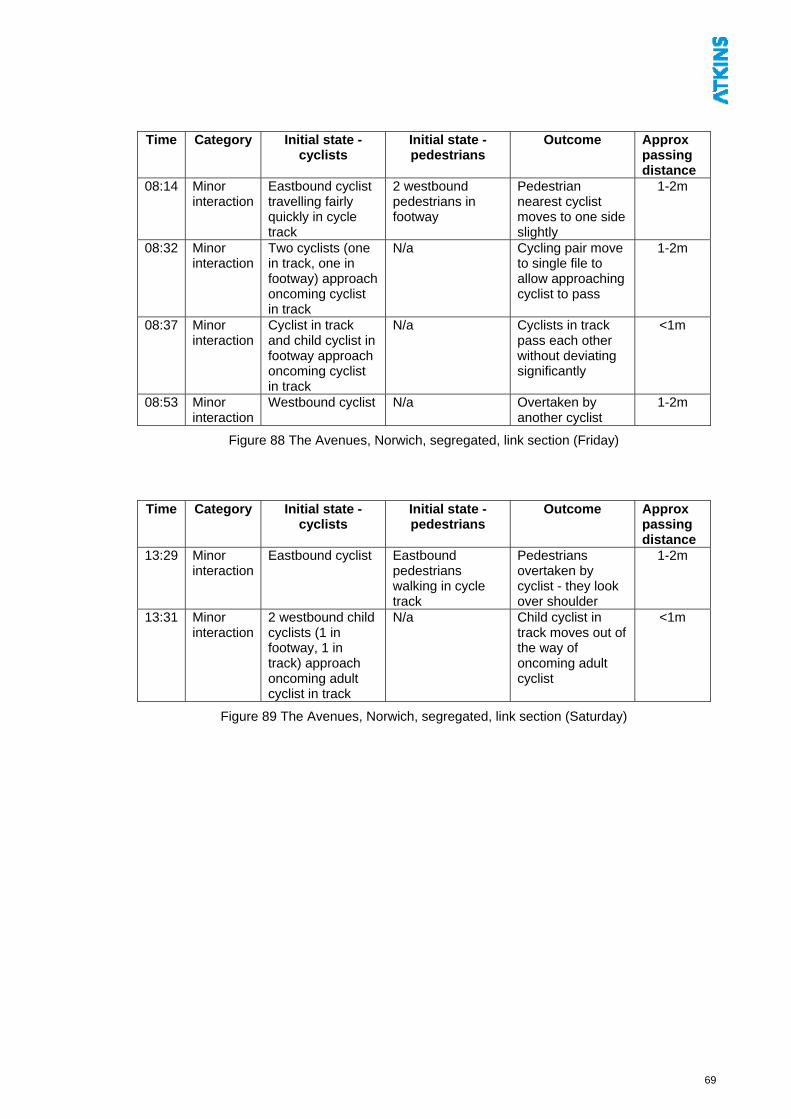
Figure 88 The Avenues, Norwich, segregated, link section (Friday)
Time Category Initial state - cyclists
Initial state - pedestrians
Outcome Approx passing distance
13:29 Minor interaction
Eastbound cyclist Eastbound pedestrians walking in cycle track
Pedestrians overtaken by cyclist - they look over shoulder
1-2m
13:31 Minor interaction
2 westbound child cyclists (1 in footway, 1 in track) approach oncoming adult cyclist in track
N/a Child cyclist in track moves out of the way of oncoming adult cyclist
<1m
Figure 89 The Avenues, Norwich, segregated, link section (Saturday)
69
Time Category Initial state -
cyclists Initial state - pedestrians
Outcome Approx passing distance
08:08 Minor interaction
Cyclist slowly approaches driveway
Passengers exit car stopped in middle of driveway
Cyclist rides past passengers exiting car
1-2m
08:08 Minor interaction
Northbound child cyclist
Group of school children ahead of cyclist walking in same direction
Cyclist swerves to overtake school children
<1m
08:21 Minor interaction
Southbound cyclist
Two pedestrians passing each other
Cyclists passes northbound pedestrian
<1m
08:22 Minor interaction
Slow moving northbound cyclist attempts to pass pedestrian group on their right then their left side
Two adults with a child. One of the adults is walking a dog.
Both adults step out of the way for cyclist to pass
<1m
08:22 Minor interaction
Two slow moving southbound cyclists
Two adults with a child. One of the adults is walking a dog.
Cyclists pass group. No change in behaviour
<1m
08:26 Minor interaction
Two cyclists approach each other
Refuse collection worker between cyclists
One cyclist overtakes refuse collection worker then deviates slightly to allow the other cyclist to pass
1-2m
08:36 Minor interaction
Southbound cyclist
Southbound pedestrian
Pedestrian overtaken by cyclist in close proximity. No change in behaviour
<1m
08:43 Minor interaction
Southbound cyclist
Two pedestrians walking abreast southbound
Pedestrians overtaken by cyclist in close proximity. No change in behaviour
<1m
08:45 Minor interaction
Fairly quickly moving northbound cyclist
Southbound pedestrian
Pedestrian moves out of the way of cyclist who continues on intended line
1-2m
08:45 Minor interaction
Fairly quickly moving northbound cyclist
Southbound pedestrian
Pedestrian moves slightly out of the way of cyclist who continues on intended line
1-2m
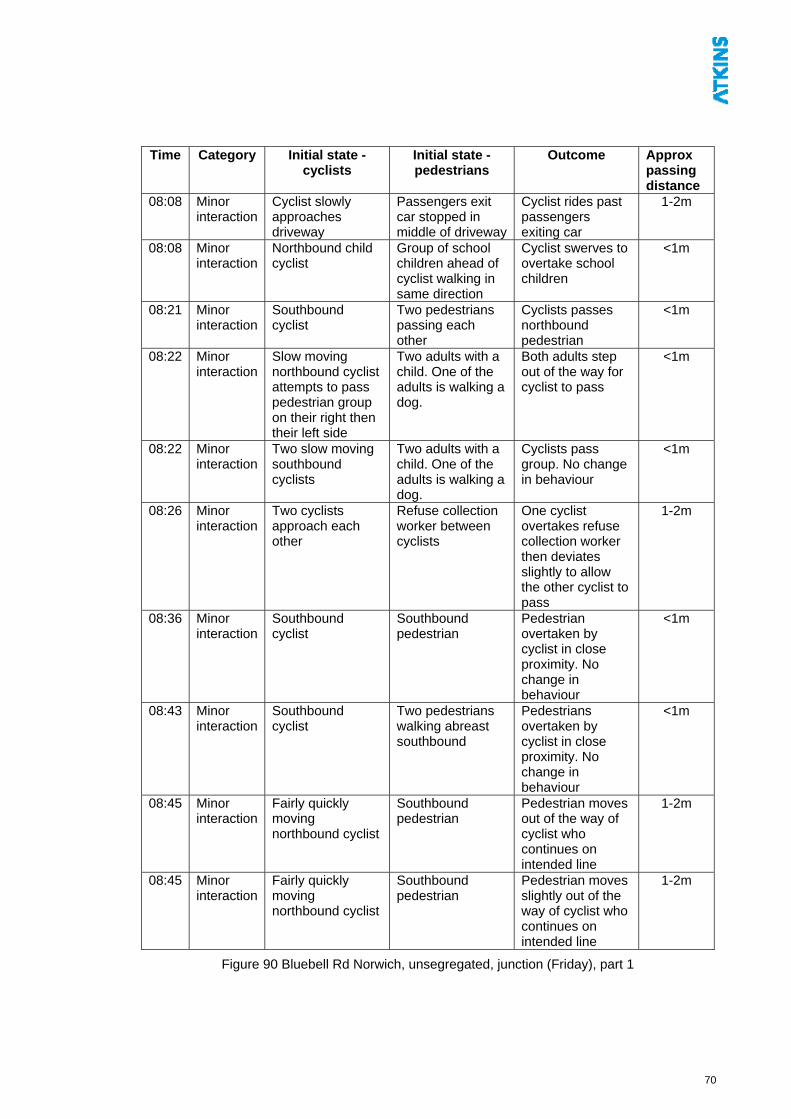
Figure 90 Bluebell Rd Norwich, unsegregated, junction (Friday), part 1
70
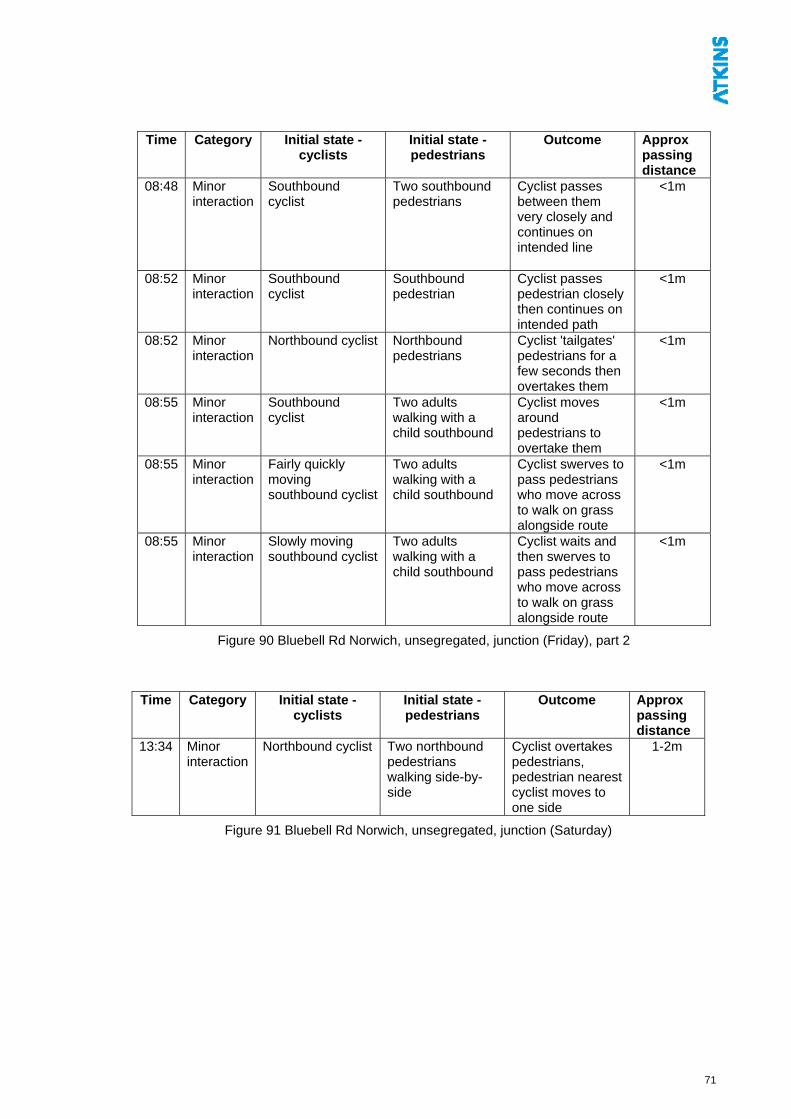
Time Category Initial state - cyclists
Initial state - pedestrians
Outcome Approx passing distance
08:48 Minor interaction
Southbound cyclist
Two southbound pedestrians
Cyclist passes between them very closely and continues on intended line
<1m
08:52 Minor interaction
Southbound cyclist
Southbound pedestrian
Cyclist passes pedestrian closely then continues on intended path
<1m
08:52 Minor interaction
Northbound cyclist Northbound pedestrians
Cyclist 'tailgates' pedestrians for a few seconds then overtakes them
<1m
08:55 Minor interaction
Southbound cyclist
Two adults walking with a child southbound
Cyclist moves around pedestrians to overtake them
<1m
08:55 Minor interaction
Fairly quickly moving southbound cyclist
Two adults walking with a child southbound
Cyclist swerves to pass pedestrians who move across to walk on grass alongside route
<1m
08:55 Minor interaction
Slowly moving southbound cyclist
Two adults walking with a child southbound
Cyclist waits and then swerves to pass pedestrians who move across to walk on grass alongside route
<1m
Figure 90 Bluebell Rd Norwich, unsegregated, junction (Friday), part 2
Time Category Initial state - cyclists
Initial state - pedestrians
Outcome Approx passing distance
13:34 Minor interaction
Northbound cyclist Two northbound pedestrians walking side-by-side
Cyclist overtakes pedestrians, pedestrian nearest cyclist moves to one side
1-2m
Figure 91 Bluebell Rd Norwich, unsegregated, junction (Saturday)
71
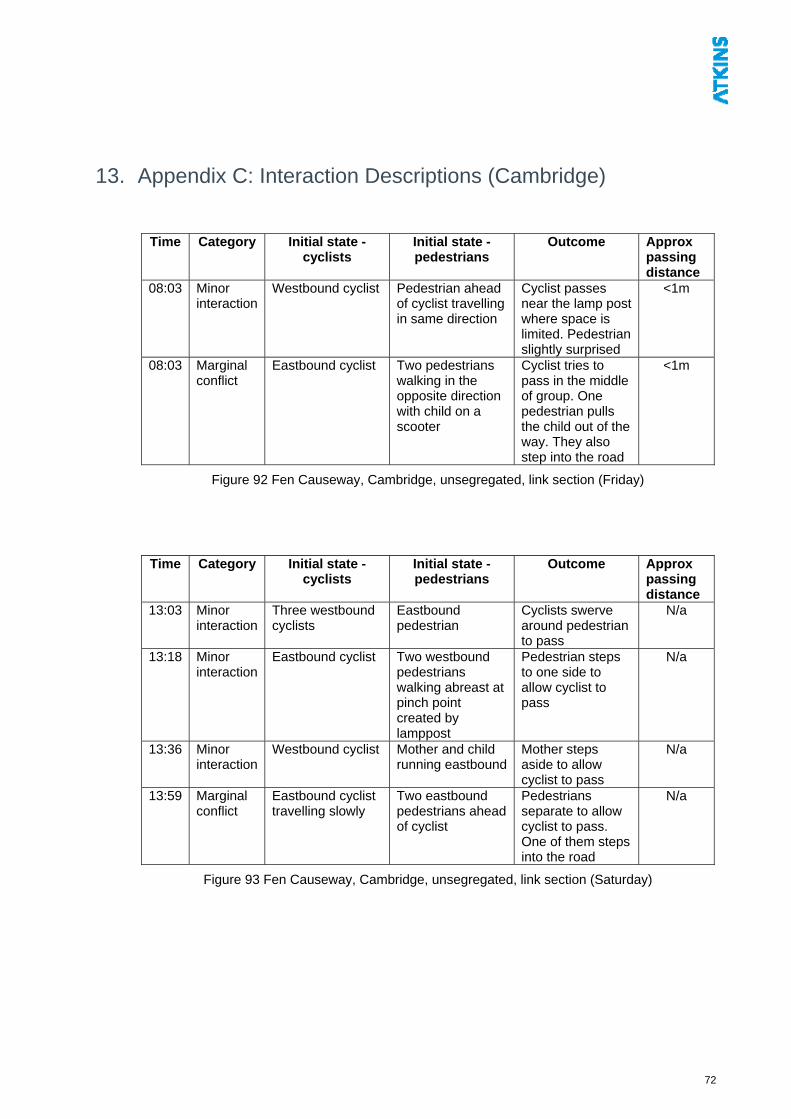
13. Appendix C: Interaction Descriptions (Cambridge)
Time Category Initial state -
cyclists Initial state - pedestrians
Outcome Approx passing distance
08:03 Minor interaction
Westbound cyclist Pedestrian ahead of cyclist travelling in same direction
Cyclist passes near the lamp post where space is limited. Pedestrian slightly surprised
<1m
08:03 Marginal conflict
Eastbound cyclist Two pedestrians walking in the opposite direction with child on a scooter
Cyclist tries to pass in the middle of group. One pedestrian pulls the child out of the way. They also step into the road
<1m
Figure 92 Fen Causeway, Cambridge, unsegregated, link section (Friday)
Time Category Initial state - cyclists
Initial state - pedestrians
Outcome Approx passing distance
13:03 Minor interaction
Three westbound cyclists
Eastbound pedestrian
Cyclists swerve around pedestrian to pass
N/a
13:18 Minor interaction
Eastbound cyclist Two westbound pedestrians walking abreast at pinch point created by lamppost
Pedestrian steps to one side to allow cyclist to pass
N/a
13:36 Minor interaction
Westbound cyclist Mother and child running eastbound
Mother steps aside to allow cyclist to pass
N/a
13:59 Marginal conflict
Eastbound cyclist travelling slowly
Two eastbound pedestrians ahead of cyclist
Pedestrians separate to allow cyclist to pass. One of them steps into the road
N/a
Figure 93 Fen Causeway, Cambridge, unsegregated, link section (Saturday)
72
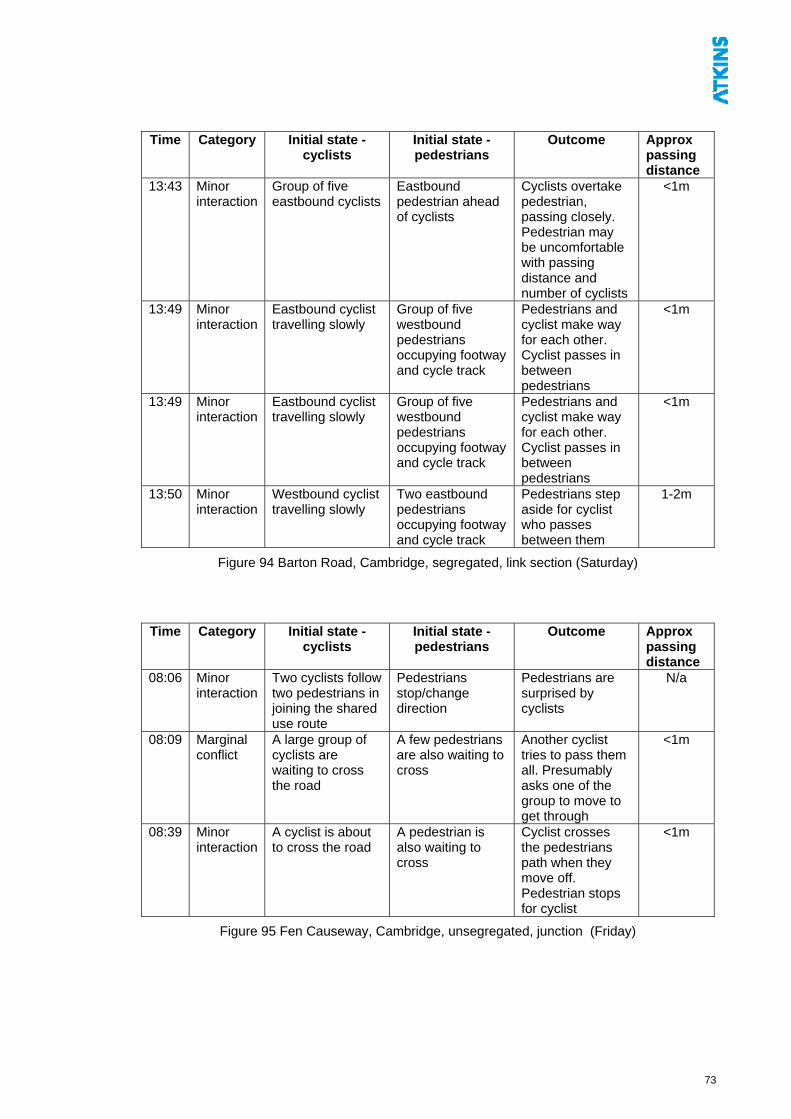
Time Category Initial state - cyclists
Initial state - pedestrians
Outcome Approx passing distance
13:43 Minor interaction
Group of five eastbound cyclists
Eastbound pedestrian ahead of cyclists
Cyclists overtake pedestrian, passing closely. Pedestrian may be uncomfortable with passing distance and number of cyclists
<1m
13:49 Minor interaction
Eastbound cyclist travelling slowly
Group of five westbound pedestrians occupying footway and cycle track
Pedestrians and cyclist make way for each other. Cyclist passes in between pedestrians
<1m
13:49 Minor interaction
Eastbound cyclist travelling slowly
Group of five westbound pedestrians occupying footway and cycle track
Pedestrians and cyclist make way for each other. Cyclist passes in between pedestrians
<1m
13:50 Minor interaction
Westbound cyclist travelling slowly
Two eastbound pedestrians occupying footway and cycle track
Pedestrians step aside for cyclist who passes between them
1-2m
Figure 94 Barton Road, Cambridge, segregated, link section (Saturday)
Time Category Initial state - cyclists
Initial state - pedestrians
Outcome Approx passing distance
08:06 Minor interaction
Two cyclists follow two pedestrians in joining the shared use route
Pedestrians stop/change direction
Pedestrians are surprised by cyclists
N/a
08:09 Marginal conflict
A large group of cyclists are waiting to cross the road
A few pedestrians are also waiting to cross
Another cyclist tries to pass them all. Presumably asks one of the group to move to get through
<1m
08:39 Minor interaction
A cyclist is about to cross the road
A pedestrian is also waiting to cross
Cyclist crosses the pedestrians path when they move off. Pedestrian stops for cyclist
<1m
Figure 95 Fen Causeway, Cambridge, unsegregated, junction (Friday)
73
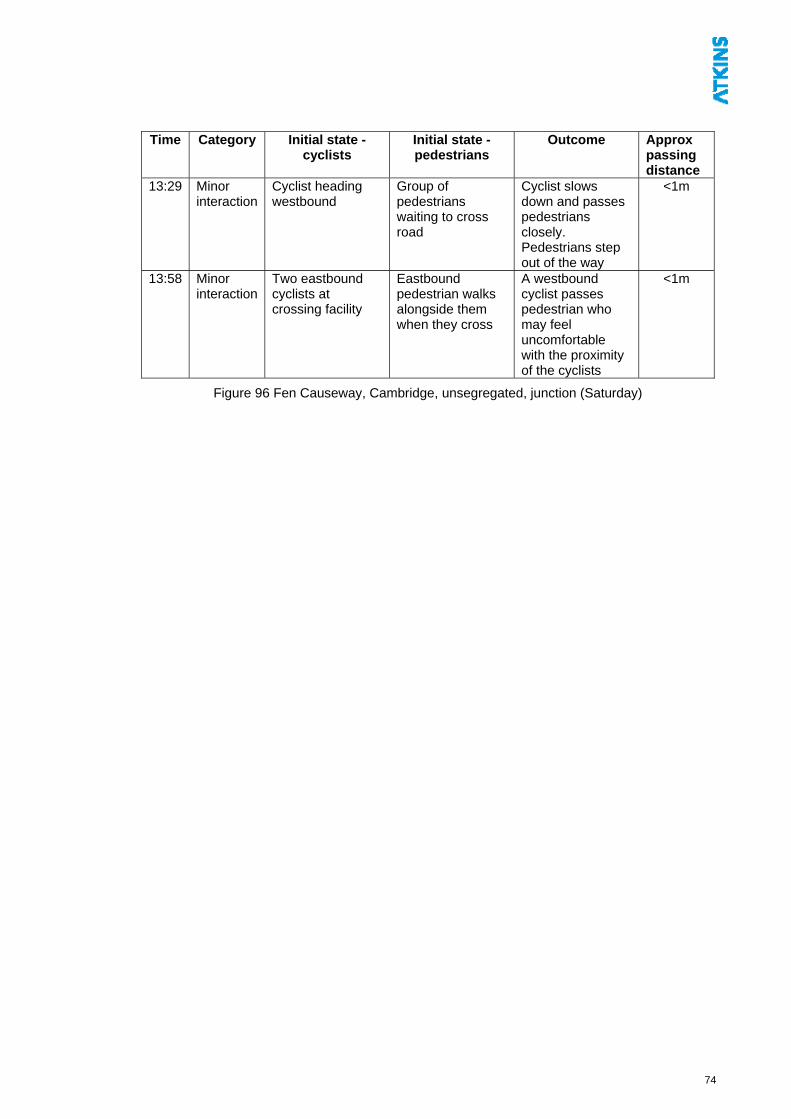
Time Category Initial state - cyclists
Initial state - pedestrians
Outcome Approx passing distance
13:29 Minor interaction
Cyclist heading westbound
Group of pedestrians waiting to cross road
Cyclist slows down and passes pedestrians closely. Pedestrians step out of the way
<1m
13:58 Minor interaction
Two eastbound cyclists at crossing facility
Eastbound pedestrian walks alongside them when they cross
A westbound cyclist passes pedestrian who may feel uncomfortable with the proximity of the cyclists
<1m
Figure 96 Fen Causeway, Cambridge, unsegregated, junction (Saturday)
74
75
14. Appendix D: Pedestrian Level of Service 14.1.1 Level of Service is a standard measurement of pedestrian capacity and level of
comfort. In this context, the methodology assesses the peak volume of pedestrian flow activity and the amount of available, usable space for users.
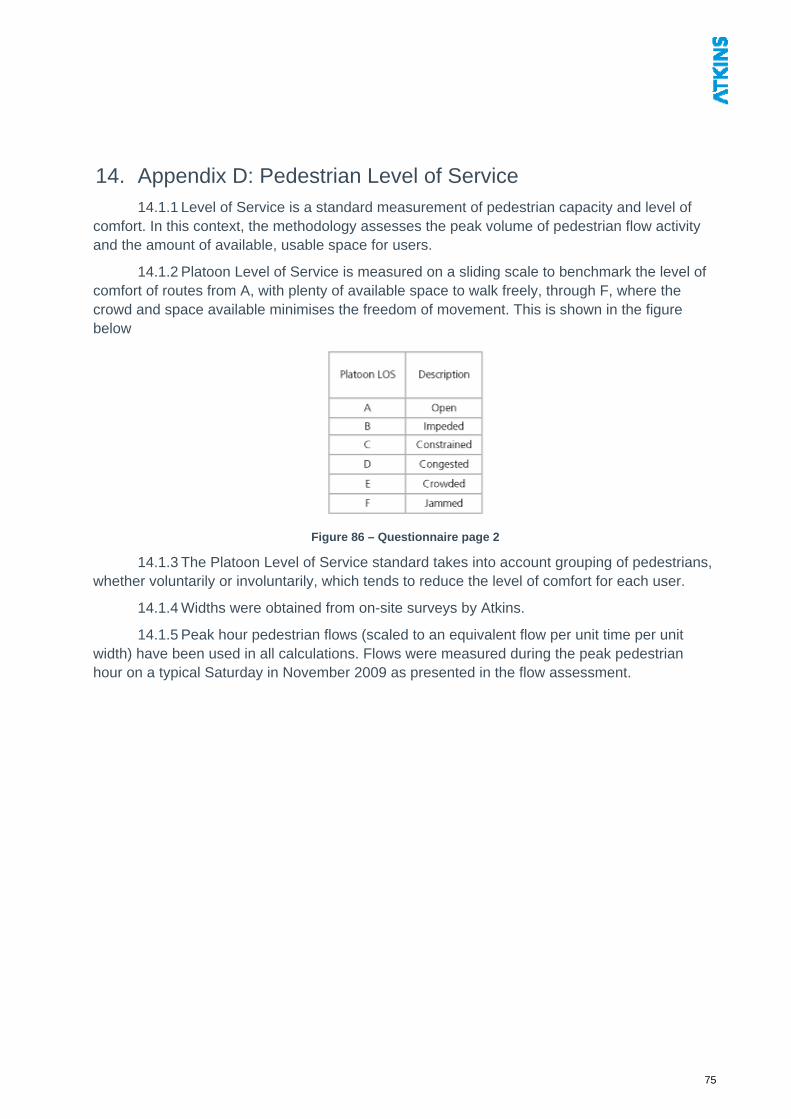
14.1.2 Platoon Level of Service is measured on a sliding scale to benchmark the level of comfort of routes from A, with plenty of available space to walk freely, through F, where the crowd and space available minimises the freedom of movement. This is shown in the figure below
Figure 86 – Questionnaire page 2
14.1.3 The Platoon Level of Service standard takes into account grouping of pedestrians, whether voluntarily or involuntarily, which tends to reduce the level of comfort for each user.
14.1.4 Widths were obtained from on-site surveys by Atkins.
14.1.5 Peak hour pedestrian flows (scaled to an equivalent flow per unit time per unit width) have been used in all calculations. Flows were measured during the peak pedestrian hour on a typical Saturday in November 2009 as presented in the flow assessment.