Embed Size (px)
Citation preview
Soft Matter
PAPER
Dow
nloa
ded
by U
nive
rsity
of
Con
nect
icut
on
17 M
arch
201
3Pu
blis
hed
on 0
6 Fe
brua
ry 2
013
on h
ttp://
pubs
.rsc
.org
| do
i:10.
1039
/C3S
M27
131E
View Article OnlineView Journal | View Issue
aREQUIMTE, Faculdade de Engenharia, Uni
4200-465 Porto, Portugal. E-mail: pilarg@febCentro de Investigaç~ao em Quımica (CIQ
Bioquımica, Faculdade de Ciencias, Univer
687, 4169-007 Porto, PortugalcREQUIMTE, CQFB, Faculdade de Ciencias e
2829-516 Caparica, Portugal
† Electronic supplementary informa10.1039/c3sm27131e
Cite this: Soft Matter, 2013, 9, 3131
Received 14th September 2012Accepted 10th January 2013
DOI: 10.1039/c3sm27131e
www.rsc.org/softmatter
This journal is ª The Royal Society of
Shaping the molecular assemblies of native and alkali-modified agars in dilute and concentrated aqueousmedia via microwave-assisted extraction†
Ana M. M. Sousa,a Jo~ao Borges,b Fernando Silva,b Ana M. Ramos,c Eurico J. Cabritac
and Maria Pilar Gonçalves*a
The use of agar-based biomaterials for the development of emerging areas, such as tissue engineering or
‘smart materials’ production has recently gained great interest. Understanding how these gel-forming
polysaccharides self-organise in aqueous media and how these associations can be tuned to meet the
specific needs of each application is thus of great relevance. As an extension of previous pioneering
research concerning the application of the microwave-assisted extraction (MAE) technique in the
recovery of native (NA) and alkali-modified (AA) agars, this article focuses on the different molecular
assemblies assumed by these novel NA and AA when using different MAE routes. The molecular
architectures in dilute (5, 10, 50 and 100 mg mL�1) and concentrated (1.5% (w/w)) aqueous media were
imaged by AFM and cryoSEM, respectively. Relevant structural and physicochemical properties were
investigated to support the microscopic data. Different extraction routes led to polysaccharides with
unique properties, which in turn resulted in different molecular assemblies. Even at 5 mg mL�1, AFM
images included individual fibers, cyclic segments, aggregates and local networks. At higher polymer
concentrations, the structures further aggregated forming multilayer polymeric networks for AA. The
more compact and denser 3D networks of AA, imaged by cryoSEM, and their higher resistance to large
deformations matched the 2D-shapes observed by AFM. Depending on the nature of the AA chains,
homogeneous or heterogeneous growth of assemblies was seen during network formation. The
obtained results support well the view of double helix formation followed by intensive double helix
association proposed for agar gelation.
Introduction
Agar is the name given to a mixture of water-soluble and gel-forming polysaccharides found in selected marine red algae,mainly Gracilaria and Gelidium genera.1 According to thenomenclature proposed by Knutsen et al.,2 the agar backbone iscomposed mainly of two polysaccharides, agarose and agaran.The building blocks (i.e. monomers) of agarose, theunbranched gelling segment of the polymer skeleton, are 3-linked b-D-galactose (G) and 4-linked 3,6-anhydro-a-L-galactose(LA). When the anhydride bridge is absent, the polysaccharideis termed agaran and is composed of 3-linked b-D-galactose (G)
versidade do Porto, Rua Dr Roberto Frias,
.up.pt
-UP, L4), Departamento de Quımica e
sidade do Porto, Rua do Campo Alegre
Tecnologia, Universidade Nova de Lisboa,
tion (ESI) available. See DOI:
Chemistry 2013
and 4-linked a-L-galactose (L) residues. The structural regularityof agar chains may be masked in numerous ways due to thepresence of substituent groups such as sulfate esters, methylethers, pyruvate acid ketals and more rarely, other sugar resi-dues.3,4 Different arrangements and relative contents of agarbuilding blocks will result in polysaccharides with distinctproperties. The ability to form thermoreversible physicalhydrogels with large thermal hysteresis5–8 makes agar widelyused in several applications such as in food, pharmaceutical,biotechnological and biomedical industries.9–17 Although thefood market has still by far the largest contribution to the agarindustry16 in recent years, emerging areas such as tissue engi-neering12,15,18 and “smart” materials14,19 production, havebecome key applications. When using Gracilaria seaweeds anddepending on the nal application, two types of agars can beextracted.20 If so-texture products (i.e. gel strength�30 to 200 gcm�2) are desired, native agars (NA) with low gelling characterare the most appropriate.10 Contrarily, if hard-texture modiersare needed, alkali-modied agars (AA) should be considered.Superior-grade agars such as AA (i.e. gel strength >700 g cm�2 ina 1.5% (w/w) solution),10 are obtained by the inclusion of an
Soft Matter, 2013, 9, 3131–3139 | 3131
Soft Matter Paper
Dow
nloa
ded
by U
nive
rsity
of
Con
nect
icut
on
17 M
arch
201
3Pu
blis
hed
on 0
6 Fe
brua
ry 2
013
on h
ttp://
pubs
.rsc
.org
| do
i:10.
1039
/C3S
M27
131E
View Article Online
alkaline step prior to the extraction process, which will promotethe conversion of a-L-galactose 6-sulfate (L6S) in LA units,responsible for the polymers' gelling ability.6,21
In recent years, the Microwave-Assisted Extraction (MAE)technique has become a preferential methodology wherenatural products extractions are concerned.22–26 In previouspioneer research, we have explored with great success MAE27,28
as an alternative to NA and AA conventional extractions,29 per-formed with thermal heating. Besides the signicant reductionsin extraction time and solvent volume, the use of MAE allowed asignicant increase in NA and AA recoveries and remarkablyenhanced the gelling properties in the case of the alkali-modi-ed polysaccharides.
Agar hydrogels form upon cooling of a homogeneous solutionprepared in boiling water. The complexity underlying agar gela-tion made it a widely discussed subject among researchers in thepast years.6,7,30–34 At high temperatures agar molecules arebelieved to exist in a random coil state and move towards anordered conformation when cooled to temperatures below thepolymer's gelation point (�30 to 40 �C) (i.e. coil-to-helix transi-tion or 2n (coil) 4 n (double helix)). Intensive interhelical asso-ciation then takes place (i.e. helix-to-helix aggregation or n(double helix) 4 double helix assemblies) until the systemapproaches the global minimum of free energy.34–38 The agar'sroute to gelation will be markedly inuenced by its physico-chemical properties.6 While the anhydride bridge of the LAresidues will confer high stability to the polymer and enhance itscapability of forming the double helices, the sulfate groups willintroduce kinks during the intermolecular associations leadingto soer hydrogels.30,37 Also, the molecular mass4,6,35 of agars isreported to be an inuential parameter in the gelation process.
The current work summarizes the main ndings related tothe research work carried out on these novel optimized MAEagars. To the best of our knowledge, AFM studies on themolecular architectures of agars in solutions of sub-gellingmacroscopic concentrations (i.e. dilute regime) or on agarsobtained by MAE have not been published so far. Furthermore,the promising results achieved with the application of a greenerapproach such as MAE to the isolation of agar-like poly-saccharides27,28 clearly justies a more thorough characteriza-tion of these MAE agars.
The evolution of the assemblies upon concentration increaseof NA and AA was investigated by imaging dilute (5, 10, 50 and100 mg mL�1) and concentrated (1.5% (w/w)) aqueous media bymeans of AFM and cryoSEM, respectively. The obtained datawere discussed in the light of the theoretical model proposedfor agar gelation30,34 as well as the nature of the polymericchains (i.e. sulfate/LA ratio and molecular mass). Large defor-mation studies were performed on the equilibrated hydrogels(i.e. concentrated regime) and correlated with the 3D polymericnetworks observed by cryoSEM.
ExperimentalChemicals
Commercial agar from Sigma-Aldrich Co. (A-7002, St. Louis,MO, (C12H18O9)n) was used as reference. The reagents used in
3132 | Soft Matter, 2013, 9, 3131–3139
these experiments included: hydrochloric acid (Panreac, 37%v/v, HCl), resorcin (Sigma-Aldrich, $99.0%, C6H6O2), acetalde-hyde diethyl acetal (Fluka, $95.0%, C6H14O2), trichloroaceticacid (Panreac, CCl3COOH), ethanol (Aga, 96% v/v), sodiumhydroxide (Pronalab, $98.6%, NaOH), acetic acid (Sigma-Aldrich, $99%, CH3COOH), sodium nitrate (Merck, $99.5%,NaNO3), all of analytical grade and used as received. The stan-dards, D(+)-xylose (95729, C5H10O5), D(+)-glucose (G5767,C6H12O6), D(+)-galactose (G0750, C6H12O6), D(�)-fructose F0127,C6H12O6) and agarose, type II (A6877, (C24H38O19)n) werepurchased from Sigma-Aldrich; pullulans were from Shodex(Showa Denko, Japan; (C6H12O5)n) and sodium sulfate fromFluka (puriss p.a. ACS $ 99.0%). 3-(Trimethylsilyl)propionic-2,2,3,3-d4 acid sodium salt (TSP, Sigma-Aldrich) and deuteriumoxide (Merck, $ 99.9%, D2O) were used in NMR analysis.
Seaweed preparation
Agar samples were extracted from Gracilaria vermiculophyllacollected at Ria de Aveiro, Portugal (40�380 0N, 8�4300W), inJanuary 2011. The month of collection and the preparation ofthe seaweeds were described in a previous report.29 In the caseof AA, the seaweeds were pretreated with a 6% (w/w) NaOHsolution for 3.5 h at 85 �C before the MAE treatment, following aprotocol described elsewhere.27,29 Two samples were consid-ered, AA1 and AA2, according to the used MAE conditions. Inthe case of NA, the dried biomass was directly put in theextraction vessels of the microwave apparatus without previoustreatment.
Microwave-assisted extraction
The extraction procedure has been described elsewhere.27,28
Briey, agar samples were extracted in a MARS-X 1500 W(Microwave Accelerated Reaction System for Extraction andDigestion, CEM, Mathews, NC, USA), coupled with an incorpo-rated sensor to detect solvent leaks, and at maximum magne-tron power (100%). The following optimal operationalparameters (extraction time, temperature, solvent volume,stirring speed) were set in the equipment according to previousoptimization works: NA (15 min, 120 �C, 40 mL, medium),28 AA1(20 min, 110 �C, 40 mL, no stirring)27 and AA2 (5 min, 90 �C,20 mL, maximum).27 The extracts were puried and the hydra-tion degree of the samples estimated according to our earlierreport.28
FTIR and NMR analysis
The NMR experiments (non-spinning at 80 �C in a 400 MHzBruker Avance III spectrometer, using a 5 mm QNP probeequipped with a z gradient coil) were carried out at CEMUP(Centro de Materiais da Universidade do Porto) Porto, Portugal.The samples were dissolved in D2O to a nal concentration of15 mg mL�1 and TSP was used as internal reference (dH ¼�0.017 ppm; dC¼�0.18 ppm). The adopted procedure followeda previous work28 with somemodications. The 1H NMR spectrawere obtained with a 5.11 s acquisition time, 6400 Hz spectralwidth and an average number of 16 scans while the 13C NMRdata were acquired with a 1.42 s acquisition time, a spectral
This journal is ª The Royal Society of Chemistry 2013
Paper Soft Matter
Dow
nloa
ded
by U
nive
rsity
of
Con
nect
icut
on
17 M
arch
201
3Pu
blis
hed
on 0
6 Fe
brua
ry 2
013
on h
ttp://
pubs
.rsc
.org
| do
i:10.
1039
/C3S
M27
131E
View Article Online
width of 23 000 Hz and an average number of scans of 15 000.The 1H–13C correlations were recorded through a phase-sensi-tive HSQC (heteronuclear single quantum coherence) experi-ment using the following parameters: 0.2 s acquisition time,(5000, 20 000) Hz spectral width and 128 average scans. The AA2sample was further investigated through 1D 13C APT (attachedproton test; a relaxation delay of 2.0 s, 1.42 s acquisition time, aspectral width of 23 000 Hz and 5000 scans) and 2D HMBC(heteronuclear multiple bond correlation; relaxation delay of1.5 s, 0.39 s acquisition time (5000, 23 000) Hz spectral widthand 72 average scans) experiments. Thin polysaccharide lmsof 0.5% (w/w) concentration were analyzed in a Bomem MB-series FTIR spectrometer (ABB Bomem, Inc., Quebec) accordingto a previous procedure.28 Details of the shorthand notationused for the chemical nomenclature of agar units (i.e. 3,6-anhydro-a-L-galactose, LA; 6-O-methyl-b-D-galactose, G6M; 2-O-methyl-3,6-anhydro-a-L-galactose, LA2M; a-L-galactose 6-sulfate,L6S) can be found in the same paper.
Determination of the sulfate and sugar contents
The xylose, glucose and sulfate contents of the samples wereexamined by High-Performance Liquid Chromatography(HPLC) in DIONEX equipment, model ICS 3000. 10–20 mg ofagar were hydrolyzed under reux in 10 mL of HCl 1 mol L�1 forat least 4 h and aerwards diluted to a nal volume of 25 mL.Prior to the analysis, the hydrolysate was diluted by a factor often (1 : 10) and passed through a lter with a porosity of 0.2 mm.The sulfate determination was carried out in an IonPac AS15column (Dionex) with an IonPac AG15 pre-column, equippedwith a conductivity detector with suppression (suppressorASRS300 4 mm). The analysis was performed at 30 �C usingNaOH (38 mM) as eluent, at a ow rate of 1.2 mL min�1.
For the sugar content, a CarboPac column with a pre-columnBioLC AminoTrap, equipped with a pulsed amperometricdetector (PAD) was used. The experiments were carried out at30 �C with NaOH (18 mM) as eluent, at a ow rate of 0.9 mLmin�1. The system was washed with a 200 mM NaOH solutionbetween each injection and an 18 mM NaOH solution waspassed through the system prior to each analysis. The LAcontent was determined by the colorimetric method of Yaphe &Arsenault39 using the resorcinol-acetal reagent and with fruc-tose as standard.
Size exclusion chromatography (SEC)
The apparent number-average (Mn) and mass-average (Mw)molar masses of agars were determined by SEC using a lowtemperature Waters Co. apparatus with a Waters Ultrahydrogellinear column (7.8� 300 mm) and a differential refractive indexdetector (Waters 2410). The molar mass dispersity of thesamples was estimated from the ratio between Mw and Mn (ÐM
¼ Mw/Mn). Agar solutions (5 mg mL�1) were prepared in 0.1 MNaNO3, a non-aggregating salt, in order to minimize as far aspossible, the aggregation of the polysaccharide molecules. Thesolutions were ltered through a 0.45 mm lter and injectedwith a 200 mL sample loop in a Waters 510 Solvent Deliverysystem. Measurements were performed at 40 �C and a ow rate
This journal is ª The Royal Society of Chemistry 2013
of 0.8 mL min�1 using 0.1 M NaNO3 as eluent. Pullulan stan-dards with known Mw values (P-5, 5900; P-20, 22 800; P-50,47 300; P-100, 122 000; P-200, 212 000; P-400, 404 000; P-800,788 000) were used in the calibration. Chromatograms of atleast two injections were obtained with the data being recordedand analyzed with the Millenium 32 soware package.
Dilute regime studies by atomic force microscopy (AFM)
Solutions of 0.05% (w/w) concentration were prepared bydispersing each polysaccharide in distilled water with subse-quent heating at 95 �C under constant stirring for one hour.Aer complete solubilization of the polymer, the solutions werele to cool at room temperature for 40 minutes aer which theywere diluted to the desired concentrations (5, 10, 50 and 100 mgmL�1). The pH of the solutions fell in the range 6.14–6.86.Aliquots (25 mL) of each dilute solution were deposited ontofreshly cleaved discs of mica (Muscovite V-4, 15 mm diameter,SPI Supplies�), allowed to air dry for about 20 min, washedthoroughly with Millipore water, dried under a so stream ofnitrogen, and imaged by AFM in tapping mode.
AFM imaging was performed in air at room temperatureusing a PicoLe atomic force microscope (Molecular Imaging,USA) operating in dynamic tip deection mode (AcousticAlternating Current mode, AAC). An intermittent contactregimen (tapping mode) was selected in order to avoid damageon surfaces and typical tip sticking problems. The AFM imagesof each dilute medium was obtained by imaging the force of theoscillating contacts of the tip with the sample surface. Siliconcantilever (ACT-50, AppNano, USA) with a tip (pyramidal shape)height in the range of 14–16 mm, radius of curvature (ROC)lower than 10 nm, spring constant of 25–75 Nm�1, and a typicalresonance frequency in the range 200–400 kHz was used for thispurpose. Several macroscopically separated areas of the micasurface were scanned in topography, amplitude, and phasemodes with a resolution of 512 � 512 pixels and are represen-tative of 5 mm� 5 mm and/or 3 mm� 3 mm regions over differentlocations on the studied mica surfaces. AFM images were cor-rected for bow/tilt by a second-order attening using the Pico-View� 1.8.2 soware (Agilent Technologies). The averageheights (Hav) as well as the height proles along the lines drawnover the topographic AFM images were obtained using the freeGwyddion 2.22 soware.
Concentrated regime studies by penetration tests andcryoScanning Electron Microscopy (cryoSEM)
Agar hydrogels of 1.5% (w/w) concentration were preparedaccording to a previous procedure.27 The behavior of theequilibrated hydrogels under large deformations was examinedusing a texture analyzer (Stable Micro Systems model TA-XT2,Surrey, England). The failure stresses required for breaking thesurfaces of the gels and respective strains were determinedthrough penetration tests performed with a cylindrical probe of10 mm diameter at a penetration rate of 0.2 mm s�1. At leastthree measurements were performed for each agar sample.
The cryoSEM studies of agar hydrogels (1.5% (w/w)) wereperformed at CEMUP, Porto, Portugal. A small sample volume
Soft Matter, 2013, 9, 3131–3139 | 3133
Soft Matter Paper
Dow
nloa
ded
by U
nive
rsity
of
Con
nect
icut
on
17 M
arch
201
3Pu
blis
hed
on 0
6 Fe
brua
ry 2
013
on h
ttp://
pubs
.rsc
.org
| do
i:10.
1039
/C3S
M27
131E
View Article Online
(approx. 1–3 mm3) was mounted on aluminum stubs andrapidly frozen through quick plunging in a nitrogen slush(�210 �C). Aer freezing, the sample was transferred to an ALTO2500 cryo-preparation chamber and placed on a cool stage(�150 �C), where it was fractured. The ice formed on theexposed fractured gel surface was removed by sublimationat �90 �C for 1.5 min. Aerwards, the sample was coated with asputtered Au–Pd thin lm at �150 �C for 40 s, from a sputterhead using ultrapure argon gas. The analysis was performedat �150 �C in a JEOL JSM 6301F scanning electron microscopeequipped with a Gatan ALTO 2500 cryo-preparation chamberusing an accelerating voltage of 15 kV and working distances of15 mm.
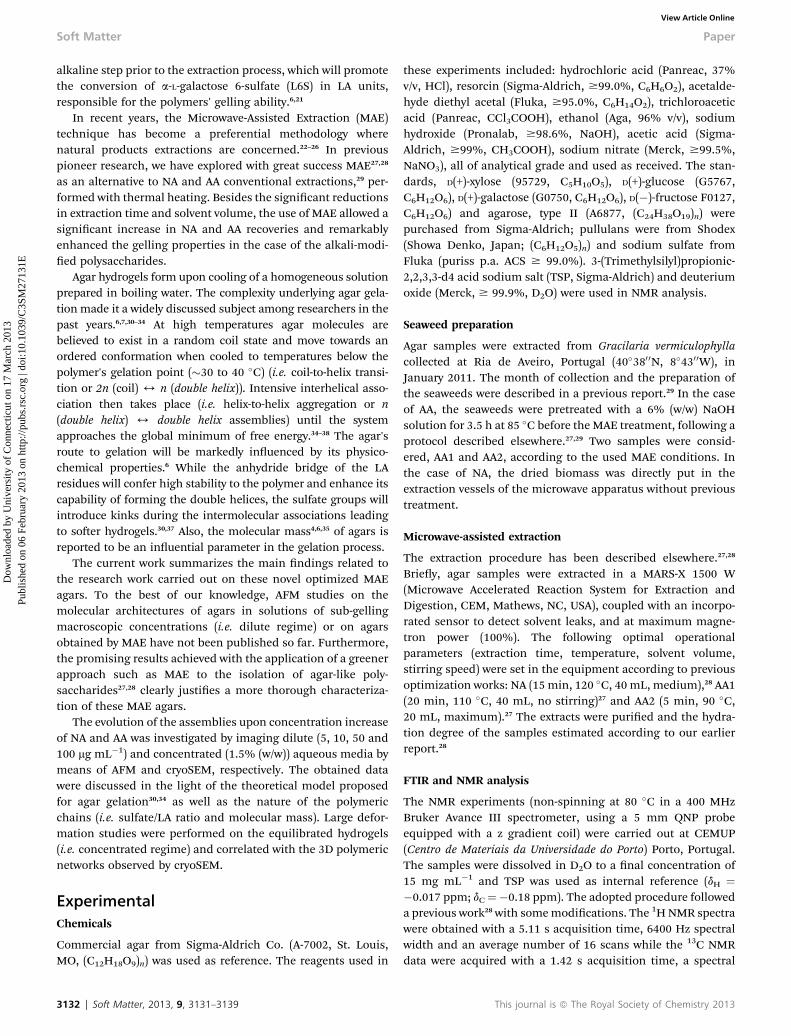
Fig. 1 1H NMR spectra (400 MHz) of NA (a) and AA2 (b) samples in D2O (dataobtained at 80 �C with the following conditions: 5.11 s acquisition time, 1.0 srelaxation delay, a spectral width of 6400 Hz and an average of 16 scans). Thealkaline modification minimizes the peak of the C1 of the L6S residues. The regionof the methylated segments, LA2M and G6M,28 is identified in the marked inset.
Results and discussionCharacterization of the polysaccharides
As explained in the introductory section, the structural regu-larity of agar's backbone is oen modied by the presence ofsubstituent groups. These modications, induced by physio-logical (seaweeds' life cycle) and environmental (growth condi-tions, season of collection) aspects as well as the extractionconditions, will dene the nal properties of the poly-saccharides.4,21 For instance, the alkaline treatment of agarcauses the conversion of the L6S monomers in LA units.4,11
Sulfates at C6S are an exception in that they are eliminatedduring the formation of the anhydride rings; all the othersulfate groups present in agar skeleton are stable in this alka-line modication.5 Since detailed FTIR and NMR characteriza-tions of related agar samples are available elsewhere,28 we willonly focus our attention on the properties which are relevant forthe present study. Additional spectroscopic information (HSQC,13C APT, HMBC and FTIR spectra) can be found in the ESI(Fig. S1–S5†). The sugars, total sulfate and LA contents of thesamples quantied by liquid chromatography and colorimetricmethods are presented in Table 1.
The alkaline modication minimized the proton signalrelated to the L6S residues (around 5.28 ppm) in the 1H NMRspectra of AA (e.g. AA2 spectrum in Fig. 1b). Further proof of theconversion of these sulfated monomers into their anhydride‘precursor’ units during the alkaline treatment was obtained bythe 2D HSQC experiments (Fig. S1–S3 in the ESI†).28 Typicalsignals of additional monosaccharides such as xylose and
Table 1 Chemical characterization of native (NA) and alkali-modified (AA1 andAA2) agars. Commercial agar (CA) from Sigma-Aldrich was used as reference
Chemical properties NA AA1 AA2 CA
LAa (%wt) 23.2 � 0.4 34.2 � 1.1 40.7 � 1.1 43.5 � 0.9Sulfb (%wt) 3.22 1.73 1.54 1.42 � 0.08Glucb (%wt) tr. tr. tr. tr.Xylb (%wt) tr. n.d. tr. tr.Water (%) 12.0 14.3 13.2 12.9
a Determined by the colorimetric method of Yaphe & Arsenault.39b Sulfate (Sulf), glucose (Gluc) and xylose (Xyl) contents determined byliquid chromatography; maximum standard deviation of 0.17%; tr –traces (<0.002%); n.d. – not detected.
3134 | Soft Matter, 2013, 9, 3131–3139
glucose were not resolved which fairly agreed with the residualamounts detected through liquid chromatography (Table 1).The chemical analysis showed a higher sulfate content for NA(3.22%) while the sulfates detected in AA (1.73% for AA1 and1.54% for AA2) could be attributed to akali-stable ones presentin the 3-linked monomers.11,21 The amount of anhydridemonomers showed an inverse trend; NA showed by far thelowest value (�23%) in opposition to the higher values for AA1(�34%) and AA2 (�41%), the latter falling closer to the refer-ence (�43.5%).
The apparent mass-average molar masses, Mw, determinedby SEC (Table 2), seemed to suggest a substantial depolymer-ization of AA1 when compared to AA2 ((230 � 30) � 103 and(676 � 110) � 103 g mol�1, respectively). This could be attrib-uted to the more draconian MAE conditions used in the case ofAA1. NA showed an intermediate value of Mw between those ofAA1 and AA2 ((476 � 21) � 103 g mol�1) and was comparable tonative agars from other Gracilaria species extracted withthermal heating.4 The chemical conversion occurring duringthe alkaline step is expected to produce some decrease in molarmass.21 Although the intermediate Mw for NA could again be
Table 2 Physical properties of native (NA) and alkali-modified (AA1 and AA2)agars. Commercial agar (CA) from Sigma-Aldrich was used as reference
Physical properties NA AA1 AA2 CA
Failure stressa
(kPa)15 � 5 53 � 0.1 108 � 11 100 � 5
Failure strain� 10�3a
103 � 6 101 � 2 170 � 3 139 � 9
Mw � 103b
(g mol�1)476 � 20.6 230 � 30 676 � 110 392 � 40
Mn � 103b
(g mol�1)182 � 2 88 � 8 223 � 58 116 � 8
ÐMb 2.62 � 0.09 2.60 � 0.10 3.07 � 0.30 3.38 � 0.10
a Determined through penetration tests performed on 1.5% (w/w) agargels. b Determined through size exclusion chromatography.
This journal is ª The Royal Society of Chemistry 2013

Fig. 2 Topographical (A, C and E) and equivalent amplitude (B, D and F) AFMimages of NA structures formed on the 5 (A and B), 10 (C and D) and 100 (E and F)mg mL�1 dilute aqueous solutions when deposited onto mica and air dried. Theimage size is 5 mm � 5 mm. Examples of NA aggregates (1), local networks (2),cyclic structures (3), individual fibers (4) and branching (5) are identified bynumbered arrows.
Paper Soft Matter
Dow
nloa
ded
by U
nive
rsity
of
Con
nect
icut
on
17 M
arch
201
3Pu
blis
hed
on 0
6 Fe
brua
ry 2
013
on h
ttp://
pubs
.rsc
.org
| do
i:10.
1039
/C3S
M27
131E
View Article Online
assigned to differences in the MAE conditions we could suspectpossible occurrence of aggregative phenomena during theSEC measurements. AA2 showed higher variability betweendifferent injections (i.e. an error range of �110 � 103 g mol�1)and simultaneously the highest molar mass dispersity, ÐM
(�3.1 � 0.3). A similar broad Mw distribution was found for thecommercial sample (�3.4 � 0.1) in opposition to the narrowestone observed for NA and AA1 (�2.6). The ÐM of NA fell in therange reported by Rodrıguez and co-workers4 for Gracilariagracilis agars (1.7–2.8). If one considers that only the agarosefraction present in agar's skeleton is monodisperse37 a higherÐM for NA (higher sulfate/LA ratio) should be expected. In thecase of MAE, however, the spectacular molecular accelerationsinduced by the use of microwave heating during extraction (i.e.in order to align with the electromagnetic eld the moleculesrotate at 4.9 � 109 times per second24) could explain theobserved values (AA2 extracted at maximum stirring in oppo-sition to the other polysaccharides). Nonetheless, problemsrelated to either particulate material not separated during thepurication step or possible aggregation are commonly asso-ciated with this type of measurement40,41 and for that reason,caution must be taken when interpreting the results.
Dilute regime studies
Details of the molecular assemblies of NA and AA were obtainedby imaging dilute aqueous media of increasing concentrations(5, 10, 50 and 100 mg mL�1) by AFM. In order to keep thenumber of gures to a reasonable level, results of the 50 mgmL�1 solutions are provided in the ESI†. Previous AFM studieshave provided relevant knowledge on the behavior of otherpolysaccharides in solution and gels.42–45 Although the relevanceof such a technique is unquestionable, it is worth noting thatthe polysaccharides are prone to certain artifacts during thesample preparation procedure.42,46,47
Inuence of media concentration
5 mm � 5 mm topographical and equivalent amplitude AFMimages of NA for the 5, 10 and 100 mg mL�1 solutions areillustrated in Fig. 2 (50 mg mL�1 studies are provided in Fig. S6of the ESI†). As the concentration increased, a progressivestructural reinforcement could be observed. At 5 mg mL�1, shortindividual bers were predominant on the NA backgroundalthough longer and thicker particles were sporadically seen(Fig. 2A/B and 6A/B). Small aggregates were also visible (seearrow 1) which could be interpreted as highly associated bersaggregated upon drying of the samples on the substrate.48 Localnetworks (2) were very rarely seen, suggesting that the chosenconcentration could be close to the critical value for networkformation. At 10 mg mL�1 (Fig. 2C/D), NA structures includedindividual bers (4) with occasional branching (5), cyclicstructures (3), aggregates (1) and local networks (2). The strandswere mainly long although shorter particles could still beobservable. Further association of agar helices at higherconcentrations (50 and 100 mg mL�1, respectively, Fig. S6† and2E/F) resulted in a polymeric network covering the substrate.Occasionally, brighter dots could be seen in the AFM
This journal is ª The Royal Society of Chemistry 2013
micrograph matching points of higher heights ((1) in Fig. S6†and 2E/F) which were attributed to brous aggregates. NAimages seemed to suggest some orientation of the bers prob-ably due to a less rigid nature of the polysaccharide.42
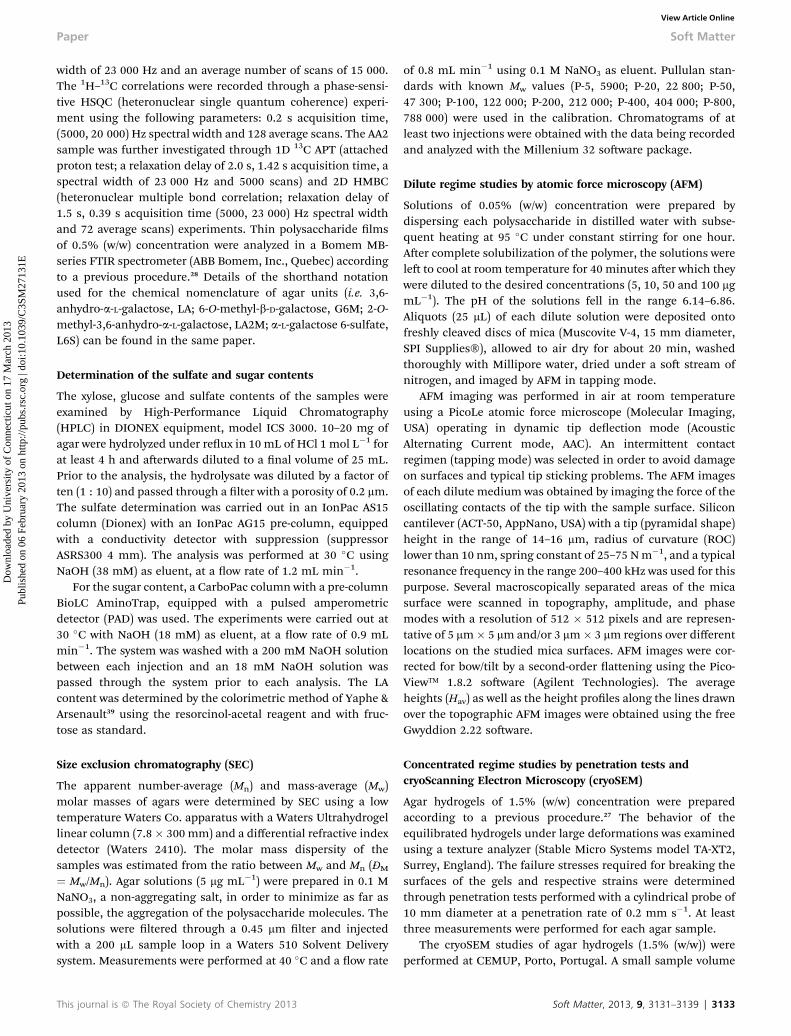
Fig. 3 shows the 5 mm � 5 mm topographical and equivalentamplitude AFM images of AA1 dried solutions on the micasurface. At the lowest polymer concentration, highly entangledbers formed networks with no particular ordering (‘randomnetworks’) (Fig. 3A/B). No clear indication of orientation orbranching of the material was obtained from the AFM imagesexamination. Small spherical or odd shaped aggregates weresporadically seen resulting as previously, in brighter regions inthe AFM micrographs ((1) in Fig. 3A/B). Deposition of AA1 at10 mg mL�1 resulted in reinforced ‘random networks’ whichfurther developed into polymeric layers at higher concentra-tions (50 and 100 mg mL�1). Here in addition, occasionalaggregates resulted in brighter dots in the AFM images ((1) inFig. 3E/F).
Fig. 4 provides information on the molecular assemblies ofAA2 in dilute aqueous media, when adsorbed onto mica. At 5 mgmL�1, well-dened bers with different degrees of entangle-ment could be seen in great detail (Fig. 4A/B). The elongatedshape and variable lengths of the strands suggested polymerchains with non-uniform sizes.42 This agreed well with the ÐM
estimations by SEC. Also, the bers seemed rigid enough toprevent orientation during the spreading of the sample.42
Soft Matter, 2013, 9, 3131–3139 | 3135
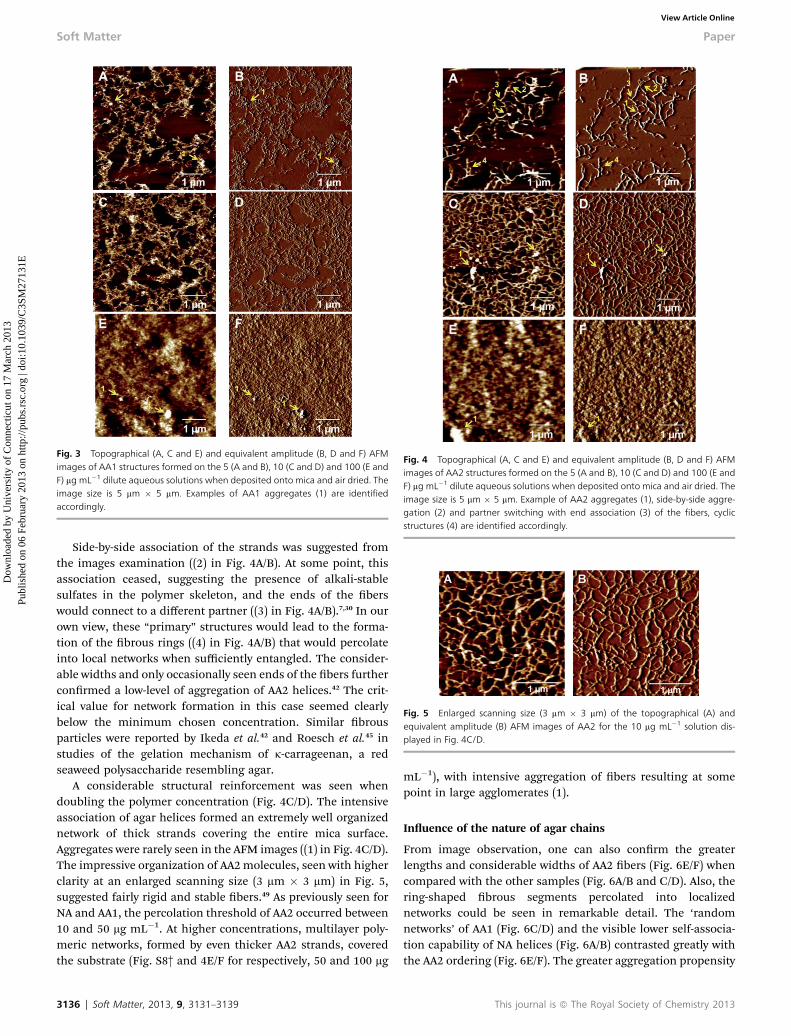
Fig. 3 Topographical (A, C and E) and equivalent amplitude (B, D and F) AFMimages of AA1 structures formed on the 5 (A and B), 10 (C and D) and 100 (E andF) mg mL�1 dilute aqueous solutions when deposited onto mica and air dried. Theimage size is 5 mm � 5 mm. Examples of AA1 aggregates (1) are identifiedaccordingly.
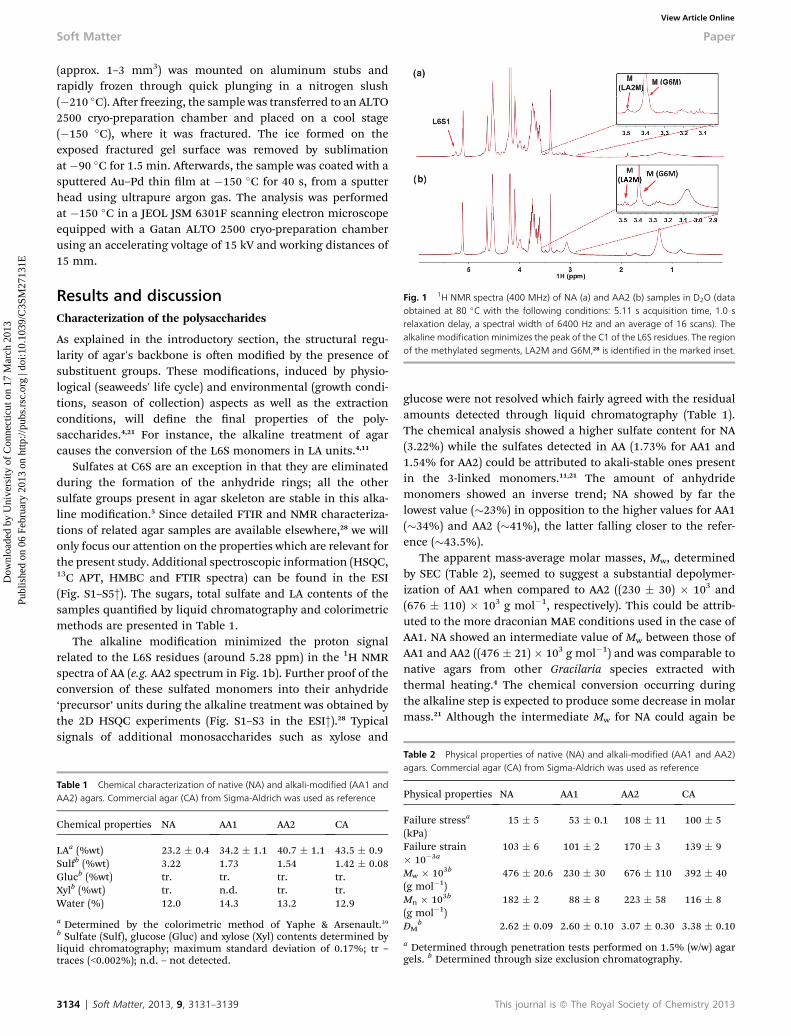
Fig. 4 Topographical (A, C and E) and equivalent amplitude (B, D and F) AFMimages of AA2 structures formed on the 5 (A and B), 10 (C and D) and 100 (E andF) mg mL�1 dilute aqueous solutions when deposited onto mica and air dried. Theimage size is 5 mm � 5 mm. Example of AA2 aggregates (1), side-by-side aggre-gation (2) and partner switching with end association (3) of the fibers, cyclicstructures (4) are identified accordingly.
Fig. 5 Enlarged scanning size (3 mm � 3 mm) of the topographical (A) andequivalent amplitude (B) AFM images of AA2 for the 10 mg mL�1 solution dis-played in Fig. 4C/D.
Soft Matter Paper
Dow
nloa
ded
by U
nive
rsity
of
Con
nect
icut
on
17 M
arch
201
3Pu
blis
hed
on 0
6 Fe
brua
ry 2
013
on h
ttp://
pubs
.rsc
.org
| do
i:10.
1039
/C3S
M27
131E
View Article Online
Side-by-side association of the strands was suggested fromthe images examination ((2) in Fig. 4A/B). At some point, thisassociation ceased, suggesting the presence of alkali-stablesulfates in the polymer skeleton, and the ends of the berswould connect to a different partner ((3) in Fig. 4A/B).7,30 In ourown view, these “primary” structures would lead to the forma-tion of the brous rings ((4) in Fig. 4A/B) that would percolateinto local networks when sufficiently entangled. The consider-able widths and only occasionally seen ends of the bers furtherconrmed a low-level of aggregation of AA2 helices.42 The crit-ical value for network formation in this case seemed clearlybelow the minimum chosen concentration. Similar brousparticles were reported by Ikeda et al.42 and Roesch et al.45 instudies of the gelation mechanism of k-carrageenan, a redseaweed polysaccharide resembling agar.
A considerable structural reinforcement was seen whendoubling the polymer concentration (Fig. 4C/D). The intensiveassociation of agar helices formed an extremely well organizednetwork of thick strands covering the entire mica surface.Aggregates were rarely seen in the AFM images ((1) in Fig. 4C/D).The impressive organization of AA2molecules, seen with higherclarity at an enlarged scanning size (3 mm � 3 mm) in Fig. 5,suggested fairly rigid and stable bers.49 As previously seen forNA and AA1, the percolation threshold of AA2 occurred between10 and 50 mg mL�1. At higher concentrations, multilayer poly-meric networks, formed by even thicker AA2 strands, coveredthe substrate (Fig. S8† and 4E/F for respectively, 50 and 100 mg
3136 | Soft Matter, 2013, 9, 3131–3139
mL�1), with intensive aggregation of bers resulting at somepoint in large agglomerates (1).
Inuence of the nature of agar chains
From image observation, one can also conrm the greaterlengths and considerable widths of AA2 bers (Fig. 6E/F) whencompared with the other samples (Fig. 6A/B and C/D). Also, thering-shaped brous segments percolated into localizednetworks could be seen in remarkable detail. The ‘randomnetworks’ of AA1 (Fig. 6C/D) and the visible lower self-associa-tion capability of NA helices (Fig. 6A/B) contrasted greatly withthe AA2 ordering (Fig. 6E/F). The greater aggregation propensity
This journal is ª The Royal Society of Chemistry 2013
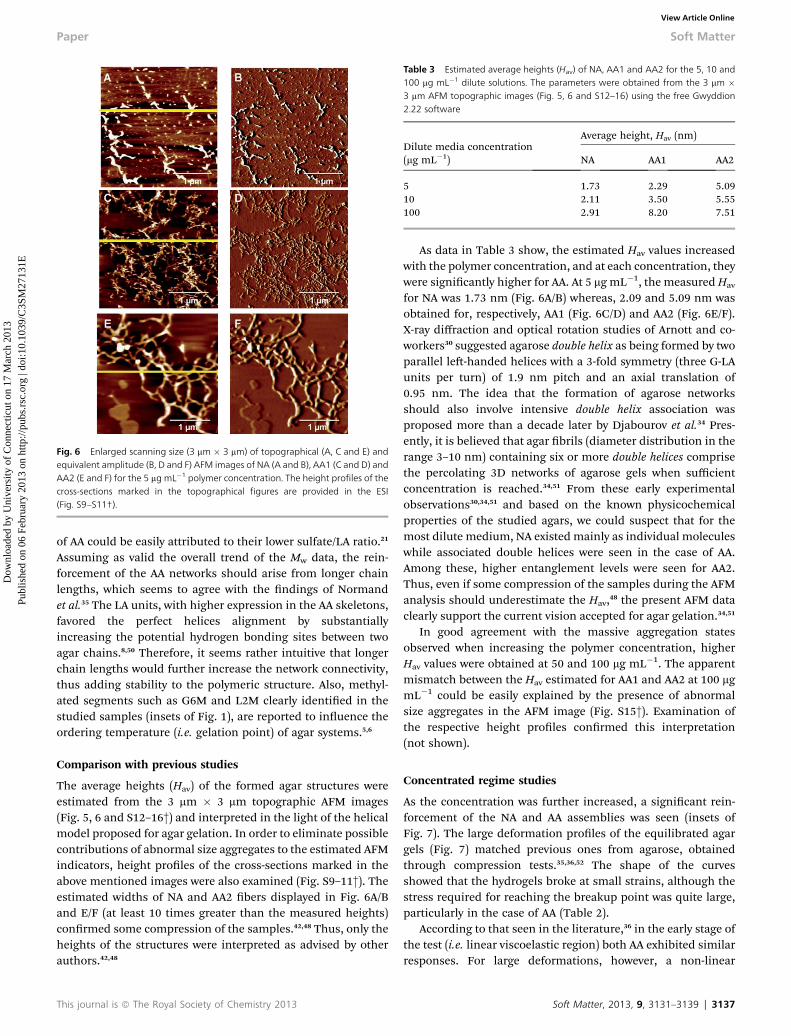
Fig. 6 Enlarged scanning size (3 mm � 3 mm) of topographical (A, C and E) andequivalent amplitude (B, D and F) AFM images of NA (A and B), AA1 (C and D) andAA2 (E and F) for the 5 mg mL�1 polymer concentration. The height profiles of thecross-sections marked in the topographical figures are provided in the ESI(Fig. S9–S11†).
Table 3 Estimated average heights (Hav) of NA, AA1 and AA2 for the 5, 10 and100 mg mL�1 dilute solutions. The parameters were obtained from the 3 mm �3 mm AFM topographic images (Fig. 5, 6 and S12–16) using the free Gwyddion2.22 software
Dilute media concentration(mg mL�1)
Average height, Hav (nm)
NA AA1 AA2
5 1.73 2.29 5.0910 2.11 3.50 5.55100 2.91 8.20 7.51
Paper Soft Matter
Dow
nloa
ded
by U
nive
rsity
of
Con
nect
icut
on
17 M
arch
201
3Pu
blis
hed
on 0
6 Fe
brua
ry 2
013
on h
ttp://
pubs
.rsc
.org
| do
i:10.
1039
/C3S
M27
131E
View Article Online
of AA could be easily attributed to their lower sulfate/LA ratio.21
Assuming as valid the overall trend of the Mw data, the rein-forcement of the AA networks should arise from longer chainlengths, which seems to agree with the ndings of Normandet al.35 The LA units, with higher expression in the AA skeletons,favored the perfect helices alignment by substantiallyincreasing the potential hydrogen bonding sites between twoagar chains.8,50 Therefore, it seems rather intuitive that longerchain lengths would further increase the network connectivity,thus adding stability to the polymeric structure. Also, methyl-ated segments such as G6M and L2M clearly identied in thestudied samples (insets of Fig. 1), are reported to inuence theordering temperature (i.e. gelation point) of agar systems.5,6
Comparison with previous studies
The average heights (Hav) of the formed agar structures wereestimated from the 3 mm � 3 mm topographic AFM images(Fig. 5, 6 and S12–16†) and interpreted in the light of the helicalmodel proposed for agar gelation. In order to eliminate possiblecontributions of abnormal size aggregates to the estimated AFMindicators, height proles of the cross-sections marked in theabove mentioned images were also examined (Fig. S9–11†). Theestimated widths of NA and AA2 bers displayed in Fig. 6A/Band E/F (at least 10 times greater than the measured heights)conrmed some compression of the samples.42,48 Thus, only theheights of the structures were interpreted as advised by otherauthors.42,48
This journal is ª The Royal Society of Chemistry 2013
As data in Table 3 show, the estimated Hav values increasedwith the polymer concentration, and at each concentration, theywere signicantly higher for AA. At 5 mg mL�1, the measuredHav
for NA was 1.73 nm (Fig. 6A/B) whereas, 2.09 and 5.09 nm wasobtained for, respectively, AA1 (Fig. 6C/D) and AA2 (Fig. 6E/F).X-ray diffraction and optical rotation studies of Arnott and co-workers30 suggested agarose double helix as being formed by twoparallel le-handed helices with a 3-fold symmetry (three G-LAunits per turn) of 1.9 nm pitch and an axial translation of0.95 nm. The idea that the formation of agarose networksshould also involve intensive double helix association wasproposed more than a decade later by Djabourov et al.34 Pres-ently, it is believed that agar brils (diameter distribution in therange 3–10 nm) containing six or more double helices comprisethe percolating 3D networks of agarose gels when sufficientconcentration is reached.34,51 From these early experimentalobservations30,34,51 and based on the known physicochemicalproperties of the studied agars, we could suspect that for themost dilute medium, NA existed mainly as individual moleculeswhile associated double helices were seen in the case of AA.Among these, higher entanglement levels were seen for AA2.Thus, even if some compression of the samples during the AFManalysis should underestimate the Hav,48 the present AFM dataclearly support the current vision accepted for agar gelation.34,51
In good agreement with the massive aggregation statesobserved when increasing the polymer concentration, higherHav values were obtained at 50 and 100 mg mL�1. The apparentmismatch between the Hav estimated for AA1 and AA2 at 100 mgmL�1 could be easily explained by the presence of abnormalsize aggregates in the AFM image (Fig. S15†). Examination ofthe respective height proles conrmed this interpretation(not shown).
Concentrated regime studies
As the concentration was further increased, a signicant rein-forcement of the NA and AA assemblies was seen (insets ofFig. 7). The large deformation proles of the equilibrated agargels (Fig. 7) matched previous ones from agarose, obtainedthrough compression tests.35,36,52 The shape of the curvesshowed that the hydrogels broke at small strains, although thestress required for reaching the breakup point was quite large,particularly in the case of AA (Table 2).
According to that seen in the literature,36 in the early stage ofthe test (i.e. linear viscoelastic region) both AA exhibited similarresponses. For large deformations, however, a non-linear
Soft Matter, 2013, 9, 3131–3139 | 3137
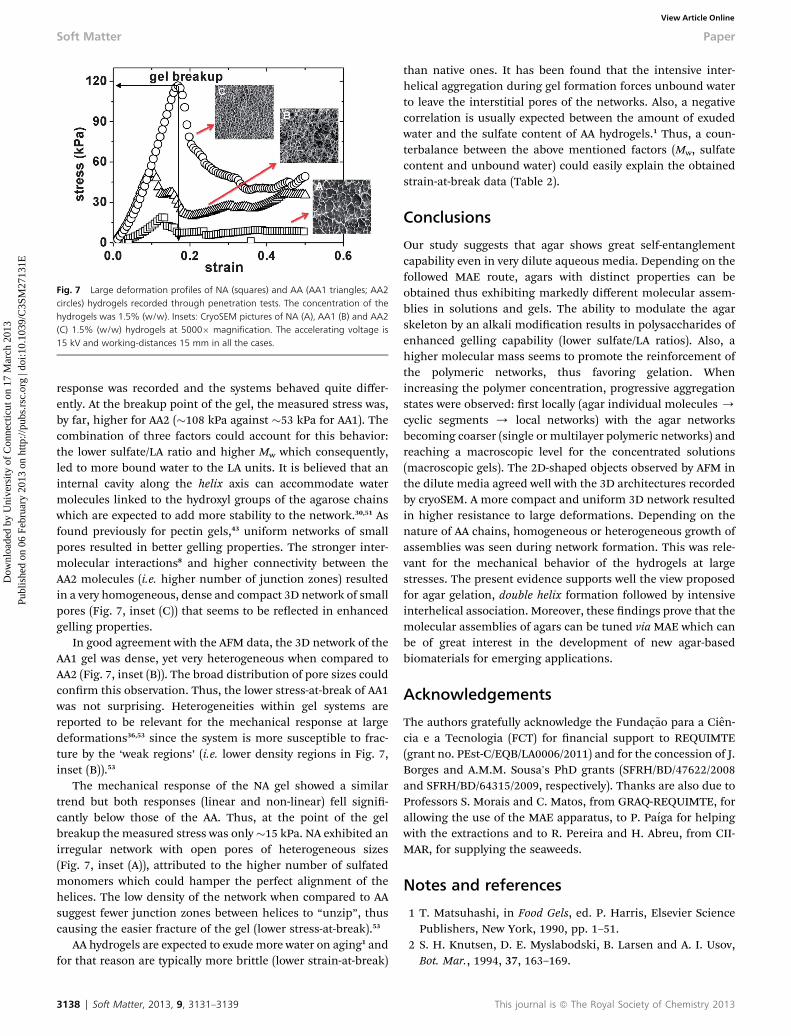
Fig. 7 Large deformation profiles of NA (squares) and AA (AA1 triangles; AA2circles) hydrogels recorded through penetration tests. The concentration of thehydrogels was 1.5% (w/w). Insets: CryoSEM pictures of NA (A), AA1 (B) and AA2(C) 1.5% (w/w) hydrogels at 5000� magnification. The accelerating voltage is15 kV and working-distances 15 mm in all the cases.
Soft Matter Paper
Dow
nloa
ded
by U
nive
rsity
of
Con
nect
icut
on
17 M
arch
201
3Pu
blis
hed
on 0
6 Fe
brua
ry 2
013
on h
ttp://
pubs
.rsc
.org
| do
i:10.
1039
/C3S
M27
131E
View Article Online
response was recorded and the systems behaved quite differ-ently. At the breakup point of the gel, the measured stress was,by far, higher for AA2 (�108 kPa against �53 kPa for AA1). Thecombination of three factors could account for this behavior:the lower sulfate/LA ratio and higher Mw which consequently,led to more bound water to the LA units. It is believed that aninternal cavity along the helix axis can accommodate watermolecules linked to the hydroxyl groups of the agarose chainswhich are expected to add more stability to the network.30,51 Asfound previously for pectin gels,43 uniform networks of smallpores resulted in better gelling properties. The stronger inter-molecular interactions8 and higher connectivity between theAA2 molecules (i.e. higher number of junction zones) resultedin a very homogeneous, dense and compact 3D network of smallpores (Fig. 7, inset (C)) that seems to be reected in enhancedgelling properties.
In good agreement with the AFM data, the 3D network of theAA1 gel was dense, yet very heterogeneous when compared toAA2 (Fig. 7, inset (B)). The broad distribution of pore sizes couldconrm this observation. Thus, the lower stress-at-break of AA1was not surprising. Heterogeneities within gel systems arereported to be relevant for the mechanical response at largedeformations36,53 since the system is more susceptible to frac-ture by the ‘weak regions’ (i.e. lower density regions in Fig. 7,inset (B)).53
The mechanical response of the NA gel showed a similartrend but both responses (linear and non-linear) fell signi-cantly below those of the AA. Thus, at the point of the gelbreakup the measured stress was only�15 kPa. NA exhibited anirregular network with open pores of heterogeneous sizes(Fig. 7, inset (A)), attributed to the higher number of sulfatedmonomers which could hamper the perfect alignment of thehelices. The low density of the network when compared to AAsuggest fewer junction zones between helices to “unzip”, thuscausing the easier fracture of the gel (lower stress-at-break).53
AA hydrogels are expected to exudemore water on aging1 andfor that reason are typically more brittle (lower strain-at-break)
3138 | Soft Matter, 2013, 9, 3131–3139
than native ones. It has been found that the intensive inter-helical aggregation during gel formation forces unbound waterto leave the interstitial pores of the networks. Also, a negativecorrelation is usually expected between the amount of exudedwater and the sulfate content of AA hydrogels.1 Thus, a coun-terbalance between the above mentioned factors (Mw, sulfatecontent and unbound water) could easily explain the obtainedstrain-at-break data (Table 2).
Conclusions
Our study suggests that agar shows great self-entanglementcapability even in very dilute aqueous media. Depending on thefollowed MAE route, agars with distinct properties can beobtained thus exhibiting markedly different molecular assem-blies in solutions and gels. The ability to modulate the agarskeleton by an alkali modication results in polysaccharides ofenhanced gelling capability (lower sulfate/LA ratios). Also, ahigher molecular mass seems to promote the reinforcement ofthe polymeric networks, thus favoring gelation. Whenincreasing the polymer concentration, progressive aggregationstates were observed: rst locally (agar individual molecules /cyclic segments / local networks) with the agar networksbecoming coarser (single or multilayer polymeric networks) andreaching a macroscopic level for the concentrated solutions(macroscopic gels). The 2D-shaped objects observed by AFM inthe dilute media agreed well with the 3D architectures recordedby cryoSEM. A more compact and uniform 3D network resultedin higher resistance to large deformations. Depending on thenature of AA chains, homogeneous or heterogeneous growth ofassemblies was seen during network formation. This was rele-vant for the mechanical behavior of the hydrogels at largestresses. The present evidence supports well the view proposedfor agar gelation, double helix formation followed by intensiveinterhelical association. Moreover, these ndings prove that themolecular assemblies of agars can be tuned via MAE which canbe of great interest in the development of new agar-basedbiomaterials for emerging applications.
Acknowledgements
The authors gratefully acknowledge the Fundaç~ao para a Cien-cia e a Tecnologia (FCT) for nancial support to REQUIMTE(grant no. PEst-C/EQB/LA0006/2011) and for the concession of J.Borges and A.M.M. Sousa's PhD grants (SFRH/BD/47622/2008and SFRH/BD/64315/2009, respectively). Thanks are also due toProfessors S. Morais and C. Matos, from GRAQ-REQUIMTE, forallowing the use of the MAE apparatus, to P. Paıga for helpingwith the extractions and to R. Pereira and H. Abreu, from CII-MAR, for supplying the seaweeds.
Notes and references
1 T. Matsuhashi, in Food Gels, ed. P. Harris, Elsevier SciencePublishers, New York, 1990, pp. 1–51.
2 S. H. Knutsen, D. E. Myslabodski, B. Larsen and A. I. Usov,Bot. Mar., 1994, 37, 163–169.
This journal is ª The Royal Society of Chemistry 2013
Paper Soft Matter
Dow
nloa
ded
by U
nive
rsity
of
Con
nect
icut
on
17 M
arch
201
3Pu
blis
hed
on 0
6 Fe
brua
ry 2
013
on h
ttp://
pubs
.rsc
.org
| do
i:10.
1039
/C3S
M27
131E
View Article Online
3 A. I. Usov, Food Hydrocolloids, 1998, 12, 301–308.4 M. C. Rodrıguez, M. C. Matulewicz, M. D. Noseda,D. R. B. Ducatti and P. I. Leonardi, Bioresour. Technol.,2009, 100, 1435–1441.
5 M. Lahaye and C. Rochas, Hydrobiologia, 1991, 221, 137–148.
6 K. T. Nijenhuis, Adv. Polym. Sci., 1997, 130, 194–202.7 A. H. Clark and S. B. Ross-Murphy, Adv. Polym. Sci., 1987, 83,107–125.
8 S. Boral, A. Saxena and H. B. Bohidar, J. Phys. Chem. B, 2008,112, 3625–3632.
9 D. J. McHugh, A Guide to the Seaweed Industry, FAO FisheriesTechnical Paper 441, Food and Agriculture Organization ofthe United Nations, Rome, 2003, p. 21.
10 F. Pereira-Pacheco, D. Robledo, L. Rodriguez-Carvajal andY. Freile-Pelegrin, Bioresour. Technol., 2007, 98, 1278–1284.
11 J. B. Romero, R. D. Villanueva and M. N. E. Montano,Bioresour. Technol., 2008, 99, 8151–8155.
12 Z. Cao, R. J. Gilbert and W. He, Biomacromolecules, 2009, 10,2954–2959.
13 N. Benmouhoub, N. Simmonet, N. Agoudjil and T. Coradin,Green Chem., 2008, 10, 957–964.
14 T. Singh, T. J. Trivedi and A. Kumar, Green Chem., 2010, 12,1029–1035.
15 V. T. Nayar, J. D. Weiland, C. S. Nelson and A. M. Hodge,J. Mech. Behav. Biomed. Mater., 2012, 7, 60–68.
16 V. Kumar and R. Fotedar, Carbohydr. Polym., 2009, 78, 813–819.
17 P.-L. Lam, K. K.-H. Lee, S. H.-L. Kok, G. Y.-M. Cheng,X.-M. Tao, D. K.-P. Hau, M. C.-W. Yuen, K.-H. Lam,R. Gambari, C.-H. Chui and R. S.-M. Wong, So Matter,2012, 8, 5027–5037.
18 Y. Yamada, K. Hozumi, A. Aso, A. Hotta, K. Toma, F. Katagiri,Y. Kikkawa and M. Nomizu, Biomaterials, 2012, 33, 4118–4125.
19 Z. Wang, R. Zhang, Y. Ma, A. Peng, H. Fu and J. Yao, J. Mater.Chem., 2010, 20, 271–277.
20 D. Bulone, A. Emanuele and P. L. San Biagio, Biophys. Chem.,1999, 77, 1–8.
21 E. Murano, J. Appl. Phycol., 1995, 7, 245–254.22 M. Desai, J. Parikh and P. A. Parikh, Sep. Purif. Rev., 2010, 39,
1–32.23 O. Sticher, Nat. Prod. Rep., 2008, 25, 517–554.24 K. Srogi, Anal. Lett., 2006, 39, 1261–1288.25 M. L. Fishman, H. K. Chau, P. H. Cooke and A. T. Hotchkiss,
J. Agric. Food Chem., 2008, 56, 1471–1478.26 N. Asfaw, P. Licence, A. A. Novitskii and M. Poliakoff, Green
Chem., 2005, 7, 352–356.27 A. M. M. Sousa, V. D. Alves, S. Morais, C. Delerue-Matos and
M. P. Goncalves, Bioresour. Technol., 2010, 101, 3258–3267.28 A. M. M. Sousa, S. Morais, M. H. Abreu, R. Pereira, I. Sousa-
Pinto, E. J. Cabrita, C. Delerue-Matos and M. P. Gonçalves,J. Agric. Food Chem., 2012, 60, 4977–4985.
This journal is ª The Royal Society of Chemistry 2013
29 R. D. Villanueva, A. M. M. Sousa, M. P. Goncalves, M. Nilssonand L. Hilliou, J. Appl. Phycol., 2010, 22, 211–220.
30 S. Arnott, A. Fulmer, W. E. Scott, I. C. M. Dea, R. Moorhouseand D. A. Rees, J. Mol. Biol., 1974, 90, 269–284.
31 J. Y. Xiong, J. Narayanan, X. Y. Liu, T. K. Chong, S. B. Chenand T. S. Chung, J. Phys. Chem. B, 2005, 109, 5638–5643.
32 M. Manno, A. Emanuele, V. Martorana, D. Bulone, P. L. SanBiagio, M. B. Palma-Vittorelli and M. U. Palma, Phys. Rev. E:Stat. Phys., Plasmas, Fluids, Relat. Interdiscip. Top., 1999, 59,2222–2230.
33 S. A. Foord and E. D. T. Atkins, Biopolymers, 1989, 28, 1345–1365.
34 M. Djabourov, A. H. Clark, D. W. Rowlands andS. B. Rossmurphy, Macromolecules, 1989, 22, 180–188.
35 V. Normand, D. L. Lootens, E. Amici, K. P. Plucknett andP. Aymard, Biomacromolecules, 2000, 1, 730–738.
36 P. Aymard, D. R. Martin, K. Plucknett, T. J. Foster, A. H. Clarkand I. T. Norton, Biopolymers, 2001, 59, 131–144.
37 K. C. Labropoulos, D. E. Niesz, S. C. Danforth andP. G. Kevrekidis, Carbohydr. Polym., 2002, 50, 393–406.
38 O. Ayyad, D. Munoz-Rojas, N. Agullo, S. Borros andP. Gomez-Romero, So Matter, 2010, 6, 2389–2391.
39 W. Yaphe and G. P. Arsenault, Anal. Biochem., 1965, 13, 143–148.
40 I. M. N. Vold, K. A. Kristiansen and B. E. Christensen,Biomacromolecules, 2006, 7, 2136–2146.
41 M. Milas, M. Rinaudo, I. Roure, S. Al-Assaf, G. O. Phillips andP. A. Williams, Biopolymers, 2001, 59, 191–204.
42 S. Ikeda, V. J. Morris and K. Nishinari, Biomacromolecules,2001, 2, 1331–1337.
43 M. L. Fishman, P. H. Cooke, H. K. Chau, D. R. Coffin andA. T. Hotchkiss, Jr, Biomacromolecules, 2007, 8, 573–578.
44 V. J. Morris, A. Gromer, A. R. Kirby, R. J. M. Bongaerts andA. P. Gunning, Food Hydrocolloids, 2011, 25, 230–237.
45 R. Roesch, S. Cox, S. Compton, U. Happek and M. Corredig,Food Hydrocolloids, 2004, 18, 429–439.
46 A. R. Kirby, A. P. Gunning and V. J. Morris, Biopolymers, 1996,38, 355–366.
47 A. Robic, C. Gaillard, J.-F. Sassi, Y. Lerat and M. Lahaye,Biopolymers, 2009, 91, 652–664.
48 V. J. Morris, A. R. Kirby and A. P. Gunning, Atomic ForceMicroscopy for Biologists, Imperial College Press, London,2nd edn, 2010.
49 S. Ikeda, Y. Nitta, T. Temsiripong, R. Pongsawatmanit andK. Nishinari, Food Hydrocolloids, 2004, 18, 727–735.
50 K. C. Labropoulos, S. Rangarajan, D. E. Niesz andS. C. Danforth, J. Am. Ceram. Soc., 2001, 84, 1217–1224.
51 F. V. Chavez, E. Persson and B. Halle, J. Am. Chem. Soc., 2006,128, 4902–4910.
52 E. Amici, A. H. Clark, V. Normand and N. B. Johnson,Biomacromolecules, 2000, 1, 721–729.
53 T. vanVliet and P. Walstra, Faraday Discuss., 1995, 101, 359–370.
Soft Matter, 2013, 9, 3131–3139 | 3139