Embed Size (px)
Citation preview
Shaping the bank of the futureSouth African banking survey 2013
www.pwc.co.za/banking

PwC | 3
ContentsForeword 4
Executive summary 6
Introduction 12
Evaluating trends shaping the industry and banks’ responses 16
1 External developments 16
2 Macro trends 34
3 Internal responses 44
4 Stakeholder expectations 58
5 Level of preparedness 66
Appendix 1: Peer analysis 76
Appendix 2: Additional survey results 84
Appendix 3: Research methodology 88
Appendix 4: BA 900 data 90
Contacts 98

4 | Shaping the Bank of the Future
Foreword

PwC | 5
We are pleased to launch the 13th edition of the PwC survey on banking in South Africa – Shaping the bank of the future.
The banking industry is dynamic and has evolved significantly since our last survey in 2011 as banking chief executives have adapted their strategies in response to regulatory changes and global economic pressures.
Our aim is to highlight the challenges and opportunities faced by CEOs as they position their banks to succeed in the future. We also explore industry trends to provide perspectives on how banking in South Africa may evolve over the next three years.
We have grouped these challenges and opportunities faced by banks into four broad themes, namely external developments, macro trends, internal responses and stakeholder expectations. Central to all themes is how CEOs are planning to maintain asolid return on equity given the challenges they are facing.
Our foremost findings include:
• External developments: Regulatory reform coupled with an uncertain economic environment remains the most pressing issue facing CEOs;
• Macro trends: The rise and interconnectivity of emerging markets is a significant opportunity for our banks;
• Internal responses: Cost containment, leveraging technology in all aspects of banking and a renewed focus on being client centric are some of the internal tactics CEOs are using to stay on top; and
• Stakeholder expectations: Although CEOs are positive about their ability to adapt, ROE levels will be lower than in the past. Managing stakeholders has become a high priority.
This survey was developed by PwC and Dr Brian Metcalfe and builds on previous surveys. However, those who have followed the survey over its lifespan will notice that we have changed the way in which findings are presented.
In this edition, PwC’s point of view, observed locally and globally, has been combined with the presentation of survey results to give readers richer insights. In the conclusion, we also highlight how we believe the CEO agenda will evolve given the trends identified.
We would like to thank the CEOs and senior executives who participated in this survey and whose support made it possible. We also thank the partners and staff in our Johannesburg office who have helped to produce this report. Particular thanks go to Dr Brian Metcalfe for his research, which formed the basis for this report.
As in the past, we look forward to your feedback on this survey and on other issues you think should be covered in future research.
Johannes Grosskopf Banking and Capital Markets Leader PwC South Africa 18 June 2013

6 | Shaping the Bank of the Future
Executive summary
PwC | 7
It is clear from our survey results that the world in general, and the banking industry specifically, are more complex now than they were a decade ago. At the same time, a number of trends and developments are currently shaping the global landscape for financial services and in particular the banking industry. We have tried to capture these trends in this report.
In our interviews, bank executives confirmed these emerging trends and the resulting impact on their organisations. They were also positive about their respective organisation’s ability to respond to these trends. In many instances, tactical solutions have already been implemented in response to short-term changes, while some organisations have started to implement more fundamental strategic changes to capitalise on longer-term opportunities.
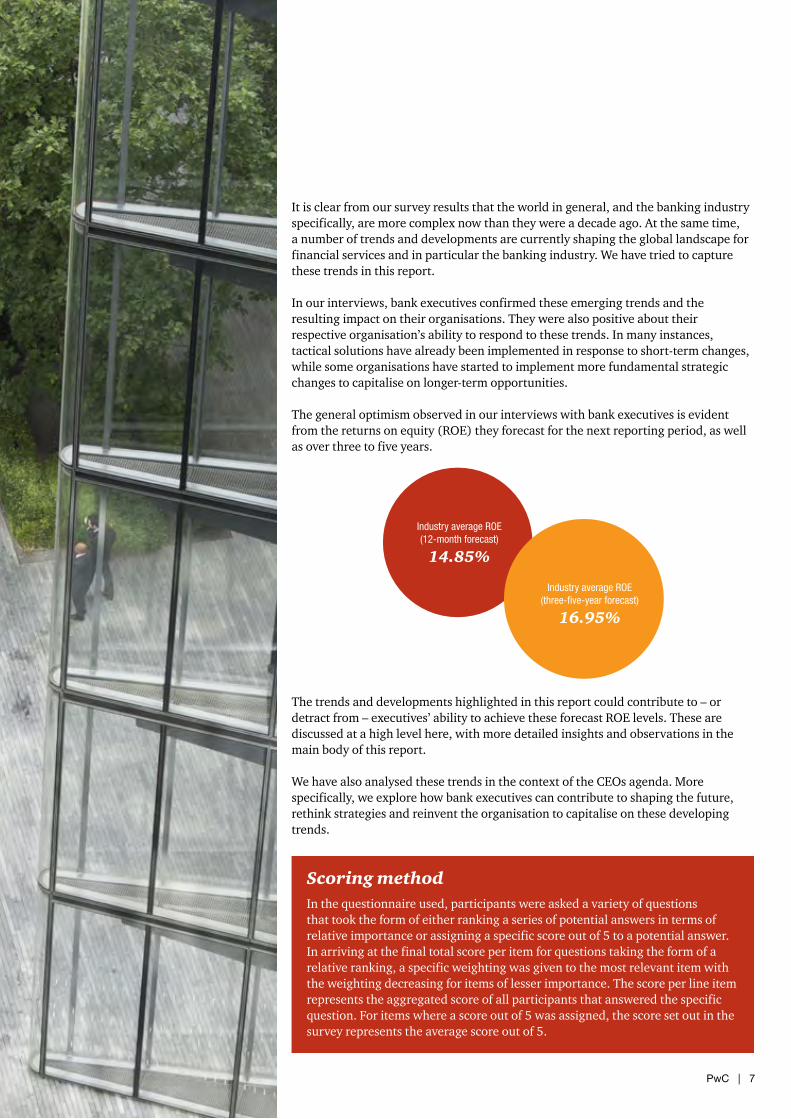
The general optimism observed in our interviews with bank executives is evident from the returns on equity (ROE) they forecast for the next reporting period, as well as over three to five years.
The trends and developments highlighted in this report could contribute to – or detract from – executives’ ability to achieve these forecast ROE levels. These are discussed at a high level here, with more detailed insights and observations in the main body of this report.
We have also analysed these trends in the context of the CEOs agenda. More specifically, we explore how bank executives can contribute to shaping the future, rethink strategies and reinvent the organisation to capitalise on these developing trends.
Industry average ROE(12-month forecast)
14.85%
Industry average ROE(three-five-year forecast)
16.95%
Scoring methodIn the questionnaire used, participants were asked a variety of questions that took the form of either ranking a series of potential answers in terms of relative importance or assigning a specific score out of 5 to a potential answer. In arriving at the final total score per item for questions taking the form of a relative ranking, a specific weighting was given to the most relevant item with the weighting decreasing for items of lesser importance. The score per line item represents the aggregated score of all participants that answered the specific question. For items where a score out of 5 was assigned, the score set out in the survey represents the average score out of 5.
Trends and developments shaping the South African banking industry
8 | Shaping the Bank of the Future
1. External developments
2. Macro trends
Economic environment
• Despite concerns that the consumer is under pressure, the ratio between household debt and disposable income in South Africa has declined consistently since 2008, from 83.3% to 74.7%.
• Similarly, the ratio between debt service costs and disposable household incomes has declined by almost 50% since 2008, which is partly attributable to a relatively benign interest rate environment.
• From a macroeconomic perspective, there is justification for concern over the possibility of sharp rises in money market interest rates and higher unemployment. This coupled with a weaker Rand may impact the consumer negatively.
Market segment competitiveness
• Corporate banking, flow businesses (foreign exchange and rates) and business banking are the most important wholesale market segments.
• Traditional retail banking (deposit taking and transactional banking), electronic banking and personal banking are the most important retail market segments.
• Traditional retail banking (deposit taking and transactional banking) is viewed as the most intensely competitive market segment and banks believe a fundamental change in strategy and positioning is required to compete aggressively in this segment.
• Rapid expansion in unsecured lending is the second-most important development in the South African banking industry. Interestingly it was also considered to be the second-biggest weakness in the industry.
New entrants
• The likelihood of new entrants into the South African banking market is regarded as low.
• The likelihood of a foreign entrant is considered to be higher than the establishment of a new local bank.
• Bank executives acknowledge the threat posed by non-traditional competitors, such as retailers and mobile service providers.
Regulatory reform
• Regulatory reform is regarded as the most significant development, most pressing issue and most significant weakness in the banking industry. The sheer scope of current and planned reforms that will impact the industry are top of mind for bank executives.
• Risk-weighted assets optimisation and compliance with the Net Stable Funding Ratio (NSFR) and Liquidity Coverage Ratio (LCR)are regarded as the top three implications of Basel III.
• Remuneration remains a hot topic as authorities continue to explore how best to regulate rewards in the sector, with the aim of reducing excessive risk taking.
1.1
2.1
1.2
2.2
1.3
2.3
1.4
Rise and interconnectivity of emerging markets
• Nearly half of respondents expect 10-15% of their after-tax profits to come from the sub-Saharan region (excluding South Africa) in the medium term, with Nigeria, Ghana and Kenya regarded as key growth territories.
• Growth potential, political stability and availability of quality local talent are important considerations for executives when expanding into Africa.
Demographic shifts
• Demographic changes will have a pronounced impact on the profile of economies around the world. Banks must anticipate these changes and align products and services to their changing customer base.
• Developing economies are experiencing significant population growth, specifically in economically active segments. This creates an attractive market for deposits, lending and transactional banking.
Urbanisation
• Over the next 30 years, the urbanisation of 1.8 billion people will bring the global urban population to 5.6 billion.
• Urbanisation increases the stress on physical and service infrastructure, creating demand for investment that will support the migration of people into cities.
• Banks must tailor their service offerings for rural and urban populations. Urban populations have a higher demand for financial products and services. However, banks should continue to explore innovative ways of meeting rural customer needs.
PwC | 9
3. Internal responses
4. Stakeholder expectations
3.1
4.1
3.2
3.3
4.2
3.4
Operational levers to restore ROE
• Cost containment is regarded as the most important mechanism to achieve ROE/ROA targets, followed by a focus on new markets.
• Internal efficiency drives, automation and optimisation of staff levels are key mechanisms for containing costs.
• Overall staff numbers are predicted to grow marginally from 150 768 to 154 354 by 2016, which equates to growth of 2%. Based on these modest increases, rapid adoption and implementation of automation will be critical if banks are to achieve their growth aspirations.
Technology
• Innovation is critical in this rapidly changing landscape with the Big Four banks all ranking it of maximum importance.
• Technology is regarded as one of the key enablers of innovation.
• The majority of respondents expect to invest significantly in technology over the medium term, with the Big Four banks each projecting R3-R5bn.
• Some banks have already achieved profitable revenue growth in the South African market by encouraging customers to migrate to electronic channels. Banks are seeking to leverage this experience as they expand across Africa.
• The Big Four banks currently operate 2 877 traditional branches, forecast to reduce by 21% to 2 285 by 2016. This is consistent with their stated intention to transition more customers to electronic distribution channels.
• ATM numbers are stabilising at around 20 000.
Customer centricity
• Banks are adopting a more holistic approach to customer relationships. They are analysing big data to identify customer needs and inform more granular pricing decisions.
• Banks’ views on the importance of the client onboarding process vary. The majority agree that service quality and client retention are pressing issues in the highly competitive South African banking market.
Talent
• Bank executives continue to place significant value on global experience, as well as leadership skills and adaptability.
• Lack of qualified staff is a key concern for banks looking to improve their credit business lines.
Investor expectations
• Although banks are positive about forecast ROE levels, they do not expect these returns to recover to pre-crisis levels.
• In a new world of reduced leverage and increased capital, the risk/return proposition of investing in bank shares has changed. Banks will have to explain this to the investor community.
Government interest
• Increased government interest is regarded as the third-most important development in the industry.
• The move to a twin peaks regulatory model is supported by the majority of respondents, despite some concerns about potential regulatory duplication.
• Most banks support deposit guarantee insurance up to R100 000.
10 | Shaping the Bank of the Future
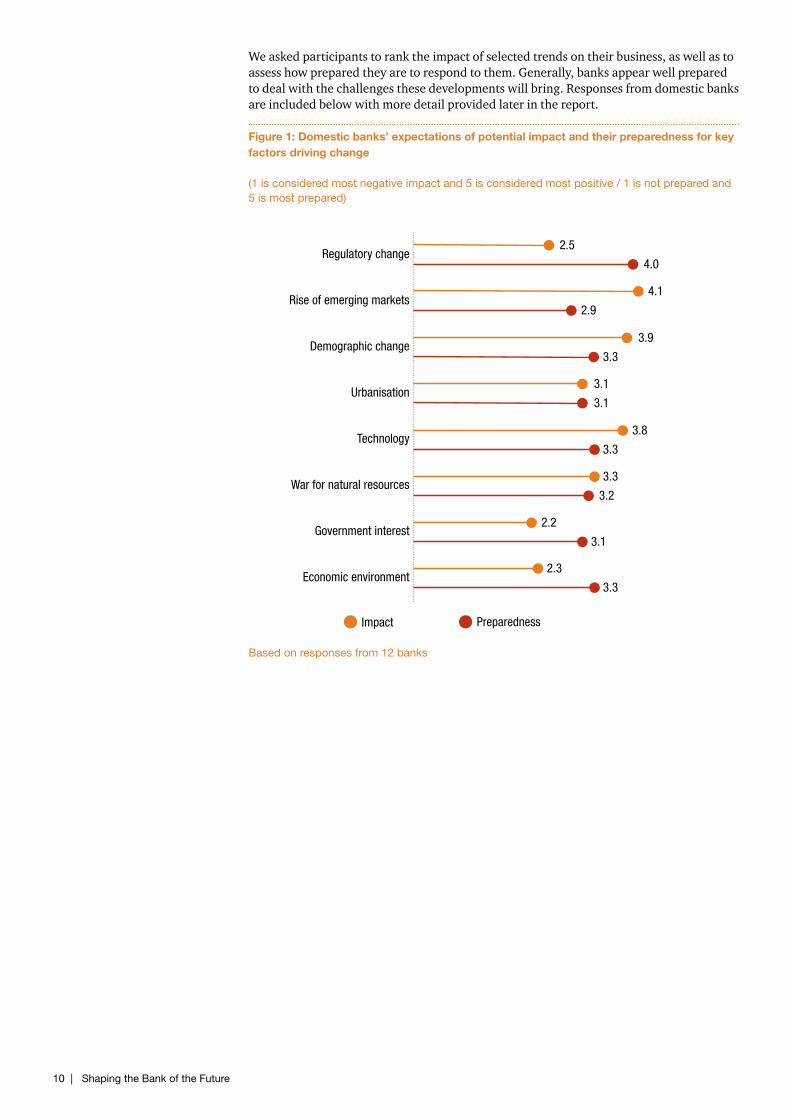
We asked participants to rank the impact of selected trends on their business, as well as to assess how prepared they are to respond to them. Generally, banks appear well prepared to deal with the challenges these developments will bring. Responses from domestic banks are included below with more detail provided later in the report.
Figure 1: Domestic banks’ expectations of potential impact and their preparedness for key factors driving change
(1 is considered most negative impact and 5 is considered most positive / 1 is not prepared and 5 is most prepared)
Based on responses from 12 banks
Economic environment
Government interest
War for natural resources
Technology
Urbanisation
Demographic change
Rise of emerging markets
Regulatory change2.5
4.0
4.1
2.9
3.9
3.3
3.1
3.1
3.8
3.3
3.3
3.2
2.2
3.1
2.3
3.3
Impact Preparedness
PwC | 11
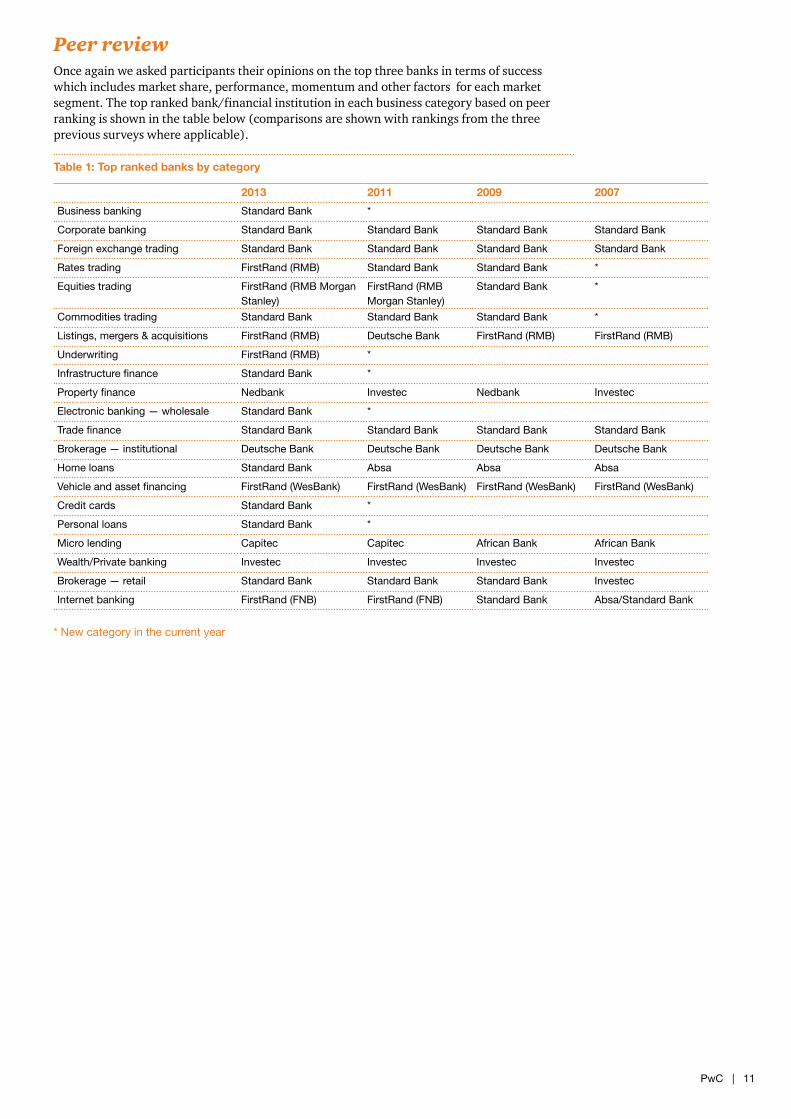
Peer reviewOnce again we asked participants their opinions on the top three banks in terms of success which includes market share, performance, momentum and other factors for each market segment. The top ranked bank/financial institution in each business category based on peer ranking is shown in the table below (comparisons are shown with rankings from the three previous surveys where applicable).
Table 1: Top ranked banks by category
2013 2011 2009 2007
Business banking Standard Bank *
Corporate banking Standard Bank Standard Bank Standard Bank Standard Bank
Foreign exchange trading Standard Bank Standard Bank Standard Bank Standard Bank
Rates trading FirstRand (RMB) Standard Bank Standard Bank *
Equities trading FirstRand (RMB Morgan Stanley)
FirstRand (RMB Morgan Stanley)
Standard Bank *
Commodities trading Standard Bank Standard Bank Standard Bank *
Listings, mergers & acquisitions FirstRand (RMB) Deutsche Bank FirstRand (RMB) FirstRand (RMB)
Underwriting FirstRand (RMB) *
Infrastructure finance Standard Bank *
Property finance Nedbank Investec Nedbank Investec
Electronic banking — wholesale Standard Bank *
Trade finance Standard Bank Standard Bank Standard Bank Standard Bank
Brokerage — institutional Deutsche Bank Deutsche Bank Deutsche Bank Deutsche Bank
Home loans Standard Bank Absa Absa Absa
Vehicle and asset financing FirstRand (WesBank) FirstRand (WesBank) FirstRand (WesBank) FirstRand (WesBank)
Credit cards Standard Bank *
Personal loans Standard Bank *
Micro lending Capitec Capitec African Bank African Bank
Wealth/Private banking Investec Investec Investec Investec
Brokerage — retail Standard Bank Standard Bank Standard Bank Investec
Internet banking FirstRand (FNB) FirstRand (FNB) Standard Bank Absa/Standard Bank
* New category in the current year

12 | Shaping the Bank of the Future
Introduction
PwC | 13
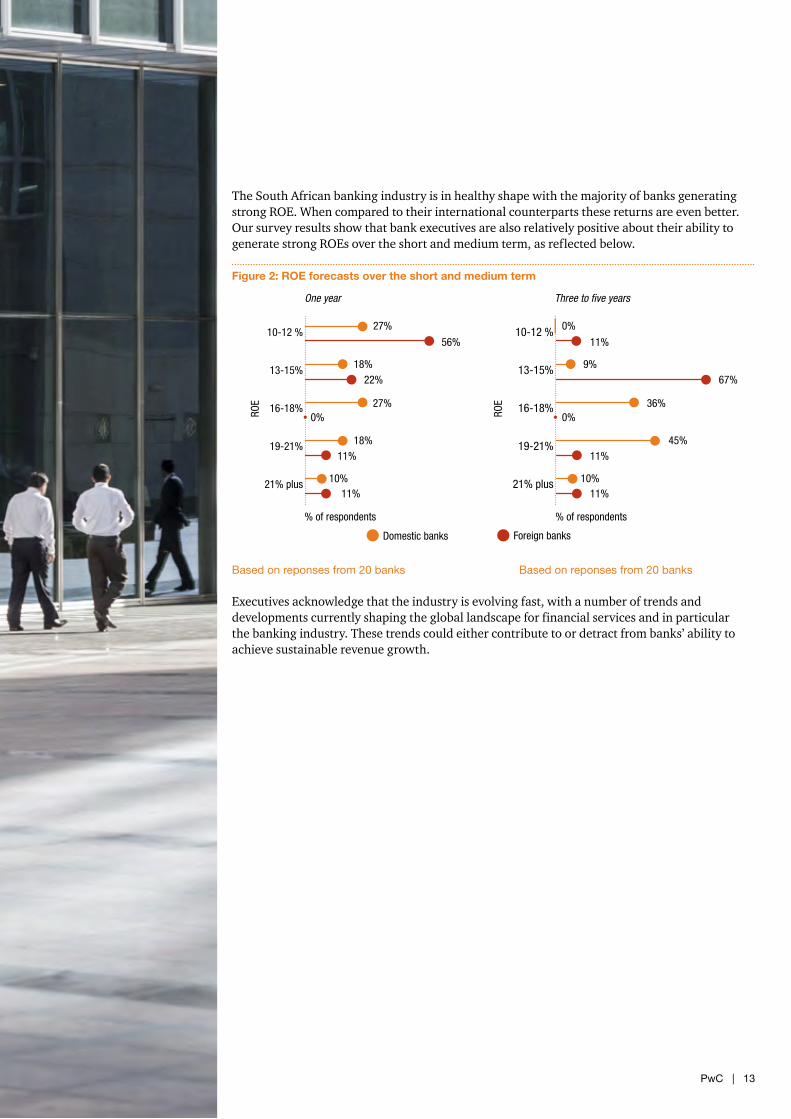
The South African banking industry is in healthy shape with the majority of banks generating strong ROE. When compared to their international counterparts these returns are even better. Our survey results show that bank executives are also relatively positive about their ability to generate strong ROEs over the short and medium term, as reflected below.
Figure 2: ROE forecasts over the short and medium term
Based on reponses from 20 banks Based on reponses from 20 banks
Executives acknowledge that the industry is evolving fast, with a number of trends and developments currently shaping the global landscape for financial services and in particular the banking industry. These trends could either contribute to or detract from banks’ ability to achieve sustainable revenue growth.
21% plus
19-21%
16-18%
13-15%
10-12 %
Domestic banks
One year Three to five years
Foreign banks
% of respondents% of respondents
27%
56%
18%22%
27%0%
18%11%
10%11%
21% plus
19-21%
16-18%
13-15%
10-12 % 0%
11%
9%67%
36%0%
45%11%
10%11%
ROE
ROE

14 | Shaping the Bank of the Future
Key trends shaping the banking industry identified in this survey and through our wider industry initiatives engagement include:
• ExternaldevelopmentsA combination of local and global factors that directly impact the banking industry: The majority of these factors typically detract from a bank’s ability to achieve ROE targets. They include the sluggish economic environment, large-scale regulatory change and competition in various attractive market segments.
• Macrotrends Macro trends currently shaping the global landscape for all industries, in particular the banking industry: Strategic alignment to these trends, which include the rise and interconnectivity of emerging markets, urbanisation and demographic shifts, could contribute significantly to strong ROE growth over the medium to long term, or could represent a lost opportunity for those who do not respond.
• InternalresponsesTactical and strategic responses already implemented or planned by the banks: In general, these responses are aimed at improving ROE (if properly implemented) and include cost control, innovation and technology. Talent shortages are also explored as part of this dimension. Inability to source the right talent could detract significantly from achieving growth objectives, while winners in the war for talent could establish a competitive edge that is hard to match.
• StakeholderexpectationsExpectations of a range of external stakeholders: Banks cannot maintain control of their destinies without the confidence of a variety of stakeholders, such as investors, government and the societies in which they operate. These stakeholders could influence, either favourably or obstructively, how banks achieve their growth objectives.
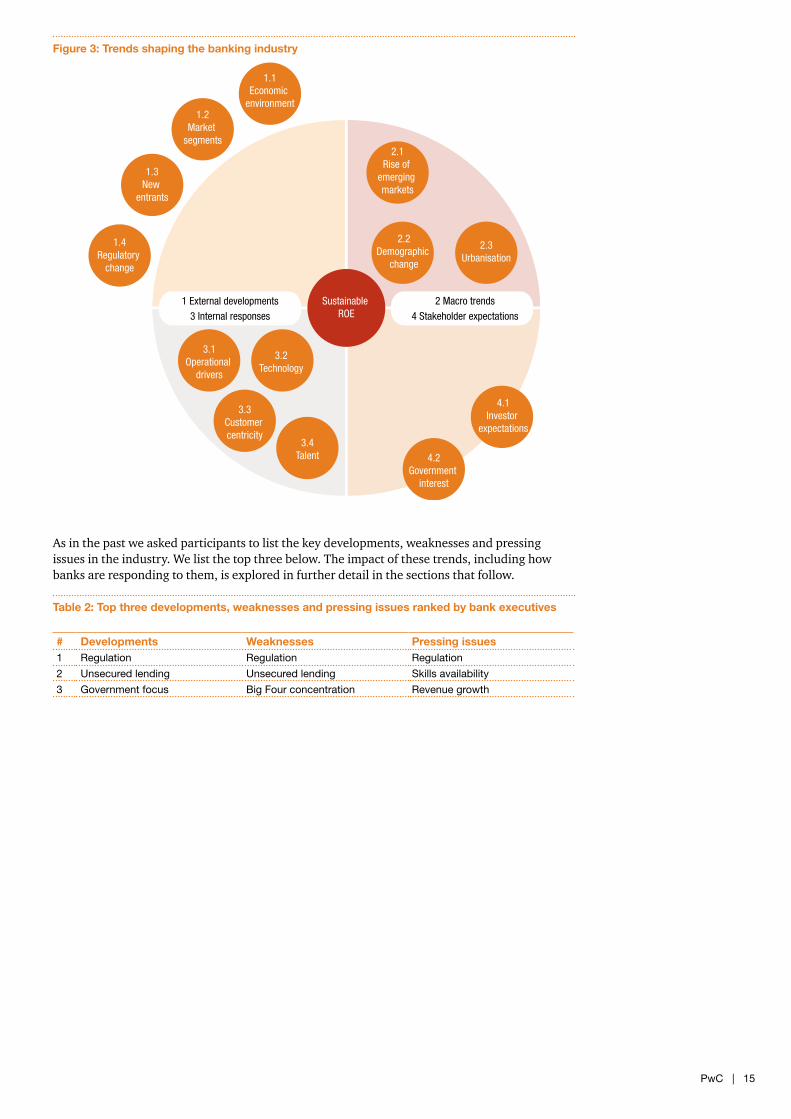
These trends are summarised in Figure 3 on the opposite page. The trends located inside the circle contribute in a positive manner to banks’ ability to achieve ROE targets, while those outside the circle have a negative impact.
PwC | 15
1.4Regulatory
change
1.3New
entrants
1.2Market
segments
1.1Economic
environment
2.1Rise of
emerging markets
2.2Demographic
change
2.3Urbanisation
4.1Investor
expectations
4.2Government
interest
3.4Talent
3.3Customer centricity
3.2Technology
3.1Operational
drivers
2 Macro trendsSustainable ROE 4 Stakeholder expectations
1 External developments3 Internal responses
Figure 3: Trends shaping the banking industry
As in the past we asked participants to list the key developments, weaknesses and pressing issues in the industry. We list the top three below. The impact of these trends, including how banks are responding to them, is explored in further detail in the sections that follow.
Table 2: Top three developments, weaknesses and pressing issues ranked by bank executives
# Developments Weaknesses Pressing issues1 Regulation Regulation Regulation
2 Unsecured lending Unsecured lending Skills availability
3 Government focus Big Four concentration Revenue growth
16 | Shaping the Bank of the Future
Evaluating trends shaping the industry and banks’ responses
1 External developments
PwC | 17
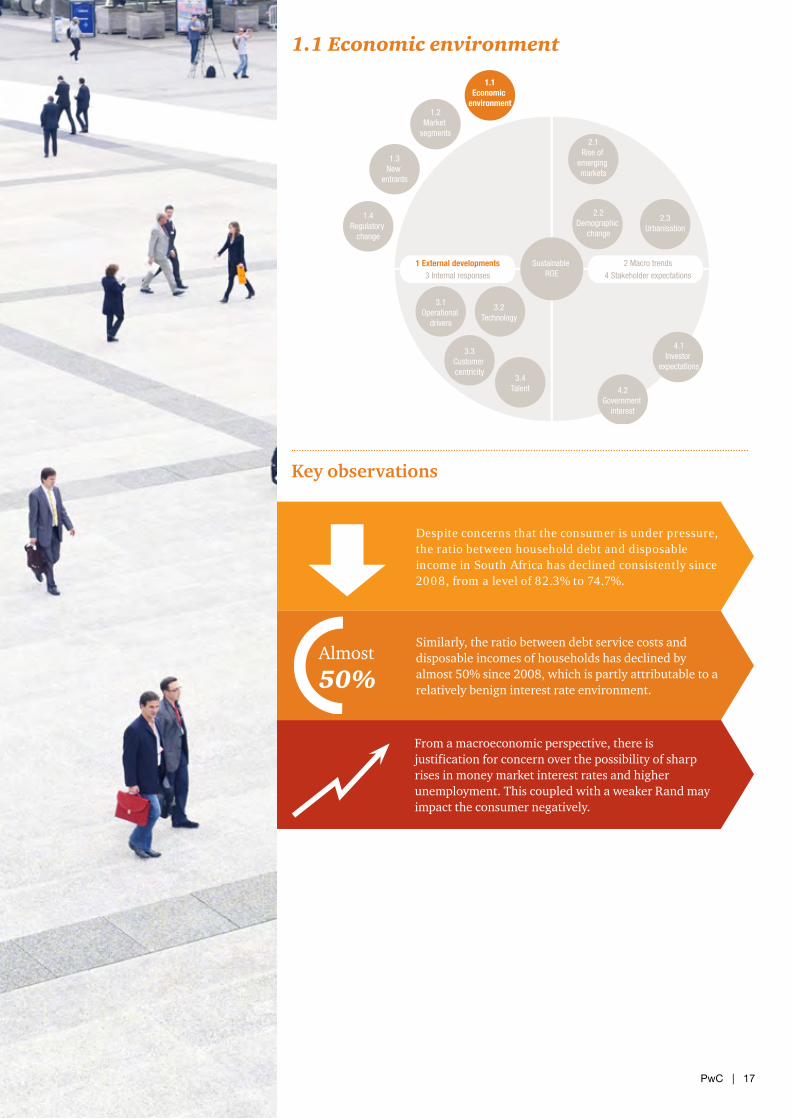
1.1 Economic environment
Key observations
Despite concerns that the consumer is under pressure, the ratio between household debt and disposable income in South Africa has declined consistently since 2008, from a level of 82.3% to 74.7%.
Similarly, the ratio between debt service costs and disposable incomes of households has declined by almost 50% since 2008, which is partly attributable to a relatively benign interest rate environment.
From a macroeconomic perspective, there is justification for concern over the possibility of sharp rises in money market interest rates and higher unemployment. This coupled with a weaker Rand may impact the consumer negatively.
1.4Regulatory
change
1.3New
entrants
1.2Market
segments
1.1Economic
environment
2.1Rise of
emerging markets
2.2Demographic
change
2.3Urbanisation
4.1Investor
expectations
4.2Government
interest
3.4Talent
3.3Customer centricity
3.2Technology
3.1Operational
drivers
2 Macro trendsSustainable ROE 4 Stakeholder expectations
1 External developments3 Internal responses
18 | Shaping the Bank of the Future
Although subdued growth is forecast for the current year, authoritative research agencies have been forecasting healthier economic growth rates in the longer term. For example, the International Monetary Fund (IMF) was anticipating improved global prospects in its April 2013 economic outlook alongside the ‘bumpy road’ to full recovery.
It has also become customary for economic research agencies to emphasise the prolonged economic stagnation of the Eurozone as the main obstacle to a resurgence of pre-recession output growth. Following a swift recovery from recession in 2010, economic growth in the Eurozone slipped marginally in 2011 and then dipped to just below zero last year.
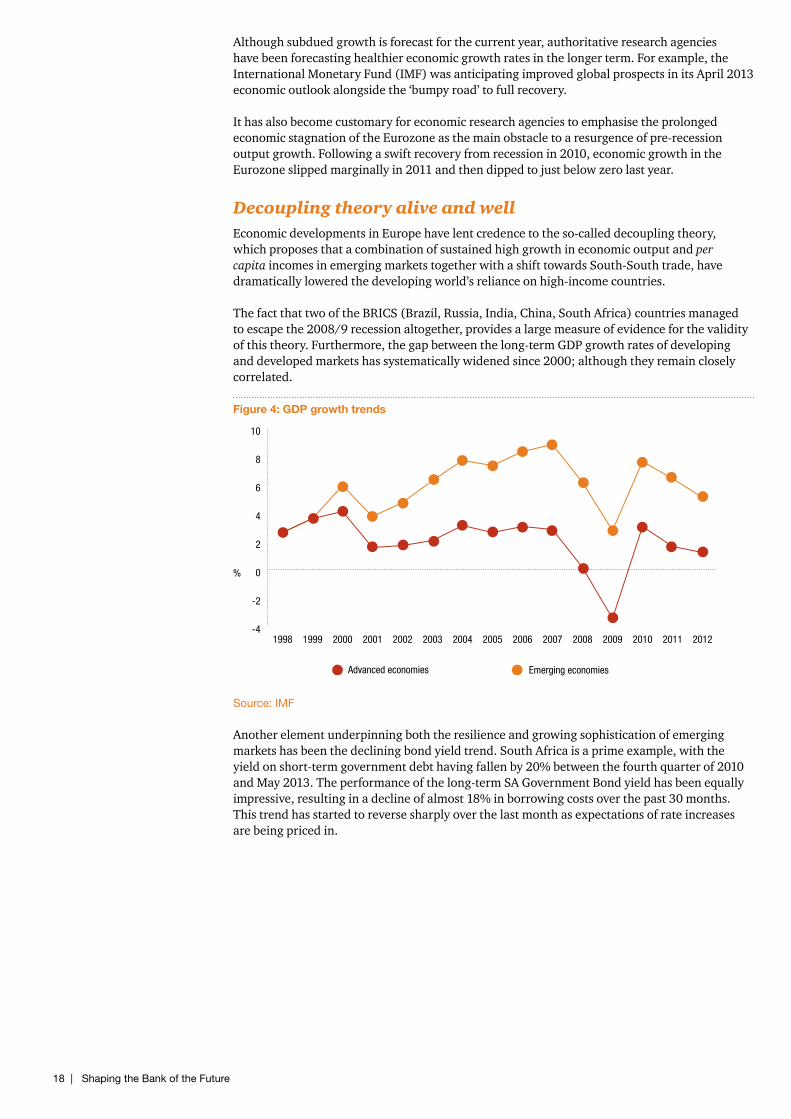
Decoupling theory alive and wellEconomic developments in Europe have lent credence to the so-called decoupling theory, which proposes that a combination of sustained high growth in economic output and per capita incomes in emerging markets together with a shift towards South-South trade, have dramatically lowered the developing world’s reliance on high-income countries.
The fact that two of the BRICS (Brazil, Russia, India, China, South Africa) countries managed to escape the 2008/9 recession altogether, provides a large measure of evidence for the validity of this theory. Furthermore, the gap between the long-term GDP growth rates of developing and developed markets has systematically widened since 2000; although they remain closely correlated.
Figure 4: GDP growth trends
Source: IMF
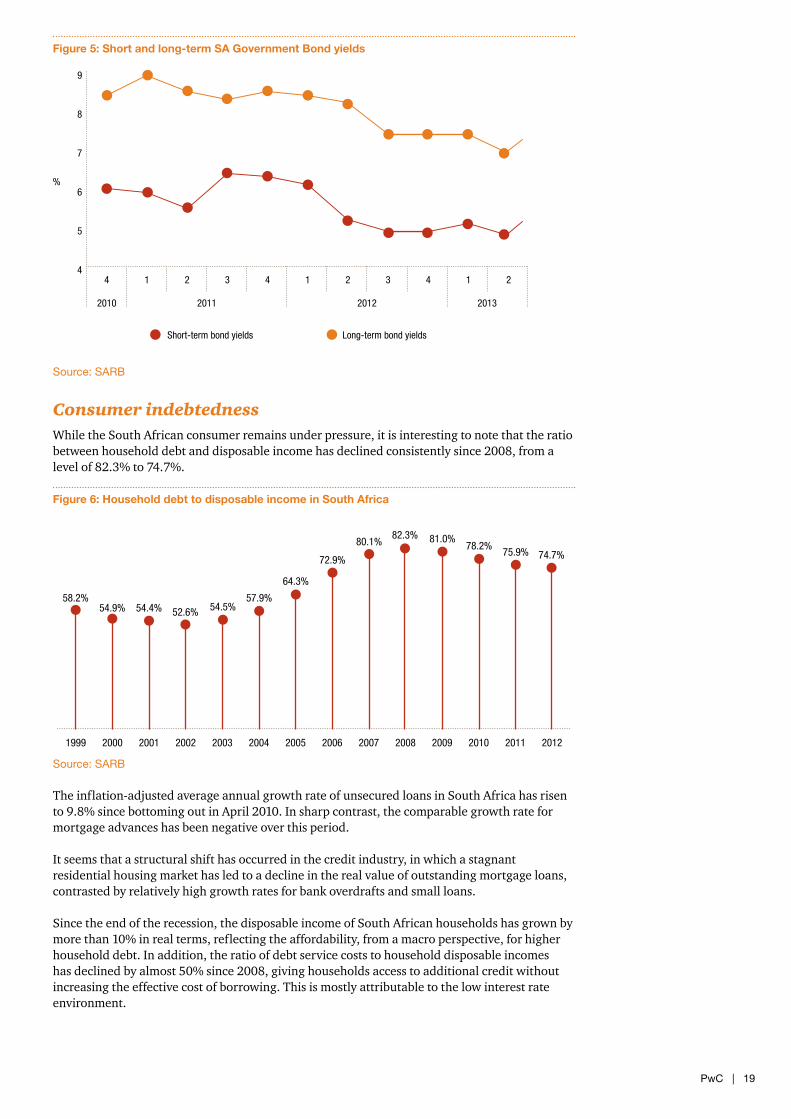
Another element underpinning both the resilience and growing sophistication of emerging markets has been the declining bond yield trend. South Africa is a prime example, with the yield on short-term government debt having fallen by 20% between the fourth quarter of 2010 and May 2013. The performance of the long-term SA Government Bond yield has been equally impressive, resulting in a decline of almost 18% in borrowing costs over the past 30 months. This trend has started to reverse sharply over the last month as expectations of rate increases are being priced in.
-4
-2
0
2
4
6
8
10
Emerging economiesAdvanced economies
%
201220112010200920082007200620052004200320022001200019991998
PwC | 19
Figure 5: Short and long-term SA Government Bond yields
Source: SARB
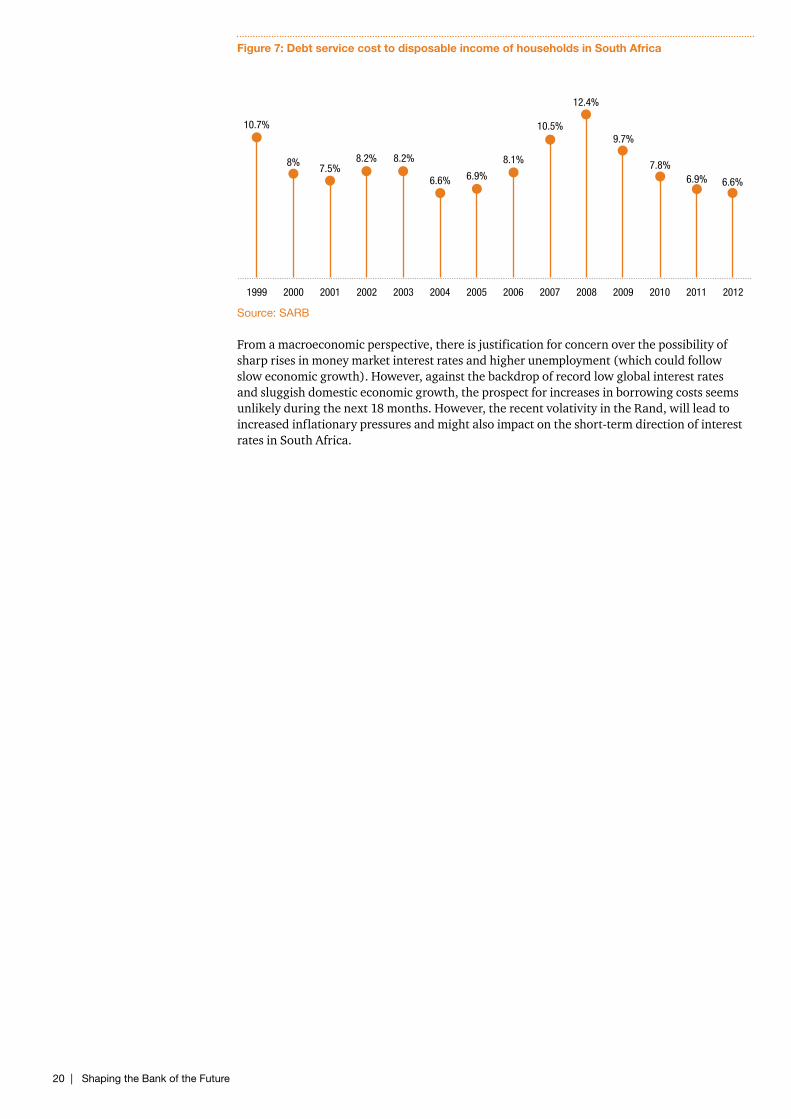
Consumer indebtednessWhile the South African consumer remains under pressure, it is interesting to note that the ratio between household debt and disposable income has declined consistently since 2008, from a level of 82.3% to 74.7%.
Figure 6: Household debt to disposable income in South Africa
Source: SARB
The inflation-adjusted average annual growth rate of unsecured loans in South Africa has risen to 9.8% since bottoming out in April 2010. In sharp contrast, the comparable growth rate for mortgage advances has been negative over this period.
It seems that a structural shift has occurred in the credit industry, in which a stagnant residential housing market has led to a decline in the real value of outstanding mortgage loans, contrasted by relatively high growth rates for bank overdrafts and small loans.
Since the end of the recession, the disposable income of South African households has grown by more than 10% in real terms, reflecting the affordability, from a macro perspective, for higher household debt. In addition, the ratio of debt service costs to household disposable incomes has declined by almost 50% since 2008, giving households access to additional credit without increasing the effective cost of borrowing. This is mostly attributable to the low interest rate environment.
20122011201020092008200720062005200420032002200120001999
58.2%54.9% 54.4% 52.6% 54.5%
57.9%
64.3%
72.9%
80.1%82.3% 81.0%
78.2%75.9% 74.7%
4
5
6
7
8
9
Long-term bond yieldsShort-term bond yields
214321432
2010
14
2011 2012 2013
%
20 | Shaping the Bank of the Future
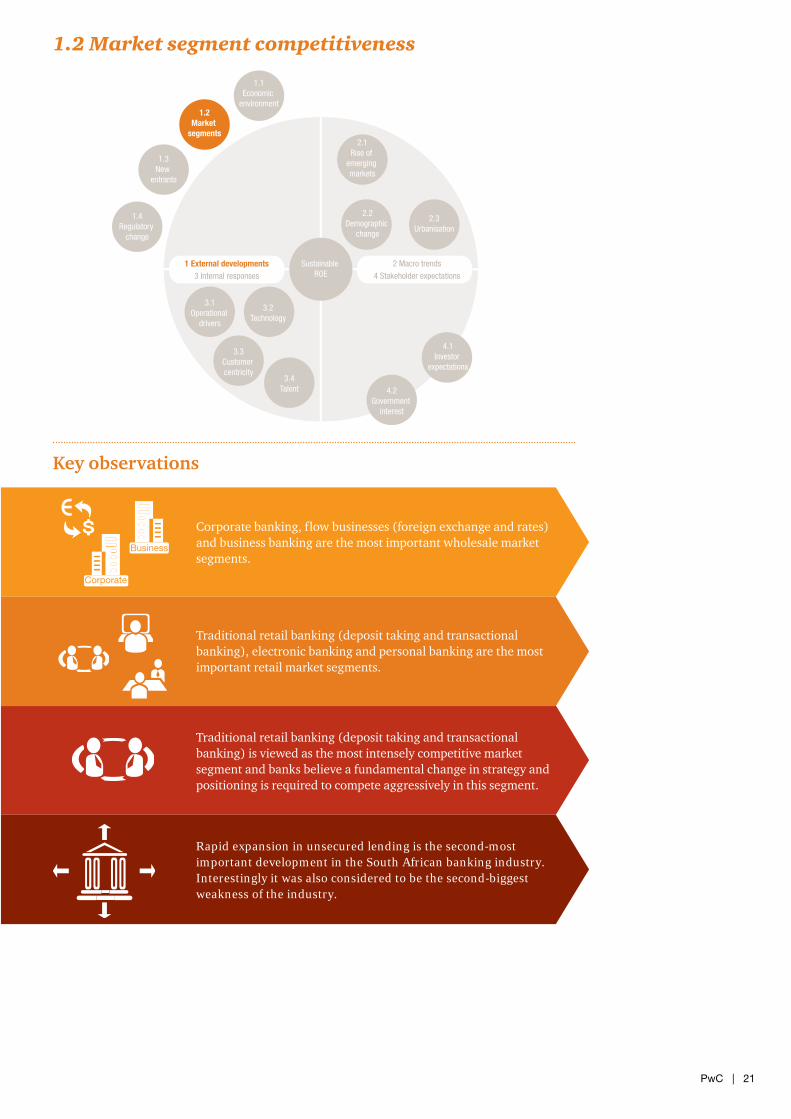
Figure 7: Debt service cost to disposable income of households in South Africa
Source: SARB
From a macroeconomic perspective, there is justification for concern over the possibility of sharp rises in money market interest rates and higher unemployment (which could follow slow economic growth). However, against the backdrop of record low global interest rates and sluggish domestic economic growth, the prospect for increases in borrowing costs seems unlikely during the next 18 months. However, the recent volativity in the Rand, will lead to increased inflationary pressures and might also impact on the short-term direction of interest rates in South Africa.
20122011201020092008200720062005200420032002200120001999
10.7%
8%7.5%
8.2% 8.2%
6.6% 6.9%
8.1%
10.5%
12.4%
9.7%
7.8%6.9% 6.6%
PwC | 21
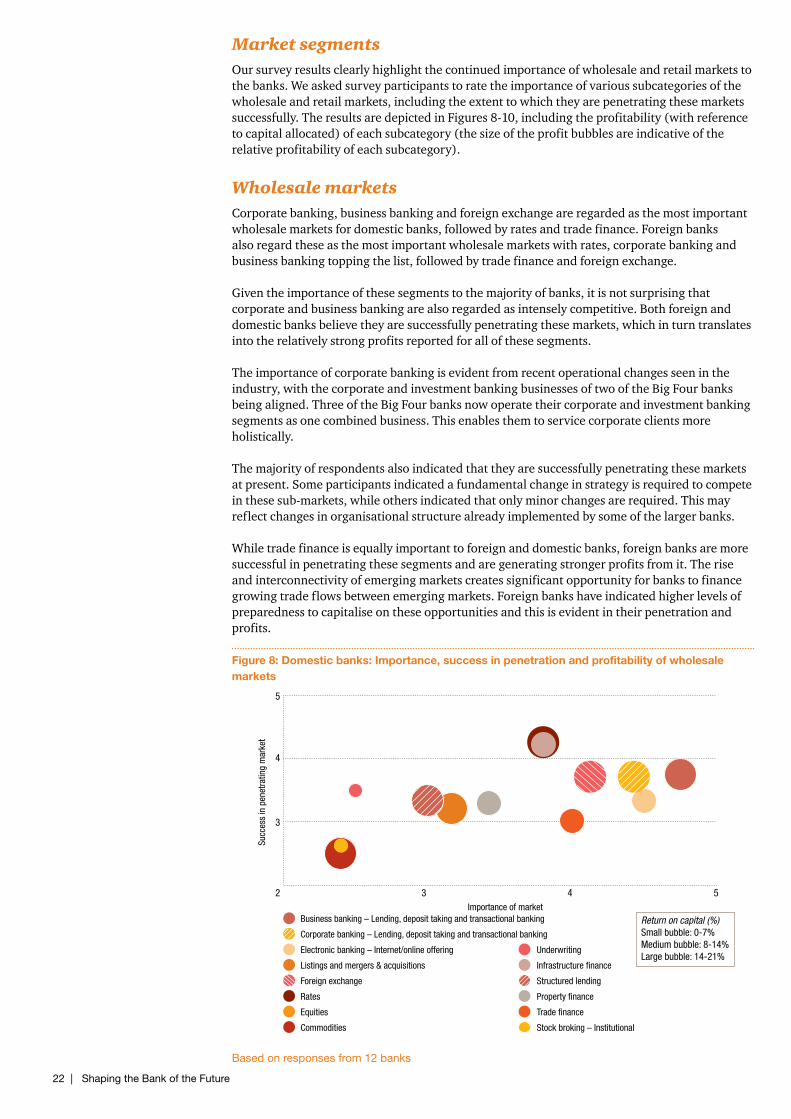
1.2 Market segment competitiveness
1.4Regulatory
change
1.3New
entrants
1.2Market
segments
1.1Economic
environment
2.1Rise of
emerging markets
2.2Demographic
change
2.3Urbanisation
4.1Investor
expectations
4.2Government
interest
3.4Talent
3.3Customer centricity
3.2Technology
3.1Operational
drivers
2 Macro trendsSustainable ROE 4 Stakeholder expectations
1 External developments3 Internal responses
Business
Corporate
Corporate banking, flow businesses (foreign exchange and rates) and business banking are the most important wholesale market segments.
Traditional retail banking (deposit taking and transactional banking), electronic banking and personal banking are the most important retail market segments.
Traditional retail banking (deposit taking and transactional banking) is viewed as the most intensely competitive market segment and banks believe a fundamental change in strategy and positioning is required to compete aggressively in this segment.
Rapid expansion in unsecured lending is the second-most important development in the South African banking industry. Interestingly it was also considered to be the second-biggest weakness of the industry.
Key observations
22 | Shaping the Bank of the Future
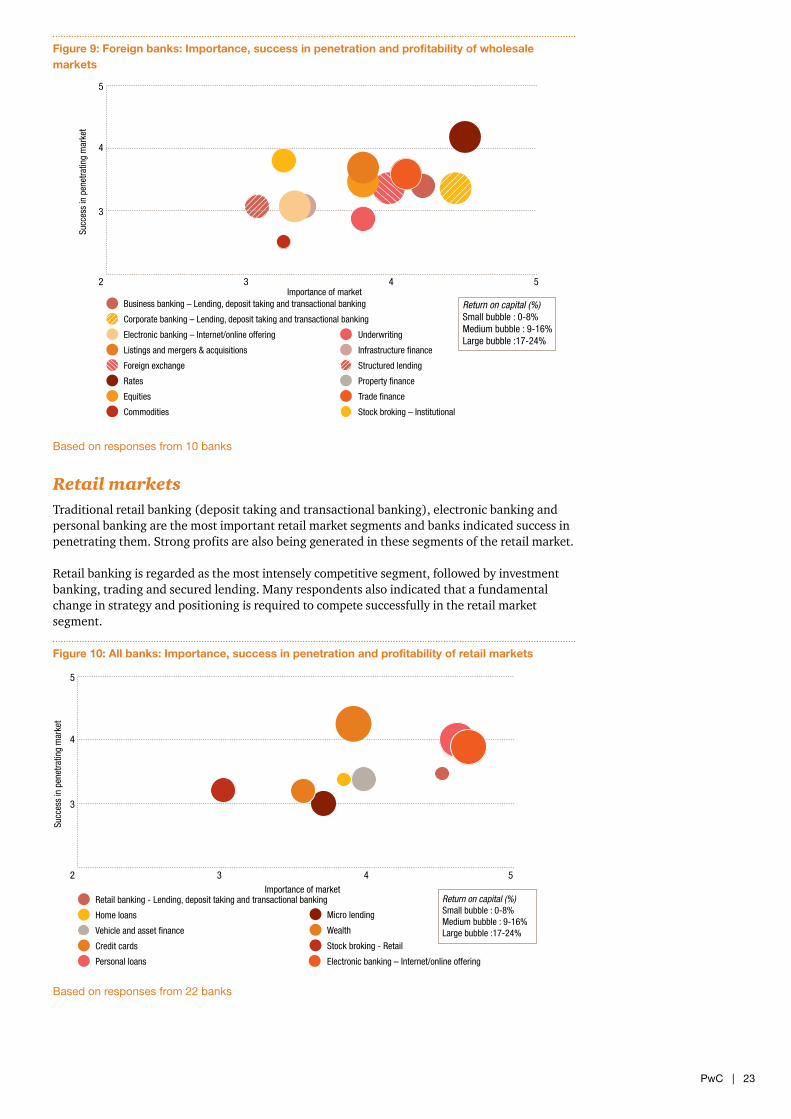
Market segmentsOur survey results clearly highlight the continued importance of wholesale and retail markets to the banks. We asked survey participants to rate the importance of various subcategories of the wholesale and retail markets, including the extent to which they are penetrating these markets successfully. The results are depicted in Figures 8-10, including the profitability (with reference to capital allocated) of each subcategory (the size of the profit bubbles are indicative of the relative profitability of each subcategory).
Wholesale marketsCorporate banking, business banking and foreign exchange are regarded as the most important wholesale markets for domestic banks, followed by rates and trade finance. Foreign banks also regard these as the most important wholesale markets with rates, corporate banking and business banking topping the list, followed by trade finance and foreign exchange.
Given the importance of these segments to the majority of banks, it is not surprising that corporate and business banking are also regarded as intensely competitive. Both foreign and domestic banks believe they are successfully penetrating these markets, which in turn translates into the relatively strong profits reported for all of these segments.
The importance of corporate banking is evident from recent operational changes seen in the industry, with the corporate and investment banking businesses of two of the Big Four banks being aligned. Three of the Big Four banks now operate their corporate and investment banking segments as one combined business. This enables them to service corporate clients more holistically.
The majority of respondents also indicated that they are successfully penetrating these markets at present. Some participants indicated a fundamental change in strategy is required to compete in these sub-markets, while others indicated that only minor changes are required. This may reflect changes in organisational structure already implemented by some of the larger banks.
While trade finance is equally important to foreign and domestic banks, foreign banks are more successful in penetrating these segments and are generating stronger profits from it. The rise and interconnectivity of emerging markets creates significant opportunity for banks to finance growing trade flows between emerging markets. Foreign banks have indicated higher levels of preparedness to capitalise on these opportunities and this is evident in their penetration and profits.
Figure 8: Domestic banks: Importance, success in penetration and profitability of wholesale markets
Based on responses from 12 banks
Business banking – Lending, deposit taking and transactional banking
2 3 4
3
4
5
5
Corporate banking – Lending, deposit taking and transactional banking
Foreign exchange
Rates
Equities
Commodities
Listings and mergers & acquisitions
Underwriting
Infrastructure finance
Structured lending
Property finance
Trade finance
Stock broking – Institutional
Return on capital (%) Small bubble: 0-7% Medium bubble: 8-14% Large bubble: 14-21%
Electronic banking – Internet/online offering
Importance of market
Succ
ess
in p
enet
ratin
g m
arke
t
PwC | 23
Figure 9: Foreign banks: Importance, success in penetration and profitability of wholesale markets
Based on responses from 10 banks
Retail marketsTraditional retail banking (deposit taking and transactional banking), electronic banking and personal banking are the most important retail market segments and banks indicated success in penetrating them. Strong profits are also being generated in these segments of the retail market.
Retail banking is regarded as the most intensely competitive segment, followed by investment banking, trading and secured lending. Many respondents also indicated that a fundamental change in strategy and positioning is required to compete successfully in the retail market segment.
Figure 10: All banks: Importance, success in penetration and profitability of retail markets
Based on responses from 22 banks
2 3 4
3
4
5
5
Return on capital (%) Small bubble : 0-8% Medium bubble : 9-16% Large bubble :17-24%
Business banking – Lending, deposit taking and transactional banking
Corporate banking – Lending, deposit taking and transactional banking
Foreign exchange
Rates
Equities
Commodities
Listings and mergers & acquisitions
Underwriting
Infrastructure finance
Structured lending
Property finance
Trade finance
Stock broking – Institutional
Electronic banking – Internet/online offering
Importance of market
Succ
ess
in p
enet
ratin
g m
arke
t
Retail banking - Lending, deposit taking and transactional banking
2 3 4
3
4
5
5
Home loans
Personal loans
Micro lending
Wealth
Stock broking - RetailCredit cards
Electronic banking – Internet/online offering
Vehicle and asset finance
Return on capital (%) Small bubble : 0-8% Medium bubble : 9-16% Large bubble :17-24%
Importance of market
Succ
ess
in p
enet
ratin
g m
arke
t
24 | Shaping the Bank of the Future
Unsecured lendingInterestingly, respondents do not regard the unsecured lending market as very competitive. This is probably partly attributable to the significant demand for these loans in the South African market at present, which translates into ample business for all participants.
Although overall asset growth in the banking industry remains muted, one area that stands out is the exponential growth in unsecured lending exposures. Bank executives regard this as a key development in the sector. Despite the appealing margins and strong consumer demand, these exposures come with significant downside risk, given the absence of collateral in the event of default.
Given these growth rates, it is not surprising that the surge in unsecured lending was ranked as the second-most important market development by the banks. They also identified it as the second-largest weakness in the South African banking industry.
The growth in unsecured lending can be attributed to a combination of factors. On the demand side, we credit increased consumerism, a benign interest rate environment and a lack of awareness among some consumers of the cost and risks associated with high levels of indebtedness.
On the supply side, we believe that lenders are being drawn by the increasing economic attractiveness of unsecured lending compared to other forms of credit. This is evident in our survey results. With reference to return on capital allocated, all banks indicated unsecured personal loans are either profitable (10-20%) or very profitable (20-30%).
It would appear that some banks are currently willing to accept and manage the increased risk in exchange for prospects of greater returns. A notable feature of the unsecured lending trend is the strong growth in increasingly higher-value, longer-term unsecured loans advanced to relatively higher-income individuals. This may suggest that the lower end of the market is reaching saturation, which is prompting lenders to target the higher end of the market.
Unsecured lending was viewed sceptically by participants not active in this segment. Concern centred on the impact of a future interest rate rise on consumers’ ability to repay borrowings. This risk is also evident across all the banks’ lending portfolios.
The National Credit Regulator’s Credit Bureau Monitor, for quarter December 2012, noted that 17.52 million accounts (December 2011: 16.91 million) or 25.2% (December 2011: 25.0%) of total active accounts across all segments had impaired records. These included accounts that were three months in arrears, accounts with judgements and administration orders and accounts with adverse listings. The percentage of consumers with impaired credit records increased from 46.2% in December 2011 to 46.8% in December 2012. These statistics confirm a view of a consumer under strain.
To address risks in the rapidly expanding unsecured lending market, the South African Reserve Bank, Banking Association of South Africa, National Treasury and the major banks reached agreement in October 2012 to institute reforms aimed at improving responsible lending and preventing a debt spiral.
We point out that domestic banks rated ‘increased risk of loan defaults – retail segment’ 18th out of 32 pressing issues. This relatively low ranking is indicative of their perception of an improved credit environment, specifically when compared to the period after the 2008 financial crisis. It is apparent that banks are not yet overly concerned about bad debt, despite indications that consumers are under pressure. Unexpected changes in economic conditions, such as interest rate increases, could change sentiment quickly.
Our survey results show that the key challenges faced by banks relating to impairments include a shortage of qualified staff in this specialist field, the complexity of models and data constraints - as can be seen from the summary of responses in the graph below.

PwC | 25
Figure 11: Key impairment related challenges
Based on responses from 16 banks
Macro environment
Information technology constraints
Subjectivity
Data constraints
Complexity of models
Suitably qualified staff 27
20
16
14
13
3
26 | Shaping the Bank of the Future
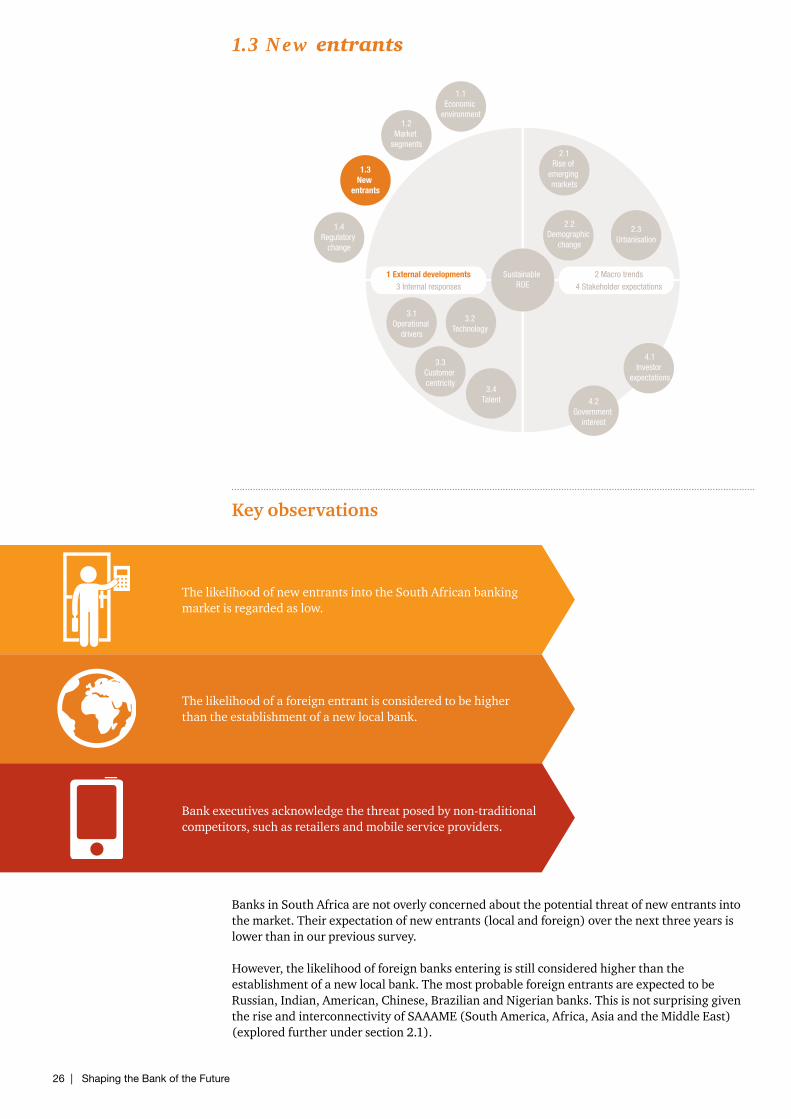
Key observations
The likelihood of new entrants into the South African banking market is regarded as low.
The likelihood of a foreign entrant is considered to be higher than the establishment of a new local bank.
Bank executives acknowledge the threat posed by non-traditional competitors, such as retailers and mobile service providers.
1.4Regulatory
change
1.3New
entrants
1.2Market
segments
1.1Economic
environment
2.1Rise of
emerging markets
2.2Demographic
change
2.3Urbanisation
4.1Investor
expectations
4.2Government
interest
3.4Talent
3.3Customer centricity
3.2Technology
3.1Operational
drivers
2 Macro trendsSustainable ROE 4 Stakeholder expectations
1 External developments3 Internal responses
Banks in South Africa are not overly concerned about the potential threat of new entrants into the market. Their expectation of new entrants (local and foreign) over the next three years is lower than in our previous survey.
However, the likelihood of foreign banks entering is still considered higher than the establishment of a new local bank. The most probable foreign entrants are expected to be Russian, Indian, American, Chinese, Brazilian and Nigerian banks. This is not surprising given the rise and interconnectivity of SAAAME (South America, Africa, Asia and the Middle East) (explored further under section 2.1).
1.3 New entrants
PwC | 27
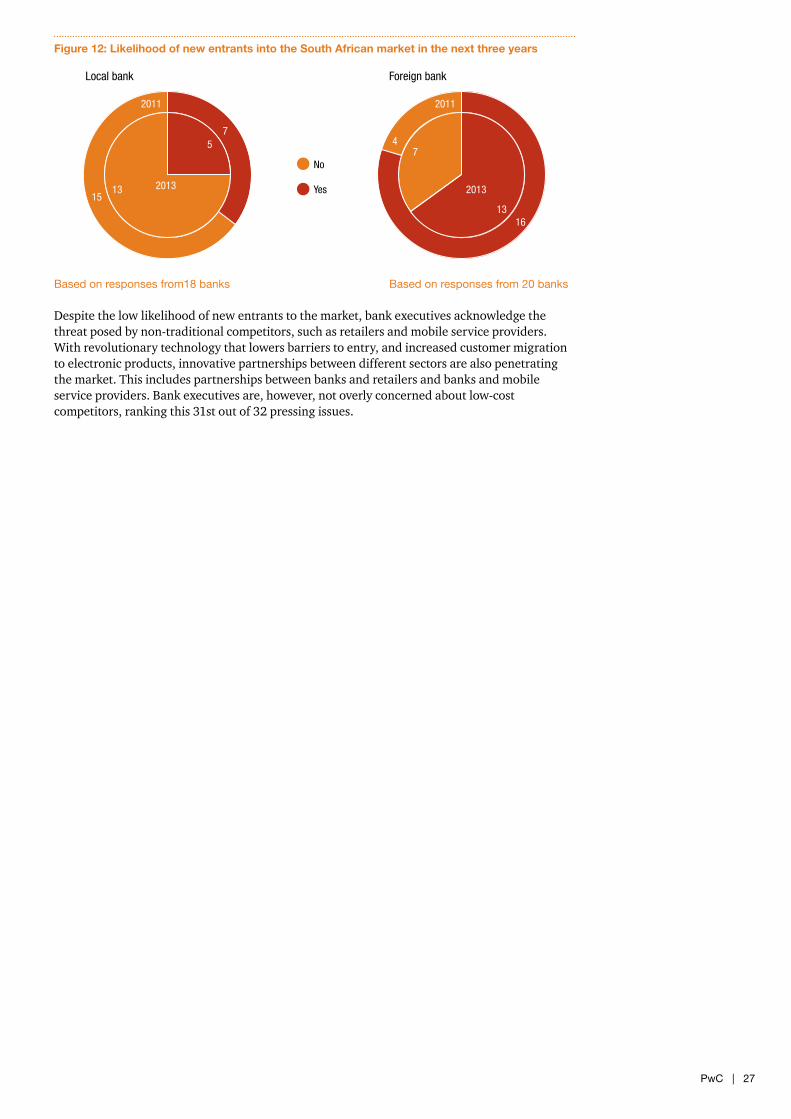
Figure 12: Likelihood of new entrants into the South African market in the next three years
Based on responses from18 banks Based on responses from 20 banks
Despite the low likelihood of new entrants to the market, bank executives acknowledge the threat posed by non-traditional competitors, such as retailers and mobile service providers. With revolutionary technology that lowers barriers to entry, and increased customer migration to electronic products, innovative partnerships between different sectors are also penetrating the market. This includes partnerships between banks and retailers and banks and mobile service providers. Bank executives are, however, not overly concerned about low-cost competitors, ranking this 31st out of 32 pressing issues.
2013
2011
7
1315
5
13
74
16
2013
2011
Local bank Foreign bank
No
Yes

28 | Shaping the Bank of the Future
Key observations
Regulatory reform is regarded as the most significant development, most pressing issue and most significant weakness facing the banking industry. The sheer scope of current and planned reforms that will impact the industry are clearly top of mind for bank executives.
Risk-weighted assets optimisation and compliance with the Net Stable Funding Ratio and Liquidity Coverage Ratio are regarded as the top three implications of Basel III.
Remuneration remains a hot topic as authorities continue to explore how best to regulate rewards in the sector with the aim of reducing excessive risk taking.
1.4Regulatory
change
1.3New
entrants
1.2Market
segments
1.1Economic
environment
2.1Rise of
emerging markets
2.2Demographic
change
2.3Urbanisation
4.1Investor
expectations
4.2Government
interest
3.4Talent
3.3Customer centricity
3.2Technology
3.1Operational
drivers
2 Macro trendsSustainable ROE 4 Stakeholder expectations
1 External developments3 Internal responses
Basel III dominates the regulatory agendaBasel III establishes tougher capital standards through more restrictive capital definitions, higher risk-weighted assets (RWA), additional capital buffers and higher requirements for minimum capital ratios. In addition, it creates liquidity standards that could drive new balance sheet strategies designed to limit illiquid assets, restrict wholesale/unstable sources of funding and manage higher funding costs. These new standards could have a broad impact across most banks, particularly on those centred in commercial, wholesale and retail banking activities.
1.4 Regulatory reform
PwC | 29
These reforms also require banks to undertake significant process and system changes in order to achieve upgrades in the areas of stress testing, counterparty risk and capital management infrastructure. At the same time, banks are also required to invest in functionality systems to track, monitor and report on a variety of transactions, ensuring compliance with international legislation, such as FATCA and the Volcker Rule. It is, therefore, not surprising that regulatory reform is regarded as the most important development and pressing issue in the banking industry.
Despite the plethora of new regulations impacting the banking industry, participants indicated they have been extremely efficient in responding to the changes. The overall average score was 3.85 (out of 5) with the Big Four banks averaging 4 out of 5.
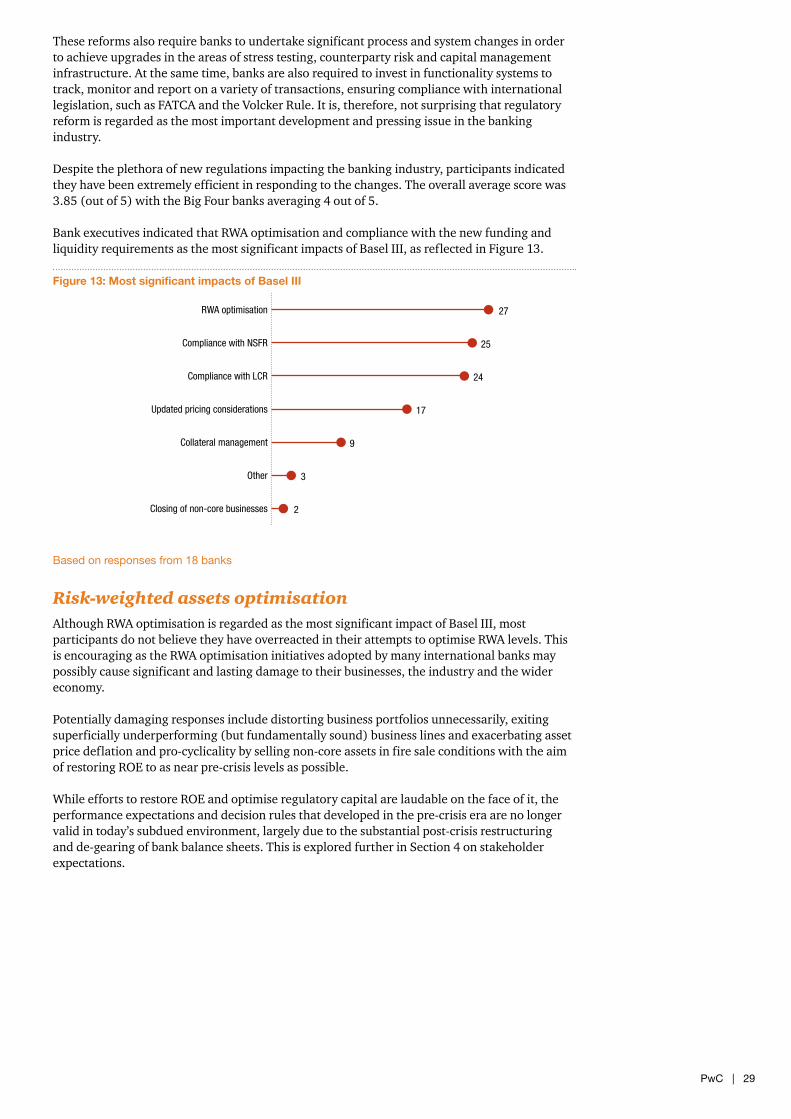
Bank executives indicated that RWA optimisation and compliance with the new funding and liquidity requirements as the most significant impacts of Basel III, as reflected in Figure 13.
Figure 13: Most significant impacts of Basel III
Based on responses from 18 banks
Risk-weighted assets optimisationAlthough RWA optimisation is regarded as the most significant impact of Basel III, most participants do not believe they have overreacted in their attempts to optimise RWA levels. This is encouraging as the RWA optimisation initiatives adopted by many international banks may possibly cause significant and lasting damage to their businesses, the industry and the wider economy.
Potentially damaging responses include distorting business portfolios unnecessarily, exiting superficially underperforming (but fundamentally sound) business lines and exacerbating asset price deflation and pro-cyclicality by selling non-core assets in fire sale conditions with the aim of restoring ROE to as near pre-crisis levels as possible.
While efforts to restore ROE and optimise regulatory capital are laudable on the face of it, the performance expectations and decision rules that developed in the pre-crisis era are no longer valid in today’s subdued environment, largely due to the substantial post-crisis restructuring and de-gearing of bank balance sheets. This is explored further in Section 4 on stakeholder expectations.
Closing of non-core businesses
Other
Collateral management
Updated pricing considerations
Compliance with LCR
Compliance with NSFR
RWA optimisation 27
25
24
17
9
3
2
30 | Shaping the Bank of the Future
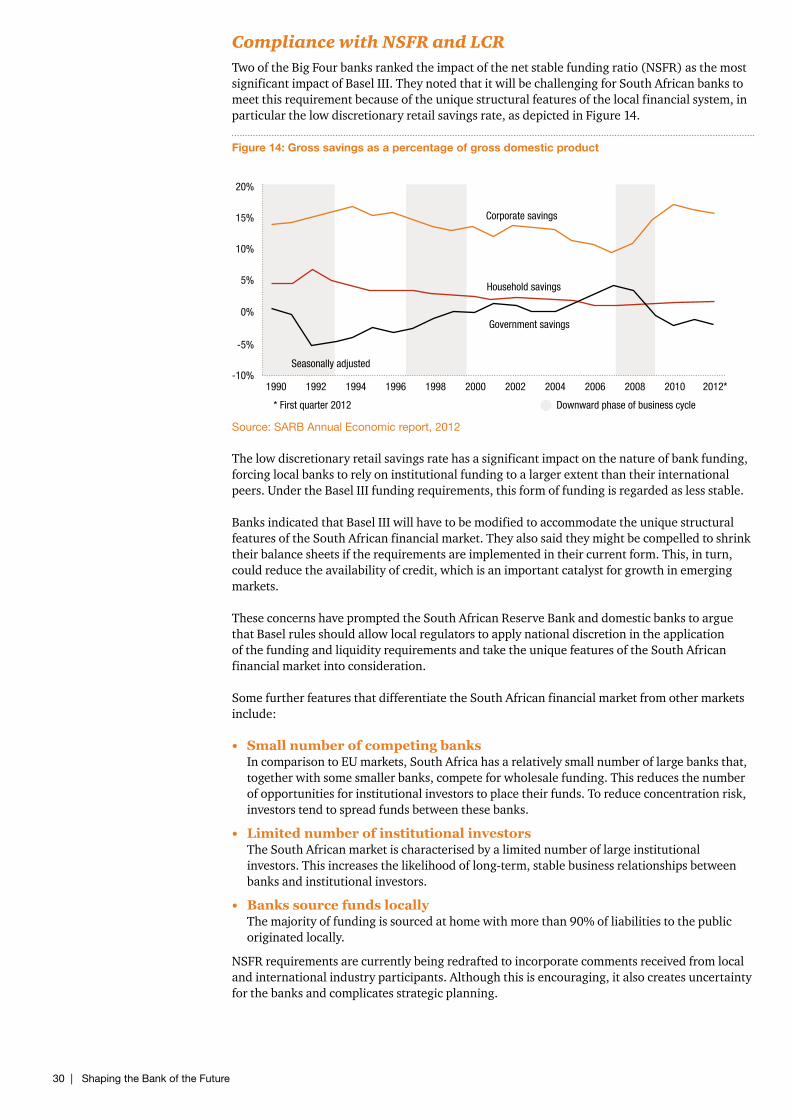
Compliance with NSFR and LCR Two of the Big Four banks ranked the impact of the net stable funding ratio (NSFR) as the most significant impact of Basel III. They noted that it will be challenging for South African banks to meet this requirement because of the unique structural features of the local financial system, in particular the low discretionary retail savings rate, as depicted in Figure 14.
Figure 14: Gross savings as a percentage of gross domestic product
Source: SARB Annual Economic report, 2012
The low discretionary retail savings rate has a significant impact on the nature of bank funding, forcing local banks to rely on institutional funding to a larger extent than their international peers. Under the Basel III funding requirements, this form of funding is regarded as less stable.
Banks indicated that Basel III will have to be modified to accommodate the unique structural features of the South African financial market. They also said they might be compelled to shrink their balance sheets if the requirements are implemented in their current form. This, in turn, could reduce the availability of credit, which is an important catalyst for growth in emerging markets.
These concerns have prompted the South African Reserve Bank and domestic banks to argue that Basel rules should allow local regulators to apply national discretion in the application of the funding and liquidity requirements and take the unique features of the South African financial market into consideration.
Some further features that differentiate the South African financial market from other markets include:
• SmallnumberofcompetingbanksIn comparison to EU markets, South Africa has a relatively small number of large banks that, together with some smaller banks, compete for wholesale funding. This reduces the number of opportunities for institutional investors to place their funds. To reduce concentration risk, investors tend to spread funds between these banks.
• LimitednumberofinstitutionalinvestorsThe South African market is characterised by a limited number of large institutional investors. This increases the likelihood of long-term, stable business relationships between banks and institutional investors.
• BankssourcefundslocallyThe majority of funding is sourced at home with more than 90% of liabilities to the public originated locally.
NSFR requirements are currently being redrafted to incorporate comments received from local and international industry participants. Although this is encouraging, it also creates uncertainty for the banks and complicates strategic planning.
1990 1992 1994-10%
* First quarter 2012 Downward phase of business cycle
Corporate savings
Seasonally adjusted
Household savings
Government savings
-5%
0%
5%
10%
15%
20%
1996 1998 2000 2002 2004 2006 2008 2010 2012*
PwC | 31
Capital levels will increase significantlyAs noted earlier, Basel III will have a significant impact on the capital requirements of banks through increased RWA requirements and additional capital buffers. In line with the Basel III framework, the South African Reserve Bank will introduce the following measures to address certain key weaknesses identified during the global financial crisis:
• AcapitalconservationbufferThis is intended to promote the conservation of capital as well as the build-up of adequate buffers (above the minimum) that can be drawn down in periods of stress. It will be phased in from 2016 and, when finally implemented, will reach a maximum of 2.5%.
• AcountercyclicalbufferThis is designed to adjust the capital conservation buffer range when there are signs that credit has grown to excessive levels. It achieves the broader macro-prudential goal of protecting the banking sector in periods of excess aggregate credit growth. As with the capital conservation buffer, this will be phased in from 2016. However, a notable difference is that it is set at zero in normal times and increases to a maximum of 2.5% during periods of excessive credit growth.
• Domesticsystemicallyimportantbank(D-SIB)capitalsurchargeThis aims to address shocks caused by those banks that are not significant from an international perspective, but which nevertheless could have an important impact on their own domestic financial system and economy compared to non-systemic institutions. The D-SIB capital requirement will range from 0 to 2.5% and will also be phased in from 2016.
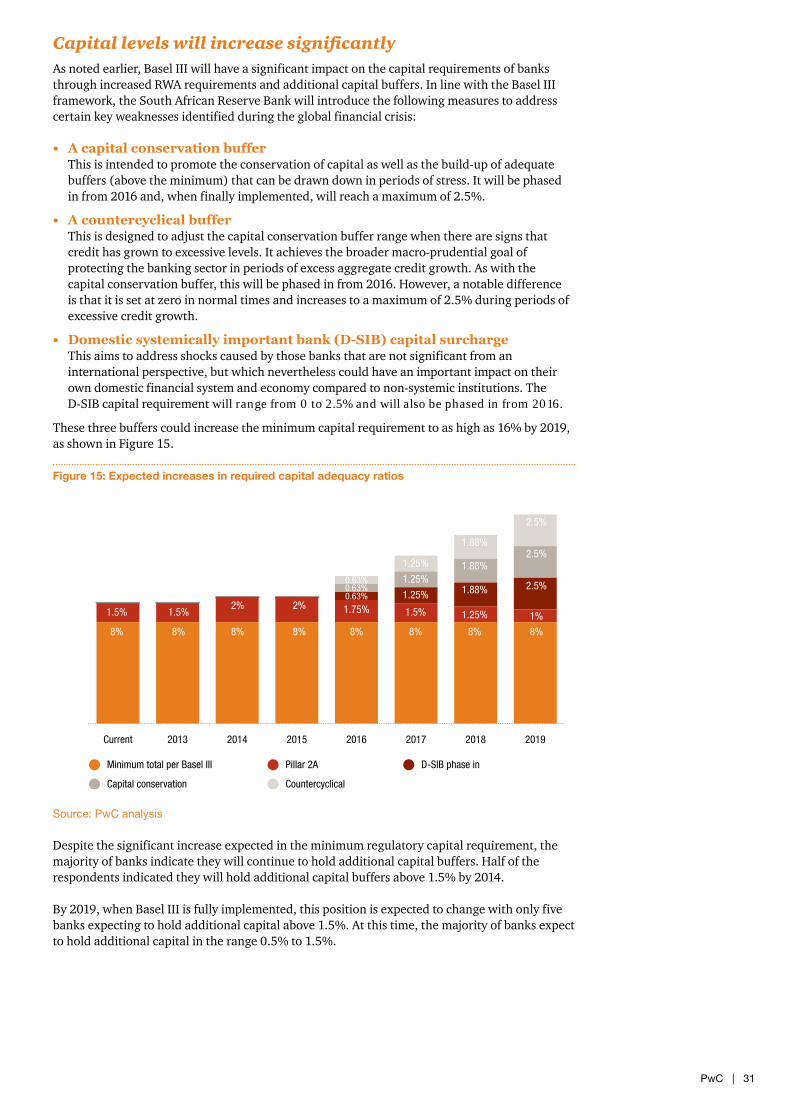
These three buffers could increase the minimum capital requirement to as high as 16% by 2019, as shown in Figure 15.
Figure 15: Expected increases in required capital adequacy ratios
Source: PwC analysis
Despite the significant increase expected in the minimum regulatory capital requirement, the majority of banks indicate they will continue to hold additional capital buffers. Half of the respondents indicated they will hold additional capital buffers above 1.5% by 2014.
By 2019, when Basel III is fully implemented, this position is expected to change with only five banks expecting to hold additional capital above 1.5%. At this time, the majority of banks expect to hold additional capital in the range 0.5% to 1.5%.
2019201820172016201520142013Current
8% 8% 8% 8% 8% 8% 8% 8%
1.5% 1.5%2% 2% 1.75% 1.5% 1.25% 1%
0.63% 1.25% 1.88% 2.5%0.63%1.25%
1.88%2.5%
0.63%
1.25%
1.88%
2.5%
Minimum total per Basel III Pillar 2A D-SIB phase in
Capital conservation Countercyclical
32 | Shaping the Bank of the Future
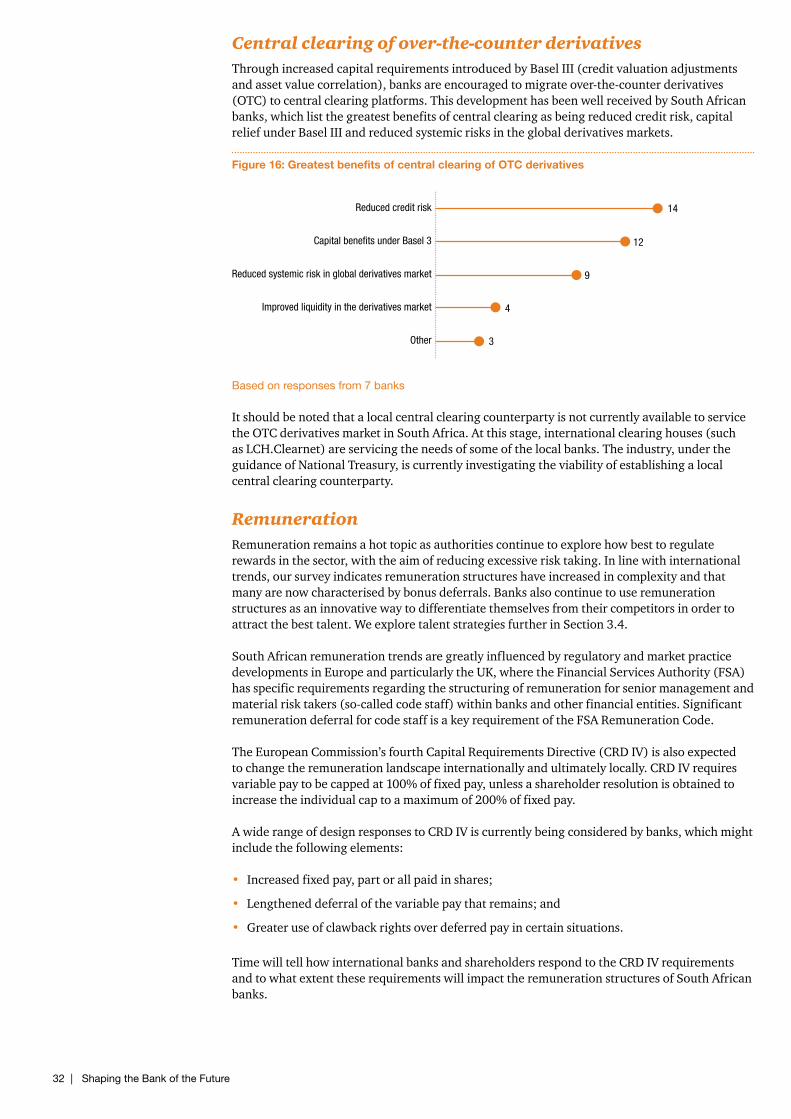
Central clearing of over-the-counter derivatives Through increased capital requirements introduced by Basel III (credit valuation adjustments and asset value correlation), banks are encouraged to migrate over-the-counter derivatives (OTC) to central clearing platforms. This development has been well received by South African banks, which list the greatest benefits of central clearing as being reduced credit risk, capital relief under Basel III and reduced systemic risks in the global derivatives markets.
Figure 16: Greatest benefits of central clearing of OTC derivatives
Based on responses from 7 banks
It should be noted that a local central clearing counterparty is not currently available to service the OTC derivatives market in South Africa. At this stage, international clearing houses (such as LCH.Clearnet) are servicing the needs of some of the local banks. The industry, under the guidance of National Treasury, is currently investigating the viability of establishing a local central clearing counterparty.
RemunerationRemuneration remains a hot topic as authorities continue to explore how best to regulate rewards in the sector, with the aim of reducing excessive risk taking. In line with international trends, our survey indicates remuneration structures have increased in complexity and that many are now characterised by bonus deferrals. Banks also continue to use remuneration structures as an innovative way to differentiate themselves from their competitors in order to attract the best talent. We explore talent strategies further in Section 3.4.
South African remuneration trends are greatly influenced by regulatory and market practice developments in Europe and particularly the UK, where the Financial Services Authority (FSA) has specific requirements regarding the structuring of remuneration for senior management and material risk takers (so-called code staff) within banks and other financial entities. Significant remuneration deferral for code staff is a key requirement of the FSA Remuneration Code.
The European Commission’s fourth Capital Requirements Directive (CRD IV) is also expected to change the remuneration landscape internationally and ultimately locally. CRD IV requires variable pay to be capped at 100% of fixed pay, unless a shareholder resolution is obtained to increase the individual cap to a maximum of 200% of fixed pay.
A wide range of design responses to CRD IV is currently being considered by banks, which might include the following elements:
• Increased fixed pay, part or all paid in shares;
• Lengthened deferral of the variable pay that remains; and
• Greater use of clawback rights over deferred pay in certain situations.
Time will tell how international banks and shareholders respond to the CRD IV requirements and to what extent these requirements will impact the remuneration structures of South African banks.
Other
Improved liquidity in the derivatives market
Reduced systemic risk in global derivatives market
Capital benefits under Basel 3
Reduced credit risk 14
12
9
4
3

PwC | 33

34 | Shaping the Bank of the Future
2 Macro trends
PwC | 35
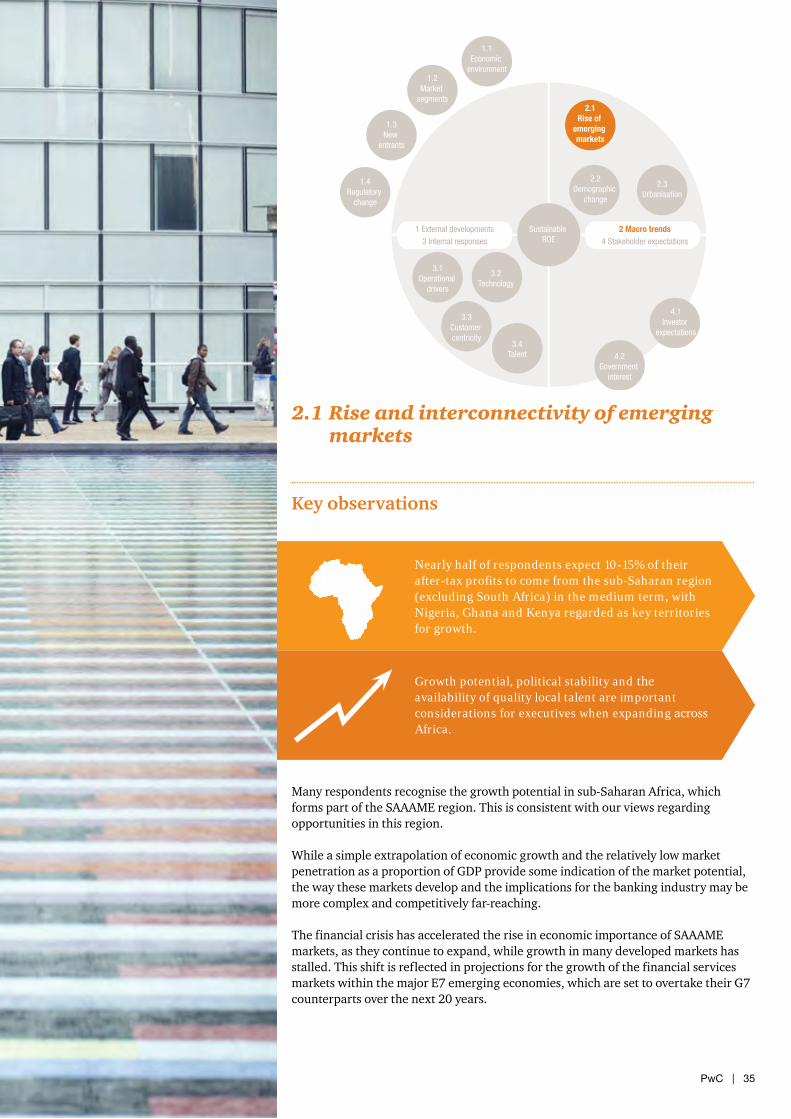
Nearly half of respondents expect 10-15% of their after-tax profits to come from the sub-Saharan region (excluding South Africa) in the medium term, with Nigeria, Ghana and Kenya regarded as key territories for growth.
Growth potential, political stability and the availability of quality local talent are important considerations for executives when expanding across Africa.
1.4Regulatory
change
1.3New
entrants
1.2Market
segments
1.1Economic
environment
2.1Rise of
emerging markets
2.2Demographic
change
2.3Urbanisation
4.1Investor
expectations
4.2Government
interest
3.4Talent
3.3Customer centricity
3.2Technology
3.1Operational
drivers
2 Macro trendsSustainable ROE 4 Stakeholder expectations
1 External developments3 Internal responses
2.1 Rise and interconnectivity of emerging markets
Key observations
Many respondents recognise the growth potential in sub-Saharan Africa, which forms part of the SAAAME region. This is consistent with our views regarding opportunities in this region.
While a simple extrapolation of economic growth and the relatively low market penetration as a proportion of GDP provide some indication of the market potential, the way these markets develop and the implications for the banking industry may be more complex and competitively far-reaching.
The financial crisis has accelerated the rise in economic importance of SAAAME markets, as they continue to expand, while growth in many developed markets has stalled. This shift is reflected in projections for the growth of the financial services markets within the major E7 emerging economies, which are set to overtake their G7 counterparts over the next 20 years.
36 | Shaping the Bank of the Future
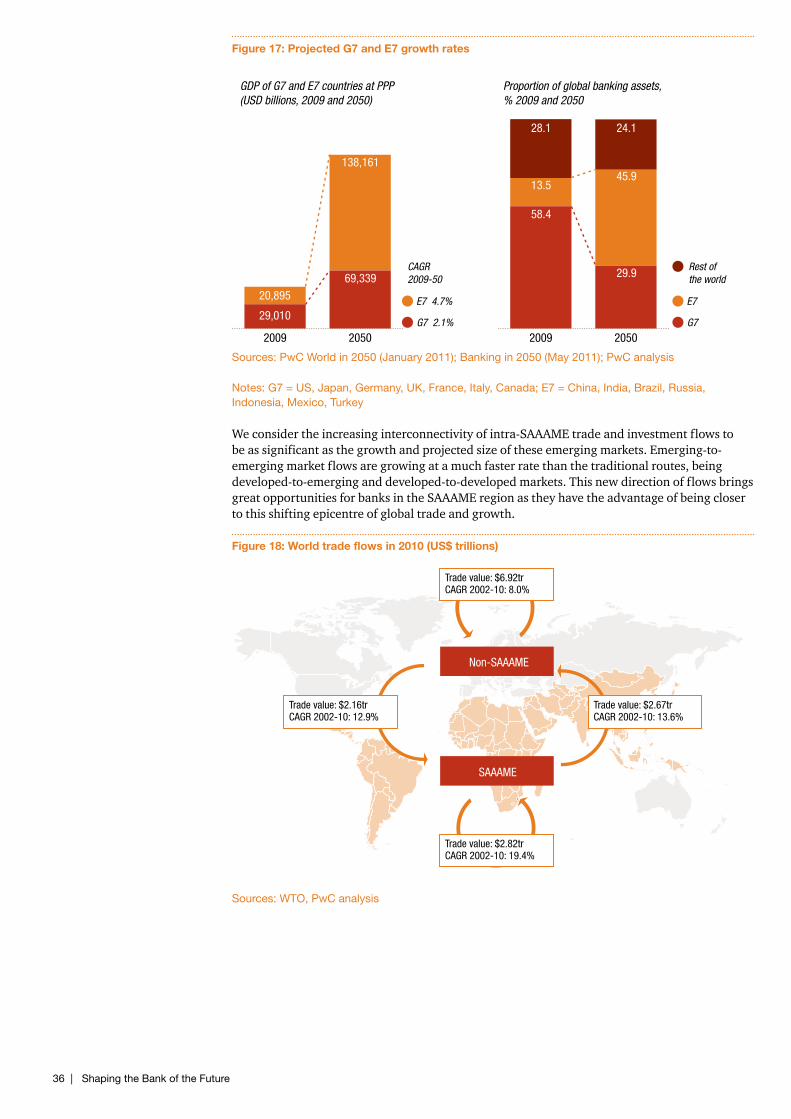
Figure 17: Projected G7 and E7 growth rates
Sources: PwC World in 2050 (January 2011); Banking in 2050 (May 2011); PwC analysis
Notes: G7 = US, Japan, Germany, UK, France, Italy, Canada; E7 = China, India, Brazil, Russia, Indonesia, Mexico, Turkey
We consider the increasing interconnectivity of intra-SAAAME trade and investment flows to be as significant as the growth and projected size of these emerging markets. Emerging-to-emerging market flows are growing at a much faster rate than the traditional routes, being developed-to-emerging and developed-to-developed markets. This new direction of flows brings great opportunities for banks in the SAAAME region as they have the advantage of being closer to this shifting epicentre of global trade and growth.
Figure 18: World trade flows in 2010 (US$ trillions)
Sources: WTO, PwC analysis
20502009 20502009
GDP of G7 and E7 countries at PPP�(USD billions, 2009 and 2050)
Proportion of global banking assets, % 2009 and 2050
20,895
138,161
28.1
13.5
58.4
24.1
45.9
29.9
29,010
69,339
E7
G7
Rest of the world
E7 4.7%
G7 2.1%
CAGR2009-50
Non-SAAAME
SAAAME
Trade value: $6.92trCAGR 2002-10: 8.0%
Trade value: $2.82trCAGR 2002-10: 19.4%
Trade value: $2.16trCAGR 2002-10: 12.9%
Trade value: $2.67trCAGR 2002-10: 13.6%
PwC | 37
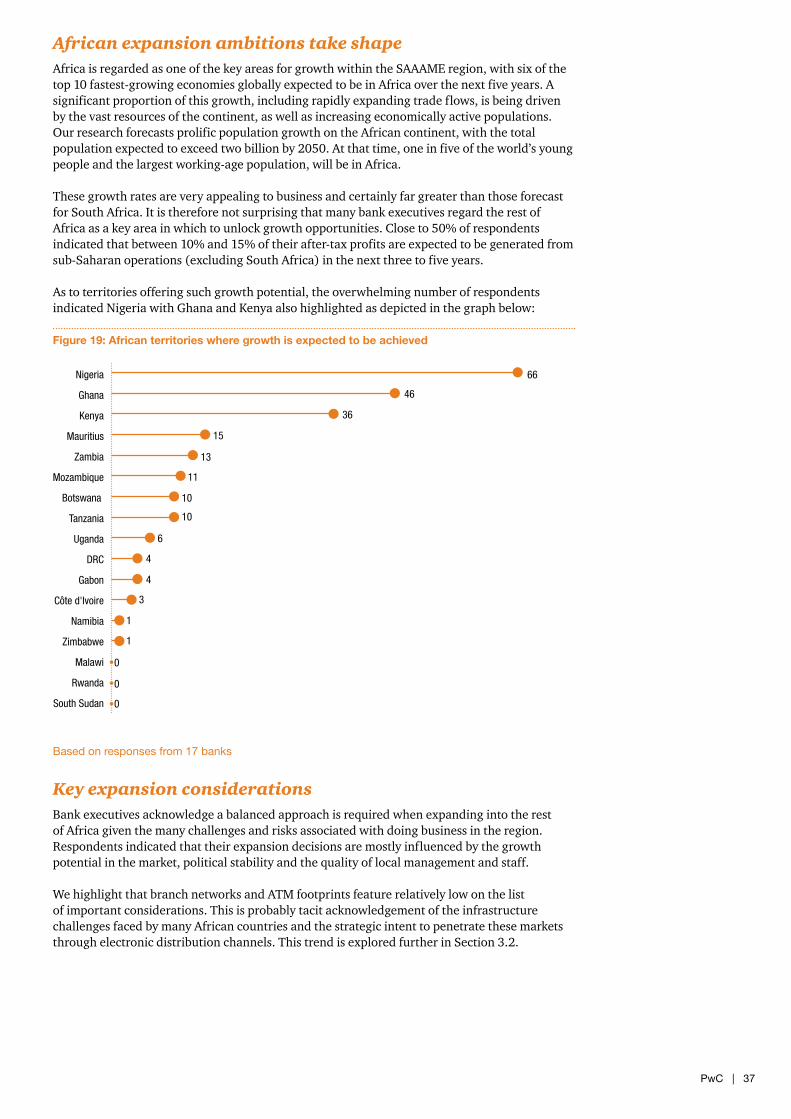
African expansion ambitions take shapeAfrica is regarded as one of the key areas for growth within the SAAAME region, with six of the top 10 fastest-growing economies globally expected to be in Africa over the next five years. A significant proportion of this growth, including rapidly expanding trade flows, is being driven by the vast resources of the continent, as well as increasing economically active populations. Our research forecasts prolific population growth on the African continent, with the total population expected to exceed two billion by 2050. At that time, one in five of the world’s young people and the largest working-age population, will be in Africa.
These growth rates are very appealing to business and certainly far greater than those forecast for South Africa. It is therefore not surprising that many bank executives regard the rest of Africa as a key area in which to unlock growth opportunities. Close to 50% of respondents indicated that between 10% and 15% of their after-tax profits are expected to be generated from sub-Saharan operations (excluding South Africa) in the next three to five years.
As to territories offering such growth potential, the overwhelming number of respondents indicated Nigeria with Ghana and Kenya also highlighted as depicted in the graph below:
Figure 19: African territories where growth is expected to be achieved
Based on responses from 17 banks
Key expansion considerationsBank executives acknowledge a balanced approach is required when expanding into the rest of Africa given the many challenges and risks associated with doing business in the region. Respondents indicated that their expansion decisions are mostly influenced by the growth potential in the market, political stability and the quality of local management and staff.
We highlight that branch networks and ATM footprints feature relatively low on the list of important considerations. This is probably tacit acknowledgement of the infrastructure challenges faced by many African countries and the strategic intent to penetrate these markets through electronic distribution channels. This trend is explored further in Section 3.2.
South Sudan
Rwanda
Malawi
Zimbabwe
Namibia
Côte d'Ivoire
Gabon
DRC
Uganda
Tanzania
Botswana
Mozambique
Zambia
Mauritius
Kenya
Ghana
Nigeria 66
46
36
15
13
11
10
10
6
4
4
3
1
1
0
0
0
38 | Shaping the Bank of the Future
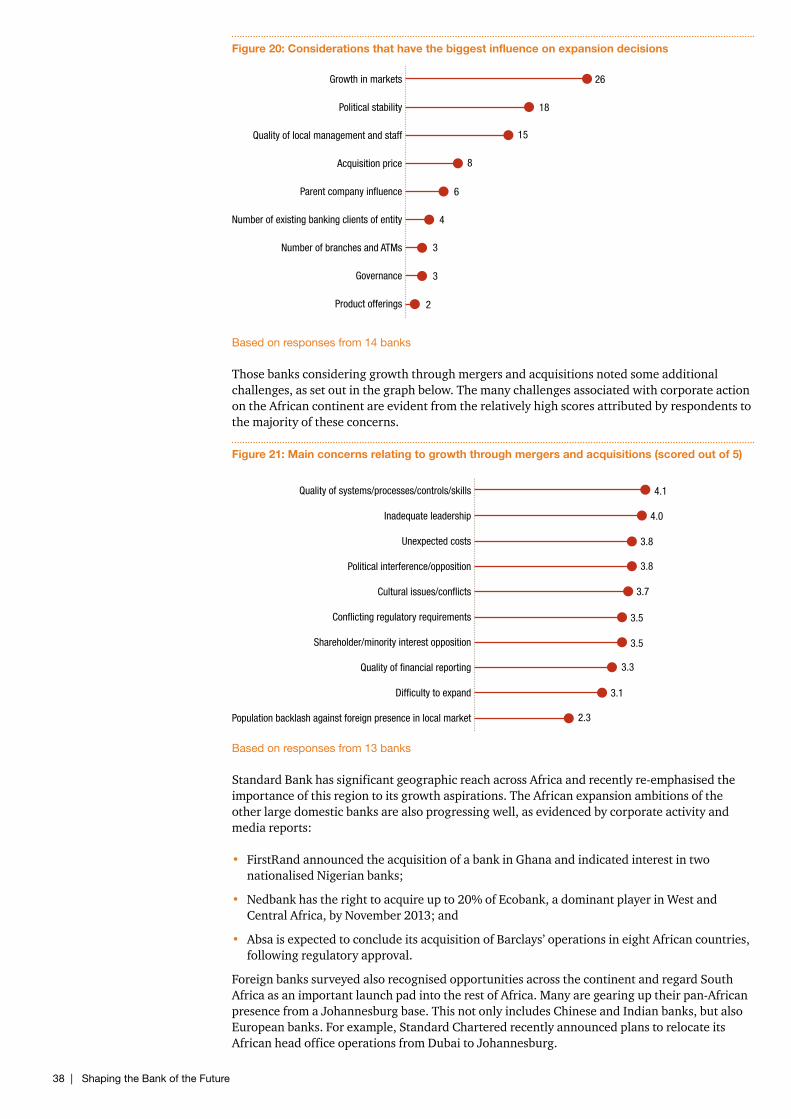
Figure 20: Considerations that have the biggest influence on expansion decisions
Based on responses from 14 banks
Those banks considering growth through mergers and acquisitions noted some additional challenges, as set out in the graph below. The many challenges associated with corporate action on the African continent are evident from the relatively high scores attributed by respondents to the majority of these concerns.
Figure 21: Main concerns relating to growth through mergers and acquisitions (scored out of 5)
Based on responses from 13 banks
Standard Bank has significant geographic reach across Africa and recently re-emphasised the importance of this region to its growth aspirations. The African expansion ambitions of the other large domestic banks are also progressing well, as evidenced by corporate activity and media reports:
• FirstRand announced the acquisition of a bank in Ghana and indicated interest in two nationalised Nigerian banks;
• Nedbank has the right to acquire up to 20% of Ecobank, a dominant player in West and Central Africa, by November 2013; and
• Absa is expected to conclude its acquisition of Barclays’ operations in eight African countries, following regulatory approval.
Foreign banks surveyed also recognised opportunities across the continent and regard South Africa as an important launch pad into the rest of Africa. Many are gearing up their pan-African presence from a Johannesburg base. This not only includes Chinese and Indian banks, but also European banks. For example, Standard Chartered recently announced plans to relocate its African head office operations from Dubai to Johannesburg.
Product offerings
Governance
Number of branches and ATMs
Number of existing banking clients of entity
Parent company influence
Acquisition price
Quality of local management and staff
Political stability
Growth in markets 26
18
15
8
6
4
3
3
2
Population backlash against foreign presence in local market
Difficulty to expand
Quality of financial reporting
Shareholder/minority interest opposition
Conflicting regulatory requirements
Cultural issues/conflicts
Political interference/opposition
Unexpected costs
Inadequate leadership
Quality of systems/processes/controls/skills 4.1
4.0
3.8
3.8
3.7
3.5
3.5
3.3
3.1
2.3
PwC | 39
Demographic changes will have a pronounced impact on the profile of economies around the world. Banks must anticipate these changes and align products and services to their changing customer base.
SAAAME regions are experiencing significant population growth, specifically in economically active segments. This creates an attractive market for deposits, lending and transactional banking.
1.4Regulatory
change
1.3New
entrants
1.2Market
segments
1.1Economic
environment
2.1Rise of
emerging markets
2.2Demographic
change
2.3Urbanisation
4.1Investor
expectations
4.2Government
interest
3.4Talent
3.3Customer centricity
3.2Technology
3.1Operational
drivers
2 Macro trendsSustainable ROE 4 Stakeholder expectations
1 External developments3 Internal responses
Key observations
Diversity
2.2 Demographic shifts
40 | Shaping the Bank of the Future
With a global population that has recently passed seven billion, demographic change is a key consideration for governments and financial institutions. Mortality and fertility rates are starting to converge, slowing the growth of the world’s population.
The decrease in mortality rates is being driven by a combination of advances in healthcare, increasing global wealth, improved social services and better education. The decreasing fertility rate corresponds to shifting lifestyles. The impact of demographic change is likely to vary across different regions of the world depending on the net effect of birth rates and ageing patterns.
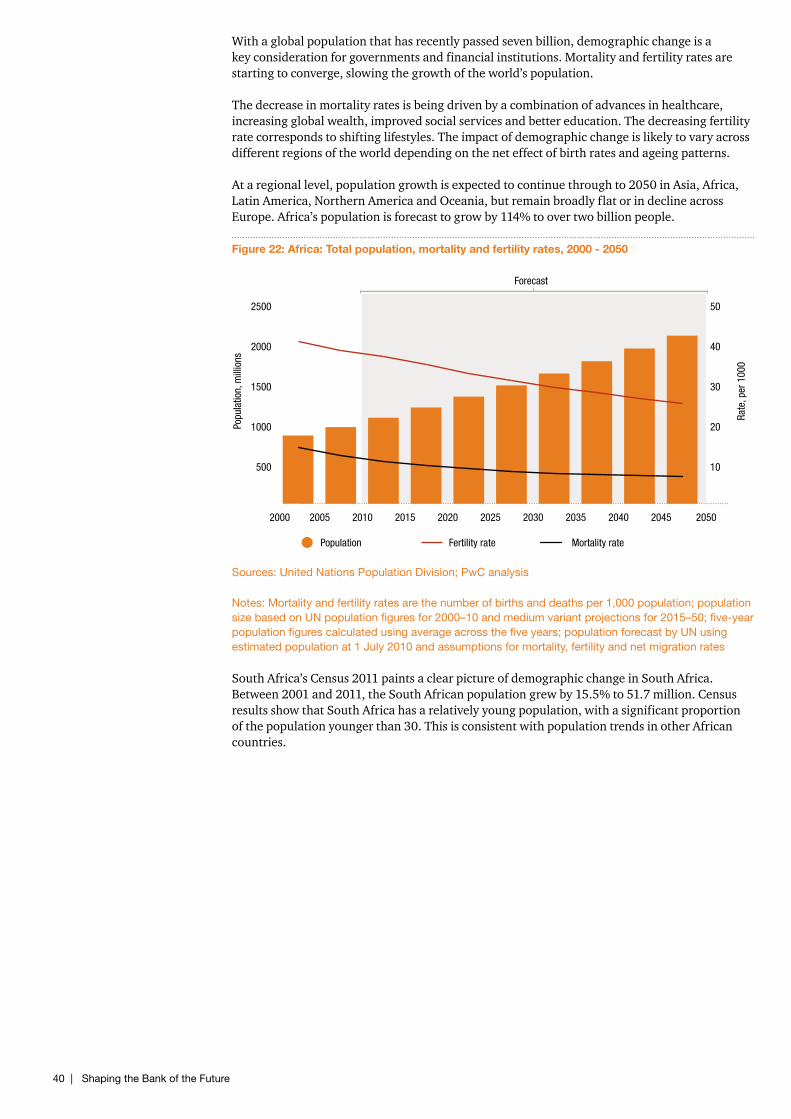
At a regional level, population growth is expected to continue through to 2050 in Asia, Africa, Latin America, Northern America and Oceania, but remain broadly flat or in decline across Europe. Africa’s population is forecast to grow by 114% to over two billion people.
Figure 22: Africa: Total population, mortality and fertility rates, 2000 - 2050
Sources: United Nations Population Division; PwC analysis
Notes: Mortality and fertility rates are the number of births and deaths per 1,000 population; population size based on UN population figures for 2000–10 and medium variant projections for 2015–50; five-year population figures calculated using average across the five years; population forecast by UN using estimated population at 1 July 2010 and assumptions for mortality, fertility and net migration rates
South Africa’s Census 2011 paints a clear picture of demographic change in South Africa. Between 2001 and 2011, the South African population grew by 15.5% to 51.7 million. Census results show that South Africa has a relatively young population, with a significant proportion of the population younger than 30. This is consistent with population trends in other African countries.
500
1000
1500
2000
2500
2045 2050204020352030202520202015201020052000
10
20
30
40
50
Popu
latio
n, m
illio
ns
Rate
, per
100
0
Forecast
Population Fertility rate Mortality rate
PwC | 41
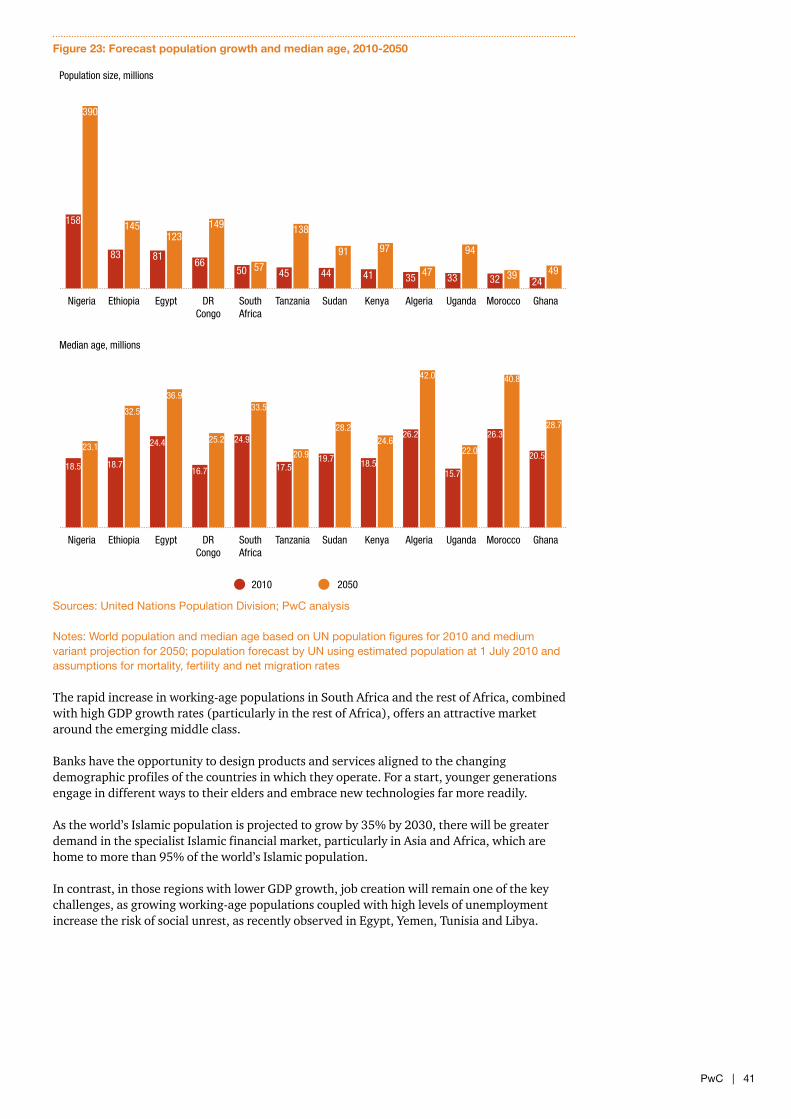
Figure 23: Forecast population growth and median age, 2010-2050
Sources: United Nations Population Division; PwC analysis
Notes: World population and median age based on UN population figures for 2010 and medium variant projection for 2050; population forecast by UN using estimated population at 1 July 2010 and assumptions for mortality, fertility and net migration rates
The rapid increase in working-age populations in South Africa and the rest of Africa, combined with high GDP growth rates (particularly in the rest of Africa), offers an attractive market around the emerging middle class.
Banks have the opportunity to design products and services aligned to the changing demographic profiles of the countries in which they operate. For a start, younger generations engage in different ways to their elders and embrace new technologies far more readily.
As the world’s Islamic population is projected to grow by 35% by 2030, there will be greater demand in the specialist Islamic financial market, particularly in Asia and Africa, which are home to more than 95% of the world’s Islamic population.
In contrast, in those regions with lower GDP growth, job creation will remain one of the key challenges, as growing working-age populations coupled with high levels of unemployment increase the risk of social unrest, as recently observed in Egypt, Yemen, Tunisia and Libya.
Population size, millions
GhanaMoroccoUgandaAlgeriaKenyaSudanTanzaniaSouthAfrica
DRCongo
EgyptEthiopiaNigeria
158
390
83
145
81
123
66
149
50 5745
138
44
91
41
97
35 47 33
94
324939
24
Median age, millions
2010 2050
GhanaMoroccoUgandaAlgeriaKenyaSudanTanzaniaSouthAfrica
DRCongo
EgyptEthiopiaNigeria
18.5
23.1
18.7
32.5
24.4
36.9
16.7
25.2 24.9
33.5
17.520.9 19.7
28.2
18.5
24.626.2
42.0
15.7
22.0
26.328.7
40.8
20.5

42 | Shaping the Bank of the Future
Key observations
1.4Regulatory
change
1.3New
entrants
1.2Market
segments
1.1Economic
environment
2.1Rise of
emerging markets
2.2Demographic
change
2.3Urbanisation
4.1Investor
expectations
4.2Government
interest
3.4Talent
3.3Customer centricity
3.2Technology
3.1Operational
drivers
2 Macro trendsSustainable ROE 4 Stakeholder expectations
1 External developments3 Internal responses
Over the next 30 years, the urbanisation of 1.8 billion people will bring the global urban population to 5.6 billion.
Urbanisation increases the stress on physical and service infrastructure, creating demand for investment that will support the migration of people into cities.
Banks must tailor their service offerings for rural and urban populations. Urban populations have a higher demand for financial products and services. However, banks should continue to explore innovative ways of meeting rural customer needs.
2.3 Urbanisation
PwC | 43
Social and behavioural change is occurring around the world on a number of levels, mainly due to increased personal wealth, urbanisation, migration of talent and technology. These developments are shifting global markets and changing and establishing new business models.
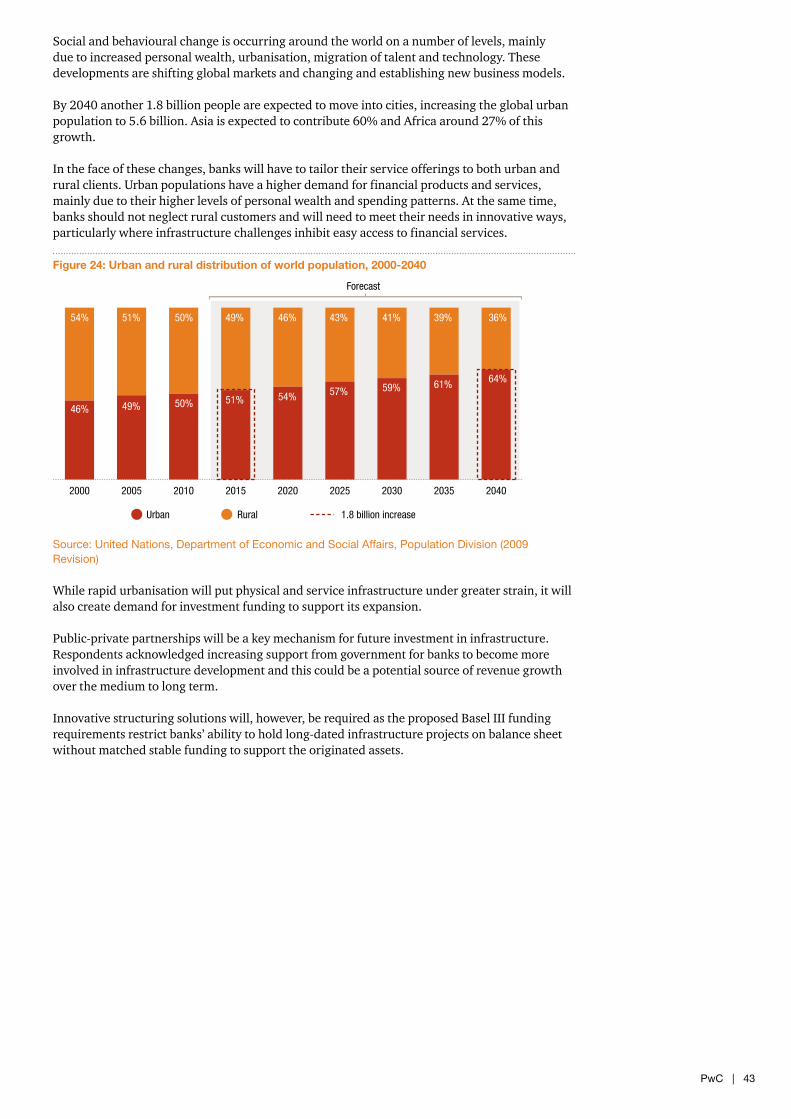
By 2040 another 1.8 billion people are expected to move into cities, increasing the global urban population to 5.6 billion. Asia is expected to contribute 60% and Africa around 27% of this growth.
In the face of these changes, banks will have to tailor their service offerings to both urban and rural clients. Urban populations have a higher demand for financial products and services, mainly due to their higher levels of personal wealth and spending patterns. At the same time, banks should not neglect rural customers and will need to meet their needs in innovative ways, particularly where infrastructure challenges inhibit easy access to financial services.
Figure 24: Urban and rural distribution of world population, 2000-2040
Source: United Nations, Department of Economic and Social Affairs, Population Division (2009 Revision)
While rapid urbanisation will put physical and service infrastructure under greater strain, it will also create demand for investment funding to support its expansion.
Public-private partnerships will be a key mechanism for future investment in infrastructure. Respondents acknowledged increasing support from government for banks to become more involved in infrastructure development and this could be a potential source of revenue growth over the medium to long term.
Innovative structuring solutions will, however, be required as the proposed Basel III funding requirements restrict banks’ ability to hold long-dated infrastructure projects on balance sheet without matched stable funding to support the originated assets.
204020352030202520202015201020052000
Forecast
Urban Rural 1.8 billion increase
54%
46%
51%
49%
50%
50%
49%
51%
46%
54%
43%
57%
41%
59%
39%
61%
36%
64%

44 | Shaping the Bank of the Future
3 Internal responses
PwC | 45
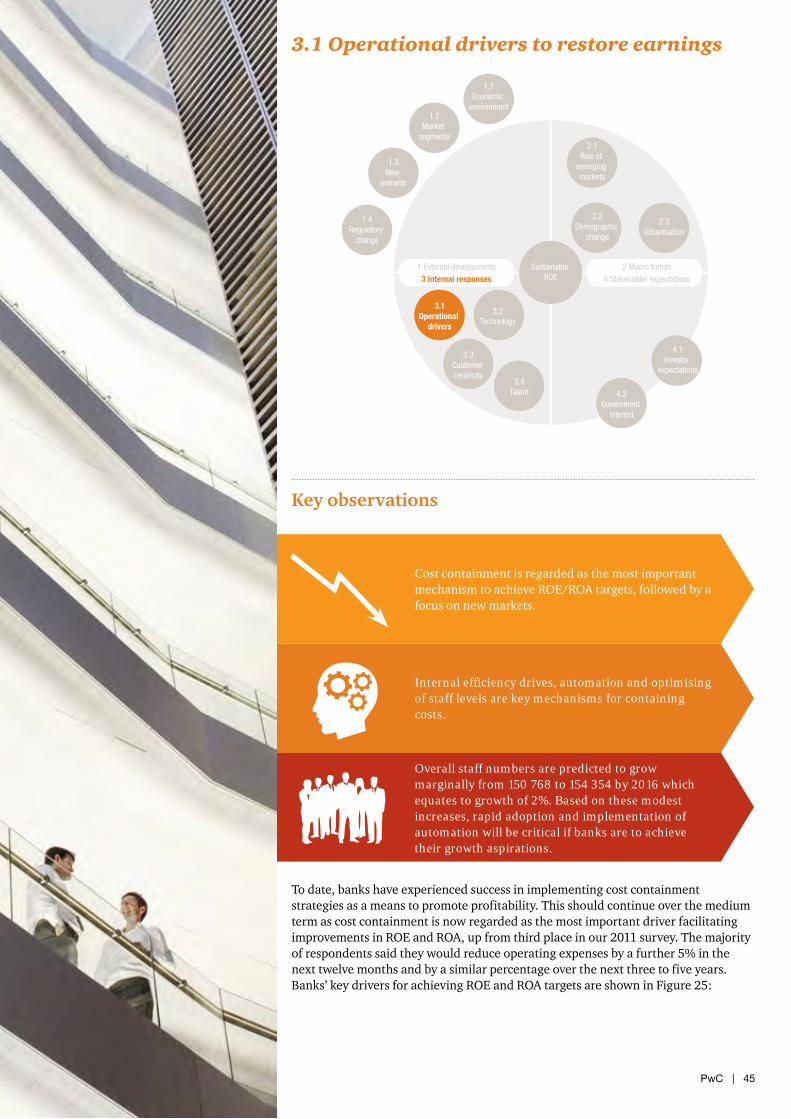
Cost containment is regarded as the most important mechanism to achieve ROE/ROA targets, followed by a focus on new markets.
Internal efficiency drives, automation and optimising of staff levels are key mechanisms for containing costs.
Overall staff numbers are predicted to grow marginally from 150 768 to 154 354 by 2016 which equates to growth of 2%. Based on these modest increases, rapid adoption and implementation of automation will be critical if banks are to achieve their growth aspirations.
1.4Regulatory
change
1.3New
entrants
1.2Market
segments
1.1Economic
environment
2.1Rise of
emerging markets
2.2Demographic
change
2.3Urbanisation
4.1Investor
expectations
4.2Government
interest
3.4Talent
3.3Customer centricity
3.2Technology
3.1Operational
drivers
2 Macro trendsSustainable ROE 4 Stakeholder expectations
1 External developments3 Internal responses
Key observations
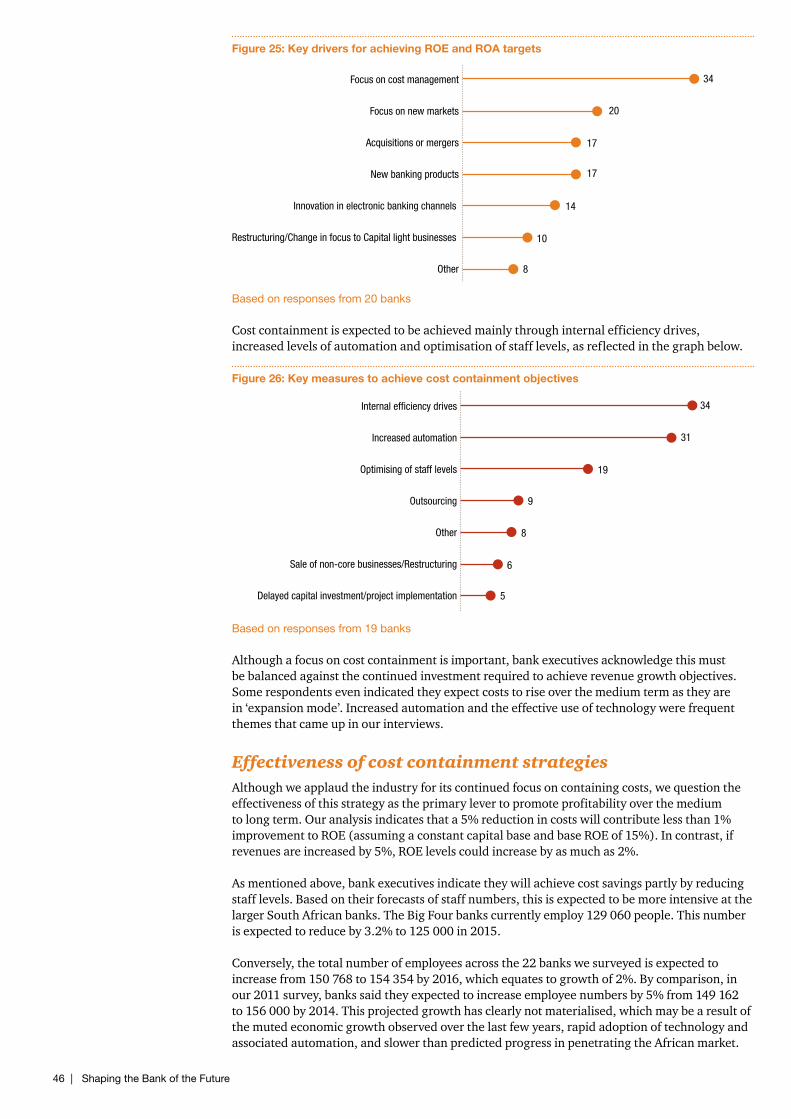
To date, banks have experienced success in implementing cost containment strategies as a means to promote profitability. This should continue over the medium term as cost containment is now regarded as the most important driver facilitating improvements in ROE and ROA, up from third place in our 2011 survey. The majority of respondents said they would reduce operating expenses by a further 5% in the next twelve months and by a similar percentage over the next three to five years. Banks’ key drivers for achieving ROE and ROA targets are shown in Figure 25:
3.1 Operational drivers to restore earnings
46 | Shaping the Bank of the Future
Figure 25: Key drivers for achieving ROE and ROA targets
Based on responses from 20 banks
Cost containment is expected to be achieved mainly through internal efficiency drives, increased levels of automation and optimisation of staff levels, as reflected in the graph below.
Figure 26: Key measures to achieve cost containment objectives
Based on responses from 19 banks
Although a focus on cost containment is important, bank executives acknowledge this must be balanced against the continued investment required to achieve revenue growth objectives. Some respondents even indicated they expect costs to rise over the medium term as they are in ‘expansion mode’. Increased automation and the effective use of technology were frequent themes that came up in our interviews.
Effectiveness of cost containment strategiesAlthough we applaud the industry for its continued focus on containing costs, we question the effectiveness of this strategy as the primary lever to promote profitability over the medium to long term. Our analysis indicates that a 5% reduction in costs will contribute less than 1% improvement to ROE (assuming a constant capital base and base ROE of 15%). In contrast, if revenues are increased by 5%, ROE levels could increase by as much as 2%.
As mentioned above, bank executives indicate they will achieve cost savings partly by reducing staff levels. Based on their forecasts of staff numbers, this is expected to be more intensive at the larger South African banks. The Big Four banks currently employ 129 060 people. This number is expected to reduce by 3.2% to 125 000 in 2015.
Conversely, the total number of employees across the 22 banks we surveyed is expected to increase from 150 768 to 154 354 by 2016, which equates to growth of 2%. By comparison, in our 2011 survey, banks said they expected to increase employee numbers by 5% from 149 162 to 156 000 by 2014. This projected growth has clearly not materialised, which may be a result of the muted economic growth observed over the last few years, rapid adoption of technology and associated automation, and slower than predicted progress in penetrating the African market.
Other
Restructuring/Change in focus to Capital light businesses
Innovation in electronic banking channels
New banking products
Acquisitions or mergers
Focus on new markets
Focus on cost management 34
20
17
17
14
10
8
Delayed capital investment/project implementation
Sale of non-core businesses/Restructuring
Other
Outsourcing
Optimising of staff levels
Increased automation
Internal efficiency drives 34
31
19
9
8
6
5
PwC | 47
Key observations
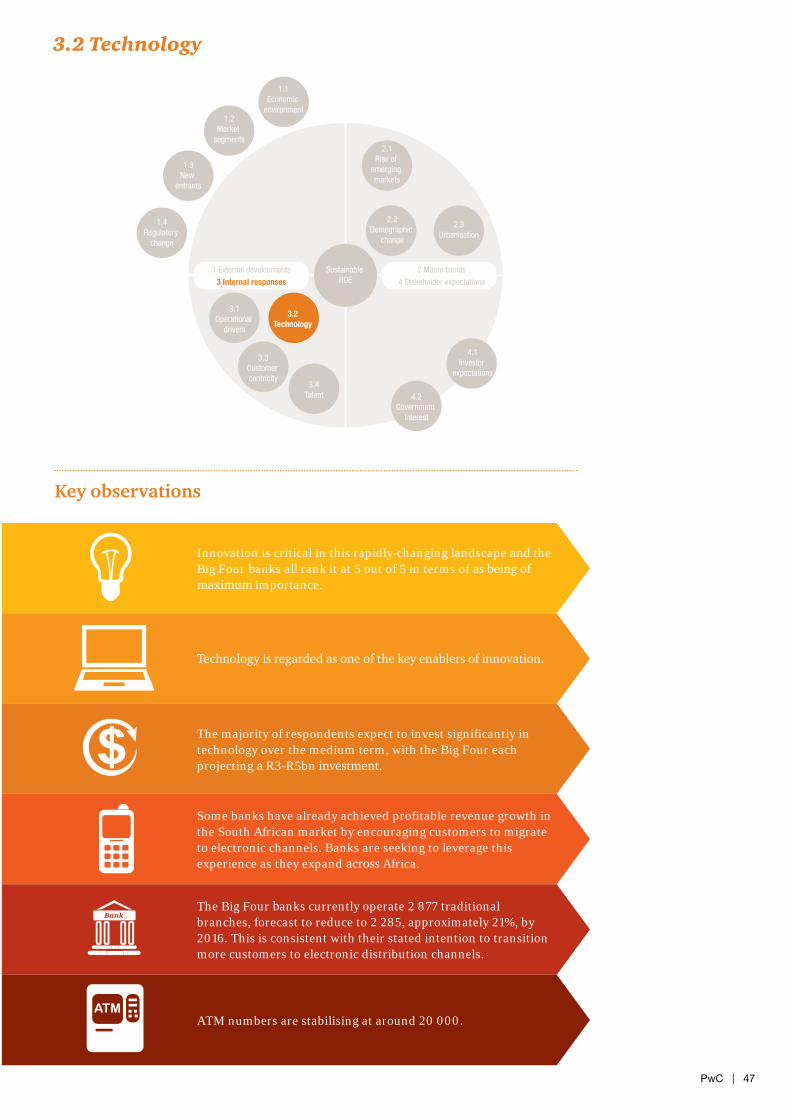
Innovation is critical in this rapidly-changing landscape and the Big Four banks all rank it at 5 out of 5 in terms of as being of maximum importance.
Technology is regarded as one of the key enablers of innovation.
The majority of respondents expect to invest significantly in technology over the medium term, with the Big Four each projecting a R3-R5bn investment.
Some banks have already achieved profitable revenue growth in the South African market by encouraging customers to migrate to electronic channels. Banks are seeking to leverage this experience as they expand across Africa.
The Big Four banks currently operate 2 877 traditional branches, forecast to reduce to 2 285, approximately 21%, by 2016. This is consistent with their stated intention to transition more customers to electronic distribution channels.
ATM numbers are stabilising at around 20 000.
1.4Regulatory
change
1.3New
entrants
1.2Market
segments
1.1Economic
environment
2.1Rise of
emerging markets
2.2Demographic
change
2.3Urbanisation
4.1Investor
expectations
4.2Government
interest
3.4Talent
3.3Customer centricity
3.2Technology
3.1Operational
drivers
2 Macro trendsSustainable ROE 4 Stakeholder expectations
1 External developments3 Internal responses
3.2 Technology
48 | Shaping the Bank of the Future
Technological change has the potential to alter the business, operational and investment models of banks. As the speed of technological innovation accelerates, banks are facing immense challenges where to focus technology investment, what technology to use and how to manage implementation across multiple geographies and businesses. At the same time, technology is transforming customer behaviours by fundamentally changing distribution models and raising the bar on customer experience.
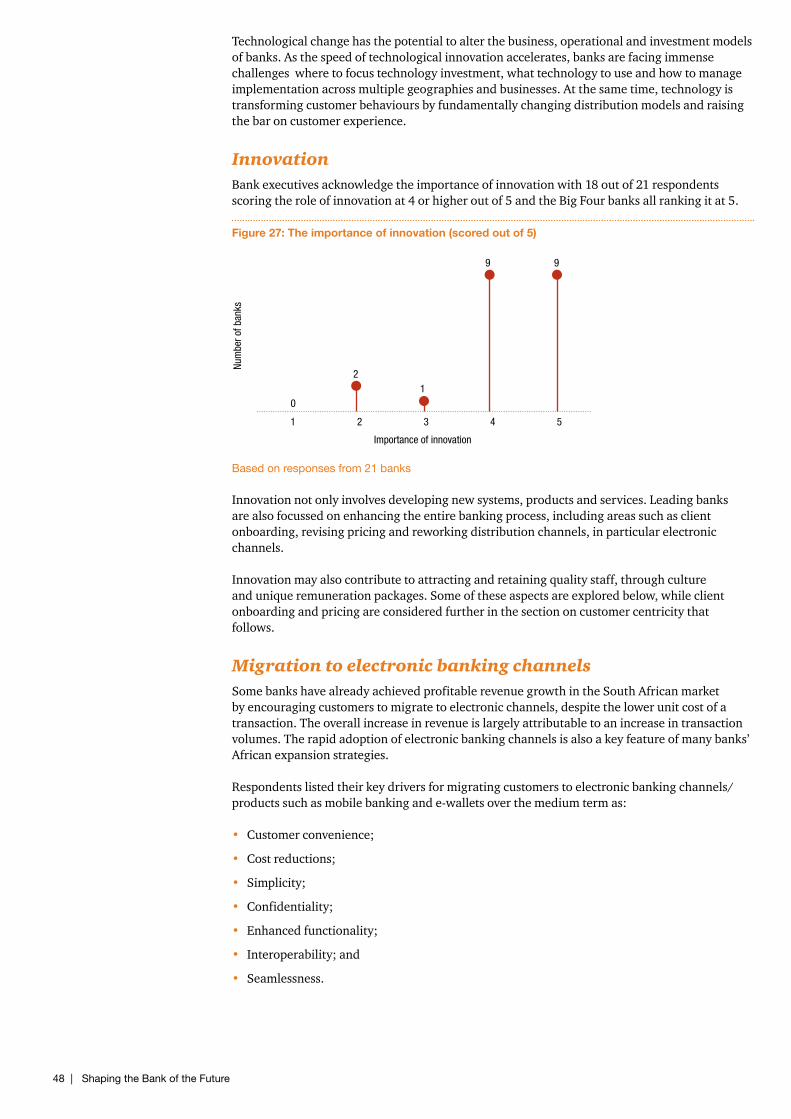
InnovationBank executives acknowledge the importance of innovation with 18 out of 21 respondents scoring the role of innovation at 4 or higher out of 5 and the Big Four banks all ranking it at 5.
Figure 27: The importance of innovation (scored out of 5)
Based on responses from 21 banks
Innovation not only involves developing new systems, products and services. Leading banks are also focussed on enhancing the entire banking process, including areas such as client onboarding, revising pricing and reworking distribution channels, in particular electronic channels.
Innovation may also contribute to attracting and retaining quality staff, through culture and unique remuneration packages. Some of these aspects are explored below, while client onboarding and pricing are considered further in the section on customer centricity that follows.
Migration to electronic banking channelsSome banks have already achieved profitable revenue growth in the South African market by encouraging customers to migrate to electronic channels, despite the lower unit cost of a transaction. The overall increase in revenue is largely attributable to an increase in transaction volumes. The rapid adoption of electronic banking channels is also a key feature of many banks’ African expansion strategies.
Respondents listed their key drivers for migrating customers to electronic banking channels/products such as mobile banking and e-wallets over the medium term as:
• Customer convenience;
• Cost reductions;
• Simplicity;
• Confidentiality;
• Enhanced functionality;
• Interoperability; and
• Seamlessness.
Importance of innovation
Num
ber o
f ban
ks
0
54321
21
9 9
PwC | 49
Through the rapid adoption of mobile banking as a distribution channel in emerging markets, its innovative use within financial services has leapfrogged developed markets. Indeed, rather than following the path to maturity seen in the West, it’s likely that SAAAME markets will develop very differently, leading innovation in many areas of financial services. For example, mobile money transfers have already seen exponential growth in emerging markets, as shown in Figure 28.
Figure 28: Worldwide mobile money deployments
Sources: WirelessIntelligence.com Mobile Money Deployment Tracker, accessed 03/10/2011
Notes: Mobile money is defined as ‘the use of a mobile phone in order to transfer funds between banks or accounts, deposit or withdraw funds, or pay bills’. This term is also used for the broader realm of electronic commerce and can refer to the use of a mobile device to purchase items, whether physical or electronic (Business dictionary online)
Harnessing the true potential of smartphones for electronic banking purposes should be a key priority for banks, specifically considering the ever-growing number of economically-active people in Africa and the fact that emerging markets will represent over 60% of worldwide smartphone shipments by 2015.
North America2005: Obopay2007: Monetise2008: Mobex2009: Zoompass
Middle East2008: Roshan, Zain2010: Cellcom2011: MCI, Zain, Vodaphone
Europe2001: Paybox2006: Monitise2008: Mpass2010: Proximus, Millennium Bank2011: Geocell, MagtiCom, Telenor
Latin America and the Caribbean2007: Oi2008: Tigo2009: Movistar, Vivo, DDDedo2010: Entel, Digicel, Tpago, mPeso2011: Daviplata, Tigo, Voila
Africa2004: Celpay, WIZZIT2007: Safaricom2008: Vodacom, Zantel, Zanaco2009: Celpay, MTN, Orange, Txtnpay, Airtel, Splash Cash, Standard Bank, Mobile Transactions2010: Airtel, MTN, Orange, Econnet Wireless, Mobicash, Masary, Tigo, Tangaza, Telma, Maroc Telecom, Somtel, Vodacom, UT Mobile2011: Mascom and Orange, MTN, Lonestar, MobiPay, Tigo, NetOne, Telecel
Asia-Pacific2003: Smart2004: Globe Telecom2005: True Move2006: Grameenphone, NTT DOCOMO2007: Maxis, Dialog2008: WING, China Unicom2009: Eko, Suvidha, Celcom, XacBank, Telenor2010: Banglalink, Cellcard, Vodaphone, Digicel, Nokia Money, Telkomesel, MobiCom, UBL Bank, Vinaphone2011: bKash, Idea Cellular, Mobilink, Digicel, Mpowa, AIS
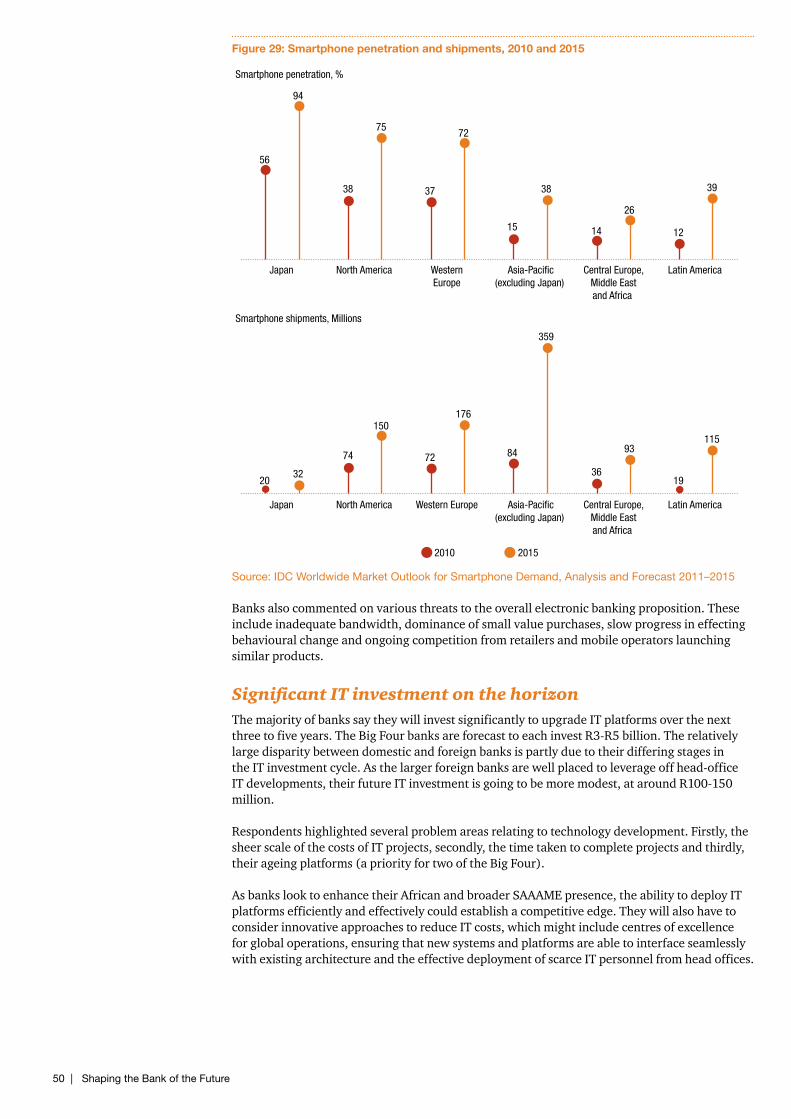
50 | Shaping the Bank of the Future
Figure 29: Smartphone penetration and shipments, 2010 and 2015
Source: IDC Worldwide Market Outlook for Smartphone Demand, Analysis and Forecast 2011–2015
Banks also commented on various threats to the overall electronic banking proposition. These include inadequate bandwidth, dominance of small value purchases, slow progress in effecting behavioural change and ongoing competition from retailers and mobile operators launching similar products.
Significant IT investment on the horizonThe majority of banks say they will invest significantly to upgrade IT platforms over the next three to five years. The Big Four banks are forecast to each invest R3-R5 billion. The relatively large disparity between domestic and foreign banks is partly due to their differing stages in the IT investment cycle. As the larger foreign banks are well placed to leverage off head-office IT developments, their future IT investment is going to be more modest, at around R100-150 million.
Respondents highlighted several problem areas relating to technology development. Firstly, the sheer scale of the costs of IT projects, secondly, the time taken to complete projects and thirdly, their ageing platforms (a priority for two of the Big Four).
As banks look to enhance their African and broader SAAAME presence, the ability to deploy IT platforms efficiently and effectively could establish a competitive edge. They will also have to consider innovative approaches to reduce IT costs, which might include centres of excellence for global operations, ensuring that new systems and platforms are able to interface seamlessly with existing architecture and the effective deployment of scarce IT personnel from head offices.
Latin America Central Europe,Middle Eastand Africa
Asia-Pacific(excluding Japan)
Western Europe
North America Japan
56
94
38
75
37
72
15
38
14
26
12
39
Smartphone penetration, %
Smartphone shipments, Millions
2010 2015
Latin America Central Europe,Middle Eastand Africa
Asia-Pacific(excluding Japan)
Western Europe North America Japan
2032
74
150
72
176
84
359
36
93
19
115
PwC | 51
Continued relevance of physical touch pointsTheBigFourbankscurrentlyoperate2 877traditionalbranchescomparedto2 740branchesin2011.Atthattimerespondentspredictedanincreaseto2 910branchesby2014.However,banksarenowforecastingthatbrancheswillreducebyapproximately21%to2 285by2016.Thisconfirms previous indications that the Big Four banks plan to reduce the number of bricks and mortar branches over the next three years.
This does not necessarily mean that their distribution networks will be negatively affected. Instead, banks are looking to reduce costs and improve efficiency in the scope and scale of their branch networks by reaching out to customers through new self-service touch points. For example, one of the Big Four banks indicated in its latest integrated report that in the year to December 2012, registered active cell-phone banking users increased by 79% and internet banking users increased by 34%. Another Big Four bank commented that customers continue to migrate away from traditional channels such as branches and ATMs. Given these trends, the projected decrease in traditional branches is not surprising.
Looking at the branch network in more detail, there is evidence of growth in the number of branches that service the previously unbanked (the ‘inclusive’ market). These are generally smaller, lower-cost branches. One of the Big Four banks indicated that the number of such branches increased by 37% in the previous financial year. Another bank reported it had opened 80 new outlets, while another opened 100 in the last financial year.
Despite the overall expected reduction in the number of traditional branches, we believe the branch remains relevant. Some customers feel more secure if they are able to see their bank. We think branches may become smaller in size and look different depending on the markets they service. For example, private banking branches will be more customer friendly, with a coffee shop feel, while mainstream branches are partnering with, and even moving into, retail shops.
TheBigFourbankscurrentlyoperate19 648ATMs,slightlylessthanthenumberofATMsreportedin2011(21 000).RespondentssaidtheyplannedtomaintainexistingATMlevelsorincrease the number marginally. The projected branch and ATM trends clearly point to the role of technology in opening up new mobile distribution channels.
Cybercrime and related fraud on the riseSurvey participants highlighted the growing threat of cybercrime and noted high levels of card fraud and internet fraud as weaknesses in the industry. In the context of operational losses, executives ranked external fraud, including cybercrime, at 4 out of 5 in importance. With its current ranking of 7 (2011: 12) on the list of most pressing issues, data security has increased in importance for the majority of banks since our 2011 survey.
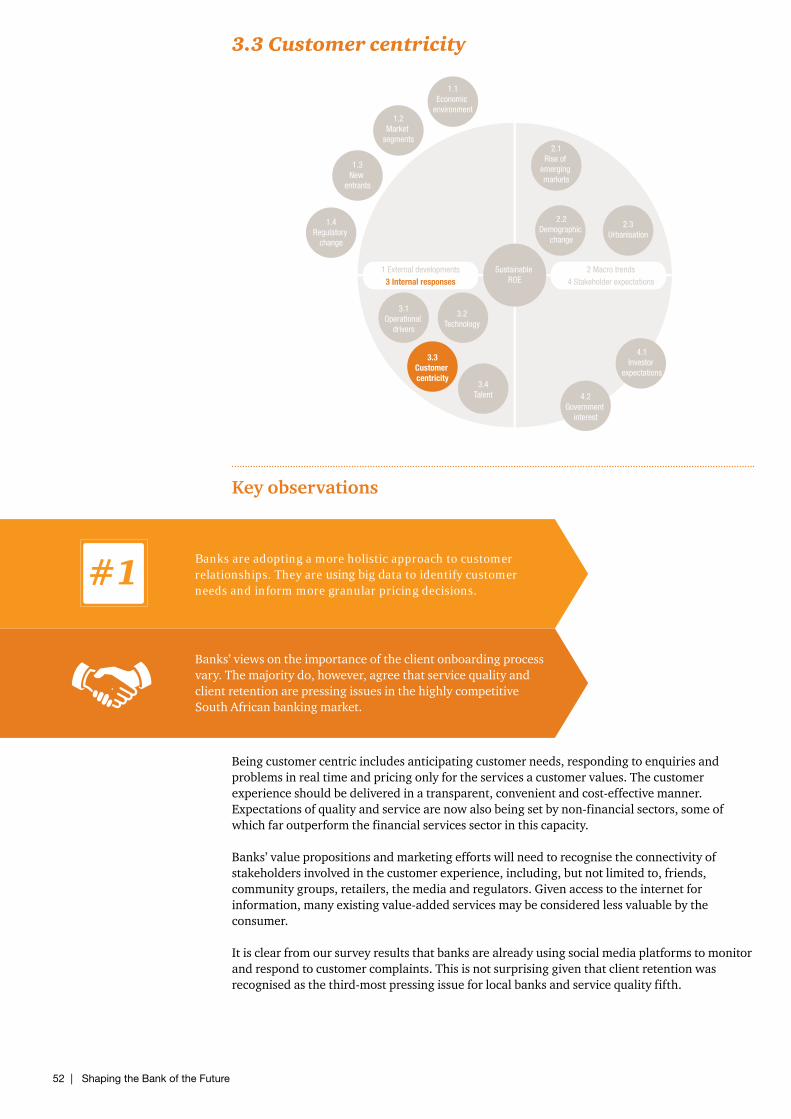
52 | Shaping the Bank of the Future
Key observations
Banks are adopting a more holistic approach to customer relationships. They are using big data to identify customer needs and inform more granular pricing decisions.
Banks’ views on the importance of the client onboarding process vary. The majority do, however, agree that service quality and client retention are pressing issues in the highly competitive South African banking market.
1.4Regulatory
change
1.3New
entrants
1.2Market
segments
1.1Economic
environment
2.1Rise of
emerging markets
2.2Demographic
change
2.3Urbanisation
4.1Investor
expectations
4.2Government
interest
3.4Talent
3.3Customer centricity
3.2Technology
3.1Operational
drivers
2 Macro trendsSustainable ROE 4 Stakeholder expectations
1 External developments3 Internal responses
Being customer centric includes anticipating customer needs, responding to enquiries and problems in real time and pricing only for the services a customer values. The customer experience should be delivered in a transparent, convenient and cost-effective manner. Expectations of quality and service are now also being set by non-financial sectors, some of which far outperform the financial services sector in this capacity.
Banks’ value propositions and marketing efforts will need to recognise the connectivity of stakeholders involved in the customer experience, including, but not limited to, friends, community groups, retailers, the media and regulators. Given access to the internet for information, many existing value-added services may be considered less valuable by the consumer.
It is clear from our survey results that banks are already using social media platforms to monitor and respond to customer complaints. This is not surprising given that client retention was recognised as the third-most pressing issue for local banks and service quality fifth.
3.3 Customer centricity
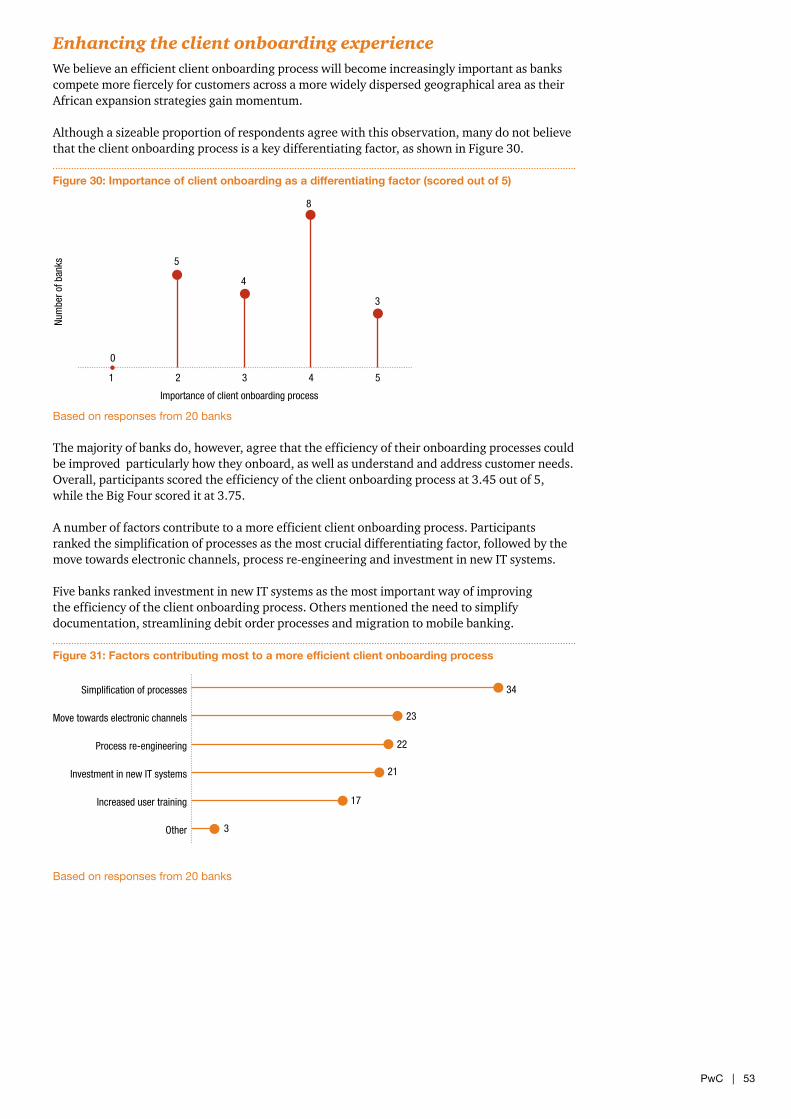
PwC | 53
Enhancing the client onboarding experienceWe believe an efficient client onboarding process will become increasingly important as banks compete more fiercely for customers across a more widely dispersed geographical area as their African expansion strategies gain momentum.
Although a sizeable proportion of respondents agree with this observation, many do not believe that the client onboarding process is a key differentiating factor, as shown in Figure 30.
Figure 30: Importance of client onboarding as a differentiating factor (scored out of 5)
Based on responses from 20 banks
The majority of banks do, however, agree that the efficiency of their onboarding processes could be improved particularly how they onboard, as well as understand and address customer needs. Overall, participants scored the efficiency of the client onboarding process at 3.45 out of 5, while the Big Four scored it at 3.75.
A number of factors contribute to a more efficient client onboarding process. Participants ranked the simplification of processes as the most crucial differentiating factor, followed by the move towards electronic channels, process re-engineering and investment in new IT systems.
Five banks ranked investment in new IT systems as the most important way of improving the efficiency of the client onboarding process. Others mentioned the need to simplify documentation, streamlining debit order processes and migration to mobile banking.
Figure 31: Factors contributing most to a more efficient client onboarding process
Based on responses from 20 banks
Importance of client onboarding process
0
54321
5
4
8
3
Num
ber o
f ban
ks
Other
Increased user training
Investment in new IT systems
Process re-engineering
Move towards electronic channels
Simplification of processes 34
23
22
21
17
3
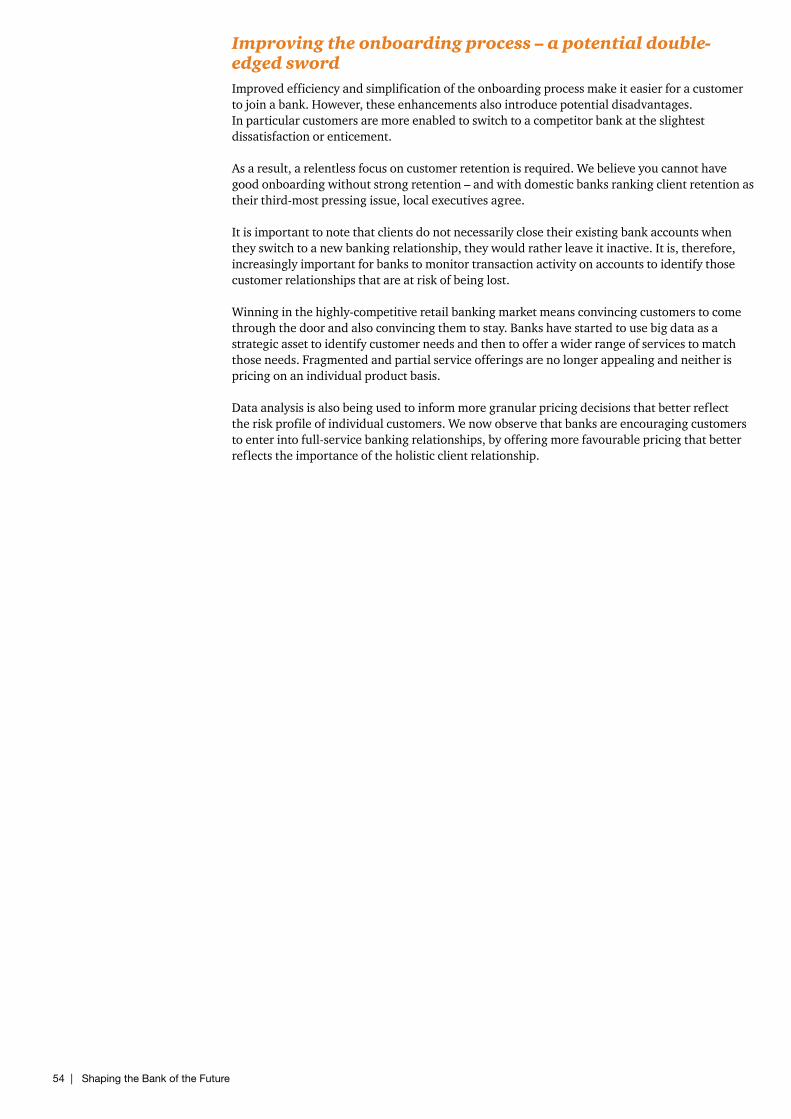
54 | Shaping the Bank of the Future
Improving the onboarding process – a potential double-edged swordImproved efficiency and simplification of the onboarding process make it easier for a customer to join a bank. However, these enhancements also introduce potential disadvantages. In particular customers are more enabled to switch to a competitor bank at the slightest dissatisfaction or enticement.
As a result, a relentless focus on customer retention is required. We believe you cannot have good onboarding without strong retention – and with domestic banks ranking client retention as their third-most pressing issue, local executives agree.
It is important to note that clients do not necessarily close their existing bank accounts when they switch to a new banking relationship, they would rather leave it inactive. It is, therefore, increasingly important for banks to monitor transaction activity on accounts to identify those customer relationships that are at risk of being lost.
Winning in the highly-competitive retail banking market means convincing customers to come through the door and also convincing them to stay. Banks have started to use big data as a strategic asset to identify customer needs and then to offer a wider range of services to match those needs. Fragmented and partial service offerings are no longer appealing and neither is pricing on an individual product basis.
Data analysis is also being used to inform more granular pricing decisions that better reflect the risk profile of individual customers. We now observe that banks are encouraging customers to enter into full-service banking relationships, by offering more favourable pricing that better reflects the importance of the holistic client relationship.
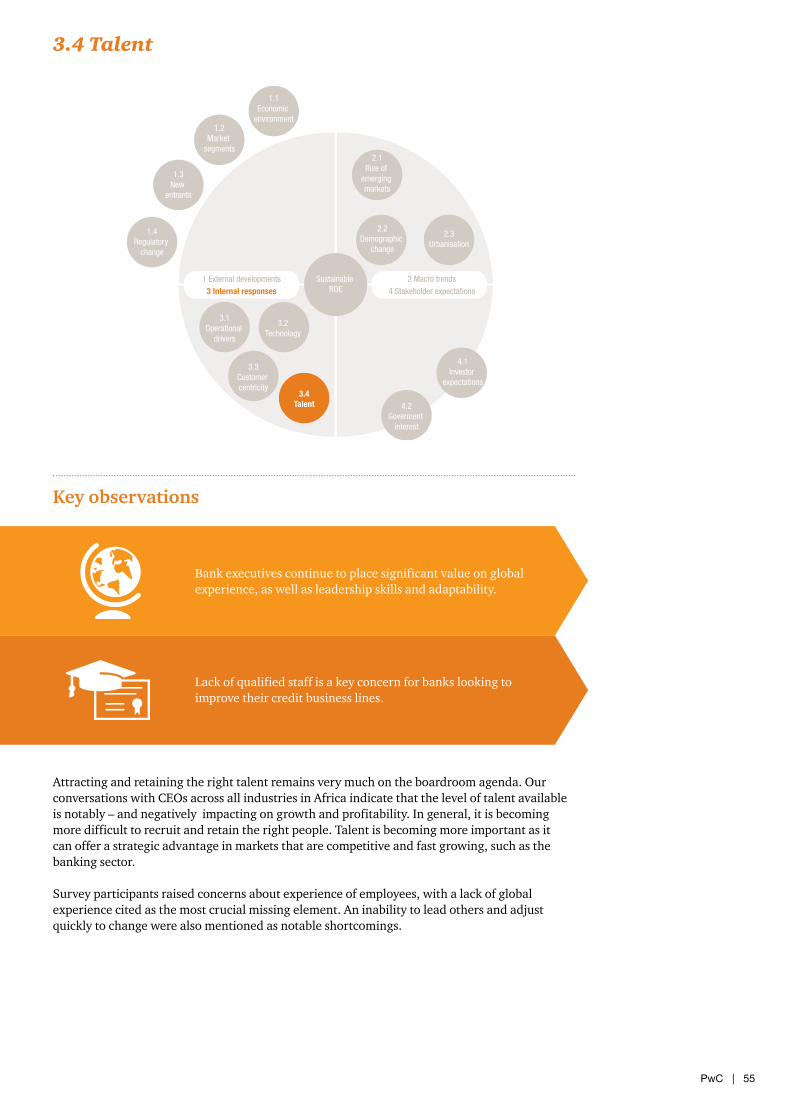
PwC | 55
Key observations
Bank executives continue to place significant value on global experience, as well as leadership skills and adaptability.
Lack of qualified staff is a key concern for banks looking to improve their credit business lines.
1.4Regulatory
change
1.3New
entrants
1.2Market
segments
1.1Economic
environment
2.1Rise of
emerging markets
2.2Demographic
change
2.3Urbanisation
4.1Investor
expectations
4.2Goverment
interest
3.4Talent
3.3Customer centricity
3.2Technology
3.1Operational
drivers
2 Macro trendsSustainable ROE 4 Stakeholder expectations
1 External developments3 Internal responses
Attracting and retaining the right talent remains very much on the boardroom agenda. Our conversations with CEOs across all industries in Africa indicate that the level of talent available is notably – and negatively impacting on growth and profitability. In general, it is becoming more difficult to recruit and retain the right people. Talent is becoming more important as it can offer a strategic advantage in markets that are competitive and fast growing, such as the banking sector.
Survey participants raised concerns about experience of employees, with a lack of global experience cited as the most crucial missing element. An inability to lead others and adjust quickly to change were also mentioned as notable shortcomings.
3.4 Talent
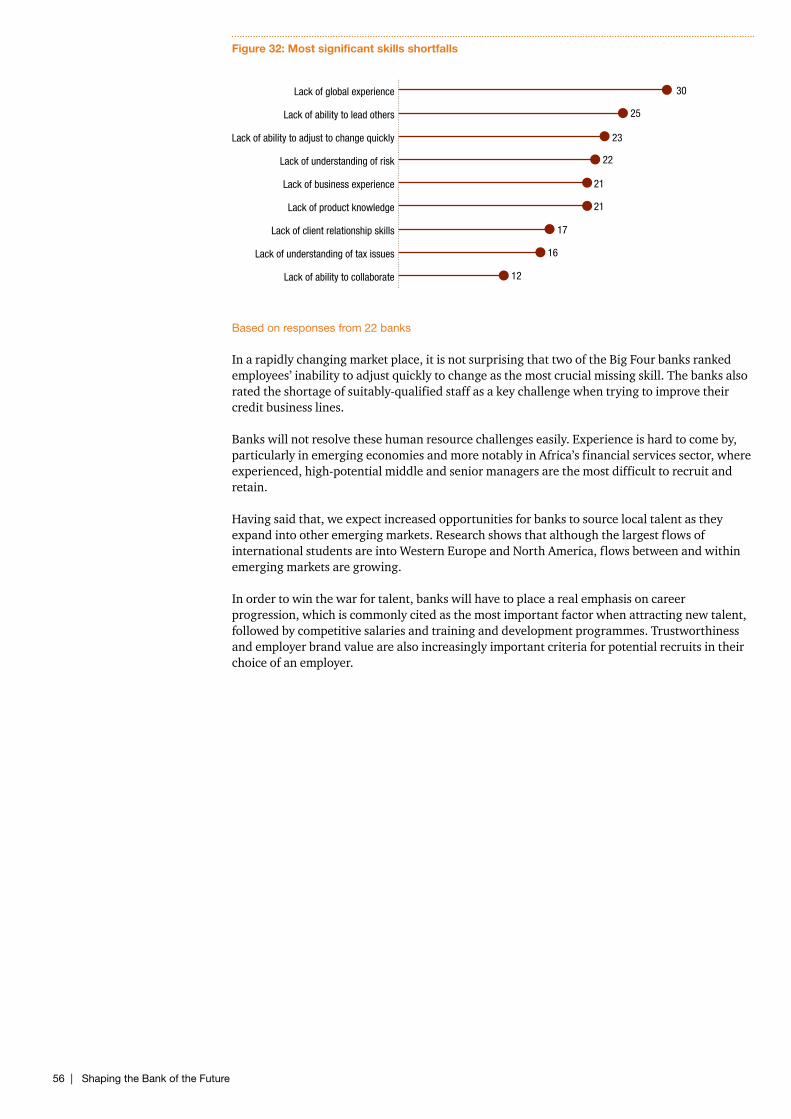
56 | Shaping the Bank of the Future
Figure 32: Most significant skills shortfalls
Based on responses from 22 banks
In a rapidly changing market place, it is not surprising that two of the Big Four banks ranked employees’ inability to adjust quickly to change as the most crucial missing skill. The banks also rated the shortage of suitably-qualified staff as a key challenge when trying to improve their credit business lines.
Banks will not resolve these human resource challenges easily. Experience is hard to come by, particularly in emerging economies and more notably in Africa’s financial services sector, where experienced, high-potential middle and senior managers are the most difficult to recruit and retain.
Having said that, we expect increased opportunities for banks to source local talent as they expand into other emerging markets. Research shows that although the largest flows of international students are into Western Europe and North America, flows between and within emerging markets are growing.
In order to win the war for talent, banks will have to place a real emphasis on career progression, which is commonly cited as the most important factor when attracting new talent, followed by competitive salaries and training and development programmes. Trustworthiness and employer brand value are also increasingly important criteria for potential recruits in their choice of an employer.
Lack of ability to collaborate
Lack of understanding of tax issues
Lack of client relationship skills
Lack of product knowledge
Lack of business experience
Lack of understanding of risk
Lack of ability to adjust to change quickly
Lack of ability to lead others
Lack of global experience 30
25
23
22
21
21
17
16
12

PwC | 57

58 | Shaping the Bank of the Future
4 Stakeholder expectations
PwC | 59
Although banks are positive about forecast ROE levels, they do not expect these returns to recover to pre-crisis levels.
In a new world of reduced leverage and increased capital, the risk/return proposition of investing in bank shares has changed.
1.4Regulatory
change
1.3New
entrants
1.2Market
segments
1.1Economic
environment
2.1Rise of
emerging markets
2.2Demographic
change
2.3Urbanisation
4.1Investor
expectations
4.2Government
interest
3.4Talent
3.3Customer centricity
3.2Technology
3.1Operational
drivers
2 Macro trendsSustainable ROE 4 Stakeholder expectations
1 External developments3 Internal responses
Key observations
The trends explored in the preceding sections will undoubtedly have a profound impact on the local and global banking landscape. In the earlier section dealing with regulatory reform, we noted that many international banks are aggressively adjusting their business models with the aim of restoring ROE to as near pre-crisis levels as possible.
They are doing this by following a new mindset of RWA optimisation and other initiatives. Encouragingly, South African bank executives told us they do not believe their efforts to optimise RWA consumption have been overly aggressive.
In the section on internal responses, we explored various strategies being considered to achieve ROE targets over the short and medium term. Although these initiatives are laudable, with higher required capital levels, gearing largely reduced and underlying economic growth substantially subdued, it is unlikely that the industry can replicate previous levels of nominal ROE performance.
4.1 Investor expectations

60 | Shaping the Bank of the Future
Investors are, however, not being asked to accept worse performance. They are merely being asked to accept a risk/return proposition that is different to the one they became accustomed to during the boom years.
There are very plausible conditions in which a bank’s economic profit (the excess profit after all economic costs, including capital costs, have been met) would be unaffected, or even enhanced, by the equity injection required by the regulatory changes.
These stem largely from the expectation that cost of equity (COE) will fall because changes to bank capital requirements and funding structures will reduce balance sheet gearing and, therefore, risk.
The key message here is that although ROE comes down with the addition of new equity, so too does COE, thereby leaving the economic spread unaffected. Consequently, ROE targets and expectations should reduce in a similar manner.
In some instances, investor expectations are informed by ROE targets communicated by the banks. Some banks have even gone as far as presenting strategies for achieving pre-Basel III ROE over the medium to long term through, for example, RWA optimisation initiatives.
A positive outcome of this approach is that banks have identified and addressed ‘low-hanging fruit’, such as cleaning up data and models, restructuring capital to ensure favourable tiering treatment and disposing of genuine non-core assets.
In our experience, these measures will not fully offset the impact that the new capital requirements and funding structures will have on bank ROEs. Consequently, ROE targets and expectations will have to change and bank executives should lead this debate.
PwC | 61
Key observations
Increased government interest is regarded as the third-most important development in the industry.
The move to a twin peaks regulatory model is supported by the majority of respondents, despite some concerns about potential regulatory duplication.
Most banks support deposit guarantee insurance up to
R100 000.
1.4Regulatory
change
1.3New
entrants
1.2Market
segments
1.1Economic
environment
2.1Rise of
emerging markets
2.2Demographic
change
2.3Urbanisation
4.1Investor
expectations
4.2Government
interest
3.4Talent
3.3Customer centricity
3.2Technology
3.1Operational
drivers
2 Macro trendsSustainable ROE 4 Stakeholder expectations
1 External developments3 Internal responses
Government focus on the contribution of banksThe relative under-performance of the South African economy compared to many other emerging markets has prompted the Government to explore how the banking industry can play a more active role in stimulating economic growth. Banks are being encouraged to facilitate major infrastructure projects, such as funding rapid urbanisation and renewable energy projects, as natural resources continue to come under pressure. Participants viewed the growing level of government attention towards the role of the banking sector in the economy as the third-most important development impacting the banking industry.
4.2 Government interest
62 | Shaping the Bank of the Future
Government has frequently and clearly indicated that South African banks must ensure that the wider population has access to fair and cost-effective financial services, and facilitate their needs at an affordable cost. For a long time its message has been to bank the unbanked. However, as a pressing issue for respondents, this ranked quite lowly at 18 out of 32 (15 for domestic banks). The imminent launch of Postbank could give this initiative a meaningful boost.
PostbankAs part of its financial inclusion strategy, the South African Government plans to relaunch Postbank as a full-scale retail bank in late 2013. For this reason, we included it in our survey for the first time. As the banking arm of the Post Office, it is being corporatised and will be regulated by the Banks Act, Postbank Act and other banking regulations, rather than by the Post Office Act. It is expected to become the fifth-largest bank in South Africa and is said to have 6.6 million accounts and more than half the market share in Mzansi low-cost banking products. Its entrance is expected to increase competition in the retail market, especially in rural areas.
Twin peaks The main objective of the twin peaks model is the development of institutions to deal with system-wide macro-prudential risks. This will be achieved by separating the oversight of market conduct regulation (regulating how firms conduct their business, design and price their products and treat their customers) from prudential regulations (regulating financial institutions’ solvency and liquidity).
The Financial Services Board (FSB) will be transformed to function as the new market conduct regulator, which will be responsible for regulating and supervising the financial sector’s market conduct, including banks, insurers, financial advisers, financial intermediaries, investment institutions and the broader financial markets.
As prudential regulator, The South African Reserve Bank will be responsible for:
• Maintaining overall financial stability (with the assistance of the Financial Services Board); and
• Overseeing systemic risks that may arise from key financial market infrastructure.
The South African Reserve Bank is well placed to perform this role as it has the ability to assess the safety and soundness of key role players in the payments system. It can also provide emergency liquidity and respond to relevant macroeconomic developments.
Although the responsibilities of the South African Reserve Bank and the Financial Services Board have been outlined at a high level, many of the finer details, including the final structure of the South African twin peaks framework are not yet clear. Figure 33 depicts the roles and accountabilities in the UK’s twin peaks framework, which serves as a useful example of such a framework which has recently been implemented.
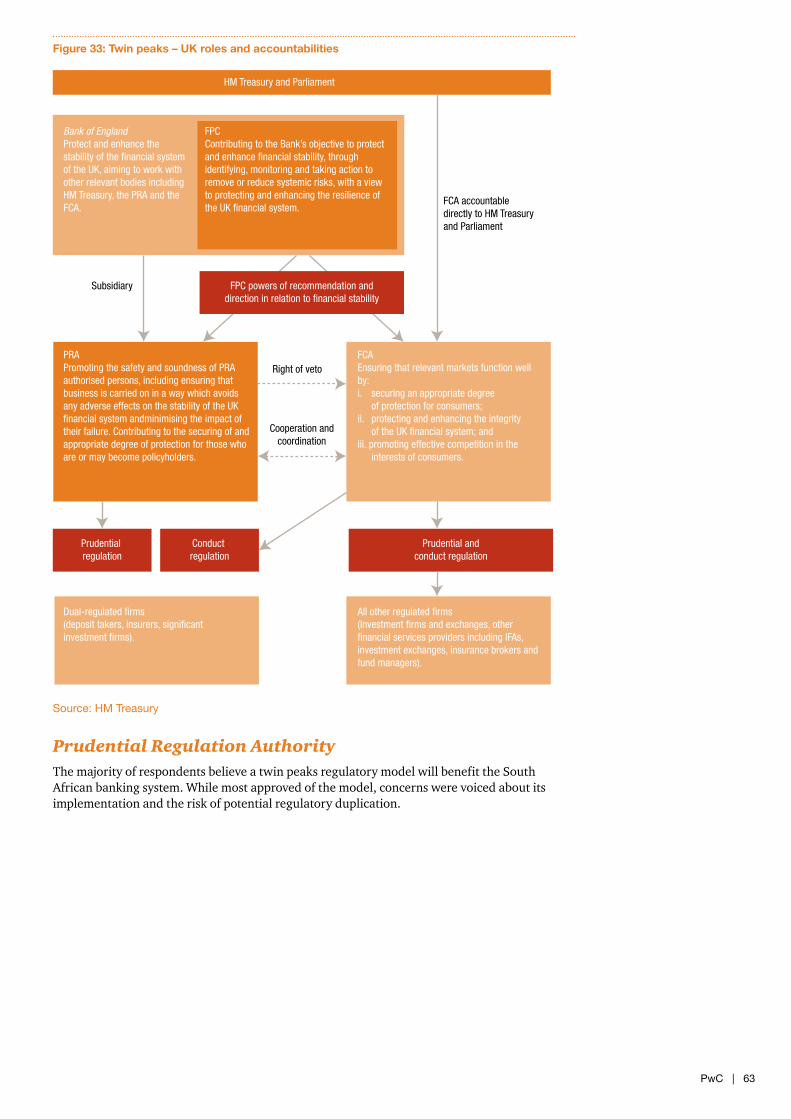
PwC | 63
Bank of EnglandProtect and enhance the stability of the financial system of the UK, aiming to work with other relevant bodies including HM Treasury, the PRA and the FCA.
FPCContributing to the Bank’s objective to protect and enhance financial stability, through identifying, monitoring and taking action to remove or reduce systemic risks, with a view to protecting and enhancing the resilience of the UK financial system.
PRAPromoting the safety and soundness of PRA authorised persons, including ensuring that business is carried on in a way which avoids any adverse effects on the stability of the UK financial system andminimising the impact of their failure. Contributing to the securing of and appropriate degree of protection for those who are or may become policyholders.
FCAEnsuring that relevant markets function well by:i. securing an appropriate degree of protection for consumers;ii. protecting and enhancing the integrity of the UK financial system; andiii. promoting effective competition in the interests of consumers.
Dual-regulated firms(deposit takers, insurers, significant investment firms).
All other regulated firms(Investment firms and exchanges, other financial services providers including IFAs, investment exchanges, insurance brokers and fund managers).
Right of veto
Cooperation andcoordination
Prudential regulation
Conduct regulation
Prudential andconduct regulation
Subsidiary
FCA accountabledirectly to HM Treasuryand Parliament
HM Treasury and Parliament
FPC powers of recommendation anddirection in relation to financial stability
Figure 33: Twin peaks – UK roles and accountabilities
Source: HM Treasury
Prudential Regulation AuthorityThe majority of respondents believe a twin peaks regulatory model will benefit the South African banking system. While most approved of the model, concerns were voiced about its implementation and the risk of potential regulatory duplication.
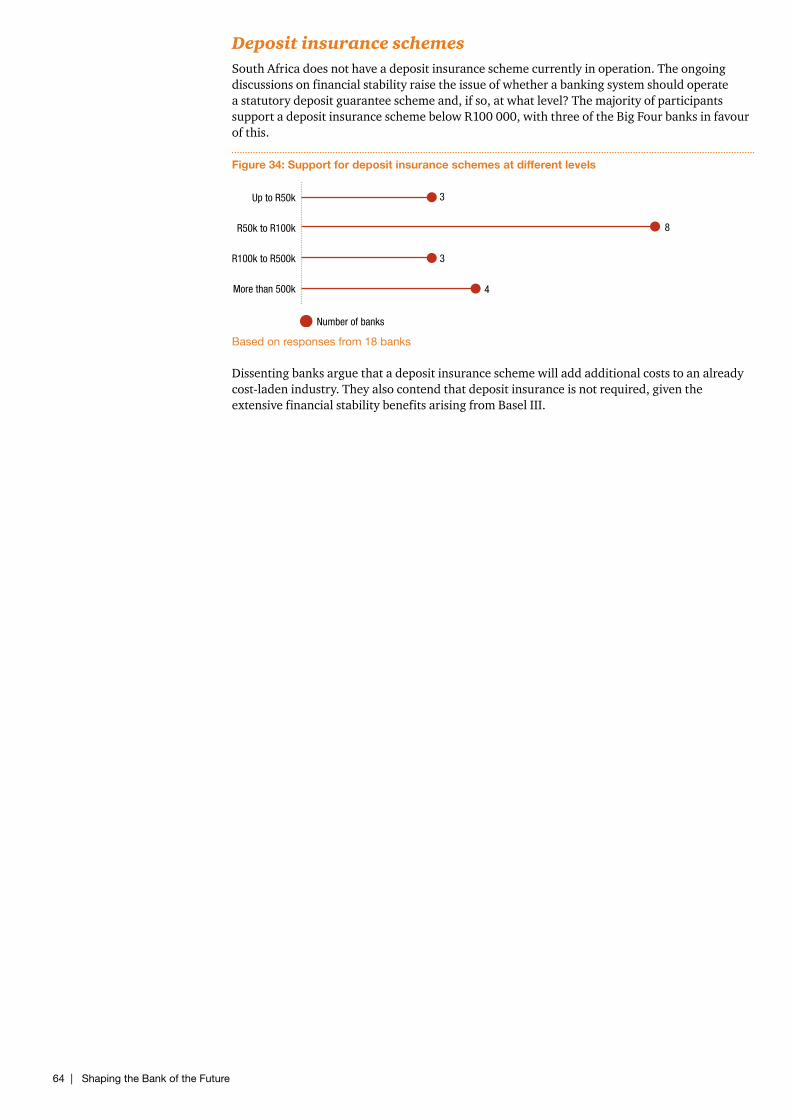
64 | Shaping the Bank of the Future
Deposit insurance schemesSouth Africa does not have a deposit insurance scheme currently in operation. The ongoing discussions on financial stability raise the issue of whether a banking system should operate a statutory deposit guarantee scheme and, if so, at what level? The majority of participants supportadepositinsuranceschemebelowR100 000,withthreeoftheBigFourbanksinfavourof this.
Figure 34: Support for deposit insurance schemes at different levels
Based on responses from 18 banks
Dissenting banks argue that a deposit insurance scheme will add additional costs to an already cost-laden industry. They also contend that deposit insurance is not required, given the extensive financial stability benefits arising from Basel III.
More than 500k
R100k to R500k
R50k to R100k
Up to R50k 3
8
3
4
Number of banks

PwC | 65

66 | Shaping the Bank of the Future
5 Level of preparedness
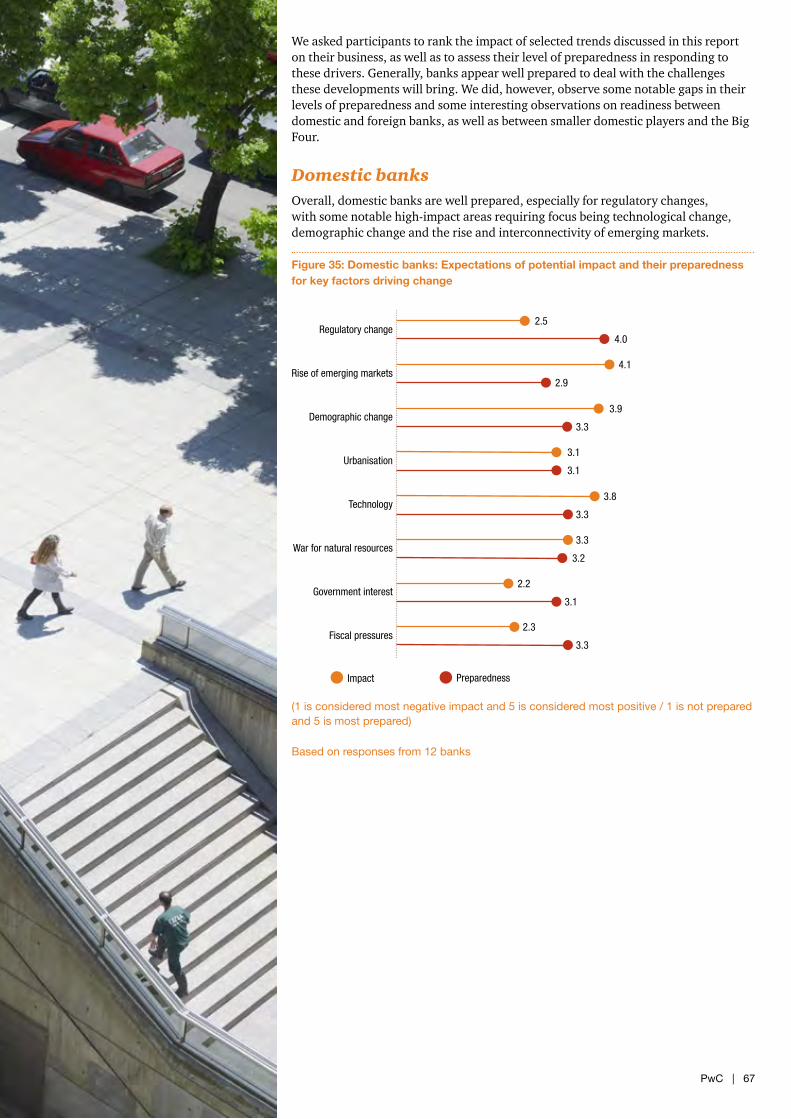
PwC | 67
We asked participants to rank the impact of selected trends discussed in this report on their business, as well as to assess their level of preparedness in responding to these drivers. Generally, banks appear well prepared to deal with the challenges these developments will bring. We did, however, observe some notable gaps in their levels of preparedness and some interesting observations on readiness between domestic and foreign banks, as well as between smaller domestic players and the Big Four.
Domestic banksOverall, domestic banks are well prepared, especially for regulatory changes, with some notable high-impact areas requiring focus being technological change, demographic change and the rise and interconnectivity of emerging markets.
Figure 35: Domestic banks: Expectations of potential impact and their preparedness for key factors driving change
(1 is considered most negative impact and 5 is considered most positive / 1 is not prepared and 5 is most prepared)
Based on responses from 12 banks
Fiscal pressures
Government interest
War for natural resources
Technology
Urbanisation
Demographic change
Rise of emerging markets
Regulatory change2.5
4.0
4.1
2.9
3.9
3.3
3.1
3.1
3.8
3.3
3.3
3.2
2.2
3.1
2.3
3.3
Impact Preparedness
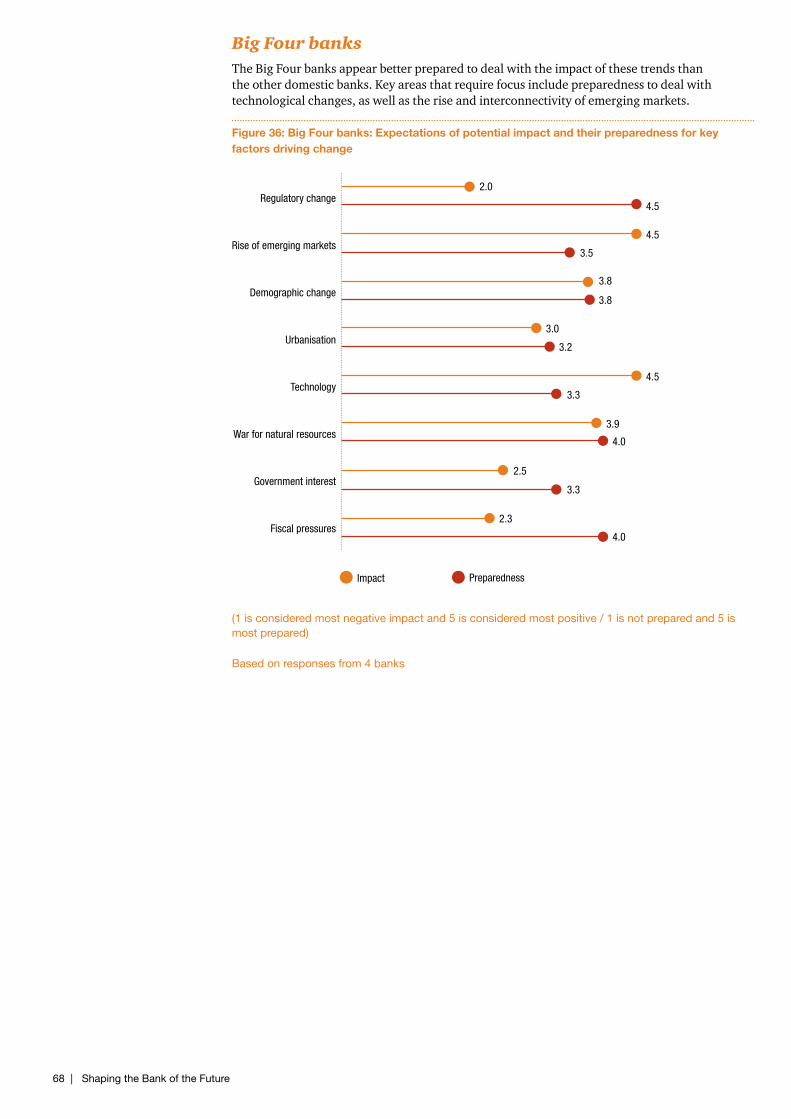
68 | Shaping the Bank of the Future
Big Four banksThe Big Four banks appear better prepared to deal with the impact of these trends than the other domestic banks. Key areas that require focus include preparedness to deal with technological changes, as well as the rise and interconnectivity of emerging markets.
Figure 36: Big Four banks: Expectations of potential impact and their preparedness for key factors driving change
(1 is considered most negative impact and 5 is considered most positive / 1 is not prepared and 5 is most prepared)
Based on responses from 4 banks
Fiscal pressures
Government interest
War for natural resources
Technology
Urbanisation
Demographic change
Rise of emerging markets
Regulatory change
Impact
2.0
4.5
4.5
3.5
3.8
3.8
3.0
3.2
4.5
3.3
3.9
4.0
2.5
3.3
2.3
4.0
Preparedness
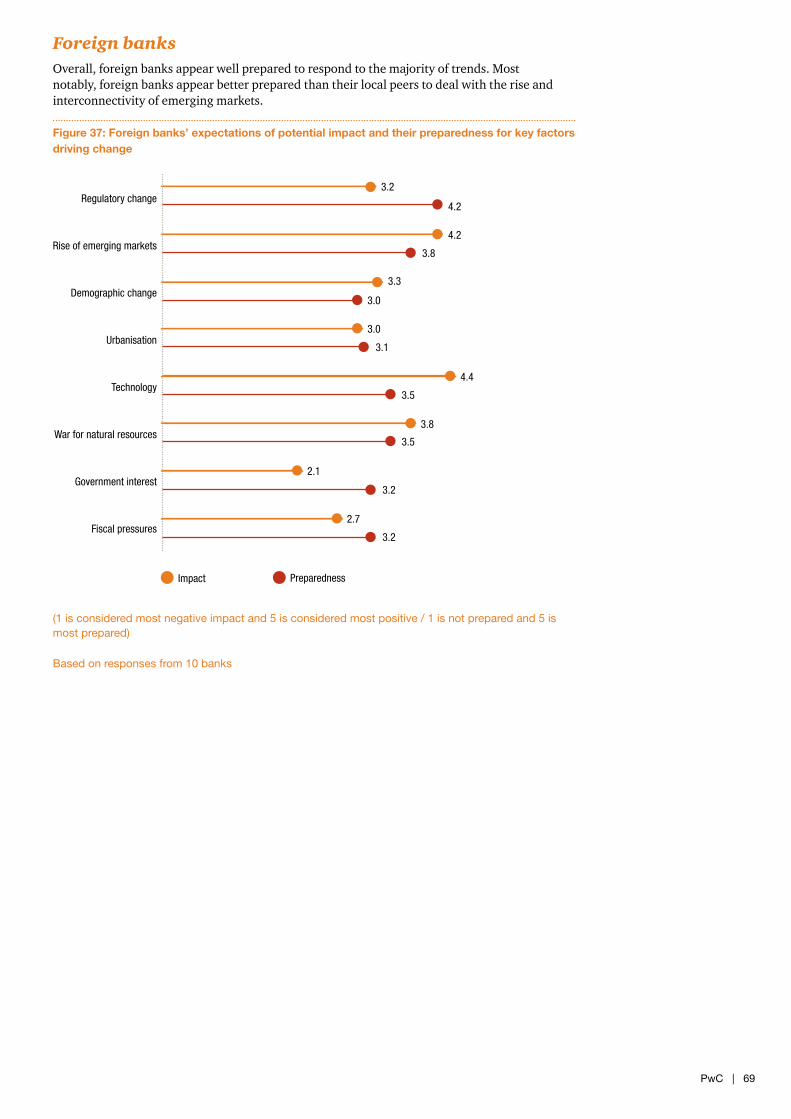
PwC | 69
Foreign banksOverall, foreign banks appear well prepared to respond to the majority of trends. Most notably, foreign banks appear better prepared than their local peers to deal with the rise and interconnectivity of emerging markets.
Figure 37: Foreign banks’ expectations of potential impact and their preparedness for key factors driving change
(1 is considered most negative impact and 5 is considered most positive / 1 is not prepared and 5 is most prepared)
Based on responses from 10 banks
Fiscal pressures
Government interest
War for natural resources
Technology
Urbanisation
Demographic change
Rise of emerging markets
Regulatory change
Impact
3.2
4.2
4.2
3.8
3.3
3.0
3.0
3.1
4.4
3.5
3.8
3.5
2.1
3.2
2.7
3.2
Preparedness
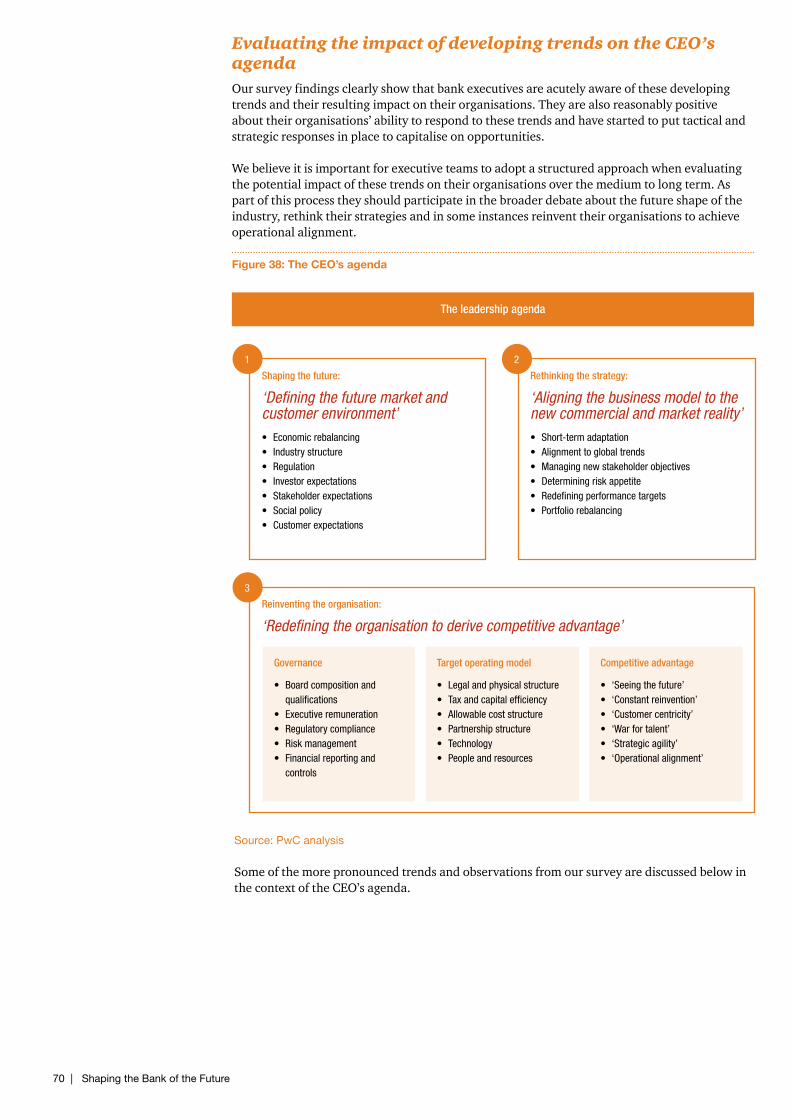
70 | Shaping the Bank of the Future
The leadership agenda
Shaping the future:
‘Defining the future market and customer environment’• Economicrebalancing• Industrystructure• Regulation• Investorexpectations• Stakeholderexpectations• Socialpolicy• Customerexpectations
Rethinking the strategy:
‘Aligning the business model to the new commercial and market reality’• Short-termadaptation• Alignmenttoglobaltrends• Managingnewstakeholderobjectives• Determiningriskappetite• Redefiningperformancetargets• Portfoliorebalancing
Reinventing the organisation:
‘Redefining the organisation to derive competitive advantage’
Governance
• Boardcompositionandqualifications
• Executiveremuneration• Regulatorycompliance• Riskmanagement• Financialreportingand
controls
Target operating model
• Legalandphysicalstructure• Taxandcapitalefficiency• Allowablecoststructure• Partnershipstructure• Technology• Peopleandresources
Competitive advantage
• ‘Seeingthefuture’• ‘Constantreinvention’• ‘Customercentricity’• ‘Warfortalent’• ‘Strategicagility’• ‘Operationalalignment’
1
3
2
Evaluating the impact of developing trends on the CEO’s agendaOur survey findings clearly show that bank executives are acutely aware of these developing trends and their resulting impact on their organisations. They are also reasonably positive about their organisations’ ability to respond to these trends and have started to put tactical and strategic responses in place to capitalise on opportunities.
We believe it is important for executive teams to adopt a structured approach when evaluating the potential impact of these trends on their organisations over the medium to long term. As part of this process they should participate in the broader debate about the future shape of the industry, rethink their strategies and in some instances reinvent their organisations to achieve operational alignment.
Figure 38: The CEO’s agenda
Source: PwC analysis
Some of the more pronounced trends and observations from our survey are discussed below in the context of the CEO’s agenda.
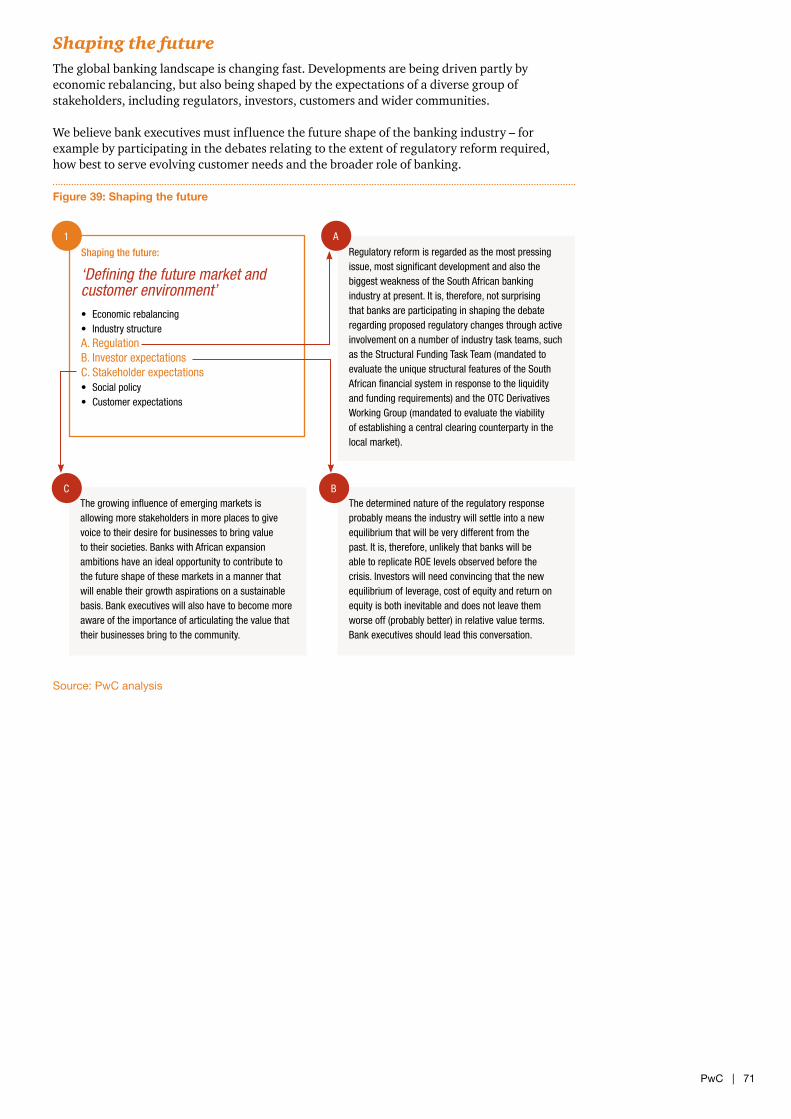
PwC | 71
Shaping the futureThe global banking landscape is changing fast. Developments are being driven partly by economic rebalancing, but also being shaped by the expectations of a diverse group of stakeholders, including regulators, investors, customers and wider communities.
We believe bank executives must influence the future shape of the banking industry – for example by participating in the debates relating to the extent of regulatory reform required, how best to serve evolving customer needs and the broader role of banking.
Figure 39: Shaping the future
Source: PwC analysis
Shaping the future:
‘Defining the future market and customer environment’• Economicrebalancing• IndustrystructureA.RegulationB.InvestorexpectationsC.Stakeholderexpectations• Socialpolicy• Customerexpectations
Regulatoryreformisregardedasthemostpressingissue,mostsignificantdevelopmentandalsothebiggestweaknessoftheSouthAfricanbankingindustryatpresent.Itis,therefore,notsurprisingthatbanksareparticipatinginshapingthedebateregardingproposedregulatorychangesthroughactiveinvolvementonanumberofindustrytaskteams,suchastheStructuralFundingTaskTeam(mandatedtoevaluatetheuniquestructuralfeaturesoftheSouthAfricanfinancialsysteminresponsetotheliquidityandfundingrequirements)andtheOTCDerivativesWorkingGroup(mandatedtoevaluatetheviabilityofestablishingacentralclearingcounterpartyinthelocalmarket).
Thegrowinginfluenceofemergingmarketsisallowingmorestakeholdersinmoreplacestogivevoicetotheirdesireforbusinessestobringvaluetotheirsocieties.BankswithAfricanexpansionambitionshaveanidealopportunitytocontributetothefutureshapeofthesemarketsinamannerthatwillenabletheirgrowthaspirationsonasustainablebasis.Bankexecutiveswillalsohavetobecomemoreawareoftheimportanceofarticulatingthevaluethattheirbusinessesbringtothecommunity.
Thedeterminednatureoftheregulatoryresponseprobablymeanstheindustrywillsettleintoanewequilibriumthatwillbeverydifferentfromthepast.Itis,therefore,unlikelythatbankswillbeabletoreplicateROElevelsobservedbeforethecrisis.Investorswillneedconvincingthatthenewequilibriumofleverage,costofequityandreturnonequityisbothinevitableanddoesnotleavethemworseoff(probablybetter)inrelativevalueterms.Bankexecutivesshouldleadthisconversation.
1
C B
A
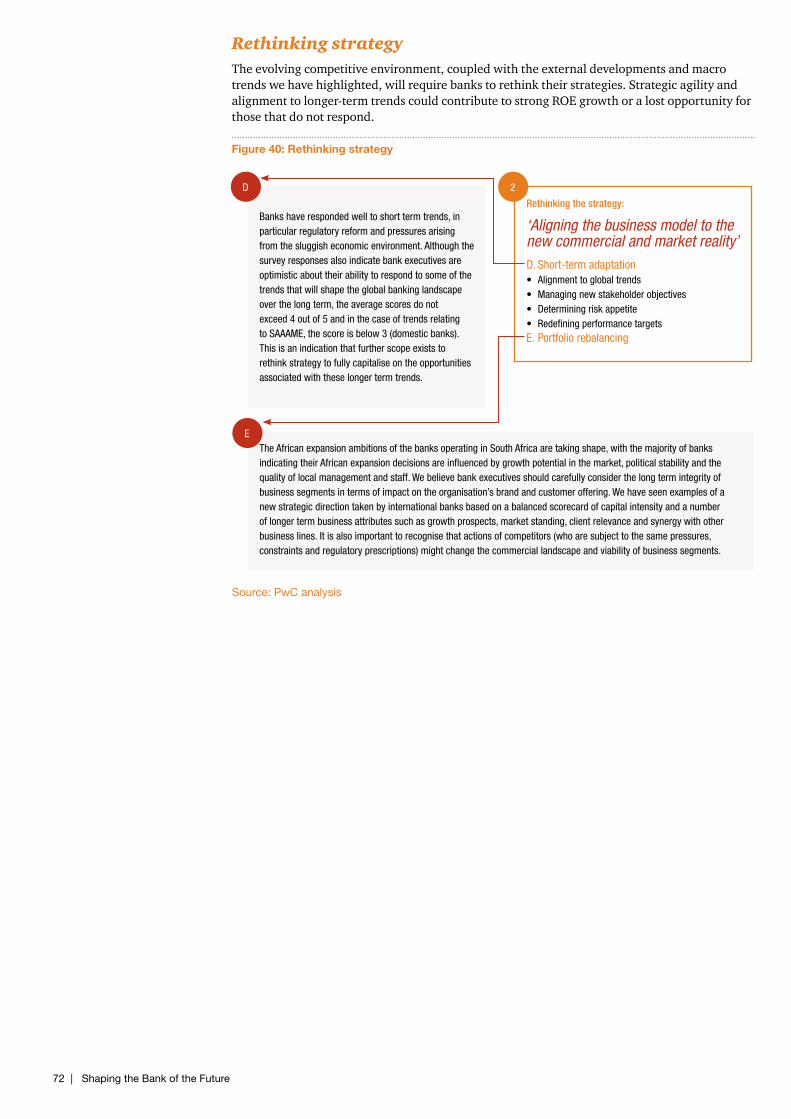
72 | Shaping the Bank of the Future
Source: PwC analysis
Rethinking strategyThe evolving competitive environment, coupled with the external developments and macro trends we have highlighted, will require banks to rethink their strategies. Strategic agility and alignment to longer-term trends could contribute to strong ROE growth or a lost opportunity for those that do not respond.
Figure 40: Rethinking strategy
Rethinking the strategy:
‘Aligning the business model to the new commercial and market reality’D.Short-termadaptation• Alignmenttoglobaltrends• Managingnewstakeholderobjectives• Determiningriskappetite• RedefiningperformancetargetsE.Portfoliorebalancing
2
Bankshaverespondedwelltoshorttermtrends,inparticularregulatoryreformandpressuresarisingfromthesluggisheconomicenvironment.Althoughthesurveyresponsesalsoindicatebankexecutivesareoptimisticabouttheirabilitytorespondtosomeofthetrendsthatwillshapetheglobalbankinglandscapeoverthelongterm,theaveragescoresdonotexceed4outof5andinthecaseoftrendsrelatingtoSAAAME,thescoreisbelow3(domesticbanks).Thisisanindicationthatfurtherscopeexiststorethinkstrategytofullycapitaliseontheopportunitiesassociatedwiththeselongertermtrends.
TheAfricanexpansionambitionsofthebanksoperatinginSouthAfricaaretakingshape,withthemajorityofbanksindicatingtheirAfricanexpansiondecisionsareinfluencedbygrowthpotentialinthemarket,politicalstabilityandthequalityoflocalmanagementandstaff.Webelievebankexecutivesshouldcarefullyconsiderthelongtermintegrityofbusinesssegmentsintermsofimpactontheorganisation’sbrandandcustomeroffering.Wehaveseenexamplesofanewstrategicdirectiontakenbyinternationalbanksbasedonabalancedscorecardofcapitalintensityandanumberoflongertermbusinessattributessuchasgrowthprospects,marketstanding,clientrelevanceandsynergywithotherbusinesslines.Itisalsoimportanttorecognisethatactionsofcompetitors(whoaresubjecttothesamepressures,constraintsandregulatoryprescriptions)mightchangethecommerciallandscapeandviabilityofbusinesssegments.
D
E
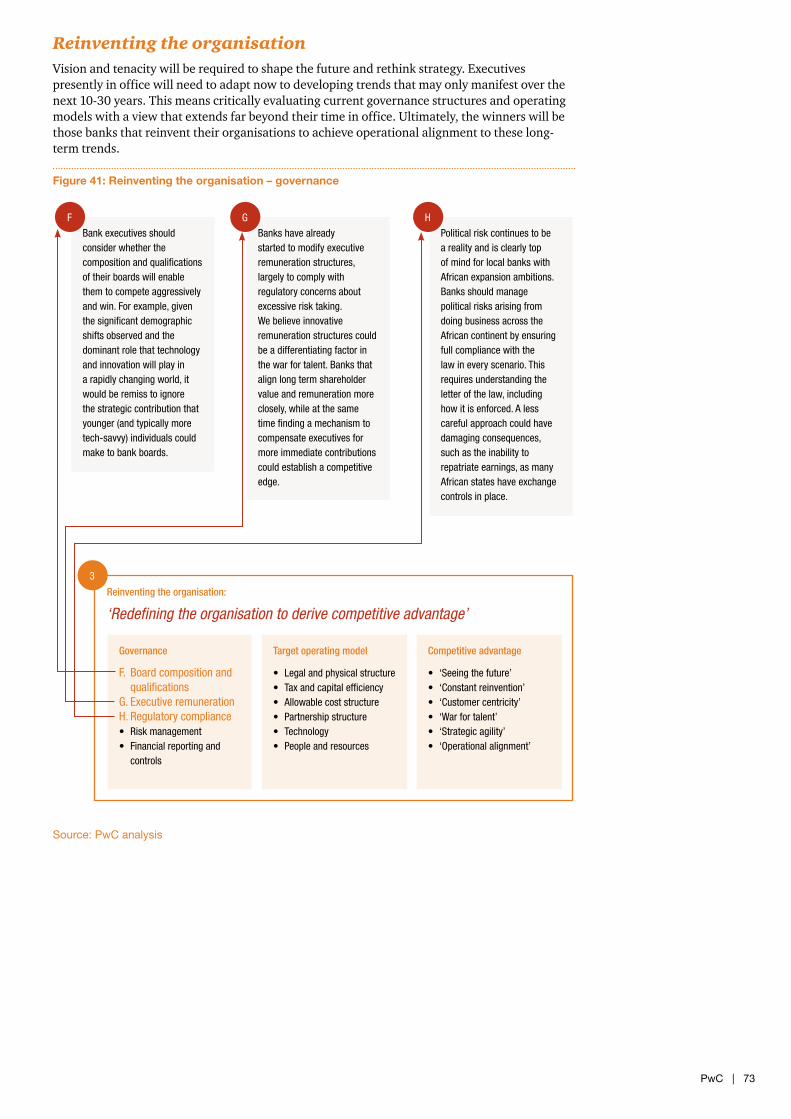
PwC | 73
Reinventing the organisationVision and tenacity will be required to shape the future and rethink strategy. Executives presently in office will need to adapt now to developing trends that may only manifest over the next 10-30 years. This means critically evaluating current governance structures and operating models with a view that extends far beyond their time in office. Ultimately, the winners will be those banks that reinvent their organisations to achieve operational alignment to these long-term trends.
Figure 41: Reinventing the organisation – governance
Source: PwC analysis
Reinventing the organisation:
‘Redefining the organisation to derive competitive advantage’
Governance
F. Boardcompositionandqualifications
G.ExecutiveremunerationH.Regulatorycompliance• Riskmanagement• Financialreportingand
controls
Target operating model
• Legalandphysicalstructure• Taxandcapitalefficiency• Allowablecoststructure• Partnershipstructure• Technology• Peopleandresources
Competitive advantage
• ‘Seeingthefuture’• ‘Constantreinvention’• ‘Customercentricity’• ‘Warfortalent’• ‘Strategicagility’• ‘Operationalalignment’
3
Bankexecutivesshouldconsiderwhetherthecompositionandqualificationsoftheirboardswillenablethemtocompeteaggressivelyandwin.Forexample,giventhesignificantdemographicshiftsobservedandthedominantrolethattechnologyandinnovationwillplayinarapidlychangingworld,itwouldberemisstoignorethestrategiccontributionthatyounger(andtypicallymoretech-savvy)individualscouldmaketobankboards.
Bankshavealreadystartedtomodifyexecutiveremunerationstructures,largelytocomplywithregulatoryconcernsaboutexcessiverisktaking.Webelieveinnovativeremunerationstructurescouldbeadifferentiatingfactorinthewarfortalent.Banksthatalignlongtermshareholdervalueandremunerationmoreclosely,whileatthesametimefindingamechanismtocompensateexecutivesformoreimmediatecontributionscouldestablishacompetitiveedge.
PoliticalriskcontinuestobearealityandisclearlytopofmindforlocalbankswithAfricanexpansionambitions.BanksshouldmanagepoliticalrisksarisingfromdoingbusinessacrosstheAfricancontinentbyensuringfullcompliancewiththelawineveryscenario.Thisrequiresunderstandingtheletterofthelaw,includinghowitisenforced.Alesscarefulapproachcouldhavedamagingconsequences,suchastheinabilitytorepatriateearnings,asmanyAfricanstateshaveexchangecontrolsinplace.
F G H
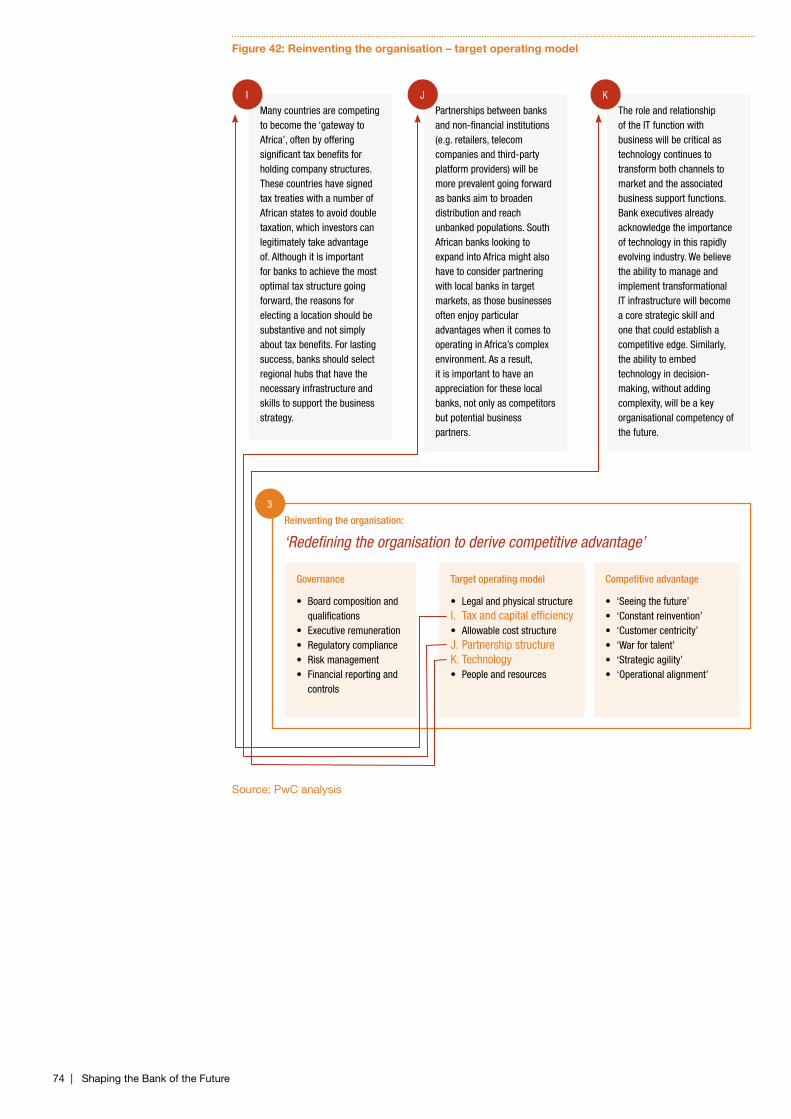
74 | Shaping the Bank of the Future
Reinventing the organisation:
‘Redefining the organisation to derive competitive advantage’
Governance
• Boardcompositionandqualifications
• Executiveremuneration• Regulatorycompliance• Riskmanagement• Financialreportingand
controls
Target operating model
• LegalandphysicalstructureI. Taxandcapitalefficiency• AllowablecoststructureJ.PartnershipstructureK.Technology• Peopleandresources
Competitive advantage
• ‘Seeingthefuture’• ‘Constantreinvention’• ‘Customercentricity’• ‘Warfortalent’• ‘Strategicagility’• ‘Operationalalignment’
3
Manycountriesarecompetingtobecomethe‘gatewaytoAfrica’,oftenbyofferingsignificanttaxbenefitsforholdingcompanystructures.ThesecountrieshavesignedtaxtreatieswithanumberofAfricanstatestoavoiddoubletaxation,whichinvestorscanlegitimatelytakeadvantageof.Althoughitisimportantforbankstoachievethemostoptimaltaxstructuregoingforward,thereasonsforelectingalocationshouldbesubstantiveandnotsimplyabouttaxbenefits.Forlastingsuccess,banksshouldselectregionalhubsthathavethenecessaryinfrastructureandskillstosupportthebusinessstrategy.
Partnershipsbetweenbanksandnon-financialinstitutions(e.g.retailers,telecomcompaniesandthird-partyplatformproviders)willbemoreprevalentgoingforwardasbanksaimtobroadendistributionandreachunbankedpopulations.SouthAfricanbankslookingtoexpandintoAfricamightalsohavetoconsiderpartneringwithlocalbanksintargetmarkets,asthosebusinessesoftenenjoyparticularadvantageswhenitcomestooperatinginAfrica’scomplexenvironment.Asaresult,itisimportanttohaveanappreciationfortheselocalbanks,notonlyascompetitorsbutpotentialbusinesspartners.
TheroleandrelationshipoftheITfunctionwithbusinesswillbecriticalastechnologycontinuestotransformbothchannelstomarketandtheassociatedbusinesssupportfunctions.Bankexecutivesalreadyacknowledgetheimportanceoftechnologyinthisrapidlyevolvingindustry.WebelievetheabilitytomanageandimplementtransformationalITinfrastructurewillbecomeacorestrategicskillandonethatcouldestablishacompetitiveedge.Similarly,theabilitytoembedtechnologyindecision-making,withoutaddingcomplexity,willbeakeyorganisationalcompetencyofthefuture.
I J K
Figure 42: Reinventing the organisation – target operating model
Source: PwC analysis
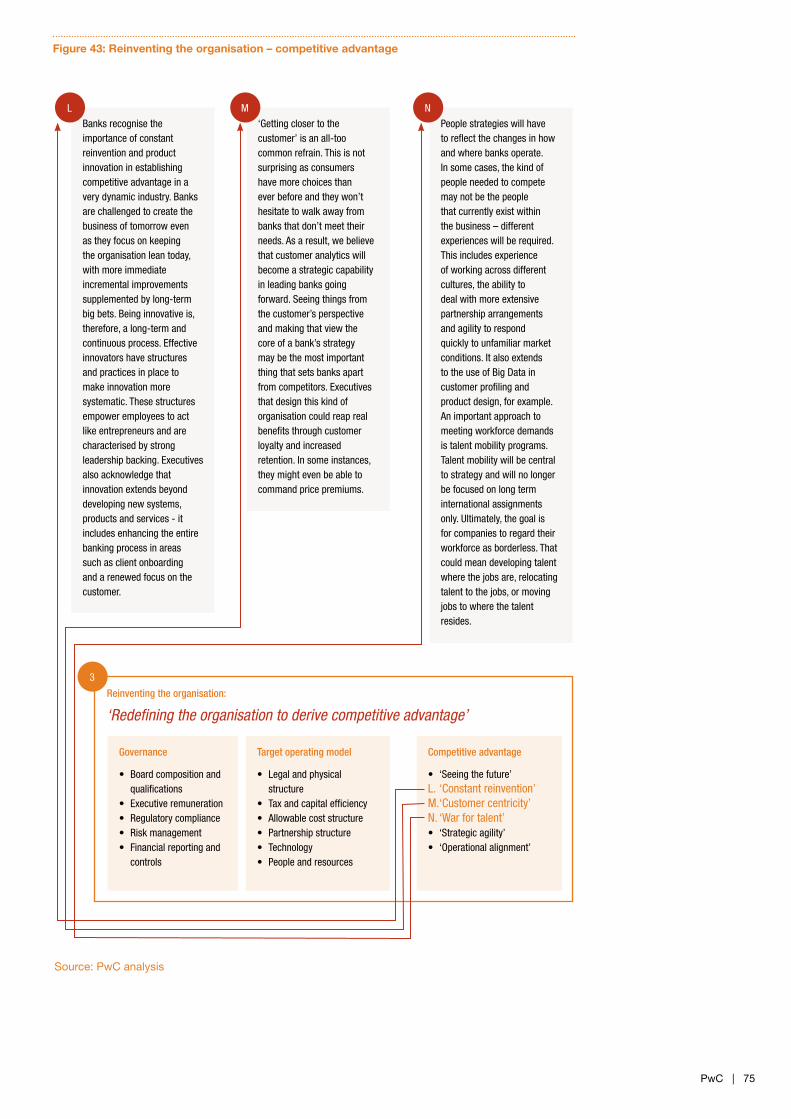
PwC | 75
Figure 43: Reinventing the organisation – competitive advantage
Reinventing the organisation:
‘Redefining the organisation to derive competitive advantage’
Governance
• Boardcompositionandqualifications
• Executiveremuneration• Regulatorycompliance• Riskmanagement• Financialreportingand
controls
Target operating model
• Legalandphysicalstructure
• Taxandcapitalefficiency• Allowablecoststructure• Partnershipstructure• Technology• Peopleandresources
Competitive advantage
• ‘Seeingthefuture’L.‘Constantreinvention’M.‘Customercentricity’N.‘Warfortalent’• ‘Strategicagility’• ‘Operationalalignment’
3
Banksrecognisetheimportanceofconstantreinventionandproductinnovationinestablishingcompetitiveadvantageinaverydynamicindustry.Banksarechallengedtocreatethebusinessoftomorrowevenastheyfocusonkeepingtheorganisationleantoday,withmoreimmediateincrementalimprovementssupplementedbylong-termbigbets.Beinginnovativeis,therefore,along-termandcontinuousprocess.Effectiveinnovatorshavestructuresandpracticesinplacetomakeinnovationmoresystematic.Thesestructuresempoweremployeestoactlikeentrepreneursandarecharacterisedbystrongleadershipbacking.Executivesalsoacknowledgethatinnovationextendsbeyonddevelopingnewsystems,productsandservices-itincludesenhancingtheentirebankingprocessinareassuchasclientonboardingandarenewedfocusonthecustomer.
‘Gettingclosertothecustomer’isanall-toocommonrefrain.Thisisnotsurprisingasconsumershavemorechoicesthaneverbeforeandtheywon’thesitatetowalkawayfrombanksthatdon’tmeettheirneeds.Asaresult,webelievethatcustomeranalyticswillbecomeastrategiccapabilityinleadingbanksgoingforward.Seeingthingsfromthecustomer’sperspectiveandmakingthatviewthecoreofabank’sstrategymaybethemostimportantthingthatsetsbanksapartfromcompetitors.Executivesthatdesignthiskindoforganisationcouldreaprealbenefitsthroughcustomerloyaltyandincreasedretention.Insomeinstances,theymightevenbeabletocommandpricepremiums.
Peoplestrategieswillhavetoreflectthechangesinhowandwherebanksoperate.Insomecases,thekindofpeopleneededtocompetemaynotbethepeoplethatcurrentlyexistwithinthebusiness–differentexperienceswillberequired.Thisincludesexperienceofworkingacrossdifferentcultures,theabilitytodealwithmoreextensivepartnershiparrangementsandagilitytorespondquicklytounfamiliarmarketconditions.ItalsoextendstotheuseofBigDataincustomerprofilingandproductdesign,forexample.Animportantapproachtomeetingworkforcedemandsistalentmobilityprograms.Talentmobilitywillbecentraltostrategyandwillnolongerbefocusedonlongterminternationalassignmentsonly.Ultimately,thegoalisforcompaniestoregardtheirworkforceasborderless.Thatcouldmeandevelopingtalentwherethejobsare,relocatingtalenttothejobs,ormovingjobstowherethetalentresides.
L M N
Source: PwC analysis

76 | Shaping the Bank of the Future
Appendix 1: Peer analysis
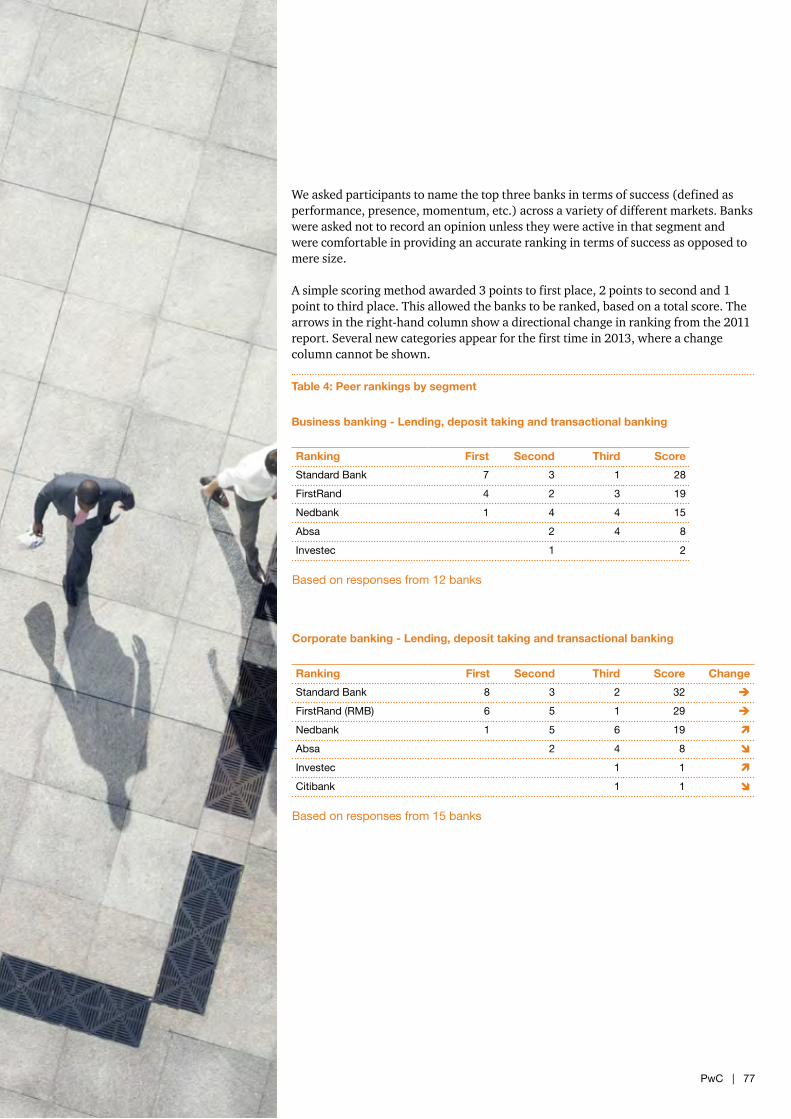
PwC | 77
We asked participants to name the top three banks in terms of success (defined as performance, presence, momentum, etc.) across a variety of different markets. Banks were asked not to record an opinion unless they were active in that segment and were comfortable in providing an accurate ranking in terms of success as opposed to mere size.
A simple scoring method awarded 3 points to first place, 2 points to second and 1 point to third place. This allowed the banks to be ranked, based on a total score. The arrows in the right-hand column show a directional change in ranking from the 2011 report. Several new categories appear for the first time in 2013, where a change column cannot be shown.
Table 4: Peer rankings by segment
Business banking - Lending, deposit taking and transactional banking
Ranking First Second Third Score
Standard Bank 7 3 1 28
FirstRand 4 2 3 19
Nedbank 1 4 4 15
Absa 2 4 8
Investec 1 2
Based on responses from 12 banks
Corporate banking - Lending, deposit taking and transactional banking
Ranking First Second Third Score Change
Standard Bank 8 3 2 32
FirstRand (RMB) 6 5 1 29
Nedbank 1 5 6 19
Absa 2 4 8
Investec 1 1
Citibank 1 1 Based on responses from 15 banks
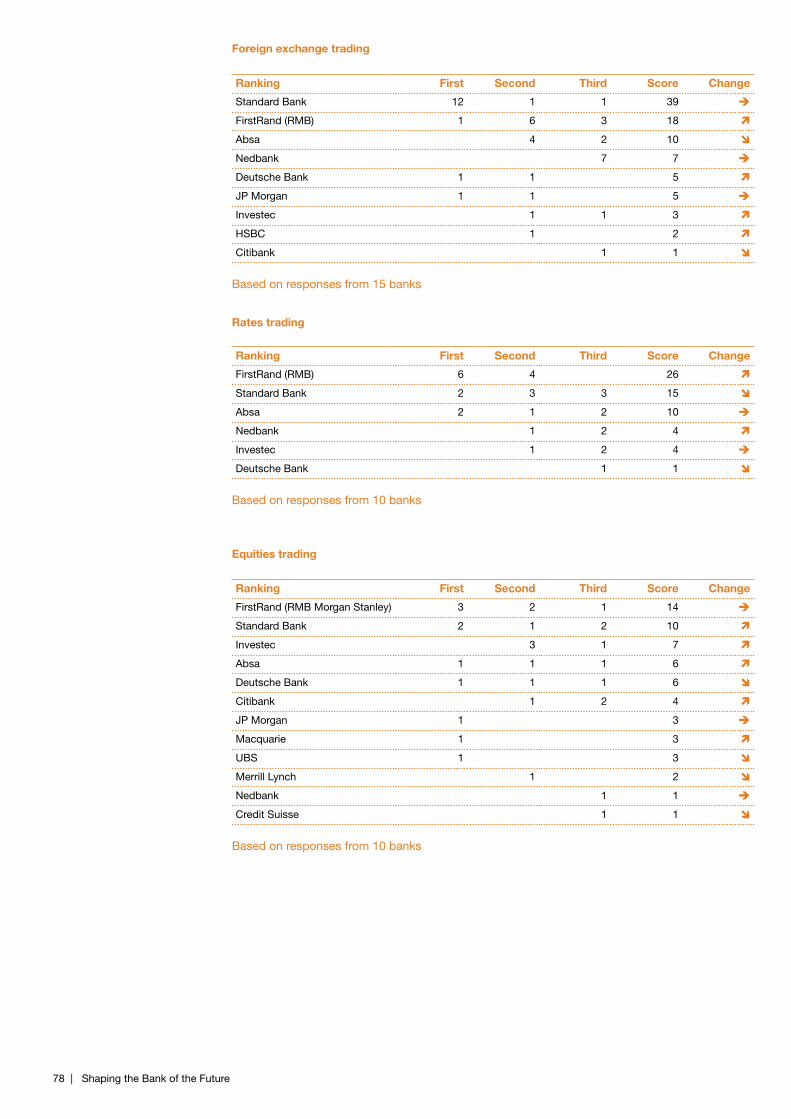
78 | Shaping the Bank of the Future
Foreign exchange trading
Ranking First Second Third Score Change
Standard Bank 12 1 1 39
FirstRand (RMB) 1 6 3 18
Absa 4 2 10
Nedbank 7 7
Deutsche Bank 1 1 5
JP Morgan 1 1 5
Investec 1 1 3
HSBC 1 2
Citibank 1 1
Based on responses from 15 banks
Rates trading
Ranking First Second Third Score Change
FirstRand (RMB) 6 4 26
Standard Bank 2 3 3 15
Absa 2 1 2 10
Nedbank 1 2 4
Investec 1 2 4
Deutsche Bank 1 1
Based on responses from 10 banks
Equities trading
Ranking First Second Third Score Change
FirstRand (RMB Morgan Stanley) 3 2 1 14
Standard Bank 2 1 2 10
Investec 3 1 7
Absa 1 1 1 6
Deutsche Bank 1 1 1 6
Citibank 1 2 4
JP Morgan 1 3
Macquarie 1 3
UBS 1 3
Merrill Lynch 1 2
Nedbank 1 1
Credit Suisse 1 1
Based on responses from 10 banks
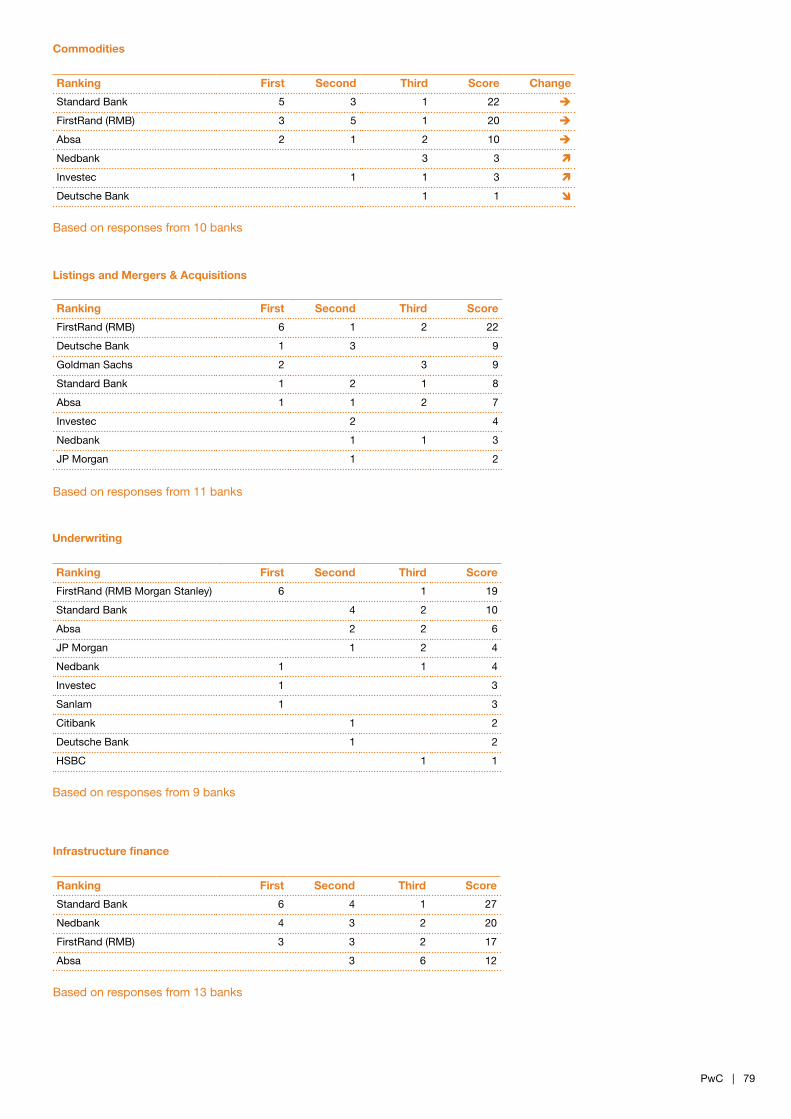
PwC | 79
Commodities
Ranking First Second Third Score Change
Standard Bank 5 3 1 22
FirstRand (RMB) 3 5 1 20
Absa 2 1 2 10
Nedbank 3 3
Investec 1 1 3
Deutsche Bank 1 1
Based on responses from 10 banks
Listings and Mergers & Acquisitions
Ranking First Second Third Score
FirstRand (RMB) 6 1 2 22
Deutsche Bank 1 3 9
Goldman Sachs 2 3 9
Standard Bank 1 2 1 8
Absa 1 1 2 7
Investec 2 4
Nedbank 1 1 3
JP Morgan 1 2
Based on responses from 11 banks
Underwriting
Ranking First Second Third Score
FirstRand (RMB Morgan Stanley) 6 1 19
Standard Bank 4 2 10
Absa 2 2 6
JP Morgan 1 2 4
Nedbank 1 1 4
Investec 1 3
Sanlam 1 3
Citibank 1 2
Deutsche Bank 1 2
HSBC 1 1
Based on responses from 9 banks
Infrastructure finance
Ranking First Second Third Score
Standard Bank 6 4 1 27
Nedbank 4 3 2 20
FirstRand (RMB) 3 3 2 17
Absa 3 6 12
Based on responses from 13 banks
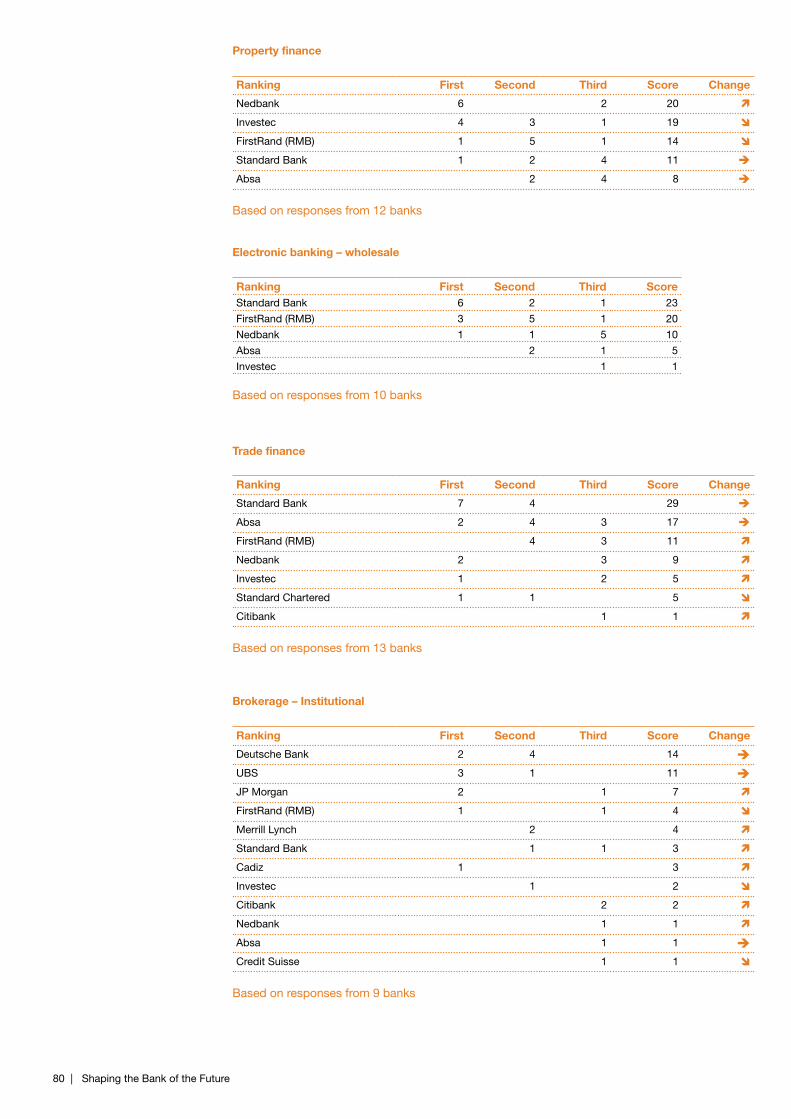
80 | Shaping the Bank of the Future
Property finance
Ranking First Second Third Score Change
Nedbank 6 2 20
Investec 4 3 1 19
FirstRand (RMB) 1 5 1 14
Standard Bank 1 2 4 11
Absa 2 4 8
Based on responses from 12 banks
Electronic banking – wholesale
Ranking First Second Third ScoreStandard Bank 6 2 1 23
FirstRand (RMB) 3 5 1 20
Nedbank 1 1 5 10
Absa 2 1 5
Investec 1 1
Based on responses from 10 banks
Ranking First Second Third Score Change
Standard Bank 7 4 29
Absa 2 4 3 17
FirstRand (RMB) 4 3 11
Nedbank 2 3 9
Investec 1 2 5
Standard Chartered 1 1 5
Citibank 1 1
Based on responses from 13 banks
Trade finance
Brokerage – Institutional
Ranking First Second Third Score Change
Deutsche Bank 2 4 14 UBS 3 1 11 JP Morgan 2 1 7
FirstRand (RMB) 1 1 4
Merrill Lynch 2 4
Standard Bank 1 1 3
Cadiz 1 3
Investec 1 2
Citibank 2 2
Nedbank 1 1
Absa 1 1 Credit Suisse 1 1
Based on responses from 9 banks
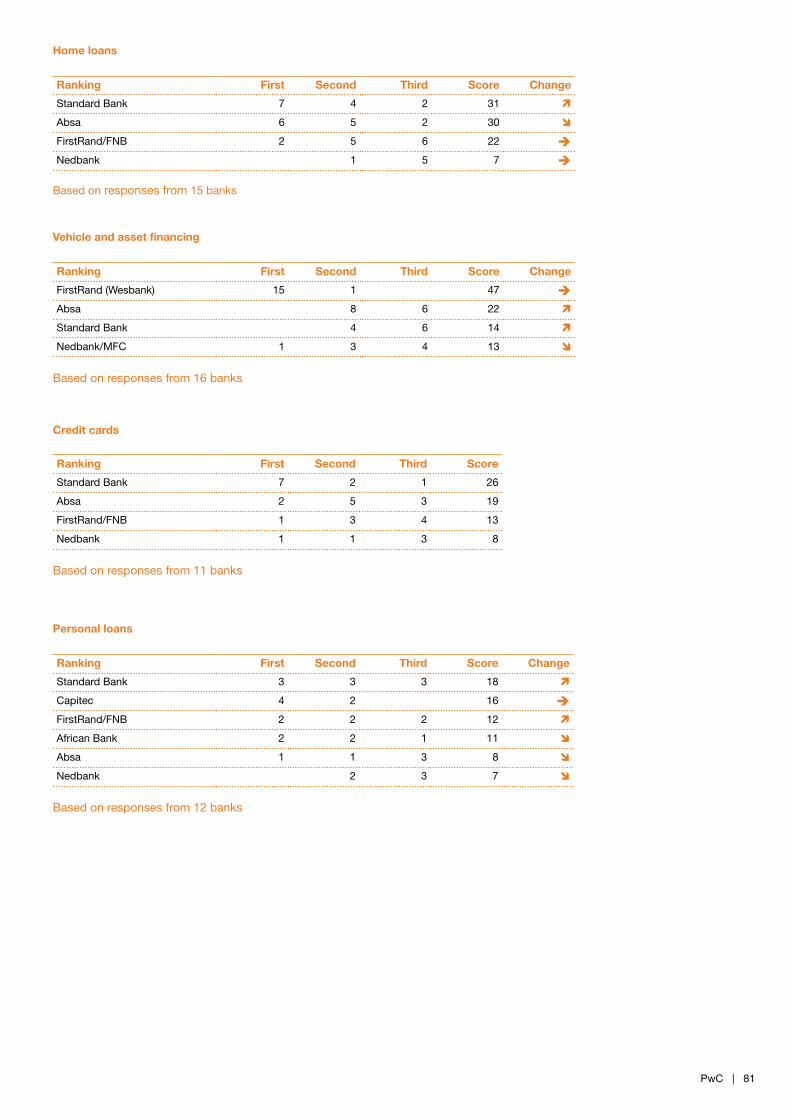
PwC | 81
Credit cards
Ranking First Second Third Score
Standard Bank 7 2 1 26
Absa 2 5 3 19
FirstRand/FNB 1 3 4 13
Nedbank 1 1 3 8
Based on responses from 11 banks
Vehicle and asset financing
Ranking First Second Third Score Change
FirstRand (Wesbank) 15 1 47 Absa 8 6 22
Standard Bank 4 6 14
Nedbank/MFC 1 3 4 13
Based on responses from 16 banks
Ranking First Second Third Score Change
Standard Bank 7 4 2 31
Absa 6 5 2 30
FirstRand/FNB 2 5 6 22 Nedbank 1 5 7
Based on responses from 15 banks
Home loans
Personal loans
Ranking First Second Third Score Change
Standard Bank 3 3 3 18
Capitec 4 2 16 FirstRand/FNB 2 2 2 12
African Bank 2 2 1 11
Absa 1 1 3 8
Nedbank 2 3 7
Based on responses from 12 banks
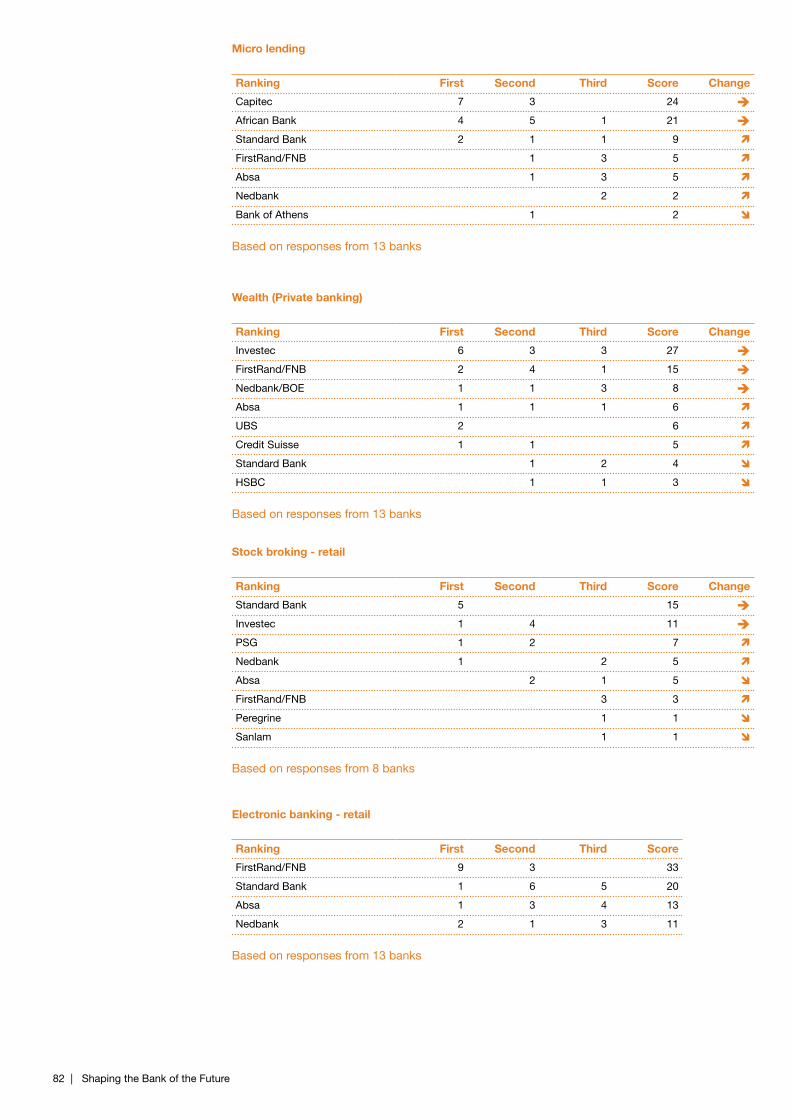
82 | Shaping the Bank of the Future
Micro lending
Ranking First Second Third Score Change
Capitec 7 3 24 African Bank 4 5 1 21 Standard Bank 2 1 1 9
FirstRand/FNB 1 3 5
Absa 1 3 5
Nedbank 2 2
Bank of Athens 1 2
Based on responses from 13 banks
Wealth (Private banking)
Ranking First Second Third Score Change
Investec 6 3 3 27 FirstRand/FNB 2 4 1 15 Nedbank/BOE 1 1 3 8 Absa 1 1 1 6
UBS 2 6
Credit Suisse 1 1 5
Standard Bank 1 2 4
HSBC 1 1 3
Based on responses from 13 banks
Stock broking - retail
Ranking First Second Third Score Change
Standard Bank 5 15 Investec 1 4 11 PSG 1 2 7
Nedbank 1 2 5
Absa 2 1 5
FirstRand/FNB 3 3
Peregrine 1 1
Sanlam 1 1
Based on responses from 8 banks
Electronic banking - retail
Ranking First Second Third Score
FirstRand/FNB 9 3 33
Standard Bank 1 6 5 20
Absa 1 3 4 13
Nedbank 2 1 3 11
Based on responses from 13 banks

PwC | 83

84 | Shaping the Bank of the Future
Appendix 2: Additional survey results
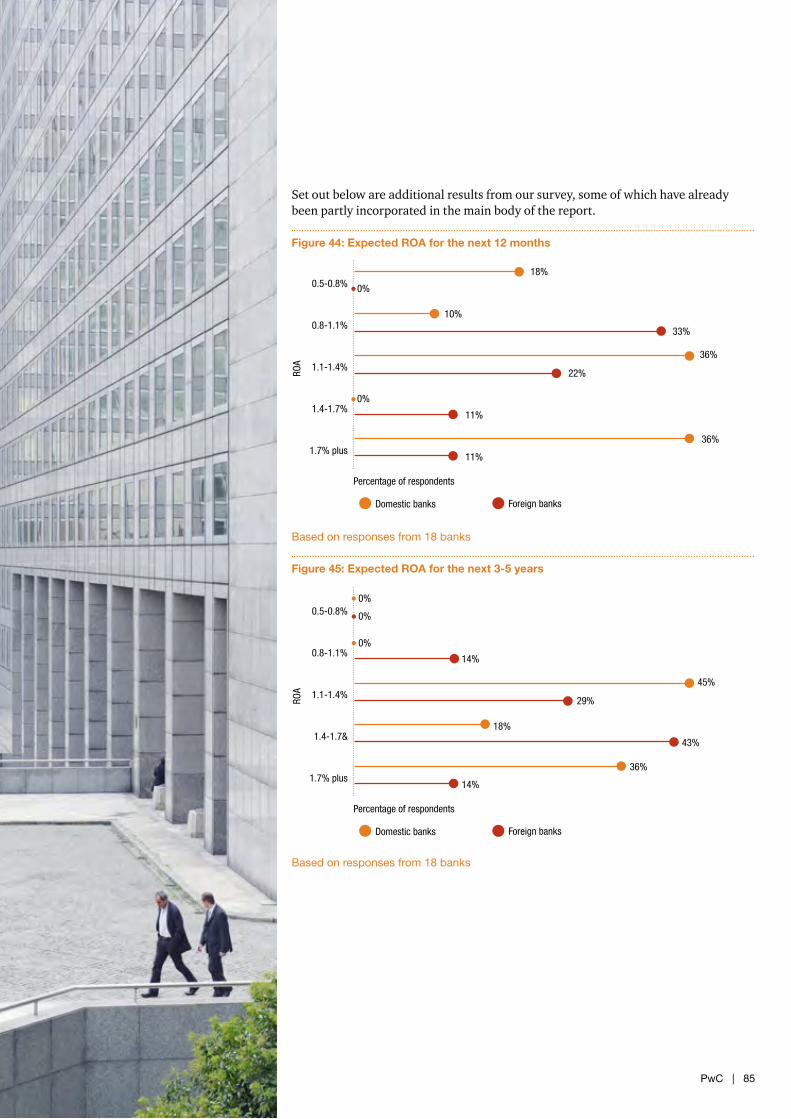
PwC | 85
Set out below are additional results from our survey, some of which have already been partly incorporated in the main body of the report.
Figure 44: Expected ROA for the next 12 months
Based on responses from 18 banks
Figure 45: Expected ROA for the next 3-5 years
Based on responses from 18 banks
1.7% plus
1.4-1.7%
1.1-1.4%
0.8-1.1%
0.5-0.8%
Domestic banks
Percentage of respondents
18%
0%
0%
10%
33%
36%
22%
11%
36%
11%
Foreign banks
ROA
1.7% plus
1.4-1.7&
1.1-1.4%
0.8-1.1%
0.5-0.8%
Domestic banks
0%
0%
0%
18%
14%
45%
29%
43%
36%
14%
Foreign banks
Percentage of respondents
ROA
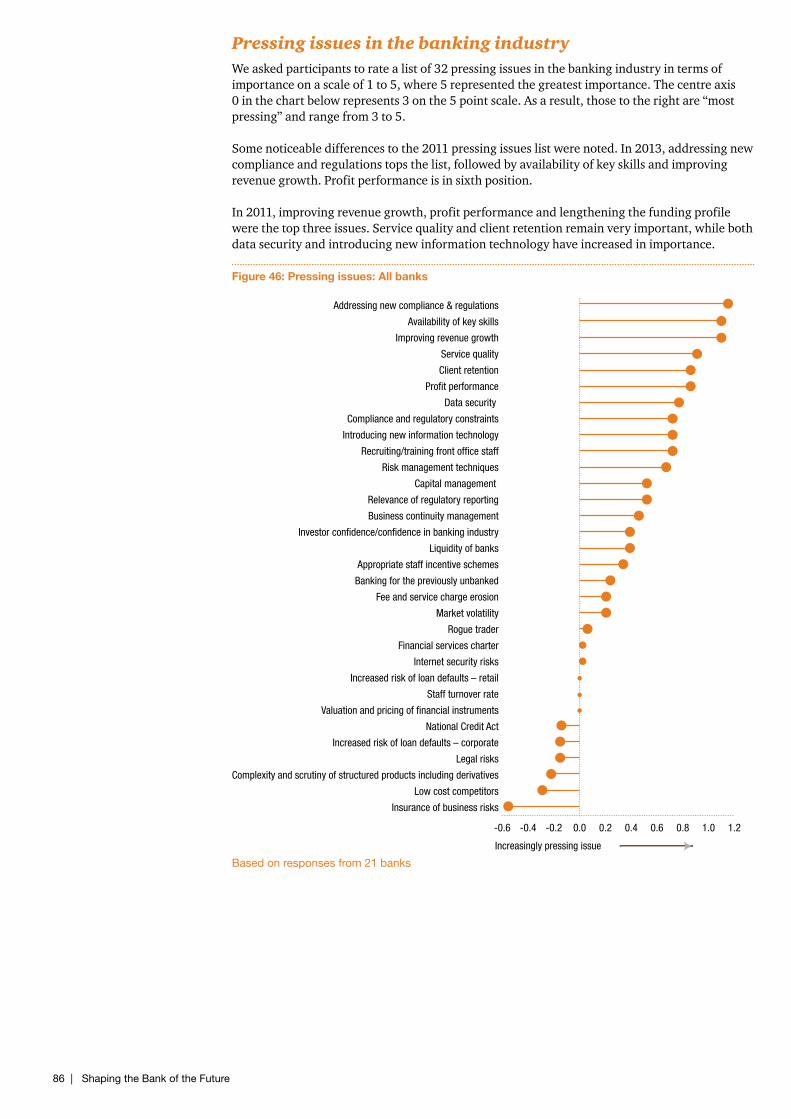
86 | Shaping the Bank of the Future
Pressing issues in the banking industryWe asked participants to rate a list of 32 pressing issues in the banking industry in terms of importance on a scale of 1 to 5, where 5 represented the greatest importance. The centre axis 0 in the chart below represents 3 on the 5 point scale. As a result, those to the right are “most pressing” and range from 3 to 5.
Some noticeable differences to the 2011 pressing issues list were noted. In 2013, addressing new compliance and regulations tops the list, followed by availability of key skills and improving revenue growth. Profit performance is in sixth position.
In 2011, improving revenue growth, profit performance and lengthening the funding profile were the top three issues. Service quality and client retention remain very important, while both data security and introducing new information technology have increased in importance.
Figure 46: Pressing issues: All banks
Based on responses from 21 banks
Increasingly pressing issue
-0.6 -0.4 -0.2 0.0 0.2 0.4 0.6 0.8 1.0 1.2
Insurance of business risks
Low cost competitors
Complexity and scrutiny of structured products including derivatives
Legal risks
Increased risk of loan defaults – corporate
National Credit Act
Valuation and pricing of financial instruments
Staff turnover rate
Increased risk of loan defaults – retail
Internet security risks
Financial services charter
Rogue trader
Market volatility
Fee and service charge erosion
Banking for the previously unbanked
Appropriate staff incentive schemes
Liquidity of banks
Investor confidence/confidence in banking industry
Business continuity management
Relevance of regulatory reporting
Capital management
Risk management techniques
Recruiting/training front office staff
Introducing new information technology
Compliance and regulatory constraints
Data security
Profit performance
Client retention
Service quality
Improving revenue growth
Availability of key skills
Addressing new compliance & regulations
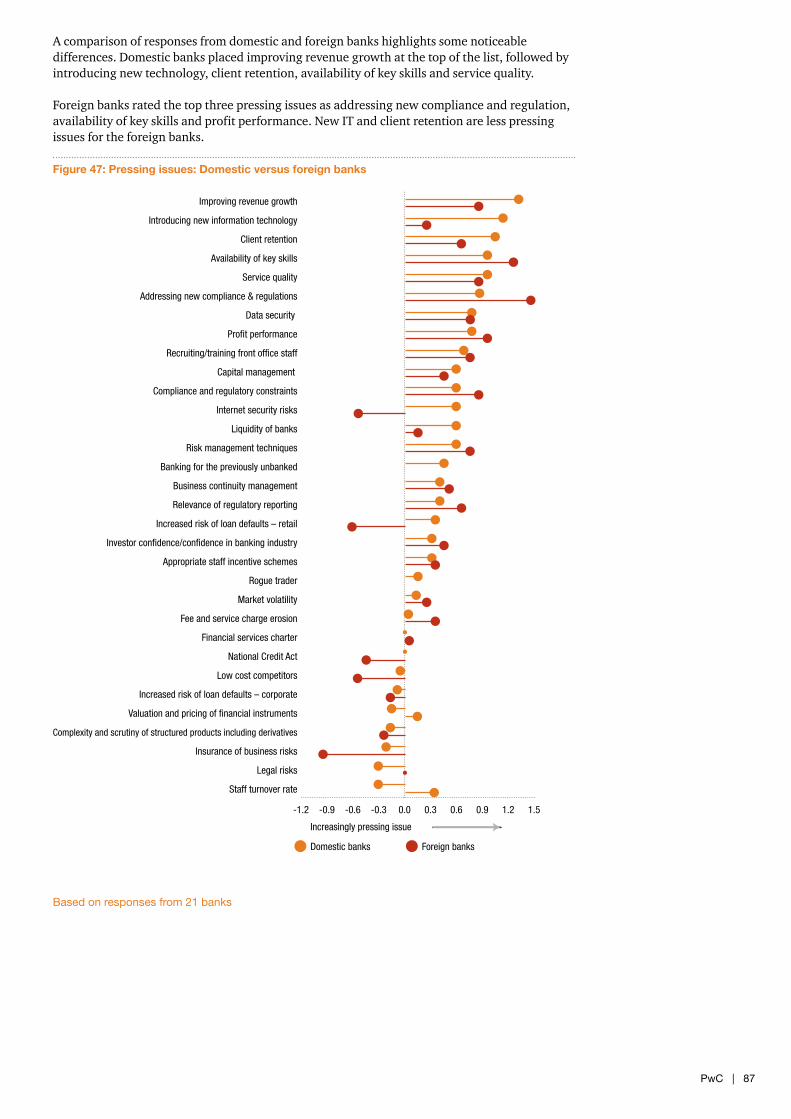
PwC | 87
A comparison of responses from domestic and foreign banks highlights some noticeable differences. Domestic banks placed improving revenue growth at the top of the list, followed by introducing new technology, client retention, availability of key skills and service quality.
Foreign banks rated the top three pressing issues as addressing new compliance and regulation, availability of key skills and profit performance. New IT and client retention are less pressing issues for the foreign banks.
Figure 47: Pressing issues: Domestic versus foreign banks
Based on responses from 21 banks
Domestic banks
Increasingly pressing issue
Foreign banks
-1.2 -0.9 -0.6 -0.3 0.0 0.3 0.6 0.9 1.2 1.5
Staff turnover rate
Legal risks
Insurance of business risks
Complexity and scrutiny of structured products including derivatives
Valuation and pricing of financial instruments
Increased risk of loan defaults – corporate
Low cost competitors
National Credit Act
Financial services charter
Fee and service charge erosion
Market volatility
Rogue trader
Appropriate staff incentive schemes
Investor confidence/confidence in banking industry
Increased risk of loan defaults – retail
Relevance of regulatory reporting
Business continuity management
Banking for the previously unbanked
Risk management techniques
Liquidity of banks
Internet security risks
Compliance and regulatory constraints
Capital management
Recruiting/training front office staff
Profit performance
Data security
Addressing new compliance & regulations
Service quality
Availability of key skills
Client retention
Introducing new information technology
Improving revenue growth

88 | Shaping the Bank of the Future
Appendix 3:Research methodology
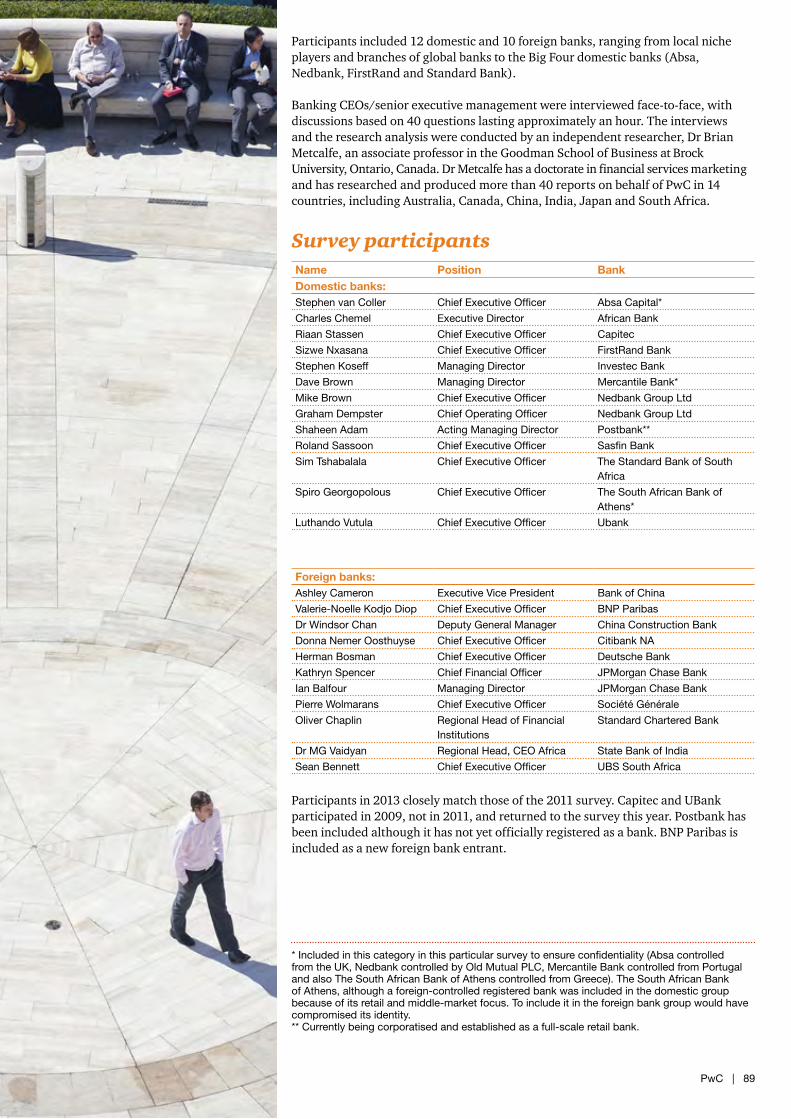
PwC | 89
Participants included 12 domestic and 10 foreign banks, ranging from local niche players and branches of global banks to the Big Four domestic banks (Absa, Nedbank, FirstRand and Standard Bank).
Banking CEOs/senior executive management were interviewed face-to-face, with discussions based on 40 questions lasting approximately an hour. The interviews and the research analysis were conducted by an independent researcher, Dr Brian Metcalfe, an associate professor in the Goodman School of Business at Brock University, Ontario, Canada. Dr Metcalfe has a doctorate in financial services marketing and has researched and produced more than 40 reports on behalf of PwC in 14 countries, including Australia, Canada, China, India, Japan and South Africa.
Survey participantsName Position BankDomestic banks:Stephen van Coller Chief Executive Officer Absa Capital*
Charles Chemel Executive Director African Bank
Riaan Stassen Chief Executive Officer Capitec
Sizwe Nxasana Chief Executive Officer FirstRand Bank
Stephen Koseff Managing Director Investec Bank
Dave Brown Managing Director Mercantile Bank*
Mike Brown Chief Executive Officer Nedbank Group Ltd
Graham Dempster Chief Operating Officer Nedbank Group Ltd
Shaheen Adam Acting Managing Director Postbank**
Roland Sassoon Chief Executive Officer Sasfin Bank
Sim Tshabalala Chief Executive Officer The Standard Bank of South Africa
Spiro Georgopolous Chief Executive Officer The South African Bank of Athens*
Luthando Vutula Chief Executive Officer Ubank
Foreign banks:Ashley Cameron Executive Vice President Bank of China
Valerie-Noelle Kodjo Diop Chief Executive Officer BNP Paribas
Dr Windsor Chan Deputy General Manager China Construction Bank
Donna Nemer Oosthuyse Chief Executive Officer Citibank NA
Herman Bosman Chief Executive Officer Deutsche Bank
Kathryn Spencer Chief Financial Officer JPMorgan Chase Bank
Ian Balfour Managing Director JPMorgan Chase Bank
Pierre Wolmarans Chief Executive Officer Société Générale
Oliver Chaplin Regional Head of Financial Institutions
Standard Chartered Bank
Dr MG Vaidyan Regional Head, CEO Africa State Bank of India
Sean Bennett Chief Executive Officer UBS South Africa
Participants in 2013 closely match those of the 2011 survey. Capitec and UBank participated in 2009, not in 2011, and returned to the survey this year. Postbank has been included although it has not yet officially registered as a bank. BNP Paribas is included as a new foreign bank entrant.
* Included in this category in this particular survey to ensure confidentiality (Absa controlled from the UK, Nedbank controlled by Old Mutual PLC, Mercantile Bank controlled from Portugal and also The South African Bank of Athens controlled from Greece). The South African Bank of Athens, although a foreign-controlled registered bank was included in the domestic group because of its retail and middle-market focus. To include it in the foreign bank group would have compromised its identity.** Currently being corporatised and established as a full-scale retail bank.

90 | Shaping the Bank of the Future
Appendix 4: BA 900 data

PwC | 91
• BA 900 – Deposits
• BA 900 – Equity and liabilities
• BA 900 – Total assets
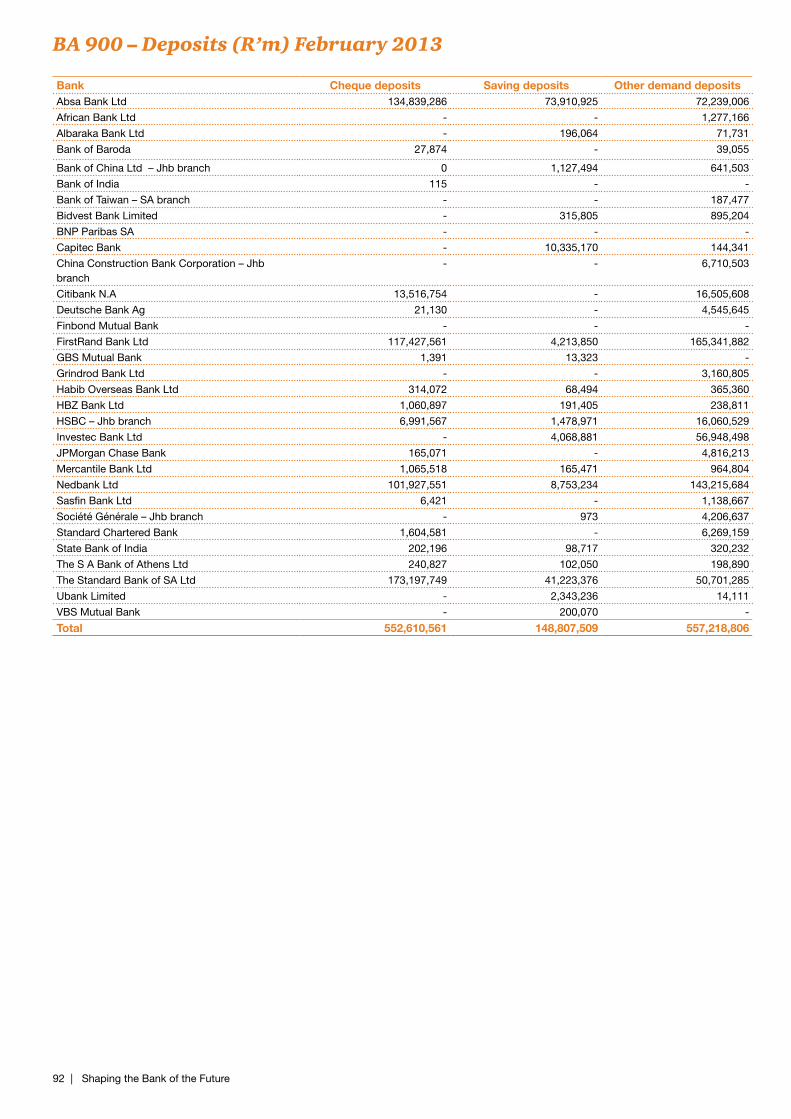
92 | Shaping the Bank of the Future
BA 900 – Deposits (R’m) February 2013
Bank Cheque deposits Saving deposits Other demand deposits Short-term deposits Medium-term deposits Long-term deposits Total depositsAbsa Bank Ltd 134,839,286 73,910,925 72,239,006 39,904,369 100,403,691 142,688,631 563,985,908
African Bank Ltd - - 1,277,166 2,266,786 9,129,143 14,155,186 26,828,281
Albaraka Bank Ltd - 196,064 71,731 1,008,803 1,221,675 940,960 3,439,233
Bank of Baroda 27,874 - 39,055 479,243 352,962 415,691 1,314,825
Bank of China Ltd – Jhb branch 0 1,127,494 641,503 2,382,190 2,211,234 607,737 6,970,158
Bank of India 115 - - - - - 115
Bank of Taiwan – SA branch - - 187,477 769,500 834,606 12,292 1,803,875
Bidvest Bank Limited - 315,805 895,204 53,275 701,904 9,048 1,975,236
BNP Paribas SA - - - - - - -
Capitec Bank - 10,335,170 144,341 550,226 2,471,291 8,358,778 21,859,806
China Construction Bank Corporation – Jhb branch
- - 6,710,503 2,820,841 2,923,416 198,026 12,652,786
Citibank N.A 13,516,754 - 16,505,608 3,299,739 2,787,248 185,994 36,295,342
Deutsche Bank Ag 21,130 - 4,545,645 1,198,635 284,877 372,784 6,423,071
Finbond Mutual Bank - - - 1,091 30,070 134,672 165,833
FirstRand Bank Ltd 117,427,561 4,213,850 165,341,882 48,922,950 82,028,589 107,679,769 525,614,600
GBS Mutual Bank 1,391 13,323 - 196,306 153,022 399,705 763,747
Grindrod Bank Ltd - - 3,160,805 131,801 1,426,468 61,332 4,780,406
Habib Overseas Bank Ltd 314,072 68,494 365,360 83,124 96,842 600 928,492
HBZ Bank Ltd 1,060,897 191,405 238,811 999,297 219,665 68,359 2,778,434
HSBC – Jhb branch 6,991,567 1,478,971 16,060,529 4,399,910 3,273,109 435,172 32,639,258
Investec Bank Ltd - 4,068,881 56,948,498 32,684,587 49,928,643 43,652,653 187,283,262
JPMorgan Chase Bank 165,071 - 4,816,213 70,738 140,631 882,472 6,075,125
Mercantile Bank Ltd 1,065,518 165,471 964,804 731,082 1,260,483 411,718 4,599,076
Nedbank Ltd 101,927,551 8,753,234 143,215,684 33,879,025 96,296,340 117,741,845 501,813,679
Sasfin Bank Ltd 6,421 - 1,138,667 293,013 347,492 32,609 1,818,202
Société Générale – Jhb branch - 973 4,206,637 1,592,200 113,727 - 5,913,537
Standard Chartered Bank 1,604,581 - 6,269,159 2,795,332 1,961,154 4,251,046 16,881,272
State Bank of India 202,196 98,717 320,232 259,403 384,061 275,449 1,540,058
The S A Bank of Athens Ltd 240,827 102,050 198,890 4,468 400,988 52,643 999,866
The Standard Bank of SA Ltd 173,197,749 41,223,376 50,701,285 156,947,234 103,162,936 114,019,248 639,251,828
Ubank Limited - 2,343,236 14,111 83,647 378,862 143,475 2,963,331
VBS Mutual Bank - 200,070 - 8,477 5,868 56,585 271,000
Total 552,610,561 148,807,509 557,218,806 338,817,292 464,930,997 558,244,478 2,620,629,643
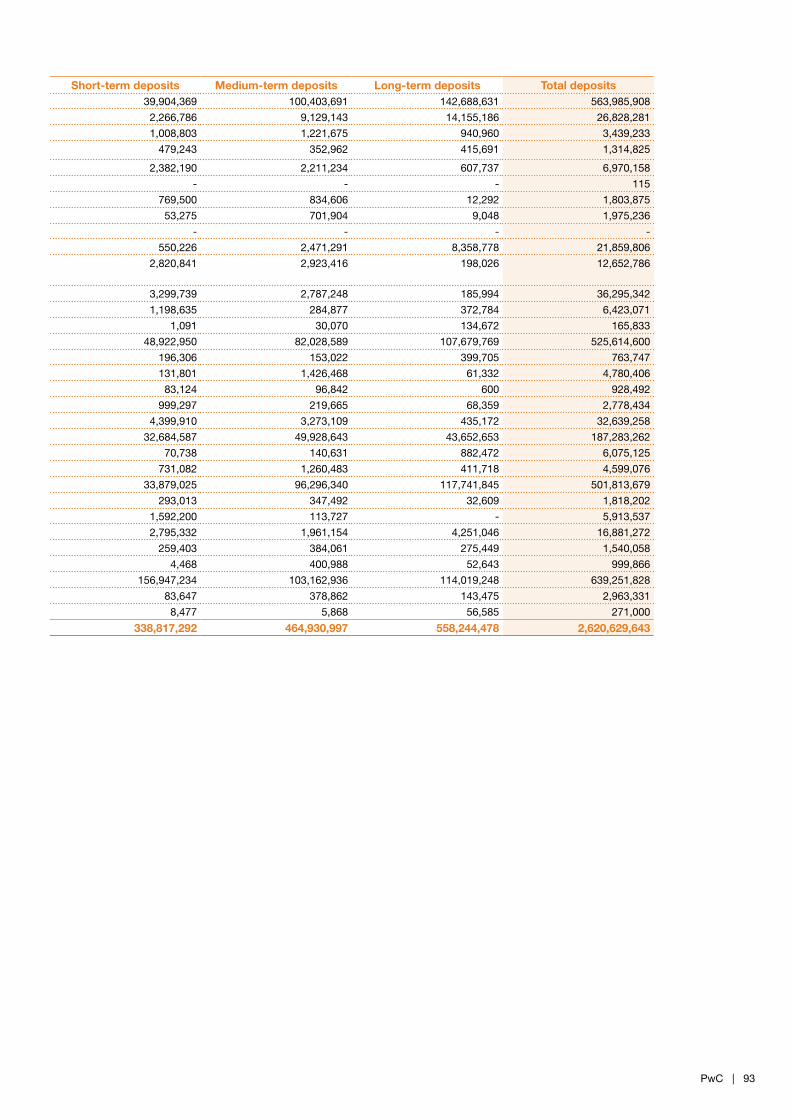
PwC | 93
BA 900 – Deposits (R’m) February 2013
Bank Cheque deposits Saving deposits Other demand deposits Short-term deposits Medium-term deposits Long-term deposits Total depositsAbsa Bank Ltd 134,839,286 73,910,925 72,239,006 39,904,369 100,403,691 142,688,631 563,985,908
African Bank Ltd - - 1,277,166 2,266,786 9,129,143 14,155,186 26,828,281
Albaraka Bank Ltd - 196,064 71,731 1,008,803 1,221,675 940,960 3,439,233
Bank of Baroda 27,874 - 39,055 479,243 352,962 415,691 1,314,825
Bank of China Ltd – Jhb branch 0 1,127,494 641,503 2,382,190 2,211,234 607,737 6,970,158
Bank of India 115 - - - - - 115
Bank of Taiwan – SA branch - - 187,477 769,500 834,606 12,292 1,803,875
Bidvest Bank Limited - 315,805 895,204 53,275 701,904 9,048 1,975,236
BNP Paribas SA - - - - - - -
Capitec Bank - 10,335,170 144,341 550,226 2,471,291 8,358,778 21,859,806
China Construction Bank Corporation – Jhb branch
- - 6,710,503 2,820,841 2,923,416 198,026 12,652,786
Citibank N.A 13,516,754 - 16,505,608 3,299,739 2,787,248 185,994 36,295,342
Deutsche Bank Ag 21,130 - 4,545,645 1,198,635 284,877 372,784 6,423,071
Finbond Mutual Bank - - - 1,091 30,070 134,672 165,833
FirstRand Bank Ltd 117,427,561 4,213,850 165,341,882 48,922,950 82,028,589 107,679,769 525,614,600
GBS Mutual Bank 1,391 13,323 - 196,306 153,022 399,705 763,747
Grindrod Bank Ltd - - 3,160,805 131,801 1,426,468 61,332 4,780,406
Habib Overseas Bank Ltd 314,072 68,494 365,360 83,124 96,842 600 928,492
HBZ Bank Ltd 1,060,897 191,405 238,811 999,297 219,665 68,359 2,778,434
HSBC – Jhb branch 6,991,567 1,478,971 16,060,529 4,399,910 3,273,109 435,172 32,639,258
Investec Bank Ltd - 4,068,881 56,948,498 32,684,587 49,928,643 43,652,653 187,283,262
JPMorgan Chase Bank 165,071 - 4,816,213 70,738 140,631 882,472 6,075,125
Mercantile Bank Ltd 1,065,518 165,471 964,804 731,082 1,260,483 411,718 4,599,076
Nedbank Ltd 101,927,551 8,753,234 143,215,684 33,879,025 96,296,340 117,741,845 501,813,679
Sasfin Bank Ltd 6,421 - 1,138,667 293,013 347,492 32,609 1,818,202
Société Générale – Jhb branch - 973 4,206,637 1,592,200 113,727 - 5,913,537
Standard Chartered Bank 1,604,581 - 6,269,159 2,795,332 1,961,154 4,251,046 16,881,272
State Bank of India 202,196 98,717 320,232 259,403 384,061 275,449 1,540,058
The S A Bank of Athens Ltd 240,827 102,050 198,890 4,468 400,988 52,643 999,866
The Standard Bank of SA Ltd 173,197,749 41,223,376 50,701,285 156,947,234 103,162,936 114,019,248 639,251,828
Ubank Limited - 2,343,236 14,111 83,647 378,862 143,475 2,963,331
VBS Mutual Bank - 200,070 - 8,477 5,868 56,585 271,000
Total 552,610,561 148,807,509 557,218,806 338,817,292 464,930,997 558,244,478 2,620,629,643
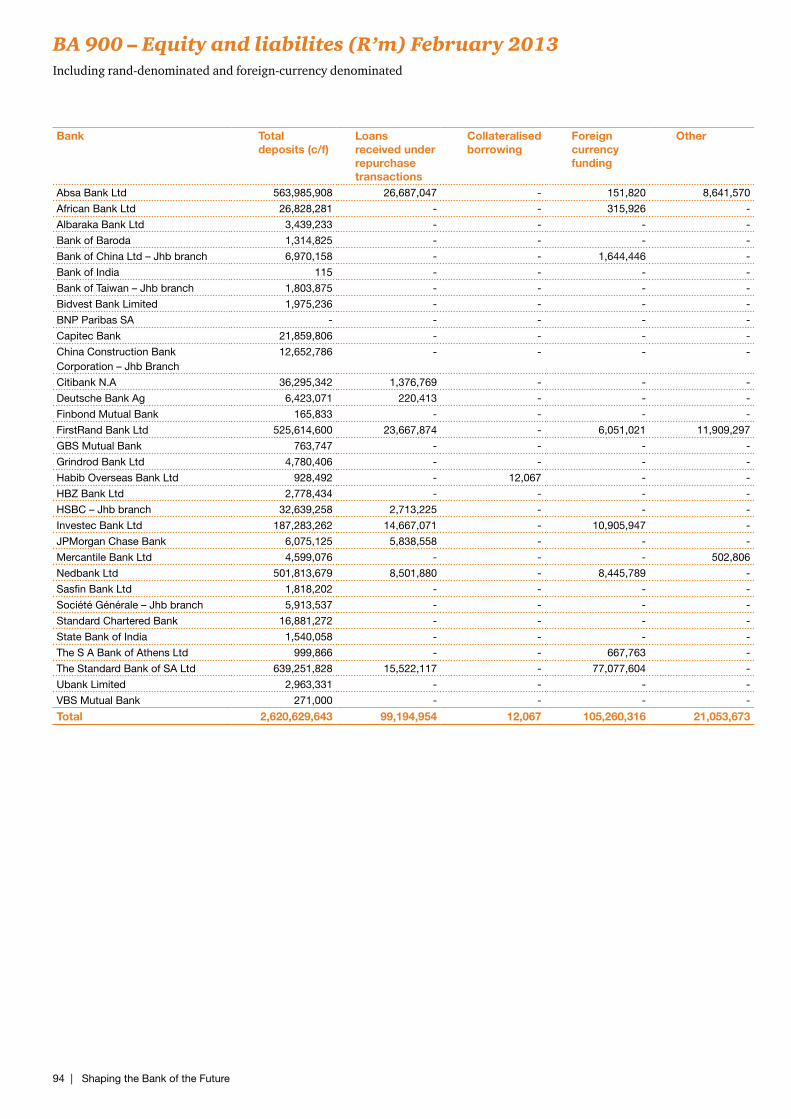
94 | Shaping the Bank of the Future
BA 900 – Equity and liabilites (R’m) February 2013Including rand-denominated and foreign-currency denominated
Bank Total deposits (c/f)
Loans received under repurchase transactions
Collateralised borrowing
Foreign currency funding
Other Other liabilities to the public
Outstanding liabilities on behalf of clients
Other liabilities
Share capital Other reserves
Total equity and liabilities
Absa Bank Ltd 563,985,908 26,687,047 - 151,820 8,641,570 42,323,297 - 66,864,825 17,411,929 39,566,575 765,632,971
African Bank Ltd 26,828,281 - - 315,926 - 24,069,560 - 1,842,920 8,654,311 4,186,881 65,897,879
Albaraka Bank Ltd 3,439,233 - - - - - - 44,839 254,866 109,183 3,848,121
Bank of Baroda 1,314,825 - - - - - - 3,176 62,703 69,033 1,449,737
Bank of China Ltd – Jhb branch 6,970,158 - - 1,644,446 - 493,713 - 192,499 1,200,000 393,764 10,894,580
Bank of India 115 - - - - - - 565 250,000 1,163 251,843
Bank of Taiwan – Jhb branch 1,803,875 - - - - 17,057 - 13,730 50,000 210,115 2,094,777
Bidvest Bank Limited 1,975,236 - - - - - - 319,837 527,779 1,276,936 4,099,788
BNP Paribas SA - - - - - - - 9,483 342,000 5,004 356,487
Capitec Bank 21,859,806 - - - - 7,141,968 - 1,048,317 6,060,111 2,228,007 38,338,209
China Construction Bank Corporation – Jhb Branch
12,652,786 - - - - - - 93,772 1,205,797 116,246 14,068,601
Citibank N.A 36,295,342 1,376,769 - - - 3,692 - 6,623,586 2,164,602 2,341,315 48,805,306
Deutsche Bank Ag 6,423,071 220,413 - - - - - 10,029,847 884,639 420,852 17,978,822
Finbond Mutual Bank 165,833 - - - - - - 22,298 457,781 -24,727 621,186
FirstRand Bank Ltd 525,614,600 23,667,874 - 6,051,021 11,909,297 34,284,729 - 78,739,936 18,308,325 34,806,102 733,381,884
GBS Mutual Bank 763,747 - - - - - - 24,091 - 126,836 914,674
Grindrod Bank Ltd 4,780,406 - - - - 576,091 - 118,287 368,579 163,952 6,007,315
Habib Overseas Bank Ltd 928,492 - 12,067 - - - - 14,536 20,000 56,712 1,031,807
HBZ Bank Ltd 2,778,434 - - - - - - 99,593 50,000 199,444 3,127,471
HSBC – Jhb branch 32,639,258 2,713,225 - - - - - 1,201,630 885,025 922,031 38,361,169
Investec Bank Ltd 187,283,262 14,667,071 - 10,905,947 - 11,979,528 - 15,002,072 14,930,953 5,244,567 260,013,400
JPMorgan Chase Bank 6,075,125 5,838,558 - - - - - 20,551,367 2,650,000 - 35,115,050
Mercantile Bank Ltd 4,599,076 - - - 502,806 - - 252,384 1,483,077 218,983 7,056,326
Nedbank Ltd 501,813,679 8,501,880 - 8,445,789 - 28,904,071 - 24,426,738 21,021,396 24,046,705 617,160,258
Sasfin Bank Ltd 1,818,202 - - - - 528,178 - 135,587 313,476 279,284 3,074,727
Société Générale – Jhb branch 5,913,537 - - - - - - 69,168 295,599 183,981 6,462,285
Standard Chartered Bank 16,881,272 - - - - - - 1,264,457 1,664,557 409,330 20,219,616
State Bank of India 1,540,058 - - - - - - 35,059 535,850 215,769 2,326,736
The S A Bank of Athens Ltd 999,866 - - 667,763 - 40,000 - 22,045 277,685 422 2,007,781
The Standard Bank of SA Ltd 639,251,828 15,522,117 - 77,077,604 - 55,748,203 - 105,763,344 35,256,369 34,782,599 963,402,064
Ubank Limited 2,963,331 - - - - - - 122,233 244,875 296,118 3,626,557
VBS Mutual Bank 271,000 - - - - 2,729 - - 17,759 18,742 310,230
Total 2,620,629,643 99,194,954 12,067 105,260,316 21,053,673 206,112,816 0 334,952,221 137,850,043 152,871,924 3,677,937,656
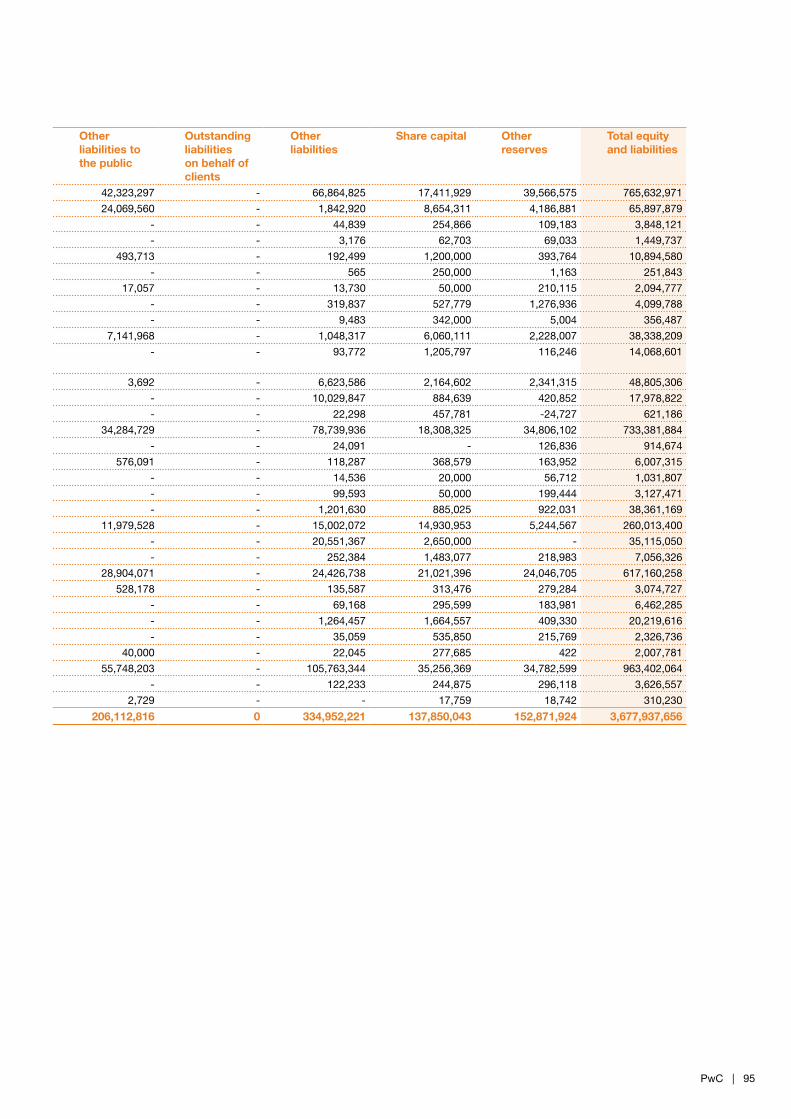
PwC | 95
BA 900 – Equity and liabilites (R’m) February 2013Including rand-denominated and foreign-currency denominated
Bank Total deposits (c/f)
Loans received under repurchase transactions
Collateralised borrowing
Foreign currency funding
Other Other liabilities to the public
Outstanding liabilities on behalf of clients
Other liabilities
Share capital Other reserves
Total equity and liabilities
Absa Bank Ltd 563,985,908 26,687,047 - 151,820 8,641,570 42,323,297 - 66,864,825 17,411,929 39,566,575 765,632,971
African Bank Ltd 26,828,281 - - 315,926 - 24,069,560 - 1,842,920 8,654,311 4,186,881 65,897,879
Albaraka Bank Ltd 3,439,233 - - - - - - 44,839 254,866 109,183 3,848,121
Bank of Baroda 1,314,825 - - - - - - 3,176 62,703 69,033 1,449,737
Bank of China Ltd – Jhb branch 6,970,158 - - 1,644,446 - 493,713 - 192,499 1,200,000 393,764 10,894,580
Bank of India 115 - - - - - - 565 250,000 1,163 251,843
Bank of Taiwan – Jhb branch 1,803,875 - - - - 17,057 - 13,730 50,000 210,115 2,094,777
Bidvest Bank Limited 1,975,236 - - - - - - 319,837 527,779 1,276,936 4,099,788
BNP Paribas SA - - - - - - - 9,483 342,000 5,004 356,487
Capitec Bank 21,859,806 - - - - 7,141,968 - 1,048,317 6,060,111 2,228,007 38,338,209
China Construction Bank Corporation – Jhb Branch
12,652,786 - - - - - - 93,772 1,205,797 116,246 14,068,601
Citibank N.A 36,295,342 1,376,769 - - - 3,692 - 6,623,586 2,164,602 2,341,315 48,805,306
Deutsche Bank Ag 6,423,071 220,413 - - - - - 10,029,847 884,639 420,852 17,978,822
Finbond Mutual Bank 165,833 - - - - - - 22,298 457,781 -24,727 621,186
FirstRand Bank Ltd 525,614,600 23,667,874 - 6,051,021 11,909,297 34,284,729 - 78,739,936 18,308,325 34,806,102 733,381,884
GBS Mutual Bank 763,747 - - - - - - 24,091 - 126,836 914,674
Grindrod Bank Ltd 4,780,406 - - - - 576,091 - 118,287 368,579 163,952 6,007,315
Habib Overseas Bank Ltd 928,492 - 12,067 - - - - 14,536 20,000 56,712 1,031,807
HBZ Bank Ltd 2,778,434 - - - - - - 99,593 50,000 199,444 3,127,471
HSBC – Jhb branch 32,639,258 2,713,225 - - - - - 1,201,630 885,025 922,031 38,361,169
Investec Bank Ltd 187,283,262 14,667,071 - 10,905,947 - 11,979,528 - 15,002,072 14,930,953 5,244,567 260,013,400
JPMorgan Chase Bank 6,075,125 5,838,558 - - - - - 20,551,367 2,650,000 - 35,115,050
Mercantile Bank Ltd 4,599,076 - - - 502,806 - - 252,384 1,483,077 218,983 7,056,326
Nedbank Ltd 501,813,679 8,501,880 - 8,445,789 - 28,904,071 - 24,426,738 21,021,396 24,046,705 617,160,258
Sasfin Bank Ltd 1,818,202 - - - - 528,178 - 135,587 313,476 279,284 3,074,727
Société Générale – Jhb branch 5,913,537 - - - - - - 69,168 295,599 183,981 6,462,285
Standard Chartered Bank 16,881,272 - - - - - - 1,264,457 1,664,557 409,330 20,219,616
State Bank of India 1,540,058 - - - - - - 35,059 535,850 215,769 2,326,736
The S A Bank of Athens Ltd 999,866 - - 667,763 - 40,000 - 22,045 277,685 422 2,007,781
The Standard Bank of SA Ltd 639,251,828 15,522,117 - 77,077,604 - 55,748,203 - 105,763,344 35,256,369 34,782,599 963,402,064
Ubank Limited 2,963,331 - - - - - - 122,233 244,875 296,118 3,626,557
VBS Mutual Bank 271,000 - - - - 2,729 - - 17,759 18,742 310,230
Total 2,620,629,643 99,194,954 12,067 105,260,316 21,053,673 206,112,816 0 334,952,221 137,850,043 152,871,924 3,677,937,656
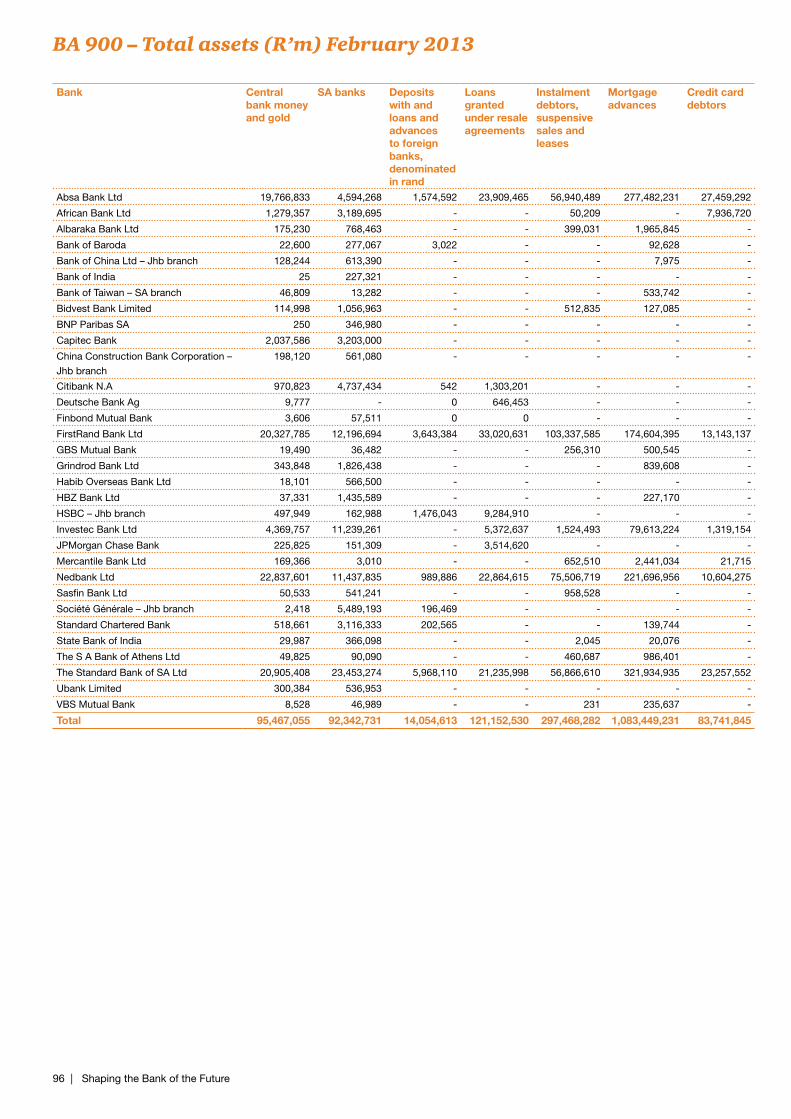
96 | Shaping the Bank of the Future
BA 900 – Total assets (R’m) February 2013
Bank Central bank money and gold
SA banks Deposits with and loans and advances to foreign banks, denominated in rand
Loans granted under resale agreements
Instalment debtors, suspensive sales and leases
Mortgage advances
Credit card debtors
Foreign currency loans and advances
Redeemable preference shares issued
Overdrafts, loans and advances: public sector
Overdrafts, loans and advances: private sector
Less: Credit impairments in respect of loans and advances
Investments Non-financial assets
Other assets Total assets
Absa Bank Ltd 19,766,833 4,594,268 1,574,592 23,909,465 56,940,489 277,482,231 27,459,292 27,411,577 4,810,070 7,521,997 145,344,898 12,901,222 156,677,666 8,712,955 16,327,860 765,632,971African Bank Ltd 1,279,357 3,189,695 - - 50,209 - 7,936,720 - - - 54,090,672 10,023,007 4,247,952 4,641,735 484,546 65,897,879Albaraka Bank Ltd 175,230 768,463 - - 399,031 1,965,845 - - - - - 16,716 449,537 91,064 15,667 3,848,121Bank of Baroda 22,600 277,067 3,022 - - 92,628 - 195,364 - - 785,108 11,540 85,145 194 149 1,449,737Bank of China Ltd – Jhb branch 128,244 613,390 - - - 7,975 - 7,804,951 - - 1,980,182 26,143 357,532 8,229 20,218 10,894,580Bank of India 25 227,321 - - - - - - - - 20,172 202 95 862 3,570 251,843Bank of Taiwan – SA branch 46,809 13,282 - - - 533,742 - 1,160,154 - - 187,571 14,631 149,090 332 18,428 2,094,777Bidvest Bank Limited 114,998 1,056,963 - - 512,835 127,085 - 243,651 - 22,426 180,638 32,562 172,016 1,534,421 167,317 4,099,788BNP Paribas SA 250 346,980 - - - - - - - - - - - 9,257 - 356,487Capitec Bank 2,037,586 3,203,000 - - - - - 0 - - 31,387,454 2,724,564 3,226,297 802,596 405,840 38,338,209China Construction Bank Corporation –
Jhb branch
198,120 561,080 - - - - - 7,755,453 - 513,509 2,815,405 176,916 2,200,381 154,363 47,206 14,068,601
Citibank N.A 970,823 4,737,434 542 1,303,201 - - - 15,198,324 - 1 8,155,425 99,248 18,173,637 121,958 243,207 48,805,306Deutsche Bank Ag 9,777 - 0 646,453 - - - 3,517,431 - - 642,932 5,550 13,113,227 339 54,209 17,978,822Finbond Mutual Bank 3,606 57,511 0 0 - - - - - - 293,252 13,300 - 310,469 -30,355 621,186FirstRand Bank Ltd 20,327,785 12,196,694 3,643,384 33,020,631 103,337,585 174,604,395 13,143,137 29,268,053 29,994,642 12,113,661 157,468,487 11,383,527 136,044,406 10,128,238 9,474,315 733,381,884GBS Mutual Bank 19,490 36,482 - - 256,310 500,545 - - - - 13,946 5,686 87,438 1,381 4,768 914,674Grindrod Bank Ltd 343,848 1,826,438 - - - 839,608 - - 511,639 - 1,892,394 9,953 341,620 2,792 258,929 6,007,315Habib Overseas Bank Ltd 18,101 566,500 - - - - - 33,499 - - 283,424 3,325 128,936 2,315 2,357 1,031,807HBZ Bank Ltd 37,331 1,435,589 - - - 227,170 - 203,789 - - 703,229 9,403 498,860 16,340 14,566 3,127,471HSBC – Jhb branch 497,949 162,988 1,476,043 9,284,910 - - - 7,581,865 - - 3,444,829 3,368 15,346,439 11,603 557,911 38,361,169Investec Bank Ltd 4,369,757 11,239,261 - 5,372,637 1,524,493 79,613,224 1,319,154 16,886,811 7,045,784 - 56,370,252 1,455,172 76,479,951 311,345 935,902 260,013,400JPMorgan Chase Bank 225,825 151,309 - 3,514,620 - - - 1,427,544 - 881,261 4,319,776 - 20,226,295 20,927 4,347,492 35,115,050Mercantile Bank Ltd 169,366 3,010 - - 652,510 2,441,034 21,715 163,534 - - 3,092,859 76,457 295,383 215,129 78,243 7,056,326Nedbank Ltd 22,837,601 11,437,835 989,886 22,864,615 75,506,719 221,696,956 10,604,275 25,123,912 246,250 15,695,143 137,228,213 10,872,981 68,579,603 9,268,742 5,953,490 617,160,258Sasfin Bank Ltd 50,533 541,241 - - 958,528 - - 39,855 - - 838,046 36,422 523,057 80,704 79,186 3,074,727Société Générale – Jhb branch 2,418 5,489,193 196,469 - - - - 15,489 - - 223,931 - 473,029 5,927 55,829 6,462,285Standard Chartered Bank 518,661 3,116,333 202,565 - - 139,744 - 4,393,774 - - 6,320,292 105,506 5,458,289 19,312 156,153 20,219,616State Bank of India 29,987 366,098 - - 2,045 20,076 - 409,382 - - 905,991 46,133 626,244 3,362 9,683 2,326,736The S A Bank of Athens Ltd 49,825 90,090 - - 460,687 986,401 - 27,580 - - 285,708 33,875 91,580 37,310 12,478 2,007,781The Standard Bank of SA Ltd 20,905,408 23,453,274 5,968,110 21,235,998 56,866,610 321,934,935 23,257,552 116,018,936 25,407,597 6,114,722 147,636,545 13,019,778 174,696,021 19,277,498 13,648,632 963,402,064Ubank Limited 300,384 536,953 - - - - - - 403,496 - 1,269,371 300,927 1,189,110 127,350 100,822 3,626,557VBS Mutual Bank 8,528 46,989 - - 231 235,637 - - - - 3,431 444 13,318 1,628 912 310,230
Total 95,467,055 92,342,731 14,054,613 121,152,530 297,468,282 1,083,449,231 83,741,845 264,880,928 68,419,478 42,862,720 768,184,433 63,408,558 699,952,154 55,920,678 53,449,531 3,677,937,656
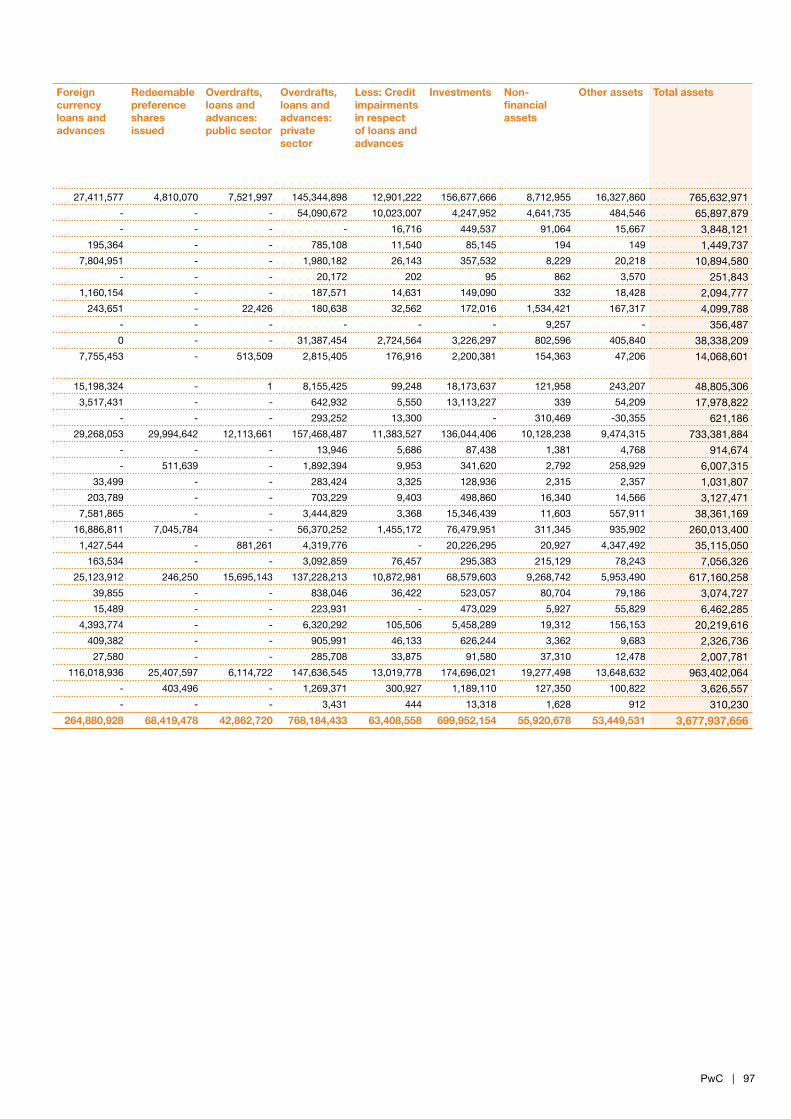
PwC | 97
BA 900 – Total assets (R’m) February 2013
Bank Central bank money and gold
SA banks Deposits with and loans and advances to foreign banks, denominated in rand
Loans granted under resale agreements
Instalment debtors, suspensive sales and leases
Mortgage advances
Credit card debtors
Foreign currency loans and advances
Redeemable preference shares issued
Overdrafts, loans and advances: public sector
Overdrafts, loans and advances: private sector
Less: Credit impairments in respect of loans and advances
Investments Non-financial assets
Other assets Total assets
Absa Bank Ltd 19,766,833 4,594,268 1,574,592 23,909,465 56,940,489 277,482,231 27,459,292 27,411,577 4,810,070 7,521,997 145,344,898 12,901,222 156,677,666 8,712,955 16,327,860 765,632,971African Bank Ltd 1,279,357 3,189,695 - - 50,209 - 7,936,720 - - - 54,090,672 10,023,007 4,247,952 4,641,735 484,546 65,897,879Albaraka Bank Ltd 175,230 768,463 - - 399,031 1,965,845 - - - - - 16,716 449,537 91,064 15,667 3,848,121Bank of Baroda 22,600 277,067 3,022 - - 92,628 - 195,364 - - 785,108 11,540 85,145 194 149 1,449,737Bank of China Ltd – Jhb branch 128,244 613,390 - - - 7,975 - 7,804,951 - - 1,980,182 26,143 357,532 8,229 20,218 10,894,580Bank of India 25 227,321 - - - - - - - - 20,172 202 95 862 3,570 251,843Bank of Taiwan – SA branch 46,809 13,282 - - - 533,742 - 1,160,154 - - 187,571 14,631 149,090 332 18,428 2,094,777Bidvest Bank Limited 114,998 1,056,963 - - 512,835 127,085 - 243,651 - 22,426 180,638 32,562 172,016 1,534,421 167,317 4,099,788BNP Paribas SA 250 346,980 - - - - - - - - - - - 9,257 - 356,487Capitec Bank 2,037,586 3,203,000 - - - - - 0 - - 31,387,454 2,724,564 3,226,297 802,596 405,840 38,338,209China Construction Bank Corporation –
Jhb branch
198,120 561,080 - - - - - 7,755,453 - 513,509 2,815,405 176,916 2,200,381 154,363 47,206 14,068,601
Citibank N.A 970,823 4,737,434 542 1,303,201 - - - 15,198,324 - 1 8,155,425 99,248 18,173,637 121,958 243,207 48,805,306Deutsche Bank Ag 9,777 - 0 646,453 - - - 3,517,431 - - 642,932 5,550 13,113,227 339 54,209 17,978,822Finbond Mutual Bank 3,606 57,511 0 0 - - - - - - 293,252 13,300 - 310,469 -30,355 621,186FirstRand Bank Ltd 20,327,785 12,196,694 3,643,384 33,020,631 103,337,585 174,604,395 13,143,137 29,268,053 29,994,642 12,113,661 157,468,487 11,383,527 136,044,406 10,128,238 9,474,315 733,381,884GBS Mutual Bank 19,490 36,482 - - 256,310 500,545 - - - - 13,946 5,686 87,438 1,381 4,768 914,674Grindrod Bank Ltd 343,848 1,826,438 - - - 839,608 - - 511,639 - 1,892,394 9,953 341,620 2,792 258,929 6,007,315Habib Overseas Bank Ltd 18,101 566,500 - - - - - 33,499 - - 283,424 3,325 128,936 2,315 2,357 1,031,807HBZ Bank Ltd 37,331 1,435,589 - - - 227,170 - 203,789 - - 703,229 9,403 498,860 16,340 14,566 3,127,471HSBC – Jhb branch 497,949 162,988 1,476,043 9,284,910 - - - 7,581,865 - - 3,444,829 3,368 15,346,439 11,603 557,911 38,361,169Investec Bank Ltd 4,369,757 11,239,261 - 5,372,637 1,524,493 79,613,224 1,319,154 16,886,811 7,045,784 - 56,370,252 1,455,172 76,479,951 311,345 935,902 260,013,400JPMorgan Chase Bank 225,825 151,309 - 3,514,620 - - - 1,427,544 - 881,261 4,319,776 - 20,226,295 20,927 4,347,492 35,115,050Mercantile Bank Ltd 169,366 3,010 - - 652,510 2,441,034 21,715 163,534 - - 3,092,859 76,457 295,383 215,129 78,243 7,056,326Nedbank Ltd 22,837,601 11,437,835 989,886 22,864,615 75,506,719 221,696,956 10,604,275 25,123,912 246,250 15,695,143 137,228,213 10,872,981 68,579,603 9,268,742 5,953,490 617,160,258Sasfin Bank Ltd 50,533 541,241 - - 958,528 - - 39,855 - - 838,046 36,422 523,057 80,704 79,186 3,074,727Société Générale – Jhb branch 2,418 5,489,193 196,469 - - - - 15,489 - - 223,931 - 473,029 5,927 55,829 6,462,285Standard Chartered Bank 518,661 3,116,333 202,565 - - 139,744 - 4,393,774 - - 6,320,292 105,506 5,458,289 19,312 156,153 20,219,616State Bank of India 29,987 366,098 - - 2,045 20,076 - 409,382 - - 905,991 46,133 626,244 3,362 9,683 2,326,736The S A Bank of Athens Ltd 49,825 90,090 - - 460,687 986,401 - 27,580 - - 285,708 33,875 91,580 37,310 12,478 2,007,781The Standard Bank of SA Ltd 20,905,408 23,453,274 5,968,110 21,235,998 56,866,610 321,934,935 23,257,552 116,018,936 25,407,597 6,114,722 147,636,545 13,019,778 174,696,021 19,277,498 13,648,632 963,402,064Ubank Limited 300,384 536,953 - - - - - - 403,496 - 1,269,371 300,927 1,189,110 127,350 100,822 3,626,557VBS Mutual Bank 8,528 46,989 - - 231 235,637 - - - - 3,431 444 13,318 1,628 912 310,230
Total 95,467,055 92,342,731 14,054,613 121,152,530 297,468,282 1,083,449,231 83,741,845 264,880,928 68,419,478 42,862,720 768,184,433 63,408,558 699,952,154 55,920,678 53,449,531 3,677,937,656

98 | Shaping the Bank of the Future
Johannes Grosskopf
Banking and Capital Markets Leader, PwC South Africa
+27 (0)11 797 4346
Tom Winterboer
Financial Services Leader Southern Africa and Africa
+27 (0)11 797 5407
Louis le Grange
Tax – Financial Services, PwC South Africa
+27 (0)11 797 4263
Werner Horn
Advisory – Financial Services, PwC South Africa
+27 (0)11 797 4876
Rudi Binedell
Financial Services, PwC Botswana
+267 395 2011
Rob Walker
Financial Services, PwC Mozambique
+258 21 307 620
Louis van der Riet
Financial Services, PwC Namibia
+267 395 2011
Paul Lewis
Financial Services, PwC Swaziland
+268 2404 3143
Clive Mukondiwa
Financial Services, PwC Zimbabwe
+263 43 383 628
Gabriel Ukpeh
Financial Services, PwC Nigeria
+234 (802) 778 4967
Richard Njoroge
Financial Services, PwC Kenya
+254 (20) 2855604
Contacts

PwC | 99

100 | Shaping the Bank of the Future
©2013. PricewaterhouseCoopers (“PwC”), the South African firm. All rights reserved. In this document, “PwC” refers to PricewaterhouseCoopers in South Africa, which is a member firm of PricewaterhouseCoopers International Limited (PwCIL), each member firm of which is a separate legal entity and does not act as an agent of PwCIL. (13-13259)