Embed Size (px)
Citation preview

Shaping demands to achieve corporate financial objectives
OAUG – Collaborate, 08. Denver
Patrick WilliamsOracle Corporation
Srini SubramanianInspirage, LLC
Agenda
This presentation is intended to review• Challenges in the current business environment• Importance of demand shaping• Demand shaping activities• Use cases and sample product capabilities• Summary
•

Industry Challenges
• Stock outs & non- availability
• Customer Switching• Excessive inventory• Promotion’s
negative ROI• Loss of revenue• NPI failure
Long manufacturing
lead times
Promotions/Deals fluctuate demand
Poor collaboration between sales, marketing, demand
mgmt., operations, and with customers
Product variations to meet different geographical and legal requirements
Extreme product segmentation
Shorter product lifecycles
High inventory costs
Frequent new product introductions
Proper Demand Management and Sales and Operations
Planning helps companies solve these challenges and increase
profitable revenue growth.

Typical ChallengesShorter Product Lifecycles• Frequent new product introductions putting increased burden on operations• Shorter life span of the product making it difficult to forecastExtreme Product Segmentation• Extreme segmentation of the product by color and aesthetic attributes to
meet various demographic needs causing stock-outs or excess inventory of certain products.
• Product variations to meet different geographical and legal requirements. For example, manuals, labeling and software to meet various language needs.
Disconnected sales and operations• Lack of integration between sales/marketing and operations• Planning and review process is extremely manual and time consuming Inferior business processes and systems• Manual processes, low visibility in a globalized business climate• Multiple non integrated local systems
•

What are the implications?Impact to customer service levels• Stock outs due to insufficient forecast can cause customers to switch
suppliers or be dissatisfied• Reduced pricing power; affecting the marginsImproper capital allocation• Forecast created for the wrong product could cause your supply chain to be
over-driven resulting in excess inventory• Impact to resources such as capital, space, production resources, etc.• Lost opportunity to sell your products and increase revenue and profitsInability to react to changing market conditions• If changing market conditions are not turned into advantage, profitability
may suffer• Competitors may gainUnmet expectations• All of the above could result in unmet corporate expectations and decline in
shareholder value
•

Importance of demand shaping

How ‘shaping demand’ can help
• Proactive approach to demand management• Makes your supply chain demand driven• Improved profitability due to proper prioritization of
demands, building right products at the right time• Promotes collaboration amongst all stakeholders• Supports replenishment system with immediate
visibility to changing needs

Traditional Supply Chains
DemandDemand SupplySupply
Product
Traditional Definition of
Supply Chain Management
customersupplier
designpartner Source: AMR Research

Technology Opportunities
Supply Risk
Management
Demand Insights
Product
Demand Supply
Demand-driven Processes
Drive a Profitable Demand
Response
Sense Demand
Source: AMR Research
•Proactive approach to demand management•Makes your supply chain demand driven•Improved profitability due proper prioritization of demands, building right products at the right time•Promotes collaboration amongst all stakeholders•Supports replenishment system with immediate visibility to changing needs
Shape Demand

Demand shaping
Shaping demands at the heart of a Demand Driven Supply Network (DDSN)
What is “Shaping Demands”?• Shaping demands can be defined as aligning your forecast to reality by
taking all possible variables into consideration. For example:Strategic predictive forecasting• Collaborate with stakeholders• Historical demand patterns• Managing new product introductions• Discounts and promotions• Trade promotion and promotion optimizationOperational planning to satisfy demands• Sales and operations planning• Supply planning based on global forecasts• Supply positioning
•

Strategic Predictive Forecasting
Collaboration• Collaborate to incorporate inputs from different stake-holders in the
organization – such as marketing/sales/Operations• Forecast at the appropriate level of aggregation. For example, there may not
be enough information for forecast at an individual item/location combinationHistorical demand patterns• Seasonality and Trends• Shape Modeling• Causal FactorsManage new product introductions• New item / store introductions• Lifecycle / supersession / Product phase-in and phase-outsDiscounts and promotion optimization• Effect of discounts and promotions• Promotion optimization
•

Operational Planning
Tolerance along time and organization dimensions for fulfilling demands• Global forecasting and consumption• Automatically sourcing forecasts to appropriate organizations that fulfill
demandsSales and Operations Planning• Review current demand fulfillment• Consider constrained supply• Re-prioritize demandsSupply Positioning• Consider forecast accuracy measures to determine inventory levels• Postponement optimization
•

Use cases to shape demands

Scenario#1: A consumer electronics manufacturer’s predicament
Popular line of mobile devices works with multiple technologies, caters to multiple demographics, sells through out the world.
What is needed to effectively manage the forecasts of a wide variety of related products?
• Collaborate between various account owners and regional and global managers to arrive at a consensus:
I. Send/receive information between stakeholders back and forthII. Manage by exception
• Ability to take forecasts entered at higher level and disaggregate them to appropriate lower level SKUs, while considering the following:
I. Historical distributionII. Order BacklogIII. Any additional weights specified
•

Workflow enabled collaborationWhy collaboration capabilities are important?• It is extremely critical to bring sales, operations, finance and marketing to
agreement on a single forecast number.• A platform that enables collaboration between these stakeholders will result
in a better aligned corporation marching towards a common goal.Ability to easily tailor process flows that is custom to each business• Web based workflow development tool allows creating new workflows and
modifying canned workflows easy.• For example, you can have a workflow that enables collaboration between
account manager, regional manager and country manager before finalizing the forecast.
Process to define and handle exceptions• Create workflows to handle exception events such as over/under forecasting
and remediation plansWorkflows to integrate external systems• Facilitate integrating external systems’ data through workflows• For example, allocate around intersections that have sales orders
•

Workflow enabled collaboration between stakeholders
•

Disaggregating higher level entries to lower level SKU/Location
Why is this important?• If the forecast quantities end up entered for the wrong products/locations, it
could result in overconsumption and hence result in excess inventory• Can be mitigated with robust disaggregation mechanismsDemantra supports multiple disaggregation schemes• Proportional – where the allocation logic is based on another series• Proport Mechanism to control disaggregation during analytical engine runsProportional • When a “series” is defined, modelers have the ability to define the allocation
to be based on another series.• The basis series could be computed based on a business specific logic or
could be collected data series such as order history and backlog.Custom Methods • Define custom methods that can be invoked for any special allocation logic.• For example, allocate around intersections that have sales orders
•

Disaggregating higher level entries to lower level SKU/Location
•

“Expressions” to facilitate numerical calculations / quick review
Server Expressions• These are expressions that uses database grouping functions such as
average, sum, etc.• For example, you could have an expression that computes the average selling
price at the category level and determine profitability.Client Expressions• These are expressions that enable using mathematical formulas and if-then-
else statements using different series data.• For example, you could have an expressions that makes the forecast equal to
or above the sales order quantity for any given combination.Color expressions• These are expressions that color code the cell based on conditionality.• For example, you could color all cells red when the forecast variance is above
a certain percentage.
•

Expressions / Color Coding
•

Scenario#2: A manufacturer of construction equipment
The business is growing but also depends on continued economic indicators. Seasonal business with the type of equipment sold depending on the weather patterns.
What is needed to accurately forecast considering all the factors that affect the business?
• Ability to consider the historical trends and seasonality to predict forecast.I. Sophisticated algorithmII. Ability to tune the forecasts
• Mimic trends occurred in the past I. Ramp up / Ramp down
• Consider all the causals that influence the forecast one way or the otherI. Global causal factorsII. Local causal factors
•

Demantra’s Statistical Forecasting Capabilities
• Bayesian-Markov algorithm uses a mixed model that is better than best-fit approaches.
• Unlimited dimensions and hierarchies
• Forecast tree uses hierarchy to determine the best levels to forecast
– For example, start at the lowest levels in the hierarchy and then move up one step at a time.
• Attribute based forecasting capabilities
• Nodal tuning capabilities• Advanced reporting capabilities
such as graphs, charts, various summarization capabilities.
•
Causal Analysis
Outlier Detection
Promotion Events
Seasonality
Cyclical Patterns
Trend
Historical data
Bayesian Estimator
Forecast
Multiple causal factors
Combined model
Bayesian Optimizer

Shape Modeling
Activity based shape modeling• Demantra captures the profile of historical demand over a period of time• Apply shapes scaled for volume and time to future forecasts• Alignment of future forecasts shape dictated by Quantity Alignment
Duration specified in another series• Supported in Demand Planning mode and Promotion Effectiveness modePromotion Shape Modeling• Similar to Activity based shape modeling but in addition considers
promotion attributes• Available only in PE modeShape modeling applicable only when there is continuous stream of
demand data
•

Activity Based Shape Modeling
•

Causal Factors
• Global Factors– Model global causal factors that apply
to all products and locations– For example, holidays such as
Thanksgiving and Christmas, seasons, etc
• Local Factors– Local causal factors apply to a specific
product and location– For example, a snow plough is more
likely to sell more during snowy season in the North-East than in Arizona.
• Improved forecast accuracy as a result of better incorporation of the causals.
•

Scenario#3: A retailer on an aggressive growth trajectory
10 – 20 new stores being opened every year. New products being introduced in existing stores.
New products and stores don’t have any history. How do they predict demand for their new locations and products? How to effectively promote a product and provide incentives to push slow moving products?
• Member managementI. Introduce new productsII. Introduce new stores
• ChainingI. Copy history of like stores/like products for new stores and products
respectivelyII. Life cycle and super-cession
•

Member Management• New Products Introduction
– All “combinations” are stored at lowest levels
– Most members have “combinations” with sales data and hence enabled for forecasting
– For introducing new, use tools such as Member Management to enable them for forecasting
– Create a new member at any aggregation level in the product hierarchy – but typically lowest level members
• Link new products to Locations– Link a new product to a location or an
existing product to a new location– Create combinations of
product/locations
• Dummy history creation– Insert dummy historical records– Enables viewing combinations in
worksheets
•

ChainingForecasting new product / stores• Chaining is the process of copying series data from one set of combinations to
new set of combinations.• If you have new product/location combinations, use chaining to create history so
Demantra can generate forecast.Item Similarity• For example, you created new store X which sells same items as existing store Y• Chaining creates all the relevant item combinations for new store X based on YLocation Similarity• For example, you created a new item B which is similar to item A and sold in all
locations• Chaining creates all relevant location combinations for B based on AProport Mechanisms• Multiple proportionality options exist for disaggregating to new combinations –
such as Target, Source, Equal and Similar
•

Scenario#4: A global telecommunications equipment manufacturer shipping products from many facilities
Forecasting by a specific “ship-from” organization can lead to over/under driving the supply chain.
Company needs the ability to forecast at a global level and let the operations determine the right source at fulfillment time.
• Global ForecastingI. Consumption by different levels in Location/Item hierarchyII. Dynamic sourcing of the forecast to appropriate fulfillment centers
• Consumption tolerance along time dimensionI. Backward and Forward daysII. Consume within time bucket
•
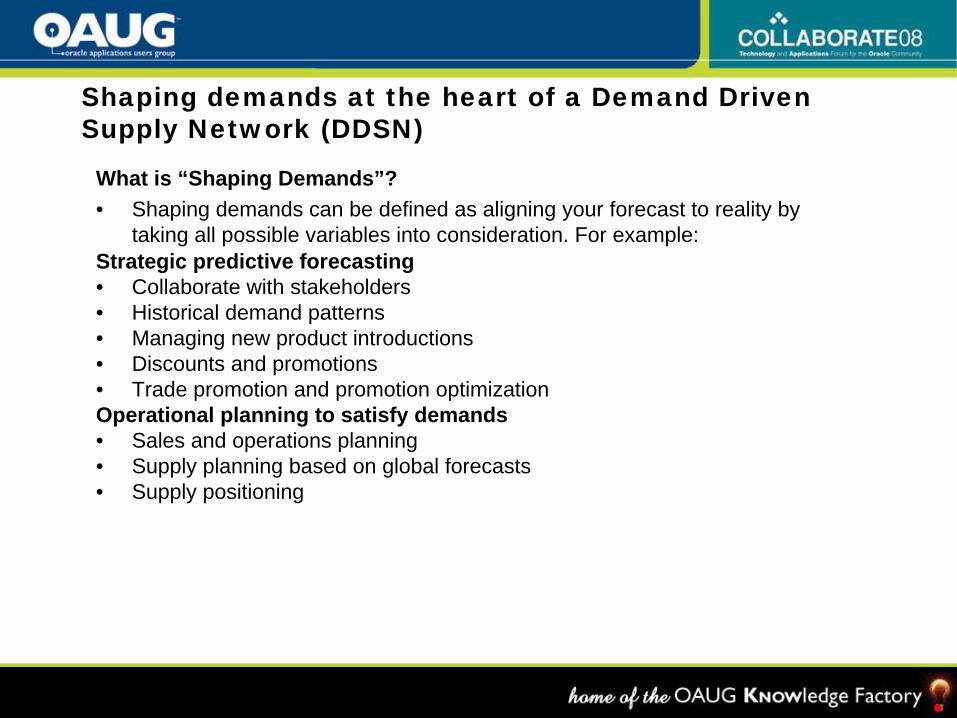
Global Forecasting – Publish from Demantra, Consume and Distribute within ASCP
• Publish forecast from Demantra to ASCP without the context of an Organization
– Define sourcing rules to distribute the forecast to appropriate fulfillment centers based on regions/category/Item and Instance.
– ASCP utilizes the sourcing rules to distribute the remaining forecast after consumption.
• Consumption at multiple levels in location hierarchy
– Zone / Region– Ship to Location
• Consumption by multiple levels in Item hierarchy
– Item– Demand Class
•

Consumption tolerance along time dimensions
• Backward Days– First look for the forecast on the day of
the sales order.– Then days backwards from sales order
date the forecast should be consumed.
• Forward Days– After scanning backwards, scan forward
to look for forecast to consume.
• Consume within time bucket– For non-daily buckets, force the
consumption of the forecast only within that bucket and not allow spanning backwards and forwards.
• Criticality of consumption– If the forecasts are not consumed
properly, supply chain will be overdriven causing excess inventory
– All these different options can be taken advantage to shape forecast demands to align with reality.
•

Summary

Shaping demands to achieve financial objectives
Start with the corporate objectives• Identify and prioritize corporate objectives• For example, improve forecast accuracy by 10% or reduce stock-outs of certain
product line, etc.Drill down to specifics• Determine what is needed to accomplish the objectives• For example, better collaboration among stakeholders or improved statistical
forecasting capability, etc.Map the software functionality to meet specific requirements• Demantra is a suite of products within larger APS umbrella with many
components and overlapping features• Identify the specific features that meet your needs• Then choose the components that provide those featuresLayout an incremental rollout plan• Start with the quick wins• Expand the footprint with minimal change management impact
•

Journey….
•
••OrchestrateOrchestrate
••CollaborateCollaborate
••AnticipateAnticipate
••ReactReact •Lean. Understand demand:• sources, quality, variability
•Supply chain visibility,•manufacturing as SN node
•S&OP that works
•Customer scorecards and•Value chain level
•performance metrics
•Sense, shape and drive a •profitable demand response
•Call to action•The burning
•platform

Call to Action
Simple questions to determine the call to action…..
• Do you know what your forecast accuracy is?• How much more profits will be added by improving your forecast
accuracy by 5%?• Are your financial metrics better than your industry average?• Do your internal teams such as sales, marketing, operations and finance
talk to each other on customer wins, losses, financial targets, promotions, etc?
• Do you arrive at a single forecast that all stakeholders agree upon?• Can your IT systems/processes facilitate quickly reacting to changes in
supply or demand picture? For example, provide ability to execute daily/weekly planning cycles.
•


![Shaping Low-Density Lattice Codes Using Voronoi Integerskurkoski/presentations/Ferdinand-itw14.pdf · Lattice codes can achieve the capacity of AWGN channel [Erez and Zamir ’04]](https://img.pdfslide.us/doc/110x75/6022db6ad45e96320b67a73e/shaping-low-density-lattice-codes-using-voronoi-kurkoskipresentationsferdinand-itw14pdf.jpg)