Embed Size (px)
Citation preview

0162-8828 (c) 2015 IEEE. Personal use is permitted, but republication/redistribution requires IEEE permission. See http://www.ieee.org/publications_standards/publications/rights/index.html for moreinformation.
This article has been accepted for publication in a future issue of this journal, but has not been fully edited. Content may change prior to final publication. Citation information: DOI10.1109/TPAMI.2016.2533388, IEEE Transactions on Pattern Analysis and Machine Intelligence
1
Shape Distributions of Nonlinear DynamicalSystems for Video-based Inference
Vinay Venkataraman, Student Member, IEEE , and Pavan Turaga, Senior Member, IEEE
Abstract—This paper presents a shape-theoretic framework for dynamical analysis of nonlinear dynamical systems whichappear frequently in several video-based inference tasks. Traditional approaches to dynamical modeling have included linearand nonlinear methods with their respective drawbacks. A novel approach we propose is the use of descriptors of the shape ofthe dynamical attractor as a feature representation of nature of dynamics. The proposed framework has two main advantagesover traditional approaches: a) representation of the dynamical system is derived directly from the observational data, without anyinherent assumptions, and b) the proposed features show stability under different time-series lengths where traditional dynamicalinvariants fail. We illustrate our idea using nonlinear dynamical models such as Lorenz and Rossler systems, where our featurerepresentations (shape distribution) support our hypothesis that the local shape of the reconstructed phase space can be used asa discriminative feature. Our experimental analyses on these models also indicate that the proposed framework show stability fordifferent time-series lengths, which is useful when the available number of samples are small/variable. The specific applicationsof interest in this paper are: 1) activity recognition using motion capture and RGBD sensors, 2) activity quality assessment forapplications in stroke rehabilitation, and 3) dynamical scene classification. We provide experimental validation through action andgesture recognition experiments on motion capture and Kinect datasets. In all these scenarios, we show experimental evidenceof the favorable properties of the proposed representation.
Index Terms—Action modeling, largest Lyapunov exponent, chaos theory, shape distribution, action and gesture recognition,movement quality assessment, dynamical scene analysis.
F
1 INTRODUCTION
D YNAMICAL modeling methods for understand-ing signals from various sensing platforms have
been the cornerstone of many applications in thecomputer vision community, such as human activityanalysis [1] and dynamical natural scene recognition[2]. Recent advances in sensing platforms like mo-tion capture systems and the Kinect have openeddoors to several applications including home-basedhealth monitoring, gaming and entertainment. Takefor instance the task of developing algorithms forunderstanding the dynamics in human activities. Thisproblem is non-trivial due to the complexity of naturalhuman movement, which is a result of interactionsbetween multiple body joints having high degreesof freedom. In addition, the task of recognizing hu-man actions is challenging due to several factorsincluding inter-class similarities between actions (e.g.,running and walking), intra-class variations due tomultiple strategies for an action (e.g., dance) andinter-subject variations. Natural human movements(such as walking, running) are composed of periodicaction sequences in the form of repetitions, with somevariability [3]. These inherent attributes of human
• V. Venkataraman and P. Turaga are with the School of Electrical,Computer and Energy Engineering and School of Arts, Media andEngineering, Arizona State University, Tempe, USA.
E-mail: [email protected] and [email protected]
movement (periodicity with variability) have moti-vated researchers to employ tools from nonlinear dy-namical systems theory to model human movement[3], [4], [5], [6], [7], [8], [9]. Dynamical modelingof spatio-temporal evolution of human activities aretraditionally accomplished by defining a state spaceand learning a function that maps the current stateto the next state [10], [11]. A recent alternate ap-proach has attempted to derive a representation forthe dynamical system directly from the observationdata using tools from chaos theory [4]. The main ideahere is that, by using a top-down approach of dynam-ical modeling, one would only approximate the true-dynamics of the system with attempts to fit a modelto the observational data. Whereas, in the bottom-up approach [4], the dynamical system parameterssuch as the number of independent variables, degreesof freedom and other unknown parameters are esti-mated from the data. Such an approach can be seenas a generalized representation without any strongassumptions, suitable for analyzing a wide range ofdynamical phenomenon.
2 RELATED WORK
Several approaches have been proposed in literaturefor modeling the dynamics underlying an observedtime-series and we review the prior work in the spe-cific applications of interest in a) activity recognition,b) activity quality assessment, and c) natural scenerecognition.

0162-8828 (c) 2015 IEEE. Personal use is permitted, but republication/redistribution requires IEEE permission. See http://www.ieee.org/publications_standards/publications/rights/index.html for moreinformation.
This article has been accepted for publication in a future issue of this journal, but has not been fully edited. Content may change prior to final publication. Citation information: DOI10.1109/TPAMI.2016.2533388, IEEE Transactions on Pattern Analysis and Machine Intelligence
2
2.1 Classical Dynamical InvariantsThe largest Lyapunov exponent is a widely useddynamical invariant (measure of chaos), which quan-tifies the rate of divergence of initially closely-spacedtrajectories [2], [4]. A practical method for estimat-ing the largest Lyapunov exponent from an observa-tional time-series was first proposed by Wolf et al.[12]. Several other approaches were also proposedin literature to quantify chaos [13], [14], [15], whichwere found to suffer from at least one of the fol-lowing drawbacks: (a) unreliable for small datasets,(b) computationally intensive, (c) relatively difficult toimplement [16]. An improved method for estimationof the largest Lyapunov exponent to overcome theabove mentioned drawbacks was later proposed byRosenstein et al. [16]. However, experimental resultson nonlinear dynamical models have shown that thesuggested number of data samples for accurate es-timation of the largest Lyapunov exponent is 10m
(where m is the embedding dimension) [16], [17].In recent years, these methods have been applied tomodel various visual dynamical phenomenon suchas video-based recognition of human activities [4] aswell as recognition of dynamical scenes [2]. However,when one needs to make inferences from short videos,or for instance when the activity of interest lastsonly a few seconds, the classical approaches havesignificant drawbacks. While quantification of chaosusing the largest Lyapunov exponent have been usedto monitor varying chaos levels (level of complexityof the system) for recognition or prediction purposes[18], experimental studies for modeling human ac-tivities have not reported any evidence for differentlevels of chaos in human activities. Hence, we believethat a representation for level of chaos may not bea suitable approach to model human activities. Inthis paper, we propose an alternative approach tomodel human activities by extracting dynamical fea-tures representative of the shape of the reconstructedphase space instead of quantifying chaos. We alsodemonstrate through experiments that the frameworkfor estimation of dynamical features show stabilityacross different time-series lengths and compare theperformance with traditional chaotic invariants.
2.2 Activity RecognitionHuman activity analysis has attracted the attentionof many researchers resulting in extensive literatureon the subject. A detailed review of the approachesin literature for modeling and recognition of humanactivities are discussed in [1], [19]. Since our presentwork is related to non-parametric approaches fordynamical system analysis for action modeling, werestrict our discussion to related methods.
Human actions have been modeled using dynam-ical system theory in computer vision [4], [11] andbiomechanics [3], [6]. Differential equations can be
used to model such a system, which requires ac-cess to all independent variables of the system. Thisapproach would facilitate an understanding of thesystem behavior and also allow for the prediction offuture states using present and past state information.However, this is not realizable in practice, as it isextremely hard to determine the independent vari-ables and the interactions governing the dynamics ofhuman actions.
Dynamical modeling of human actions can bebroadly categorized into parametric and nonparamet-ric methods. Furthermore, human actions have beenmodeled with the assumption that the underlyingdynamical system is linear [11] or nonlinear [4], [10].In parametric modeling approaches, the dynamics ofa system is represented by imposing a model andlearning the model parameters from training data.Hidden Markov Models (HMMs) [20] and LinearDynamical Systems (LDSs) [21] are the most popularparametric modeling approaches employed for actionrecognition [22], [23], [24] and gait analysis [11], [25],[26]. Nonlinear parametric modeling approaches suchas Switching Linear Dynamical Systems (SLDSs) havebeen utilized to model complex activities composedof sequences of short segments modeled by LDS [27].While nonlinear approaches can provide a more accu-rate model, it is difficult to precisely learn the modelparameters. In addition, one would only approximatethe true-dynamics of the system with attempts tofit a model to the experimental data. An alternativenonparametric action modeling approach is based ontools from chaos theory, with no assumptions onthe underlying dynamical system. Traditional chaoticmeasures, like the largest Lyapunov exponent, corre-lation dimension and correlation integral, have beenextensively used to model human actions [3], [4],[6]. However, [16] and [17] have shown that thesenonlinear dynamical measures need large amounts ofdata to produce stable results (10m, where m is theembedding dimension). Junejo et al. [5] used a self-similarity matrix, a graphical representation of distinctrecurrent behavior of nonlinear dynamical systems,to learn an action descriptor. In this paper, throughillustrative examples and experimental validation, weshow that our framework works more robustly thantraditional chaotic invariants for action modeling.
2.3 Activity Quality for Rehabilitation
Recently researchers from various backgrounds haveshown interest in the development of computationalframeworks for quantification of quality of movement,for possible applications in health monitoring andrehabilitation [3], [17], [28], [29]. Stroke being themost common neurological disorder, leaves millionsdisabled every year who are unable to undergo long-term therapy treatment due to insufficient coverage byinsurance. Recent directions in rehabilitation research

0162-8828 (c) 2015 IEEE. Personal use is permitted, but republication/redistribution requires IEEE permission. See http://www.ieee.org/publications_standards/publications/rights/index.html for moreinformation.
This article has been accepted for publication in a future issue of this journal, but has not been fully edited. Content may change prior to final publication. Citation information: DOI10.1109/TPAMI.2016.2533388, IEEE Transactions on Pattern Analysis and Machine Intelligence
3
have been towards development of portable systemsfor therapy. Traditional quantitative scales such as theFugl Meyer Test [30] and the Wolf Motor Function Test(WMFT) [31], have proven to be effective in evaluatingmovement quality. However, these approaches in-volve visual monitoring which would greatly benefitfrom the development of an objective computationalframework for movement quality assessment. The aimhere is to develop standardized methods to describethe level of impairment across subjects.
The focus of existing approaches for movementquality assessment has been towards finding typicalpatterns in kinematics which differ between healthyand impaired subjects. While these approaches aresuccessful in giving an insight into understandinghuman movement, they fail to utilize the inherentdynamical nature of the movement. Rehabilitationtherapies are composed of repetitive movements (e.g.,reach to a target) that are strongly periodic with in-herent variability. Traditional methods have assumedthat this variability arises from noise in the system.However, it is evident that variability is an integralpart of repetitive movements due to the availabilityof multiple strategies for the movement. Also, it isbelieved that variability produced in human move-ment is a result of nonlinear interactions and havedeterministic origin [3]. Extensive research has beencarried out to model this variability using nonlineardynamical system theory [3], [6]. In this paper, weutilize the action modeling framework for movementquality assessment using a single wrist marker. Weshow the utility of the proposed action modelingframework for quantifying the quality of reachingtasks using a single marker on the wrist, and obtaincomparable results to a heavy marker-based setup (14markers placed on arm, shoulder and torso [28]).
2.4 Natural Scene Classification
Natural scene classification has been an active areaof research in computer vision with applications inautomated image and video understanding. Muchresearch has been focused around scene classificationusing single still images [32], [33], thereby neglectingdynamical motion information available in videos. Re-cently, the problem of dynamical modeling of naturalscenes was introduced by Shroff et al. [2] who utilizedtools from chaos theory along with GIST [34], [35] tomodel the spatio-temporal evolution in natural scenesin an unconstrained setting.
Dynamic texture representation using LDS pro-posed by Soatto et al. has been used to recognizeand synthesize dynamic textures such as sea-waves,smoke, traffic [36], [37]. Such low-dimensional modelshave been used to capture complex natural phenom-ena. However, experimental results reported in [2]show that these simple models might not be effectivefor dynamic scene classification in an unconstrained
setting. Shroff et al. utilized traditional chaotic in-variants to model the dynamics and have shownthat dynamical attributes augmented with spatial at-tributes (GIST [35]) can be effectively used for cate-gorization of dynamic scenes [2]. Another recent ap-proach utilized spatio-temporal oriented energy filtersfor dynamic natural scene classification [38]. In thispaper, we test the generality of the proposed actionmodeling framework for dynamic scene classificationapplication.
Contributions: In this paper, we present a compu-tational framework for analysis of dynamical systemsby combining the theoretical concepts of dynamicalsystem analysis and ideas in shape theory. We ex-tract dynamical shape features from the reconstructedphase space in the form of shape distributions toachieve improved results. We show the utility of theproposed framework in action and gesture recogni-tion, movement quality assessment, and dynamicalscene recognition and evaluate the performance bycomparing it with traditional chaotic invariants. Wealso propose two new shape functions to encodelocal dynamical evolution as opposed to global shapefunctions proposed by Osada et al. [39].
3 PRELIMINARIES
In this section, we introduce the background neces-sary to develop an understanding of nonlinear dy-namical system analysis and chaos theory for appli-cations in activity analysis, activity quality assessmentand natural scene analysis.
3.1 Dynamical System AnalysisDynamical systems are governed by a set of functionsdefining the variations in the behavior of the systemover time. A dynamical system is termed linear ornonlinear if the function defining the behavior of thesystem is linear or nonlinear respectively. Dynami-cal systems can be represented using state variablesdefining the state of the system at a given time t.A dynamical system is termed deterministic if thereexists a unique future state for a given current stateand is termed stochastic if the future state is de-rived from a probability distribution of possible states.Chaos theory is the field of study of such deterministicdynamical systems that show high sensitivity to initialconditions. A chaotic system is a dynamical systemwith deterministic behavior showing sensitivity toinitial conditions.
The states of a chaotic system are generally consid-ered to be in an n-dimensional manifold also calledphase space. A chaotic system evolves over time inits phase space according to the system variablesgoverning the dynamics. The path traversed by thesystem over time is called a trajectory and the regionof the phase space where the trajectories settle downas time approaches infinity is denoted as an attractor.

0162-8828 (c) 2015 IEEE. Personal use is permitted, but republication/redistribution requires IEEE permission. See http://www.ieee.org/publications_standards/publications/rights/index.html for moreinformation.
This article has been accepted for publication in a future issue of this journal, but has not been fully edited. Content may change prior to final publication. Citation information: DOI10.1109/TPAMI.2016.2533388, IEEE Transactions on Pattern Analysis and Machine Intelligence
4
−20−10
010
2030
−40
−20
0
20
20
40
60
80
x(t)y(t)
z(t)
(a) Lorenz attractor
0 20 40 60 80 100−30
−20
−10
0
10
20
30
40
time
x(t)
(b) One-dimensional time seriesof Lorenz attractor (x(t))
−30 −20 −10 0 10 20 30−50
050
−40
−20
0
20
40
x(t+τ)x(t)
x(t+
2τ)
(c) Reconstructed phase space by de-lay embedding
Fig. 1: Phase space reconstruction of Lorenz attractor by delay embedding. (a) shows the 3D view of trajectories of Lorenzattractor with control parameters ρ = 45.92, σ = 16.0 and β = 4.0. We can see that trajectories of Lorenz system settle downand are confined within the attractor. The one-dimensional time series (observed) of the Lorenz system is shown in (b). Wesee that a low-dimensional nonlinear system can generate such complex and chaotic signal. (c) shows the reconstructedphase space from observed time series of the Lorenz system using delay embedding (τ = 11). The above example illustratesthat the reconstructed phase space preserves certain topological properties of the original Lorenz attractor.
One would need to have access to all independentvariables of the system and their interactions for acomplete understanding of the system. In a real worldscenario, the data recorded is of low-dimension andis insufficient to model the dynamics of the system. Inaddition, model-based (parametric) approaches, suchas LDS assume an underlying mapping function fto describe the dynamics of the system. It has beenestablished that such approaches may not be suitablefor modeling the dynamics of complex systems suchas human movements due to the simplifying as-sumptions [40]. The theory of chaotic systems allowsfor determining certain invariants of the dynamicalsystem function f without making any assumptionsabout the system.
3.2 Phase Space ReconstructionThe phase space is defined as the space with all possiblestates of a system [41], [42]. In a deterministic dy-namical system that can be mathematically modeled,future states of the system can be determined usingpresent and past state information. However, for ap-plications such as human activity understanding anddynamical scene understanding, the system equationsare complex. Furthermore, sensing systems in the real-world do not allow us to observe all variables ofthe system (e.g., the home-based setting for strokerehabilitation with single marker on the wrist). Toaddress these problems, we have to employ methodsfor reconstructing the attractor to obtain a phase spacewhich preserves the important topological propertiesof the original dynamical system. This process isrequired to find the mapping function between theone-dimensional observed time series and the m-dimensional attractor, with the assumption that allvariables of the system influence one another. Theconcept of phase space reconstruction was expoundedin the embedding theorem proposed by Takens, calledTakens’ embedding theorem [43] and an exampleof the procedure is shown in Fig. 1. For a discretedynamical system with a multidimensional phasespace, time-delay vectors (or embedding vectors) are
obtained by concatenation of time-delayed samplesgiven by
xi(n) = [xi(n), xi(n+ τ), · · · , xi(n+ (m− 1)τ)]T , (1)
where ‘m’ is the embedding dimension and ‘τ ’ isthe embedding delay. These parameters should becarefully selected in order to facilitate a good phasespace reconstruction. For a sufficiently large ‘m’, theimportant topological properties of the unknown mul-tidimensional system are reproduced in the recon-structed phase space [42]. The embedding method hasproven to be useful, particularly for time series gen-erated from low-dimensional deterministic dynamicalsystems, by providing a way to apply theoreticalconcepts of nonlinear dynamical systems onto ob-served time series. The embedding theorem does notsuggest methods to estimate the optimal values for‘m’ and ‘τ ’. We use the false nearest neighbors [44]approach to estimate m and the first zero crossing ofthe autocorrelation function [45] to estimate τ . Fig. 1shows an example of phase space reconstruction froma one-dimensional observed time-series of a Lorenzsystem.
3.3 Embedding Dimension
The embedding dimension refers to the number oftime-delayed samples concatenated to form the time-delay vector (see (1)). The aim here is to estimatean integer embedding dimension which can unfoldthe attractor thereby removing any self-overlaps dueto projection of the attractor onto lower dimensionalspace. Hence, the embedding dimension can be de-fined as the minimum dimension required to unfoldthe attractor completely. The false nearest neighborapproach finds this minimum embedding dimensionto remove any false nearest neighbors (neighbors dueto projection onto lower dimension) [42]. Consider avector in reconstructed phase space in m dimensionsgiven by
x(k) = [x(k), x(k + τ), · · · , x(k + (m− 1)τ)]T , (2a)
0162-8828 (c) 2015 IEEE. Personal use is permitted, but republication/redistribution requires IEEE permission. See http://www.ieee.org/publications_standards/publications/rights/index.html for moreinformation.
This article has been accepted for publication in a future issue of this journal, but has not been fully edited. Content may change prior to final publication. Citation information: DOI10.1109/TPAMI.2016.2533388, IEEE Transactions on Pattern Analysis and Machine Intelligence
5
and a nearest neighbor in the phase space given by
xNN (k) = [xNN (k), xNN (k+τ), · · · , xNN (k+(m−1)τ)]T . (2b)
If the vector xNN (k) is a true neighbor of x(k), thenit should be because of the underlying dynamics.The vector xNN (k) can be a false neighbor of x(k)when dimension m is unable to unfold the attractor.Hence, moving to the next dimension m + 1 maymove this false neighbor out of the neighborhoodof x(k). This process of finding false neighbors ofevery vector xi(k) sequentially removes self-overlapsand identifies m where the attractor is completelyunfolded. The embedding dimension m suggestedby the false nearest neighbor algorithm for exemplartrajectories of human actions was either 3 or 4. Weselect a constant embedding dimension m = 3 toreconstruct all relevant phase space. Even with thisfixed value of m, we obtain excellent results as shownin our experiments.
3.4 Embedding DelayEmbedding delay refers to the choice of integer timedelay used to construct the time-delay vector. Theo-retically, the embedding process allows any value ofτ if one has access to infinitely accurate data [42].Since this is practically impossible, we try to find avalue τ which makes the components of the vector[x(k), x(k + τ), x(k + 2τ)]T in the embedding suffi-ciently independent. A low value of τ makes adjacentcomponents to be correlated and hence they cannotbe considered as independent variables. On the otherhand, a high value of τ may make the adjacent compo-nents uncorrelated (almost independent) and cannotbe considered as part of the system that supposedlygenerated them. The shape of the embedded timeseries will critically depend on the choice of τ [45].A good selection of τ should ensure that the data aremaximally spread in phase space resulting in smoothphase space reconstruction. We use the first zero-crossing of the autocorrelation function as an estimateof τ as suggested in [45] for strongly periodic data,which is a suitable choice for our experiments.
3.5 Phase Space Reconstruction of the LorenzAttractorThe Lorenz attractor is the steady state of a nonlinearchaotic system of three coupled nonlinear ordinarydifferential equations [46] as given below:
x = σ(y − x), (3a)
y = x(ρ− z)− y, (3b)
z = xy − βz, (3c)
where x, y, z are the state variables and σ, ρ andβ are non-negative and dimensionless parameters.These equations were defined by Lorenz in 1963 [41]
to represent a simplified model of thermal convectionin the lower atmosphere. Lorenz showed that thisrelatively simple-looking set of equations could havehighly erratic dynamics for a range of defined controlparameters, for which the dynamics are chaotic. Thedynamics of the Lorenz system in the 3-dimensionalstate space generated from these set of equations isillustrated in Fig. 1(a). Lorenz attractor also illustratesthat deterministic nonlinear models of low dimensioncan produce signal with complex dynamics. Further-more, Fig. 1 illustrates that it is possible to recreatean approximate attractor generated by a multidimen-sional system (such as Lorenz) using only a one-dimensional observed time series.
In the next section, we propose dynamical shapefeature extraction from reconstructed phase spacewhich is more suitable for action modeling than tra-ditional chaotic invariants. We also show the stabilityof the proposed dynamical shape features for differenttime-series lengths using nonlinear dynamical models(Lorenz and Rossler systems).
4 ATTRACTOR SHAPE DISTRIBUTIONS
In this section, we present a framework which com-bines the strong theoretical concepts of nonlineardynamical analysis and ideas in shape theory to ef-fectively represent the nature of dynamics. From Fig.2, we see that the ‘shape’ of the reconstructed phasespace can be seen as a discriminative feature for classi-fication between Run and Walk action classes. Hence,our aim will be to extract feature representationsfor the shape of the reconstructed phase space. It isimportant to note here that the process of phase spacereconstruction preserves certain topological propertiesand global shape is not a topological invariant, whilelocal shape properties are computed from samplesexpected to be relatively invariant. However, our goalhere is to suggest a shape-based descriptor (bothglobal and local) which possess sufficient discrimina-tory properties and robustness.
We consider the attractor as having its own char-acteristic shape in the high-dimensional phase space.Shape analysis of 3D surfaces is a well-studied prob-lem in the computer vision community. In [39], Osadaet al. present a method for finding a similarity measurebetween 3D shapes by computing shape distributionsof the 3D surface sampled from the shape functionby measuring their global geometric properties. Weuse the shape distribution of the reconstructed phasespace as the dynamical feature representation in ourexperiments. While the shape distributions was orig-inally proposed to measure similarity between 3Dshapes, we believe that shape distributions can beused as feature representations for any n-dimensionalphase space. In addition, it is said that any functioncan be used to extract the shape distribution [39], butwe adopt simpler shape functions based on geometric

0162-8828 (c) 2015 IEEE. Personal use is permitted, but republication/redistribution requires IEEE permission. See http://www.ieee.org/publications_standards/publications/rights/index.html for moreinformation.
This article has been accepted for publication in a future issue of this journal, but has not been fully edited. Content may change prior to final publication. Citation information: DOI10.1109/TPAMI.2016.2533388, IEEE Transactions on Pattern Analysis and Machine Intelligence
6
0 1 2 3 4 5−20
0
20
40
60
80
Time in sec
x(t)
(a) Time series data
−40−20
020
4060
−50
0
50−50
0
50
x(t)x(t+τ)
x(t+
2τ)
(b) Reconstructed Phase Space (c) Shape Distribution
0 1 2 3 4 5−20
0
20
40
60
80
Time in sec
x(t)
(d) Time series data
−40−20
020
4060
−50
0
50−50
0
50
100
x(t)x(t+τ)
x(t+
2τ)
(e) Reconstructed Phase Space (f) Shape Distribution
Fig. 2: Examples of phase space reconstruction of corresponding time series data of a subject performing Run and Walkaction respectively. The embedding parameters were selected as m = 3 and τ as described in section 3.4. This exampleillustrates that the shape of the reconstructed phase space can be seen as a discriminative feature for classification ofactions. We use shape distributions proposed by Osada et al. [39] as a representation for shape of phase space. (c) and (f)together support our hypothesis that shape distribution (D2) can be used for classification of actions.
properties (distance and area) which are listed below:(a) Global Shape Functions:
• D1: measures the distance between one fixedpoint and one random point sampled from thereconstructed phase space. The fixed point isselected as the centroid of the attractor.
• D2: measures the distance between two ran-dom points in the phase space represented as||xi − xj ||2.
• D3: measures the square root of the area of thetriangle formed by three random points on theattractor.
For example, the D2 shape function can be repre-sented as
D2ij = ||xi − xj ||2, (4)
where xi and xj are points (embedding vectors) in thereconstructed phase space. A set of these distances forrandomly chosen embedding vector pairs are com-puted. From this set, we construct a histogram bycounting the number of samples which fall into eachof B=50 fixed sized bins to obtain the attractor’s shapedistribution.
These shape functions encode global geometricproperties of the phase space, lacking informationabout local shape and dynamical evolution in thephase space. While previous investigation shows thatglobal geometric shape function (D2) performs suffi-ciently better than the traditional nonlinear dynamicalmeasures (largest Lyapunov exponent, correlation di-mension and correlation integral) [29], we hypothesizethat a shape function which encodes local geometryand dynamical evolution information of phase spaceshould improve the performance. In this direction, wepropose new shape functions defined as,(b) Local Shape Functions:
• DT1: It is similar to D2, with an additionalconstraint that the time separation between tworandom points in reconstructed phase space is≤ δ, thereby encoding only the local shape in-formation.
• DT2: encodes dynamical evolution of the phasespace by exponential weighting given by
DT2ij = e−γ|ti−tj | ∗ ||xi − xj ||2, (5)
where ti and tj are the time indexes of the ran-domly selected pair of embedding vectors in thereconstructed phase space. ‘δ’ and ‘γ’ are empir-ically determined parameters such that δ, γ ≥ 0.
Local vs Global: The main idea behind proposingthese local shape functions is that, a global shape func-tion would consider data samples from independentrepetitions (well separated in time) of a movement.Also, repetitive human movements (such as runningand walking) result in trajectories which wraps arounditself in reconstructed phase space, creating an artifactof having closely spaced trajectories in phase space.We believe that such an approach would not provide arobust feature representation, and we suggest the useof local shape functions instead which only considersdata samples close in time.
Metric on Shape Distributions: Several metricsexist in literature to calculate the distance between his-tograms including chi-squared statistic (χ2 distance),Bhattacharyya distance [47], Riemannian analysis [48]and Earth Mover’s Distance (EMD) [49]. In our exper-iments, we provide results using Euclidean distanceand chi-squared distance metrics for comparison dueto their simplicity.
4.1 Test on ModelsThe framework was tested on the Lorenz and Rosslermodels to determine whether the shape feature can

0162-8828 (c) 2015 IEEE. Personal use is permitted, but republication/redistribution requires IEEE permission. See http://www.ieee.org/publications_standards/publications/rights/index.html for moreinformation.
This article has been accepted for publication in a future issue of this journal, but has not been fully edited. Content may change prior to final publication. Citation information: DOI10.1109/TPAMI.2016.2533388, IEEE Transactions on Pattern Analysis and Machine Intelligence
7
−500
50 −500
50−50
0
50
x(t+τ)x(t)
x(t+
2τ)
−500
50 −500
50−50
0
50
x(t+τ)x(t)
x(t+
2τ)
−500
50 −500
50−50
0
50
x(t+τ)x(t)
x(t+
2τ)
−500
50 −500
50−50
0
50
x(t+τ)x(t)
x(t+
2τ)
−500
50 −500
50−50
0
50
x(t+τ)x(t)
x(t+
2τ)
Reconstructed phase space of Lorenz system for different time-series lengths
−20 0 20−20020
−20
0
20
x(t)x(t+τ)
x(t+
2τ)
−20 0 20−20020
−20
0
20
x(t)x(t+τ)
x(t+
2τ)
−20 0 20−20020
−20
0
20
x(t)x(t+τ)
x(t+
2τ)
−20 0 20−20020
−20
0
20
x(t)x(t+τ)
x(t+
2τ)
−20 0 20−20020
−20
0
20
x(t)x(t+τ)
x(t+
2τ)
Reconstructed phase space of Rossler system for different time-series lengths
−500
50
−500
50−50
0
50
x(t)x(t+τ)
x(t+
2τ)
−500
50
−500
50−50
0
50
x(t)x(t+τ)
x(t+
2τ)
−500
50
−500
50−50
0
50
x(t)x(t+τ)
x(t+
2τ)
−500
50
−500
50−50
0
50
x(t)x(t+τ)
x(t+
2τ)
−500
50
−500
50−50
0
50
x(t)x(t+τ)
x(t+
2τ)
Reconstructed phase space of Run action for different time-series lengths
Fig. 3: Illustration of the effect of time-series lengths on reconstructed phase space for nonlinear dynamical models likeLorenz and Rossler systems, and right-foot trajectory of a subject performing Run action. These examples clearly indicatethat the shape of the reconstructed phase space does not change with time-series length, motivating feature extractionrepresentative of the shape of the reconstructed phase space (as reported in Fig. 4).
5 10 15 20 25 30 35 40 45 50Bin
NL = 1000
NL = 2000
NL = 3000
NL = 4000
NL = 5000
NR
= 400N
R = 800
NR
= 1200N
R = 1600
NR
= 2000
(a) Shape distribution (D2) of reconstructedphase space for Lorenz (blue) and Rossler (red)models for different time-series length N (NL andNR represent time-series lengths of Lorenz andRossler systems respectively).
N = 100N = 200N = 300N = 400N = 500
(b) Shape distribution (D2) of reconstructedphase space from right-foot trajectory of a subjectperforming Run action for different time-serieslength.
Fig. 4: Illustration of stability of the dynamical shape distribution (D2) extracted from reconstructed phase space fordifferent time-series length. (a) shows the stability of D2 distribution on Lorenz and Rossler systems while studies havereported significant error in estimation of largest Lyapunov exponent on these models (refer TABLE 1). (b) depicts thestability of D2 distribution for trajectory data collected from right-foot of a subject performing Run action.
TABLE 1: Experimental results on Lorenz and Rossler mod-els for given embedding parameters (mL = 3, τL = 11,mR = 3, τR = 8) and different time-series lengths. The truevalue of λ1 for Lorenz and Rossler models are 1.50 and 0.09respectively [12].
System N Calculated λ1 % error
Lorenz
1000 1.751 16.72000 1.345 -10.33000 1.372 -8.54000 1.392 -7.25000 1.523 1.5
Rossler
400 0.0351 -61.0800 0.0655 -27.21200 0.0918 2.01600 0.0984 9.32000 0.0879 -2.3
be effectively used to classify differences in shape ofreconstructed phase space of nonlinear dynamical sys-tems. We compare the performance of the proposedframework with that of largest Lyapunov exponent.
The effect of time-series length on estimation of largestLyapunov exponent was studied by Rosenstein et al.[16], by evaluating the performance of the algorithmthey proposed for estimation of λ1 for various time-series lengths. The simulation results on Lorenz andRossler models are shown in TABLE 1. Their findingsindicate that the estimation error increases with re-duction in time-series length (N ). Fig. 3 depicts thevariations in reconstructed phase space for differenttime-series length with defined embedding param-eters. It is evident from these plots that the shapeof the reconstructed phase space remain sufficientlysimilar and can be used as a discriminative featurefor classification purposes. Also, from Fig. 4, the shapedistribution (using D2 shape function) was found tobe stable for different time-series lengths. This strikingability of our feature representations to be robust tochanges in data length will be useful in applicationsrelated to human activity analysis, where the signal
0162-8828 (c) 2015 IEEE. Personal use is permitted, but republication/redistribution requires IEEE permission. See http://www.ieee.org/publications_standards/publications/rights/index.html for moreinformation.
This article has been accepted for publication in a future issue of this journal, but has not been fully edited. Content may change prior to final publication. Citation information: DOI10.1109/TPAMI.2016.2533388, IEEE Transactions on Pattern Analysis and Machine Intelligence
8
observation time is small/variable.
5 EXPERIMENTS AND RESULTS
The proposed framework for representation of dy-namics was evaluated on the following video-basedinference tasks:(1) Action recognition on a motion capture dataset [4].(2) Action recognition on the MSR Action3D datasetreleased by Microsoft Research [50].(3) Action quality estimation on stroke rehabilitationdatasets collected in hospital and home environments[28], [51].(4) Dynamic scene classification on the Maryland “in-the-wild” natural scene dataset [2] and the Yupenn“stabilized” scene dataset [38].
Baseline: The main contribution of our work is topropose a better way to encode dynamics comparedto traditional chaotic invariants. To evaluate the effec-tiveness of our framework, we provide comparativeresults in each experiment with a feature vector 1 oftraditional chaotic invariants obtained by concatenat-ing the largest Lyapunov exponent, correlation dimen-sion and correlation integral (for 8 values of radius)resulting in a 10-dimensional feature vector denotedas Chaos. For a fair comparison, the embedding pro-cedure is fixed as mentioned in earlier sections.
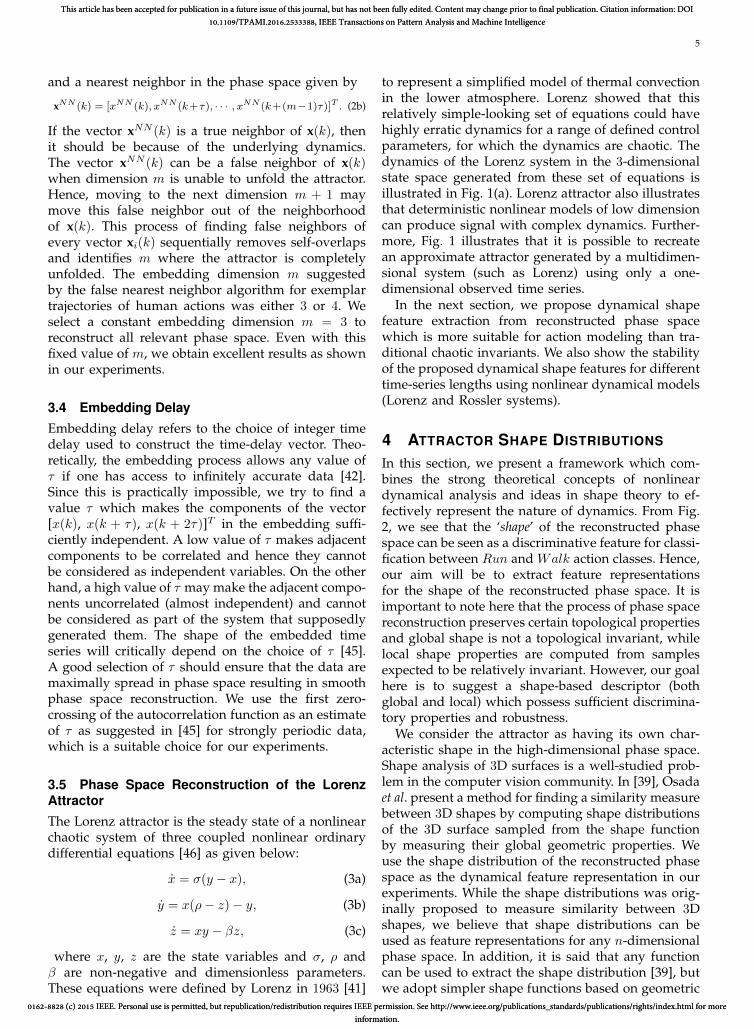
5.1 Motion Capture DatasetIn the first experiment, we evaluate the performanceof the proposed framework using 3-dimensional mo-tion capture sequences of body joints of subjects per-forming actions released by FutureLight, R&D divi-sion of Santa Monica Studios [4]. The dataset is acollection of five actions: dance, jump, run, sit andwalk with 31, 14, 30, 35 and 48 instances respectively.The classification problem on this dataset is shownto be challenging due to the presence of significantintra-class variations [4]. The data is in the form oftrajectories of 3D rotation angles from 18 body joints.We use all body joints except the hip joint, to removeany effects of translational movement of the body. The3D time-series from these 17 body joints were dividedinto scalar time-series resulting in a 51-dimensionalvector representation for each action. Phase spacereconstruction and dynamical shape feature extractionwas performed. The results of the leave-one-out cross-validation approach using a nearest neighbor classifier(using Euclidean and χ2 distance metrics) are tabu-lated in TABLE 2. The best classification performancewe achieved was a mean accuracy of 99.37% usingDT2 dynamical shape feature, in comparison with89.7% reported by Ali et al. in [4] using traditionalchaotic invariants. In addition, we see that the classi-fication performance of each dynamical shape feature
1. Code available athttp://www.physik3.gwdg.de/tstool/HTML/index.html
TABLE 2: Classification rates for the various proposeddynamical shape features of phase space on the motioncapture dataset with m = 3 (and m = 5 in parenthe-ses). For comparison, we use Euclidean distance and chi-squared distance metrics as a measure of distance betweenprobability distributions. We see that DT2 achieves highestclassification rate of 99.37%. The confusion table of the sameis reported in TABLE 3.
Dynamical Shape Feature Distance MeasureL2 χ2
Chaos 80.38 (82.28) 83.54 (85.54)Ali et al. 89.70 -
D1 94.30 (94.30) 98.10 (98.10)D2 96.84 (96.20) 96.84 (96.20)D3 97.47 (96.84) 97.47 (97.47)
DT1 97.47 (96.20) 98.73 (98.10)DT2 96.84 (96.20) 99.37 (99.37)
TABLE 3: Confusion table for motion capture dataset usingDT2 as the dynamical shape feature achieving mean classi-fication rate of 99.37% when compared to 89.7% reportedby Ali et al. in [4].
Action Dance Jump Run Sit WalkDance 30 1 0 0 0Jump 0 14 0 0 0Run 0 0 30 0 0Sit 0 0 0 35 0
Walk 0 0 0 0 48
is significantly better than the results achieved byusing traditional chaotic invariants (Chaos with m =3 & m = 5). The proposed action modeling frame-work achieves near-perfect classification accuracy onthe motion capture dataset even in the presence ofsignificant intra-class variations indicating its stability.This is also evident from the examples shown inFig. 5, where minor variations in the reconstructedphase space (in the form of intra-class variations)has not produced any significant effect on the dy-namical shape feature indicating the stability of theproposed framework. From these results, we see thatthe dynamical shape features with temporal evolutioninformation (DT1 and DT2) performs better than theshape features D1, D2 and D3, hence substantiatingour hypothesis that shape functions with dynamicalevolution information should only improve the recog-nition performance.
5.2 Kinect Dataset
The framework was also evaluated on a more compre-hensive dataset released by Microsoft Research calledMSR Action3D dataset [50] having 20 action classes:high arm wave, horizontal arm wave, hammer, hand catch,forward punch, high throw, draw x, draw tick, draw circle,hand clap, two hand wave, side boxing, bend, forwardkick, side kick, jogging, tennis swing, tennis serve, golfswing, pick up & throw with 10 subjects performingeach action thrice (see Fig. 6 for example actions).The action classes in this dataset were selected to

0162-8828 (c) 2015 IEEE. Personal use is permitted, but republication/redistribution requires IEEE permission. See http://www.ieee.org/publications_standards/publications/rights/index.html for moreinformation.
This article has been accepted for publication in a future issue of this journal, but has not been fully edited. Content may change prior to final publication. Citation information: DOI10.1109/TPAMI.2016.2533388, IEEE Transactions on Pattern Analysis and Machine Intelligence
9
−200
2040
6080
−500
50100−50
0
50
100
s(t)s(t+τ)
s(t+
2τ)
−500
50100
−500
50100−50
0
50
100
s(t)s(t+τ)
s(t+
2τ)
−500
50100
−500
50100−50
0
50
100
s(t)s(t+τ)
s(t+
2τ)
−500
50100
−500
50100−50
0
50
100
s(t)s(t+τ)
s(t+
2τ)
Examples of phase space reconstruction of RightLeg X-rotation time-series for ‘Run’ action Shape Distribution
−500
50100
−500
50100−50
0
50
100
s(t)s(t+τ)
s(t+
2τ)
−200
2040
6080
−500
50100−50
0
50
100
s(t)s(t+τ)
s(t+
2τ)
−200
2040
6080
−500
50100−50
0
50
100
s(t)s(t+τ)
s(t+
2τ)
−200
2040
6080
−500
50100−50
0
50
100
s(t)s(t+τ)
s(t+
2τ)
Examples of phase space reconstruction of RightLeg X-rotation time-series for ‘Walk’ action Shape Distribution
−40−20
020
40
−40−20
020
40−40
−20
0
20
40
s(t)s(t+τ)
s(t+
2τ)
−40−20
020
4060
−50
0
50−50
0
50
s(t)s(t+τ)
s(t+
2τ)
−40−20
020
40
−40−20
020
40−40
−20
0
20
40
s(t)s(t+τ)s(
t+2τ
)
−20−10
010
2030
−200
2040
−20
0
20
40
s(t)s(t+τ)
s(t+
2τ)
Examples of phase space reconstruction of RightLeg X-rotation time-series for ‘Dance’ action Shape Distribution
Fig. 5: Illustration of the phase space reconstruction and dynamical shape feature extraction (D2 shape feature) usingfour examples of Run, Walk and Dance action classes each from the motion capture dataset [4]. As an example, phasespace reconstruction of X-rotation time-series from right leg of subjects performing these actions is shown. Embeddingparameters, m was selected to be 3 and τ was calculated by method explained in section 3.4. It is evident from theseexamples that the ‘shape’ of phase space is a representative feature for an action class and can be captured using shapedistributions.
(a) D1 (b) D2 (c) D3 (d) DT1 (e) DT2
(f) D1 (g) D2 (h) D3 (i) DT1 (j) DT2
Fig. 6: Example actions from action class Tennis serve (a) and Two hand wave (b) from the MSR Action3D dataset. Skeletondata of 20 joints provided in the dataset will be used in our action recognition experiment. Shape distributions fromreconstructed phase space using the hand trajectory from five instances each of tennis serve and two hand wave actionsis shown here to illustrate the insensitivity of the framework to inter-class similarities.
0162-8828 (c) 2015 IEEE. Personal use is permitted, but republication/redistribution requires IEEE permission. See http://www.ieee.org/publications_standards/publications/rights/index.html for moreinformation.
This article has been accepted for publication in a future issue of this journal, but has not been fully edited. Content may change prior to final publication. Citation information: DOI10.1109/TPAMI.2016.2533388, IEEE Transactions on Pattern Analysis and Machine Intelligence
10
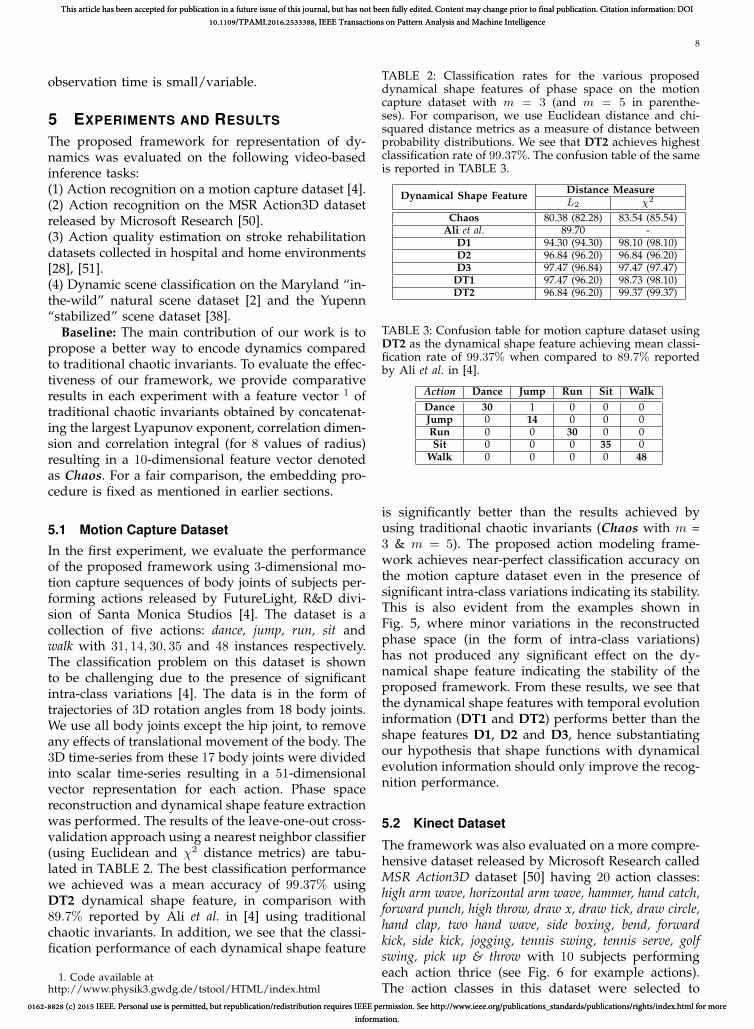
TABLE 4: Classification results for cross-subject test setting where 50% subjects were used for training and the remaining50% subjects for testing in proposed method using linear SVM with m = 3 (and m = 5 in parentheses).
Shape Distribution ChaosSet D1 D2 D3 DT1 DT2AS1 88.35 (86.14) 89.32 (87.13) 87.13 (86.41) 88.57 (87.38) 90.48 (89.58) 72.28 (74.56)AS2 69.72 (63.39) 72.65 (69.75) 71.43 (72.32) 73.21 (73.50) 74.11 (70.00) 51.85 (52.40)AS3 90.74 (84.68) 96.40 (93.69) 98.20 (96.43) 98.25 (92.92) 99.09 (96.49) 76.36 (78.86)
Avg. 82.94 (78.07) 86.12 (83.52) 85.59 (85.05) 86.68 (84.60) 87.89 (85.34) 66.83 (68.61)
ensure the use of arms, legs and torso by subjectsto simulate interaction with gaming consoles. Highsimilarity between classes (e.g., forward punch andhammer, high throw and pickup & throw) makesthis a challenging dataset. The 20 action classes werefurther divided into 3 Action Sets: AS1, AS2 and AS3in [50] to account for the large amount of computationinvolved in classification of these actions. The actionsets 1 and 2 were intended to group actions withsimilar movement and action set 3 to group complexmovements. The dataset provides 3D joint positionson which phase space reconstruction and extractionof shape distribution were carried out individuallyon every dimension (x, y & z). These shape distribu-tions were concatenated to form our feature vectorrepresentative of a given action. The classificationresults on the cross-subject test setting using a linearSVM are tabulated in TABLE 4 and as seen, the pro-posed framework performs better than the traditionalchaotic invariants. Examples shown in Fig. 6 furthersupport our hypothesis that shape distributions canbe used as a discriminative feature for actions. Inorder to illustrate the proposed framework’s stabilityto intra-class variations and insensitivity to inter-class similarities, we compare the dynamical shapefeatures of hand trajectory for five instances of tennisserve and two hand wave action classes. Evident fromthese examples is that even actions using similarhand movements are represented by dynamical shapefeatures with enough differences to successfully rec-ognize these actions. Furthermore, from results inTABLE 4, we see that the dynamical shape featureDT2 has the highest overall classification accuracy,indicating that the shape distribution based on tempo-ral evolution of phase space is better than traditionalglobal shape representations. We have also providedclassification results using a nearest neighbor classifierin TABLE 5 for a comprehensive comparison of theproposed shape distributions. Our results indicatethat we achieve similar performance with both m = 3and m = 5. In further evaluation experiments, we usem = 3.
5.3 Activity Quality for RehabilitationOur aim in this experiment is two-fold: a) to clas-sify movements of unimpaired (neurologically nor-mal) and impaired (stroke survivors) subjects, b) toquantitatively assess the quality of movement per-formed by the impaired subjects during repetitive task
TABLE 5: Classification results for cross-subject test settingwhere 50% subjects were used for training and the re-maining 50% subjects for testing in proposed method usingnearest-neighbor classifier.
Shape Distribution (m = 3) ChaosSet D1 D2 D3 DT1 DT2 m = 3 m = 5
AS1 67.00 74.62 75.73 75.05 78.43 52.30 55.67AS2 59.63 67.66 65.77 64.47 68.21 42.53 49.23AS3 87.83 89.96 89.66 88.11 91.13 53.45 60.59
Avg. 71.49 77.41 77.05 75.87 79.25 49.43 55.16
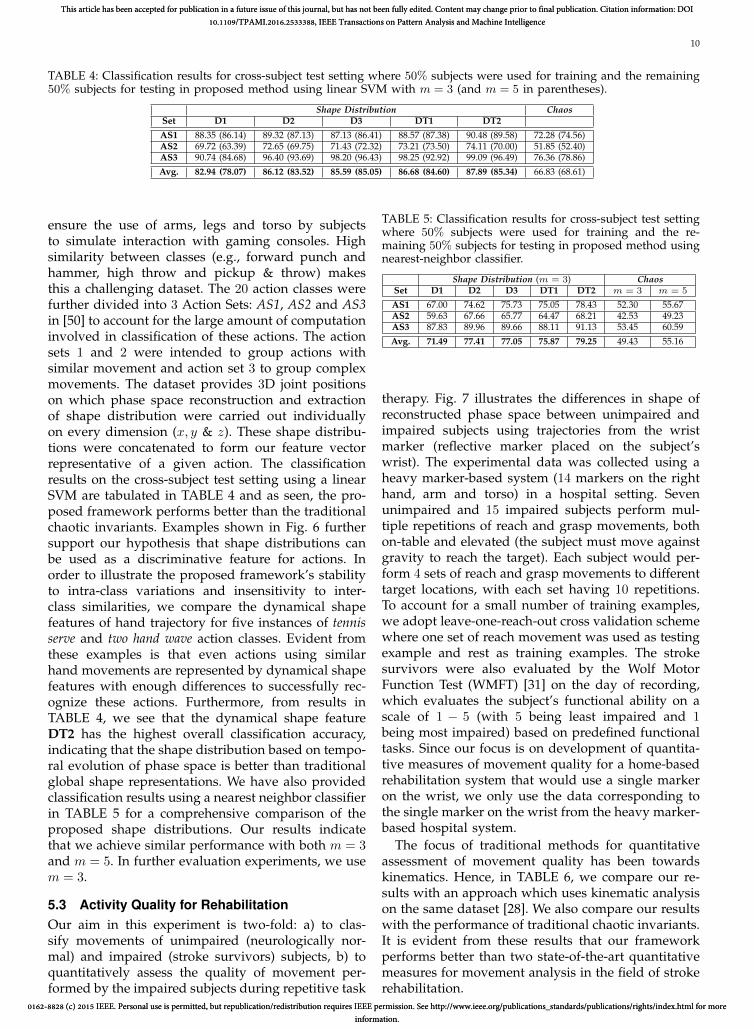
therapy. Fig. 7 illustrates the differences in shape ofreconstructed phase space between unimpaired andimpaired subjects using trajectories from the wristmarker (reflective marker placed on the subject’swrist). The experimental data was collected using aheavy marker-based system (14 markers on the righthand, arm and torso) in a hospital setting. Sevenunimpaired and 15 impaired subjects perform mul-tiple repetitions of reach and grasp movements, bothon-table and elevated (the subject must move againstgravity to reach the target). Each subject would per-form 4 sets of reach and grasp movements to differenttarget locations, with each set having 10 repetitions.To account for a small number of training examples,we adopt leave-one-reach-out cross validation schemewhere one set of reach movement was used as testingexample and rest as training examples. The strokesurvivors were also evaluated by the Wolf MotorFunction Test (WMFT) [31] on the day of recording,which evaluates the subject’s functional ability on ascale of 1 − 5 (with 5 being least impaired and 1being most impaired) based on predefined functionaltasks. Since our focus is on development of quantita-tive measures of movement quality for a home-basedrehabilitation system that would use a single markeron the wrist, we only use the data corresponding tothe single marker on the wrist from the heavy marker-based hospital system.
The focus of traditional methods for quantitativeassessment of movement quality has been towardskinematics. Hence, in TABLE 6, we compare our re-sults with an approach which uses kinematic analysison the same dataset [28]. We also compare our resultswith the performance of traditional chaotic invariants.It is evident from these results that our frameworkperforms better than two state-of-the-art quantitativemeasures for movement analysis in the field of strokerehabilitation.

0162-8828 (c) 2015 IEEE. Personal use is permitted, but republication/redistribution requires IEEE permission. See http://www.ieee.org/publications_standards/publications/rights/index.html for moreinformation.
This article has been accepted for publication in a future issue of this journal, but has not been fully edited. Content may change prior to final publication. Citation information: DOI10.1109/TPAMI.2016.2533388, IEEE Transactions on Pattern Analysis and Machine Intelligence
11U
nim
pair
ed
0 10 20 30 40 50 60−1
−0.5
0
0.5
1
Time in sec
Wris
t X
−10
1
−1
0
1−1
0
1
x(t)x(t+τ)
x(t
+2
τ)
@@@R Similarity
Measure
Impa
ired
0 10 20 30 40−1
−0.5
0
0.5
1
Time in sec
Wris
t X
(a) Time-series data
−10
1
−1
0
1−1
0
1
x(t)x(t+τ)x(t
+2
τ)
(b) Reconstructed phasespace (c) Shape distribution
����
Fig. 7: Proposed framework for movement quality assessment and action recognition by extraction of dynamical shapefeature from reconstructed phase space. (a) shows the time-series of x-location of wrist marker; its respective reconstructedphase space is shown in (b). These two exemplar trajectories are collected from the stroke rehabilitation dataset [28] andbelong to unimpaired and impaired subjects respectively. The corresponding dynamical shape feature represented by shapedistribution is shown in (c). Similarity measure (e.g., Euclidean distance) can be used to classify these trajectories.
TABLE 6: Comparison of classification rates for differ-ent methods using leave-one-reach-out cross-validation andnearest neighbor classifier on the stroke rehabilitationdataset.
Method Classification Rate (%)KIM [28] 85.2
Chaos (m = 3) 81.82Chaos (m = 5) 83.43
D1 (m = 3) 84.32D2 (m = 3) 88.60D3 (m = 3) 86.04
DT1 (m = 3) 87.65DT2 (m = 3) 92.05
We also propose a framework for movement qualityassessment (shown in Fig. 8) for stroke rehabilitation.Using the WMFT scores of impaired subjects, we learna regression function using SVM to compute a move-ment quality score from dynamical shape feature (us-ing D2 shape distribution). The regressor was trainedusing leave-one-reach-out cross-validation technique.The outputs of the regressor were averaged per sub-ject to get the Movement Quality Score (MQS). Fig. 9shows a comparison between the actual WMFT scoreand the quality assessment score by the proposedmethod (MQS). The Pearson correlation coefficientbetween the MQS and the Functional Activity Score(FAS) of the WMFT was found to be 0.8527. When werepeat the same experiment with kinematic attributeson a single wrist marker, the correlation coefficientwas found to be 0.6481. In comparison, kinematicanalysis of data from all 14 markers gave a correlationcoefficient of 0.9041. This experiment clearly showsthat the proposed framework achieves comparableresults obtained by the heavy marker-based systemeven when using a single wrist marker, which isfacilitated by the phase space reconstruction and ro-bust feature extraction from phase space using shapedistribution.
The WMFT scores are based on several functional
Impairedsubject
Dynamical Feature(D2)
- SVMRegression
6
WMFTScore
-
MovementQualityScore
(MQS)
Fig. 8: Block diagram representation for learning a regressorfor movement quality assessment using Functional ActivityScore (FAS) from the Wolf Motor Function Test (WMFT).
1 2 3 4 5 6 7 8 9 10 11 12 13 14 153
3.2
3.4
3.6
3.8
4
Subject ID
Impa
irem
ent L
evel
WMFTMQS
Fig. 9: Comparison between impairment level (with 5 be-ing least impaired and 1 being most impaired) given byactual WMFT score and MQS for 15 impaired subjects. ThePearson correlation coefficient was found to be 0.8527 witha two-tail P-value of 5.35 × 10⁻⁵, proving its statisticalsignificance.
tasks (e.g., folding a towel, picking up a pencil) andnot on evaluation of the actual movements duringrepetitive therapy treatment (reach and grasp move-ments). In the above experiment, we utilize theseWMFT scores as an approximate high-level quan-titative measure for movement quality of impairedsubjects performing reach and grasp movements, asboth WMFT evaluation and 3D marker data on thewrist were obtained on the same day.
To address this conflict in collection of ground truth(movement quality labels) and trajectory data, we

0162-8828 (c) 2015 IEEE. Personal use is permitted, but republication/redistribution requires IEEE permission. See http://www.ieee.org/publications_standards/publications/rights/index.html for moreinformation.
This article has been accepted for publication in a future issue of this journal, but has not been fully edited. Content may change prior to final publication. Citation information: DOI10.1109/TPAMI.2016.2533388, IEEE Transactions on Pattern Analysis and Machine Intelligence
12
TABLE 7: Comparison of performance of the proposed dy-namical shape features with the performance of traditionalmethods used for movement quality analysis.
Method Correlation Coefficient MSEKIM [28] 0.4918 0.0066
Chaos (m = 3) 0.4717 0.0101Chaos (m = 5) 0.5089 0.0100
D1 (m = 3) 0.3877 0.1190D2 (m = 3) 0.5029 0.0078D3 (m = 3) 0.4935 0.0061
DT1 (m = 3) 0.4582 0.0100DT2 (m = 3) 0.5510 0.0057
TABLE 8: Comparison of classification rates for variousapproaches on the Maryland “in-the-wild” dataset (withm = 3).
Class Chaos [2] Chaos (our) 2 D1 D2 D3 DT1 DT2
avalanche 30 40 0 0 20 10 0b. water 30 40 30 40 20 30 30c. traffic 50 30 80 100 50 60 90
f. fire 30 20 10 30 30 30 30fountain 20 0 40 30 30 30 40
i. collapse 10 0 10 0 0 10 0landslide 10 50 0 10 20 10 20s. traffic 20 20 20 30 30 40 30tornado 60 10 40 70 60 50 60
v. eruption 70 0 60 70 60 40 70waterfall 30 20 10 40 20 20 30
waves 80 40 70 80 80 90 80whirlpool 30 20 40 50 30 70 50
Avg. (%) 36 22.31 31.54 42.31 34.62 37.69 40.77
have used a dataset reported in [52] from eight strokesurvivors performing reach and grasp movementtasks and have developed a rating scale for movementquality in collaboration with physical therapists [52].Within this scale, physical therapists would provideus an overall rating on a scale of 1 − 5 based onthe therapist’s impression of the participant’s perfor-mance. A score of 1 denotes that the participant couldnot complete the task (most impaired) and a 5 denotesthat the participant performed the task with the samequality of performance as the therapist if he/she wereto perform it (least impaired or unimpaired). We havecollected both 3D position of the wrist and physicaltherapist ratings in order to make comparisons amongthe kinematics, our proposed measure, and the ther-apist ratings, across the same reach action. Utilizingthe expert knowledge of the therapist ratings for theserated actions will also help us better contextualizethe data to better shape our framework as a therapytool. Using the same framework for regression asearlier, we see from TABLE 7 that the proposed frame-work (using DT2) performs better than the traditionalmethods for movement quality assessment in termsof correlation coefficient and mean squared error. Itshould be noted that the proposed framework doesnot require data collected from unimpaired subjectsfor generating MQS, while kinematic methods likeKIM [28] does, making the framework more suitableto model complex tasks during therapy treatment.
2. Here “our” refers to our implementation of traditional chaoticinvariants using the OpenTSTOOL package.
TABLE 9: Comparison of classification rates for variousapproaches on the Yupenn “stabilized” dynamic dataset(with m = 3).
Class Chaos [2] Chaos (our)2 D1 D2 D3 DT1 DT2
beach 27 17 77 80 77 83 77c. street 17 70 3 87 90 100 93elevator 40 17 7 37 10 23 17
f. fire 50 10 40 50 57 40 50fountain 7 10 0 27 17 47 0highway 17 17 77 47 53 33 60l. storm 37 97 97 97 93 97 100ocean 43 30 60 70 80 87 77
railway 3 17 60 57 23 40 60r. river 3 87 60 90 83 87 77
sky 33 23 30 47 43 50 57snowing 10 77 73 80 90 90 93waterfall 10 17 50 37 30 37 37w. farm 17 03 30 13 20 10 33
Avg. (%) 22.43 35.14 48.64 58.50 54.71 58.85 59.35
5.4 Dynamic Scene Recognition
Natural dynamic scene recognition has been gaininginterest in recent years [2], [38]. In an attempt to testthe generality of the proposed framework to dynam-ical modeling for applications in video analysis, weevaluate its performance on dynamical scene classifi-cation. In this experiment, we use the Maryland “in-the-wild” dataset [2] which is a collection of 13 classeswith 10 examples per class and a larger Yupennstabilized dynamic dataset [38] which is a collectionof 14 classes with 30 examples per class. The formerhas videos collected from video hosting websites withno control over recording process leading to a datasetwith large variations in illumination, view and scale[2]. The latter dataset was recently released to em-phasize only the scene-specific temporal informationrather than camera-induced ones. In addition, thescene classes in the datasets were selected to illustratepotential failure of static scene representations leadingto confusion between classes (e.g., chaotic traffic andsmooth traffic).
Recent research on dynamical modeling of sceneshave shown that temporal (motion) information canprovide better classification performance than tradi-tional feature representations (e.g., GIST [35]) on staticscenes [2], [38]. The GIST feature is based on thehypothesis that humans recognize scenes by holisticunderstanding of a scene [35], [53], thereby providinga global spatial representation of a scene. Shroff et al.employed traditional chaotic invariants to model thedynamics in the time-series of the 960-dimensionalGIST descriptor extracted from each video and will betreated as our baseline. Similarly, we compare the per-formance of our proposed shape distribution featuresestimated on the 960-dimensional GIST descriptor tofurther support our hypothesis that proposed shape-based features can perform better than traditionalchaotic invariants in video-based inference tasks.
The average classification accuracy for all the pro-posed dynamical shape features in comparison withtraditional chaotic invariants using a nearest neighborclassifier are tabulated in TABLE 8 and 9. It is evi-dent from these results that the proposed dynamical

0162-8828 (c) 2015 IEEE. Personal use is permitted, but republication/redistribution requires IEEE permission. See http://www.ieee.org/publications_standards/publications/rights/index.html for moreinformation.
This article has been accepted for publication in a future issue of this journal, but has not been fully edited. Content may change prior to final publication. Citation information: DOI10.1109/TPAMI.2016.2533388, IEEE Transactions on Pattern Analysis and Machine Intelligence
13
shape features (D2 and DT2) perform better than thetraditional chaotic invariants used in literature for dy-namical scene classification. Evidently it is possible toimprove classification performance further by fusionof dynamical and spatial features as in [2], but here werestrict ourselves to comparison with core dynamicalapproaches.
6 CONCLUSION AND FUTURE DIRECTIONS
In this paper, we have proposed a shape theoretic dy-namical analysis framework for applications in actionand gesture recognition, movement quality assess-ment for stroke rehabilitation and dynamical sceneclassification. We address the drawbacks of traditionalmeasures from chaos theory for modeling the dynam-ics by proposing a framework combining the conceptsof nonlinear time-series analysis and shape theoryto extract robust and discriminative features fromthe reconstructed phase space. Our experiments onnonlinear dynamical models and joint trajectory datafrom motion capture support our hypothesis that theshape of the reconstructed phase space can be used asfeature representation for the above discussed appli-cations. Furthermore, the wide range of experimentalanalysis on publicly available datasets for recognitionof actions, gestures and scenes validate our claims.The framework was also tested on movement analysison a finer scale, where we were interested in quanti-fying the movement quality (level of impairment) forapplications in stroke rehabilitation. Our experimentsusing a single marker indicate that with combinationof dynamical features and machine learning tools, weare able to achieve comparable performance levels toa heavy marker-based system in movement qualityassessment.
In this work, we perform phase space reconstruc-tion on every dimension independently (univariatephase space reconstruction). Our future directions willbe towards employing techniques for multi-variatephase space reconstruction [54]. It has been shownin [55] that multi-variate phase space reconstructionmethod provides better modeling than univariatephase space reconstruction, and hence lower error inpredictions for human motion. We would also like toexplore the use of approximate entropy [56], a dynam-ical measure quantifying regularity in a time-series.The suggested number of data samples required forcomputation of approximate entropy is between 50and 5000 [56], which makes it more suitable for ap-plications in video-based inference.
7 ACKNOWLEDGMENTS
This work was supported by the National ScienceFoundation (NSF) CAREER grant 1452163.
REFERENCES
[1] J. Aggarwal and M. S. Ryoo, “Human activity analysis: Areview,” ACM Computing Surveys (CSUR), vol. 43, no. 3, p. 16,2011.
[2] N. Shroff, P. Turaga, and R. Chellappa, “Moving vistas: Ex-ploiting motion for describing scenes,” in IEEE Conference onComputer Vision and Pattern Recognition, June 2010, pp. 1911–1918.
[3] N. Stergiou and L. M. Decker, “Human movement variability,nonlinear dynamics, and pathology: is there a connection?”Human Movement Science, vol. 30, no. 5, pp. 869–888, 2011.
[4] S. Ali, A. Basharat, and M. Shah, “Chaotic invariants forhuman action recognition,” in IEEE International Conference onComputer Vision, Oct. 2007, pp. 1–8.
[5] I. N. Junejo, E. Dexter, I. Laptev, and P. Perez, “View-independent action recognition from temporal self-similarities,” IEEE Transactions on Pattern Analysis andMachine Intelligence, vol. 33, no. 1, pp. 172–185, 2011.
[6] M. Perc, “The dynamics of human gait,” European journal ofphysics, vol. 26, no. 3, pp. 525–534, 2005.
[7] J. B. Dingwell and H. G. Kang, “Differences between localand orbital dynamic stability during human walking,” Journalof Biomechanical Engineering, vol. 129, no. 4, pp. 586–593, 2007.
[8] R. T. Harbourne and N. Stergiou, “Movement variability andthe use of nonlinear tools: principles to guide physical ther-apist practice,” Physical Therapy, vol. 89, no. 3, pp. 267–282,2009.
[9] D. J. Miller, N. Stergiou, and M. J. Kurz, “An improvedsurrogate method for detecting the presence of chaos in gait,”Journal of biomechanics, vol. 39, no. 15, pp. 2873–2876, 2006.
[10] L. Ralaivola, F. d’Alche Buc et al., “Dynamical modelingwith kernels for nonlinear time series prediction,” in NeuralInformation Processing Systems, vol. 4, 2003, pp. 129–136.
[11] A. Bissacco, A. Chiuso, Y. Ma, and S. Soatto, “Recognitionof human gaits,” in IEEE Conference on Computer Vision andPattern Recognition, 2001, pp. 52–57.
[12] A. Wolf, J. B. Swift, H. L. Swinney, and J. A. Vastano, “De-termining lyapunov exponents from a time series,” Physica D:Nonlinear Phenomena, vol. 16, no. 3, pp. 285–317, 1985.
[13] J.-P. Eckmann and D. Ruelle, “Ergodic theory of chaos andstrange attractors,” Reviews of modern physics, vol. 57, no. 3,pp. 617–656, 1985.
[14] M. Sano and Y. Sawada, “Measurement of the lyapunovspectrum from a chaotic time series,” Physical review letters,vol. 55, no. 10, pp. 1082–1085, 1985.
[15] J. D. Farmer and J. J. Sidorowich, “Predicting chaotic timeseries,” Physical review letters, vol. 59, no. 8, pp. 845–848, 1987.
[16] M. Rosenstein, J. Collins, and C. De Luca, “A practical methodfor calculating largest lyapunov exponents from small datasets,” Physica D: Nonlinear Phenomena, vol. 65, no. 1, pp. 117–134, 1993.
[17] T. TenBroek, R. Van Emmerik, C. Hasson, and J. Hamill,“Lyapunov exponent estimation for human gait accelerationsignals,” Journal of Biomechanics, vol. 40, no. 2, p. 210, 2007.
[18] L. D. Iasemidis, D.-S. Shiau, W. Chaovalitwongse, J. C. Sackel-lares, P. M. Pardalos, J. C. Principe, P. R. Carney, A. Prasad,B. Veeramani, and K. Tsakalis, “Adaptive epileptic seizure pre-diction system,” IEEE Transactions on Biomedical Engineering,vol. 50, no. 5, pp. 616–627, 2003.
[19] D. M. Gavrila, “The visual analysis of human movement:A survey,” Computer Vision and Image Understanding, vol. 73,no. 1, pp. 82–98, 1999.
[20] L. Rabiner, “A tutorial on hidden markov models and selectedapplications in speech recognition,” Proceedings of the IEEE,vol. 77, no. 2, pp. 257–286, 1989.
[21] J. L. Casti, Linear Dynamical Systems. Academic Press Profes-sional, Inc., 1986.
[22] A. D. Wilson and A. F. Bobick, “Learning visual behavior forgesture analysis,” in IEEE International Symposium on ComputerVision, Nov. 1995, pp. 229–234.
[23] N. Vaswani, A. K. Roy-Chowdhury, and R. Chellappa, “Shapeactivity: a continuous-state hmm for moving/deformingshapes with application to abnormal activity detection,” IEEETransactions on Image Processing, vol. 14, no. 10, pp. 1603–1616,2005.

0162-8828 (c) 2015 IEEE. Personal use is permitted, but republication/redistribution requires IEEE permission. See http://www.ieee.org/publications_standards/publications/rights/index.html for moreinformation.
This article has been accepted for publication in a future issue of this journal, but has not been fully edited. Content may change prior to final publication. Citation information: DOI10.1109/TPAMI.2016.2533388, IEEE Transactions on Pattern Analysis and Machine Intelligence
14
[24] N. P. Cuntoor and R. Chellappa, “Epitomic representation ofhuman activities,” in IEEE Conference on Computer Vision andPattern Recognition, June 2007, pp. 1–8.
[25] A. Kale, A. Sundaresan, A. Rajagopalan, N. P. Cuntoor, A. K.Roy-Chowdhury, V. Kruger, and R. Chellappa, “Identificationof humans using gait,” IEEE Transactions on Image Processing,vol. 13, no. 9, pp. 1163–1173, 2004.
[26] Z. Liu and S. Sarkar, “Improved gait recognition by gaitdynamics normalization,” IEEE Transactions on Pattern Analysisand Machine Intelligence, vol. 28, no. 6, pp. 863–876, 2006.
[27] C. Bregler, “Learning and recognizing human dynamics invideo sequences,” in IEEE Conference on Computer Vision andPattern Recognition, June 1997, pp. 568–574.
[28] Y. Chen, M. Duff, N. Lehrer, H. Sundaram, J. He, S. L. Wolf,and T. Rikakis, “A computational framework for quantitativeevaluation of movement during rehabilitation,” in AIP Con-ference Proceedings-American Institute of Physics, vol. 1371, 2011,pp. 317–326.
[29] V. Venkataraman, P. Turaga, N. Lehrer, M. Baran, T. Rikakis,and S. L. Wolf, “Attractor-shape for dynamical analysis ofhuman movement: Applications in stroke rehabilitation andaction recognition,” in IEEE Conference on Computer Vision andPattern Recognition Workshops, June 2013, pp. 514–520.
[30] A. Fugl-Meyer, L. Jaasko, I. Leyman, S. Olsson, S. Steglindet al., “The post-stroke hemiplegic patient. 1. a method forevaluation of physical performance.” Scandinavian journal ofrehabilitation medicine, vol. 7, no. 1, pp. 13–31, 1975.
[31] S. L. Wolf, P. A. Catlin, M. Ellis, A. L. Archer, B. Morgan, andA. Piacentino, “Assessing wolf motor function test as outcomemeasure for research in patients after stroke,” Stroke, vol. 32,no. 7, pp. 1635–1639, 2001.
[32] L. Fei-Fei and P. Perona, “A bayesian hierarchical modelfor learning natural scene categories,” in IEEE Conference onComputer Vision and Pattern Recognition, June 2005, pp. 524–531.
[33] J. Xiao, J. Hays, K. A. Ehinger, A. Oliva, and A. Torralba, “Sundatabase: Large-scale scene recognition from abbey to zoo,”in IEEE Conference on Computer Vision and Pattern Recognition,June 2010, pp. 3485–3492.
[34] A. Oliva and A. Torralba, “Building the gist of a scene: Therole of global image features in recognition,” Progress in brainresearch, vol. 155, pp. 23–36, 2006.
[35] A. Oliva and Torralba, “Modeling the shape of the scene: Aholistic representation of the spatial envelope,” InternationalJournal of Computer Vision, vol. 42, no. 3, pp. 145–175, 2001.
[36] S. Soatto, G. Doretto, and Y. N. Wu, “Dynamic textures,” inIEEE International Conference on Computer Vision, vol. 2, 2001,pp. 439–446.
[37] G. Doretto, A. Chiuso, Y. N. Wu, and S. Soatto, “Dynamictextures,” International Journal of Computer Vision, vol. 51, no. 2,pp. 91–109, 2003.
[38] K. G. Derpanis, M. Lecce, K. Daniilidis, and R. P. Wildes, “Dy-namic scene understanding: The role of orientation features inspace and time in scene classification,” in IEEE Conference onComputer Vision and Pattern Recognition, June 2012, pp. 1306–1313.
[39] R. Osada, T. Funkhouser, B. Chazelle, and D. Dobkin, “Shapedistributions,” ACM Transactions on Graphics, vol. 21, no. 4, pp.807–832, 2002.
[40] A. Bissacco, “Modeling and learning contact dynamics inhuman motion,” in IEEE Conference on Computer Vision andPattern Recognition, June 2005, pp. 421–428.
[41] G. P. Williams, Chaos theory tamed. Joseph Henry Press, 1997.[42] H. D. Abarbanel, Analysis of observed chaotic data. New York:
Springer-Verlag, 1996.[43] F. Takens, “Detecting strange attractors in turbulence,” Dynam-
ical Systems and Turbulence, vol. 898, pp. 366–381, 1981.[44] M. B. Kennel, R. Brown, and H. D. Abarbanel, “Determining
embedding dimension for phase-space reconstruction using ageometrical construction,” Physical review A, vol. 45, no. 6, p.3403, 1992.
[45] M. Small, Applied nonlinear time series analysis: applications inphysics, physiology and finance. World Scientific PublishingCompany Incorporated, 2005, vol. 52.
[46] W. Tucker, “The lorenz attractor exists,” Comptes Rendus del’Academie des Sciences-Series I-Mathematics, vol. 328, no. 12, pp.1197–1202, 1999.
[47] A. Bhattacharyya, “On a measure of divergence between twostatistical populations defined by their probability distribu-tions,” Indian Journal of Statistics, vol. 35, no. 99-109, p. 4, 1943.
[48] A. Srivastava, I. Jermyn, and S. Joshi, “Riemannian analysisof probability density functions with applications in vision,”in IEEE Conference on Computer Vision and Pattern Recognition,June 2007, pp. 1–8.
[49] Y. Rubner, C. Tomasi, and L. J. Guibas, “A metric for dis-tributions with applications to image databases,” in IEEEInternational Conference on Computer Vision, Jan. 1998, pp. 59–66.
[50] W. Li, Z. Zhang, and Z. Liu, “Action recognition based on abag of 3d points,” in IEEE Conference on Computer Vision andPattern Recognition Workshops, Jun. 2010, pp. 9–14.
[51] M. Baran, N. Lehrer, D. Siwiak, Y. Chen, M. Duff, T. Ingalls,and T. Rikakis, “Design of a home-based adaptive mixedreality rehabilitation system for stroke survivors,” in IEEEConference on Engineering in Medicine and Biological Society, Aug.2011, pp. 7602–7605.
[52] V. Venkataraman, P. Turaga, M. Baran, N. Lehrer, T. Du,L. Cheng, T. Rikakis, and S. Wolf, “Component-level tuningof kinematic features from composite therapist impressionsof movement quality,” IEEE Journal of Biomedical and HealthInformatics, vol. 20, no. 1, pp. 143–152, Jan 2016.
[53] I. Biederman, “Recognition-by-components: a theory of hu-man image understanding,” Psychological review, vol. 94, no. 2,pp. 115–147, 1987.
[54] L. Cao, A. Mees, and K. Judd, “Dynamics from multivariatetime series,” Physica D: Nonlinear Phenomena, vol. 121, no. 1,pp. 75–88, 1998.
[55] A. Basharat and M. Shah, “Time series prediction by chaoticmodeling of nonlinear dynamical systems,” in IEEE Interna-tional Conference on Computer Vision, 2009, pp. 1941–1948.
[56] S. M. Pincus, “Approximate entropy as a measure of systemcomplexity.” Proceedings of the National Academy of Sciences,vol. 88, no. 6, pp. 2297–2301, 1991.
Vinay Venkataraman received his M.S. andPh. D. degrees in Electrical Engineering fromArizona State University in 2012 and 2016respectively. His research interests are innonlinear dynamical analysis, computer vi-sion and biomedical signal processing.
Pavan Turaga (S’05, M’09, SM’14) is As-sistant Professor in the School of Arts, Me-dia, Engineering, and Electrical Engineeringat Arizona State University. He received theB.Tech. degree in electronics and communi-cation engineering from the Indian Instituteof Technology Guwahati, India, in 2004, andthe M.S. and Ph.D. degrees in electrical en-gineering from the University of Maryland,College Park in 2008 and 2009 respectively.He then spent two years as a research asso-
ciate at the Center for Automation Research, University of Maryland,College Park. His research interests are in computer vision andcomputational imaging with applications in activity analysis, and dy-namic scene analysis, with a focus on non-Euclidean techniques forthese applications. He was awarded the Distinguished DissertationFellowship in 2009. He was selected to participate in the EmergingLeaders in Multimedia Workshop by IBM, New York, in 2008. Hereceived the National Science Foundation CAREER award in 2015.


![Correction: Statistical Computations on Grassmann and Stiefel …pturaga/papers/GrassmannCorrected.pdf · 2012. 8. 2. · 4 provided in [22]. Algorithmic computations of the geometric](https://img.pdfslide.us/doc/110x75/60ffdd78a4b3b812f1733979/correction-statistical-computations-on-grassmann-and-stiefel-pturagapapersgrassmanncorrectedpdf.jpg)
![Interactively Test Driving an Object Detector: Estimating ...pturaga/papers/TestDriving/WACV_TestDrive.pdfpleted the challenge (2010− 22 ,2011− 13 ,2012− 8) [ 1]. Traditionally,](https://img.pdfslide.us/doc/110x75/5ff36123b47a300a417e6cb5/interactively-test-driving-an-object-detector-estimating-pturagapaperstestdrivingwacvtestdrivepdf.jpg)