Embed Size (px)
Citation preview

This is an Open Access document downloaded from ORCA, Cardiff University's institutional
repository: http://orca.cf.ac.uk/95302/
This is the author’s version of a work that was submitted to / accepted for publication.
Citation for final published version:
Shanmugarajah, Priya D., Hoggard, Nigel, Currie, Stuart, Aeschlimann, Daniel, Aeschlimann,
Pascale Corinne, Gleeson, Dermot C., Karajeh, Mohammed, Woodroofe, Nicola, Grünewald,
Richard A. and Hadjivassiliou, Marios 2016. Alcohol-related cerebellar degeneration: not all down
to toxicity? Cerebellum & Ataxias 3 , 17. 10.1186/s40673-016-0055-1 file
Publishers page: http://dx.doi.org/10.1186/s40673-016-0055-1 <http://dx.doi.org/10.1186/s40673-
016-0055-1>
Please note:
Changes made as a result of publishing processes such as copy-editing, formatting and page
numbers may not be reflected in this version. For the definitive version of this publication, please
refer to the published source. You are advised to consult the publisher’s version if you wish to cite
this paper.
This version is being made available in accordance with publisher policies. See
http://orca.cf.ac.uk/policies.html for usage policies. Copyright and moral rights for publications
made available in ORCA are retained by the copyright holders.
Shanmugarajah
1
Title page
Alcohol-related cerebellar degeneration: not all down to toxicity?
Title character count: 66 (with spaces)
Manuscript word count: 3100
Abstract word count: 238
Number of references: 30
Number of tables: 2
Author names and affiliations
1Dr Priya D. Shanmugarajah, MD
email: [email protected]
Academic Department of Neurosciences, Royal Hallamshire Hospital,
Sheffield, UK and University of Sheffield, UK
2Dr Nigel Hoggard, MD
email: [email protected]
Academic Unit of Radiology, University of Sheffield, UK
2Dr Stuart Currie, PhD
email: [email protected]
Academic Unit of Radiology, University of Sheffield, UK
3Professor Daniel P. Aeschlimann, PhD
email: [email protected]
Shanmugarajah
2
Matrix Biology & Tissue Repair Research Unit, College of Biomedical and Life
Sciences, School of Dentistry, Cardiff University, Cardiff, UK
3Mrs Pascale C. Aeschlimann, BSc
email: [email protected]
Matrix Biology & Tissue Repair Research Unit, College of Biomedical and Life
Sciences, School of Dentistry, Cardiff University, Cardiff, UK
4Professor Dermot C. Gleeson, MD
email: [email protected]
Academic Department of Hepatology, Royal Hallamshire Hospital, Sheffield,
UK and University of Sheffield, UK;
4Dr Mohammed Karajeh, MD
email: [email protected]
Academic Department of Hepatology, Royal Hallamshire Hospital, Sheffield,
UK and University of Sheffield, UK;
5Professor Nicola Woodroofe, PhD
email: [email protected]
Biomolecular Sciences Research Centre, Sheffield Hallam University, UK
1Dr Richard A. Grünewald, DPhil
email: [email protected]
Shanmugarajah
3
Academic Department of Neurosciences, Royal Hallamshire Hospital,
Sheffield, UK and University of Sheffield, UK;
1Professor Marios Hadjivassiliou, MD
email: [email protected]
Academic Department of Neurosciences, Royal Hallamshire Hospital,
Sheffield, UK and University of Sheffield, UK;
Academic Departments of 1Neurosciences and 4Hepatology, Royal
Hallamshire Hospital, Sheffield, UK and University of Sheffield, UK; 2Academic
Unit of Radiology, University of Sheffield, UK; 3Matrix Biology & Tissue Repair
Research Unit, College of Biomedical and Life Sciences, School of Dentistry,
Cardiff University, Cardiff, UK; 5Biomolecular Sciences Research Centre,
Sheffield Hallam University, UK
Corresponding author
Dr Priya D. Shanmugarajah
Academic Department of Neurosciences, Royal Hallamshire Hospital,
Glossop Road, Sheffield S10 2JF, UK
E-mail: [email protected]
Telephone: +44 114 271 2872
Shanmugarajah
4
ABSTRACT
Background: Alcohol-related cerebellar degeneration is one of the commonest
acquired forms of cerebellar ataxia. The exact pathogenic mechanisms by
which alcohol leads to cerebellar damage remain unknown. Possible
autoreactive immune immediate mechanisms have not been explored
previously. In this study, we aim to investigate the potential role of alcohol-
induced immune mediated cerebellar degeneration.
Methods: Patients with ataxia and a history of alcohol misuse were recruited
from the Ataxia and Hepatology tertiary clinics at Sheffield Teaching Hospitals
NHS Trust. We determined the pattern of cerebellar involvement both on
clinical (SARA score) and imaging (MRI volumetry and MR spectroscopy)
parameters. In addition, HLA genotyping, serological markers for gluten-related
disorders and serological reactivity on rat cerebellar tissue using indirect
immunohistochemistry were assessed.
Results: Thirty-eight patients were included in the study all of whom had ataxia.
The gait (97%), stance (89%) and heel-shin slide (89%) were the predominant
SARA elements affected. MRI volumetric and spectroscopy techniques
demonstrated significant structural, volumetric and functional deficits of the
cerebellum with particular involvement of the cerebellar vermis. Circulating anti-
gliadin antibodies were detected in 34% patients vs. 12% in healthy controls.
Antibodies to transglutaminase 6 (TG6) were detected in 39% of patients and
4% of healthy control subjects. Using immunohistochemistry, Purkinje cell and
/ or granular layer reactivity was demonstrated in 71% of patient sera.
Shanmugarajah
5
Conclusions: Alcohol induced tissue injury to the CNS leading to cerebellar
degeneration may also involve immune mediated mechanisms, including
sensitisation to gluten.
Keywords
Alcohol, ataxia, cerebellum, cerebellar degeneration, transglutaminase
Shanmugarajah
6
BACKGROUND
Alcohol misuse is recognized worldwide as a major cause of morbidity and
mortality with significant health and economic consequences. The toxic effects
of alcohol are diverse. Alcohol-related cerebellar degeneration is one of the
commonest causes of acquired cerebellar ataxia. The pathophysiology remains
unclear but proposed mechanisms include excitotoxicity, dietary factors,
oxidative stress, compromised energy production and cell death(1). Some
argue that the direct toxic effects of alcohol on cerebellar cells is responsible,
whilst others report that nutritional factors particularly thiamine deficiency are
required to drive the underlying process(2).
Cerebellar atrophy is a recognised result of alcohol-related cerebellar
degeneration. The anterior superior cerebellar vermis is predominantly
affected(3, 4) with the Purkinje cell, granular and white matter layers being most
susceptible(2). This has been confirmed in large autopsy studies(5, 6). MRI
findings of vermian atrophy, with preferential involvement of the lingula(7), are
in keeping with the neuropathological findings.
Metabolic deficits can be demonstrated by magnetic resonance (MR)
spectroscopy, with low N-acetyl aspartate:creatine ratio (NAA/Cr) in the
cerebellar vermis. MR Spectroscopy can directly detect ethanol by a triple peak
at 1.3 ppm(8). Chronic alcohol use causes a reduction in NAA and choline
levels compared to healthy controls; thus MR spectroscopy provides a useful
tool for monitoring cerebellar function.
Shanmugarajah
7
Chronic alcohol use has been shown to provoke an IgA response that is not
only directed towards alcohol metabolites but also against self antigens,
targeting the enzyme transglutaminase 2 (TG2), even in the absence of liver
disease(9). Transglutaminases are a widely distributed family of enzymes with
cross-linking capability that aid tissue repair(10). TG2 is the autoantigen in
coeliac disease. However, autoimmunity to TG2 can also precipitate hepatitis
and ultimately liver failure(11). Proposed mechanisms for the high prevalence
of TG2 autoantibodies in patients with chronic alcohol abuse include increased
gut permeability associated with alcohol induced intestinal mucosal lesions(9)
leading to increased exposure of the immune system to pathogenic antigens
(including gluten peptides). In line with this, alcohol has been shown to induce
sensitisation to gluten in genetically susceptible individuals(12).
The aim of this study was to investigate further a potential link between
autoreactive immune responses and cerebellar degeneration in the context of
excessive alcohol intake.
METHODS
Subject selection and clinical assessments
The study was approved by the regional ethics committee (Yorkshire & The
Humber, UK). Written informed consent was obtained from all patients.
Patients were recruited from the Ataxia and Hepatology outpatient clinics at the
Royal Hallamshire Hospital, Sheffield, UK. Patients included were grouped as
‘alcohol ataxia (AA)’ and had a history of chronic ‘alcohol dependence’, defined
by the 4th edition of the Diagnostic and Statistical Manual of Mental Disorders
Shanmugarajah
8
(DSM-IV) Diagnostic Criteria for Alcohol Abuse and Dependence(13). A
subgroup of patients with alcohol-related ‘chronic liver disease’ (defined as
alcohol related liver disease diagnosed by a hepatologist and disease present
for more than 1 year) and ataxia (CLDA) was identified from this patient group.
Detailed neurological history and any background history of autoimmune
disorders were recorded, as were age at onset, duration of ataxia, requirement
for mobility aids, and current alcohol intake or abstinence at the time of
recruitment.
Detailed neurological examination was performed. Ataxia was classified as gait,
limb or both and severity was assessed as mild (mobilising independently or
with one walking aid), moderate (mobilising with 2 walking aids or walking
frame) or severe (wheelchair-dependent). The severity assessment was
adapted and modified from previously published data(14). Objective
measurement of the severity of ataxia was rated using the Scale for the
Assessment and Rating of Ataxia (SARA)(15, 16) (see supplementary
material). All patients were investigated for other causes of ataxia and were
excluded if an alternative cause was found. Tests depending on clinical
indications included blood cell counts, biochemistry, thyroid function, B12,
folate and genetic testing for inherited spinocerebellar ataxias (SCA 1, 2, 3, 6,
7) and Friedreich’s ataxia (FA).
Brain imaging
Shanmugarajah
9
Volumetric 3T MR imaging and single-voxel H1 MR spectroscopy of the
cerebellum were undertaken in patients with clinical evidence of ataxia. This
imaging protocol is in clinical use as part of the investigations of all patients with
cerebellar ataxia who attend the National Ataxia Centre in the Royal
Hallamshire Hospital, Sheffield, UK. The brain imaging protocol for structural,
volumetric and spectroscopy studies have been previously reported(12).
The vermis was assessed as a whole for volumetric analysis. A manual
approach was adopted for volumetric analysis of the vermis to avoid partial
volume averaging effects that may also be affected by the degree of atrophy
potentially confounding VBM results (unpublished data). For vermian
volumetric studies, the midline vermis was identified on sagittal T1 volume
images with reference to the midsagittal plane of the cerebellum(17). Based on
this reference, manual measurement of cross sectional areas of the whole
vermis was possible. Vermian volume (V) in mm3 was measured as a sum of
vermis cross sectional areas (mm2) multiplied by 0.9mm thickness. Vermian
volume was expressed as a percentage of the total intracranial volume
(%V:TIV).
Healthy controls recruited, were age and gender matched with patient subjects
and had undergone the same MR Imaging protocol. The details of the healthy
controls have also been previously reported(18).
Blood collection and serological tests
Shanmugarajah
10
Blood samples were collected at recruitment and the serum was aliquoted to
avoid repeat freeze-thawing and stored at -20° C in sealed tubes.
All patients had total immunoglobulin levels, IgA and IgG anti-gliadin antibodies
(AGA), anti-endomysial antibodies (EMA) and IgA anti-transglutaminase 2
(TG2) antibodies, measured by standard laboratory protocols at the
Immunology Department, Northern General Hospital, Sheffield. Briefly, the
measurement for AGA and TG2 were performed by enzyme linked
immunosorbent assay (ELISA) (Aesku. Diagnostics-Grifols, Germany). EMA
was tested by indirect immunofluorescence on slides containing monkey
oesophagus tissue (Inova-Instrumentation Laboratories, USA). Patient sera
were also used for the detection of IgA and IgG to transglutaminase 6 (TG6) by
ELISA as previously described(19).
Human Leukocyte Antigen (HLA) typing was performed at the National Blood
Service, Sheffield, UK.
Immunohistochemistry
Rat cerebellar tissue was acquired from adult Sprague-Dawley rats (Biological
Services, Faculty of Medicine, Dentistry & Health, University of Sheffield). The
cerebellar tissue was mounted using Cryo-M-Bed tissue embedding polymer
(Bright, UK) and snap-frozen with isopentane / cooled on liquid nitrogen. The
cerebellar tissue was cryo-sectioned into 10m sagittal sections that were
collected on polysine-coated slides (Thermo Scientific, UK), stored at -80 C in
an airtight container.
Shanmugarajah
11
Mouse anti-calbindin-D-28K monoclonal antibody (Sigma, UK) diluted 1:200 in
PBS was used to visualize Purkinje cells. Patient sera were diluted 1:200 or
1:600 in PBS before incubation with sections for 1h. 1:600 was identified as the
optimum dilution in determining the reactivity of patient sera on rat cerebellar
tissue in agreement with our previous study(20). Negative controls included
sections incubated without patient sera. A horseradish peroxidase-conjugated
goat anti-human or goat anti-mouse IgG antibody (Jackson ImmunoResearch
Laboratories, USA) was used as secondary antibodies.
Images were captured at X100 and X200 magnification. Two blinded observers
performed the evaluation of the Purkinje cell staining intensity on rat cerebellar
sections independently. Staining was classed as ‘weak’ or ‘strong’ if Purkinje
cell staining was above background levels. ‘Negative’ was recorded if staining
did not exceed background levels. Staining of other neuronal cell populations
(granular layer) was also noted. Concordance rate between assessors was
79%.
Statistical analysis
Statistical analysis was performed using PRISM 6 software package
(GraphPad Software Inc.). Demographic, clinical and imaging characteristics
are presented as means with standard deviations (mean ± SD). The
Independent-Samples Mann-Whitney U Test was used to determine any
difference between mean % cerebellar volume (CBV) : total intracranial volume
(TIV) and mean % vermian volume (V) : total intracranial volume (TIV) between
Shanmugarajah
12
patients and controls. The 2 test was used for comparing the prevalence of
anti-gliadin antibodies and anti-transglutaminase 6 antibodies in the study
group with that of the healthy population; and between the subgroups. Results
were considered statistically significant for p < 0.05.
RESULTS
Clinical presentation
Thirty-eight patients were recruited with mean age of 54 ± 10 years. There were
31 male and 7 female patients. All patients had clinical evidence of ataxia. Thirty
of the 38 (79%) patients were grouped as ‘alcohol ataxia’ (AA) as ataxia was
their presenting complaint. A further group of 8/38 (21%) patients recruited
from the Hepatology clinics, were selected on the basis of having alcohol-
related chronic liver disease, but were also found to have ataxia, hence
categorised as ‘chronic liver disease and ataxia’ (CLDA). Fourteen patients
(37%) had been abstinent from alcohol consumption at the time of recruitment.
A background of autoimmune history (diabetes (2), thyroid disorder (1),
pernicious anaemia (4)) was seen in 7/38 (18%) patients.
Age of ataxia onset was 49 ± 11 years. Duration of ataxia ranged from one to
27 years (Mean 6 ± 5 years). Pure gait ataxia was found in 4/38 (11%) patients
and the majority of 34/38 (89%) patients had both gait and limb ataxia.
Nystagmus was present in 11/38 (29%) patients.
Forty seven percent had mild ataxia (mobilising independently or with one
walking aid). Moderate ataxia was seen in 34% and severe ataxia was seen in
18% patients. There was no difference in the autoimmune profile between
Shanmugarajah
13
patients with mild, moderate or severe ataxia. The severity of ataxia using the
SARA scale revealed a mean total SARA score of 12 ± 7 (range 1 to 26). There
was a correlation seen between duration of ataxia and total SARA score (p
0.0272).
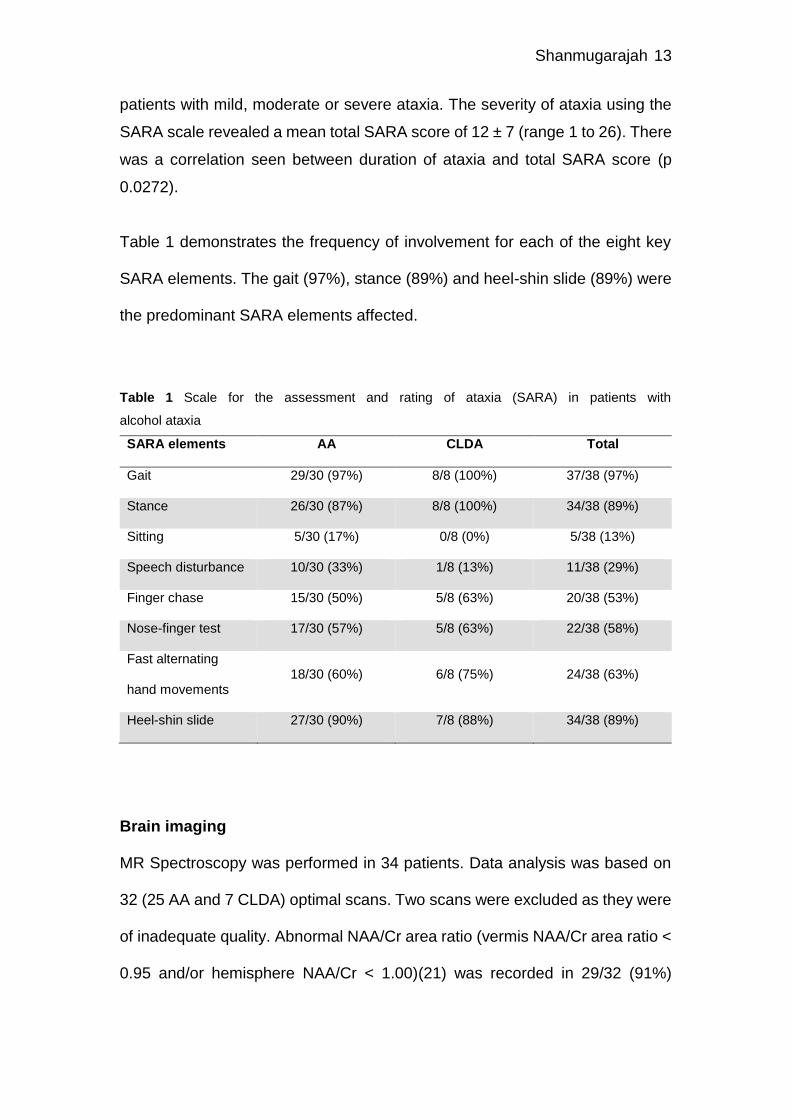
Table 1 demonstrates the frequency of involvement for each of the eight key
SARA elements. The gait (97%), stance (89%) and heel-shin slide (89%) were
the predominant SARA elements affected.
Table 1 Scale for the assessment and rating of ataxia (SARA) in patients with
alcohol ataxia
SARA elements AA CLDA Total
Gait 29/30 (97%) 8/8 (100%) 37/38 (97%)
Stance 26/30 (87%) 8/8 (100%) 34/38 (89%)
Sitting 5/30 (17%) 0/8 (0%) 5/38 (13%)
Speech disturbance 10/30 (33%) 1/8 (13%) 11/38 (29%)
Finger chase 15/30 (50%) 5/8 (63%) 20/38 (53%)
Nose-finger test 17/30 (57%) 5/8 (63%) 22/38 (58%)
Fast alternating
hand movements 18/30 (60%) 6/8 (75%) 24/38 (63%)
Heel-shin slide 27/30 (90%) 7/8 (88%) 34/38 (89%)
Brain imaging
MR Spectroscopy was performed in 34 patients. Data analysis was based on
32 (25 AA and 7 CLDA) optimal scans. Two scans were excluded as they were
of inadequate quality. Abnormal NAA/Cr area ratio (vermis NAA/Cr area ratio <
0.95 and/or hemisphere NAA/Cr < 1.00)(21) was recorded in 29/32 (91%)
Shanmugarajah
14
patients. This included 22/25 (88%) patients with AA and 7/7 (100%) patients
with CLDA.
Predominantly vermian abnormalities were present in 18/25 (72%) patients with
AA and 6/7 (86%) patients with CLDA. The hemisphere was solely affected in
only 4/25 (16%) patients with AA and 1/7 (14%) patients with CLDA.
Volumetric Image analysis matched for age and gender with healthy controls
was possible in 28 patients (22 patients with AA and 6 patients with CLDA).
Results are displayed as a whole group (AA and CLDA) vs. controls. Cerebellar
volume (%CBV:TIV) was significantly smaller (8.68 ± 0.99) in this study group
when compared with age and gender matched healthy controls (9.57 ± 0.96);
CI 95% 8.29 to 9.06, p 0.0027. Similarly, vermian volume (%V:TIV) was
significantly smaller in the study group (1.13 ± 0.24) when compared to age and
gender matched healthy controls (1.34 ± 0.13); CI 95% 1.03 to 1.22, p 0.0003.
There was no significant correlation seen between total SARA score and brain
imaging measures.
Serological testing for gluten-related antibodies
Normal total serum immunoglobulins were seen in 21/38 (55%) patients.
Raised IgA levels were seen in 8/38 (21%) patients.
Circulating anti-gliadin antibodies were detected in 13/38 (34%) patients (8 AA
and 5 CLDA) compared with a 12% prevalence in healthy controls(22) (2 p
0.012). The difference between the AA and CLDA groups was not statistically
Shanmugarajah
15
significant. Circulating anti-transglutaminase 2 (TG2) antibodies were
demonstrated in 4/38 (11%) patients, (3 AA and 1 CLDA). The three AA patients
had low TG2 titres and the one CLDA patient had TG2 titres >300 U/mL. No
patients tested positive for EMA.
Antibodies to transglutaminase 6 (TG6) were detected in 15/38 (39%) patients
vs. 4% in healthy controls(23) (2 p <0.0001). The 15 patients with anti-TG6
antibodies included 9/30 (30%) patients with AA and 6/8 (75%) patients with
CLDA (2 p 0.0207). Thirteen of the 15 patients had IgA anti-TG6 antibodies,
one had IgG anti-TG6 antibodies and one patient had both IgA and IgG anti-
TG6 antibodies.
HLA genotyping for DQ2 / DQ8
Eighteen of the 38 (47%) patients in the study group had HLA type DQ2 or
DQ8. This was not significantly different from the healthy population of 30%(24)
(p 0.056). There was no significant difference between any subgroup (AA vs.
CLDA), using the 2 test.
Serum reactivity with neural tissue
Three specific staining patterns were identified (pure Purkinje cell, pure
granular layer and combined Purkinje cell and granular layer staining pattern)
when rat brain sections were incubated with patient sera (see supplementary
material). In 27/38 (71%) patients, one of these patterns was present.
Shanmugarajah
16
Pure Purkinje cell (PC) staining was demonstrated in 4/38 (11%) patients. This
included 3/30 (10%) patients with AA and 1/8 (13%) patients with CLDA. Pure
granular layer staining was demonstrated in 16/38 (42%) patients. This
included 12/30 (40%) patients with AA and 4/8 (50%) patients with CLDA.
Combined Purkinje cell and granular layer staining was demonstrated in 7/38
(18%) patients that included 5/30 (17%) patients with AA and 2/8 (25%) patients
with CLDA.
Overall, Purkinje cell reactivity was seen in 11/38 (29%) of patients and granular
layer reactivity in 23/38 (61%) patients. There was no statistically significant
difference in prevalence of Purkinje cell and / or granular layer staining between
the 2 subgroups.
Based on the same methodology, our previous studies did not demonstrate any
staining in healthy controls and showed only 5% staining in patients with genetic
ataxia(20, 25). Table 2. summarises the serological characteristics of patients
with alcohol ataxia.
DISCUSSION
In this study, we investigated whether an autoimmune process may drive
alcohol-induced cerebellar damage. Our initial intention was to study patients
with alcoholic liver disease without ataxia and a subgroup of patients who
presented with alcohol-induced ataxia. However, all patients with alcoholic liver
disease were found to also have ataxia thus a subgroup of patients with ‘chronic
liver disease and ataxia’ was defined. This division into 2 subgroups is
Shanmugarajah
17
somewhat arbitrary as patients with alcohol-induced ataxia almost always have
some degree of liver involvement (demonstrated by elevated levels of gamma
GT). Given the overlap in functional deficits, our sample size would also be too
small to make any definitive conclusions on specific differences between the 2
subgroups. Nonetheless, we still studied the 2 subgroups given the distinct
differences in presentation.
Imaging data using MRI volumetric and spectroscopy techniques demonstrated
significant structural and functional deficits of the cerebellum, with preferential
involvement of the cerebellar vermis. There was significant vermian volume
loss in patients with alcohol ataxia compared to age and gender matched
healthy controls. The findings support neuropathological data that alcohol-
related cerebellar degeneration preferentially affects the cerebellar vermis (2-
7). Vermian involvement is common in immune-mediated ataxias such as
gluten ataxia, paraneoplastic cerebellar degeneration and primary autoimmune
cerebellar ataxia(26). We did not find any correlation between the imaging
findings and the serological and immunohistochemical findings in this cohort.
The sample size, however, may be a contributory factor to this.
Alcohol excess is associated with impairment of the blood-brain barrier. The
oxidative stress caused by alcohol metabolism on brain microvascular
endothelial cells by activation of myosin light chain kinase leads to disruption of
the tight junctions inducing blood-brain barrier breakdown(27, 28). This
enhanced permeability may lead to neo-epitope exposure to the immune
system and thereby induction of autoimmune responses to these neo-epitopes
Shanmugarajah
18
or allow reaction of serum antibodies with neural tissue and consequently
trigger localized inflammatory processes in the brain. In line with this, we show
that 71% of patients with alcohol ataxia have circulating antibodies that react
with neural tissue. Three cerebellar staining patterns were seen when rat brain
sections were incubated with patient sera: pure Purkinje cell (11%), pure
granular layer (42%) and combined Purkinje cell and granular layer (18%). We
have previously shown that up to 60% of patients with idiopathic sporadic ataxia
have anti-cerebellar antibodies as opposed to 5% of patients with genetic
ataxia(25). It is possible that alcohol is a contributing factor to “idiopathic”
sporadic ataxia, or that similar immune-mediated processes can be triggered
by infection or other unrelated environmental factors in addition to alcohol.
Increased gut permeability and mucosal damage are typical clinical findings in
patients with alcohol misuse. Not surprisingly, this may trigger a breakdown in
immune tolerance and autoimmune responses in patients harbouring genetic
susceptibility (HLA DQ2/DQ8). Excessive alcohol intake is a risk factor for
coeliac disease development(9, 12). TG2 IgA autoantibody titres have been
reported to positively correlate with liver disease(9) which is in accordance with
the view that liver disease per se may be associated with the occurrence of
TG2 autoantibodies(11). The role of TG in tissue repair and its deposition into
the extracellular matrix(29) may lead to abundant autoantibody binding and
thereby drive chronic inflammation and fibrogenesis. Only one of the patients
examined here had high levels of circulating anti-TG2 autoantibodies
suggesting that coeliac disease is not a primary underlying mechanism in this
cohort selected on the basis of neurological deficits. However, in gluten-related
Shanmugarajah
19
disorders with extraintestinal manifestation, particularly neurological,
enteropathy may not be present and autoantibodies to TG2 may not be
detectable in the circulation(19, 23).
It is therefore of interest that firstly, we found a significantly higher prevalence
of anti-gliadin antibodies in the study group (34%) compared to healthy controls
(12%) and secondly that we found a significantly higher prevalence of anti-TG6
antibodies in the study group (39%) compared to healthy control subjects (4%).
Circulating anti-TG6 antibodies are the best marker currently available for
patients with primarily neurological presentation of gluten-related disorders(23).
However, their prevalence in the study group was not substantially different to
what we previously reported for idiopathic ataxia (32%), and the association of
AGA and anti-TG6 autoantibodies is in line with previous findings (gluten
ataxia)(23). Clearly, these antibodies alone cannot explain the serum reactivity
to the granular layer neurons in most of these patients(20, 30). Anti-TG6
antibodies were more prevalent in the subgroup of patients with CLDA (75%)
compared to the subgroup of patients with AA (30%) suggesting that alcohol-
related chronic liver disease itself may be another risk factor for the
development of autoimmunity to TG6. It remains to be shown where the
immune response to TG6 develops. The fact that almost exclusively an IgA
response was seen makes the gastrointestinal tract a likely candidate.
CONCLUSIONS
Taken together, these results suggest that factors other than direct cellular
toxicity from alcohol, including autoimmune responses, may play a part in
Shanmugarajah
20
cerebellar degeneration in patients with alcohol ataxia. The role of gluten
sensitivity merits further exploration but the findings of this and previous studies
suggest that sensitivity to gluten may be an epiphenomenon, likely resulting
from increased gut permeability. Development of gluten-related autoantibodies,
however, may perpetuate cerebellar degeneration even when the patient
abstains from alcohol intake. If that proves to be the case, a gluten free diet
may prove to be beneficial for such patients.
DECLARATIONS
List of abbreviations
AGA anti-gliadin antibody
CNS central nervous system
EMA endomysial antibody
HLA human leukocyte antigen
MRI magnetic resonance imaging
NAA/Cr N-acetyl aspartate:creatine ratio
SARA Scale for the Assessment and Rating of Ataxia
TG2 transglutaminase 2
TG6 transglutaminase 6
Ethics approval and consent to participate
The study was approved by the regional ethics committee (Yorkshire & The
Humber, UK). Written informed consent was obtained from all patients.
Consent for publication
Shanmugarajah
21
Not applicable.
Availability of data and materials
The datasets supporting the conclusions of this article is included within the
main article.
Competing interests
Dr P Shanmugarajah reports no competing interests.
Dr N Hoggard reports no competing interests.
Dr S Currie reports no competing interests.
Professor D Aeschlimann serves as a scientific advisor/collaborator to Zedira
(without financial incentives) but receives royalties from Zedira for patents.
Mrs Pascale Aeschlimann reports no competing interests.
Professor Dermot Gleeson reports no competing interests.
Dr Mohammed Karajeh reports no competing interests.
Professor N Woodroofe reports no competing interests.
Dr R Grünewald reports no competing interests.
Professor M Hadjivassiliou reports no competing interests.
Funding
Bardhan Research and Education Trust.
Neurological Research Fund, Sheffield Hospitals Charity.
Sheffield Teaching Hospital NHS Foundation Trust.
Authors’ contributions
Shanmugarajah
22
MH and PS designed the study and produced the first draft of the manuscript.
PS recruited all the patients and performed the clinical, brain imaging and
laboratory assessments including analysis of the imaging data,
immunohistochemistry and ELISA experiments. NH and SC provided expertise
on brain imaging. DA and PA supervised and helped interpret the laboratory
work on TG6 antibody measurements. DG and MK provided the patients with
alcohol related chronic liver disease. RG provided the statistical support and
critical revision of the first draft. NW supervised the immunohistochemistry
experiments. MH and NH were the overall supervisors of PS. All authors read
the manuscript and made necessary changes to the final version.
Acknowledgements
National Blood Service Sheffield, UK; Department of Immunology, Northern
General Hospital, Sheffield, UK and Academic Unit of Radiology, University of
Sheffield, UK.
Supplementary material
Scale for the Assessment and Rating of Ataxia (SARA).
Immunohistochemistry staining patterns illustrating serum reactivity with neural
tissue.
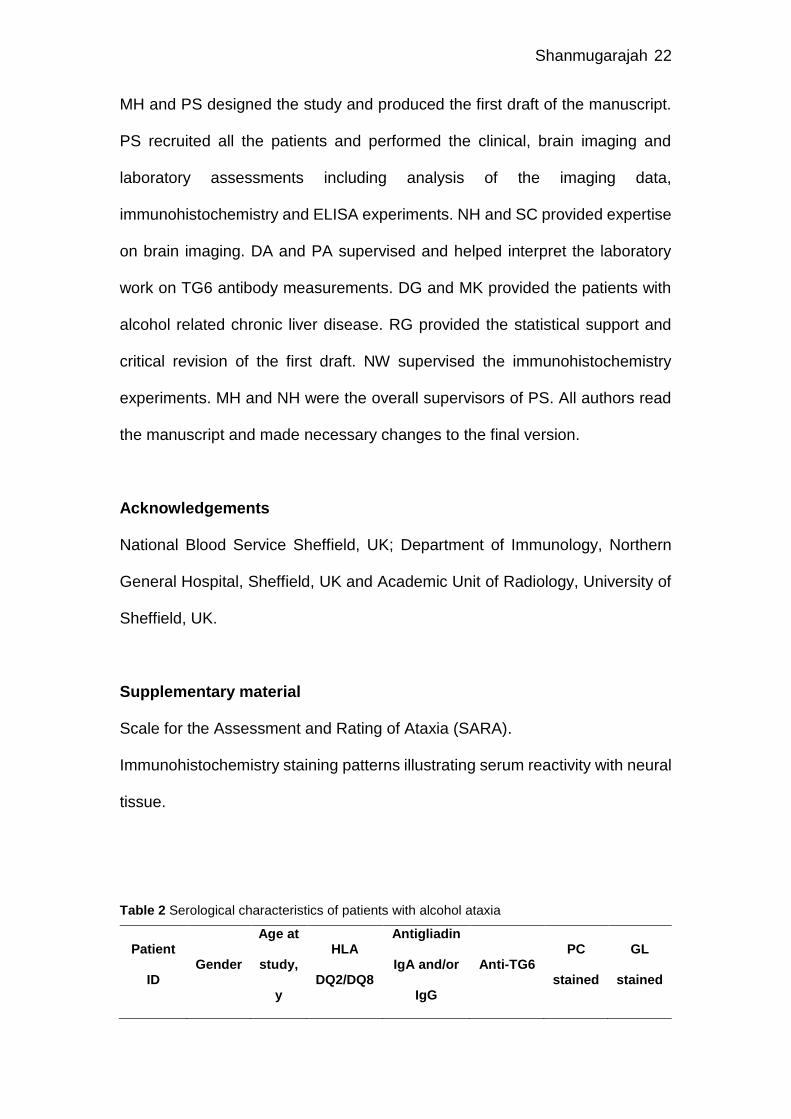
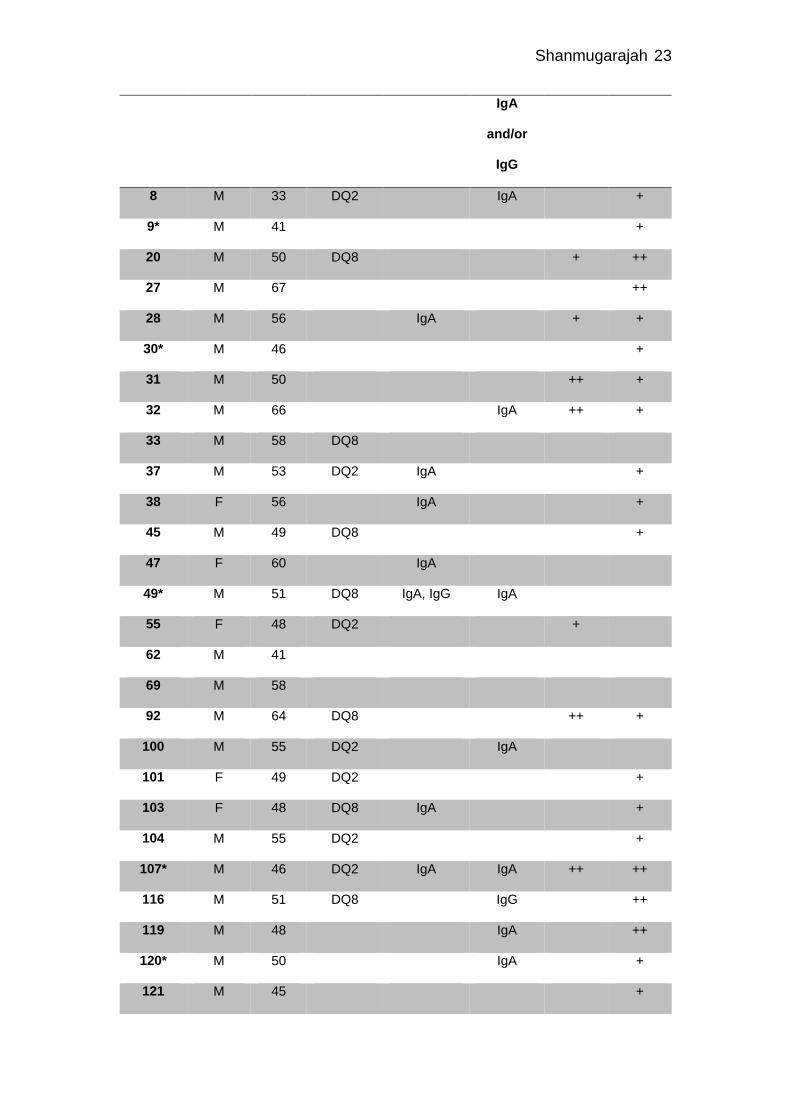
Table 2 Serological characteristics of patients with alcohol ataxia
Patient
ID Gender
Age at
study,
y
HLA
DQ2/DQ8
Antigliadin
IgA and/or
IgG
Anti-TG6 PC
stained
GL
stained
Shanmugarajah
23
IgA
and/or
IgG
8 M 33 DQ2 IgA +
9* M 41 +
20 M 50 DQ8 + ++
27 M 67 ++
28 M 56 IgA + +
30* M 46 +
31 M 50 ++ +
32 M 66 IgA ++ +
33 M 58 DQ8
37 M 53 DQ2 IgA +
38 F 56 IgA +
45 M 49 DQ8 +
47 F 60 IgA
49* M 51 DQ8 IgA, IgG IgA
55 F 48 DQ2 +
62 M 41
69 M 58
92 M 64 DQ8 ++ +
100 M 55 DQ2 IgA
101 F 49 DQ2 +
103 F 48 DQ8 IgA +
104 M 55 DQ2 +
107* M 46 DQ2 IgA IgA ++ ++
116 M 51 DQ8 IgG ++
119 M 48 IgA ++
120* M 50 IgA +
121 M 45 +
Shanmugarajah
24
122* M 50 IgA IgA +
125 F 66 DQ2 IgA
128 M 68 DQ2 IgA
132 M 62
133* M 59 DQ2 IgA IgA + ++
134 F 58 +
135 M 57 IgA IgA +
136* M 47 IgA IgA +
139 M 65 DQ2 IgA, IgG IgA, IgG
143 M 67 IgG
145 M 81 +
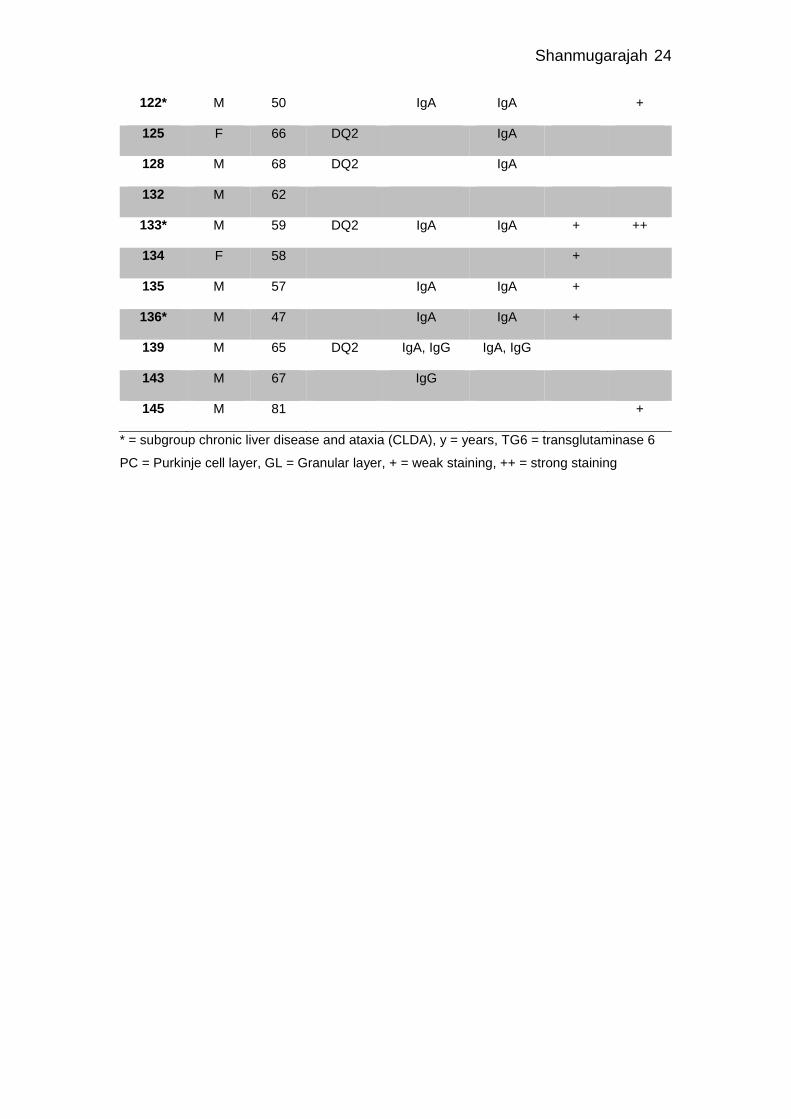
* = subgroup chronic liver disease and ataxia (CLDA), y = years, TG6 = transglutaminase 6
PC = Purkinje cell layer, GL = Granular layer, + = weak staining, ++ = strong staining
Shanmugarajah
25
References 1. Jaatinen P, Rintala J. Mechanisms of ethanol-induced degeneration in the developing, mature, and aging cerebellum. Cerebellum. 2008;7(3):332-47. 2. de la Monte SM, Kril JJ. Human alcohol-related neuropathology. Acta Neuropathol. 2014;127(1):71-90. 3. Phillips SC, Harper CG, Kril J. A quantitative histological study of the cerebellar vermis in alcoholic patients. Brain. 1987;110 ( Pt 2):301-14. 4. Andersen BB. Reduction of Purkinje cell volume in cerebellum of alcoholics. Brain Res. 2004;1007(1-2):10-8. 5. Yokota O, Tsuchiya K, Terada S, Oshima K, Ishizu H, Matsushita M, et al. Frequency and clinicopathological characteristics of alcoholic cerebellar degeneration in Japan: a cross-sectional study of 1,509 postmortems. Acta Neuropathol. 2006;112(1):43-51. 6. Darke S, Duflou J, Torok M, Prolov T. Toxicology, circumstances and pathology of deaths from acute alcohol toxicity. J Forensic Leg Med. 2013;20(8):1122-5. 7. Anderson CM, Rabi K, Lukas SE, Teicher MH. Cerebellar lingula size and experiential risk factors associated with high levels of alcohol and drug use in young adults. Cerebellum. 2010;9(2):198-209. 8. Currie S, Hadjivassiliou M, Craven IJ, Wilkinson ID, Griffiths PD, Hoggard N. Magnetic resonance imaging biomarkers in patients with progressive ataxia: current status and future direction. Cerebellum. 2013;12(2):245-66. 9. Koivisto H, Hietala J, Anttila P, Niemelä O. Co-occurrence of IgA antibodies against ethanol metabolites and tissue transglutaminase in alcohol consumers: correlation with proinflammatory cytokines and markers of fibrogenesis. Dig Dis Sci. 2008;53(2):500-5. 10. Aeschlimann D, Thomazy V. Protein crosslinking in assembly and remodelling of extracellular matrices: the role of transglutaminases. Connect Tissue Res. 2000;41(1):1-27. 11. Kaukinen K, Halme L, Collin P, Färkkilä M, Mäki M, Vehmanen P, et al. Celiac disease in patients with severe liver disease: gluten-free diet may reverse hepatic failure. Gastroenterology. 2002;122(4):881-8. 12. Currie S, Hoggard N, Clark MJ, Sanders DS, Wilkinson ID, Griffiths PD, et al. Alcohol induces sensitization to gluten in genetically susceptible individuals: a case control study. PLoS One. 2013;8(10):e77638. 13. Keyes KM, Geier T, Grant BF, Hasin DS. Influence of a drinking quantity and frequency measure on the prevalence and demographic correlates of DSM-IV alcohol dependence. Alcohol Clin Exp Res. 2009;33(5):761-71. 14. Hadjivassiliou M, Grünewald RA, Chattopadhyay AK, Davies-Jones GA, Gibson A, Jarratt JA, et al. Clinical, radiological, neurophysiological, and neuropathological characteristics of gluten ataxia. Lancet. 1998;352(9140):1582-5. 15. Schmitz-Hübsch T, du Montcel ST, Baliko L, Berciano J, Boesch S, Depondt C, et al. Scale for the assessment and rating of ataxia: development of a new clinical scale. Neurology. 2006;66(11):1717-20. 16. Weyer A, Abele M, Schmitz-Hübsch T, Schoch B, Frings M, Timmann D, et al. Reliability and validity of the scale for the assessment and rating of ataxia: a study in 64 ataxia patients. Mov Disord. 2007;22(11):1633-7.
Shanmugarajah
26
17. Schmahmann JD, Doyon J, McDonald D, Holmes C, Lavoie K, Hurwitz AS, et al. Three-dimensional MRI atlas of the human cerebellum in proportional stereotaxic space. Neuroimage. 1999;10(3 Pt 1):233-60. 18. Currie S, Hadjivassiliou M, Wilkinson ID, Griffiths PD, Hoggard N. Magnetic resonance spectroscopy of the normal cerebellum: what degree of variability can be expected? Cerebellum. 2013;12(2):205-11. 19. Hadjivassiliou M, Aeschlimann P, Strigun A, Sanders DS, Woodroofe N, Aeschlimann D. Autoantibodies in gluten ataxia recognize a novel neuronal transglutaminase. Ann Neurol. 2008;64(3):332-43. 20. Hadjivassiliou M, Boscolo S, Davies-Jones GA, Grünewald RA, Not T, Sanders DS, et al. The humoral response in the pathogenesis of gluten ataxia. Neurology. 2002;58(8):1221-6. 21. Currie S, Hadjivassiliou M, Craven IJ, Wilkinson ID, Griffiths PD, Hoggard N. Magnetic resonance spectroscopy of the brain. Postgrad Med J. 2013;89(1048):94-106. 22. Hadjivassiliou M, Gibson A, Davies-Jones GA, Lobo AJ, Stephenson TJ, Milford-Ward A. Does cryptic gluten sensitivity play a part in neurological illness? Lancet. 1996;347(8998):369-71. 23. Hadjivassiliou M, Aeschlimann P, Sanders DS, Mäki M, Kaukinen K, Grünewald RA, et al. Transglutaminase 6 antibodies in the diagnosis of gluten ataxia. Neurology. 2013;80(19):1740-5. 24. Dewar D, Pereira SP, Ciclitira PJ. The pathogenesis of coeliac disease. Int J Biochem Cell Biol. 2004;36(1):17-24. 25. Hadjivassiliou M, Boscolo S, Tongiorgi E, Grünewald RA, Sharrack B, Sanders DS, et al. Cerebellar ataxia as a possible organ-specific autoimmune disease. Mov Disord. 2008;23(10):1370-7. 26. Hadjivassiliou M. Immune-mediated acquired ataxias. Handb Clin Neurol. 2012;103:189-99. 27. Haorah J, Heilman D, Knipe B, Chrastil J, Leibhart J, Ghorpade A, et al. Ethanol-induced activation of myosin light chain kinase leads to dysfunction of tight junctions and blood-brain barrier compromise. Alcohol Clin Exp Res. 2005;29(6):999-1009. 28. Haorah J, Knipe B, Leibhart J, Ghorpade A, Persidsky Y. Alcohol-induced oxidative stress in brain endothelial cells causes blood-brain barrier dysfunction. J Leukoc Biol. 2005;78(6):1223-32. 29. Grenard P, Bresson-Hadni S, El Alaoui S, Chevallier M, Vuitton DA, Ricard-Blum S. Transglutaminase-mediated cross-linking is involved in the stabilization of extracellular matrix in human liver fibrosis. J Hepatol. 2001;35(3):367-75. 30. Boscolo S, Lorenzon A, Sblattero D, Florian F, Stebel M, Marzari R, et al. Anti transglutaminase antibodies cause ataxia in mice. PLoS One. 2010;5(3):e9698.