Embed Size (px)
DESCRIPTION
Â
Citation preview
Shanks Group plcCorporate Responsibility Report 2013
Making more from waste

Contents
Chief Executive’s statement
P4
Our people
P19
Our vision and highlights
Leading sustainable waste management 1Group highlights 2
A sustainable business
Chief Executive’s statement 4A sustainable business 5Our strategy 6
Key corporate responsibility objectives
Core CR objectives and progress 7
Sustainability and the environment
Sustainability and the environment case studies 9How we contribute to sustainability 10Sustainability and carbon performance highlights 11Technologies and sustainability 13Environmental performance highlights 14
Health and safety
Health and safety case studies 16Health and safety in a high risk industry 17Health and safety performance highlights 18
Our people
Our people case studies 19Our values, culture and people 20Our people performance highlights 21
Working with the community
Community relations case studies 22Sustainable community relations 23Community relations performance highlights 24
Sustainable management
Sustainable management systems 25Management systems performance highlights 26
Driving and embedding corporate responsibility
Corporate responsibility framework 27CR and H&S Committee site visits 27
Links, contacts and further information
More about our CR performance 28Contacts 29
Corporate Responsibility objectives
P7

Shanks Group plcCorporate Responsibility Report 20131
Our visio
n and hig
hlightsShanks Group is a leading
international sustainable waste management business.We meet the growing need to manage waste without damaging the environment. Our solutions reduce greenhouse gas emissions, recycle natural resources and limit fossil fuel dependency. Shanks uses a range of sustainable and cost-effective technologies to make valuable products from what is thrown away and generate increasing returns for our shareholders. We produce green energy, recovered fuel, recycled commodities and organic fertiliser.Shanks operates in four divisions that reflect our markets: Solid, Hazardous, Organics and UK Municipal. It has operations in the Netherlands, Belgium, UK and Canada, and employs around 4,000 people. In its target markets, the Group is at the forefront in providing sustainable waste management solutions for both the public and private sectors.
About the data in this reportSince publishing our Corporate Responsibility (CR) Report 2012, we have reorganised the business into four market-facing divisions:
•Solid Waste: the collection and treatment of non-hazardous waste
•Hazardous Waste: the reprocessing and recycling of contaminated soil, water and other contaminated materials and industrial cleaning
•Organics: The treatment of food waste, garden waste and other organic materials
•UK Municipal: long-term PFI or PPP contracts providing recycling and waste management services to local authorities and commercial activities in the UK
Our CR reporting data is split into: Benelux Solid Waste (activities in the Netherlands, Belgium and Northern France), Hazardous Waste (hazardous waste operations and industrial cleaning in the Netherlands), Organics (organic waste treatment in the Netherlands and Canada only) and UK (municipal, organics and solid waste activities in the UK).
In previous years, CR data was split by country. We recognise the need to compare performance over time and so we have recalculated our CR data for 2012 in this report to provide a consistent view of our CR activity over the past two years. Note that we have not adjusted the data in our older CR reports, and these are still available on our corporate website.
Data is represented in financial years unless otherwise stated. Single years are noted in tables and graphs (for example, 2013 for the financial year ending March 2013). Details of the definitions used are contained in our CR indicators document, available at www.shanksplc.com/cr.
Leading sustainable waste management
Shanks Group plcCorporate Responsibility Report 20132
Our visio
n and hig
hlights
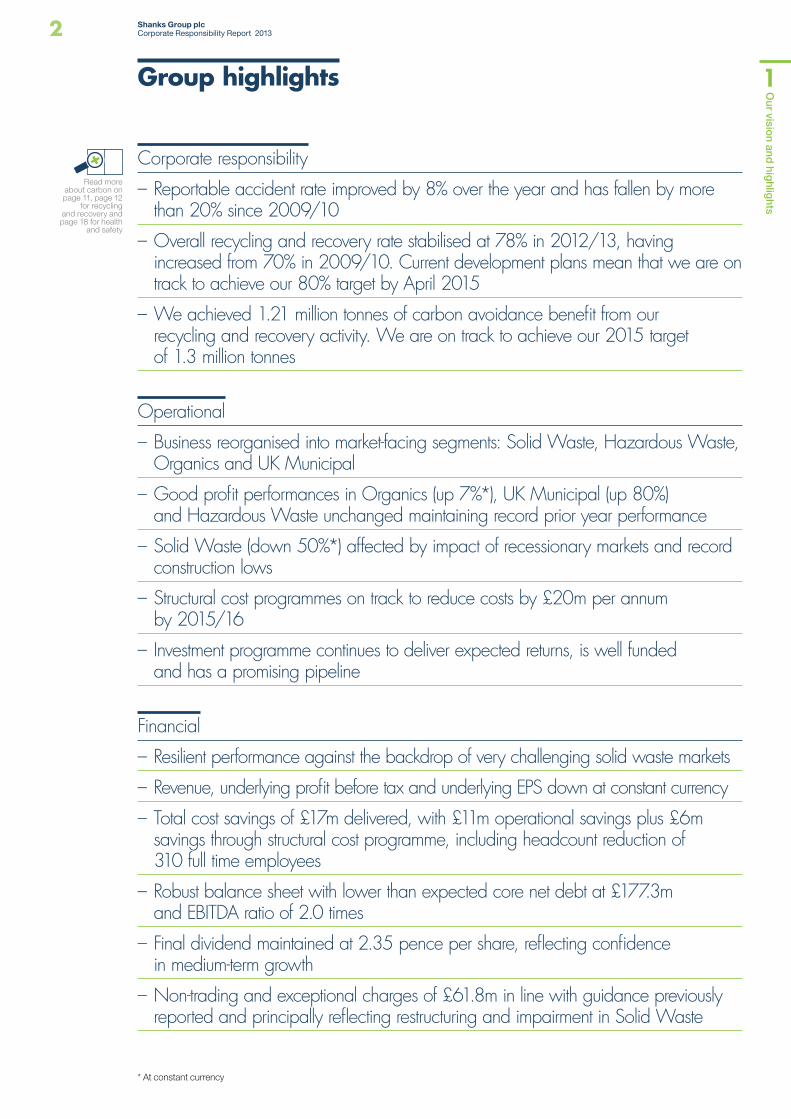
Corporate responsibility
– Reportable accident rate improved by 8% over the year and has fallen by more than 20% since 2009/10
– Overall recycling and recovery rate stabilised at 78% in 2012/13, having increased from 70% in 2009/10. Current development plans mean that we are on track to achieve our 80% target by April 2015
– We achieved 1.21 million tonnes of carbon avoidance benefit from our recycling and recovery activity. We are on track to achieve our 2015 target of 1.3 million tonnes
Operational
– Business reorganised into market-facing segments: Solid Waste, Hazardous Waste, Organics and UK Municipal
– Good profit performances in Organics (up 7%*), UK Municipal (up 80%) and Hazardous Waste unchanged maintaining record prior year performance
– Solid Waste (down 50%*) affected by impact of recessionary markets and record construction lows
– Structural cost programmes on track to reduce costs by £20m per annum by 2015/16
– Investment programme continues to deliver expected returns, is well funded and has a promising pipeline
Financial
– Resilient performance against the backdrop of very challenging solid waste markets
– Revenue, underlying profit before tax and underlying EPS down at constant currency
– Total cost savings of £17m delivered, with £11m operational savings plus £6m savings through structural cost programme, including headcount reduction of 310 full time employees
– Robust balance sheet with lower than expected core net debt at £177.3m and EBITDA ratio of 2.0 times
– Final dividend maintained at 2.35 pence per share, reflecting confidence in medium-term growth
– Non-trading and exceptional charges of £61.8m in line with guidance previously reported and principally reflecting restructuring and impairment in Solid Waste
Group highlights
Read more about carbon on page 11, page 12
for recycling and recovery and page 18 for health
and safety
* At constant currency
Shanks Group plcCorporate Responsibility Report 20133
Our visio
n and hig
hlights
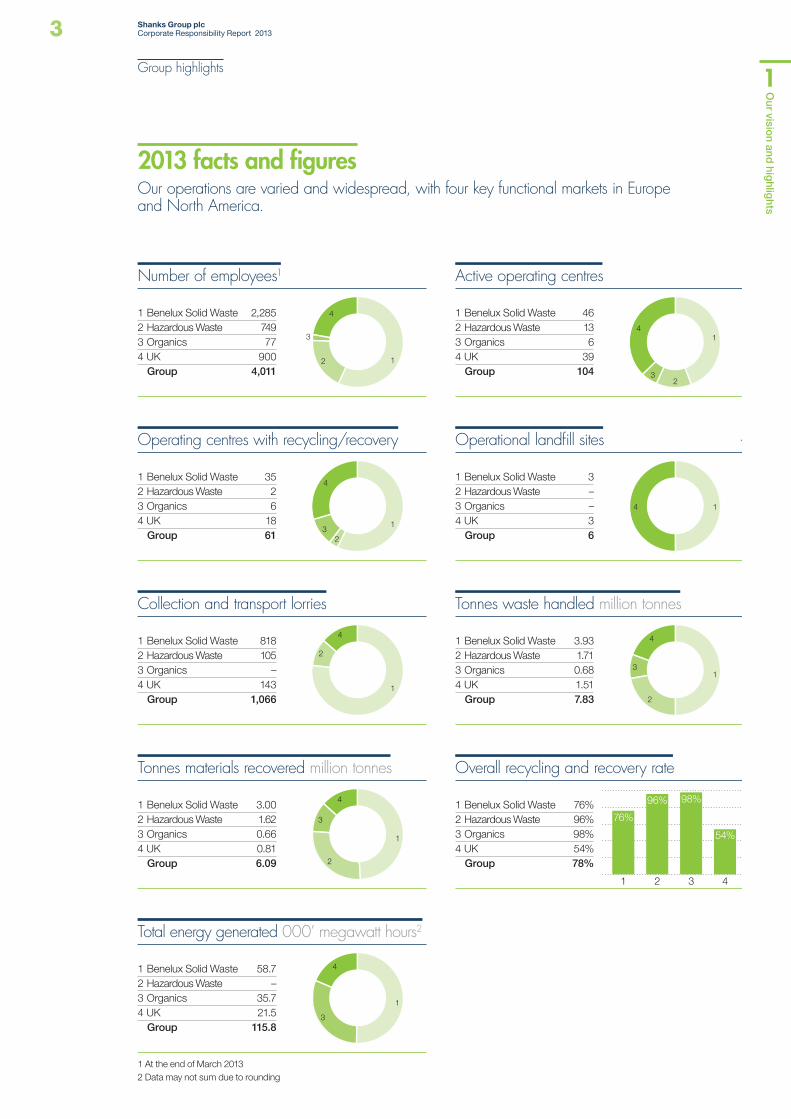
Number of employees1
1 Benelux Solid Waste 2,2852 Hazardous Waste 7493 Organics 774 UK 900 Group 4,011
12
3
4
Operating centres with recycling/recovery
1 Benelux Solid Waste 352 Hazardous Waste 23 Organics 64 UK 18 Group 61
1
23
4
Collection and transport lorries
1 Benelux Solid Waste 8182 Hazardous Waste 1053 Organics –4 UK 143 Group 1,066
1
2
4
Tonnes materials recovered million tonnes
1 Benelux Solid Waste 3.002 Hazardous Waste 1.623 Organics 0.664 UK 0.81 Group 6.09
1
2
3
4
Total energy generated 000’ megawatt hours2
1 Benelux Solid Waste 58.72 Hazardous Waste –3 Organics 35.74 UK 21.5 Group 115.8
1
3
4
Active operating centres
1 Benelux Solid Waste 462 Hazardous Waste 133 Organics 64 UK 39 Group 104
1
23
4
Operational land�ll sites
1 Benelux Solid Waste 32 Hazardous Waste –3 Organics –4 UK 3 Group 6
14
Tonnes waste handled million tonnes
1 Benelux Solid Waste 3.932 Hazardous Waste 1.713 Organics 0.684 UK 1.51 Group 7.83
1
2
3
4
Overall recycling and recovery rate
1 Benelux Solid Waste 76%2 Hazardous Waste 96%3 Organics 98%4 UK 54% Group 78%
1.5
4321
76%
96% 98%
54%
2013 facts and figuresOur operations are varied and widespread, with four key functional markets in Europe and North America.
Group highlights
1 At the end of March 20132 Data may not sum due to rounding
Our business is at the heart of a global shift in attitudes towards wastePeter Dilnot Group Chief Executive
Shanks Group plcCorporate Responsibility Report 20134
A sustainab
le business
Our ability to deliver world-class services is underpinned by successfully developing and recruiting a strong Shanks team. This year we have introduced an improved personal development system which is centred on our values and enables our people to enhance their skills. In order to further improve the health and safety of our employees, we have also re-shaped our Group Health & Safety Committee. This has led to a major new traffic safety initiative, the launch of a Group-wide safety award system, improved safety measurement and safety summits held across all parts of the Group.Our Group operates from many sites in the UK, Netherlands, Belgium and Canada. We have relationships with, and a strong commitment to, all neighbouring communities and local regulators. Without their approval and support we cannot operate effectively, or deliver sustainable services for the communities and customers we serve. To support better dialogue with all stakeholders, this year we have developed a more robust communication system to ensure that feedback from individuals and groups is logged and acted upon efficiently.While we have made progress in these areas, I am committed to ensuring we do more to be a good corporate citizen going forward. This commitment is not based solely on a desire to ‘do the right thing’, but on a belief that we must do this to be a successful, vibrant and sustainable business in the years ahead.
Peter DilnotGroup Chief Executive
Sustainability is at the heart of Shanks’ business. Our strategy is to create value by making products from material that is otherwise thrown away. We believe that recycling and the production of green energy makes great sense for the environment, while also generating returns for our shareholders. Sustainability, however, means more to us than the benefits of carbon reduction and easing the pressure on natural resources. We strive to be sustainable in how we manage our employees and engage with local communities.Given the ongoing macro-economic downturn, this year has been a challenging one for Shanks – yet it has also been a transformational one. We have repositioned the Group for growth through a major reorganisation that focuses more on our customers. We have also continued to make strides with our corporate responsibility goals. This includes investments in further recycling and green energy capabilities, meeting our annual safety targets, developing our team and building better relationships with local communities.While sustainability is a core component of our business, it is also important to our stakeholders, in particular our customers. It is their need to reduce costs and manage resources more efficiently that we address through our services and technologies. We are well placed to meet our customers’ current and future requirements, and are investing in our capabilities to do so.
Chief Executive’s statement
Shanks Group plcCorporate Responsibility Report 20135
A sustainab
le business
Our business strategy is focused on taking waste which would have gone to landfill or mass incineration and making more from it. We do this by providing sustainable waste management options, such as:•Recycling of waste to displace virgin raw materials
in the marketplace. For example, recycled aluminium has much lower embedded carbon, so reducing the footprint of resulting products.
•Composting or treatment of waste in an anaerobic digestion (AD) facility, producing a fertiliser which displaces a chemical alternative. AD has the added benefit of creating renewable energy which can be used on site or sold back to the grid.
•Producing waste derived fuels which displace fossil sources in a manufacturing or power generation facility.
Our vision is “to be the leading provider of sustainable waste management solutions in our target markets”. To achieve this vision, we are investing in effective and efficient technologies which turn waste from a disposable material into a valuable resource. This reflects the shift in the business and regulatory environment which is placing emphasis on resource efficiency, re-use, and recycling and recovery of waste materials.Sending waste to landfill is not a sustainable option. Their operation can create odour, dust, wind-borne material, methane emissions and effluent. The waste deposited may take decades to degrade, during which the risk of pollution remains. That is why we, as a Group, are in line with government policy by moving away from landfill as a viable route for waste materials.Thermal treatment may be a valid alternative to landfill as it effectively destroys the hazardous properties of some waste materials. This is different to the mass incineration of dry, non-hazardous waste, which, without energy recovery, squanders the value inherent in this material and destroys valuable recyclable materials.
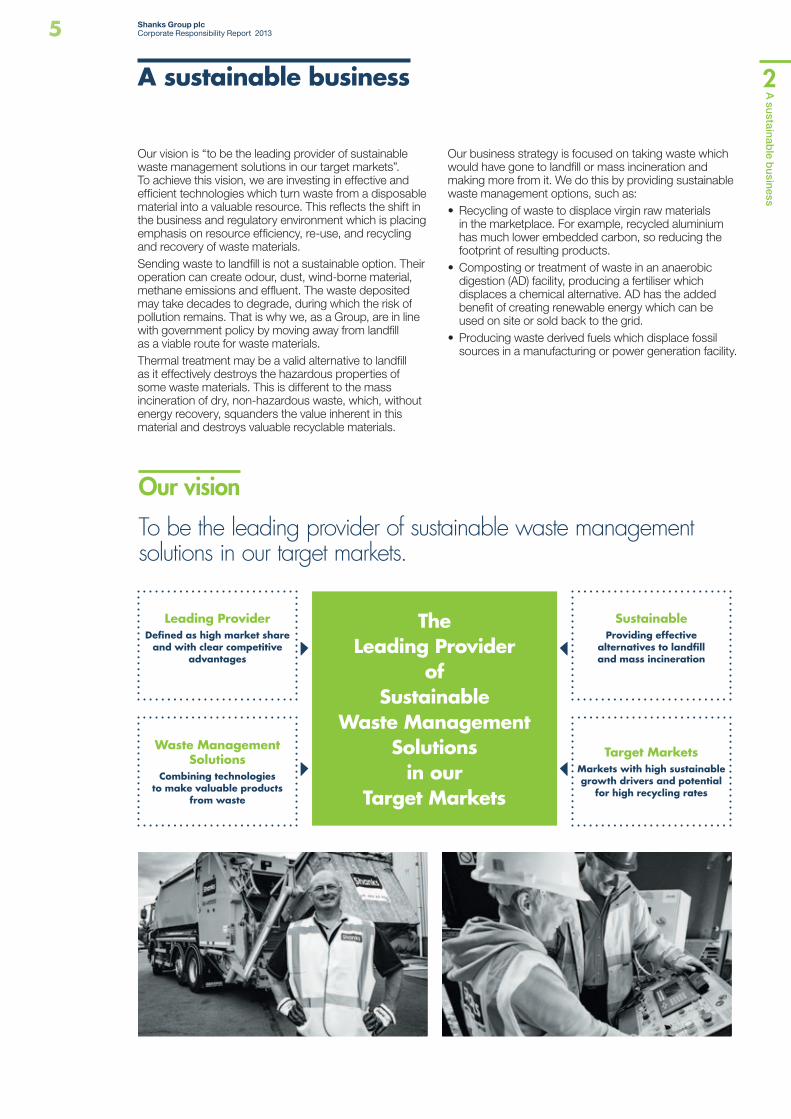
To be the leading provider of sustainable waste management solutions in our target markets.
Our vision
Leading ProviderDefined as high market share
and with clear competitive advantages
Waste Management Solutions
Combining technologies to make valuable products
from waste
SustainableProviding effective
alternatives to landfill and mass incineration
Target MarketsMarkets with high sustainable growth drivers and potential
for high recycling rates
TheLeading Provider
ofSustainable
Waste Management Solutions
in ourTarget Markets
A sustainable business
Shanks Group plcCorporate Responsibility Report 20136
A sustainab
le businessOur overarching strategy of ‘making more from waste’
remains consistent. However, the new Group structure with four market-facing divisions has led to our strategy evolving into one which is more market-orientated. The core pillars of this strategy are therefore now aligned with each division and aim to generate growth in each of our distinct markets.
The core pillars of our strategy are to:
Improve the profitability of our Solid Waste businesses. We will continue to face challenging market conditions in Solid Waste and as such, we will continue to streamline our organisation and operations in the years ahead. We are also increasingly focusing our activities in regions and areas where we can be the lowest cost operator through local scale and productivity advantages. Our cost actions will be supplemented by commercial activity in both securing waste and the sale of our products.
Broaden the scope of our Hazardous Waste business. Our Hazardous Waste business delivers superior returns through its symbiotic range of treatments and operational excellence. We will build on this profitable base by investing in more water treatment capacity. In parallel, we will expand the range of waste inputs that we treat with our existing assets and will broaden our commercial coverage.
Expand the Organics footprint in target geographies. Our unique design, build, own and operate business model provides us with a distinct competitive edge which we will leverage to expand in target markets. This will include successfully ramping-up new UK assets and developing co-processing with Dutch A-brand customers. We will also expand our North American footprint by delivering proven solutions that meet the emerging diversion requirements of that market.
Grow the UK Municipal long-term contract business. We will deliver continued improvements in our operational contracts and will profitably ramp-up newly commissioned assets. Our medium-term growth will be underpinned by the successful construction of significant new sustainable waste management infrastructure. We expect this strategy to deliver top-line growth with similar operating margins.
Underpinning our four divisional strategies are two key Group strategies that span all our businesses:
Develop world-class capabilities in a cohesive Group culture. Going forward, we will further increase our focus on building Group capabilities. This will include the introduction of a formal continuous improvement function across the Group and an initiative to improve commercial effectiveness.
Actively manage the Group’s portfolio. We are actively managing our wide portfolio of assets to improve the quality of our earnings and the return on capital employed. We are focused on deploying capital in areas where we are confident of sustainable advantage and higher growth, including potential bolt-on acquisitions.
Our strategy
31 2 456
1
2
3
4
56
A sustainable business

Shanks Group plcCorporate Responsibility Report 20137
Key co
rpo
rate respo
nsibility o
bjectives
Key corporate responsibility objectives
Carbon avoidance
Recycling and recovery have a carbon avoidance benefit. For example, burning a tonne of waste derived fuel saves more than a tonne of emitted carbon when compared to the use of coal. Similarly, the use of recycled aluminium rather than virgin feedstock from processed ore produces ten times less carbon emitted to the atmosphere. An added benefit is that some of our technologies produce green energy which displaces even more carbon emissions.The more efficient and effective we are as a business the more we can increase the carbon avoidance benefit of our activities. We are working to generate a carbon avoidance level of 1.3 million tonnes a year by April 2015. In 2011/12 we almost reached this target, but 2012/13 saw a drop to 1.21 million tonnes, reflecting the impact of the economic environment on waste management operations. We are confident that our new structure and ongoing investment will see us achieve our five year objective by 2015.
Carbon avoidance million tonnes
20132012 2015target
201120102009
1.211.301.28
1.18
0.740.64
Recycling and recovery rate
Recycling and recovery reduces the need for finite resources and diverts material from landfill and other less sustainable waste management operations. The way we state our recycling and recovery rate encapsulates the resource benefit of our activities and our success in minimising the use of less sustainable disposal options.After an initial rise from 70% in 2009, our recycling and recovery rate has stabilised at 78% over the past two years. This is despite severe economic headwinds which have put pressure on waste volumes and the cost of waste management. We are confident that our investment programme will enable us to achieve our target of 80% by April 2015.
2013
78% 80%
2012 2015target
78%
2011
77%
2010
74%
2009
70%
Recycling and recovery rate %
Core Corporate Responsibility (CR) objectives and progress: In our 2010 Corporate Responsibility Report we defined three key CR objectives to be achieved by April 2015:
– Increase our recycling and recovery rate to at least 80% – Increase the carbon avoided though our business activities to more than 1.3 million tonnes a year
– Reduce our reportable accident rate by at least 25%
Shanks Group plcCorporate Responsibility Report 20138
Key co
rpo
rate respo
nsibility o
bjectives
Accident rate
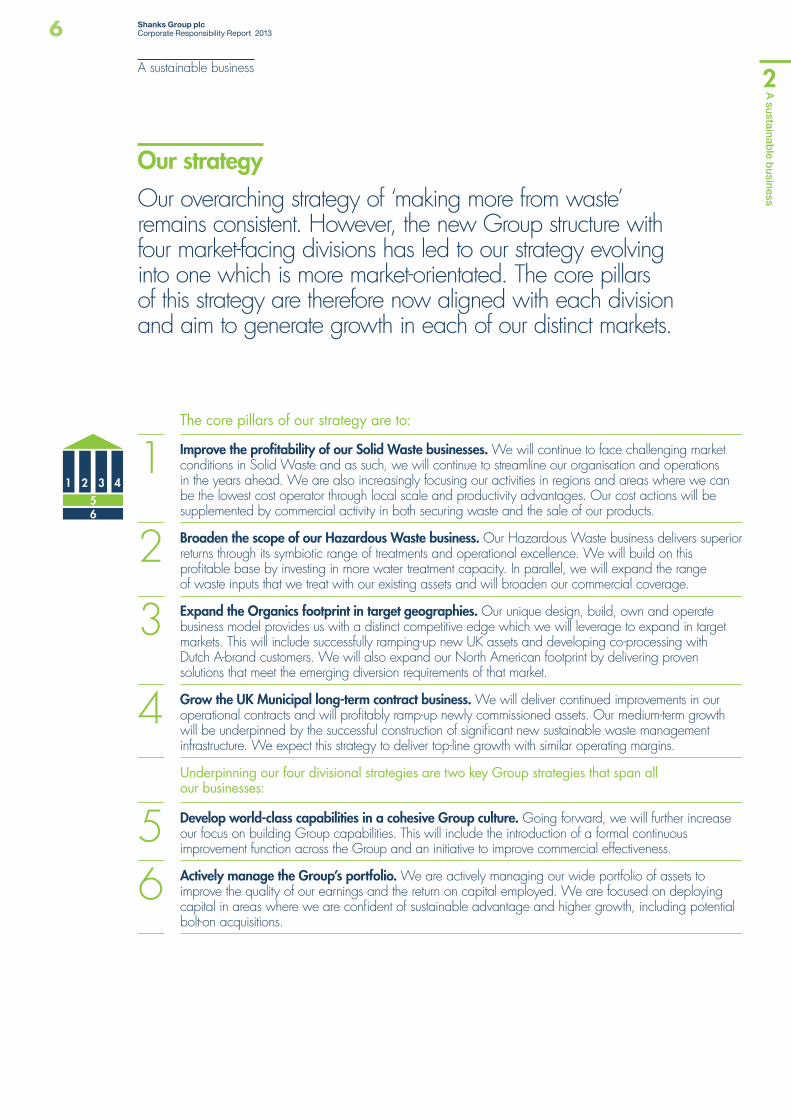
Our employees are our priority. They are a crucial conduit for our business and sustainability strategy through their dealings with each other, customers, partners, suppliers, communities and investors and they have a right to expect the highest standards of custodianship and management from us. Our industry operates high-risk processes and traditionally has accident rates in excess of manufacturing and other comparable sectors.Our ability to deliver a safe and healthy working environment is a crucial measure of our sustainability performance. Our third key CR objective is to reduce our reportable accident rate by 25% by April 2015.During the year we improved our reportable accident rate by 8%. Since 2010 our rate has been reduced by more than 20%, which means we are on target to achieve our five year objective. In addition, the days lost to absence per accident reduced by 25% over the year.
Key corporate responsibility objectives
Reportable accident rate is defined as an employee accident which results in greater than three day absence per 100,000 employees.
Reportable accident rate
2013
2,4002,300
2012 2015target
2,600
2011
3,000
2010
3,100
2009
3,300
Shanks Group plcCorporate Responsibility Report 20139
Sustainab
ility and the enviro
nment
#1Making more from waste
Sustainability and the environment case studies
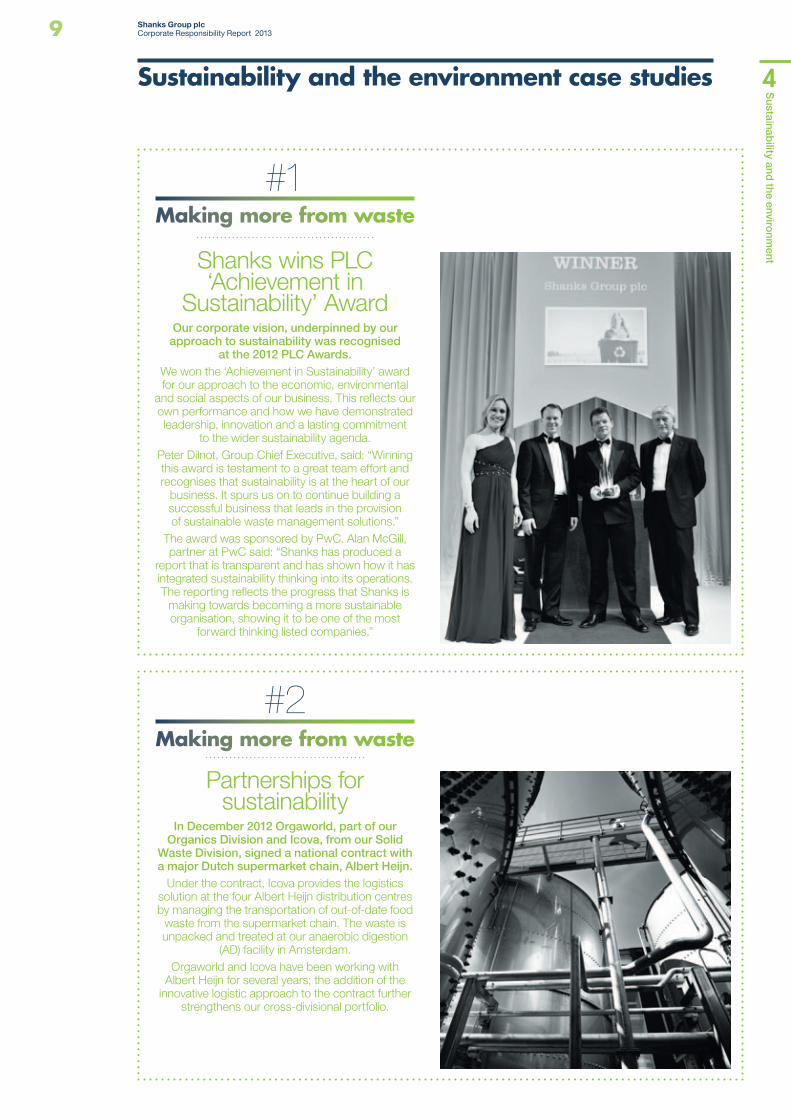
Shanks wins PLC ‘Achievement in
Sustainability’ AwardOur corporate vision, underpinned by our approach to sustainability was recognised
at the 2012 PLC Awards.We won the ‘Achievement in Sustainability’ award for our approach to the economic, environmental
and social aspects of our business. This reflects our own performance and how we have demonstrated leadership, innovation and a lasting commitment
to the wider sustainability agenda.Peter Dilnot, Group Chief Executive, said: “Winning this award is testament to a great team effort and recognises that sustainability is at the heart of our
business. It spurs us on to continue building a successful business that leads in the provision of sustainable waste management solutions.”
The award was sponsored by PwC. Alan McGill, partner at PwC said: “Shanks has produced a
report that is transparent and has shown how it has integrated sustainability thinking into its operations. The reporting reflects the progress that Shanks is
making towards becoming a more sustainable organisation, showing it to be one of the most
forward thinking listed companies.”
Partnerships for sustainability
In December 2012 Orgaworld, part of our Organics Division and Icova, from our Solid
Waste Division, signed a national contract with a major Dutch supermarket chain, Albert Heijn.
Under the contract, Icova provides the logistics solution at the four Albert Heijn distribution centres by managing the transportation of out-of-date food
waste from the supermarket chain. The waste is unpacked and treated at our anaerobic digestion
(AD) facility in Amsterdam. Orgaworld and Icova have been working with
Albert Heijn for several years; the addition of the innovative logistic approach to the contract further
strengthens our cross-divisional portfolio.
#2Making more from waste
Shanks Group plcCorporate Responsibility Report 201310
Sustainab
ility and the enviro
nment
How we contribute to sustainability
Embedding environmental sustainability
In 2012/13 we significantly increased our anaerobic digestion capacity, opened new organic and mechanical biological treatment facilities and enhanced and expanded our existing portfolio of recycling facilities. Our capital investment in new facilities has been directed at building and launching recycling and recovery capacity. This has been achieved in the face of challenging economic conditions.Further information on our approach to sustainable waste management, resource use and carbon avoidance can be found in this report and on our Group website.
Environmental sustainability at Shanks
Waste is a renewable resource. Whilst reducing demand and promoting re-use is the ideal, something needs to be done with the residual waste that is inevitably produced. This is a resource which can be used as a raw material or to provide a source of renewable energy. Shanks operates at this interface of waste and resource efficiency. It helps to drive our business and underpins our approach to environmental sustainability.Turning waste into a renewable resource requires the use of innovative technologies. We use a wide spectrum of such technologies with the simple aim of developing and providing more sustainable waste management capacity and increasing the efficiency of our business operations. We know that by excelling at what we do we divert waste from landfill and create a renewable resource, thereby avoiding the potential pollution and carbon downside of disposal.Our sustainable business not only underpins our commercial offer, but makes us a better, more competitive business. By being focused on our markets, we can improve efficiency and concentrate each of our divisions on making more from waste.
See page 13 for more on our sustainable
technologies

Shanks Group plcCorporate Responsibility Report 201311
Sustainab
ility and the enviro
nment
Sustainability and carbon performance highlights
Our carbon footprint represents the emissions generated by our business operations and the carbon avoidance benefit these activities generate. Our recycling and recovery performance is critical to our business and sustainability.
Carbon footprintEmissions from our activities
Source
CO2 equivalent 2013
(’000 tonnes)1
CO2 equivalent 2012
(’000 tonnes)1
Process based emissions
Emissions from anaerobic digestion 14 9
Emissions from composting 41 41
Emissions from hazardous waste treatment 258 287
Emissions from landfill 105 100
Emissions from mechanical biological treatment (MBT) 18 13
Transport based emissions
Fuel used by waste transport vehicles 70 80
Business travel (cars, trains, flights etc)2 4 –
Energy use emissions
Electricity used on sites and in offices 46 48
Gas used on sites and in offices 9 9
Fuel used on sites and in offices for plant and equipment/heating3 24 23
Total emissions from significant sources 589 610
Emissions avoided by our activitiesRenewable energy generated 44 36
Waste derived fuels produced and sold 652 652
Materials separated for re-use/recycling (some re-used directly, others undergo re-processing by third parties) 518 588
Total potential avoided emissions 1,214 1,276
1. Figures rounded to nearest 1,000 tonnes.2. Data not reported as a Group total for 2012.3. Includes heat use on site for Shanks Hazardous Waste.

Shanks Group plcCorporate Responsibility Report 201312
Sustainab
ility and the enviro
nment
Sustainability and carbon performance highlights
Recycling and recovery rateTotal waste handled million tonnes
1 Benelux Solid Waste 3.932 Hazardous Waste 1.713 Organics 0.684 UK 1.51 Group 7.83
1
2
3
4 1 Benelux Solid Waste 3.922 Hazardous Waste 1.753 Organics 0.564 UK 1.62 Group 7.85
1
2
3
4
2013 2012
Amount of materials recovered from the waste stream million tonnes
1 Benelux Solid Waste 3.002 Hazardous Waste 1.623 Organics 0.664 UK 0.81 Group 6.09
1
2
3
41 Benelux Solid Waste 3.092 Hazardous Waste 1.713 Organics 0.534 UK 0.76 Group 6.09
1
2
3
4
2013 2012
Proportion of total waste handled recovered from the waste stream %
1 Benelux Solid Waste 76%2 Hazardous Waste 96%3 Organics 98%4 UK 54% Group 78%
1 Benelux Solid Waste 79%2 Hazardous Waste 98%3 Organics 94%4 UK 47% Group 78%
1.5
4321
1.5
4321
76%
96% 98%
54%
79%
98% 94%
47%
Tonnes of waste handled sent for land�ll million tonnes
1 Benelux Solid Waste 0.352 Hazardous Waste –3 Organics –4 UK 0.64 Group 0.99
1
4
1 Benelux Solid Waste 0.272 Hazardous Waste –3 Organics 0.024 UK 0.79 Group 1.08
1
3
4
2013 2012
Tonnes of waste handled sent for incineration million tonnes
1 Benelux Solid Waste 0.582 Hazardous Waste 0.063 Organics 0.014 UK 0.06 Group 0.71 1
2
34
1 Benelux Solid Waste 0.562 Hazardous Waste 0.043 Organics 0.014 UK 0.07 Group 0.68 1
2
3 4
2013 2012
Shanks Group plcCorporate Responsibility Report 201313
Sustainab
ility and the enviro
nment
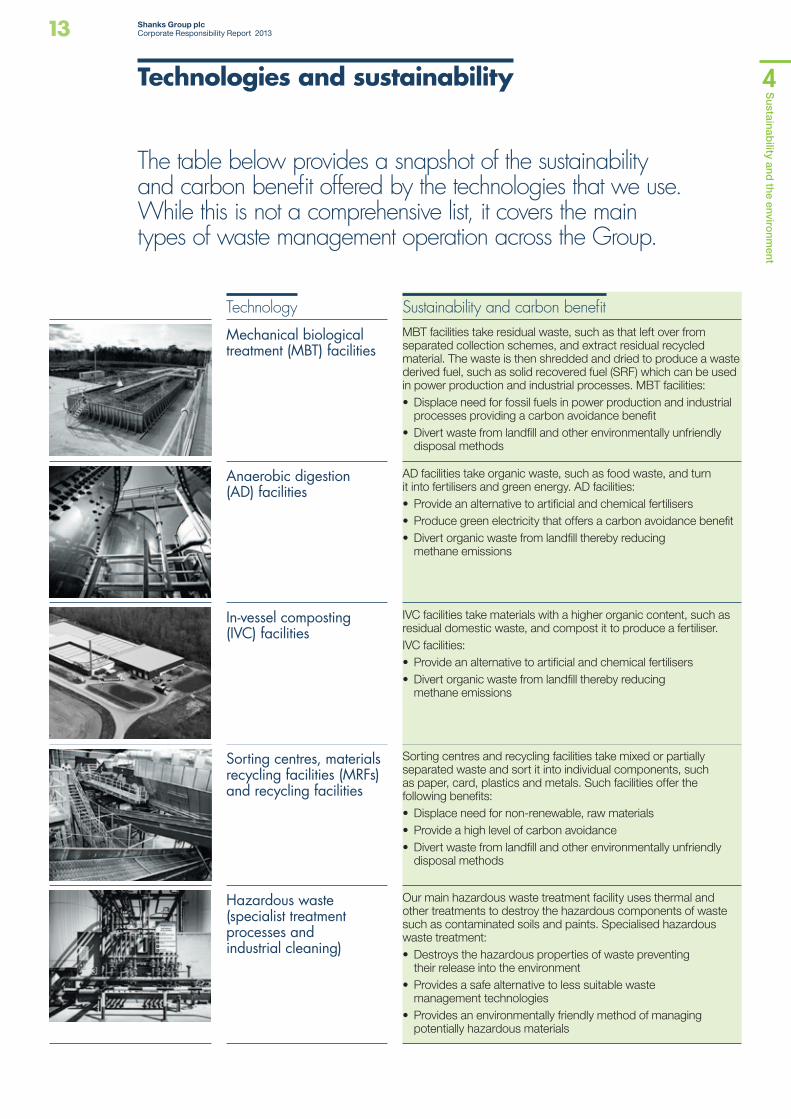
Technology Sustainability and carbon benefit
Mechanical biological treatment (MBT) facilities
MBT facilities take residual waste, such as that left over from separated collection schemes, and extract residual recycled material. The waste is then shredded and dried to produce a waste derived fuel, such as solid recovered fuel (SRF) which can be used in power production and industrial processes. MBT facilities:•Displace need for fossil fuels in power production and industrial
processes providing a carbon avoidance benefit•Divert waste from landfill and other environmentally unfriendly
disposal methods
Anaerobic digestion (AD) facilities
AD facilities take organic waste, such as food waste, and turn it into fertilisers and green energy. AD facilities:•Provide an alternative to artificial and chemical fertilisers•Produce green electricity that offers a carbon avoidance benefit•Divert organic waste from landfill thereby reducing
methane emissions
In-vessel composting (IVC) facilities
IVC facilities take materials with a higher organic content, such as residual domestic waste, and compost it to produce a fertiliser. IVC facilities:•Provide an alternative to artificial and chemical fertilisers•Divert organic waste from landfill thereby reducing
methane emissions
Sorting centres, materials recycling facilities (MRFs) and recycling facilities
Sorting centres and recycling facilities take mixed or partially separated waste and sort it into individual components, such as paper, card, plastics and metals. Such facilities offer the following benefits:•Displace need for non-renewable, raw materials•Provide a high level of carbon avoidance•Divert waste from landfill and other environmentally unfriendly
disposal methods
Hazardous waste (specialist treatment processes and industrial cleaning)
Our main hazardous waste treatment facility uses thermal and other treatments to destroy the hazardous components of waste such as contaminated soils and paints. Specialised hazardous waste treatment:•Destroys the hazardous properties of waste preventing
their release into the environment•Provides a safe alternative to less suitable waste
management technologies•Provides an environmentally friendly method of managing
potentially hazardous materials
Technologies and sustainability
The table below provides a snapshot of the sustainability and carbon benefit offered by the technologies that we use. While this is not a comprehensive list, it covers the main types of waste management operation across the Group.
Shanks Group plcCorporate Responsibility Report 201314
Sustainab
ility and the enviro
nment
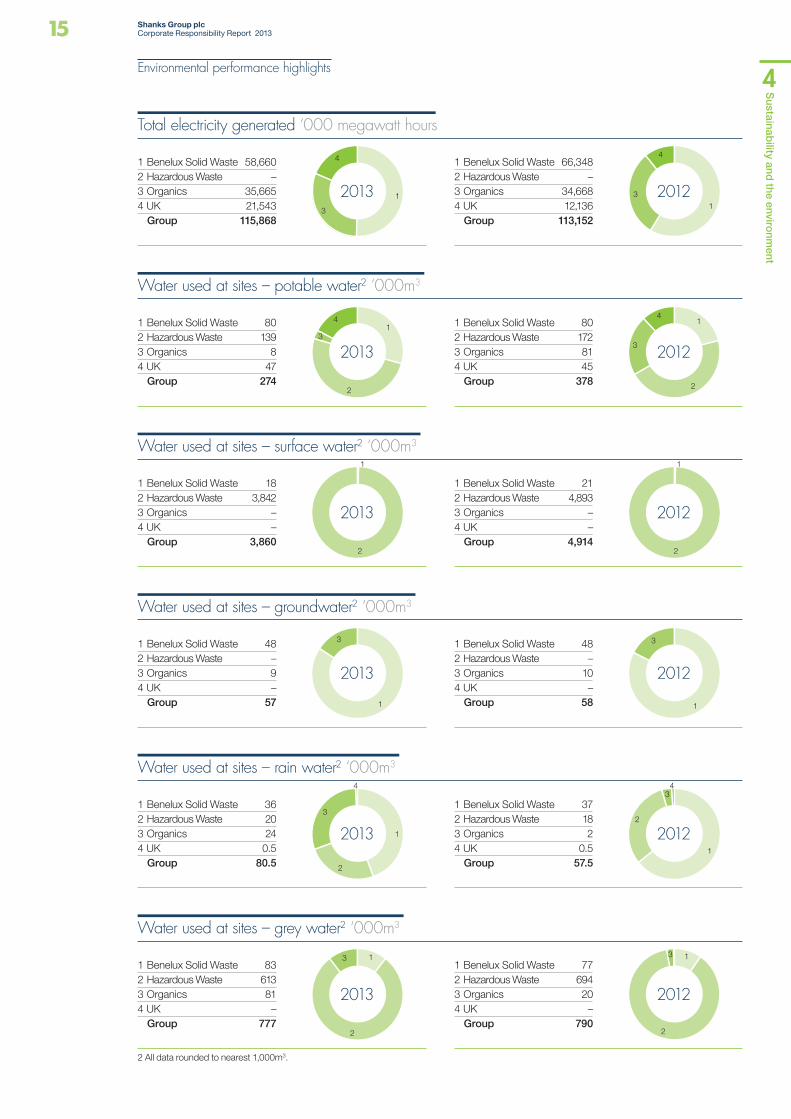
Environmental performance highlights
Our use of resources and energy provide key environmental performance indicators.
Resource and energy use
Electricity consumption at sites and of�ces 000’ kilowatt hours
1 Benelux Solid Waste 41,1542 Hazardous Waste 52,8873 Organics 20,6694 UK 24,139 Group 138,849
1
2
3
4 1 Benelux Solid Waste 36,3302 Hazardous Waste 57,0993 Organics 19,0164 UK 25,608 Group 138,053
1
2
3
4
2013 2012
Gas used at sites and of�ces cubic metres
1 Benelux Solid Waste 3,7592 Hazardous Waste 9263 Organics 124 UK 46,632 Group 51,329
12
3
4
1 Benelux Solid Waste 4,1712 Hazardous Waste 8543 Organics 94 UK 40,265 Group 45,299
1 2 3
4
2013 2012
Fuel use at sites and of�ces 000’ litres1
1 Benelux Solid Waste 5,0532 Hazardous Waste 4103 Organics 8744 UK 1,365 Group 7,702
12
3
4 1 Benelux Solid Waste 4,9242 Hazardous Waste 6393 Organics 8744 UK 1,175 Group 7,612
12
3
4
2013 2012
Fuel used in waste collection and transport vehicles 000’ litres
1 Benelux Solid Waste 18,6972 Hazardous Waste 3,0783 Organics –4 UK 2,738 Group 24,513 1
2
41 Benelux Solid Waste 21,6172 Hazardous Waste 2,5963 Organics –4 UK 2,681 Group 26,894 1
2
4
2013 2012
1. Diesel fuel used (mainly for heavy mobile or static plant).
Shanks Group plcCorporate Responsibility Report 201315
Sustainab
ility and the enviro
nment
Water used at sites – surface water2 ‘000m3
1 Benelux Solid Waste 182 Hazardous Waste 3,8423 Organics –4 UK – Group 3,860
1
2
1 Benelux Solid Waste 212 Hazardous Waste 4,8933 Organics –4 UK – Group 4,914
1
2
2013 2012
Water used at sites – potable water2 ‘000m3
1 Benelux Solid Waste 802 Hazardous Waste 1393 Organics 84 UK 47 Group 274
1
2
3
4 1 Benelux Solid Waste 802 Hazardous Waste 1723 Organics 814 UK 45 Group 378
1
2
3
4
2013 2012
Total electricity generated ‘000 megawatt hours
1 Benelux Solid Waste 58,6602 Hazardous Waste –3 Organics 35,6654 UK 21,543 Group 115,868
1
3
4 1 Benelux Solid Waste 66,3482 Hazardous Waste –3 Organics 34,6684 UK 12,136 Group 113,152
13
4
2013 2012
Water used at sites – groundwater2 ‘000m3
1 Benelux Solid Waste 482 Hazardous Waste –3 Organics 94 UK – Group 57 1
3 1 Benelux Solid Waste 482 Hazardous Waste –3 Organics 104 UK – Group 58 1
3
2013 2012
Water used at sites – rain water2 ‘000m3
1 Benelux Solid Waste 362 Hazardous Waste 203 Organics 244 UK 0.5 Group 80.5
1
2
3
4
1 Benelux Solid Waste 372 Hazardous Waste 183 Organics 24 UK 0.5 Group 57.5
1
2
34
2013 2012
Water used at sites – grey water2 ‘000m3
1 Benelux Solid Waste 832 Hazardous Waste 6133 Organics 814 UK – Group 777
1
2
31 Benelux Solid Waste 772 Hazardous Waste 6943 Organics 204 UK – Group 790
1
2
3
2013 2012
Environmental performance highlights
2 All data rounded to nearest 1,000m3.
Shanks Group plcCorporate Responsibility Report 201316
Health and
safety#3Making more from waste
Health and safety case studies
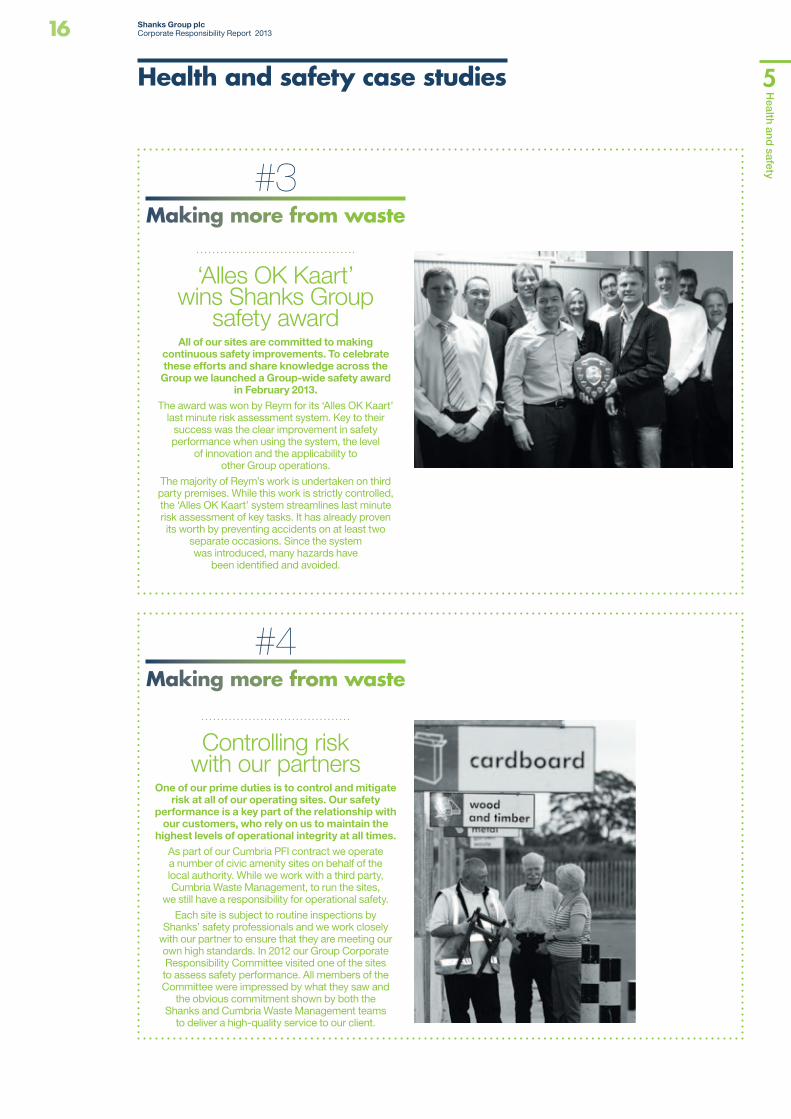
‘Alles OK Kaart’ wins Shanks Group
safety awardAll of our sites are committed to making
continuous safety improvements. To celebrate these efforts and share knowledge across the
Group we launched a Group-wide safety award in February 2013.
The award was won by Reym for its ‘Alles OK Kaart’ last minute risk assessment system. Key to their
success was the clear improvement in safety performance when using the system, the level
of innovation and the applicability to other Group operations.
The majority of Reym’s work is undertaken on third party premises. While this work is strictly controlled, the ‘Alles OK Kaart’ system streamlines last minute risk assessment of key tasks. It has already proven its worth by preventing accidents on at least two
separate occasions. Since the system was introduced, many hazards have
been identified and avoided.
Controlling risk with our partners
One of our prime duties is to control and mitigate risk at all of our operating sites. Our safety
performance is a key part of the relationship with our customers, who rely on us to maintain the
highest levels of operational integrity at all times.As part of our Cumbria PFI contract we operate a number of civic amenity sites on behalf of the local authority. While we work with a third party, Cumbria Waste Management, to run the sites,
we still have a responsibility for operational safety.
Each site is subject to routine inspections by Shanks’ safety professionals and we work closely
with our partner to ensure that they are meeting our own high standards. In 2012 our Group Corporate Responsibility Committee visited one of the sites to assess safety performance. All members of the Committee were impressed by what they saw and
the obvious commitment shown by both the Shanks and Cumbria Waste Management teams
to deliver a high-quality service to our client.
#4Making more from waste
Shanks Group plcCorporate Responsibility Report 201317
Health and
safety
Health and safety in a high risk industry
How we performed
Whilst we have an excellent safety record in comparison to sector peers, we are committed to continuous improvement. During 2012/13 we reduced our reportable accident rate by 8% compared with the previous year and by 20% over the previous three years. Our ultimate aim is to operate a zero accident business. Our accident severity rate has also fallen by 25%, measured as the number of days lost from accidents compared to the number of accidents.
In line with our corporate restructuring in 2012, we re-shaped our Group Health & Safety Committee and tasked it with further improving our performance and producing and enacting Group-wide safety innovations.The committee has been extremely active and has introduced a range of innovations and guidelines relating to common standards on non-permanent worker induction, the use of mobile telephones and personal entertainment devices, traffic and pedestrian segregation and performance reporting. A traffic safety initiative launched in November 2012 has resulted in quantified improvements across all of our sites. In February 2013 we organised our first Group-wide safety award. In addition, we now operate a communications cascade process for all of our safety professionals and have held a series of safety workshops in all of our operating divisions.All safety improvements and initiatives have been captured in a Group Health & Safety Action Plan. This plan was developed and actioned by the Group Health & Safety Committee which tracks actions and outcomes. Our focus in 2013/14 is on fire prevention and improving our safety culture through employee engagement.
The health, safety and wellbeing of our employees is a key component of our corporate values. This is particularly important in the waste management industry where accident rates have traditionally been higher than manufacturing and other industrial sectors.

Shanks Group plcCorporate Responsibility Report 201318
Health and
safety
Health and safety performance highlights
In 2012, we revised our internal health and safety reporting process. In addition to our established performance measure of accident rate, we added severity measures, performance against days worked and information on non-permanent worker safety.
Employee health and safetyEmployee accident performance
2013 2012
Total number
LTA LTA rate
Number of reportable accidents
Reportable accident
rate
Number of fatal
accidents
Total number
LTA LTA rate
Number of reportable accidents
Reportable accident
rate
Number of fatal
accidents
Benelux Solid Waste 85 3,700 76 3,300 – 96 3,900 78 3,200 1Hazardous Waste 5 650 5 650 – 9 1,200 8 1,100 –Organics 3 4,300 – – – 5 6,900 1 1,400 –UK 29 3,200 17 1,850 – 33 3,700 19 2,100 –Group 122 3,000 98 2,400 – 143 3,500 106 2,600 1
2,400
2008
3,800
2007
3,6003,100 2,900 2,700
3,300 3,100 3,0002,600
2006
4,200
2005200420032002 20132012201120102009
5,000
Long-term reportable employee accident performance
Lost time employee accident frequency and incident severity rate trend (2012/13)
SeptAugJulJunMayApr JanDecNov MarFebOct
Lost time incident frequency Incident severity rate
More than three day accident rate.
Key to terms used in health and safety data, tables and graphs:Reportable accident rate: any injury to an employee which results in more than three days’ absence from work (note – definition of reportable accident is internal and not regulatory).LTA (lost time accident) injury: any injury to an employee which results in at least one day’s absence from work.
Reportable and LTA accident rates: total accident figures do not allow adequate comparisons to be made over time as employee numbers can, and do, change. The accident rates quoted are per 100,000 employees which provide a truer measure of performance.
LTA frequency: number of lost time employee accidents per 100,000 days worked. This data is presented on a rolling 12 month basis.Incident severity rate: average number of days lost per lost time employee accident. This data is presented on a rolling 12 month basis.
Shanks Group plcCorporate Responsibility Report 201319
Our p
eop
le
#5Making more from waste
Our people case studies
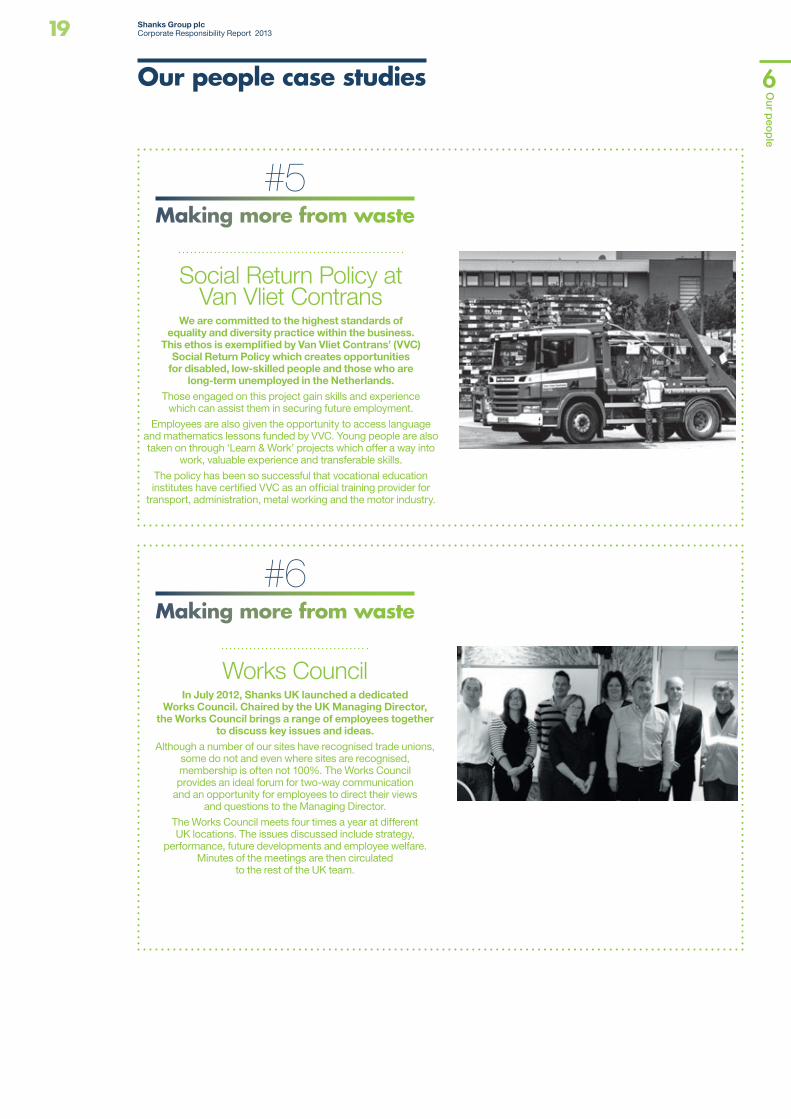
Social Return Policy at Van Vliet Contrans
We are committed to the highest standards of equality and diversity practice within the business.
This ethos is exemplified by Van Vliet Contrans’ (VVC)Social Return Policy which creates opportunities
for disabled, low-skilled people and those who are long-term unemployed in the Netherlands.
Those engaged on this project gain skills and experience which can assist them in securing future employment.
Employees are also given the opportunity to access language and mathematics lessons funded by VVC. Young people are also taken on through ‘Learn & Work’ projects which offer a way into
work, valuable experience and transferable skills.
The policy has been so successful that vocational education institutes have certified VVC as an official training provider for
transport, administration, metal working and the motor industry.
#6Making more from waste
Works CouncilIn July 2012, Shanks UK launched a dedicated
Works Council. Chaired by the UK Managing Director, the Works Council brings a range of employees together
to discuss key issues and ideas. Although a number of our sites have recognised trade unions,
some do not and even where sites are recognised, membership is often not 100%. The Works Council provides an ideal forum for two-way communication
and an opportunity for employees to direct their views and questions to the Managing Director.
The Works Council meets four times a year at different UK locations. The issues discussed include strategy,
performance, future developments and employee welfare. Minutes of the meetings are then circulated
to the rest of the UK team.
Shanks Group plcCorporate Responsibility Report 201320
Our p
eop
le
Our people
There have been many changes in our business in the last 12 months, including a new divisional structure, a new Executive Committee and a significant restructuring programme. A key differentiator during this period of change is our people and our culture. Our people continue to demonstrate the ability to meet the market challenges with a ‘can do’ approach. The effective changes we have been able to put in place over the past year are a testament not only to our people but also to our culture and values. Shanks’ culture has been built on key values which demonstrate that ‘how’ we do things is just as important as ‘what’ we do. Embedding these values into our daily working lives allows us to create a unique culture and to meet the expectations of our people, our customers and our stakeholders. Having an open culture is important to us as it provides an environment where our employees feel informed, included and are motivated and aligned to perform at their best.In order to deepen this culture and to support our momentum and drive for high performance, the Board appointed Shanks’ first Group Human Resources (HR) Director, Michelle Cummins, in August 2012. Michelle’s role focuses on working with the senior leadership team to recruit the right talent to help create an organisation which supports and develops our people.
Our values, culture and people
At Shanks, we have set our values to be a guiding force for the way we behave and go about our business, we strive to be:•Responsible: we recognise our obligations to our
fellow employees, the environment and the communities in which we operate and can be trusted to do the right thing.
• Innovative: we aim to create an environment which encourages and supports an entrepreneurial spirit.
•Straightforward: a ‘no nonsense’ approach means we do what we say we will do, empower our people to make decisions and are easy to do business with.
•Open: a transparent approach means that we are able to maintain high professional and ethical standards and internally our open culture enables us to benefit from shared knowledge and experience.
How we performed
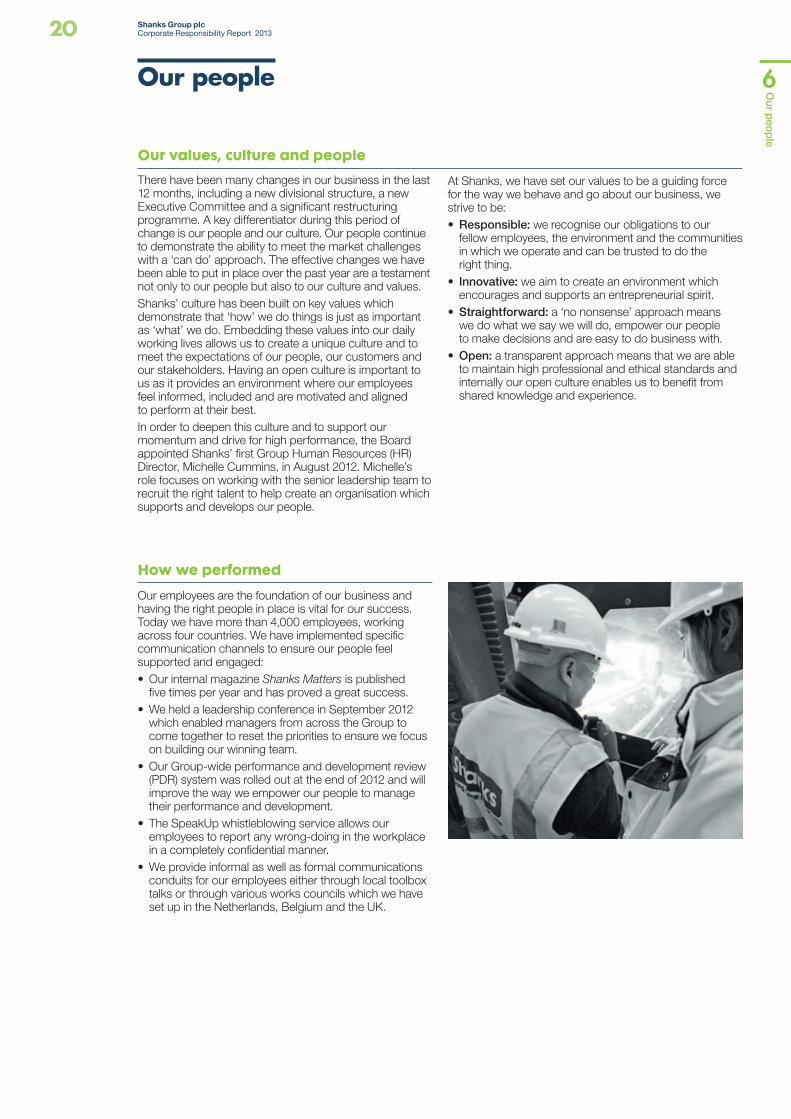
Our employees are the foundation of our business and having the right people in place is vital for our success. Today we have more than 4,000 employees, working across four countries. We have implemented specific communication channels to ensure our people feel supported and engaged:•Our internal magazine Shanks Matters is published
five times per year and has proved a great success. •We held a leadership conference in September 2012
which enabled managers from across the Group to come together to reset the priorities to ensure we focus on building our winning team.
•Our Group-wide performance and development review (PDR) system was rolled out at the end of 2012 and will improve the way we empower our people to manage their performance and development.
• The SpeakUp whistleblowing service allows our employees to report any wrong-doing in the workplace in a completely confidential manner.
•We provide informal as well as formal communications conduits for our employees either through local toolbox talks or through various works councils which we have set up in the Netherlands, Belgium and the UK.
Shanks Group plcCorporate Responsibility Report 201321
Our p
eop
le
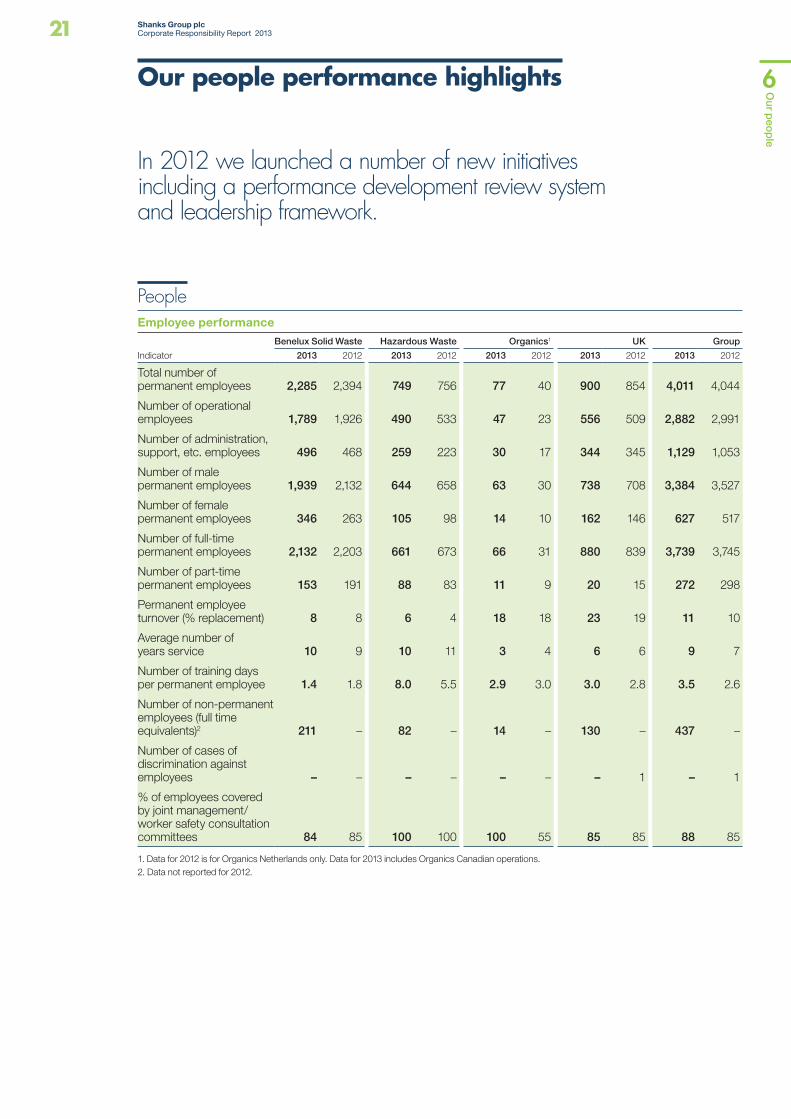
Our people performance highlights
In 2012 we launched a number of new initiatives including a performance development review system and leadership framework.
PeopleEmployee performance
Benelux Solid Waste Hazardous Waste Organics1 UK Group
Indicator 2013 2012 2013 2012 2013 2012 2013 2012 2013 2012
Total number of permanent employees 2,285 2,394 749 756 77 40 900 854 4,011 4,044
Number of operational employees 1,789 1,926 490 533 47 23 556 509 2,882 2,991
Number of administration, support, etc. employees 496 468 259 223 30 17 344 345 1,129 1,053
Number of male permanent employees 1,939 2,132 644 658 63 30 738 708 3,384 3,527
Number of female permanent employees 346 263 105 98 14 10 162 146 627 517
Number of full-time permanent employees 2,132 2,203 661 673 66 31 880 839 3,739 3,745
Number of part-time permanent employees 153 191 88 83 11 9 20 15 272 298
Permanent employee turnover (% replacement) 8 8 6 4 18 18 23 19 11 10
Average number of years service 10 9 10 11 3 4 6 6 9 7
Number of training days per permanent employee 1.4 1.8 8.0 5.5 2.9 3.0 3.0 2.8 3.5 2.6
Number of non-permanent employees (full time equivalents)2 211 – 82 – 14 – 130 – 437 –
Number of cases of discrimination against employees – – – – – – – 1 – 1
% of employees covered by joint management/worker safety consultation committees 84 85 100 100 100 55 85 85 88 85
1. Data for 2012 is for Organics Netherlands only. Data for 2013 includes Organics Canadian operations.2. Data not reported for 2012.
Shanks Group plcCorporate Responsibility Report 201322
Wo
rking with the co
mm
unity
#7Making more from waste
Community relations case studies
Watch the Landfill Harmonic Orchestra Project film at: http://vimeo.com/ 52129103.
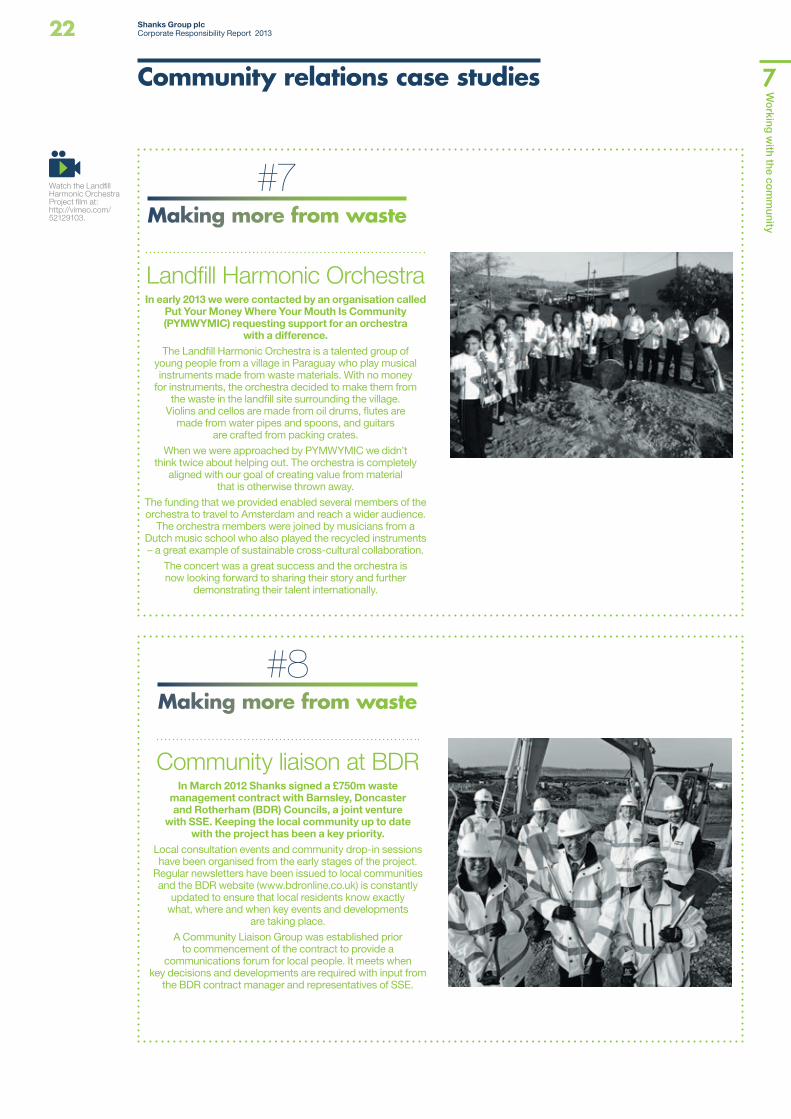
Landfill Harmonic OrchestraIn early 2013 we were contacted by an organisation called
Put Your Money Where Your Mouth Is Community (PYMWYMIC) requesting support for an orchestra
with a difference.The Landfill Harmonic Orchestra is a talented group of
young people from a village in Paraguay who play musical instruments made from waste materials. With no money
for instruments, the orchestra decided to make them from the waste in the landfill site surrounding the village.
Violins and cellos are made from oil drums, flutes are made from water pipes and spoons, and guitars
are crafted from packing crates.
When we were approached by PYMWYMIC we didn’t think twice about helping out. The orchestra is completely
aligned with our goal of creating value from material that is otherwise thrown away.
The funding that we provided enabled several members of the orchestra to travel to Amsterdam and reach a wider audience.
The orchestra members were joined by musicians from a Dutch music school who also played the recycled instruments – a great example of sustainable cross-cultural collaboration.
The concert was a great success and the orchestra is now looking forward to sharing their story and further
demonstrating their talent internationally.
#8Making more from waste
Community liaison at BDRIn March 2012 Shanks signed a £750m waste
management contract with Barnsley, Doncaster and Rotherham (BDR) Councils, a joint venture
with SSE. Keeping the local community up to date with the project has been a key priority.
Local consultation events and community drop-in sessions have been organised from the early stages of the project.
Regular newsletters have been issued to local communities and the BDR website (www.bdronline.co.uk) is constantly
updated to ensure that local residents know exactly what, where and when key events and developments
are taking place.
A Community Liaison Group was established prior to commencement of the contract to provide a
communications forum for local people. It meets when key decisions and developments are required with input from
the BDR contract manager and representatives of SSE.
Shanks Group plcCorporate Responsibility Report 201323
Wo
rking with the co
mm
unity
Sustainable community relations
While the resource and carbon benefits of sustainable waste management are widely accepted, the industry has an ongoing challenge to engage, inform and educate those living and working close to its facilities.All of our facilities have a permit to operate which requires us to consult with the public and remain open to scrutiny. We know and accept that if we do not engage with communities adjacent to our facilities this is unfair on them and will have a detrimental effect on our ability to generate wider sustainable benefits through our activities. Our community neighbours across all of our sites are key stakeholders and their voice has weight and the nature of their comments and those of local regulators we consider as critical performance measures.
Communications, co-operation and community
We believe in proactive engagement with local residents. New and sustainable waste management technologies represent a change and may be viewed with caution. Proactively explaining the benefits of new technologies and responsible methods of dealing with waste can address such concerns.We believe that our activities support society’s move to a more sustainable future, but we accept that this argument may not be enough for individuals or community neighbours. Through positive and proactive engagement we gain an insight into views and concerns, which in turn helps us to modify processes and minimise our impact on the local environment.
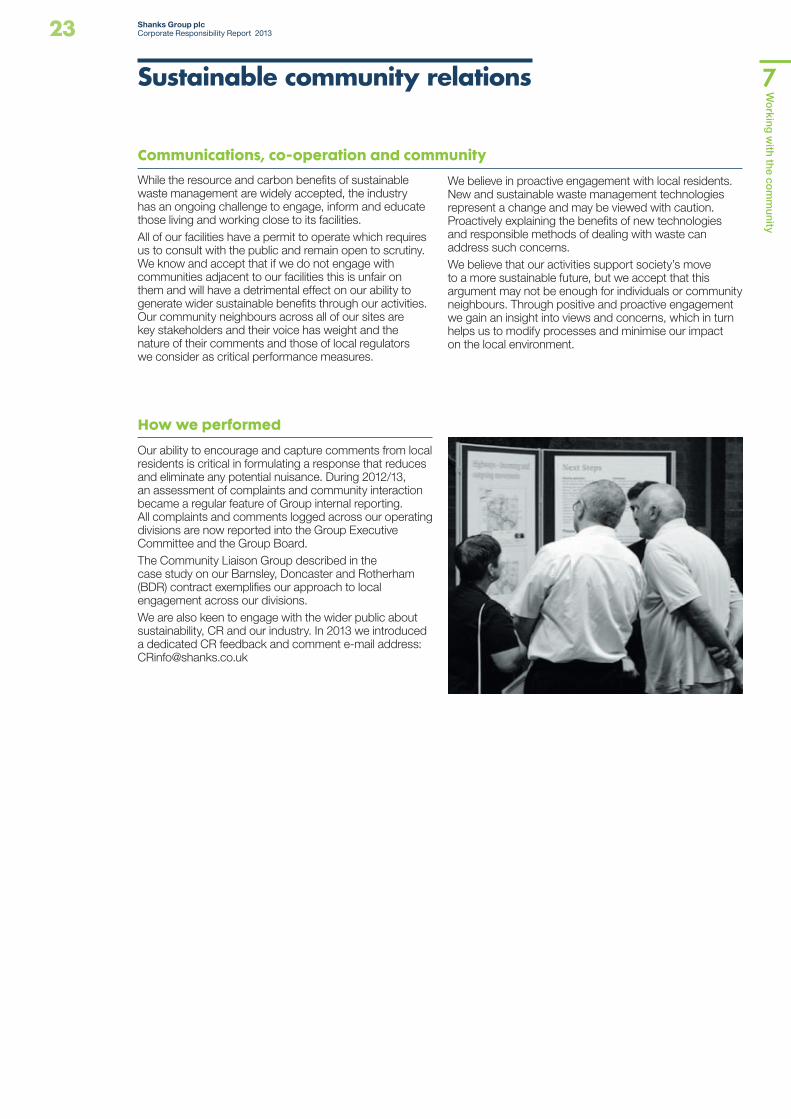
How we performed
Our ability to encourage and capture comments from local residents is critical in formulating a response that reduces and eliminate any potential nuisance. During 2012/13, an assessment of complaints and community interaction became a regular feature of Group internal reporting. All complaints and comments logged across our operating divisions are now reported into the Group Executive Committee and the Group Board.The Community Liaison Group described in the case study on our Barnsley, Doncaster and Rotherham (BDR) contract exemplifies our approach to local engagement across our divisions.We are also keen to engage with the wider public about sustainability, CR and our industry. In 2013 we introduced a dedicated CR feedback and comment e-mail address: [email protected]
Shanks Group plcCorporate Responsibility Report 201324
Wo
rking with the co
mm
unity
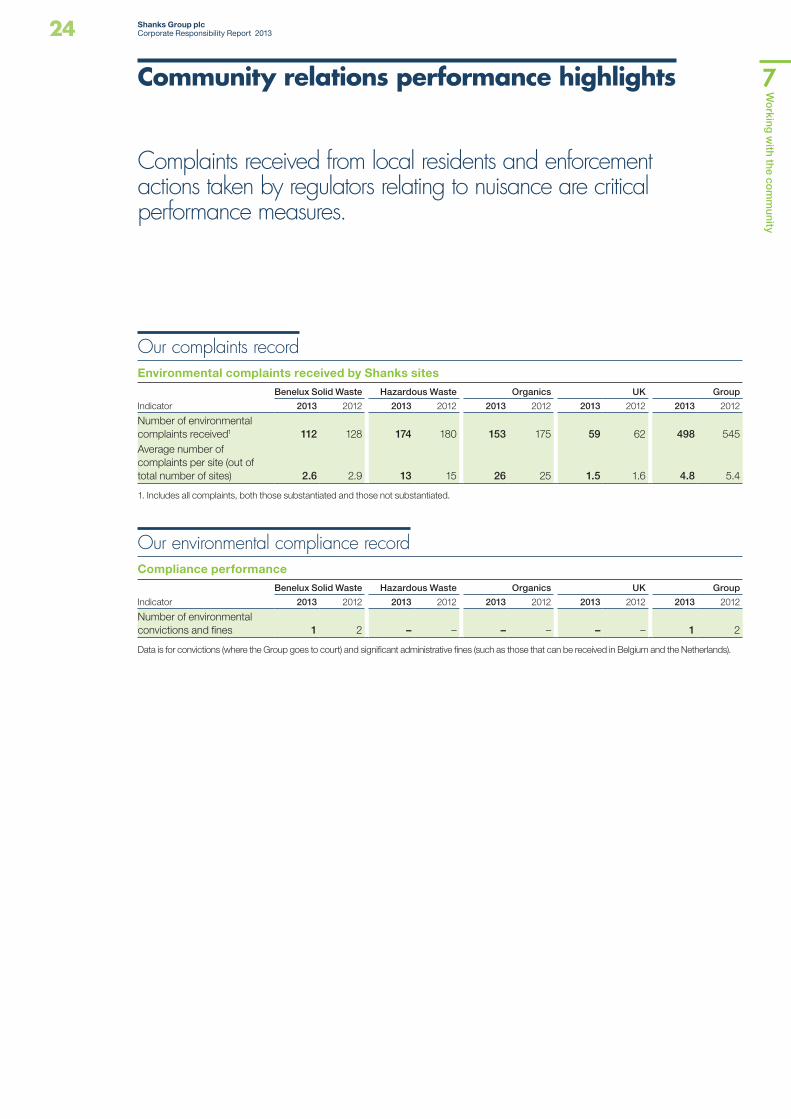
Community relations performance highlights
Complaints received from local residents and enforcement actions taken by regulators relating to nuisance are critical performance measures.
Our complaints recordEnvironmental complaints received by Shanks sites
Benelux Solid Waste Hazardous Waste Organics UK Group
Indicator 2013 2012 2013 2012 2013 2012 2013 2012 2013 2012
Number of environmental complaints received1 112 128 174 180 153 175 59 62 498 545Average number of complaints per site (out of total number of sites) 2.6 2.9 13 15 26 25 1.5 1.6 4.8 5.4
1. Includes all complaints, both those substantiated and those not substantiated.
Our environmental compliance recordCompliance performance
Benelux Solid Waste Hazardous Waste Organics UK Group
Indicator 2013 2012 2013 2012 2013 2012 2013 2012 2013 2012
Number of environmental convictions and fines 1 2 – – – – – – 1 2
Data is for convictions (where the Group goes to court) and significant administrative fines (such as those that can be received in Belgium and the Netherlands).
Shanks Group plcCorporate Responsibility Report 201325
Sustainab
le manag
ement
Sustainable management systems
We operate formal management systems at all of our operations that set the precedent for continuous improvement across our business. These are designed to maximise the quality of our resource recovery activities, maintain the highest standards of health and safety, ensure that employees are treated in an ethical manner and that the concerns of communities are acknowledged and addressed.While these management systems are internal to the Group, they are audited by third parties and comply with national and international standards. We are also included in high profile benchmarking and independently assessed schemes, for example, the FTSE4Good index and the Carbon Disclosure Project. We engage proactively with such bodies to ensure the specific issues facing waste management companies are taken into account within their ratings.
Managing sustainability
In addition to knowing that we comply with the law and good practice, our customers may insist on international accreditations before committing to a commercial relationship. Our certified management systems are therefore crucial for enhancing our customer relationships as well as providing a structure for achieving our sustainability objectives.Our commitment to sustainability was recognised when we won the PLC ‘Achievement in Sustainability’ award in March 2013.
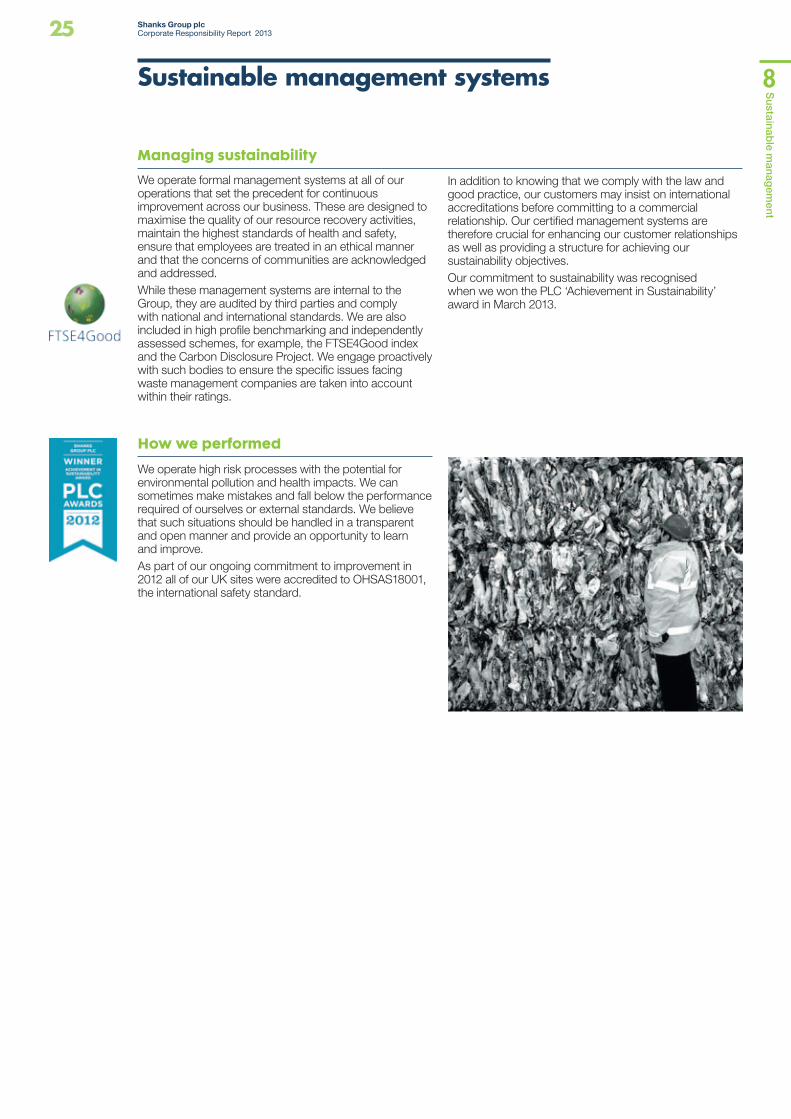
How we performed
We operate high risk processes with the potential for environmental pollution and health impacts. We can sometimes make mistakes and fall below the performance required of ourselves or external standards. We believe that such situations should be handled in a transparent and open manner and provide an opportunity to learn and improve.As part of our ongoing commitment to improvement in 2012 all of our UK sites were accredited to OHSAS18001, the international safety standard.

Our customers want to know that they are sending their waste to a responsible, ethical and legally compliant business.
ATM uses innovative technologies to treat hazardous waste. Given the nature of the material, ATM’s customers need to know that it is managed in a sustainable and
appropriate manner. Each year ATM hosts around 25 high level audits, which allow customers to gain a full picture of the on-site processes and procedures.
Such audits satisfy our customers that we meet technical standards and are true to our own performance objectives. They also provide an opportunity for us to review and improve our operating standards and to enhance our customer relationships.
Satisfied customers
#9Making more from waste
Shanks Group plcCorporate Responsibility Report 201326
Sustainab
le manag
ement
Management systems performance highlights
Our external, independent accreditations provide confidence in our management approach and commitment to legal compliance and good practice. The table below lists the main standards against which our divisions are accredited.
Our management systems achievementsNumber of sites accredited to formal management systems standards
Benelux Solid Waste Hazardous Waste Organics UK Group
Indicator 2013 2012 2013 2012 2013 2012 2013 2012 2013 2012
IS014001/EMAS 31 32 16 12 – – 39 35 86 79ISO 9001 34 36 14 10 5 5 39 35 92 86OSHAS 18001 6 8 15 11 – – 39 – 60 19SCC/VCA 21 28 14 10 – – – – 35 38Other 13 12 10 14 3 3 – – 26 29
ISO14001/EMAS – international environmental management standardsISO9001 – international quality standardOHSAS18001 – international health and safety standardSCC/VCA – national health and safety standardsOther – national and international accreditations relating to activities such as tank cleaning
Shanks Group plcCorporate Responsibility Report 201327
Driving and
emb
edd
ing corp
orate resp
onsib
ility
Corporate responsibility framework
Our Corporate Responsibility (CR) and Health & Safety Committees co-ordinate and monitor our sustainability strategy and report progress to the Group Executive Committee. They comprise senior sector and technical specialists from across the Group selected for their knowledge of our sustainability priorities.The committees provide high level advice to the Group on CR and health and safety, performance monitoring, reporting, policy formulation and communications. They also provide independent commentary on our CR and health and safety standards as well as defining performance improvements.For example, in 2012 our Health & Safety Committee focused on transport safety, a major concern for the waste management industry. The Health and Safety Committee formulated a Group-wide traffic safety programme that prioritised segregation between pedestrians and vehicles. Employee engagement was crucial, from identifying major risk areas and issues, to formulating common pedestrian protection standards and action plans.
Driving improvement
The programme resulted in traffic safety action plans for more than 100 sites and many local safety improvements. This was a major initiative requiring leadership, resources, co-ordination, performance monitoring and quality assurance. While just one example, it exemplifies the fact that CR and sustainability are key market drivers and core components of our business strategy.
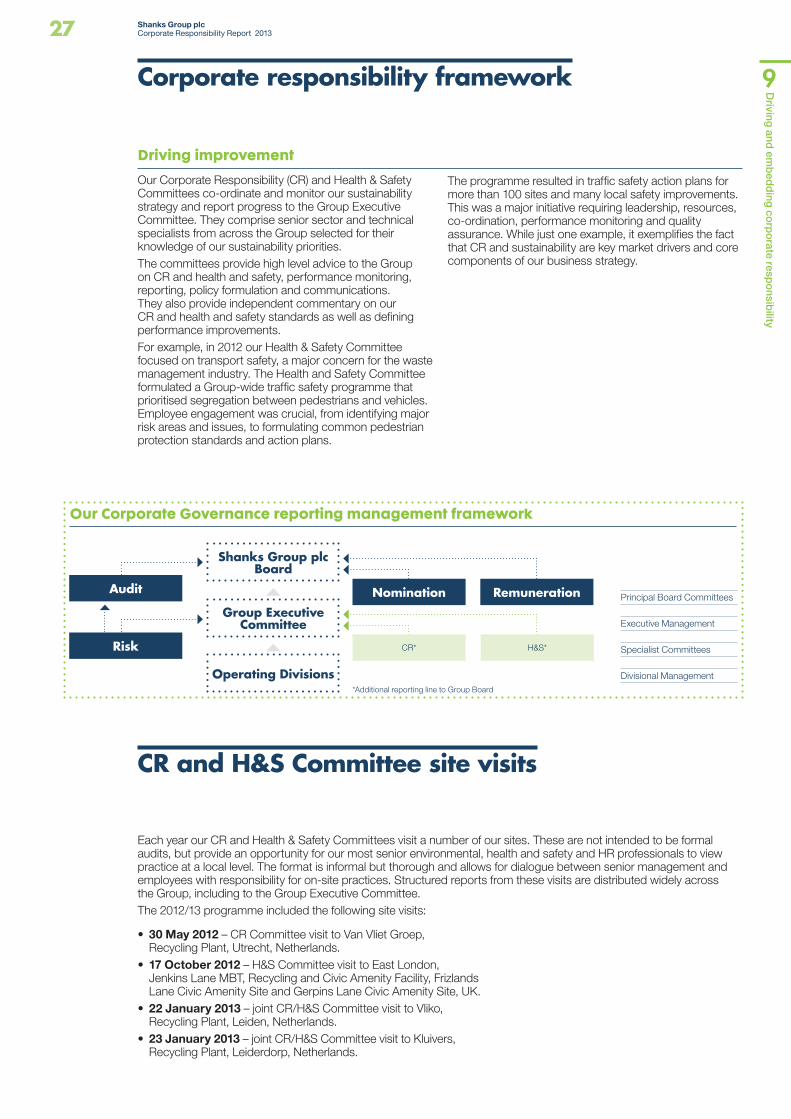
Our Corporate Governance reporting management framework
Shanks Group plc Board
Group Executive Committee
Operating Divisions
Remuneration
*Additional reporting line to Group Board
Principal Board Committees
Executive Management
Specialist Committees
Divisional Management
Audit
Risk
Nomination
CR* H&S*
CR and H&S Committee site visits
Each year our CR and Health & Safety Committees visit a number of our sites. These are not intended to be formal audits, but provide an opportunity for our most senior environmental, health and safety and HR professionals to view practice at a local level. The format is informal but thorough and allows for dialogue between senior management and employees with responsibility for on-site practices. Structured reports from these visits are distributed widely across the Group, including to the Group Executive Committee.The 2012/13 programme included the following site visits:
• 30 May 2012 – CR Committee visit to Van Vliet Groep, Recycling Plant, Utrecht, Netherlands.
• 17 October 2012 – H&S Committee visit to East London, Jenkins Lane MBT, Recycling and Civic Amenity Facility, Frizlands Lane Civic Amenity Site and Gerpins Lane Civic Amenity Site, UK.
• 22 January 2013 – joint CR/H&S Committee visit to Vliko, Recycling Plant, Leiden, Netherlands.
• 23 January 2013 – joint CR/H&S Committee visit to Kluivers, Recycling Plant, Leiderdorp, Netherlands.
Shanks Group plcCorporate Responsibility Report 201328
Links, contacts and
further inform
ation
More about our CR performance
Want to know more?
Our CR Report is one of many resources that we make available to describe our approach and performance around sustainability. Other detailed information is available through our Group website and questions or issues can be raised using the details provided in the contacts section of this report or by using our CR information e-mail address: [email protected]
Want to see detailed data?
This report offers a summary of our performance. Our Group website provides divisional level information and more detail on all aspects of CR performance. See our CR full data document at www.shanksplc.com/cr
Want to know how we calculate CR data?
Our CR indicators document defines what we measure and how these measurements are calculated. It also describes the rules that we define and follow in our reporting. Our CR indicators document is available at: www.shanksplc.com/cr
Want to know about our reporting and GRI?
The performance data and narrative in our CR Report and other published information is based on the requirements of the Global Reporting Initiative (GRI). Our response to GRI and our GRI navigator document can be viewed at: www.shanksplc.com/cr
Want to know more about our strategy and financial performance?
Our Annual Report provides more information on Shanks Group, including our vision, strategy, operations, people, risk and financial performance. The Annual Report and other corporate information can be viewed at: www.shanksplc.com/investor-centre
Want to learn more about our operations?
As well as Group documents, some of our operating divisions produce their own reports. These documents can be viewed at the divisional web addresses shown in the contacts section of this report.
Do you have a comment or question on our CR Report or associated activities?
Please contact us at: [email protected]. If you do not have access to e-mail please refer to the details at the end of this report.

Shanks Group plcCorporate Responsibility Report 201329
Links, contacts and
further inform
ation
Contacts
Corporate Head Office
Shanks Group plcDunedin HouseAuckland Park, Mount FarmMilton KeynesBuckinghamshire MK1 1BUTel: 00 44 (0) 1908 650580Fax: 00 44 (0) 1908 650651website: www.shanksplc.com e-mail: [email protected]
UK Solid Waste & Municipal Division
Shanks Waste Management LimitedDunedin HouseAuckland Park, Mount Farm Milton KeynesBuckinghamshire MK1 1BU Tel: 00 44 (0) 1908 650650Fax: 00 44 (0) 1908 650699website: www.shanks.co.uk e-mail: [email protected]
Hazardous Waste Division
Shanks Hazardous WasteComputerweg 12DPostbus 15453821 AB AmersfoortTel: 00 31 (0) 455 88 90Fax: 00 31 (0) 456 25 81website: www.reym.nle-mail: info@shankshazardous waste.com
Netherlands Solid Waste Division
Shanks NederlandPO Box 1412290 AC WateringenThe NetherlandsTel: 00 31 (0) 174 219 900Fax: 00 31 (0) 174 219 911website: www.shanks.nle-mail: [email protected]
Organics Division
Orgaworld Nederland B.VPettelaarpark 101Postbus 50765201 GB ’s- HertogenboschThe NetherlandsTel: 00 31 (0) 73-687 26 00Fax: 00 31 (0) 73-687 26 09website: www.orgaworld.nle-mail: [email protected]
Belgium Solid Waste Division
Shanks Belgium Rue Edouard Belin 3/1 B-1435 Mont-Saint-Guibert BelgiumTel: 00 32 (0) 1023 3660Fax: 00 32 (0) 1023 3661website: www.shanks.bee-mail: [email protected]
Further information about our operations, CR Reports and other publications can be obtained from our Group website: www.shanksplc.com. For information about our divisional operations please refer to the contacts below.
Principal Offices


![1737 - micromatic.com · 1737-l long shanks 1737-s short shanks 1738-l long shanks 1738-s short shanks 1066.8 [42.0] 76.2 [3.0] 990.6 [39.0] (13) spaces 76.2 [3.0] apart ref. 38.1](https://img.pdfslide.us/doc/110x75/5f8352f9a944be5a795c3526/1737-1737-l-long-shanks-1737-s-short-shanks-1738-l-long-shanks-1738-s-short-shanks.jpg)