Embed Size (px)
Citation preview

Fall 2013 Co-Op Presentation1st RotationContinuous Improvement
Shane IrelandDecember 13, 2013

About Me
Hometown: – Pittsburgh, PA
Education: – University of Pittsburgh, Senior
– Industrial Engineering
– Expected Graduation of December 2014
Rotation: 1st Co-Op Rotation at EMD– One previous rotation at Crayola
–Easton, PA
Activities / Interests:– Pittsburgh sports fan
– Poker Placed 2nd in one of the PPO Tournaments
1st Rotation: Continuous Improvement
Mentor: Tracy Alim
Manager: Mike Sherwin
Four Major Projects FIE and Office Supplies Kanban System
Incorporating the Weekend Lineup on the Intranet
ORP Takt Time Analysis
AP1000 Test Loop SMED (Standard Minute Exchange of Dies)
Semester Outline:
FIE and Office Supplies Kanban System
Goal: Improve our method for Managing Supplies
Learn the Kanban Visual Management Method
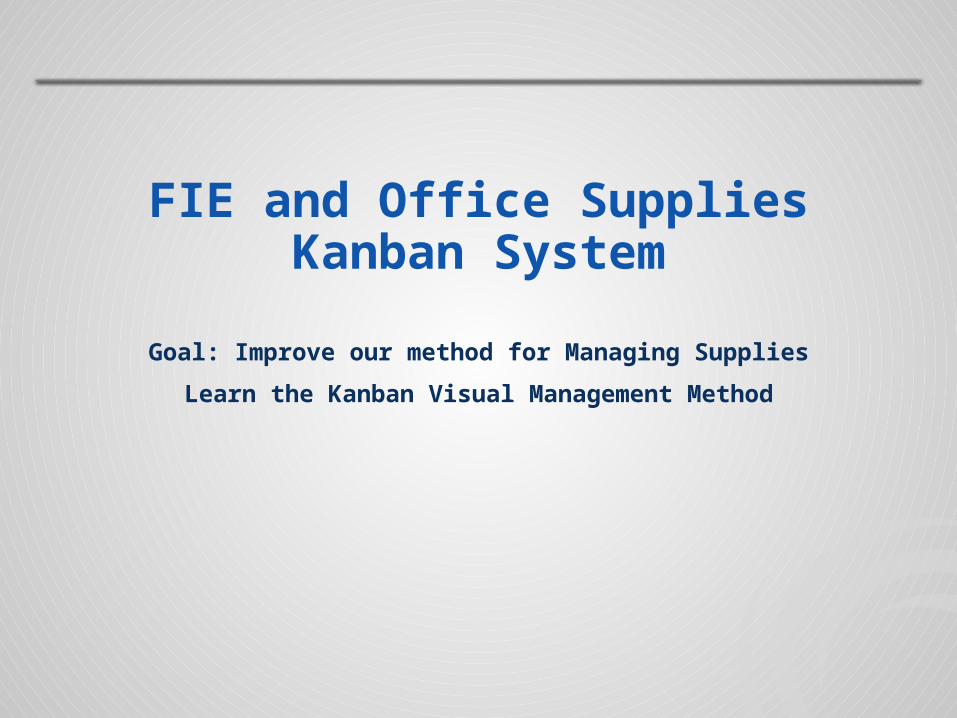
FIE and Office Supplies Kanban System
Current Method:– Supplies are replenished only when someone asks them to be
– Bulk Orders
Issues with Current Method:– Excess Inventory
– No standard signal that supplies are low
– Supplies are not available when need be
Managing our Supplies
FIE and Office Supplies Kanban System
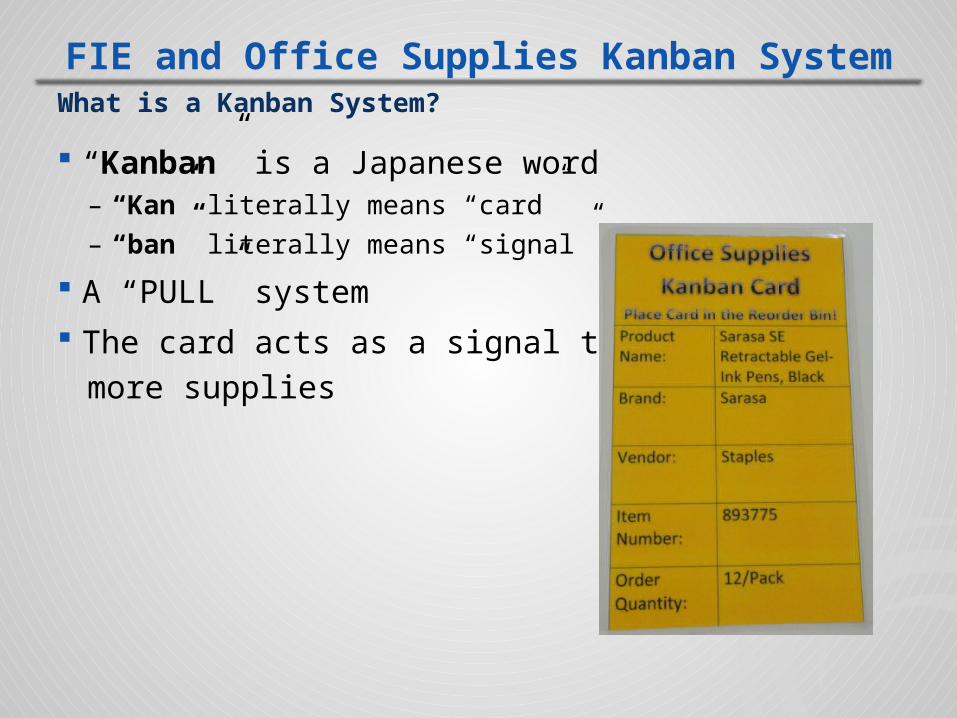
“Kanban” is a Japanese word– “Kan” literally means “card”
– “ban” literally means “signal”
A “PULL” system
The card acts as a signal to order
more supplies
What is a Kanban System?
FIE and Office Supplies Kanban System
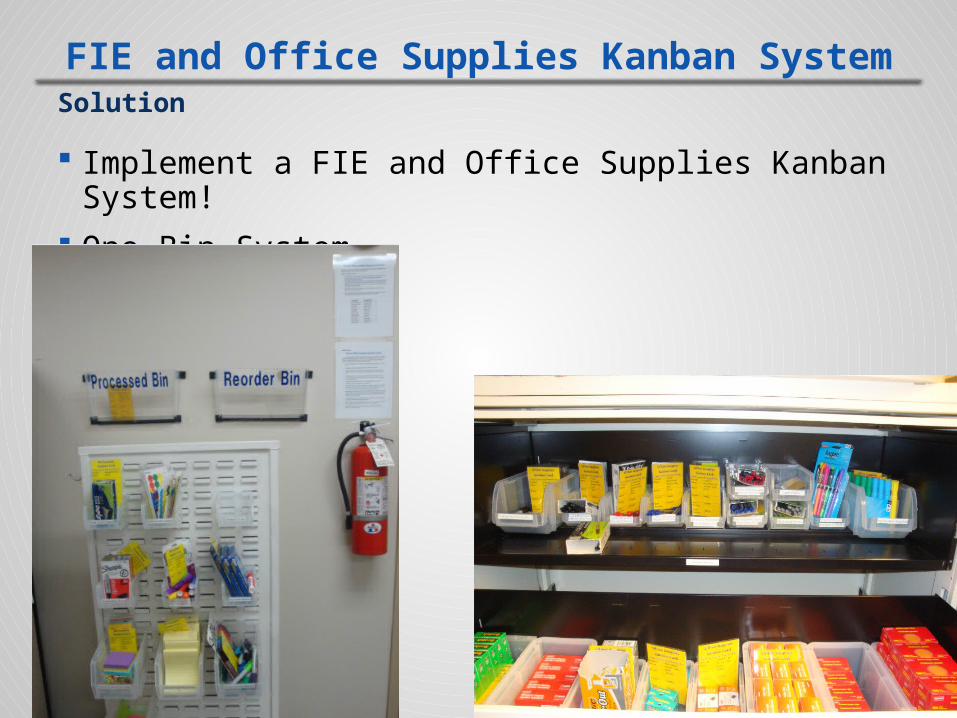
Implement a FIE and Office Supplies Kanban System!
One Bin System
Solution
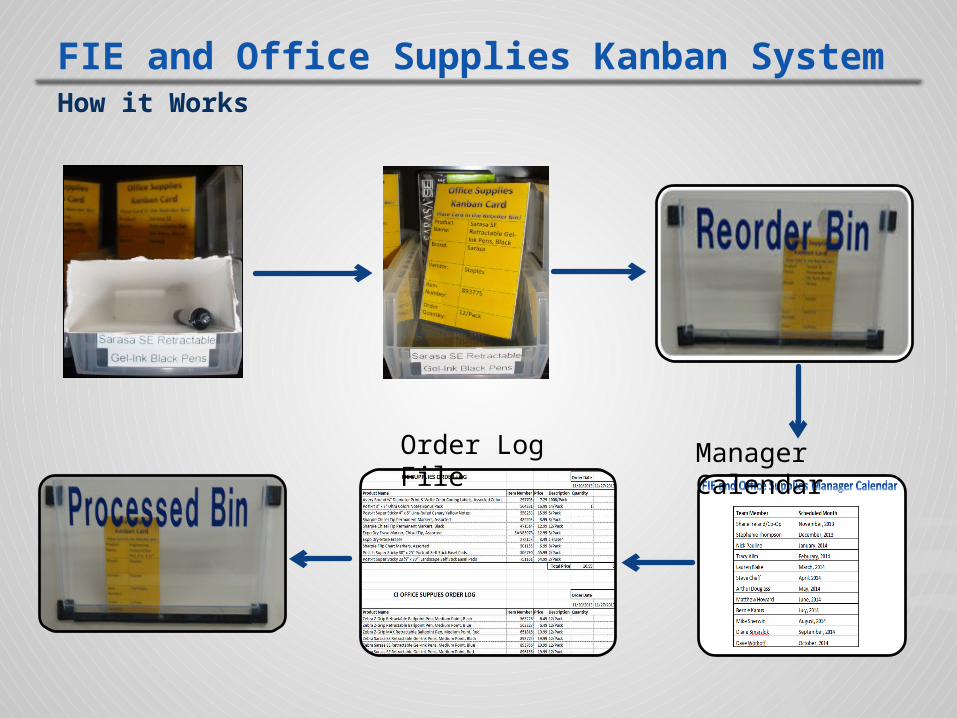
FIE and Office Supplies Kanban SystemHow it Works
Order Log File Manager Calendar
Incorporating the Weekend Lineup on the Intranet
Goal: Improve the Process of creating the Weekend Lineup
Incorporating the Weekend Lineup on the Intranet
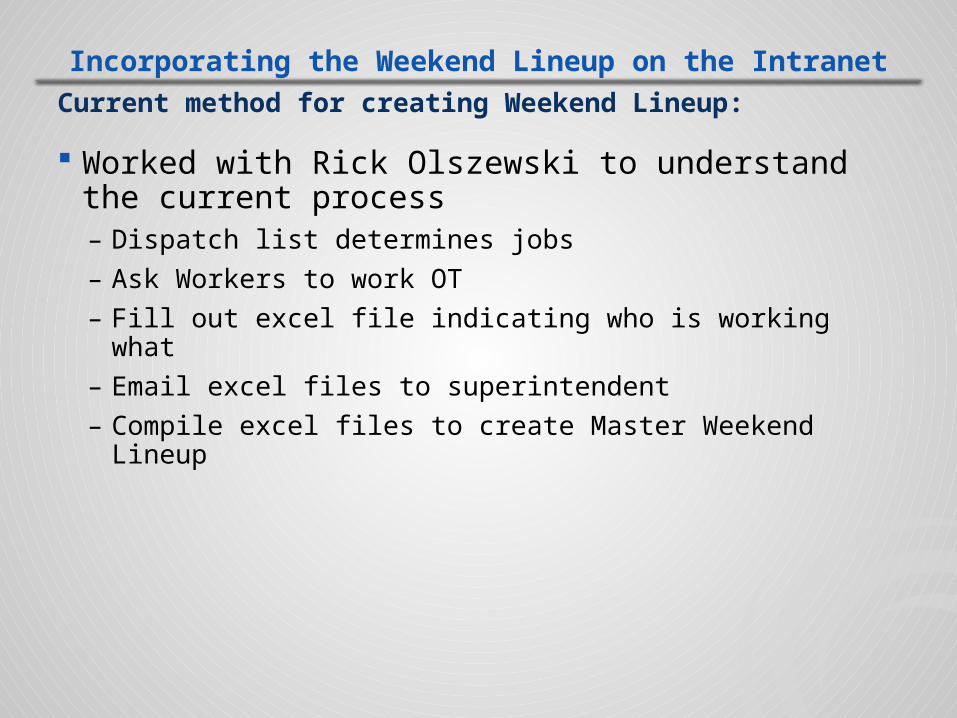
Worked with Rick Olszewski to understand the current process– Dispatch list determines jobs
– Ask Workers to work OT
– Fill out excel file indicating who is working what
– Email excel files to superintendent
– Compile excel files to create Master Weekend Lineup
Current method for creating Weekend Lineup:
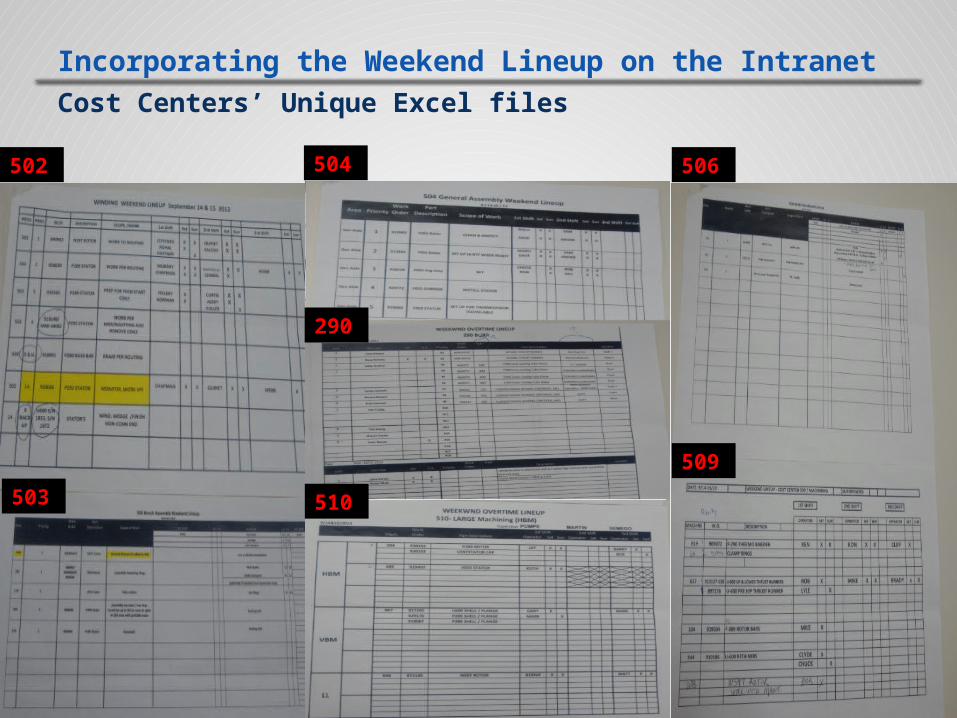
Incorporating the Weekend Lineup on the IntranetCost Centers’ Unique Excel files
502
509
506
290
504
503 510
No Standard
Emailing excel files is waste
Lacks Visibility
Incorporating the Weekend Lineup on the IntranetIssues with Current State:
Incorporating the Weekend Lineup on the Intranet
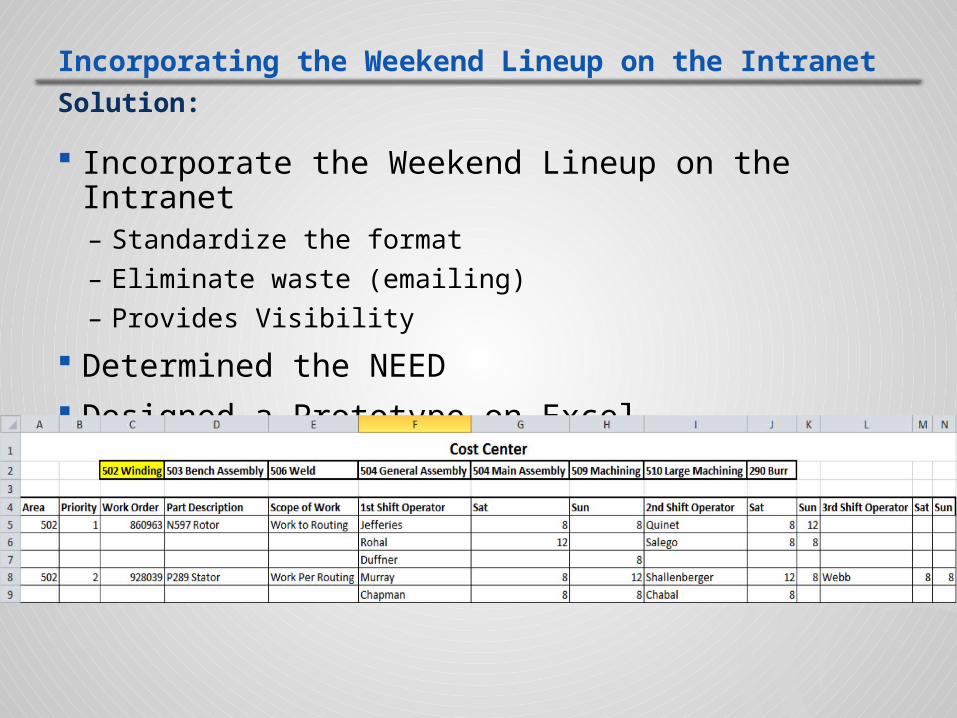
Incorporate the Weekend Lineup on the Intranet– Standardize the format
– Eliminate waste (emailing)
– Provides Visibility
Determined the NEED
Designed a Prototype on Excel
Solution:
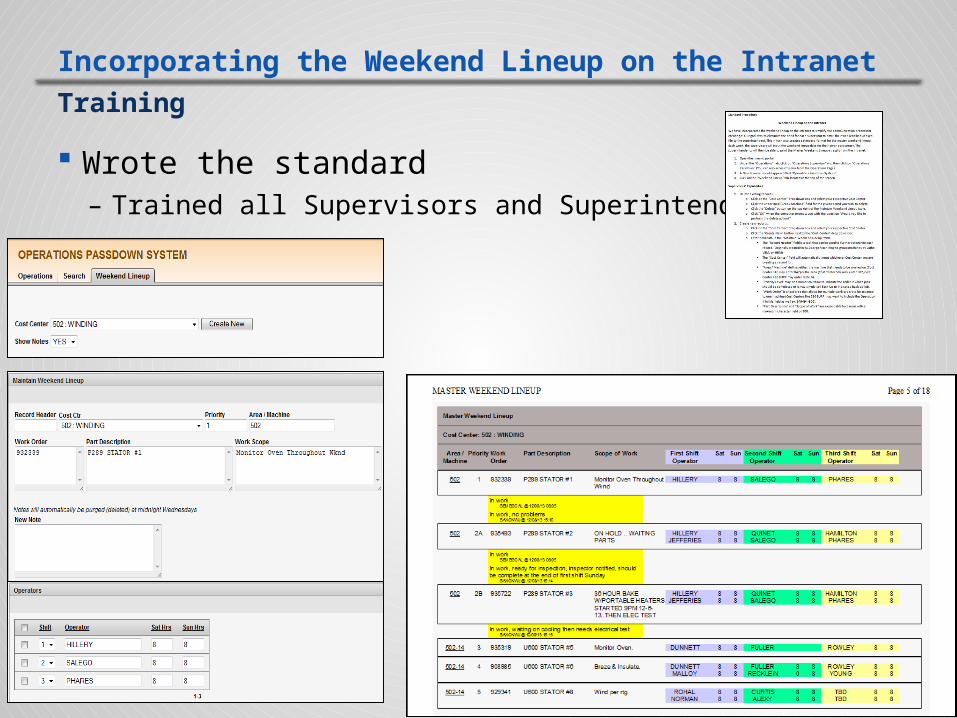
Incorporating the Weekend Lineup on the Intranet
Wrote the standard– Trained all Supervisors and Superintendents
Training
G976 Motor Takt Time Analysis
Goal: Learn Takt Time Analysis and help ensure on time ORP delivery
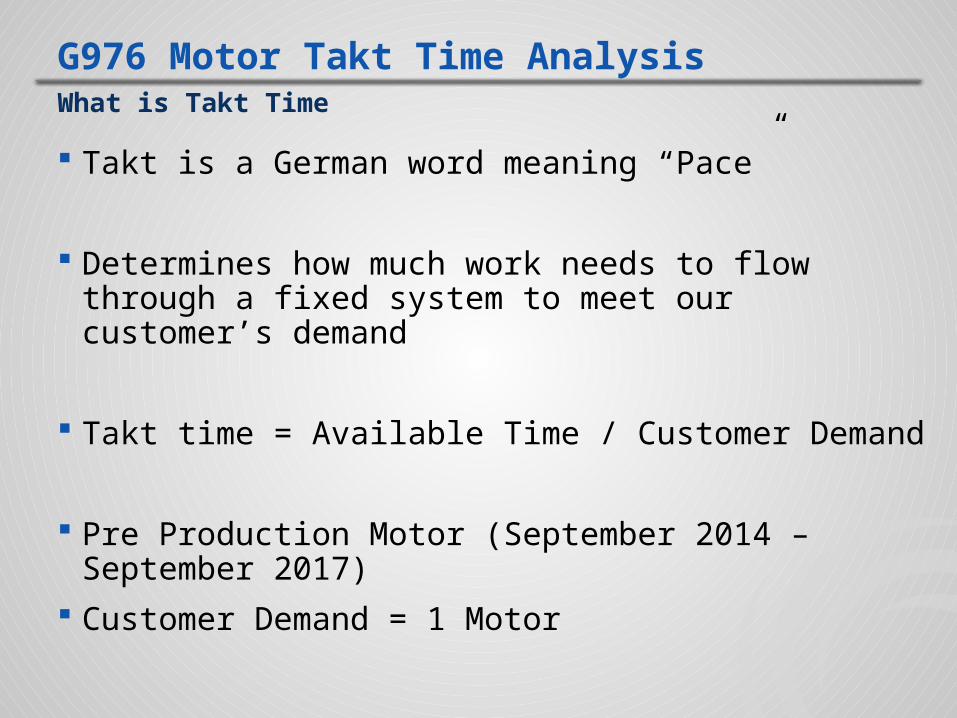
G976 Motor Takt Time Analysis
Takt is a German word meaning “Pace”
Determines how much work needs to flow through a fixed system to meet our customer’s demand
Takt time = Available Time / Customer Demand
Pre Production Motor (September 2014 – September 2017)
Customer Demand = 1 Motor
What is Takt Time
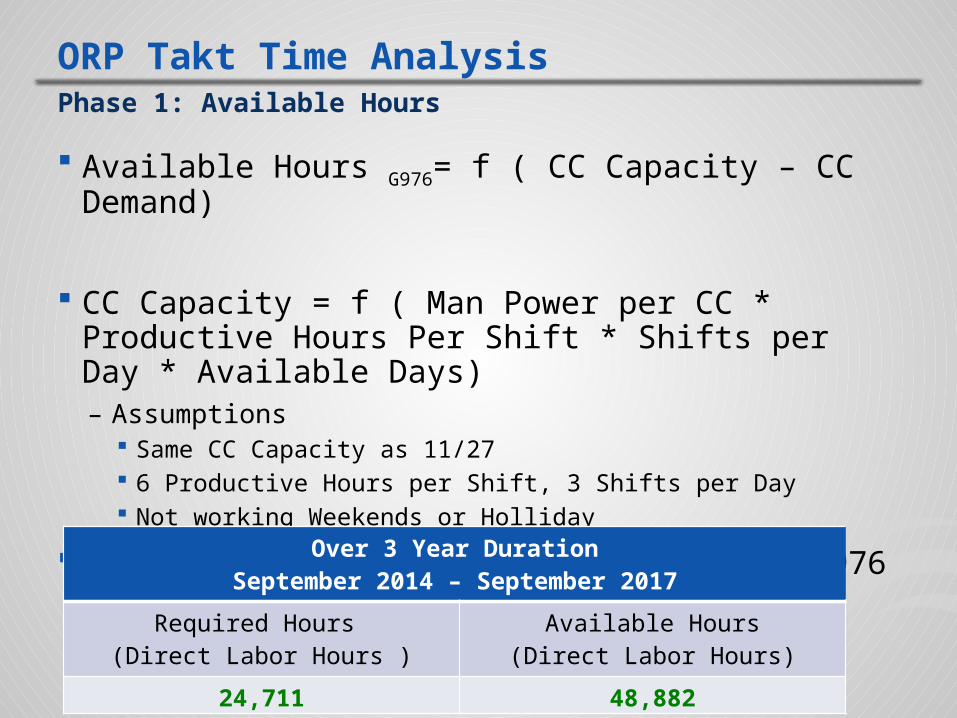
ORP Takt Time Analysis
Available Hours G976= f ( CC Capacity – CC Demand)
CC Capacity = f ( Man Power per CC * Productive Hours Per Shift * Shifts per Day * Available Days)– Assumptions
Same CC Capacity as 11/27 6 Productive Hours per Shift, 3 Shifts per Day Not working Weekends or Holliday
CC Demand = E(Project Hours per CC) – G976 Hours
Phase 1: Available Hours
Over 3 Year DurationSeptember 2014 – September 2017
Required Hours (Direct Labor Hours )
Available Hours(Direct Labor Hours)
24,711 48,882
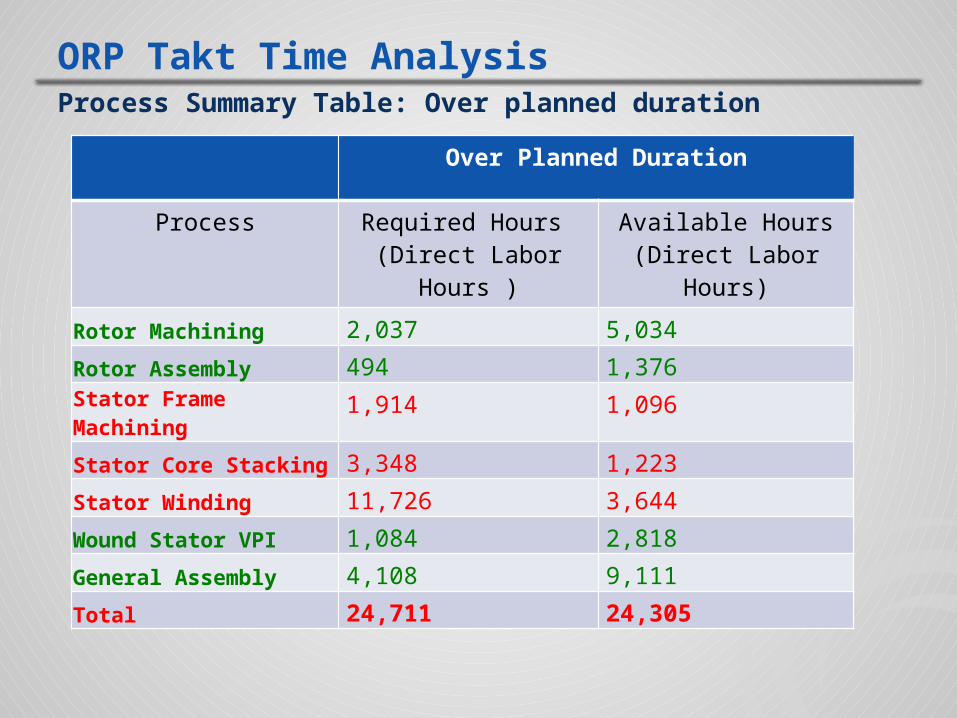
ORP Takt Time AnalysisProcess Summary Table: Over planned duration
Over Planned Duration
Process Required Hours (Direct Labor Hours )
Available Hours(Direct Labor Hours)
Rotor Machining 2,037 5,034
Rotor Assembly 494 1,376
Stator Frame Machining 1,914 1,096
Stator Core Stacking 3,348 1,223
Stator Winding 11,726 3,644
Wound Stator VPI 1,084 2,818
General Assembly 4,108 9,111
Total 24,711 24,305
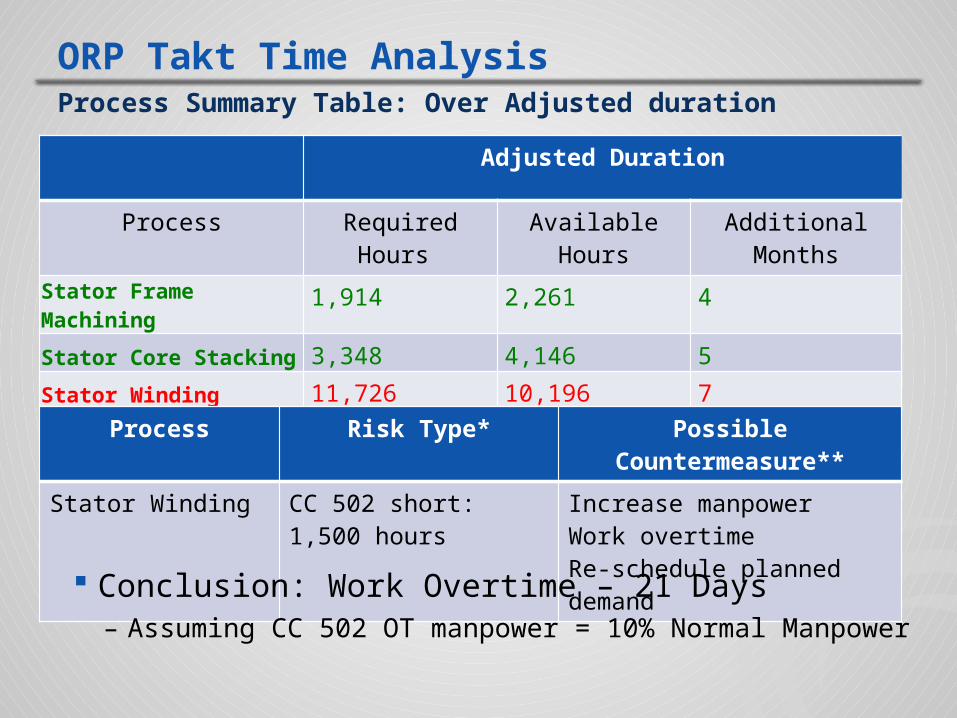
ORP Takt Time AnalysisProcess Summary Table: Over Adjusted duration
Adjusted Duration
Process Required Hours Available Hours Additional Months
Stator Frame Machining 1,914 2,261 4
Stator Core Stacking 3,348 4,146 5
Stator Winding 11,726 10,196 7
Process Risk Type* Possible Countermeasure**
Stator Winding CC 502 short: 1,500 hours
Increase manpower Work overtimeRe-schedule planned demand
Conclusion: Work Overtime – 21 Days– Assuming CC 502 OT manpower = 10% Normal Manpower
AP1000 Y-Loop SMED
Goal: Reduce AP1000 Installation, Removal, and Pre Installation cycle times in the Y-Loop
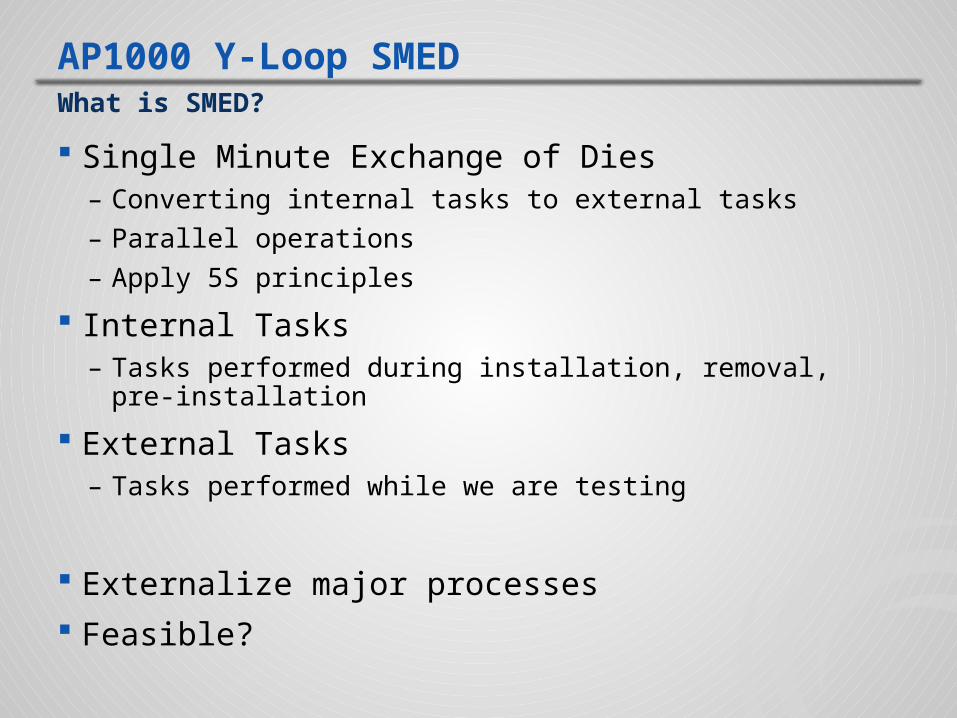
AP1000 Y-Loop SMED
Single Minute Exchange of Dies– Converting internal tasks to external tasks
– Parallel operations
– Apply 5S principles
Internal Tasks– Tasks performed during installation, removal, pre-installation
External Tasks– Tasks performed while we are testing
Externalize major processes
Feasible?
What is SMED?
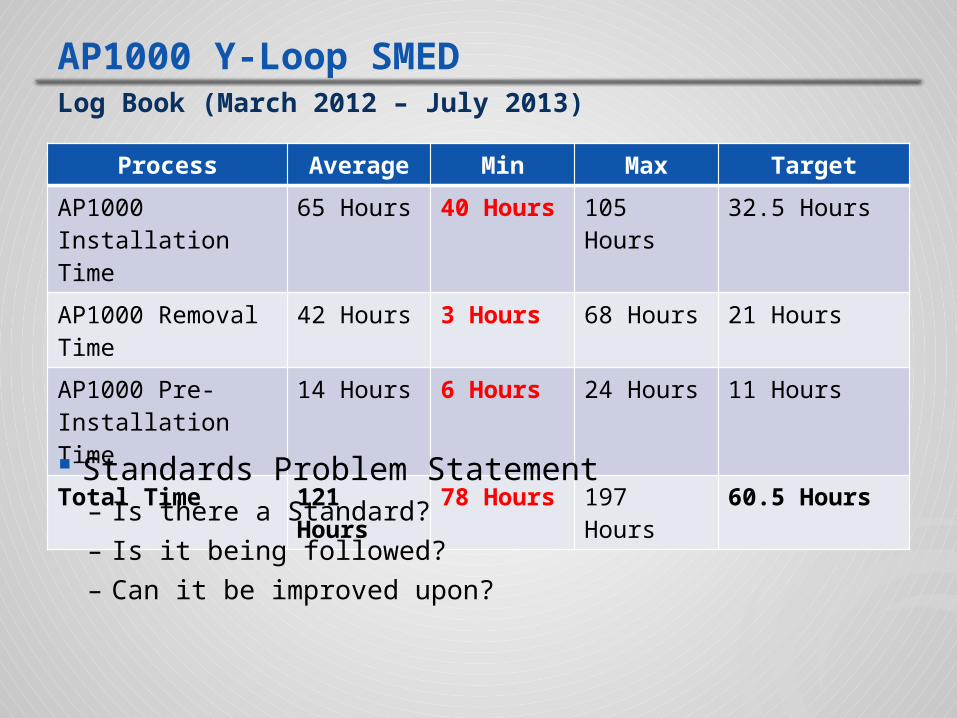
AP1000 Y-Loop SMEDLog Book (March 2012 – July 2013)
Process Average Min Max Target
AP1000 Installation Time
65 Hours 40 Hours 105 Hours 32.5 Hours
AP1000 Removal Time
42 Hours 3 Hours 68 Hours 21 Hours
AP1000 Pre-Installation Time
14 Hours 6 Hours 24 Hours 11 Hours
Total Time 121 Hours 78 Hours 197 Hours 60.5 Hours
Standards Problem Statement– Is there a Standard?
– Is it being followed?
– Can it be improved upon?
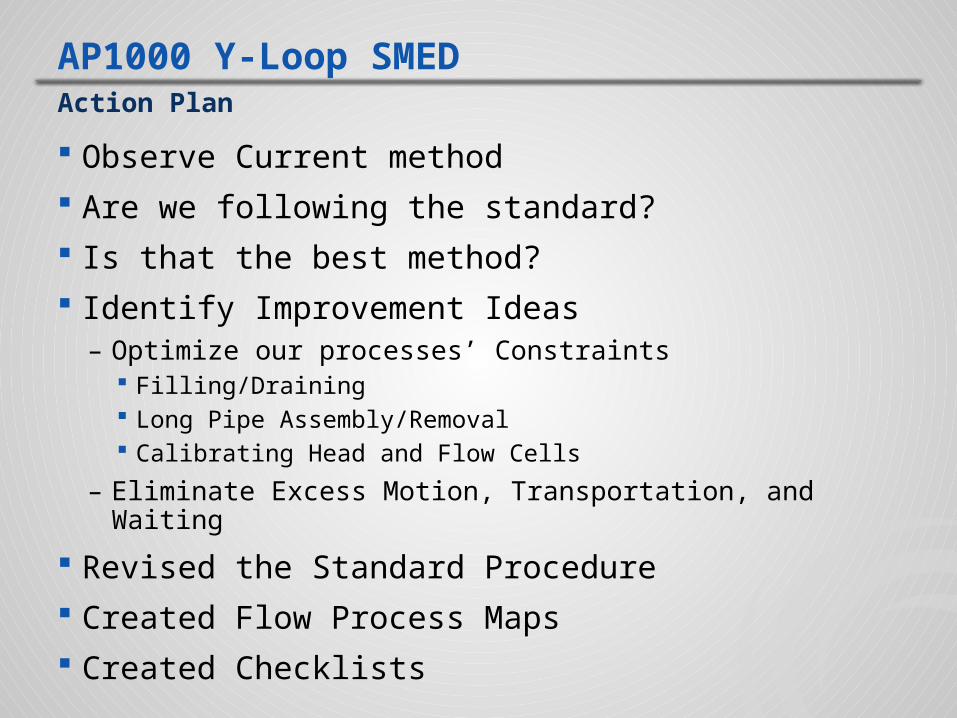
AP1000 Y-Loop SMED
Observe Current method
Are we following the standard?
Is that the best method?
Identify Improvement Ideas– Optimize our processes’ Constraints
Filling/Draining Long Pipe Assembly/Removal Calibrating Head and Flow Cells
– Eliminate Excess Motion, Transportation, and Waiting
Revised the Standard Procedure
Created Flow Process Maps
Created Checklists
Action Plan
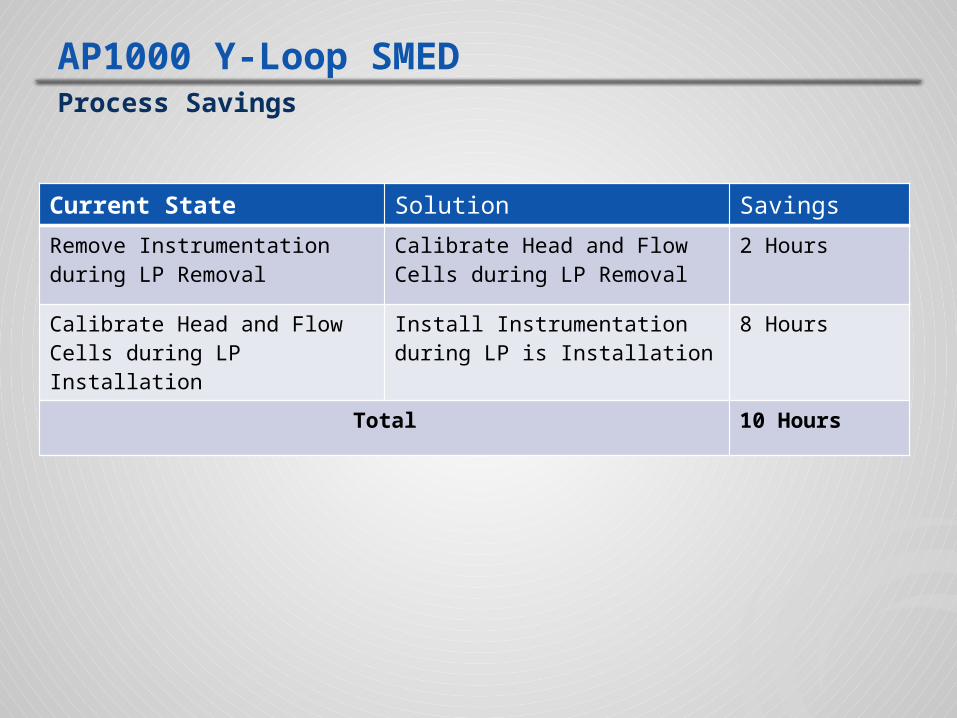
AP1000 Y-Loop SMEDProcess Savings
Current State Solution Savings
Remove Instrumentation during LP Removal
Calibrate Head and Flow Cells during LP Removal
2 Hours
Calibrate Head and Flow Cells during LP Installation
Install Instrumentation during LP is Installation
8 Hours
Total 10 Hours
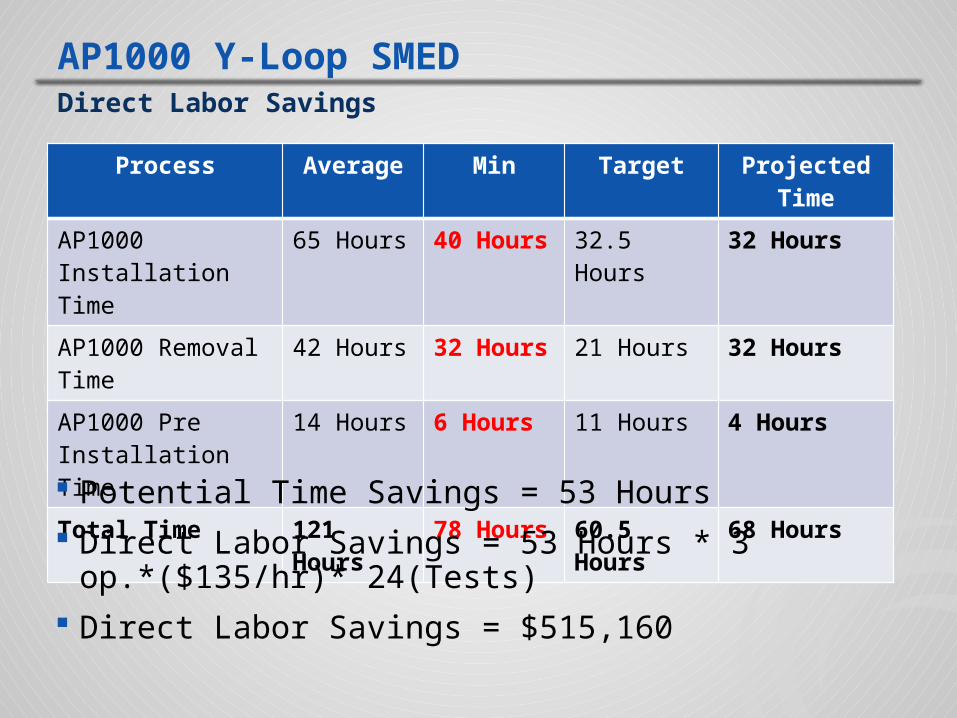
AP1000 Y-Loop SMEDDirect Labor Savings
Process Average Min Target Projected Time
AP1000 Installation Time
65 Hours 40 Hours 32.5 Hours 32 Hours
AP1000 Removal Time
42 Hours 32 Hours 21 Hours 32 Hours
AP1000 Pre Installation Time
14 Hours 6 Hours 11 Hours 4 Hours
Total Time 121 Hours 78 Hours 60.5 Hours 68 Hours
Potential Time Savings = 53 Hours
Direct Labor Savings = 53 Hours * 3 op.*($135/hr)* 24(Tests)
Direct Labor Savings = $515,160
What I learned this Rotation at EMD
Lean Manufacturing techniques Kanban Systems SMED Takt Time Analysis
Time management Balancing 8 projects
How to Implement Change
Thank You!!!
CI Team• Tracy Alim• Mike Sherwin• Steve Chaff• Nick Pauline• Stephanie Thompson• Diane Smarslok• Art Douglas• Dave Workoff• Bernie Kapus• Lauren Blake• Matt Howard
Test Engineers• Vince Angelo
• Dave Penska
Planning and Production• Holly Walton• Debbie Gibb• Niel Crowley
Donna Millburn
Superintendents•Shawn Cross
•Darren Keller
•John Martin
Supervisors • Rick Olszewski• Bob Tiberi• Clarence Bishop• Chris Hadley• Bill Pompe• Jim Bowers• Kevin Daugherty• Walt Saxon• Mike Reitmeyer

Questions?? ?