Embed Size (px)
Citation preview

Shale Gas Monitoring
Katie Tomsho & Julie Vastine
Alliance for Aquatic Resource Monitoring
NWQMC 2012

ALLARM Background
• Empower communities with scientific tools tomonitor, protect, and restore PA streams.
• Provide Dickinson students with the opportunity toconvert classroom skills into practice.
Educate. Engage. Empower.

Who we are.
• Project of theenvironmentalstudies department(1986)
• 3 full time directors
• 1 sciencedirector/Dickinsonfaculty
• 10 – 14 students

Workshop Outline
• Science of theMarcellus
• MarcellusMonitoring
• Model collaboration
• Q&A

Shale Gas Plays

Depth to Marcellus Shale

Thickness of Marcellus Shale

Depth to Utica Shale

Thickness of Utica Shale

Natural Gas Shale Plays
Michael Arthur, http://marcellus.psu.edu/resources/presentations.php

Marcellus Wells in PA

Conventional vs. Unconventional
http://seekingalpha.com/article/131641-unconventional-natural-gas-just-a-frac-away

Differences in Drilling
Traditional Hydrofracking
• In traditional hydrofracking,typically 20,000 to 80,000gallons of fluid were usedeach time a well washydrofractured.
• Traditional hydrofrackingused 700 to 2,800 lbs. ofchemical additives
• 1940s
High Volume Hydrofracking (HVHF)
• HVHF uses between 2 and 10million gallons of fluid (on average5.6 million), the exact amountdepends upon the length of the wellbore and the number of fracturescreated along the lateral extent.
• HVHF uses between 205,000 and935,000 lbs. of chemical additives,per well many of which are toxic tohumans and wildlife.
• Late 1990s
www.TCgasmap.org Marcellus Accountability Project-Tompkins


Water Trucks

Drill Pipe

Trucks, Trucks, Trucks

Drilling Sites
• Drilling pads are typically 3-5 acres, each pad containing 5-6 horizontal wells• 2-9 million gallons of water used per well• 200-1400 truck trips to supply water per well• Drilling pads must be >500 feet from structures with potable water supplies; >300 feetfrom streams and wetlands• Drinking water presumptive responsibility 2500 feet.
http://savethewatertable.org/wp-content/uploads/2010/08/marcellus-shale-us_brush-run-600x401.jpg

Marcellus Site
A well pad can contain 4-10 sites or more. -MCOR

Combining the power of science with thepower of communities.
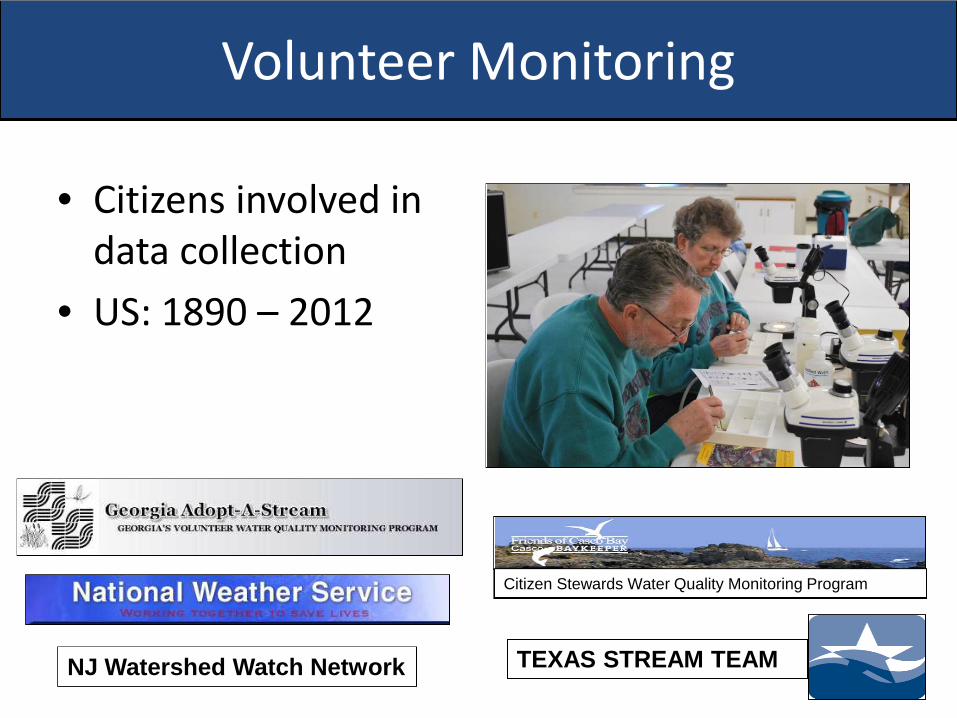
Volunteer Monitoring
• Citizens involved indata collection
• US: 1890 – 2012
TEXAS STREAM TEAMNJ Watershed Watch Network
Citizen Stewards Water Quality Monitoring Program
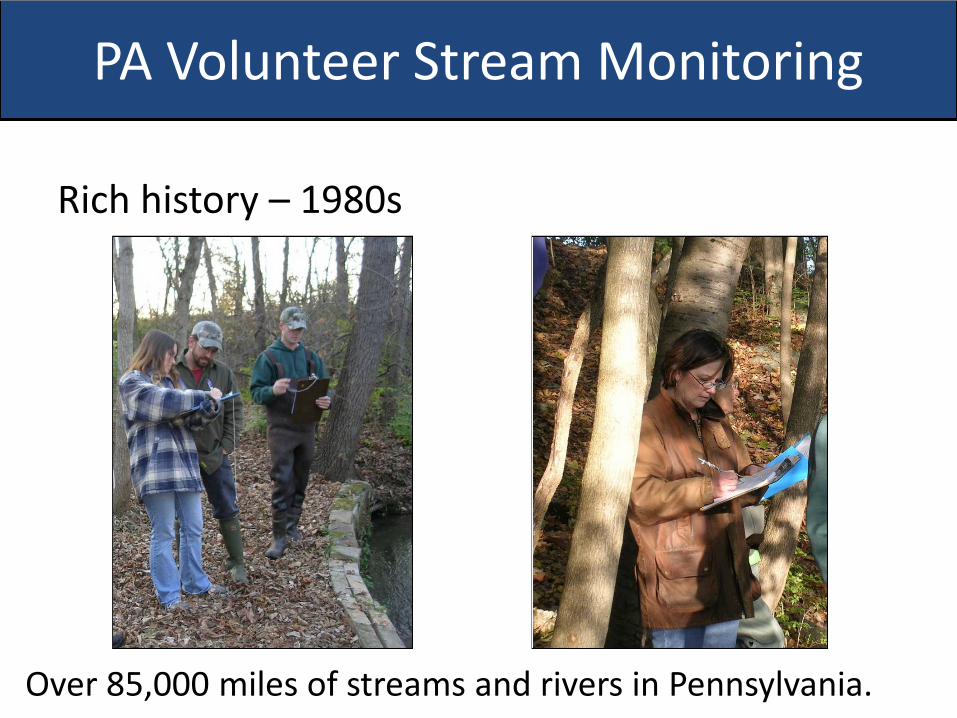
PA Volunteer Stream Monitoring
Rich history – 1980s
Over 85,000 miles of streams and rivers in Pennsylvania.

Marcellus Monitoring
A. Citizen surveillance
B. Baseline monitoring
C. Continuous monitoring
Great network of partners

Volunteer Monitoring
• Feasibility
• Affordability
• Scientifically robust
www.dickinson.edu/allarm

Why Are You Monitoring?
1. Early detection andprevention ofcontamination of flowbackwater in small streams
2. Document stream quality– long term impacts
3. Community education
4. Watchdog
The data collected using this monitoring protocol are not intended to be used for legal purposes.

Hydraulic Fracturing & Stream Monitoring
Flowback water – Fracking involves injecting several million gallons of water, sand, andchemical additives into the formation at high pressure. After the injection is completed,approximately 10-20 percent of the fluids (known as flowback) return to the surface.
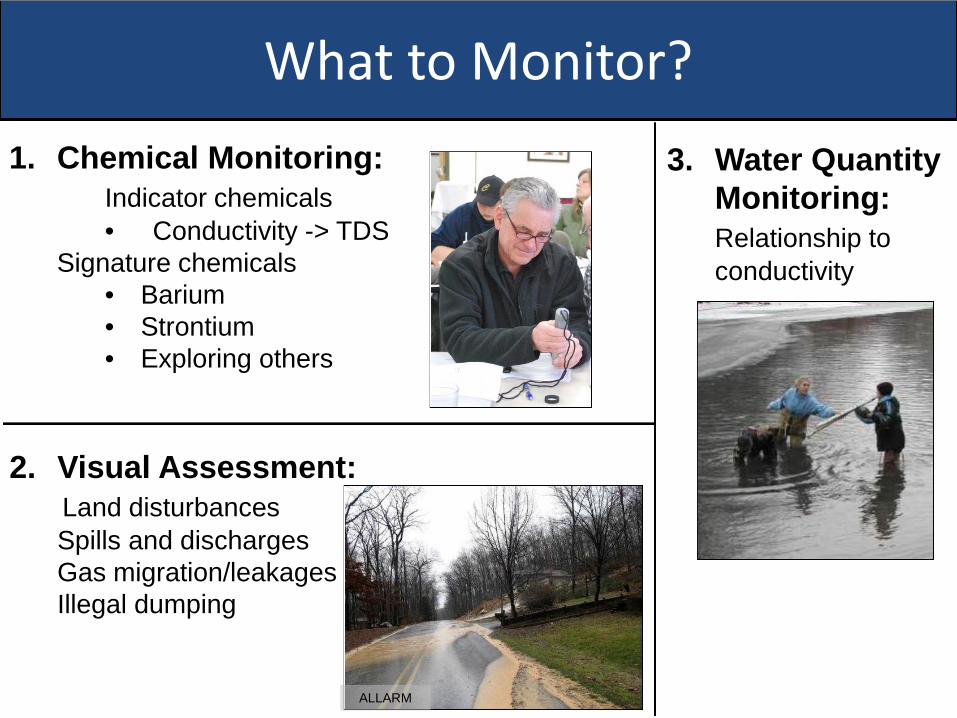
What to Monitor?
1. Chemical Monitoring:Indicator chemicals• Conductivity -> TDS
Signature chemicals• Barium• Strontium• Exploring others
2. Visual Assessment:Land disturbancesSpills and dischargesGas migration/leakagesIllegal dumping
3. Water QuantityMonitoring:Relationship toconductivity
ALLARM

Conductivity and Total Dissolved Solids
• Conductivity measures the ability of water topass an electrical current
• Total Dissolved Solids (TDS) measures theamount of ions dissolved in the water
(PA standard – 500 mg/L)
Voltage is applied between twoprobes to measure conductivity inmicroSiemens/centimeter (µS/cm)
TDS value (mg/L)TDS conversion
ratio factor

Why TDS & Conductivity?
• Frack water mixeswith natural brine,found in the shale
• Flowback watercontains highconcentrations ofsalts and metals
Picture by Amy Bergdale, US EPA

Source: Amy Bergdale, USEPA
TDS: 211,000 mg/L
TDS: 70,000 mg/L
TDS: 132,000 mg/L
TDS: 217,000 mg/L
Flowback Water Concentrations

Brine & Waste Trucks

Barium and Strontium
• Naturally-occurringmetals founddeepunderground
• Indicatecontaminationfrom MarcellusShale activities(signaturechemicals) https://www.msu.edu/~zeluffjo/periodic_table.gif

Water Quantity Monitoring
Cross-sectional area – understand relationship betweenamount of water in stream and conductivity
Depth
Width
0
50
100
150
200
250
300
350
400
450
500
conductivity
flow

Data Use: Decision Trees
Reportmonitoringinformationwhen values
exceed criteriain decision
trees
ChemicalMonitoring
*Visual
Assessment*
Surrogate Flow

Reportable event
Sample Date TDS (mg/L) Conductivity (µS/cm) Water Quantity(ft2)7/14/2010 120 178 17/21/2010 120 173 27/26/2010 130 182 38/4/2010 120 169 3
8/11/2010 100 165 68/16/2010 110 167 88/25/2010 110 168 98/30/2010 120 178 39/9/2010 110 174 5
9/14/2010 130 183 19/23/2010 100 156 810/2/2010 70 109 6110/6/2010 70 113 33
10/11/2010 60 110 1410/18/2010 140 200 510/26/2010 120 170 511/2/2010 510 680 111/9/2010 100 165 8

Visual Assessment
• Earth Disturbances
• Spills and Discharges
• Gas Migration/Leakages
Marcellus Shale Well Sites in Dimock, PA; 2010

Outlets of sediment controlstructures are NOT stabilized
Outlets of sediment controlstructures are stabilized
Photo courtesy of PA Council of Trout Unlimited Photo courtesy of PA Council of Trout Unlimited
Earth Disturbances: Drill Pad, StoragePond, & Staging Areas

Drilling fluid spill at Cabot siteDimock, PA
September 2009
Photos courtesy of Delaware Riverkeeper Network
Spills & Discharges

Gas Migration or Leakages
ALLARM
ALLARM
ALLARM

Illegal Dumping
Wetzel County Action Group Wetzel County Action Group

Determining Monitoring Locations
Step 1:
Find where drilling permitshave been issued (lat/long)• eNOTICE/eFacts/eMap PA• DEP reports
Step 2:
Find issued drilling permitlocations on map• Google Maps• Topographic map
Step 3:
Choose monitoring sitebased on important features• Well locations• Stream access

Quality Assurance/Quality Control
Considerations: What is feasible for volunteers?
Standard QA/QC Practices:• Training requirements• Care/calibration of equipment• Replicates• Documentation of procedures• Split sample analysis

Data Management
ALLARM created easy to use templates for volunteers to store their chemical, water quantity, andvisual assessment data.
Considerations: What tools and methods are available to volunteers?

Regional Data Management
• Shale Network
• WRI – Mon River Quest
• FracTracker
• SkyTruth
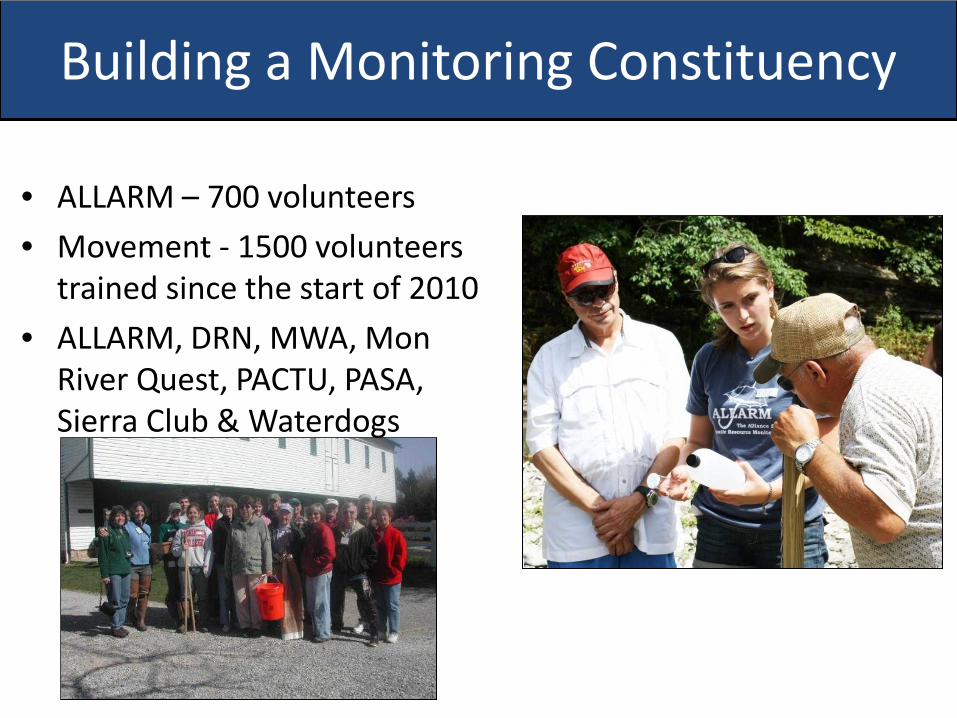
Building a Monitoring Constituency
• ALLARM – 700 volunteers
• Movement - 1500 volunteerstrained since the start of 2010
• ALLARM, DRN, MWA, MonRiver Quest, PACTU, PASA,Sierra Club & Waterdogs

Model Community Collaboration

Potter County –aka “God’s Country”
http://en.wikipedia.org/wiki/File:Map_of_Pennsylvania_highlighting_Potter_County.svg

Potter Background
• Rural – 18,000 people
• Heavily forested
• Three rivers – Allegheny, Genessee,Susquehanna
http://en.wikipedia.org/wiki/File:Pike_Township_Enter.jpg

Drilling in Potter
• 2005-2009: 22
• 2010-2011: 50

Potter a Model County
• County Commissioners
• Potter Marcellus Task Force
• Coordinated monitoring
– Trout Unlimited
– Waterdogs
– PCCD
ALLARM was recognized in town as the “water monitoring creek people”

Workshop Site Location Activity

Chemical Hands-On Training
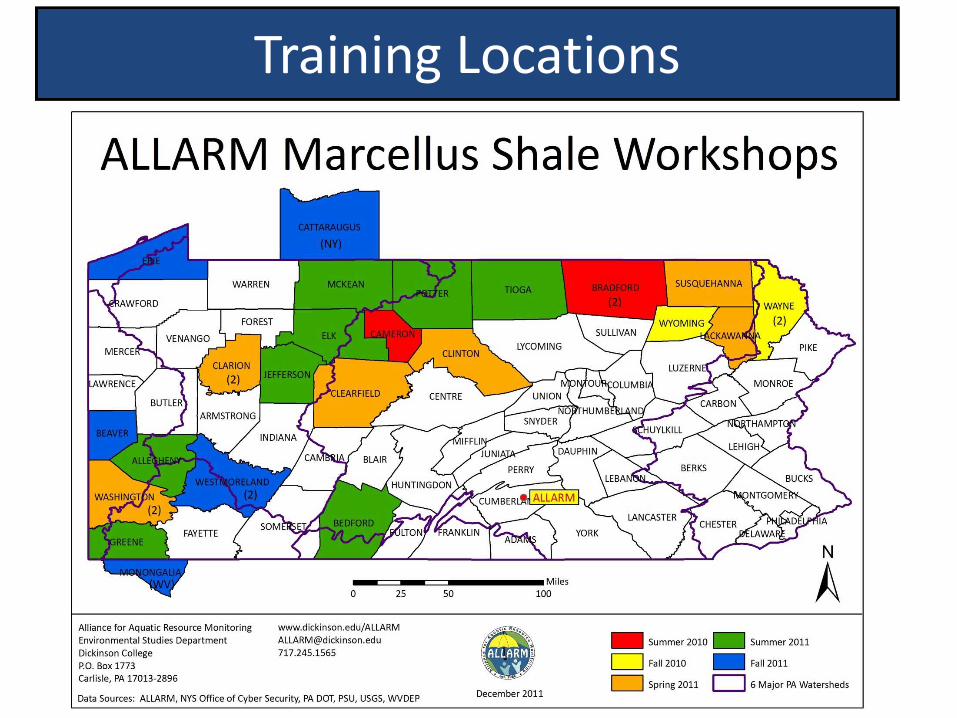
Training Locations

Questions?
Alliance for Aquatic Resource Monitoring (ALLARM)Dickinson College
P.O. Box 1773Carlisle, PA 17013
www.dickinson.edu/allarm
http://blogs.dickinson.edu/marcellusmonitoring/