Embed Size (px)
Citation preview
A STUDY ON THE INFLUENCE OF MATRIX DISTRIBUITION TO THE
PROPERTIES OF POLYMER MATRIX COMPOSITE (PMC)
SHAHANEEM BINTI SA’HARI
Thesis submitted in fulfilment of the requirements
for the award of the degree of
Bachelor of Mechanical Engineering with Manufacturing Engineering
Faculty of Mechanical Engineering
UNIVERSITI MALAYSIA PAHANG
DECEMBER 2010
ii
SUPERVISOR’S DECLARATION
I hereby declare that I have checked this project and in my opinion, this project is
adequate in terms of scope and quality for the award of the degree of Bachelor of
Mechanical Engineering with Manufacturing Engineering.
Signature
Name of Supervisor: EN. RAMLI BIN JUNID
Position: Lecturer
Date: 6 December 2010

iii
STUDENT’S DECLARATION
I hereby declare that the work in this project is my own except for quotations and
summaries which have been duly acknowledged. The project has not been accepted for
any degree and is not concurrently submitted for award of other degree.
Signature
Name: SHAHANEEM BINTI SA’HARI
ID Number: ME07039
Date: 6 December 2010

iv
Dedicated to my beloved parents
EN. SA’HARI BIN NASI
PN. HARISON BINTI ABDUL MUTALIB

v
ACKNOWLEDGEMENTS
In the name of the almighty ALLAH, the most gracious and merciful, with his
gracing and blessing has led to success be upon this thesis.
I would like to take this opportunity to express my sincere thanks and
appreciation to my project supervisor, En. Ramli bin Junid for the encouragement,
guidance, critics and insightful comment. This publication of this study would not be
possible without his encouragements and advices. As for all the lessons, guidance and
unparalleled knowledge shared will not be forgotten.
I am very thankful to Universiti Malaysia Pahang (UMP) for providing good
facilities in the campus. To all the staff and lecturers of Faculty of Mechanical
Engineering, a very big thank you to all, especially to all persons in charge for each
laboratory, who I disturb, take their time for many times in helping me and guide me to
do this experimental project, thank you very much. My sincere appreciation also
extends to all my fellow friends and others who have provided assistance and guidance
in preparing this thesis. Their views and tips are useful indeed. Thank you for the time
sacrificed to accompany me.
And last but not least, the best thanks goes to my family members especially to
my mother and father for their continuous moral support for me to successfully
accomplish my project. Thanks for the continuous love and attention that they have give
to me. Thanks for never stop believing in me. Thanks for always pray for my success
and happiness in the past, present and the future. Thanks for everything.
vi
ABSTRACT
This thesis deals with the composite materials, more focusing in Polymer Matrix
Composite. Objective of this thesis is to investigate the influence of matrix distribution
to the mechanical and physical properties of polymer matrix composite. Several testing
is planned which are Tensile Test, Vickers Hardness Test and Density Test in order to
study the behaviour of Polymer Matrix Composite (PMC) when their composition is
varied. For this Project, fibreglass is use as the dry fiber and Epoxy resins as its matrix
material. Hand layup process is use to fabricate the laminated composite. The specimens
are divided into four major categories with different weight content percentage of fiber
and matrix which are 30% matrix 70% fiber, 40% matrix 60% fiber, 50% matrix 50%
fiber and lastly, 60% matrix 40% fiber. From the observation of matrix distribution, for
category E1 (30% matrix 70% fiber), it can be seen that all fibers area were not fully
distributed with matrix material due to less matrix content. For category E4 (60%
matrix 40% fiber), it can be seen that the matrix content able to be distributed to the
whole area of fibers but it need more time to cure. In addition, the result of Physical
Testing shows that the density of laminated composite increased as the matrix amount
increased. Moreover, from Mechanical Test it shows that tensile strength of laminated
composite is increased as amount of matrix increased. As the result, the modulus of
elasticity is increased too. From Stress-Strain Curve, it shows the brittle material
behaviour of laminated composite. E4 have the highest tensile strength and modulus of
elasticity while E1 have the lowest tensile strength and modulus of elasticity. Besides,
E4 have the highest hardness number among the others. It can be conclude that, the
properties of Polymer Matrix Composite is depends on the matrix distribution.

vii
ABSTRAK
Tesis ini berkaitan dengan material komposit, lebih fokus pada Komposit Matriks
Polimer. Tujuan tesis ini adalah untuk mengetahui pengaruh taburan matrik terhadap
sifat mekanik dan fizikal komposit matriks polimer. Untuk mencapai tujuan ini,
beberapa ujian yang dirancang iaitu uji tarik, uji kekerasan Vickers dan ujian
ketumpatan. Untuk projek ini, serat kaca adalah digunakan sebagai serat kering dan
resin epoksi digunakan sebagai bahan matriks. Dalam projek ini, proses lapisan
menggunakan tangan ini digunakan untuk membuat laminasi komposit. Spesimen
dibahagikan kepada empat kategori utama dengan peratusan kandungan berat serat dan
matriks yang berbeza iaitu 30% matriks 70% serat, 40% matriks 60% serat, 50%
matriks 50% serat dan terakhir, 60% matrik 40% serat. Dari pengamatan pengedaran
matriks, untuk kategori E1 (30% serat 70% matriks), dapat dilihat bahawa semua daerah
serat tidak sepenuhnya diedarkan dengan bahan matriks kerana kandungan matriks
kurang. Untuk E4 kategori (60% serat 40% matriks), dapat dilihat bahawa kandungan
matriks boleh diedarkan ke daerah seluruh serat tetapi perlu lebih banyak masa untuk
mengeringkannya. Selain itu, keputusan Ujian Fizikal menunjukkan bahawa kepadatan
komposit laminasi meningkat apabila jumlah matriks meningkat. Selain itu, dari Ujian
Mekanikal menunjukkan bahawa kekuatan tarik komposit laminasi meningkat apabila
jumlah matriks meningkat. Sebagai hasilnya, modulus elastisitas juga meningkat. Dari
lengkungan regangan-pemanjangan menunjukkan sifat kerapuhan komposit laminasi.
E4 memiliki kekuatan tarik dan modulus elastisitas tertinggi sementara E1 memiliki
kekuatan tarik dan modulus elastisitas terendah. Selain itu, E4 memiliki angka
kekerasan tertinggi diantara yang lain. Dapat disimpulkan bahawa, sifat-sifat Polimer
Komposit Matriks sangat bergantung pada edaran matriks.
viii
TABLE OF CONTENT
CHAPTER 1 INTRODUCTION
1.1 Introduction 1
1.2 Problem Statement 2
1.3 Objective 2
1.4 Work Scopes 2
CHAPTER 2 LITERATURE REVIEW
2.1 Introduction 3
2.2 Composite 3
2.3 History of Composite Material 4
2.4 Application of Composite Materials
2.4.1 Structural Application
2.4.2 Aerospace Industry
2.4.3 Civil/Construction Industry
2.4.4 Process Industry
2.4.5 Automotive Industry
2.4.6 Other Application
5
5
6
6
7
7
8
2.5 Classification of Composite Material 8
Page
SUPERVISOR’S DECLARATION ii
STUDENT’S DECLARATION iii
DEDICATION iv
ACKNOWLEDGEMENTS v
ABSTRACT vi
ABSTRAK vii
TABLE OF CONTENTS viii
LIST OF TABLES xii
LIST OF FIGURES xiii
LIST OF SYMBOLS xv
LIST OF ABBREVIATIONS xvi
ix
2.5.1 Matrix Phase
2.5.1.1 Polymer Matrix Composite (PMC)
2.5.1.2 Metal Matrix Composite (MMC)
2.5.1.3 Ceramic Matrix Composite (CMC)
9
9
9
10
2.6 Matrix Materials 11
2.6.1 Function of Matrix 11
2.7 Properties of Matrix 12
2.8 General Type of Matrix Material 13
2.8.1 Thermoplastic
2.8.2 Thermosets
13
14
2.9 Epoxy Resins 15
2.10 Types of Fiber 15
2.11 Glass Fiber 16
2.12 Fiber Glass Form 17
2.12.1 Chopped Strand Mat (CSM)
2.12.2 Unidirectional Fabric
2.12.3 Woven Roving
17
18
18
2.13 Properties of Fiber Reinforced Polymers 19
2.14 Properties Testing of PMC 19
2.14.1 Tensile Test
2.14.1.1 Brittle Material
20
21
2.14.2 Hardness Test
2.14.2.1 Hardness Measurement Methods
2.14.2.2 Vickers Hardness Test
2.14.2.3 Relation of Hardness to Other Material
Properties
23
23
23
25
2.14.3 Density Test 26
CHAPTER 3 METHODOLOGY
3.1 Introduction 27
3.2 Fabrication Process of Composite Laminate
27
x
3.2.1 Raw Material
3.2.2 Process of Fabrication
3.2.3 Composition of Matrix and Fiber
27
28
28
3.3 Composite Laminate Testing
3.3.1 Samples Preparation
3.3.2 Density Test
3.3.3 Tensile Test
3.3.4 Hardness Test
30
30
31
32
33
CHAPTER 4 RESULT AND DISCUSSION
4.1 Introduction 37
4.2 Observation on Matrix Distribution 37
4.3 Physical Testing 41
4.4 Mechanical Testing
4.4.1 Tensile Test
4.4.2 Samples Inspection
4.4.3 Hardness
45
45
53
55
CHAPTER 5 CONCLUSION
5.1 Introduction 57
5.2 Conclusion 57
5.3 Recommendation 58
REFERENCES
References
59
APPENDICES
Appendix A Gantt Chart 62
Appendix B Sample of Calculation 65
Appendix C Classification Based on Matrix Types 67
Appendix D Properties of Selected Fiber and Matrix 68

xi
Appendix E Performance of Typical Unidirectional Composite 70
Appendix F Property of Tensile Test Graphs and Figures 72
Appendix G Hardness Table 76
Appendix H Failure Mode 78
Appendix I Stress-Strain Curve 81
xii
LIST OF TABLES
Table No. Title Page
3.1
Composition of composite laminates 28
3.2
Weight of matrix and fiber composition in composite laminates 29
3.3
Tensile Test’s samples 31
4.1
Density table test for E1 42
4.2
Density table test for E2 42
4.3
Density table test for E3 43
4.4
Density table test for E4 43
4.5
Average density 44
4.6
Dimension of Tensile Test samples 45
4.7
Tensile Test result for E1 47
4.8
Tensile Test result for E1 48
4.9
Tensile Test result for E1 49
4.10
Tensile Test result for E1 50
4.11
Summary of Tensile Test result for each category 51
4.12
Modulus of Elasticity 51
4.13
Failure mode for each sample 54
4.14 Hardness Test’s result for composite laminates 56
xiii
LIST OF FIGURES
Figure No.
Title Page
2.1
Molecule structure of epoxy resins 15
2.2
Chop strand mat fiberglass 17
2.3
Unidirectional fabric 18
2.4
Woven roving fiberglass 19
2.5
Typical engineering stress-strain curve 21
2.6
Typical Stress-Strain curve for brittle material 22
2.7
Hardness & Tensile Strength 25
3.1(a)
Composite laminate of E1 29
3.1(b)
Composite laminate of E2 29
3.1(c)
Composite laminate of E3 29
3.1(d)
Composite laminate of E4 29
3.2
T-Jaw Machine 30
3.3
Universal Testing Machine 3639 INSTRON 32
3.4(a)
Tensile Test samples for E1 33
3.4(b)
Tensile Test samples for E2 33
3.4(c)
Tensile Test samples for E3 33
3.4(d)
Tensile Test samples for E4 33
3.5(a)
Hardness Test samples for E1 34
3.5(b)
Hardness Test samples for E2 34
3.5(c)
Hardness Test samples for E3 34
3.5(d) Hardness Test samples for E4 34
3.6
Vickers Hardness Tester
35
xiv
3.7
Process flow for experimental process 36
4.1
Matrix Distribution for E1 38
4.2
Matrix Distribution for E2 39
4.3
Matrix Distribution for E3 40
4.4
Matrix Distribution for E4 40
4.5
Graph of density for composite laminate 44
4.6
E1 Stress-Strain Curve 47
4.7
E2 Stress-Strain Curve. 48
4.8
E3 Stress-Strain Curve. 49
4.9
E4 Stress-Strain Curve. 50
4.10
Graph of Modulus of Elasticity 52
4.11
E1 after failure 53
4.12
E2 after failure 53
4.13
E3 after failure 54
4.14
E4 after failure 54
4.15 Hardness of composite laminate 56

xv
LIST OF SYMBOLS
ρ Density
V Volume
m Mass
ε Stress
σ Strain
xvi
LIST OF ABBREVIATIONS
AAP Alumina−Aluminium Phosphate
Al Aluminium
ASTM American Society for Testing and Materials
BPO Benzoil Peroxide
CHP Cumene Hydroperoxide
CMC Ceramic Matrix Composite
CSM Chopped Strand Mat
Cu Copper
Fe Ferum
FRP Fiber Reinforced Plastic
GRP Glass Reinforced Plastic
MEKP Methyl Ethyl Ketone Peroxide
Mg Magnesium
MMC Metal Matrix Composite
PE Polyethylene
PMC Polymer Matrix Composite
PP Polypropylene
PVC Polyvinylchloride
CHAPTER 1
INTRODUCTION
1.1 INTRODUCTION
Nowadays, composite materials are the well known material that has been used
in manufacturing industry. The range of application is very large, from the aerospace to
the automotive industry, from household product to optical devices and many other
more application. Composite materials have just started to dominate the future
engineering reality of the twenty first century.
Composite material is one which is composed of at least two elements working
together to produce material properties that are different to the properties of those
elements on their own. The majority of composites are made up of a continuous phase
called a matrix in which a stronger phase consisting of fibers or particles is embedded.
Fundamentally, fibers or particles distributed through a matrix to enhance the properties
of the matrix in some way.
Polymer matrix composites (PMC) first emerged as a distinct technology in an
era when improved performance for advanced military systems provided a primary
motivation for materials development.
Laminated polymer matrix composites are nowadays widely used in structural
applications. Their most important properties are clearly the high longitudinal modulus
and tensile strength, which result from outstanding fiber properties. In fact, the most
common multidirectional laminates can usually sustain increasing loads after extensive
transverse cracking in various plies, but fiber fracture generally causes overall failure.
2
The important aim of this project is to know the influence of matrix distribution
to the properties of PMC. The properties such as stress, strain, density and hardness,
play an important role in producing the good and best quality of PMC. It is therefore
important in term of scientific and practical point of view, to understand the effect of
fiber and matrix material (resin) to the composite.
1.2 PROBLEM STATEMENT
Hand layup process in fabricating Polymer Matrix Composite (PMC) does not
provide even distribution of matrix polymer to the substrate. Different area of PMC will
exhibit different result primarily in terms of mechanical properties. Many studies
regarding to the contribution of reinforcement to the composite material has been
revealed but the study on the effect of matrix is rarely discovered. Thus, this study will
investigate the effects of matrix polymer in the polymer matrix composite. Hence, the
concept or theory of composite, polymer matrix composite, fibers, matrix materials and
other related topic to this project need to be study.
1.3 OBJECTIVE
This is the objective that must be completed and achieve throughout this project
and study:
(i) To investigate the influence of matrix distribution to the mechanical and
physical properties of polymer matrix composite.
1.4 WORK SCOPE
This project was purpose to make samples of fibreglass composite laminate with
different weight content that has been translate to the percentage or ratio of fiber and
matrix material. In this project, E-glass woven roving is used as fiber and epoxy as the
matrix material. Next, some tests were conducted to investigate the effect of matrix
distribution to the properties, mechanical and also physical of the composite.
CHAPTER 2
LITERATURE REVIEW
2.1 INTRODUCTION
The purpose of this chapter is to provide a review of past research efforts,
readings, references from books related to composites, polymer matrix composites
(PMC), properties of PMC, the testing on PMC and other matters that related to the
study to enhance knowledge and understanding the concept or theory before go further
for the next chapter in completing this project
2.2 COMPOSITE
Composite material is a material composed of two or more distinct phases and
having bulk properties significantly different from those of any of the constituents.
Many of common materials such as metals, alloys, doped ceramics and polymers mixed
with additives also have a small amount of dispersed phases in their structures.
However they are not considered as composite materials since their properties are
similar to those of their base constituents, physical property of steel are similar to those
of pure iron. Favourable properties of composites materials are high stiffness and high
strength, low density, high temperature stability, high electrical and thermal
conductivity, adjustable coefficient of thermal expansion, corrosion resistance and
improved wear resistance. (Sudipt Kumar, 2008)
4
The essence of the concept of composites is the bulk phase accepts the load over
a large surface area, and transfers it to the reinforcement, which being stiffer, increases
the strength of the composite. The significance here lies in that there are numerous
matrix materials and as many fiber types, which can be combined in countless ways to
produce just the desired properties.
Most research in engineered composite materials has been done since 1965.
Today, given the most efficient design, of say an aerospace structure, a boat or a motor,
we can make a composite material that meets or exceeds the performance requirements.
Most of the savings are in weight and cost. These are measured in terms of ratios such
as stiffness/weight and strength/weight.
2.3 HISTORY OF COMPOSITE MATERIAL
Although the concept of fiber reinforced materials can be traced back to the use
of straw as reinforcement in bricks manufactured by the Israelites in 800 B.C., and in
more recent times to the use of short glass fiber reinforcement in cement in the United
States in the early 1930's, fiber reinforced resin matrix materials or nowadays known as
fiber reinforced composites were not developed until the early 1940's.
After World War II, US manufacturers began producing fiberglass and polyester
resin composite boat hulls and radar cover. The automotive industry first introduced
composites into vehicle bodies in the early 1950s. Because of the highly desirable light
weight, corrosion resistance, and high strength characteristics in composites; research
emphasis went into improving the material science and manufacturing process. That
effort led to the development of two new manufacturing techniques known as filament
winding and pultrusion, which helped advance the composite technology into new
markets. There was a great demand by the recreation industry for composite fishing
rods, tennis rackets, ski equipment and golf clubs. The aerospace industry began to use
composites in pressure vessels, containers, and non-structural aircraft components. The
US Navy applied composites in mine sweeping vessels, crew boats and submarine parts.
The domestic consumers began installing composite bath tubs, covers, railings, ladders
5
and electrical equipment. The first civil application in composites was a dome structure
built in Benghazi in 1968, and other structures followed slowly.
With the increasing demand for composites, new and improved manufacturing
processes such as pultrusion, resin transfer molding, and filament winding were
developed and implemented in the early 1990s. With these enhancements in place, the
current focus is to rebuild the US transportation infrastructure using FRP composites for
maintenance and rehabilitation of existing bridges as well as new construction.
(Benjamin Tang, 1997)
2.4 APPLICATION OF COMPOSITE MATERIALS
Fiber reinforced composite materials have many advantages over traditional
construction materials. The use of Fiber Reinforced Polymer (FRP) composite
structures is growing very rapidly around the world. The need of light weight structural
elements with high stiffness for industrial applications increase the demand for
construction technology made of composite materials. Fiber Reinforced Polymers
(FRP) is system comprising of carbon, glass and aramid fibres in an epoxy matrix. The
system is currently gaining popularity in application for structural strengthening, which
includes seismic retrofit, pipe rehabilitation, blast mitigation and environmental
protection.
2.4.1 Structural Application
Structural applications refer to applications that require mechanical
performances for example, strength stiffness and vibration damping ability in the
material which may or not may bear in load in the structure. In cases where the material
bears the load, the mechanical properties requirements are particularly stringent.
6
2.4.2 Aerospace Industry
Emergence of strong and stiff reinforcements like carbon fibre along with
advances in polymer research to produce high performance resins as matrix materials
have helped meet the challenges posed by the complex designs of modern aircraft. The
large scale use of advanced composites in current programmes of development of
military fighter aircraft, small and big civil transport aircraft, helicopters, satellites,
launch vehicles and missiles all around the world is perhaps the most glowing example
of the utilization of potential of such composite materials. The use of composites has
been motivated largely by such considerations. The composites offer several of these
features as given below (Hoa, 2007):
(i) Light-weight due to high specific strength and stiffness
(ii) Fatigue-resistance and corrosion resistance
(iii) Capability of high degree of optimization: tailoring the directional
strength and stiffness
(iv) Capability to mould large complex shapes in small cycle time reducing
part count and assembly times: Good for thin-walled or generously
curved construction
(v) Capability to maintain dimensional and alignment stability in space
environment
(vi) Possibility of low dielectric loss in radar transparency
(vii) Possibility of achieving low radar cross-section
2.4.3 Civil/Construction Industry
Bridge deck is among the most deteriorated elements in bridge structure. There
may be a need to increase load rating, traffic lanes, or to conform to a new code.
Therefore, FRP composite bridge deck has been introduced as a new solution into
bridge engineering community. It offers easy installation, lightweight, and potential
resistance against environmental and chemical damages.
7
FRP can also be used in cable-stayed bridges, suspension bridges, and post-
tensioning. In reinforced concrete beam, the function of concrete below neutral axis is
mainly to position reinforcing steels and to protect them from corrosion. However,
concrete has little tensile strength compared to steel. So concrete hairline cracking is
common in reinforced members, resulting in environmental attack of reinforcing steels.
So there have been studies on a composite system that has concrete in the compressive
portion of beam and FRP sheet below neutral axis. (Bank, 2006)
2.4.4 Process Industry
When metals are severe for chemical resistance, maintenance FRP composite
can replace the need for different pressure vessels and tanks in process industry. Inspite
of accurate calculation for overturning in severe wind, the use of FRP composites
decrease the foundation weight which can take into consideration for the soil with less
bearing capacity. Any size and shape of pipe, duct, fittings or other accessories in
process industry can be made through FRP. Major uses of FRP for process industries
lies in:
(i) FRP Tanks and Process Vessels
(ii) Fiber glass Pipe and Duct
(iii) Fiberglass dampers.
2.4.5 Automotive Industry
Fiber reinforced polymer profiles have been used successfully for over 20 years.
Automotive applications include vehicular body components. Seeking a cost-effective
substitute for the steel end gate assembly on its S-10 pickup truck, General Motors
entered into a joint venture with Creative Pultrusions, Inc. and developed a pultruded
part that is stronger than its steel predecessor, offering a 30% weight reduction, and a
90% investment reduction. The development of a Class a substrate finish yields a
composite with a smoother surface finish than previously obtainable. The surface
readily accepts primer, has no "bleed-thru" of the underlying reinforcements, and has
virtually zero surface porosity.
8
The compartment body of this fire truck is free from corrosion, electrolysis, and
cracking, offering a best buy alternative to metal bodied trucks. Molded support ribs,
offsets for recessed doors, built-in ducts for ventilation and wire harness, plus
interlocking ribs, provide fabrication advantages over metal bodies. Pultrusion was
selected because it offers:
(i) Easier assembly compared to steel.
(ii) Better cosmetic appearance.
(iii) Improve product quality.
(iv) High strength and corrosion resistance.
2.4.6 Other Applications
Carbon fiber-reinforced polymer has found a lot of use in high-end sport
equipment such as racing bicycles. For the same strength, a carbon-fiber frame weighs
less than bicycle tubing of aluminium or steel. The choice of weave can be carefully
selected to maximize stiffness. The variety of shapes it can be built into has further
increased stiffness and also allowed aerodynamic consideration into tube profiles.
Carbon reinforced polymer frames, forks, handlebars, seat posts, and crank arms are
becoming more common on medium and higher priced bicycles. Carbon fiber-
reinforced polymer forks are used on most new racing bicycles. Other sporting goods
applications include rackets, fishing rods, long boards and rowing shells.
2.5 CLASSIFICATION OF COMPOSITE MATERIALS
Most commonly, composite materials have a bulk phase, which is continuous,
called the matrix, and one dispersed, non-continuous, phase called the reinforcement,
which is usually harder and stronger.
9
2.5.1 Matrix Phase
The primary phase, having a continuous character, is called matrix. Matrix is
usually more ductile and less hard phase. It holds the dispersed phase and shares a load
with it. Briefly about matrix phase:
(i) The primary phase, having a continuous character.
(ii) Usually more ductile and less hard phase.
(iii) Holds the reinforcing phase and shares a load with it.
There have 3 common types of matrix phase which are:
(i) Polymer Matrix Composite (PMC)
(ii) Metal Matrix Composite (MMC)
(iii) Ceramic Matrix Composite (CCM)
2.5.1.1 Polymer Matrix Composite (PMC)
Polymer Matrix Composite (PMC) is the material consisting of a polymer matrix
combined with a fibrous reinforcing dispersed phase. Polymer Matrix Composites are
very popular due to their low cost and simple fabrication methods.
Reinforcement of polymers by strong fibrous network permits fabrication of
PMC characterized by the following properties:
(i) High tensile strength.
(ii) High stiffness.
(iii) High Fracture Toughness.
(iv) Good abrasion resistance.
(v) Good puncture resistance.
(vi) Good corrosion resistance.
(vii) Low cost.
10
Polymer Matrix Composites (PMC) are used for manufacturing secondary load
bearing aerospace structures, boat bodies, canoes, kayaks, automotive parts, radio
controlled vehicles, sport goods such as golf clubs, skis, tennis racquets and fishing
rods, also bullet-proof vests and other armor parts, brake and clutch linings. (John
Wiley & Sons, 2002)
2.5.1.2 Metal Matrix Composite (MMC)
Metal Matrix Composites are composed of a metallic matrix (Al, Mg, Fe,Cu)
and a dispersed ceramic (oxide, carbides) or metallic phase. MMCs are used for space
shuttle, commercial airliners, electronic substrates, bicycles, automobiles, golf clubs and
a variety of other applications. From a material point of view, when compared to
polymer matrix composites, the advantages of MMCs lie in their retention of strength
and stiffness at elevated temperature, good abrasion and creep resistance properties.
Most MMCs are still in the development stage or the early stages of production and are
not so widely established as polymer matrix composites. The biggest disadvantages of
MMCs are their high costs of fabrication, which has placed limitations on their actual
applications. There are also advantages in some of the physical attributes of MMCs
such as no significant moisture absorption properties, non-inflammability, low electrical
and thermal conductivities and resistance to most radiations. (John Wiley & Sons, 2002)
2.5.1.3 Ceramic Matrix Composite (CMC)
Ceramic matrix composites (CMCs) combine reinforcing ceramic phases with a
ceramic matrix to create materials with new and superior properties. In ceramic matrix
composites, the primary goal of the ceramic reinforcement is to provide toughness to an
otherwise brittle ceramic matrix. Fillers can also be added to the ceramic matrix during
processing to enhance characteristics such as electrical conductivity, thermal
conductivity, thermal expansion, and hardness. The desirable characteristics of CMCs
include high-temperature stability, high thermal shock resistance, high hardness, high
corrosion resistance, light weight, nonmagnetic and nonconductive properties, and
versatility in providing unique engineering solutions. The combination of these
11
characteristics makes ceramic matrix composites attractive alternatives to traditional
processing industrial materials such as high alloy steels and refractory metals. For the
processing industry, related benefits of using ceramic composites include increased
energy efficiency, increased productivity, and regulatory compliance. (John Wiley &
Sons, 2002)
2.6 MATRIX MATERIALS
Although it is undoubtedly true that the high strength of composites is largely
due to the fiber reinforcement, the importance of matrix material cannot be
underestimated as it provides support for the fibers and assists the fibers in carrying the
loads. It also provides stability to the composite material. Resin matrix system acts as a
binding agent in a structural component in which the fibers are embedded. When too
much resin is used, the part is classified as resin rich. On the other hand if there is too
little resin, the part is called resin starved. A resin rich part is more susceptible to
cracking due to lack of fiber support, whereas a resin starved part is weaker because of
void areas and the fact that fibers are not held together and they are not well supported.
2.6.1 Function of Matrix
In a composite material, the matrix material serves the following functions:
(i) Holds the fibers together.
(ii) Protects the fibers from environment.
(iii) Distribute the loads evenly between fibers so that all fibers are subjected
to the same amount of strain
(iv) Enhances transverse properties of a laminate.
(v) Improves impact and fracture resistance of a component.
(vi) Helps to avoid propagation of crack growth through the fibers by
providing alternate failure path along the interface between the fibers and
matrix.
(vii) Carry interlaminar shear.
12
The matrix plays a minor role in the tensile load-carrying capacity of a
composite structure. However, selection of a matrix has a major influence on the
interlaminar shear as well as in-plane shear properties of the composite material. The
interlaminar shear strength is an important design consideration for structures under
bending loads, whereas the in-plane shear strength is important under torsion loads. The
matrix provides lateral support against the possibility of fibre buckling under
compression loading, thus influencing to some extent the compressive strength of the
composite material. The interaction between fibres and matrix is also important in
designing damage tolerant structures. Finally, the processability and defects in a
composite material depend strongly on the physical and thermal characteristics, such as
viscosity, melting point, and curing temperature of the matrix.
2.7 PROPERTIES OF MATRIX
The needs or desired properties of the matrix which are important for a
composite structure are as follows:
(i) Reduced moisture absorption.
(ii) Low shrinkage.
(iii) Low coefficient of thermal expansion.
(iv) Good flow characteristics so that it penetrates the fiber bundles
completely and eliminates voids during the compacting/curing process.
(v) Reasonable strength, modulus and elongation (elongation should be
greater than fiber).
(vi) Must be elastic to transfer load to fibers.
(vii) Strength at elevated temperature (depending on application).
(viii) Low temperature capability (depending on application).
(ix) Excellent chemical resistance (depending on application).
(x) Should be easily processable into the final composite shape.
(xi) Dimensional stability (maintains its shape).
13
As stated above, the matrix causes the stress to be distributed more evenly
between all fibers by causing the fibers to suffer the same strain. The stress is
transmitted by shear process, which requires good bonding between fiber and matrix
and also high shear strength and modulus for the matrix itself.
Some of the physical properties of the matrix which influence the behavior of
composites are:
(i) Shrinkage during cure.
(ii) Modulus of elasticity.
(iii) Ultimate elongation,
(iv) Strength (tensile, compressive and shear).
(v) Fracture toughness.
2.8 GENERAL TYPES OF MATRIX MATERIAL
The most common types of matrix material used in industry are thermoset and
thermoplastic. They have their own advantages and features.
2.8.1 Thermoplastic
Thermoplastic composites are comparable to thermoset composites in the sense
that they have the same fibre reinforcements such as carbon, aramid or glass fiber
fabrics or unidirectional tapes. The difference is the matrix material which holds the
fibers together. Thermoplastic matrices such as polyether imide (PEI), polyether ether
ketone (PEEK), and polyphenylene sulfide (PPS) can be melted and formed repeatedly,
offering new possibilities in the field of manufacture and design.
Thermoplastic pre-impregnated material or prepreg, is used for certain
processes. However, more often than not, a semi-finished sheet made from different
layers of prepreg is used as the basic material for a component. Individual prepreg
layers are stacked on top of each other and consolidated at high temperature and
14
pressure in a large platen press. At present most of the products in series production are
of the reinforced PEI range due to the attractive price/performance ratio of these
materials. In the near future, a shift towards semicrystalline materials such as PPS is
envisaged in order to provide improved chemical resistance for a number of aerospace
applications.
Thermoplastics have a number of advantages over other materials. Among these
are improved toughness, excellent fire resistance and recyclability. However, the
primary reason for the use of thermoplastics is cost-effective processing. (Arnt, 1996)
2.8.2 Thermosets
Polyesters, epoxy and other resins in liquid form contain monomers, which
convert into polymers when the resin is cured. The resulting solid .is called thermosets,
which is tough, hard, insoluble and infusible. The property of infusibility distinguishes
thermosets from the thermoplastics. Cure and polymerization refer to the chemical
reactions that solidify the resin. Curing is accomplished by heat, pressure and by
addition of curing agents at room temperature.
All polymers can be divided into major groups based on their thermal processing
behavior. Those polymers that can be heat-softened in order to process into a desired
form are called thermoplastics. Waste thermoplastics can be recovered and refabricated
by application of heat and pressure. Polystyrene is an important example of a
commercial thermoplastic. In comparison, thermosets are polymers whose individual
chain have been chemically linked by covalent bonds during polymerization or by
subsequent chemical or thermal treatment during fabrication. Once formed, these
crosslinked networks resist heat softening, creep, and solvent attack, but cannot be
thermally processed. Such properties make thermosets suitable material for composites,
coating, and adhesive applications. Principal examples of thermosets include epoxy,
phenol-formaldehyde resin, and unsaturated polyesters (Fried, 1995).
15
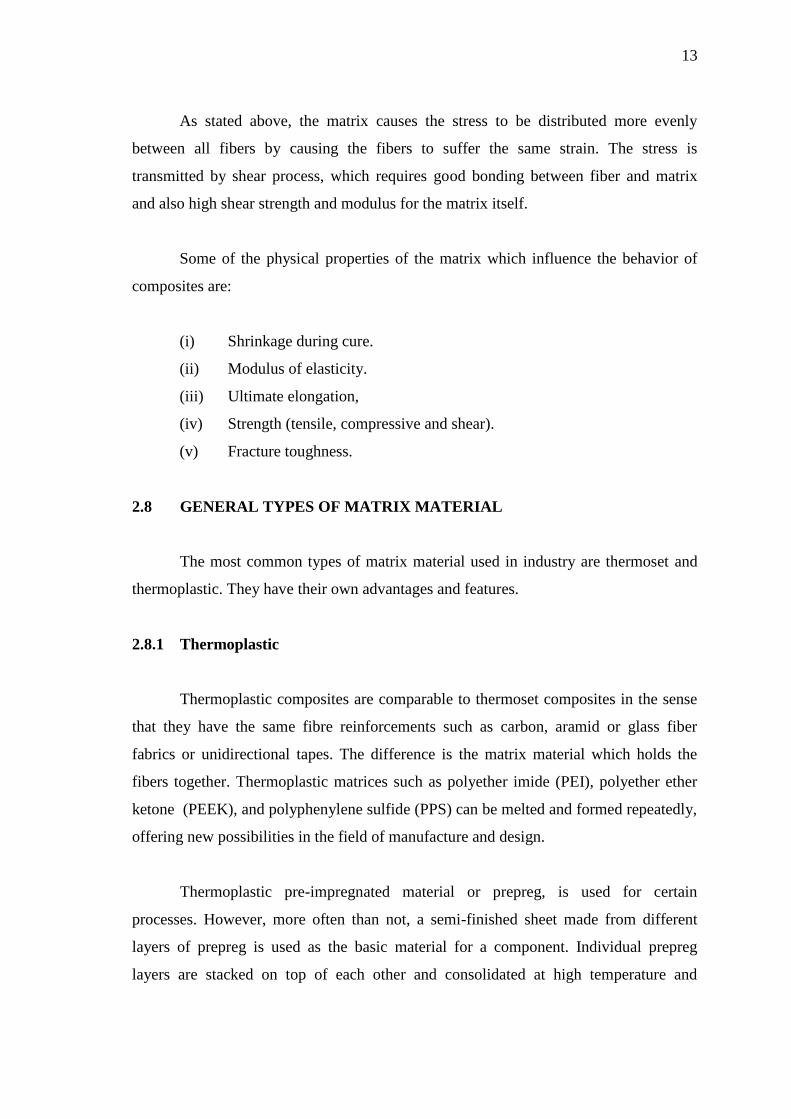
2.9 EPOXY RESINS
Epoxy resins are polymer-forming system containing two principle components
that interact to produce highly cross-linked products with exceptional toughness,
adhesion, and chemical resistance. The key player in the polymerization is epoxy
functionality a strained, three-member ring consisting of one oxygen and two carbon
atoms. This is also known as an oxirane group. (Schechter et al.1956)
Figure 2.1: Molecule structure of epoxy resins
EPs are considered to constitute one of the most important classes of
thermosetting polymers, which have been used extensively as high performance
adhesive composite materials, due to their outstanding mechanical and thermal
properties such as high modulus, and tensile strength, low creep, high glass transition
temperature, high thermal stability, and moisture resistance (May and Tanaka, 1973). In
the cured state EPs are brittle materials that have fracture energies some two orders of
magnitude lower than modern thermoplastics and other high performance materials
(Rezaiferd et al. 1993). To retain their position as materials of choice for many
applications of adhesives and composite matrixes, epoxies should be modified to
improve their properties such as fracture toughness.
2.10 TYPES OF FIBERS
Organic and inorganic fibers are used to reinforce composite materials. Almost
all organic fibers have low density, flexibility, and elasticity. Inorganic fibers are of
high modulus, high thermal stability and possess greater rigidity than organic fibers and
16
notwithstanding the diverse advantages of organic fibers which render the composites in
which they are used. Mainly, the following different types of fibers namely, glass fibers,
silicon carbide fibers, high silica and quartz fibers, aluminina fibers, metal fibers and
wires, graphite fibers, boron fibers, aramid fibers and multiphase fibers are used.
Among the glass fibers, it is again classified into E-glass, A-glass, R-glass etc. There is
a greater marker and higher degree of commercial movement of organic fibers. The
potential of fibers of graphite, silica carbide and boron are also exercising the scientific
mind due to their applications in advanced composites. (Frederick, 2001)
2.11 GLASS FIBER
Over 95% of the fibers used in reinforced plastics are glass fibers, as they are
inexpensive, easy to manufacture and possess high strength and stiffness with respect to
the plastics with which they are reinforced. Their low density, resistance to chemicals,
insulation capacity are other bonus characteristics, although the one major disadvantage
in glass is that it is prone to break when subjected to high tensile stress for a long time.
However, it remains break-resistant at higher stress-levels in shorter time frames. This
property mitigates the effective strength of glass especially when glass is expected to
sustain loads for many months or years continuously.
Period of loading, temperature, moisture and other factors also dictate the
tolerance levels of glass fibers and the disadvantage is further compounded by the fact
that the brittleness of glass does not make room for prior warning before the
catamorphic failure. But all this can be easily overlooked in view of the fact the wide
range of glass fiber variety lend themselves amicably to fabrication processes like
matched die-moulding, filament winding lay-up and so on. Glass fibers are available in
the form of mates, tapes, cloth, continuous and chopped filaments, roving and yarns.
Addition of chemicals to silica sand while making glass yields different types of
glasses. (Frederick, 2001)
17
2.12 FIBER GLASS FORM
Two major form of fiber glass are continuous fiber and discontinuous fiber. Both
forms are made by same production method up to fiber drawing stage. As commercial
reinforcement, glass fibers are produced as chopped strand mat, woven roving, fabrics,
roving and yarns.
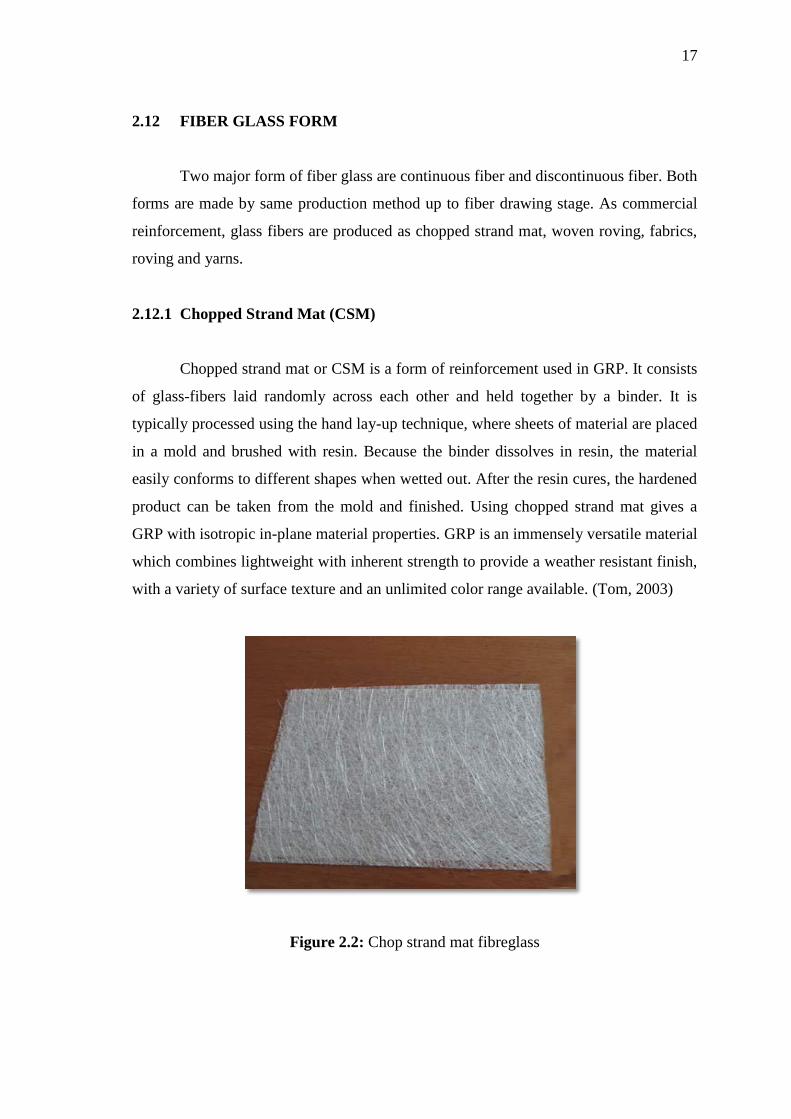
2.12.1 Chopped Strand Mat (CSM)
Chopped strand mat or CSM is a form of reinforcement used in GRP. It consists
of glass-fibers laid randomly across each other and held together by a binder. It is
typically processed using the hand lay-up technique, where sheets of material are placed
in a mold and brushed with resin. Because the binder dissolves in resin, the material
easily conforms to different shapes when wetted out. After the resin cures, the hardened
product can be taken from the mold and finished. Using chopped strand mat gives a
GRP with isotropic in-plane material properties. GRP is an immensely versatile material
which combines lightweight with inherent strength to provide a weather resistant finish,
with a variety of surface texture and an unlimited color range available. (Tom, 2003)
Figure 2.2: Chop strand mat fibreglass
18
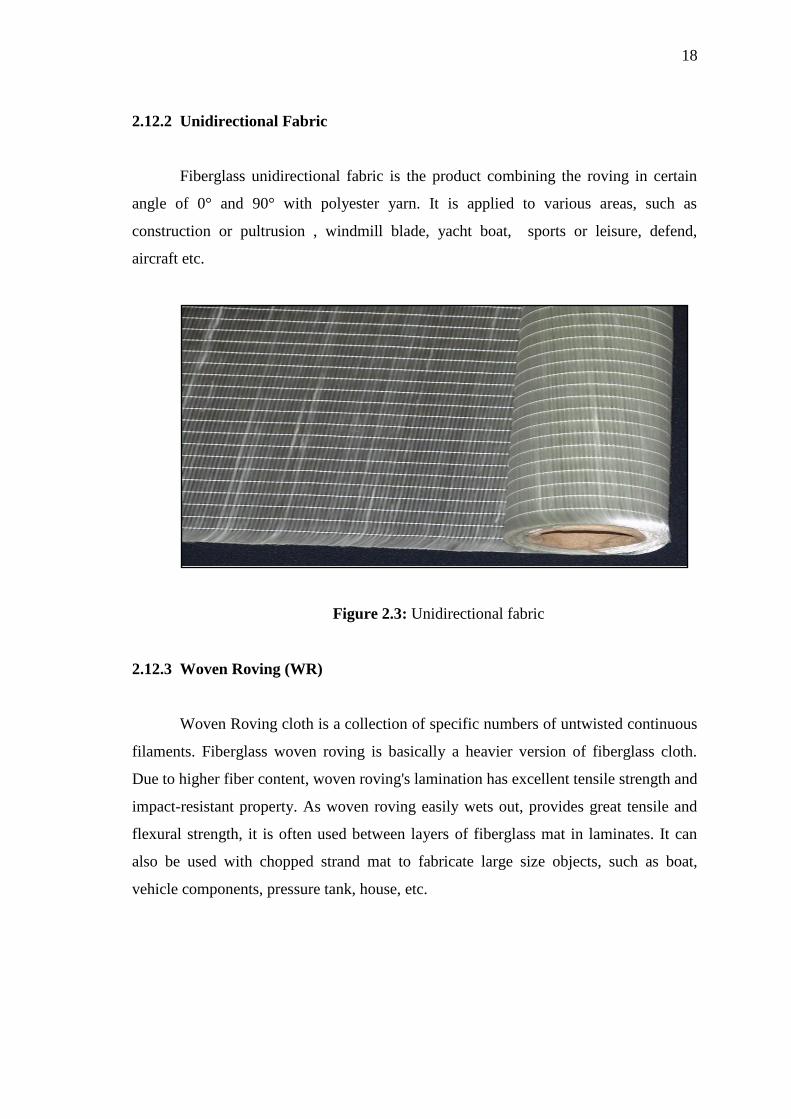
2.12.2 Unidirectional Fabric
Fiberglass unidirectional fabric is the product combining the roving in certain
angle of 0° and 90° with polyester yarn. It is applied to various areas, such as
construction or pultrusion , windmill blade, yacht boat, sports or leisure, defend,
aircraft etc.
Figure 2.3: Unidirectional fabric
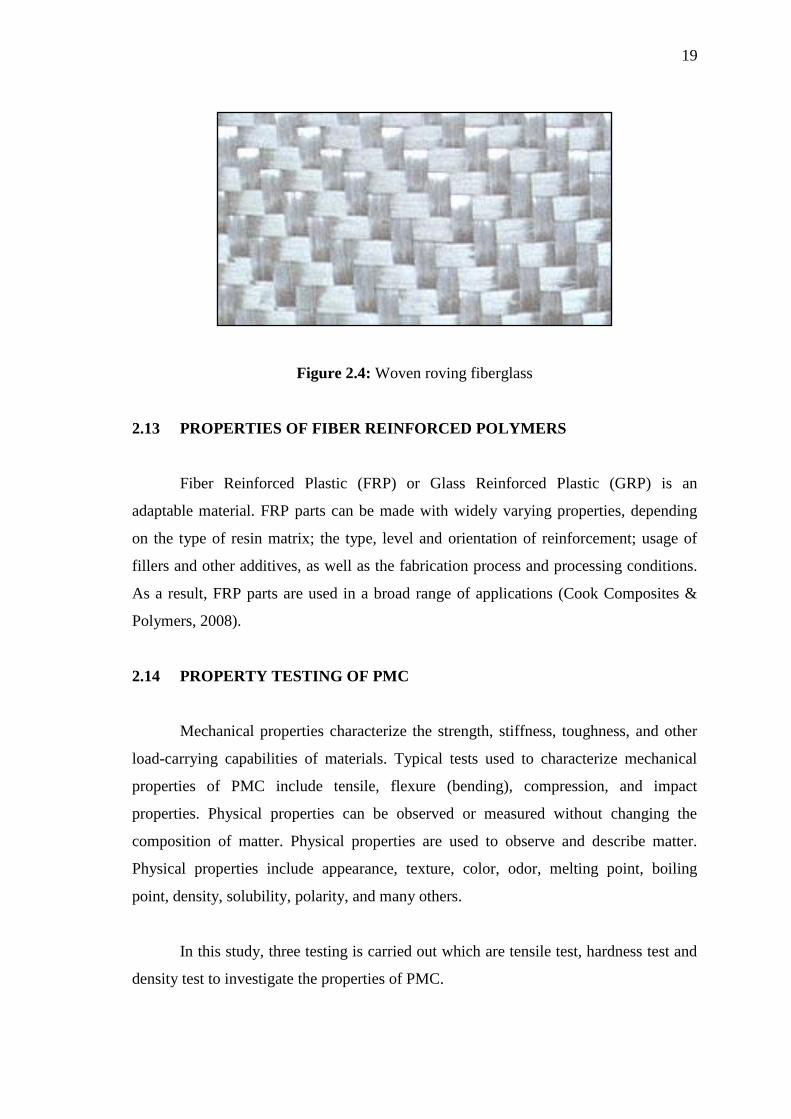
2.12.3 Woven Roving (WR)
Woven Roving cloth is a collection of specific numbers of untwisted continuous
filaments. Fiberglass woven roving is basically a heavier version of fiberglass cloth.
Due to higher fiber content, woven roving's lamination has excellent tensile strength and
impact-resistant property. As woven roving easily wets out, provides great tensile and
flexural strength, it is often used between layers of fiberglass mat in laminates. It can
also be used with chopped strand mat to fabricate large size objects, such as boat,
vehicle components, pressure tank, house, etc.
19
Figure 2.4: Woven roving fiberglass
2.13 PROPERTIES OF FIBER REINFORCED POLYMERS
Fiber Reinforced Plastic (FRP) or Glass Reinforced Plastic (GRP) is an
adaptable material. FRP parts can be made with widely varying properties, depending
on the type of resin matrix; the type, level and orientation of reinforcement; usage of
fillers and other additives, as well as the fabrication process and processing conditions.
As a result, FRP parts are used in a broad range of applications (Cook Composites &
Polymers, 2008).
2.14 PROPERTY TESTING OF PMC
Mechanical properties characterize the strength, stiffness, toughness, and other
load-carrying capabilities of materials. Typical tests used to characterize mechanical
properties of PMC include tensile, flexure (bending), compression, and impact
properties. Physical properties can be observed or measured without changing the
composition of matter. Physical properties are used to observe and describe matter.
Physical properties include appearance, texture, color, odor, melting point, boiling
point, density, solubility, polarity, and many others.
In this study, three testing is carried out which are tensile test, hardness test and
density test to investigate the properties of PMC.
20
2.14.1 Tensile Test
Tensile properties indicate how the material will react to forces being applied in
tension. A tensile test is a fundamental mechanical test where a carefully prepared
specimen is loaded in a very controlled manner while measuring the applied load and
the elongation of the specimen over some distance. Tensile tests are used to determine
the modulus of elasticity, elastic limit, elongation, proportional limit, reduction in area,
tensile strength, yield point, yield strength and other tensile properties.
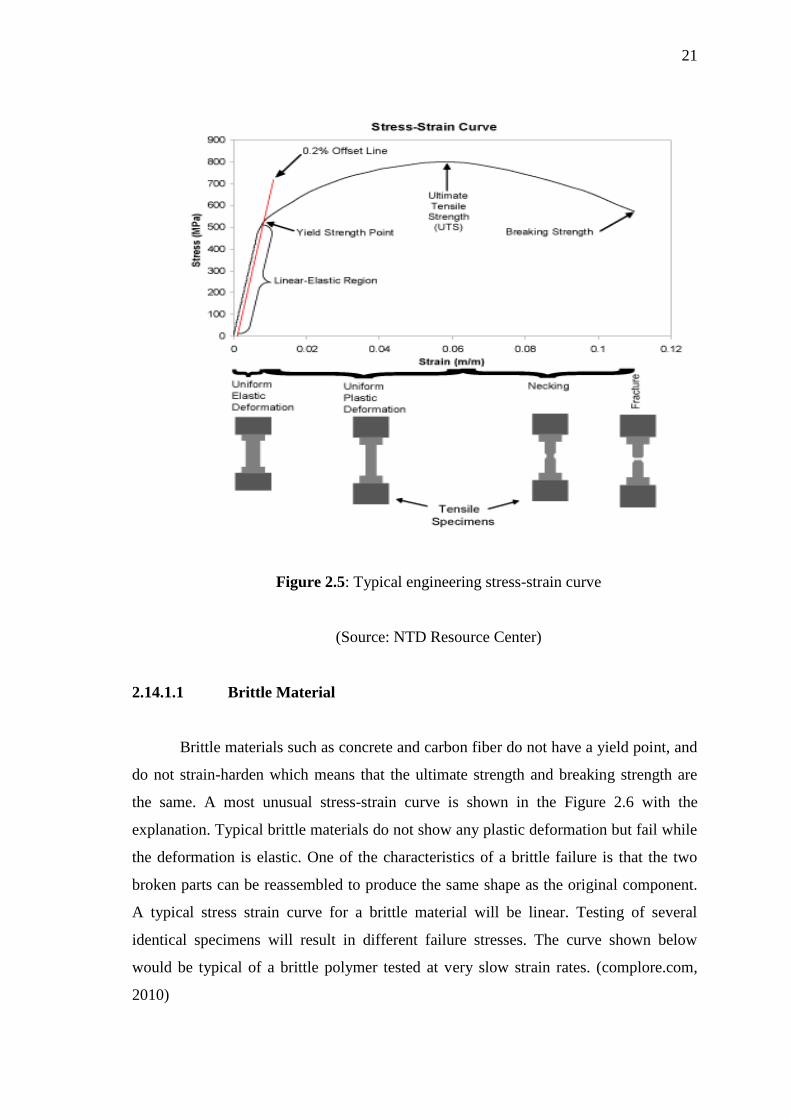
The main product of a tensile test is a load versus elongation curve which is then
converted into a stress versus strain curve. The stress-strain curve relates the applied
stress to the resulting strain and each material has its own unique stress-strain curve. A
typical engineering stress-strain curve is shown below. If the true stress, based on the
actual cross-sectional area of the specimen, is used, it is found that the stress-strain
curve increases continuously up to fracture.
The modulus of elasticity (E) defines the properties of a material as it undergoes
stress, deforms, and then returns to its original shape after the stress is removed. It is a
measure of the stiffness of a given material. To compute the modulus of elastic, simply
divide the stress by the strain in the material. Since strain is unitless, the modulus will
have the same units as the stress, such as kpi or MPa. The modulus of elasticity applies
specifically to the situation of a component being stretched with a tensile force.
The ultimate tensile strength (UTS) or, more simply, the tensile strength, is the
maximum engineering stress level reached in a tension test. The strength of a material is
its ability to withstand external forces without breaking. In brittle materials, the UTS
will at the end of the linear-elastic portion of the stress-strain curve or close to the
elastic limit. In ductile materials, the UTS will be well outside of the elastic portion into
the plastic portion of the stress-strain curve.
21
Figure 2.5: Typical engineering stress-strain curve
(Source: NTD Resource Center)
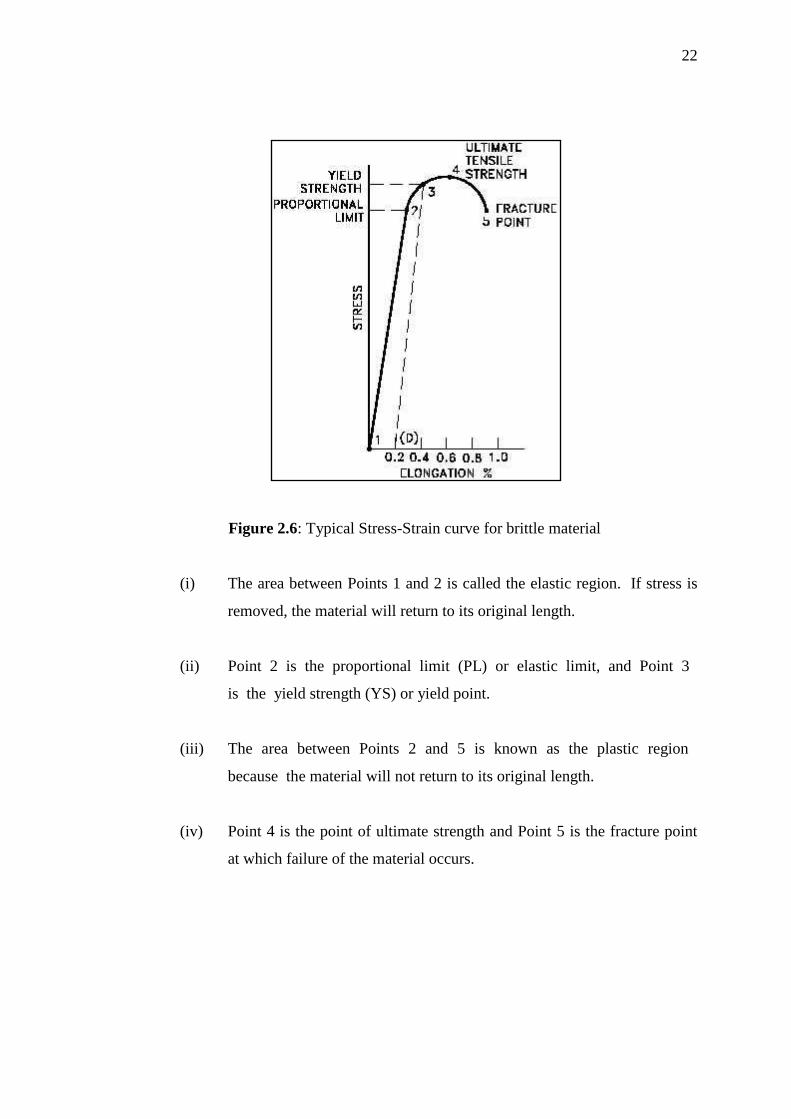
2.14.1.1 Brittle Material
Brittle materials such as concrete and carbon fiber do not have a yield point, and
do not strain-harden which means that the ultimate strength and breaking strength are
the same. A most unusual stress-strain curve is shown in the Figure 2.6 with the
explanation. Typical brittle materials do not show any plastic deformation but fail while
the deformation is elastic. One of the characteristics of a brittle failure is that the two
broken parts can be reassembled to produce the same shape as the original component.
A typical stress strain curve for a brittle material will be linear. Testing of several
identical specimens will result in different failure stresses. The curve shown below
would be typical of a brittle polymer tested at very slow strain rates. (complore.com,
2010)
22
Figure 2.6: Typical Stress-Strain curve for brittle material
(i) The area between Points 1 and 2 is called the elastic region. If stress is
removed, the material will return to its original length.
(ii) Point 2 is the proportional limit (PL) or elastic limit, and Point 3
is the yield strength (YS) or yield point.
(iii) The area between Points 2 and 5 is known as the plastic region
because the material will not return to its original length.
(iv) Point 4 is the point of ultimate strength and Point 5 is the fracture point
at which failure of the material occurs.
23
2.14.2 Hardness Test
In metallurgy hardness is defined as the ability of a material to resist plastic
deformation. The dictionary of Metallurgy defines the indentation hardness as the
resistance of a material to indentation. This is the usual type of hardness test, in which a
pointed or rounded indenter is pressed into a surface under a substantially static load.
2.14.2.1 Hardness Measurement Methods
The tests determine the depth which such a ball or cone will sink into the
material, under a given load, within a specific period of time. The followings are the
most common hardness test methods used in today`s technology:
(i) Rockwell hardness test
(ii) Brinell hardness
(iii) Vickers
(iv) Knoop hardness
(v) Shore
2.14.2.2 Vickers Hardness Test
Vickers hardness is a measure of the hardness of a material, calculated from the
size of an impression produced under a standard pressure for a standard length of time
by a pyramid-shaped diamond indenter. The diagonal of the resulting indention is
measured under a microscope and the Vickers Hardness value read from a conversion
Figure F1.1. The indenter employed in the Vickers test is a square-based pyramid whose
opposite sides meet at the apex at an angle of 136º. The diamond is pressed into the
surface of the material at loads ranging up to approximately 120 kilograms-force, and
the size of the impression (usually no more than 0.5 mm) is measured with the aid of a
calibrated microscope.
24
The Vickers number (HV) is calculated using the Eq (2.1):
HV = 1.854(F/D2) (2.1)
Where:
F = Applied load (kgf)
D2 = The area of the indentation (m2).
The applied load is usually specified when HV is cited.
The advantages of the Vickers hardness test are that extremely accurate readings
can be taken, and just one type of indenter is used for all types of metals and surface
treatments. Although thoroughly adaptable and very precise for testing the softest and
hardest of materials, under varying loads, the Vickers machine is a floor standing unit
that is rather more expensive than the Brinell or Rockwell machines. (CALCE and the
University of Maryland, 2010)
Here are some of strength and weaknesses of Vickers Hardness:
Strengths:
(i) One scale covers the entire hardness range.
(ii) A wide range of test forces to suit every application.
(iii) Nondestructive, sample can normally be used.
(iv) The advantages of the Vickers hardness test are that extremely accurate
readings can be taken.
(v) It is very precise for testing the softest and hardest of materials, under
varying loads
Weaknesses:
(i) The main drawback of the Vickers test is the need to optically measure
the indent size. This requires that the test point be highly finished to be
able to see the indent well enough to make an accurate measurement.
(ii) Slow. Testing can take 30 seconds not counting the sample preparation
time.
25
(iii) Vickers machine is a floor standing unit that is rather more expensive
than the Brinell or Rockwell machines (Indian Institute of Technology
Kanpur, 2007)
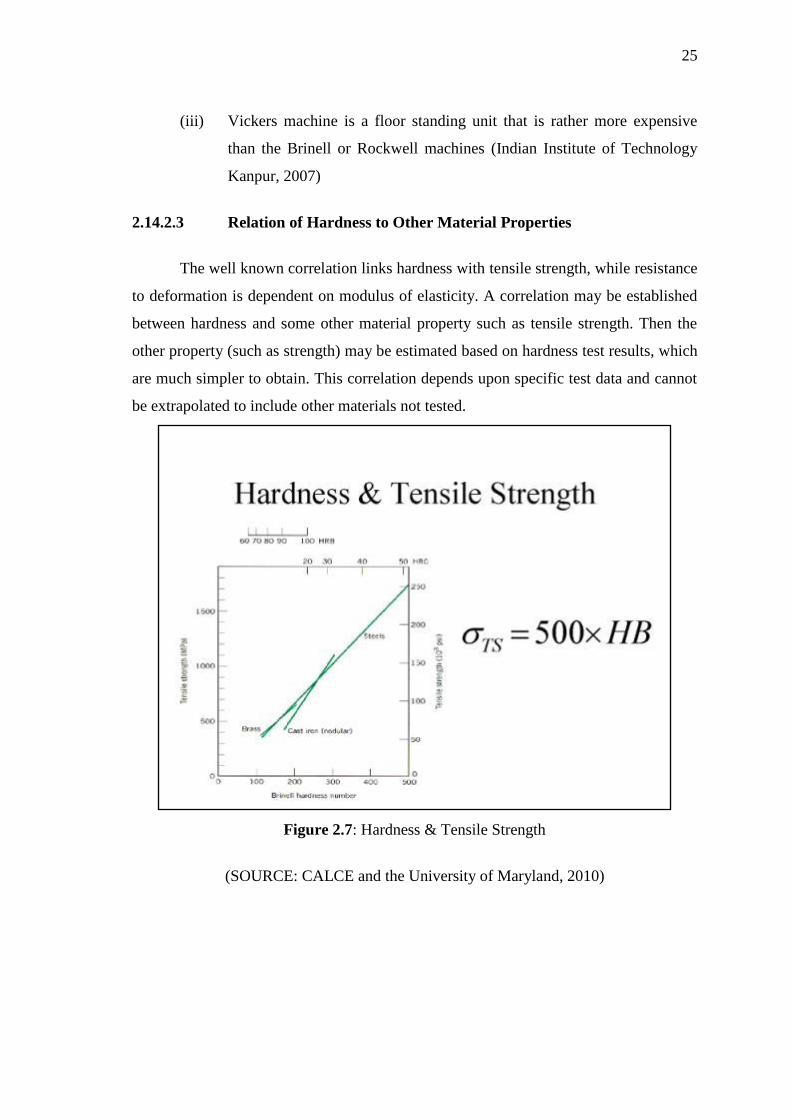
2.14.2.3 Relation of Hardness to Other Material Properties
The well known correlation links hardness with tensile strength, while resistance
to deformation is dependent on modulus of elasticity. A correlation may be established
between hardness and some other material property such as tensile strength. Then the
other property (such as strength) may be estimated based on hardness test results, which
are much simpler to obtain. This correlation depends upon specific test data and cannot
be extrapolated to include other materials not tested.
Figure 2.7: Hardness & Tensile Strength
(SOURCE: CALCE and the University of Maryland, 2010)

26
2.14.3 Density Test
In this study, the Archimedes principle is going to use to determine the density
of the polymer matrix composite.
The concept or the theory of this principle is, whenever a solid body is immersed
in a fluid, it displaces a volume of fluid equal to its own volume. Since the displaced
fluid was in equilibrium with the surrounding fluid before being displaced, meaning the
buoyant force on the displaced fluid was equal to its weight, an equal buoyant force will
be exerted on the solid body. In other words, for any solid body the buoyant force acting
on it is equal to the weight of the fluid displaced. This is true whether the fluid is a
liquid or a gas. The density of any object, usually abbreviated as ρ, is defined as the
ratio of an object’s mass to its volume.
CHAPTER 3
METHODOLOGY
3.1 INTRODUCTION
Methodology can properly refer to the theoretical analysis of the methods
appropriate to a field of study or to the body of methods and principles particular to a
branch of knowledge. It is a sort of management and project planning from the
beginning until the final stage of the project. Well planned methodology is important to
avoid delay or clash activities. Well organized procedure will satisfied the required
result in the end.
3.2 FABRICATION PROCESS OF COMPOSITE LAMINATE
The fabrication process of composite laminate process is done by applying the
hand layup process. Since this process related to chemical materials, therefore suitable
method, material and equipment to be used, must be selected wisely.
3.2.1 Raw Material
In this study, Woven Roving E- Glass was used as the dry fibers, with the
epoxy resin as the matrix materials. Release anti-adhesive agent is used to coat the base
(plastic plate) to prevent sticking of the composite laminate to the plastic plate surface.
This is because, the composition of matrix material (epoxy) with hardener (butanox)
will produce chemical reaction. The possibilities are, composite laminate might stick to
the surface of plastic plate and the plastic plate also might fuse or melt due to the heat
produce from the chemical reaction. Besides, the purpose of realease anti-adhesive
28
agent is used to release the cured composite laminate from glass plate easily without
destroying the laminate structure.
3.2.2 Process of fabrication
The plastic plate and brush were clean first from dust and impurities on the
composite laminate later. Release anti-adhesive agent is applied on the clean plastic
plate surface. The laminating process is begun with the first ply of fiber. The calculated
matrix to be used is applied on the fiber evenly by using paint brush. For the hardening
purpose, 1 to 2% of hardener (butanox) from the matrix (epoxy) weight is added. Then,
a roller is used to distribute the matrix to the fiber consistently. In addition, by using
roller, composite laminate could have uniform thickness. It also can squeeze out the air
trapped in the composite laminate. Therefore, the porosity and void content in the
laminate can be minimized. The laminating process is continued for the next layer until
finish. Lastly, all the composite laminate are been cured in the room temperature.
3.2.3 Composition of matrix material and fiber
In this study, there are 4 categories of specimens were planned. These 4
categories been differentiate based on their matrix and fiber composition. For each
laminates, 3 plies of fiberglass (E-glass) were used. The matrix that will be distributed
to every layer of fiber are calculated first before start the fabrication process in order to
ensure the matrix content of every layer is consistent. Thus, the thickness of composite
laminate can be more uniform.
Table 3.1: Composition of composite laminates
Category Weight percent of matrix,
Wm (%)
Weight percent of fiber,
Wf (%)
Matrix to fiber
ratio
E1 30 70 3:7
E2 40 60 2:3
E3 50 50 1:1
E4 60 40 3:2
29
Table 3.2: Weight of matrix and fiber composition in composite laminates
Category
Weight of composition (g)
Matrix (Epoxy) Fiber (E-glass) Matrix content for each layer
E1 48.90 114.10 16.30
E2 74.53 111.80 24.84
E3 109.20 109.20 36.40
E4 163.35 108.90 54.45
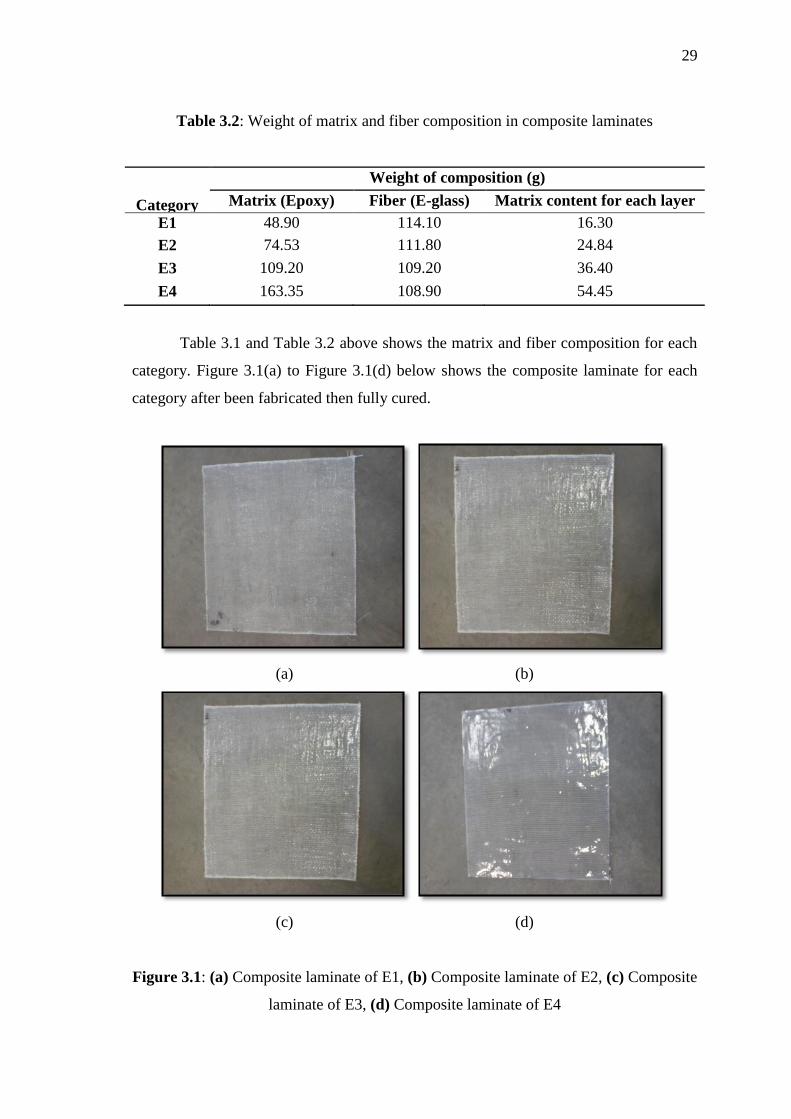
Table 3.1 and Table 3.2 above shows the matrix and fiber composition for each
category. Figure 3.1(a) to Figure 3.1(d) below shows the composite laminate for each
category after been fabricated then fully cured.
(a) (b)
(c) (d)
Figure 3.1: (a) Composite laminate of E1, (b) Composite laminate of E2, (c) Composite
laminate of E3, (d) Composite laminate of E4
30
3.3 COMPOSITE LAMINATE TESTING
There are 3 testing that have been conducted to study the effect of matrix
distribution to the PMC which are Density Test, Tensile Test and Hardness Test. Other
than that, to know the pattern or condition of the matrix distribution, the distribution of
the matrix to the composite laminate has been seen and analyzed.
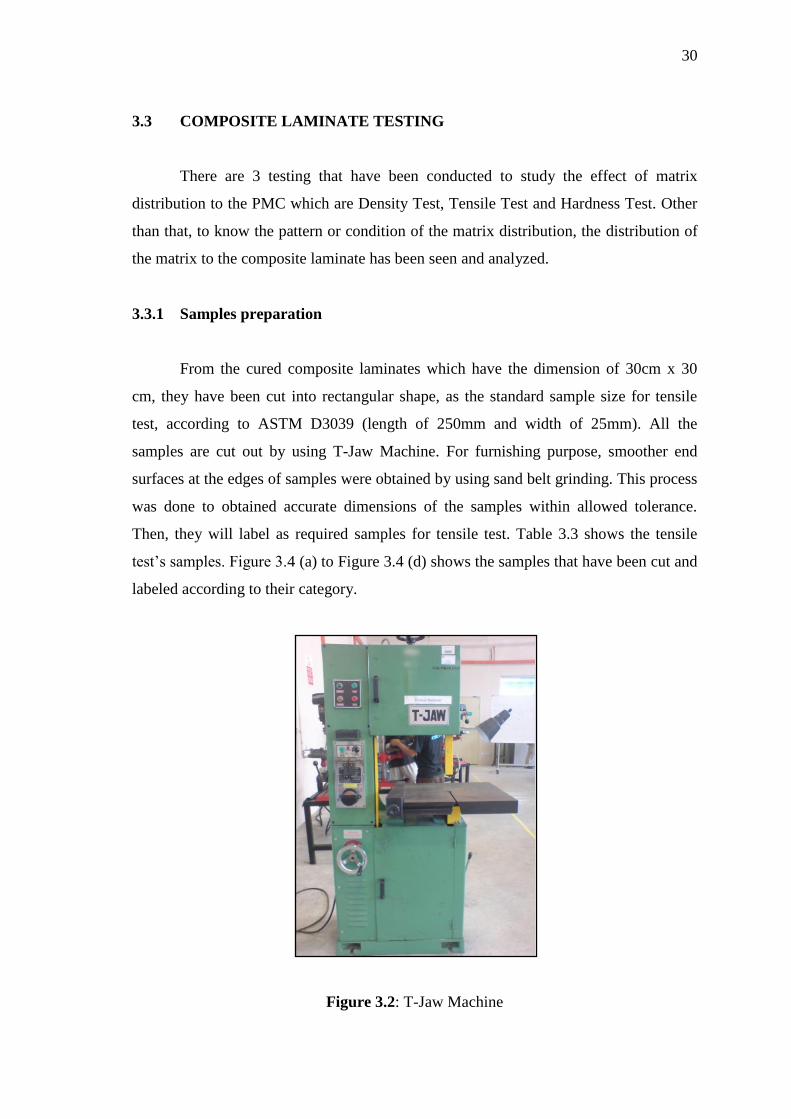
3.3.1 Samples preparation
From the cured composite laminates which have the dimension of 30cm x 30
cm, they have been cut into rectangular shape, as the standard sample size for tensile
test, according to ASTM D3039 (length of 250mm and width of 25mm). All the
samples are cut out by using T-Jaw Machine. For furnishing purpose, smoother end
surfaces at the edges of samples were obtained by using sand belt grinding. This process
was done to obtained accurate dimensions of the samples within allowed tolerance.
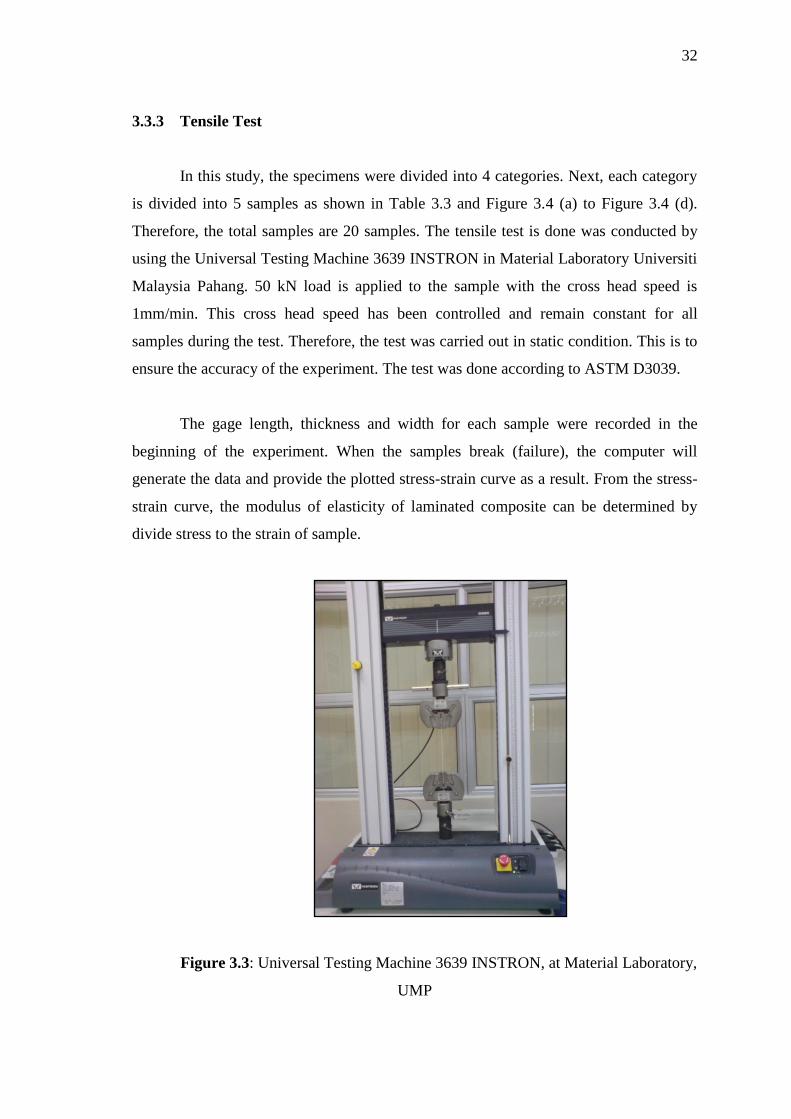
Then, they will label as required samples for tensile test. Table 3.3 shows the tensile
test’s samples. Figure 3.4 (a) to Figure 3.4 (d) shows the samples that have been cut and
labeled according to their category.
Figure 3.2: T-Jaw Machine
31
Table 3.3: Tensile Test’s samples
For each category, 5 samples were selected in order to get the average reading
for tensile test soon.
3.3.2 Density Test
The purpose of Density Test is to study the influence of matrix distribution to
the physical property of PMC. The test has been conducted by applying Archimedes
Principle by divide the mass of sample to the water displaced when sample is immersed.
Firstly, the weight of the sample is measured by using Electronic Balance and
the reading is recorded. Then, water is poured into the measuring cylinder (1000ml).
The initial reading of the volume of water is recorded. Next, the weighted sample was
put into the measuring cylinder. The final reading of the volume of the water is
recorded. The water displacement is calculated by subtracting the final volume of water
with the initial volume of water. The water displacement was indicated the volume of
the sample itself. The same method is repeated for other samples and all readings and
calculation for Density Test was recorded in a table.
Category Sample Category Sample
E1
S11
E3
S31
S12 S32
S13 S33
S14 S34
S15 S35
E2
S21
E4
S41
S22 S42
S23 S43
S24 S44
S25 S45
32
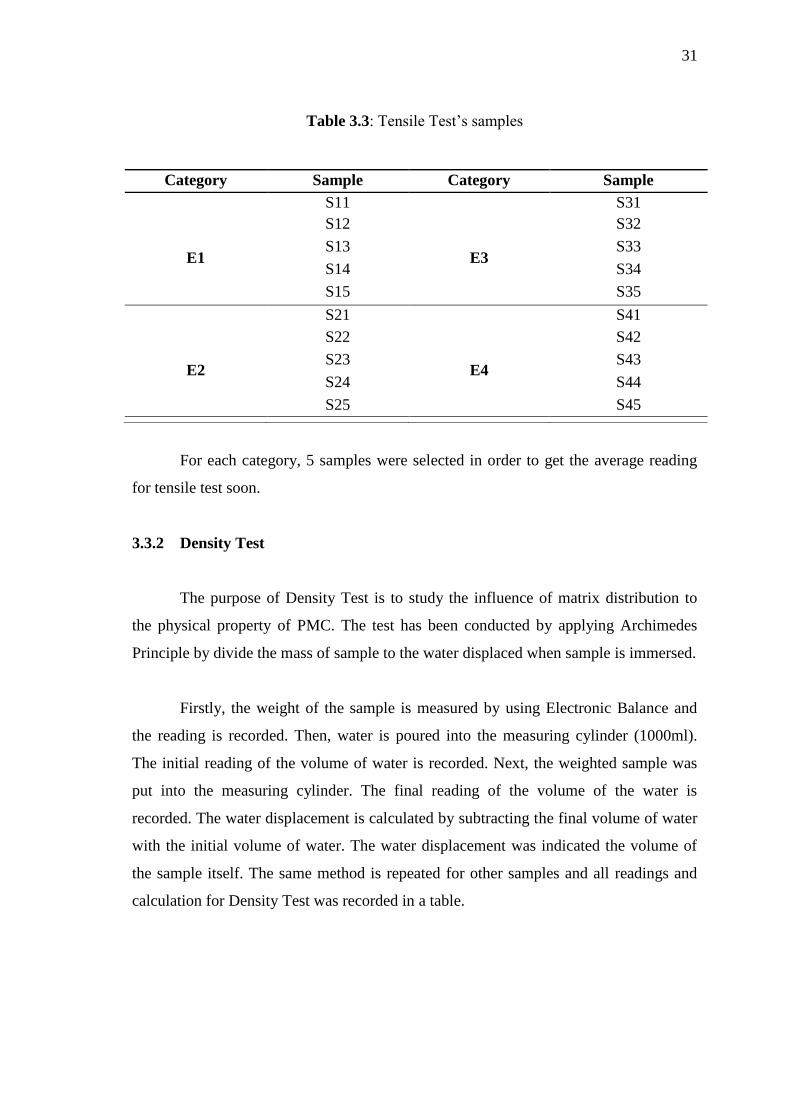
3.3.3 Tensile Test
In this study, the specimens were divided into 4 categories. Next, each category
is divided into 5 samples as shown in Table 3.3 and Figure 3.4 (a) to Figure 3.4 (d).
Therefore, the total samples are 20 samples. The tensile test is done was conducted by
using the Universal Testing Machine 3639 INSTRON in Material Laboratory Universiti
Malaysia Pahang. 50 kN load is applied to the sample with the cross head speed is
1mm/min. This cross head speed has been controlled and remain constant for all
samples during the test. Therefore, the test was carried out in static condition. This is to
ensure the accuracy of the experiment. The test was done according to ASTM D3039.
The gage length, thickness and width for each sample were recorded in the
beginning of the experiment. When the samples break (failure), the computer will
generate the data and provide the plotted stress-strain curve as a result. From the stress-
strain curve, the modulus of elasticity of laminated composite can be determined by
divide stress to the strain of sample.
Figure 3.3: Universal Testing Machine 3639 INSTRON, at Material Laboratory,
UMP
33
(a) (b)
(c) (d)
Figure 3.4: (a) Tensile Test samples for E1, (b) Tensile Test samples for E2, (c) Tensile
Test samples for E3, (d) Tensile Test samples for E4
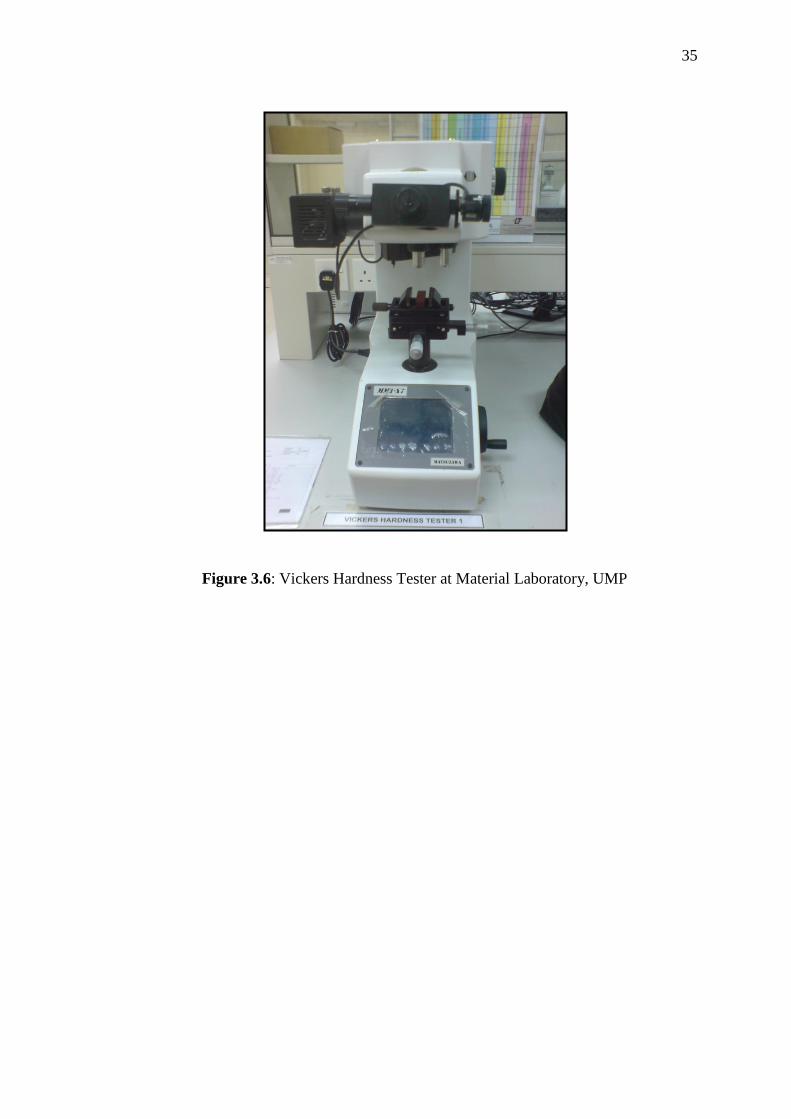
3.3.4 Hardness Test
The final testing that has been conducted is Hardness Test. The Vickers
Hardness Tester machine with diamond shape indenter has been used. In this testing, the
load applied is 500gf with 10 magnifications. Through its own standard procedure, the
hardness reading can be obtained from the machine’s screen.
34
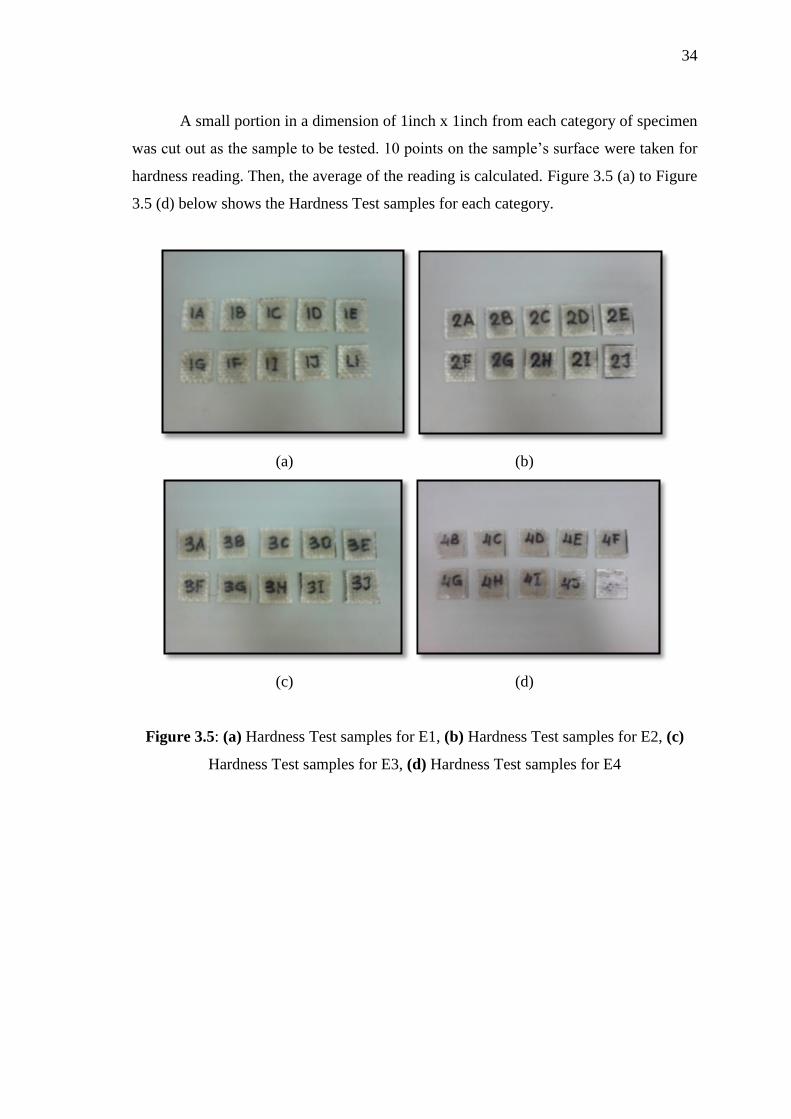
A small portion in a dimension of 1inch x 1inch from each category of specimen
was cut out as the sample to be tested. 10 points on the sample’s surface were taken for
hardness reading. Then, the average of the reading is calculated. Figure 3.5 (a) to Figure
3.5 (d) below shows the Hardness Test samples for each category.
(a) (b)
(c) (d)
Figure 3.5: (a) Hardness Test samples for E1, (b) Hardness Test samples for E2, (c)
Hardness Test samples for E3, (d) Hardness Test samples for E4
35
Figure 3.6: Vickers Hardness Tester at Material Laboratory, UMP
36
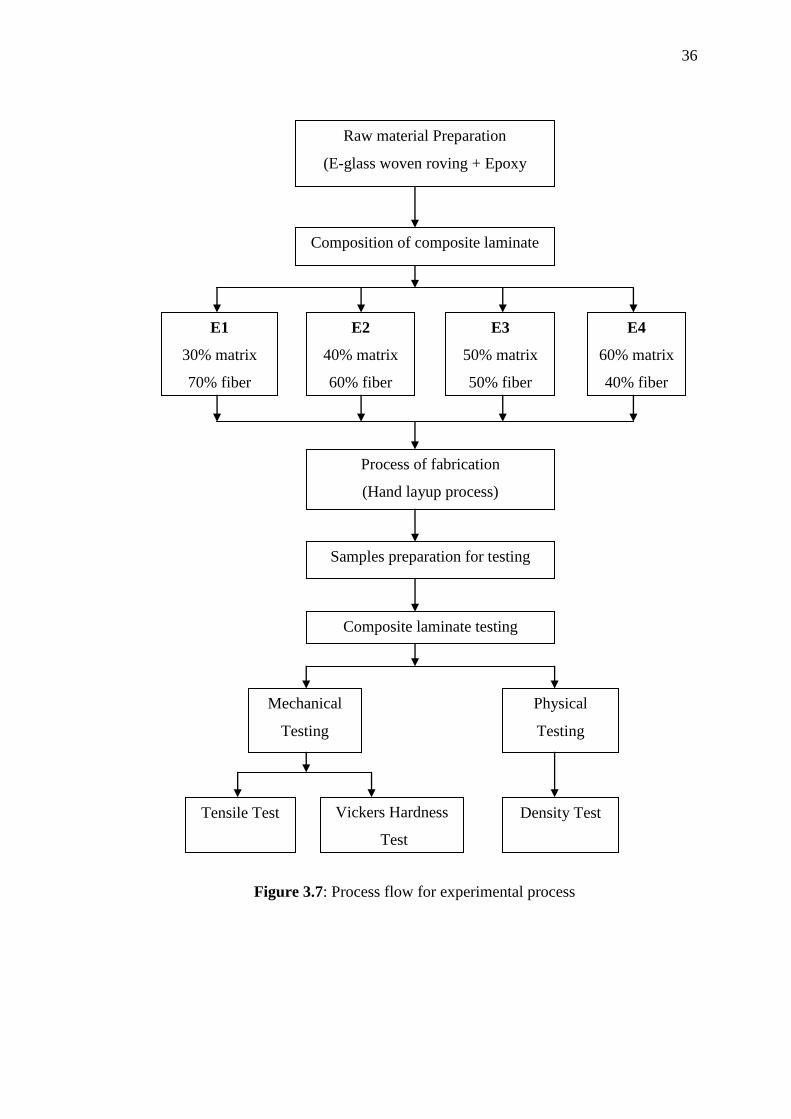
Figure 3.7: Process flow for experimental process
Composite laminate testing
Mechanical
Testing
Physical
Testing
Tensile Test Vickers Hardness
Test
Density Test
Raw material Preparation
(E-glass woven roving + Epoxy
resin)
Composition of composite laminate
E1
30% matrix
70% fiber
E2
40% matrix
60% fiber
E3
50% matrix
50% fiber
E4
60% matrix
40% fiber
Process of fabrication
(Hand layup process)
Samples preparation for testing
CHAPTER 4
RESULT AND DISCUSSION
4.1 INTRODUCTION
As mentioned previously, the objective of this project is to investigate the effect
of matrix distribution to the properties of polymer matrix composite (PMC). Therefore,
in order to obtain the properties of the fabricated composite laminates, two types of
testing were conducted to evaluate the effect of the above matter to the mechanical
properties which are Tensile Test and Hardness Test. To evaluate the effect of matrix
distribution to the physical property, Density Test has been conducted. Besides, the
matrix distribution of fabricated composite laminates has been analyzed by using
Metallurgical Microscope. By using this microscope, the distribution of the matrix can
be observed. Other than that, there have an inspection of the samples to determine their
failure mode. In the main, the effect of matrix distribution in the composite are justified
in this chapter.
4.2 OBSERVATION ON MATRIX DISTRIBUTION
The main function of matrix material is to hold fibers together. Matrix material
acts as a binding agent in a structural component in which the fibers are embedded.
Besides transferring the applied loads to the fibers, matrix also protects the fibers from
mechanical and environmental damages. Figure 4.1 to Figure 4.4 shows the matrix
distribution of laminated composite for each category. For matrix distribution analysis,
each category was cut into a small portion with the dimension of 1inch x 1inch. The
matrix distribution was observed by using the Metallurgical Microscope at 100
magnifications with 400µm scale.
38
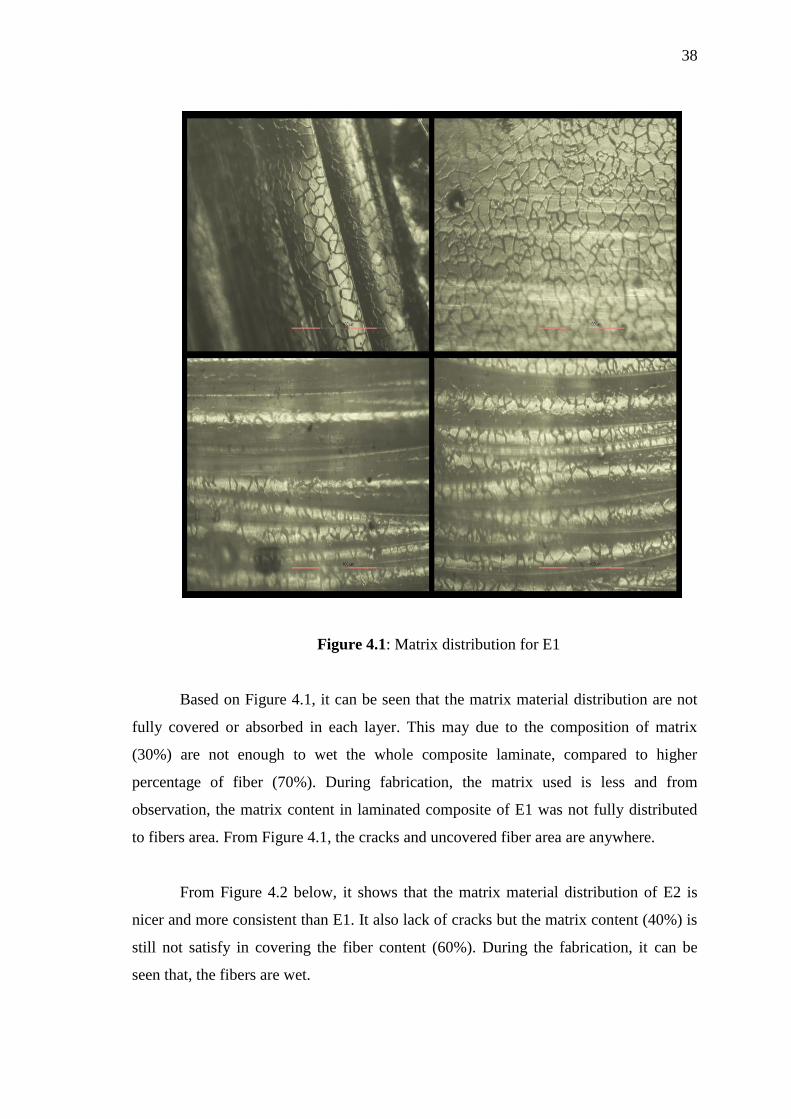
Figure 4.1: Matrix distribution for E1
Based on Figure 4.1, it can be seen that the matrix material distribution are not
fully covered or absorbed in each layer. This may due to the composition of matrix
(30%) are not enough to wet the whole composite laminate, compared to higher
percentage of fiber (70%). During fabrication, the matrix used is less and from
observation, the matrix content in laminated composite of E1 was not fully distributed
to fibers area. From Figure 4.1, the cracks and uncovered fiber area are anywhere.
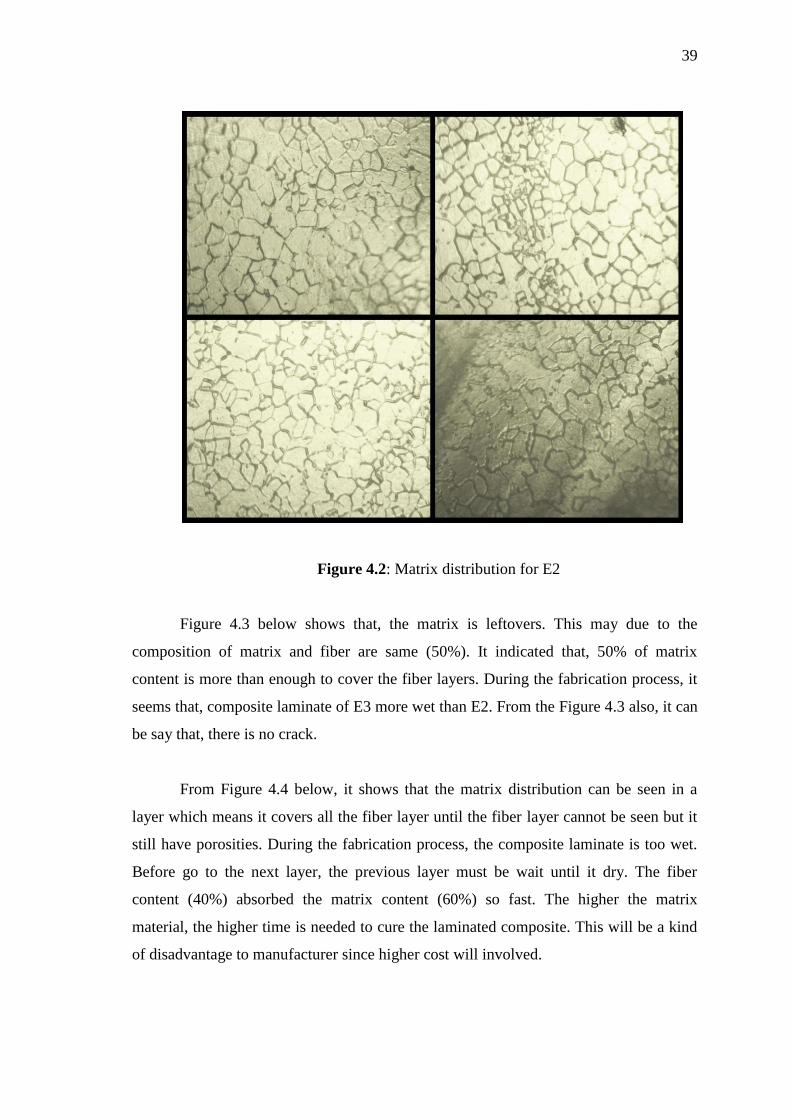
From Figure 4.2 below, it shows that the matrix material distribution of E2 is
nicer and more consistent than E1. It also lack of cracks but the matrix content (40%) is
still not satisfy in covering the fiber content (60%). During the fabrication, it can be
seen that, the fibers are wet.
39
Figure 4.2: Matrix distribution for E2
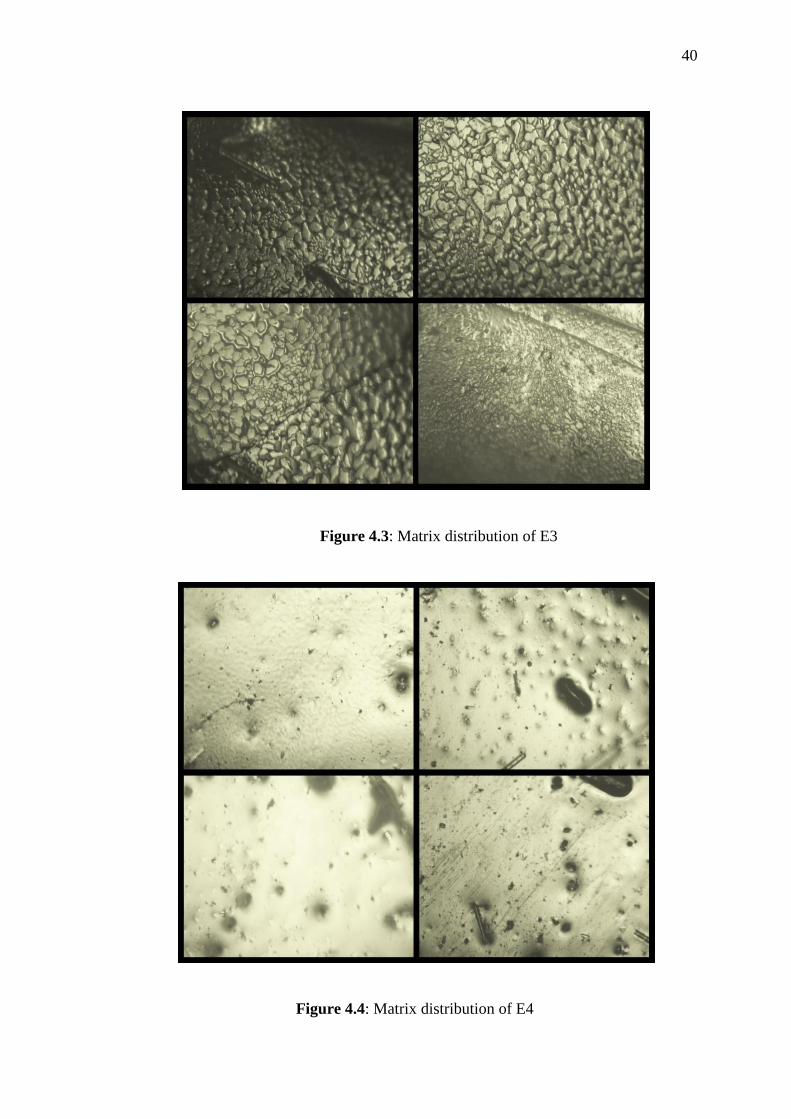
Figure 4.3 below shows that, the matrix is leftovers. This may due to the
composition of matrix and fiber are same (50%). It indicated that, 50% of matrix
content is more than enough to cover the fiber layers. During the fabrication process, it
seems that, composite laminate of E3 more wet than E2. From the Figure 4.3 also, it can
be say that, there is no crack.
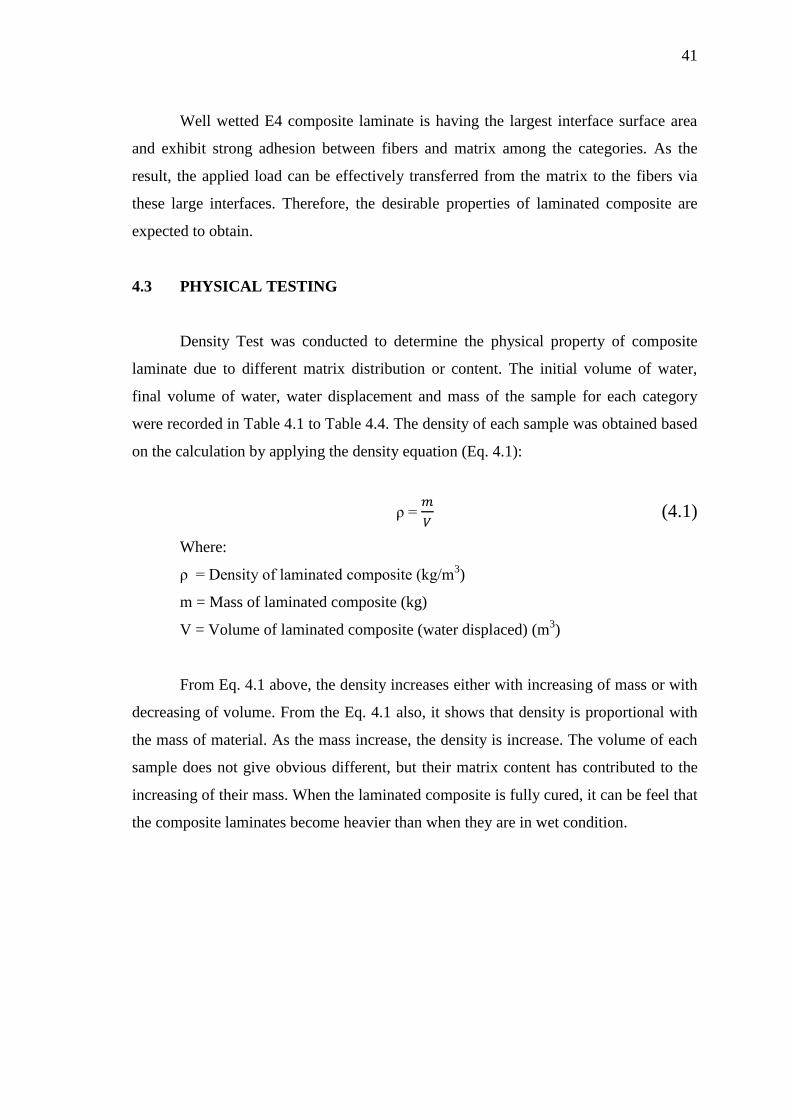
From Figure 4.4 below, it shows that the matrix distribution can be seen in a
layer which means it covers all the fiber layer until the fiber layer cannot be seen but it
still have porosities. During the fabrication process, the composite laminate is too wet.
Before go to the next layer, the previous layer must be wait until it dry. The fiber
content (40%) absorbed the matrix content (60%) so fast. The higher the matrix
material, the higher time is needed to cure the laminated composite. This will be a kind
of disadvantage to manufacturer since higher cost will involved.
40
Figure 4.3: Matrix distribution of E3
Figure 4.4: Matrix distribution of E4
41
Well wetted E4 composite laminate is having the largest interface surface area
and exhibit strong adhesion between fibers and matrix among the categories. As the
result, the applied load can be effectively transferred from the matrix to the fibers via
these large interfaces. Therefore, the desirable properties of laminated composite are
expected to obtain.
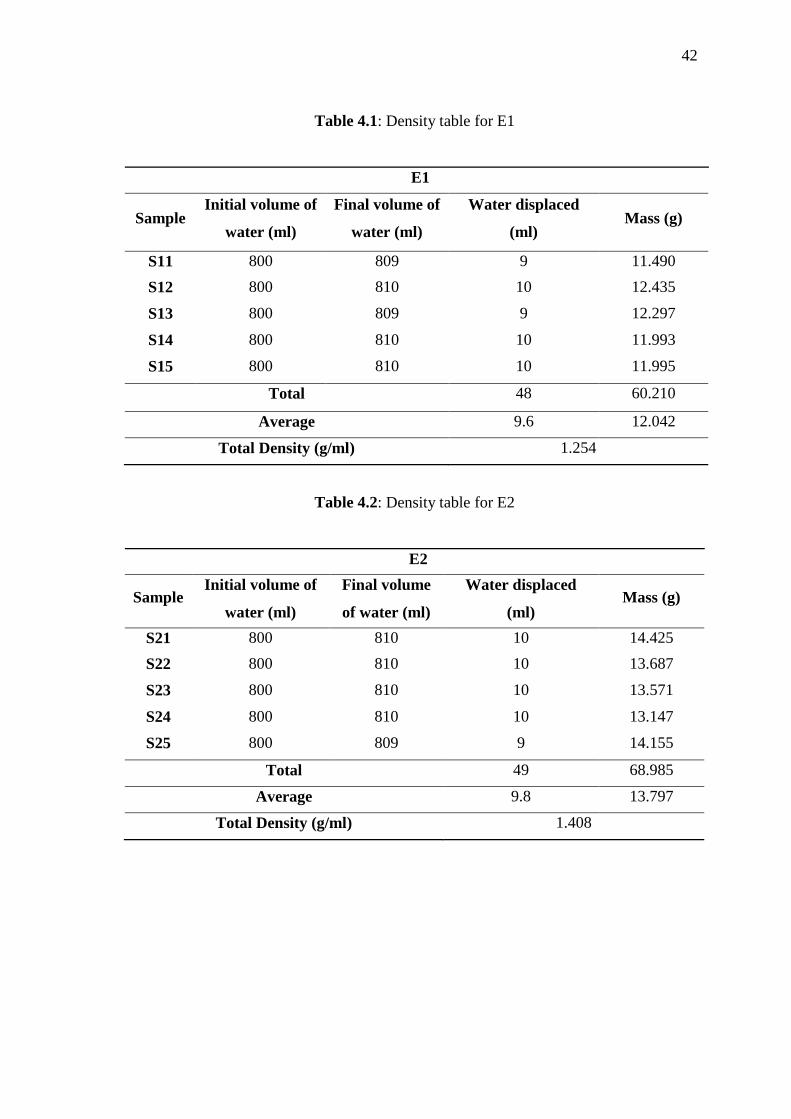
4.3 PHYSICAL TESTING
Density Test was conducted to determine the physical property of composite
laminate due to different matrix distribution or content. The initial volume of water,
final volume of water, water displacement and mass of the sample for each category
were recorded in Table 4.1 to Table 4.4. The density of each sample was obtained based
on the calculation by applying the density equation (Eq. 4.1):
ρ =
(4.1)
Where:
ρ = Density of laminated composite (kg/m3)
m = Mass of laminated composite (kg)
V = Volume of laminated composite (water displaced) (m3)
From Eq. 4.1 above, the density increases either with increasing of mass or with
decreasing of volume. From the Eq. 4.1 also, it shows that density is proportional with
the mass of material. As the mass increase, the density is increase. The volume of each
sample does not give obvious different, but their matrix content has contributed to the
increasing of their mass. When the laminated composite is fully cured, it can be feel that
the composite laminates become heavier than when they are in wet condition.
42
Table 4.1: Density table for E1
E1
Sample Initial volume of
water (ml)
Final volume of
water (ml)
Water displaced
(ml) Mass (g)
S11 800 809 9 11.490
S12 800 810 10 12.435
S13 800 809 9 12.297
S14 800 810 10 11.993
S15 800 810 10 11.995
Total 48 60.210
Average 9.6 12.042
Total Density (g/ml) 1.254
Table 4.2: Density table for E2
E2
Sample Initial volume of
water (ml)
Final volume
of water (ml)
Water displaced
(ml) Mass (g)
S21 800 810 10 14.425
S22 800 810 10 13.687
S23 800 810 10 13.571
S24 800 810 10 13.147
S25 800 809 9 14.155
Total 49 68.985
Average 9.8 13.797
Total Density (g/ml) 1.408
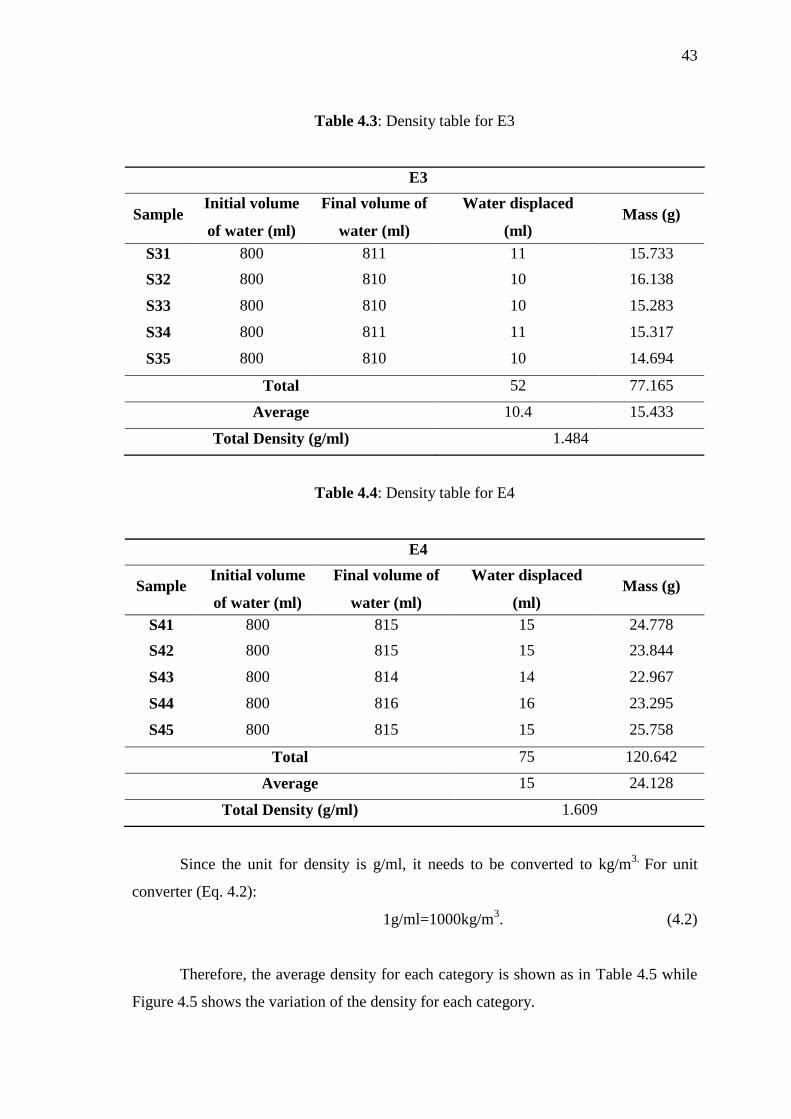
43
Table 4.3: Density table for E3
E3
Sample Initial volume
of water (ml)
Final volume of
water (ml)
Water displaced
(ml) Mass (g)
S31 800 811 11 15.733
S32 800 810 10 16.138
S33 800 810 10 15.283
S34 800 811 11 15.317
S35 800 810 10 14.694
Total 52 77.165
Average 10.4 15.433
Total Density (g/ml) 1.484
Table 4.4: Density table for E4
E4
Sample Initial volume
of water (ml)
Final volume of
water (ml)
Water displaced
(ml) Mass (g)
S41 800 815 15 24.778
S42 800 815 15 23.844
S43 800 814 14 22.967
S44 800 816 16 23.295
S45 800 815 15 25.758
Total 75 120.642
Average 15 24.128
Total Density (g/ml) 1.609
Since the unit for density is g/ml, it needs to be converted to kg/m3.
For unit
converter (Eq. 4.2):
1g/ml=1000kg/m3. (4.2)
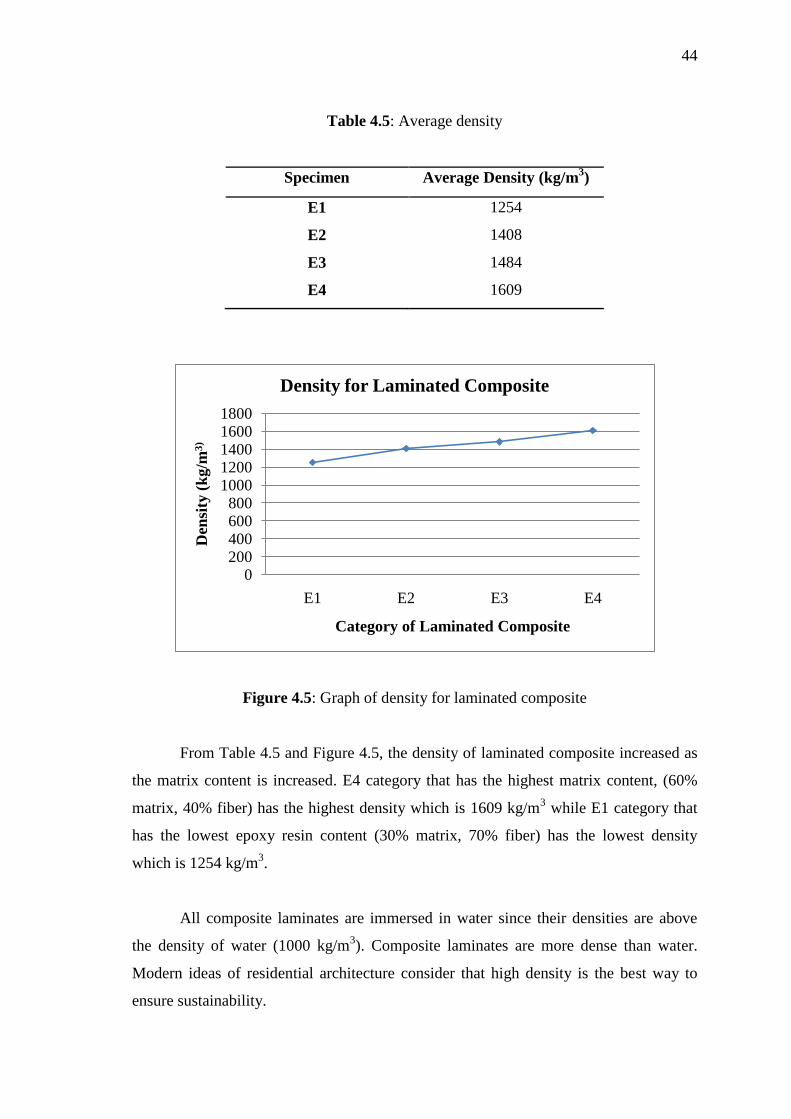
Therefore, the average density for each category is shown as in Table 4.5 while
Figure 4.5 shows the variation of the density for each category.
44
Table 4.5: Average density
Specimen Average Density (kg/m3)
E1 1254
E2 1408
E3 1484
E4 1609
Figure 4.5: Graph of density for laminated composite
From Table 4.5 and Figure 4.5, the density of laminated composite increased as
the matrix content is increased. E4 category that has the highest matrix content, (60%
matrix, 40% fiber) has the highest density which is 1609 kg/m3 while E1 category that
has the lowest epoxy resin content (30% matrix, 70% fiber) has the lowest density
which is 1254 kg/m3.
All composite laminates are immersed in water since their densities are above
the density of water (1000 kg/m3). Composite laminates are more dense than water.
Modern ideas of residential architecture consider that high density is the best way to
ensure sustainability.
0200400600800
10001200140016001800
E1 E2 E3 E4
Den
sity
(k
g/m
3)
Category of Laminated Composite
Density for Laminated Composite
45
4.4 MECHANICAL TESTING
To obtain the mechanical properties of laminated composite, tensile test and
hardness test were conducted.
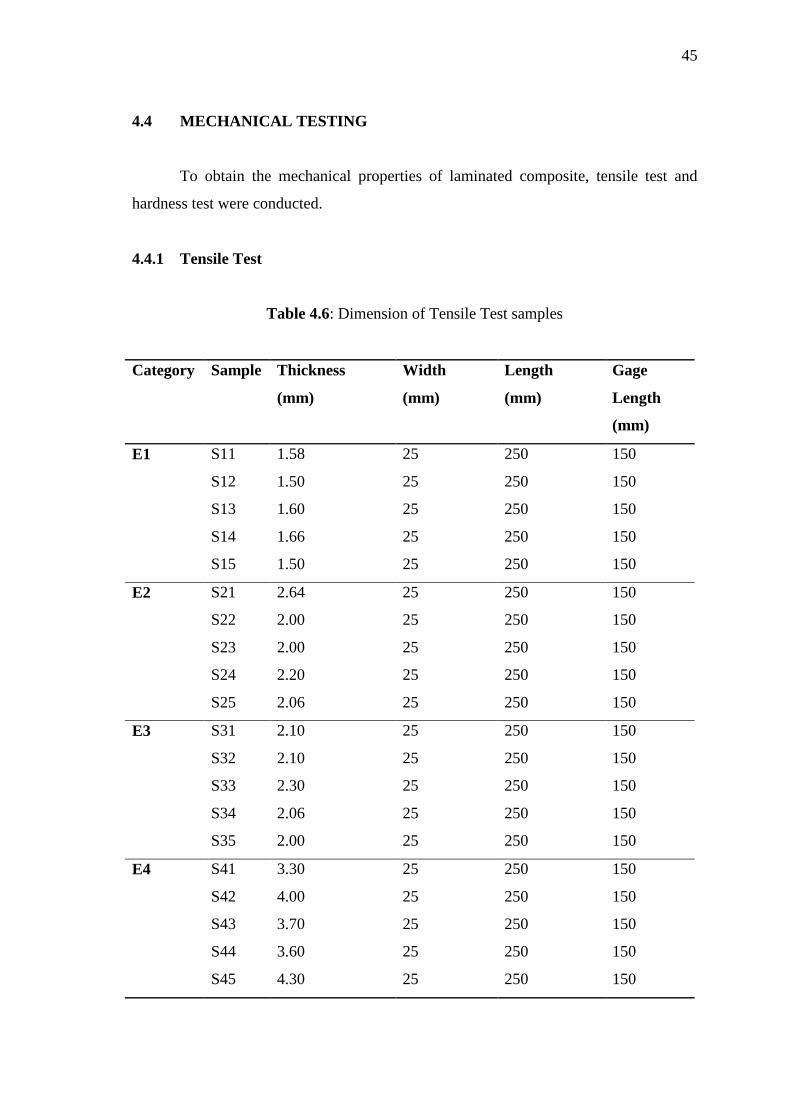
4.4.1 Tensile Test
Table 4.6: Dimension of Tensile Test samples
Category Sample Thickness
(mm)
Width
(mm)
Length
(mm)
Gage
Length
(mm)
E1 S11 1.58 25 250 150
S12 1.50 25 250 150
S13 1.60 25 250 150
S14 1.66 25 250 150
S15 1.50 25 250 150
E2 S21 2.64 25 250 150
S22 2.00 25 250 150
S23 2.00 25 250 150
S24 2.20 25 250 150
S25 2.06 25 250 150
E3 S31 2.10 25 250 150
S32 2.10 25 250 150
S33 2.30 25 250 150
S34 2.06 25 250 150
S35 2.00 25 250 150
E4 S41 3.30 25 250 150
S42 4.00 25 250 150
S43 3.70 25 250 150
S44 3.60 25 250 150
S45 4.30 25 250 150
46
The important parameters that must be key in to the INSTRON software before
run the test is the thickness. The gage length (150mm), tab length (50mm), width
(25mm) and total length (250mm) are set to be constant according to ASTM D3039.
Table 4.6 shows the dimension of test samples for each category.
From Table 4.6, it seems that the thickness of the samples is totally different but
they are in a particular range for their category. Differences of thickness will give
different value of cross sectional area, A. This will affect the result of the stress value
since stress is the ratio of force over area:
σ = F/A
F = σA (4.3)
Where:
σ = Stress
F = Force applied
A = Cross sectional area
With this relationship, the force applied is proportional to the cross sectional
area. When all the data were key in, test was running, and then the computer will
generate the output data that give the value of the maximum load applied (kN),
maximum strain (mm/mm), maximum stress (MPa) and also maximum strength (MPa).
The stress-strain curve were also generated (APPENDIX I). Table 4.7 to Table 4.10
show the data given by the INSTRON and Figure 4.6 till Figure 4.9 show the plotted
Stress-Strain curve among samples for each category.
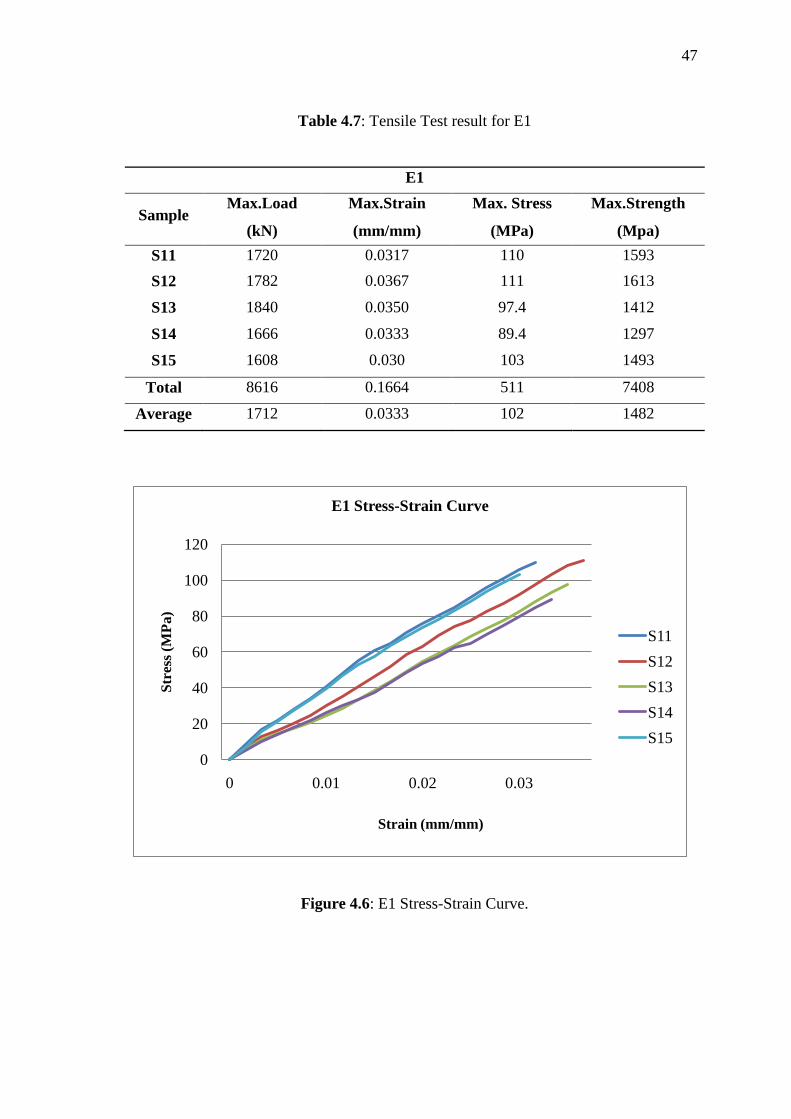
As shown in Table 4.7, the ultimate strength (maximum strength or tensile
strength) are not totally same among each others. However, they are located in a
particular range which is between 1297 MPa to 1613 MPa. Among S11 to S15, sample
S12 obtained the highest ultimate strength which is 1613 MPa.
47
Table 4.7: Tensile Test result for E1
E1
Sample Max.Load
(kN)
Max.Strain
(mm/mm)
Max. Stress
(MPa)
Max.Strength
(Mpa)
S11 1720 0.0317 110 1593
S12 1782 0.0367 111 1613
S13 1840 0.0350 97.4 1412
S14 1666 0.0333 89.4 1297
S15 1608 0.030 103 1493
Total 8616 0.1664 511 7408
Average 1712 0.0333 102 1482
Figure 4.6: E1 Stress-Strain Curve.
0
20
40
60
80
100
120
0 0.01 0.02 0.03
Str
ess
(MP
a)
E1 Stress-Strain Curve
S11
S12
S13
S14
S15
Strain (mm/mm)
48
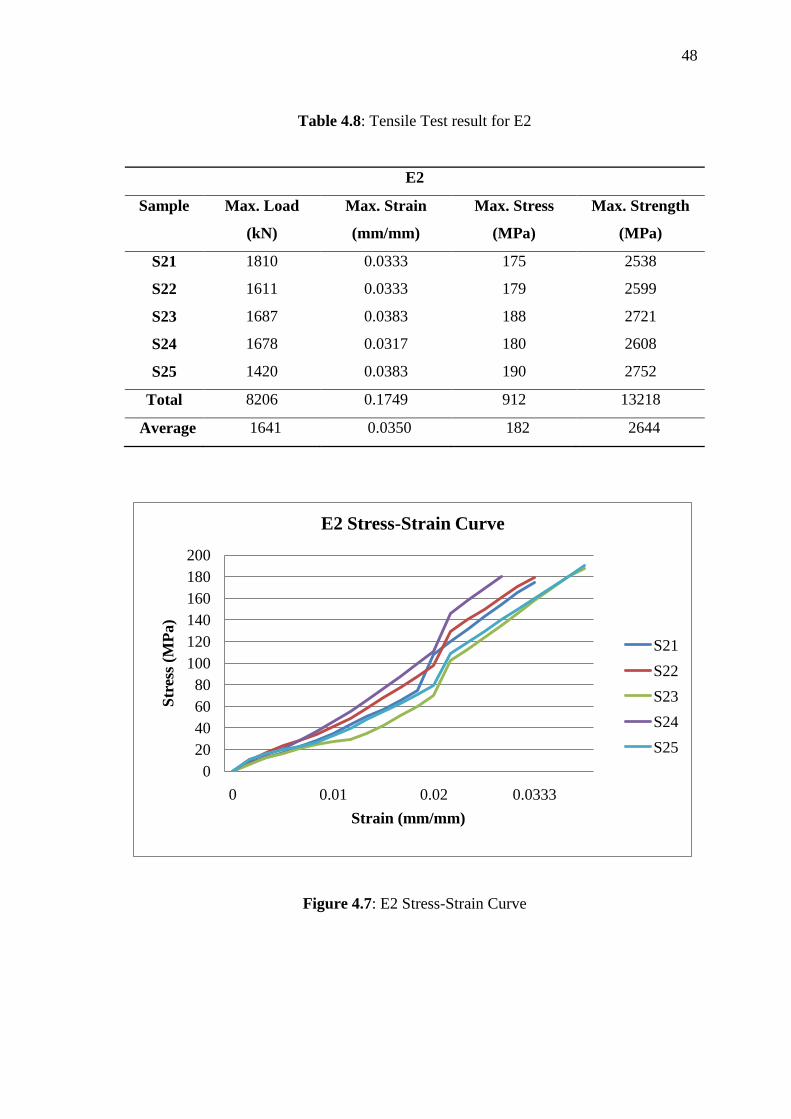
Table 4.8: Tensile Test result for E2
E2
Sample Max. Load
(kN)
Max. Strain
(mm/mm)
Max. Stress
(MPa)
Max. Strength
(MPa)
S21 1810 0.0333 175 2538
S22 1611 0.0333 179 2599
S23 1687 0.0383 188 2721
S24 1678 0.0317 180 2608
S25 1420 0.0383 190 2752
Total 8206 0.1749 912 13218
Average 1641 0.0350 182 2644
Figure 4.7: E2 Stress-Strain Curve
0
20
40
60
80
100
120
140
160
180
200
0 0.01 0.02 0.0333
Str
ess
(MP
a)
E2 Stress-Strain Curve
S21
S22
S23
S24
S25
Strain (mm/mm)
49
Like E1, the ultimate strength (maximum strength or tensile strength) for E2 also
are not totally same among each others. They are located in a particular range which is
between 2538 MPa to 2752 MPa. S25 sample obtained the highest ultimate strength
which is 2752 MPa. The result is shown in Table 4.8 and Figure 4.7.
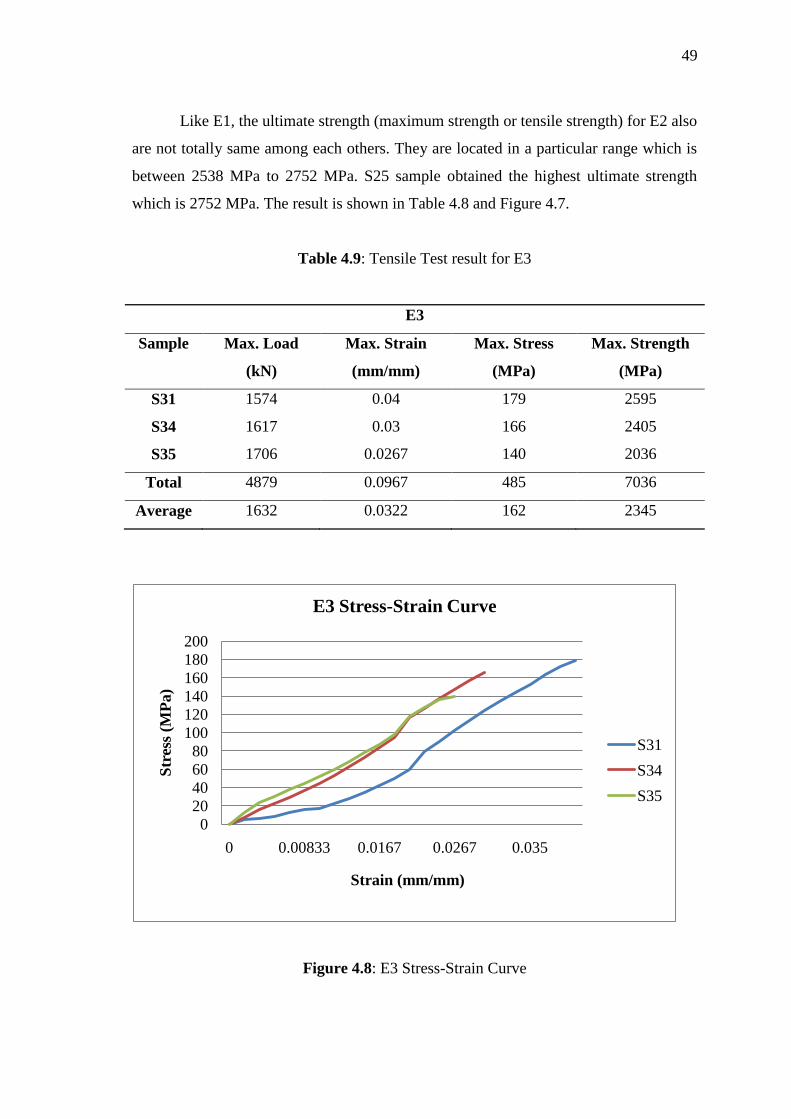
Table 4.9: Tensile Test result for E3
E3
Sample Max. Load
(kN)
Max. Strain
(mm/mm)
Max. Stress
(MPa)
Max. Strength
(MPa)
S31 1574 0.04 179 2595
S34 1617 0.03 166 2405
S35 1706 0.0267 140 2036
Total 4879 0.0967 485 7036
Average 1632 0.0322 162 2345
Figure 4.8: E3 Stress-Strain Curve
0
20
40
60
80
100
120
140
160
180
200
0 0.00833 0.0167 0.0267 0.035
Str
ess
(MP
a)
E3 Stress-Strain Curve
S31
S34
S35
Strain (mm/mm)
50
Unfortunately, for E3, just data for 3 samples are taken because the data for
other samples (S32 and S33) are irrelevant and out of the range may due to the error or
problem during gripping process. They break too early. The samples are not secured
properly thus, it affects the data. The highest strength for this category is S31 with
strength of 2595 MPa.
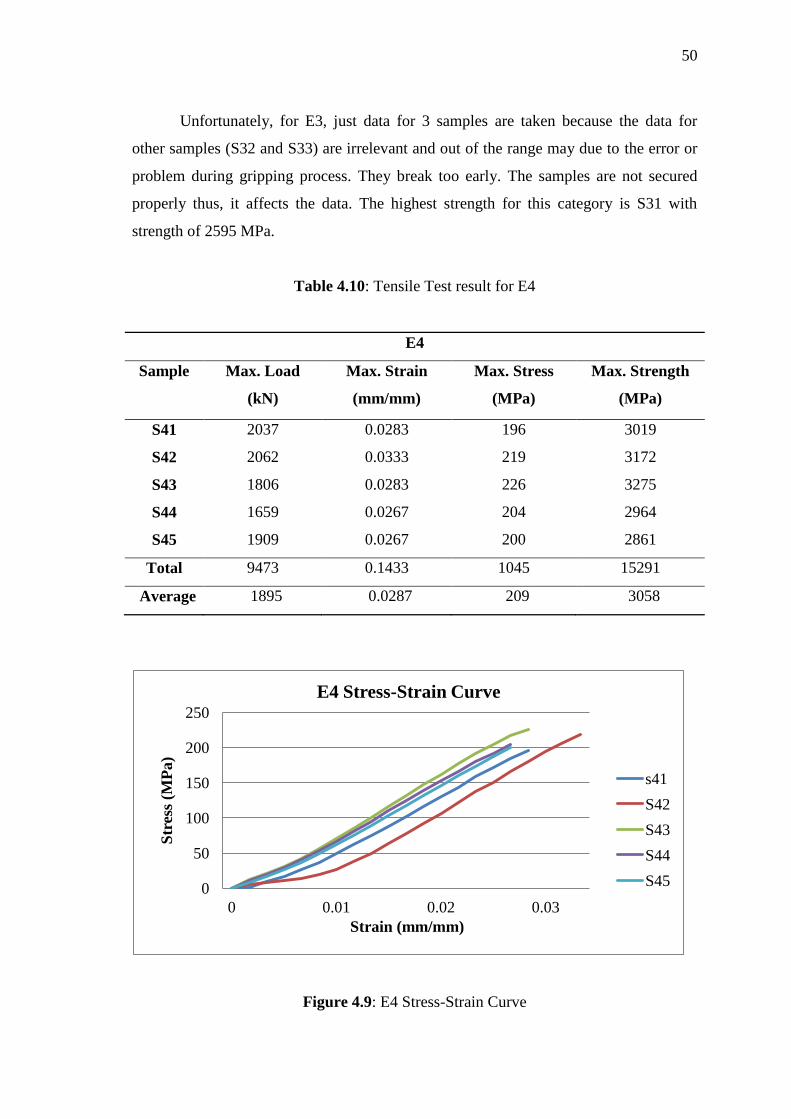
Table 4.10: Tensile Test result for E4
E4
Sample Max. Load
(kN)
Max. Strain
(mm/mm)
Max. Stress
(MPa)
Max. Strength
(MPa)
S41 2037 0.0283 196 3019
S42 2062 0.0333 219 3172
S43 1806 0.0283 226 3275
S44 1659 0.0267 204 2964
S45 1909 0.0267 200 2861
Total 9473 0.1433 1045 15291
Average 1895 0.0287 209 3058
Figure 4.9: E4 Stress-Strain Curve
0
50
100
150
200
250
0 0.01 0.02 0.03
Str
ess
(MP
a)
E4 Stress-Strain Curve
s41
S42
S43
S44
S45
Strain (mm/mm)
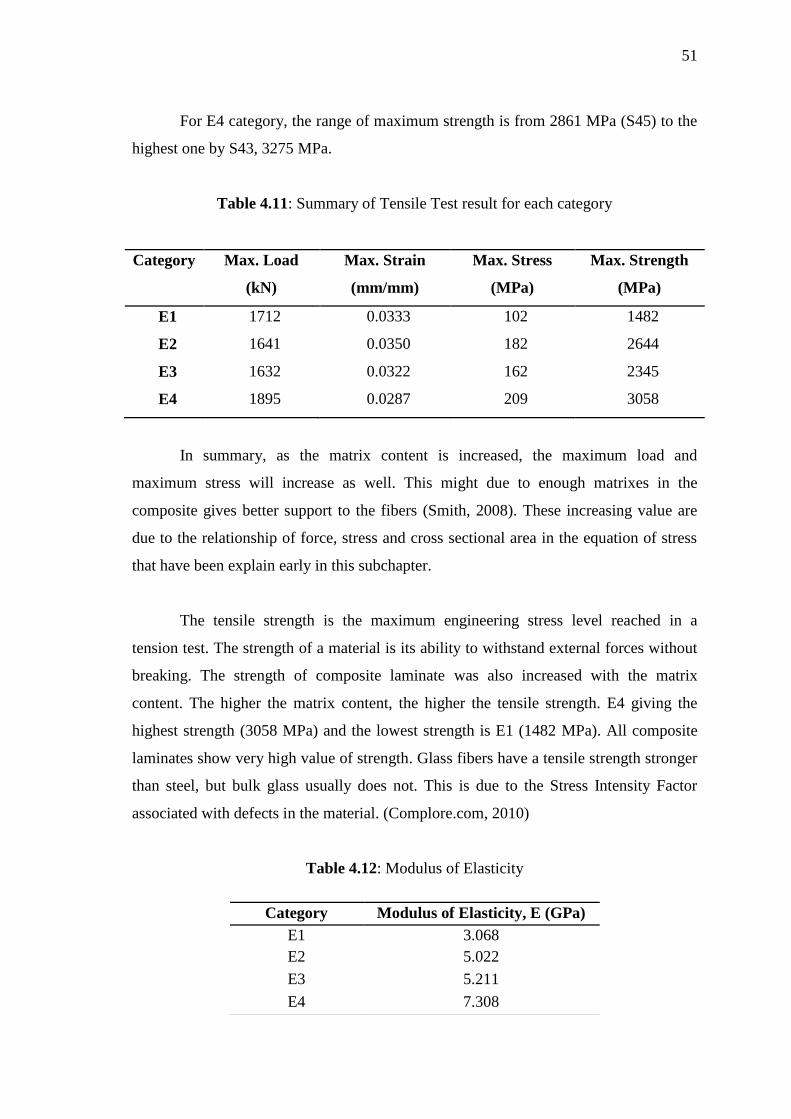
51
For E4 category, the range of maximum strength is from 2861 MPa (S45) to the
highest one by S43, 3275 MPa.
Table 4.11: Summary of Tensile Test result for each category
Category Max. Load
(kN)
Max. Strain
(mm/mm)
Max. Stress
(MPa)
Max. Strength
(MPa)
E1 1712 0.0333 102 1482
E2 1641 0.0350 182 2644
E3 1632 0.0322 162 2345
E4 1895 0.0287 209 3058
In summary, as the matrix content is increased, the maximum load and
maximum stress will increase as well. This might due to enough matrixes in the
composite gives better support to the fibers (Smith, 2008). These increasing value are
due to the relationship of force, stress and cross sectional area in the equation of stress
that have been explain early in this subchapter.
The tensile strength is the maximum engineering stress level reached in a
tension test. The strength of a material is its ability to withstand external forces without
breaking. The strength of composite laminate was also increased with the matrix
content. The higher the matrix content, the higher the tensile strength. E4 giving the
highest strength (3058 MPa) and the lowest strength is E1 (1482 MPa). All composite
laminates show very high value of strength. Glass fibers have a tensile strength stronger
than steel, but bulk glass usually does not. This is due to the Stress Intensity Factor
associated with defects in the material. (Complore.com, 2010)
Table 4.12: Modulus of Elasticity
Category Modulus of Elasticity, E (GPa)
E1 3.068
E2 5.022
E3 5.211
E4 7.308
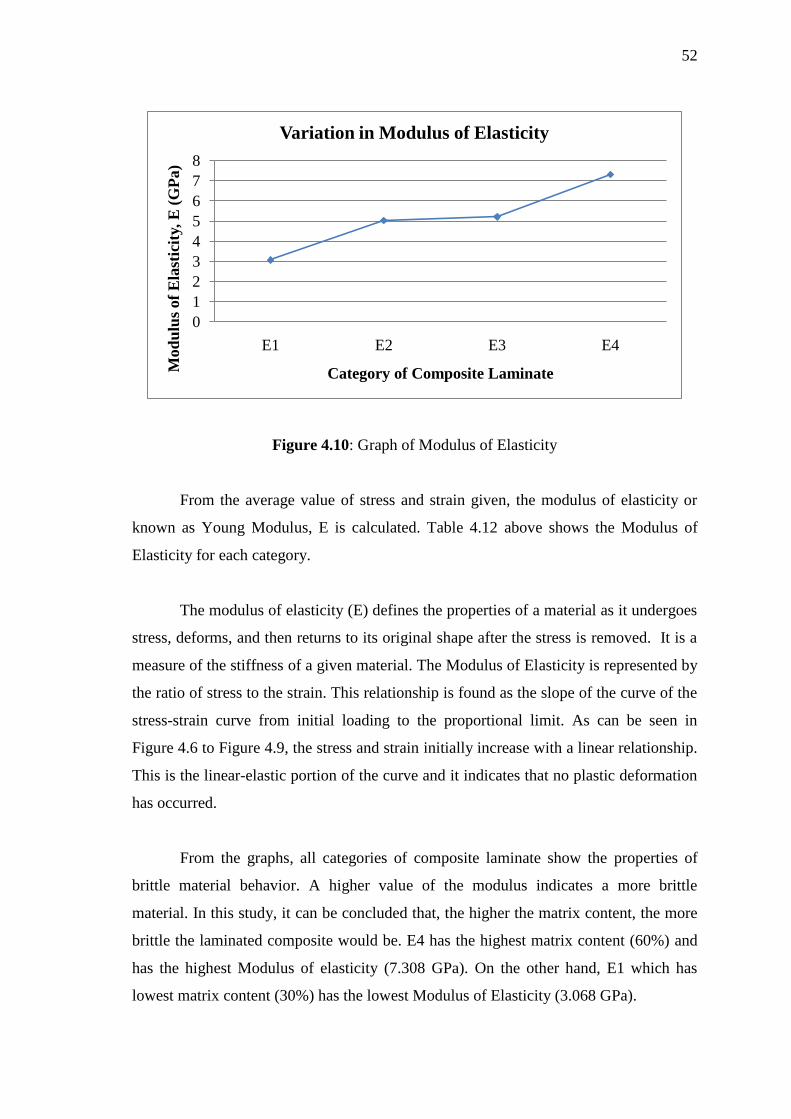
52
Figure 4.10: Graph of Modulus of Elasticity
From the average value of stress and strain given, the modulus of elasticity or
known as Young Modulus, E is calculated. Table 4.12 above shows the Modulus of
Elasticity for each category.
The modulus of elasticity (E) defines the properties of a material as it undergoes
stress, deforms, and then returns to its original shape after the stress is removed. It is a
measure of the stiffness of a given material. The Modulus of Elasticity is represented by
the ratio of stress to the strain. This relationship is found as the slope of the curve of the
stress-strain curve from initial loading to the proportional limit. As can be seen in
Figure 4.6 to Figure 4.9, the stress and strain initially increase with a linear relationship.
This is the linear-elastic portion of the curve and it indicates that no plastic deformation
has occurred.
From the graphs, all categories of composite laminate show the properties of
brittle material behavior. A higher value of the modulus indicates a more brittle
material. In this study, it can be concluded that, the higher the matrix content, the more
brittle the laminated composite would be. E4 has the highest matrix content (60%) and
has the highest Modulus of elasticity (7.308 GPa). On the other hand, E1 which has
lowest matrix content (30%) has the lowest Modulus of Elasticity (3.068 GPa).
0
1
2
3
4
5
6
7
8
E1 E2 E3 E4
Mod
ulu
s of
Ela
stic
ity, E
(G
Pa)
Category of Composite Laminate
Variation in Modulus of Elasticity
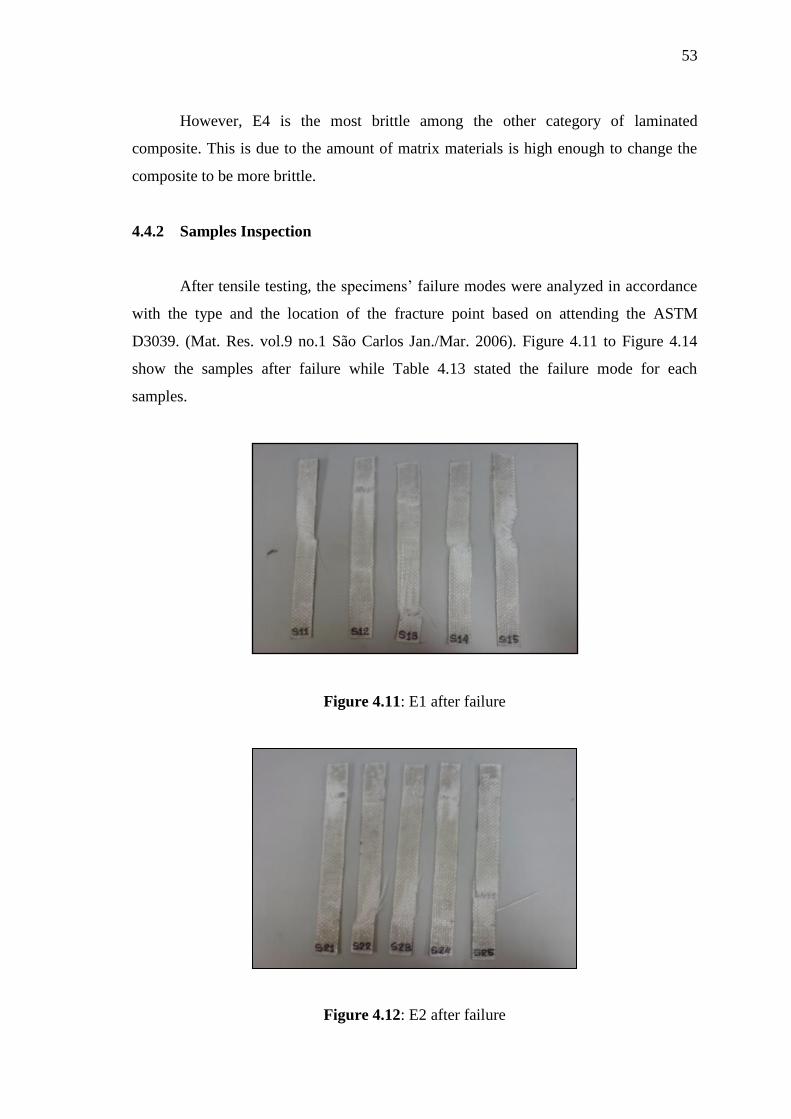
53
However, E4 is the most brittle among the other category of laminated
composite. This is due to the amount of matrix materials is high enough to change the
composite to be more brittle.
4.4.2 Samples Inspection
After tensile testing, the specimens’ failure modes were analyzed in accordance
with the type and the location of the fracture point based on attending the ASTM
D3039. (Mat. Res. vol.9 no.1 São Carlos Jan./Mar. 2006). Figure 4.11 to Figure 4.14
show the samples after failure while Table 4.13 stated the failure mode for each
samples.
Figure 4.11: E1 after failure
Figure 4.12: E2 after failure
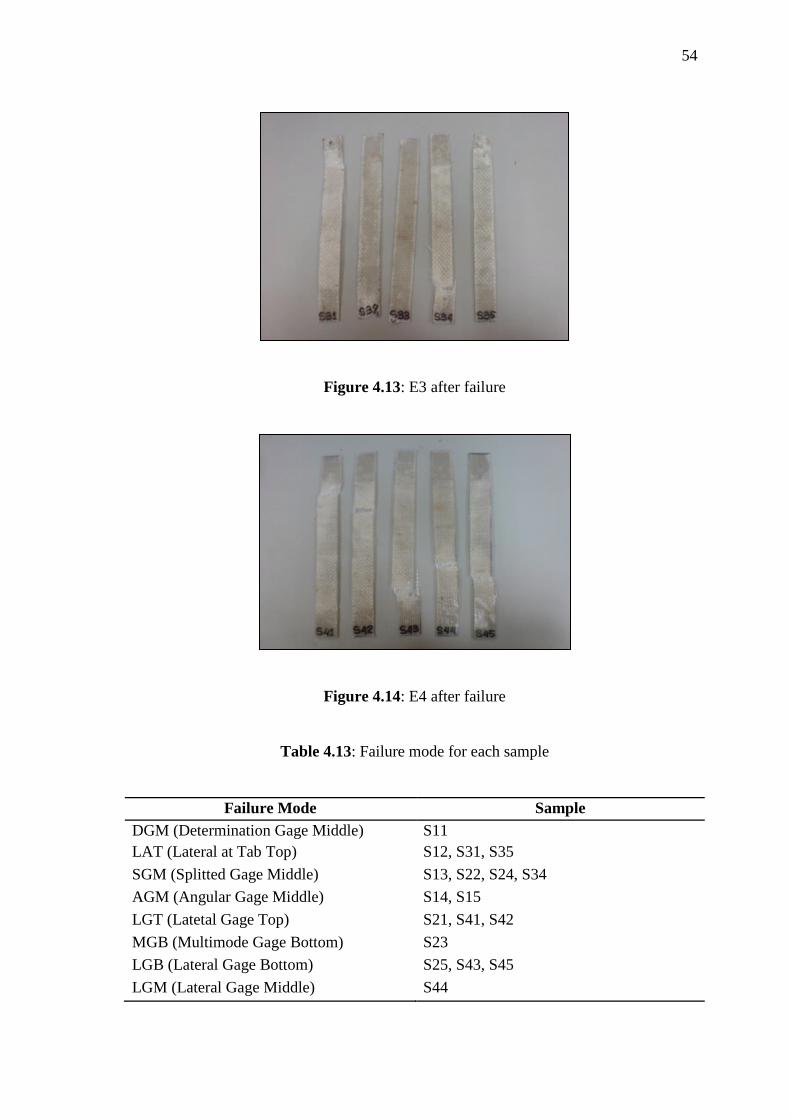
54
Figure 4.13: E3 after failure
Figure 4.14: E4 after failure
Table 4.13: Failure mode for each sample
Failure Mode Sample
DGM (Determination Gage Middle) S11
LAT (Lateral at Tab Top) S12, S31, S35
SGM (Splitted Gage Middle) S13, S22, S24, S34
AGM (Angular Gage Middle) S14, S15
LGT (Latetal Gage Top) S21, S41, S42
MGB (Multimode Gage Bottom) S23
LGB (Lateral Gage Bottom) S25, S43, S45
LGM (Lateral Gage Middle) S44
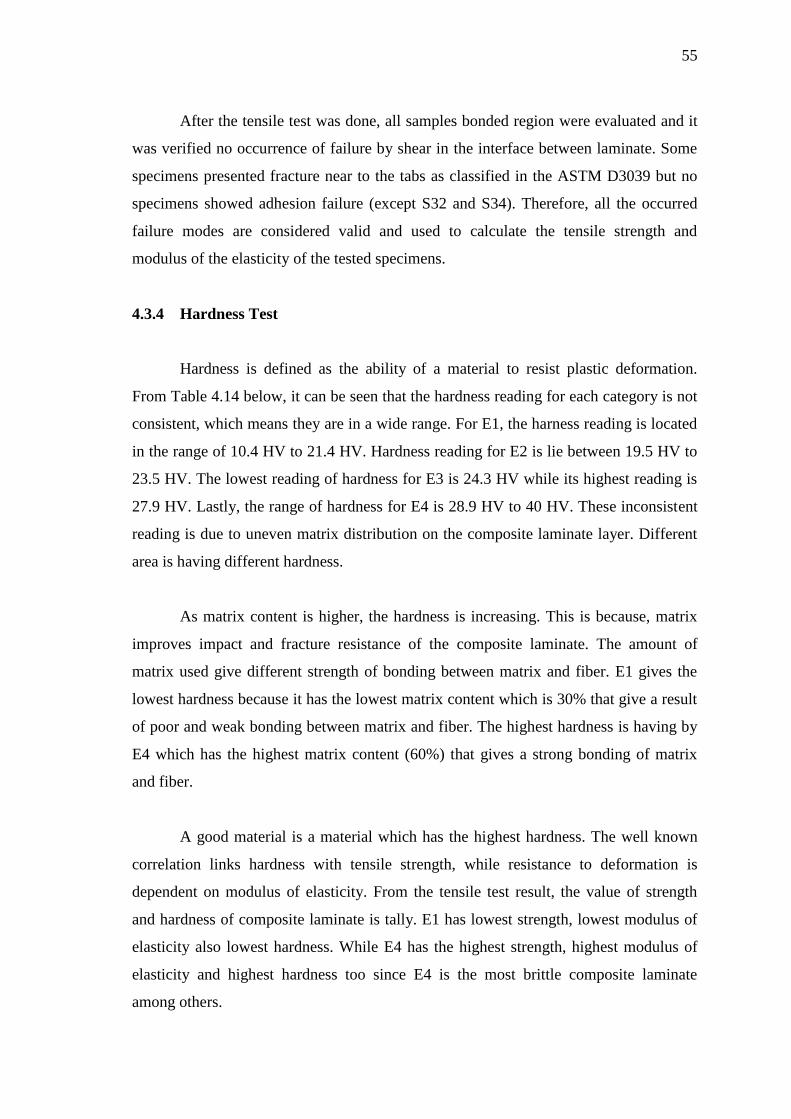
55
After the tensile test was done, all samples bonded region were evaluated and it
was verified no occurrence of failure by shear in the interface between laminate. Some
specimens presented fracture near to the tabs as classified in the ASTM D3039 but no
specimens showed adhesion failure (except S32 and S34). Therefore, all the occurred
failure modes are considered valid and used to calculate the tensile strength and
modulus of the elasticity of the tested specimens.
4.3.4 Hardness Test
Hardness is defined as the ability of a material to resist plastic deformation.
From Table 4.14 below, it can be seen that the hardness reading for each category is not
consistent, which means they are in a wide range. For E1, the harness reading is located
in the range of 10.4 HV to 21.4 HV. Hardness reading for E2 is lie between 19.5 HV to
23.5 HV. The lowest reading of hardness for E3 is 24.3 HV while its highest reading is
27.9 HV. Lastly, the range of hardness for E4 is 28.9 HV to 40 HV. These inconsistent
reading is due to uneven matrix distribution on the composite laminate layer. Different
area is having different hardness.
As matrix content is higher, the hardness is increasing. This is because, matrix
improves impact and fracture resistance of the composite laminate. The amount of
matrix used give different strength of bonding between matrix and fiber. E1 gives the
lowest hardness because it has the lowest matrix content which is 30% that give a result
of poor and weak bonding between matrix and fiber. The highest hardness is having by
E4 which has the highest matrix content (60%) that gives a strong bonding of matrix
and fiber.
A good material is a material which has the highest hardness. The well known
correlation links hardness with tensile strength, while resistance to deformation is
dependent on modulus of elasticity. From the tensile test result, the value of strength
and hardness of composite laminate is tally. E1 has lowest strength, lowest modulus of
elasticity also lowest hardness. While E4 has the highest strength, highest modulus of
elasticity and highest hardness too since E4 is the most brittle composite laminate
among others.
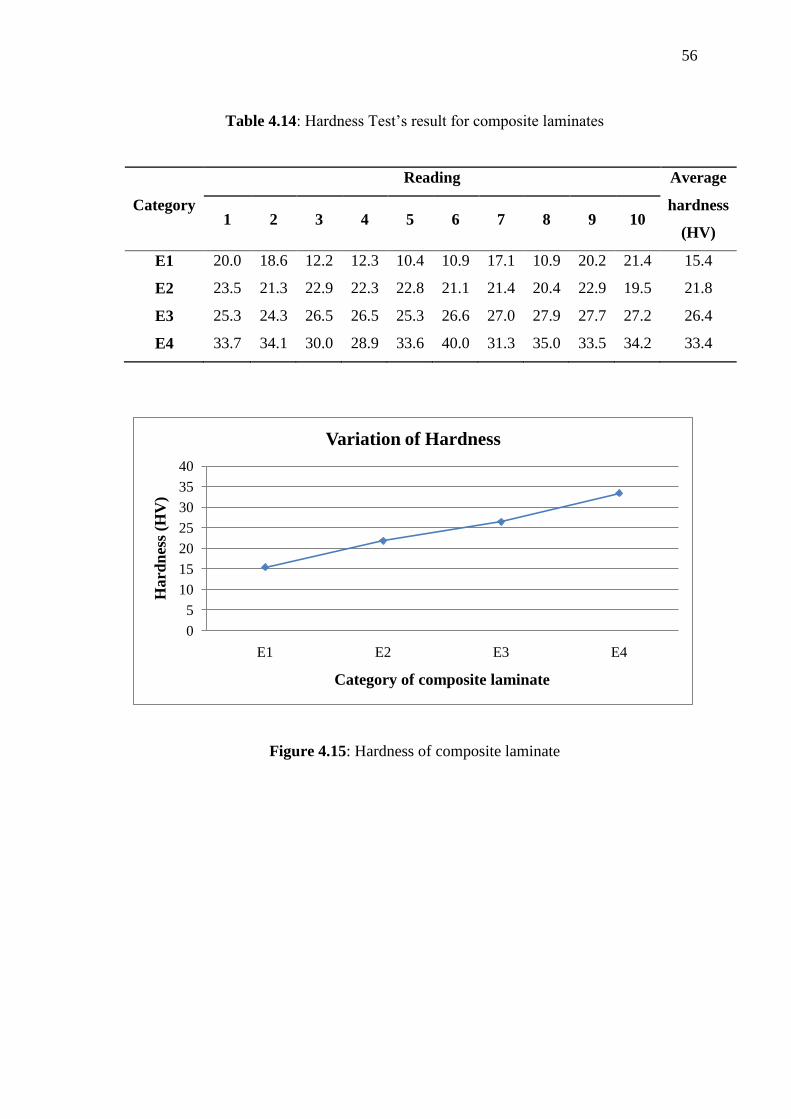
56
Table 4.14: Hardness Test’s result for composite laminates
Category
Reading Average
hardness
(HV) 1 2 3 4 5 6 7 8 9 10
E1 20.0 18.6 12.2 12.3 10.4 10.9 17.1 10.9 20.2 21.4 15.4
E2 23.5 21.3 22.9 22.3 22.8 21.1 21.4 20.4 22.9 19.5 21.8
E3 25.3 24.3 26.5 26.5 25.3 26.6 27.0 27.9 27.7 27.2 26.4
E4 33.7 34.1 30.0 28.9 33.6 40.0 31.3 35.0 33.5 34.2 33.4
Figure 4.15: Hardness of composite laminate
0
5
10
15
20
25
30
35
40
E1 E2 E3 E4
Hard
nes
s (H
V)
Category of composite laminate
Variation of Hardness
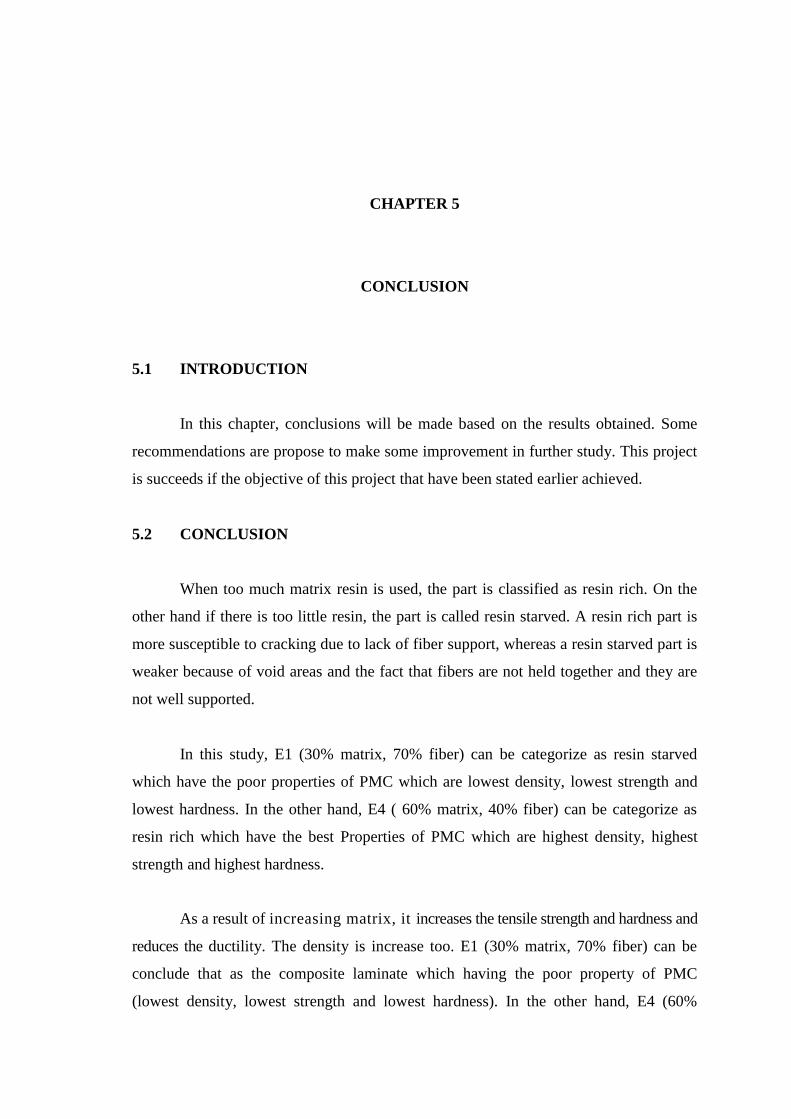
CHAPTER 5
CONCLUSION
5.1 INTRODUCTION
In this chapter, conclusions will be made based on the results obtained. Some
recommendations are propose to make some improvement in further study. This project
is succeeds if the objective of this project that have been stated earlier achieved.
5.2 CONCLUSION
When too much matrix resin is used, the part is classified as resin rich. On the
other hand if there is too little resin, the part is called resin starved. A resin rich part is
more susceptible to cracking due to lack of fiber support, whereas a resin starved part is
weaker because of void areas and the fact that fibers are not held together and they are
not well supported.
In this study, E1 (30% matrix, 70% fiber) can be categorize as resin starved
which have the poor properties of PMC which are lowest density, lowest strength and
lowest hardness. In the other hand, E4 ( 60% matrix, 40% fiber) can be categorize as
resin rich which have the best Properties of PMC which are highest density, highest
strength and highest hardness.
As a result of increasing matrix, it increases the tensile strength and hardness and
reduces the ductility. The density is increase too. E1 (30% matrix, 70% fiber) can be
conclude that as the composite laminate which having the poor property of PMC
(lowest density, lowest strength and lowest hardness). In the other hand, E4 (60%
58
matrix, 40% fiber) can be conclude that as the composite laminate which having the
best properties of PMC (highest density, highest strength and highest hardness). E4 is
recommended when the density, strength and hardness is the prime factor in design.
Thus, the final conclusion that can be made is the properties of the glass fiber
reinforced polymer composite is depends on the matrix distribution.
5.3 RECOMMENDATION
For upcoming study on this topic, some recommendation should be considered to the
better analysis and accurate result. Here are some of the recommendations for the
improvement of further study.
(i) Conduct Burn Out Test in order to obtain the actual fiber volume fraction.
Thus, the actual matrix content can be determined.
(ii) Using another type of fiberglass such as chopped strand mat or unidirectional
fiberglass to observe the matrix distribution and the result is compare with the
observation of matrix distribution on woven roving fiberglass.
(iii) Add more plies of fiberglass to investigate the properties of PMC.
(iv) Conduct Impact Test to study the brittleness of PMC with different amount of
matrix distribution.
59
REFERENCES
This guide is prepared based on the following references:
Alfredo Balacó de Morais. August-September 2001. Stress distribution along broken
fibres in polymer-matrix composites.61(11):1571-1580
A.P. Mouritz. September 2008. Tensile fatigue properties of 3D composites with
through-thickness reinforcement.68(12):2503-2510
Bank, L. C. 2006. Composites for Construction Structural Design with FRP Materials.
USA: John Wiley & Sons, Inc.
Benjamin T. 1997. Fiber Reinforced Polymer Matrix Composite Application in USA-
Faderal Highway. Washington D.C.
Bunsell, A. R., and Renard, J. 2005. Fundamentals of Fiber Reinforeced Coposite
Materials. UK: Institute of Physics Publishing Bristol and Philadelphia.
Chandler, H. 1999. Hardness Testing. 2nd
ed. USA: ASM International.
C.I. Simionescu, Viorica Rusan, Mihaela M. Macoveanu, Georgeta Cazacu, Rodica
Lipsa, Cornelia Vasile, A. Stoleriu, and Aurelia Ioanid. 1993. Lignin/epoxy
composites.48(1-4):317-323
CALCE and the University of Maryland. 2001. Material Hardness (online).
http://www.calce.umd.edu/TSFA/Hardness_ad_.htm (11 October 2010)
Chris H. L. and Donald P. 1995,1996. Elasticity and Deformation (online).
http://pages.uoregon.edu/struct/courseware/461/461_lectures/461_lecture25/461
_lecture25.html (11 October 2010)
Complore.com.2010.Properties of materials: Tensile strength (online).
http://www.complore.com/properties-materials-tensile-strength (11 October
2010)
Daniel, I. M., and Ishai, O. 2006. Engineering Mechanics of Composite Materials. 2nd
ed. USA: Oxford University Press.
Daniel Kujawski. September 1998. Width effects on the tensile strength and fatigue
behavior of angle-ply laminates.20(8):575-580
David, R. March 24, 2000. Introduction to Composite Materials. Department of
Materials Science and Engineering Massachusetts Institute of Technology
Cambridge
60
Decolon, C., 1988. Analysis of Composite Structures. London: Kogan Page Science.
Donald F. Adams. 2003. Test methods for Mechanical Properties. Chapter 5.06, Pages
113-148
F. Ellyin, and D. Kujawski. December 1995. Tensile and fatigue behaviour of
glassfibre/epoxy laminates.9(6):425-430
Farzana, H., Mehdi, H., Masami, O., and Russell E. G. Jounal of Composite Materials
2006; Review article: Polymer Matrix Nanocomposites, Processing,
Manufacturing and Application: 40: 1511
Fried, J. R. 1995. Polymer science and technology. Prentice-Hall, En-Glewoo Cliffs,
N.J 167-169
G.C. Shih, and L.J. Ebert. 1987. The effect of the fiber/matrix interface on the flexural
fatigue performance of unidirectional fiberglass composites.28(2):137-161
G. Ziegler, I. Richter, and D. Suttor. April 1999. Fiber-reinforced composites with
polymer-derived matrix: processing, matrix formation and properties.30(4):411-
417
Gay, D., and Hoa, S. V. 2007. Composite Materials Design and Applications. 2nd
ed.
USA: CRC Press.
Gdoutos, E. E., Pilakoutas, K., and Rodopoulos, C. A. 2000. Failure Analysis of
Industria Composite Materials. USA: McGraw-Hill.
George, A., Matzkanin, H., and Thomas, Y. Techniques for the Nondestructive
Evaluation of Polymer Matrix Composite. Rome, NY .The AMMTIAC
Quarterly, 2(4)
Gerstle, F.P. 1991. Composites, Encyclopedia of Polymer Science and Engineering,
New York: Wiley
Gowthaman, S., Kunigal N., and Shivakumar. 2008. Evaluation of Specific Properties
of Glass and Carbon/Vinyl Ester Composites. Composites: Part B 39:27–35
Gray, G., and Savage, G. M. September 1989. Advanced Thermoplastic Composite
Materials, Metals and Materials, Vol. 5: 513
Grellmann, W., and Seidler, S. 2007. Polymer Testing. Germany: Carl Hanser Verlag.
Halpin, J. C., and Kardos, J.L. May 1976. Polymer Engineering and Science, Vol.
16:344-352
Integrated Publishing. Typical Brittle Material Stress-Strain Curve (online).
http://www.tpub.com/content/doe/h1017v1/css/h1017v1_70.htm (11 October
2010)
61
Jane M. F. P., Sérgio, M., and Mirabel, C. R. Comparison of Tensile Strength of
Different CarbonFabric Reinforced Epoxy Composites
Jerry Ballard. 1997. Brittle Fracture (online).
http://www.eng.vt.edu/eng/materials/classes/MSE2094_NoteBook/97ClassProj/
exper/ballard/www/ballard.html (11 October 2010)
Malaysian Polymer Journal. 2009. Vol 4(1):19-29
May, C. A. and Tanaka, Y. 1973. Epoxy Resins, Chemistry and Technology. New York:
Marcel Dekker,
N. Himmel. February-April 2002. Fatigue life prediction of laminated polymer matrix
composites.24(2-4):349-360
N.K. Naik, Addis Asmelash, Venkateswara Rao Kavala, and Veerraju Ch. December
2007. Interlaminar shear properties of polymer matrix composites: Strain rate
effect.39(12):1043-1052
NTD Resource Center. Tensile Properties (online).
http://www.ndted.org/EducationResources/CommunityCollege/Materials/Mech
anical/Tensile.htm (11 October 2010)
P.T. Curtis. September 1991. Tensile fatigue mechanisms in unidirectional polymer
matrix composite materials.13(5):377-382
P. J. Callus, A. P. Mouritz, M. K. Bannister, and K. H. Leong. November 1999. Tensile
properties and failure mechanisms of 3D woven GRP composites. 30(11):1277-
1287
R.G. Hamilton, and C.A. Berg. January 1973. Fracture mechanics of fibreglass
laminates. 6(1):55-78
Santulli, C. A. Comparative Study on Falling Weight Impact Properties of Jute/Epoxy
and Hemp/Epoxy Laminates. Italy.
Schechter et al. 1956. Industrial and Engineering Chemistry, 48(1):94 -97
Sirajus Salekeen, and Douglas L. Jones. June 2007. Fatigue response of thick section
fiberglass/epoxy composites.79(1):119-124
Srinivasa D. Thoppul, Joana Finegan, and Ronald F. Gibson. March 2009. Mechanics of
mechanically fastened joints in polymer–matrix composite structures – A
review.69(3-4):301-329
Srinivasan, A. T., Kunigal, and S., Arun, S. 2008. Mechanical Behavior and Damage
Evolutionin E-glass Vinyl Ester and Carbon Composites Subjected to Static and
Blast Load.Composites: Part B 39: 57–65

APPENDIX A
A1 GANTT CHART FYP 1
A2 GANTT CHART FYP 2
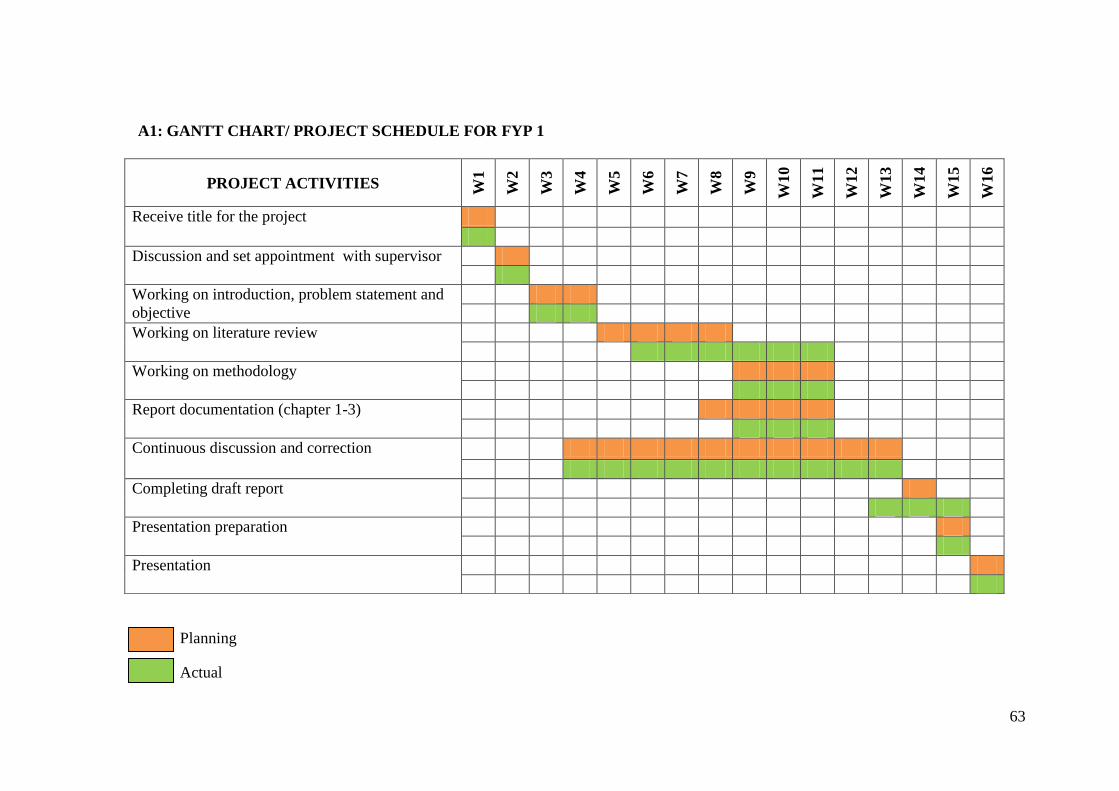
63
Planning
Actual
PROJECT ACTIVITIES W1
W2
W3
W4
W5
W6
W7
W8
W9
W10
W11
W12
W13
W14
W15
W16
Receive title for the project
Discussion and set appointment with supervisor
Working on introduction, problem statement and
objective
Working on literature review
Working on methodology
Report documentation (chapter 1-3)
Continuous discussion and correction
Completing draft report
Presentation preparation
Presentation
A1: GANTT CHART/ PROJECT SCHEDULE FOR FYP 1
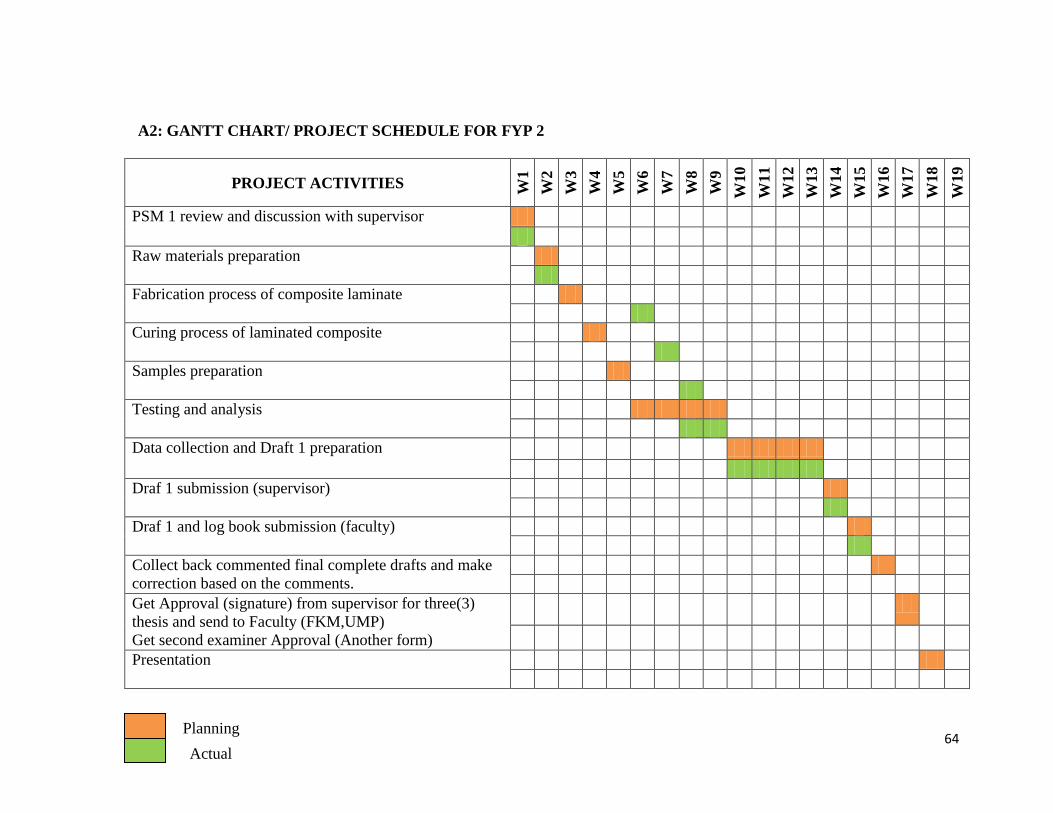
64
PROJECT ACTIVITIES W1
W2
W3
W4
W5
W6
W7
W8
W9
W10
W11
W12
W13
W14
W15
W16
W17
W18
W19
PSM 1 review and discussion with supervisor
Raw materials preparation
Fabrication process of composite laminate
Curing process of laminated composite
Samples preparation
Testing and analysis
Data collection and Draft 1 preparation
Draf 1 submission (supervisor)
Draf 1 and log book submission (faculty)
Collect back commented final complete drafts and make
correction based on the comments.
Get Approval (signature) from supervisor for three(3)
thesis and send to Faculty (FKM,UMP)
Get second examiner Approval (Another form)
Presentation
A2: GANTT CHART/ PROJECT SCHEDULE FOR FYP 2
Planning
Actual
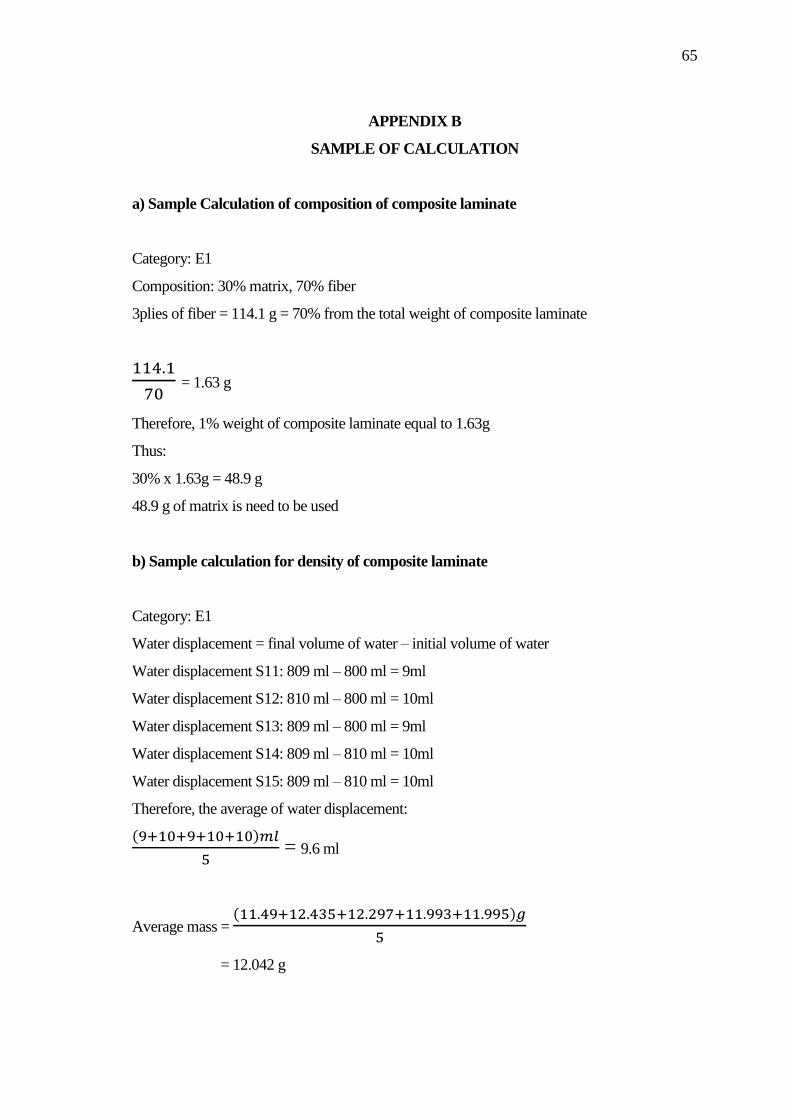
65
APPENDIX B
SAMPLE OF CALCULATION
a) Sample Calculation of composition of composite laminate
Category: E1
Composition: 30% matrix, 70% fiber
3plies of fiber = 114.1 g = 70% from the total weight of composite laminate
= 1.63 g
Therefore, 1% weight of composite laminate equal to 1.63g
Thus:
30% x 1.63g = 48.9 g
48.9 g of matrix is need to be used
b) Sample calculation for density of composite laminate
Category: E1
Water displacement = final volume of water – initial volume of water
Water displacement S11: 809 ml – 800 ml = 9ml
Water displacement S12: 810 ml – 800 ml = 10ml
Water displacement S13: 809 ml – 800 ml = 9ml
Water displacement S14: 809 ml – 810 ml = 10ml
Water displacement S15: 809 ml – 810 ml = 10ml
Therefore, the average of water displacement:
= 9.6 ml
Average mass =
= 12.042 g

66
Formula of density, ρ =
ρ =
ρ = 1.254 g/ml @ 1.254 g/cm3
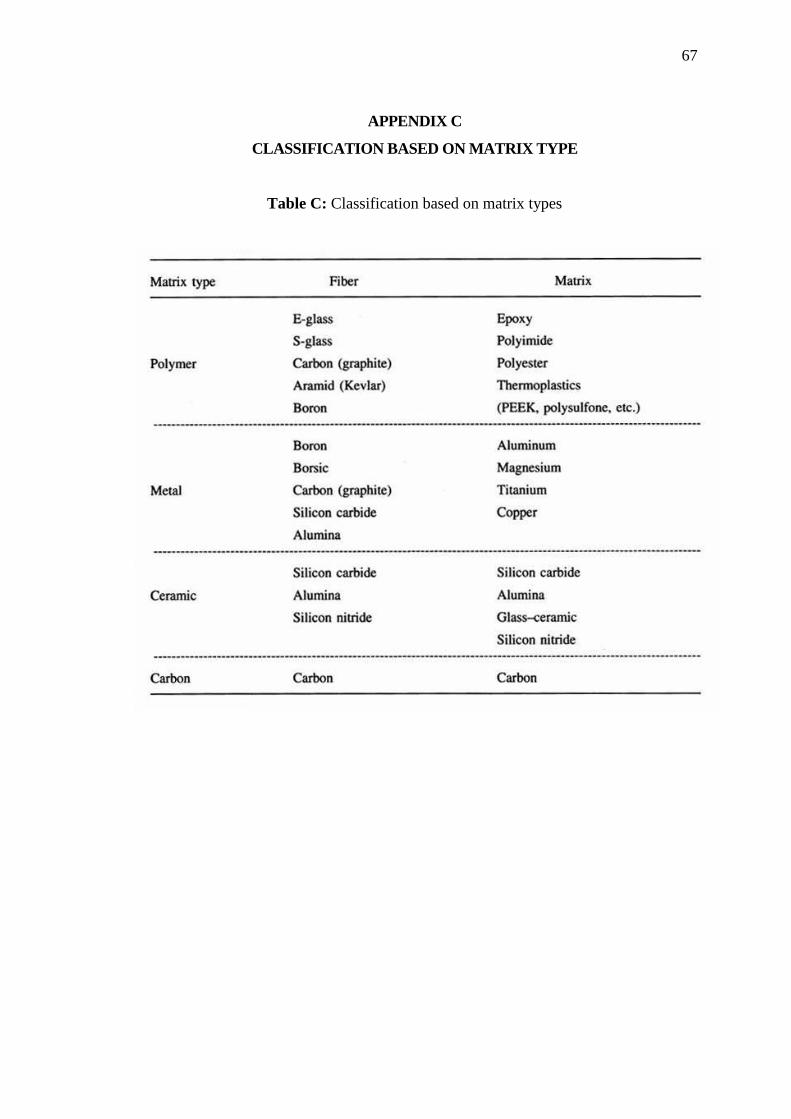
67
APPENDIX C
CLASSIFICATION BASED ON MATRIX TYPE
Table C: Classification based on matrix types
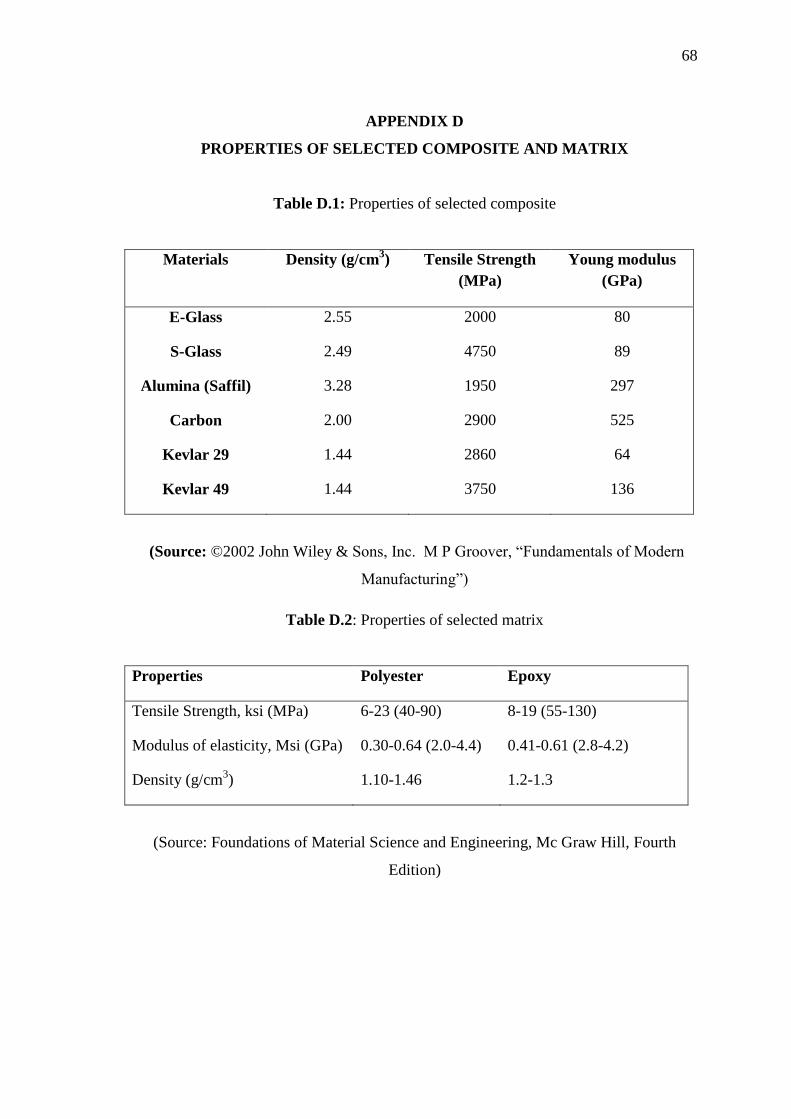
68
APPENDIX D
PROPERTIES OF SELECTED COMPOSITE AND MATRIX
Table D.1: Properties of selected composite
Materials Density (g/cm3) Tensile Strength
(MPa)
Young modulus
(GPa)
E-Glass
S-Glass
Alumina (Saffil)
Carbon
Kevlar 29
Kevlar 49
2.55
2.49
3.28
2.00
1.44
1.44
2000
4750
1950
2900
2860
3750
80
89
297
525
64
136
(Source: ©2002 John Wiley & Sons, Inc. M P Groover, “Fundamentals of Modern
Manufacturing”)
Table D.2: Properties of selected matrix
Properties Polyester Epoxy
Tensile Strength, ksi (MPa)
Modulus of elasticity, Msi (GPa)
Density (g/cm3)
6-23 (40-90)
0.30-0.64 (2.0-4.4)
1.10-1.46
8-19 (55-130)
0.41-0.61 (2.8-4.2)
1.2-1.3
(Source: Foundations of Material Science and Engineering, Mc Graw Hill, Fourth
Edition)
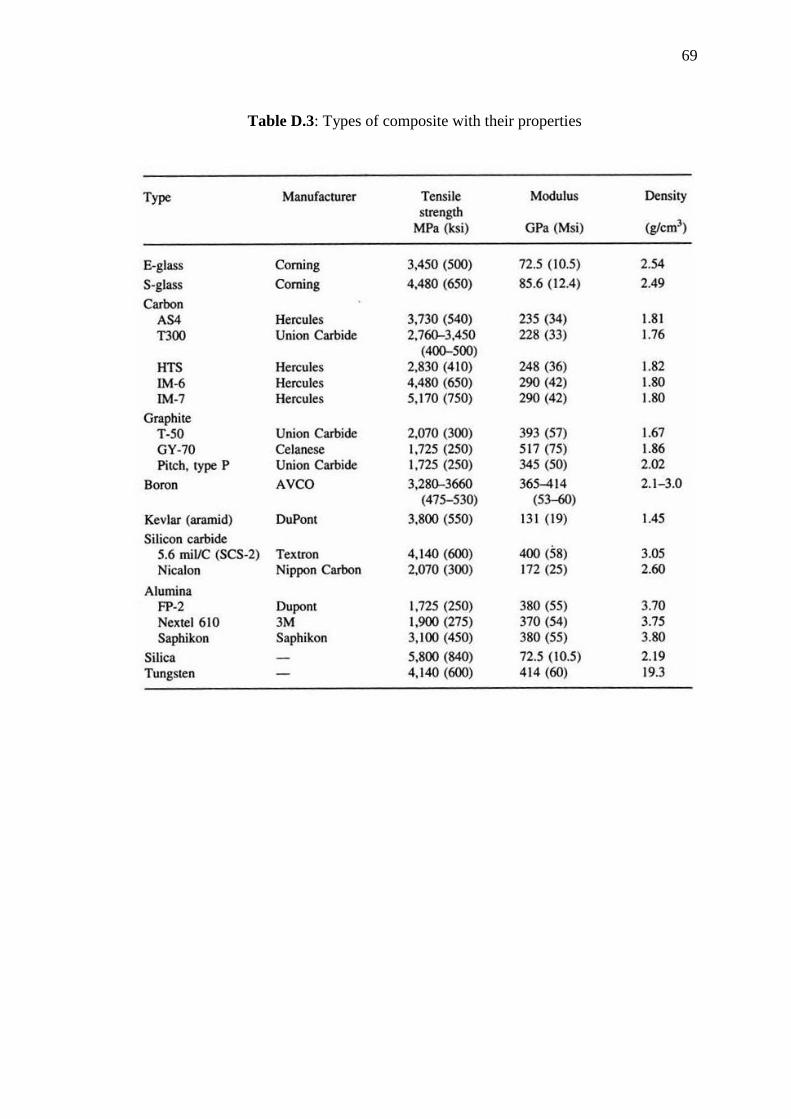
69
Table D.3: Types of composite with their properties
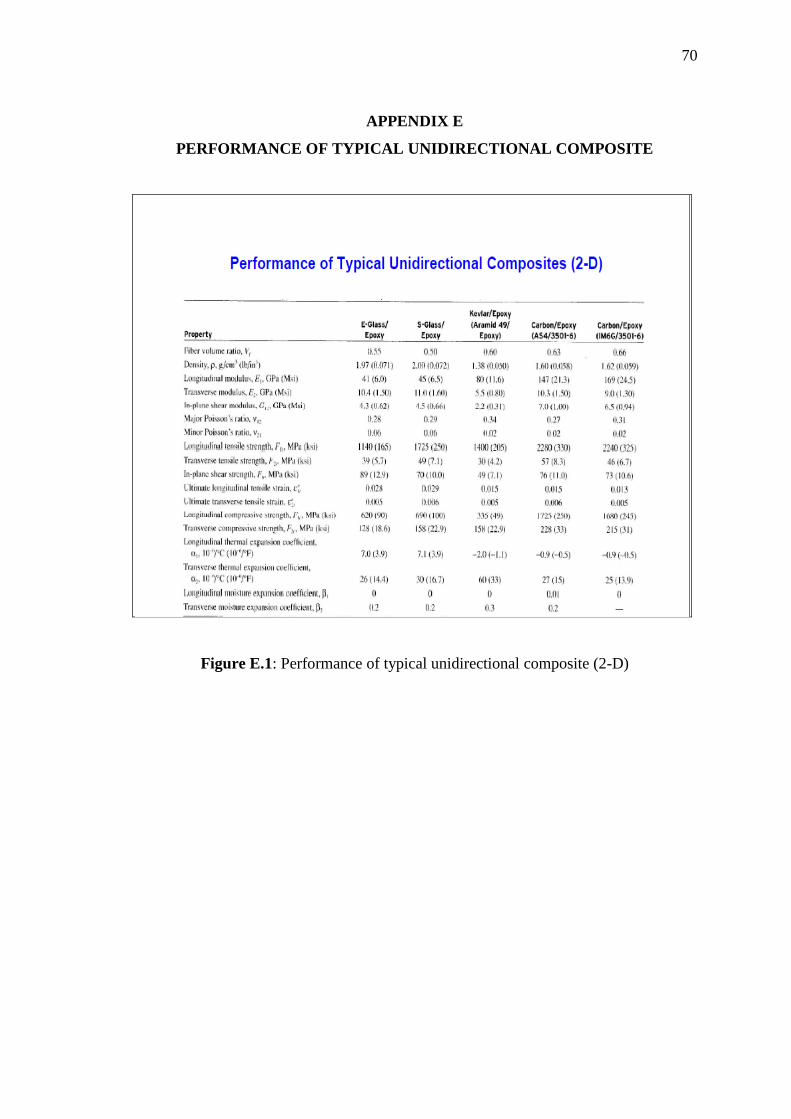
70
APPENDIX E
PERFORMANCE OF TYPICAL UNIDIRECTIONAL COMPOSITE
Figure E.1: Performance of typical unidirectional composite (2-D)
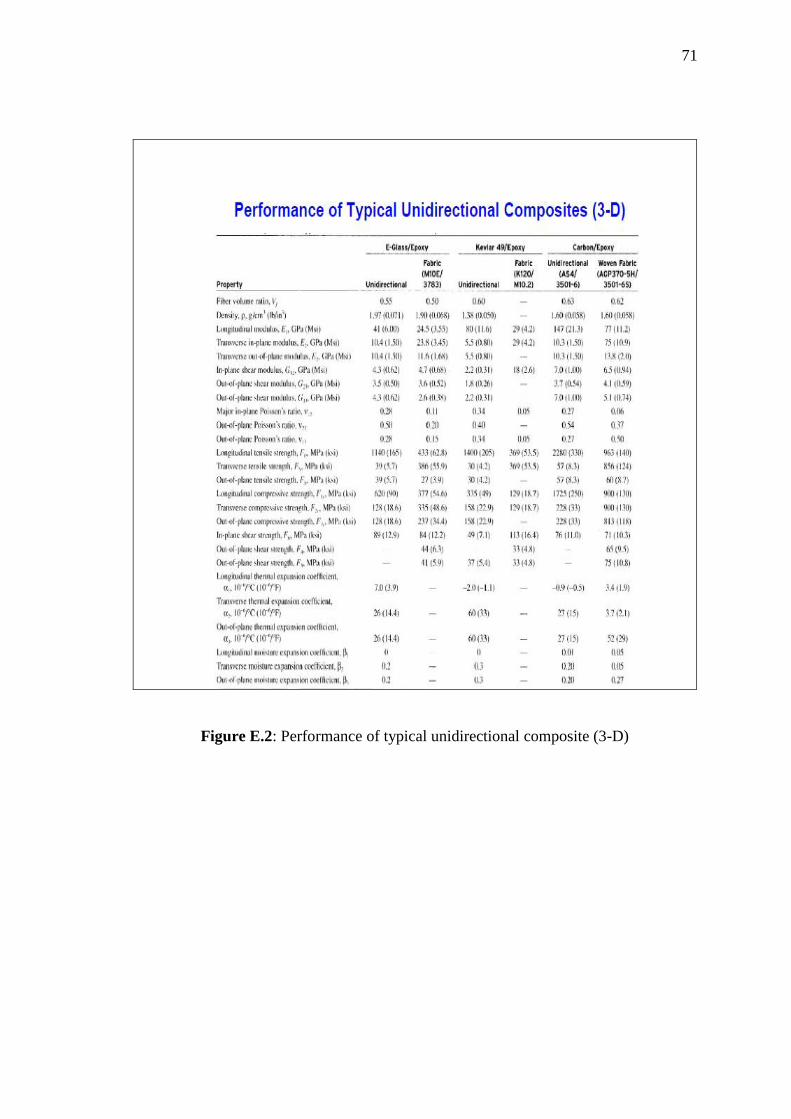
71
Figure E.2: Performance of typical unidirectional composite (3-D)
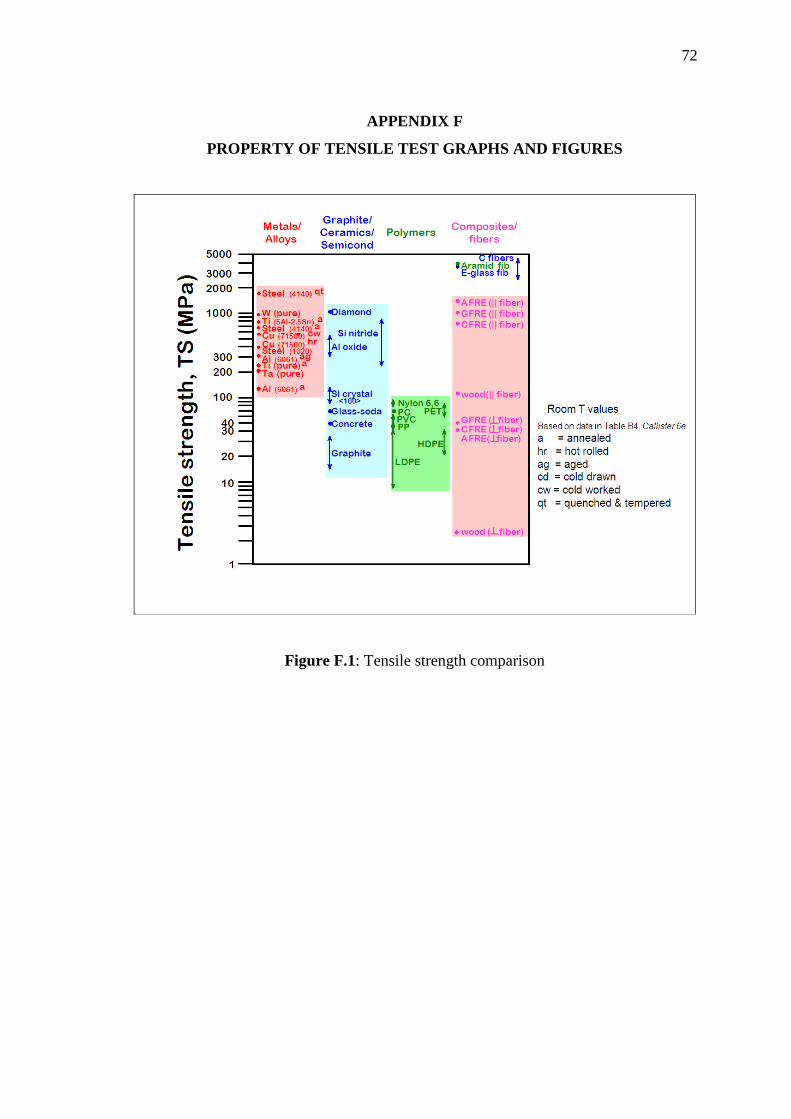
72
APPENDIX F
PROPERTY OF TENSILE TEST GRAPHS AND FIGURES
Figure F.1: Tensile strength comparison
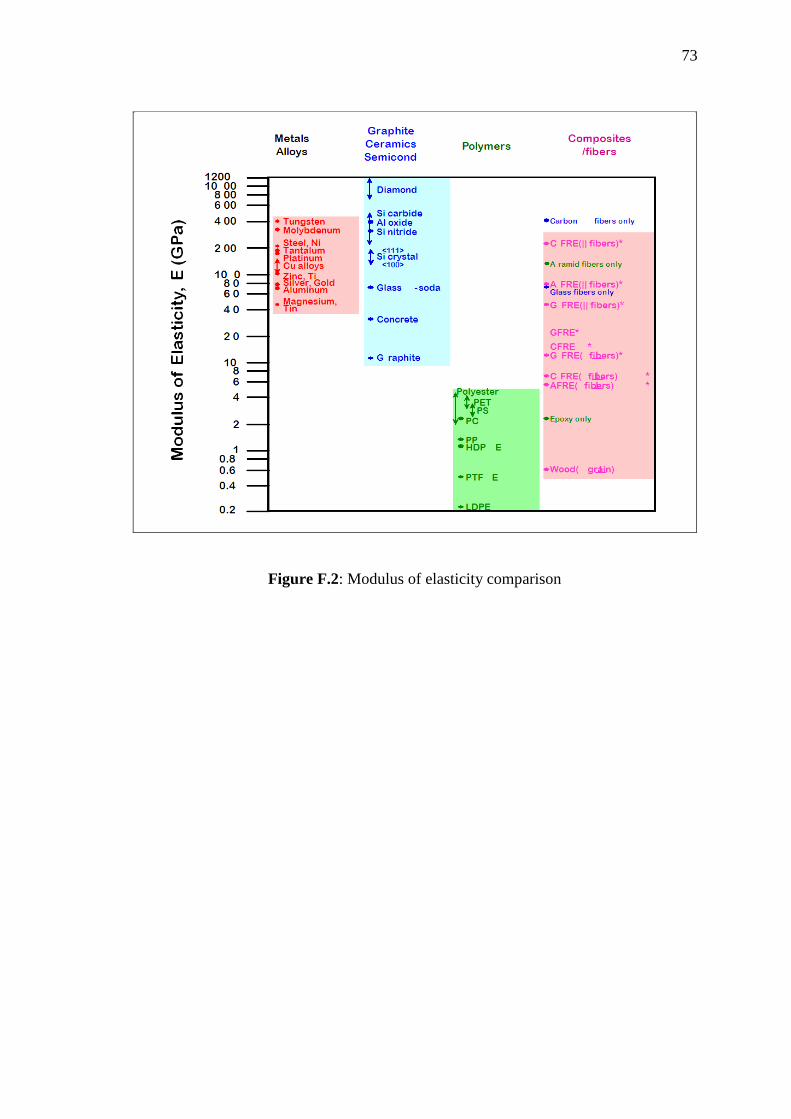
73
Figure F.2: Modulus of elasticity comparison
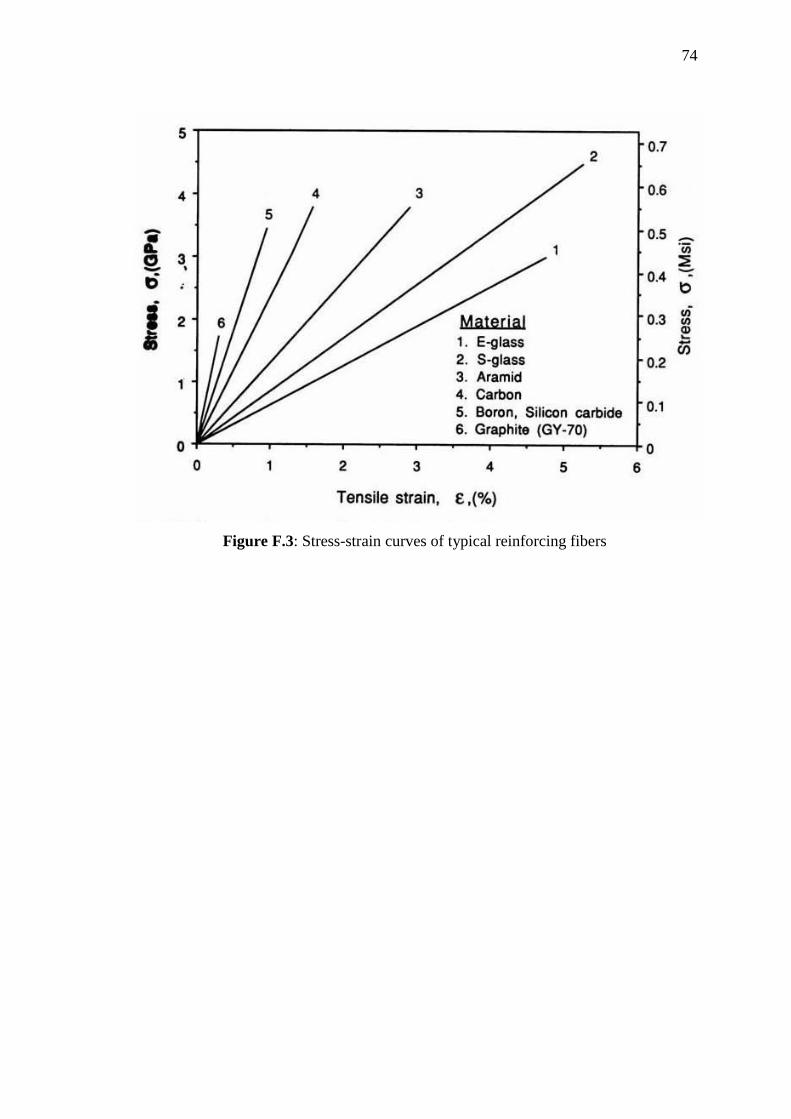
74
Figure F.3: Stress-strain curves of typical reinforcing fibers
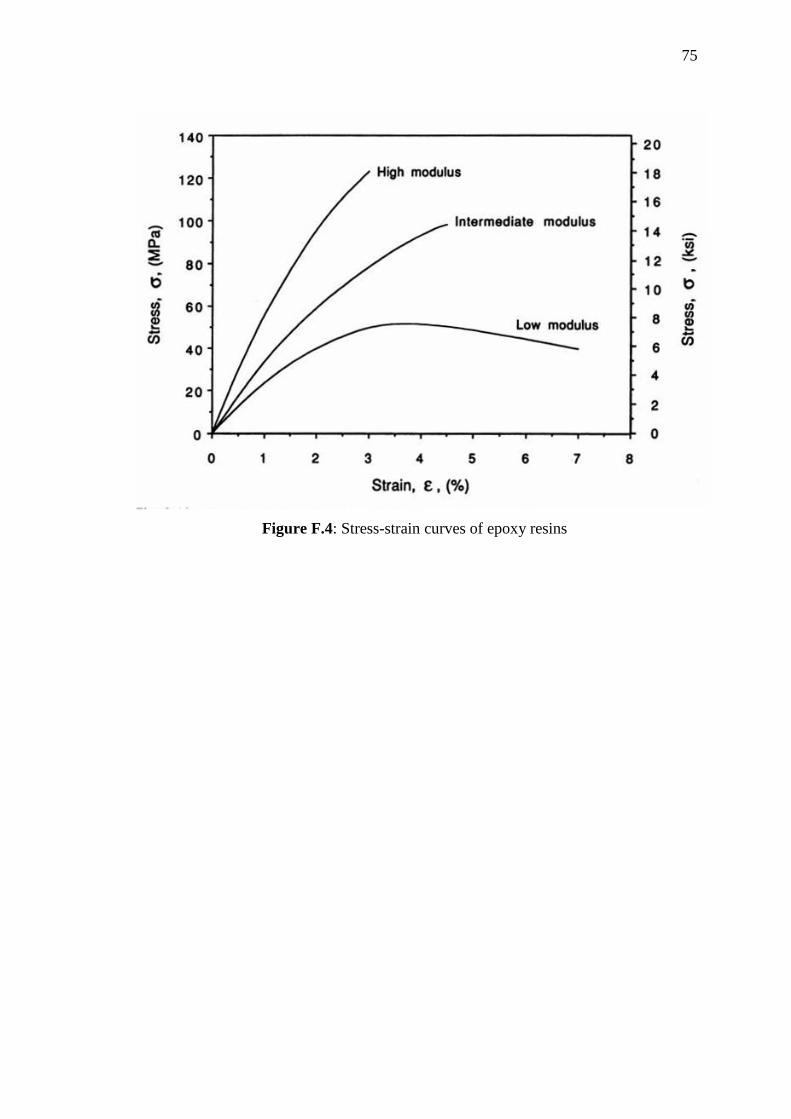
75
Figure F.4: Stress-strain curves of epoxy resins
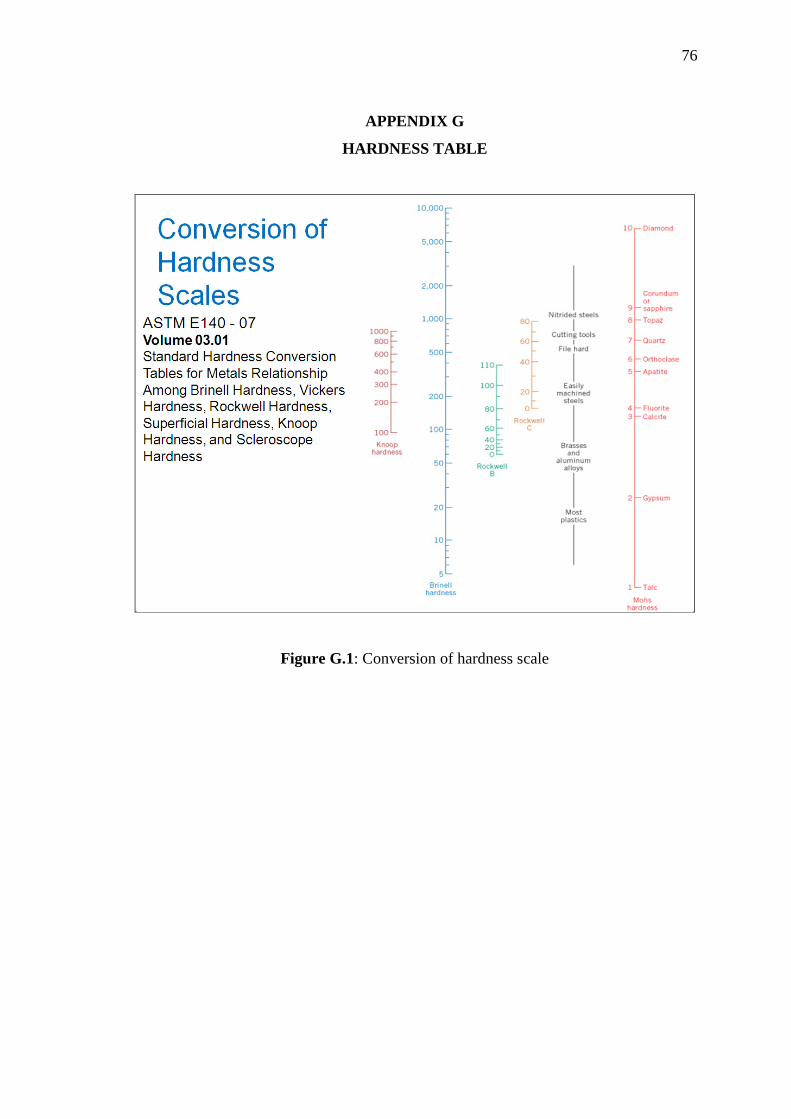
76
APPENDIX G
HARDNESS TABLE
Figure G.1: Conversion of hardness scale
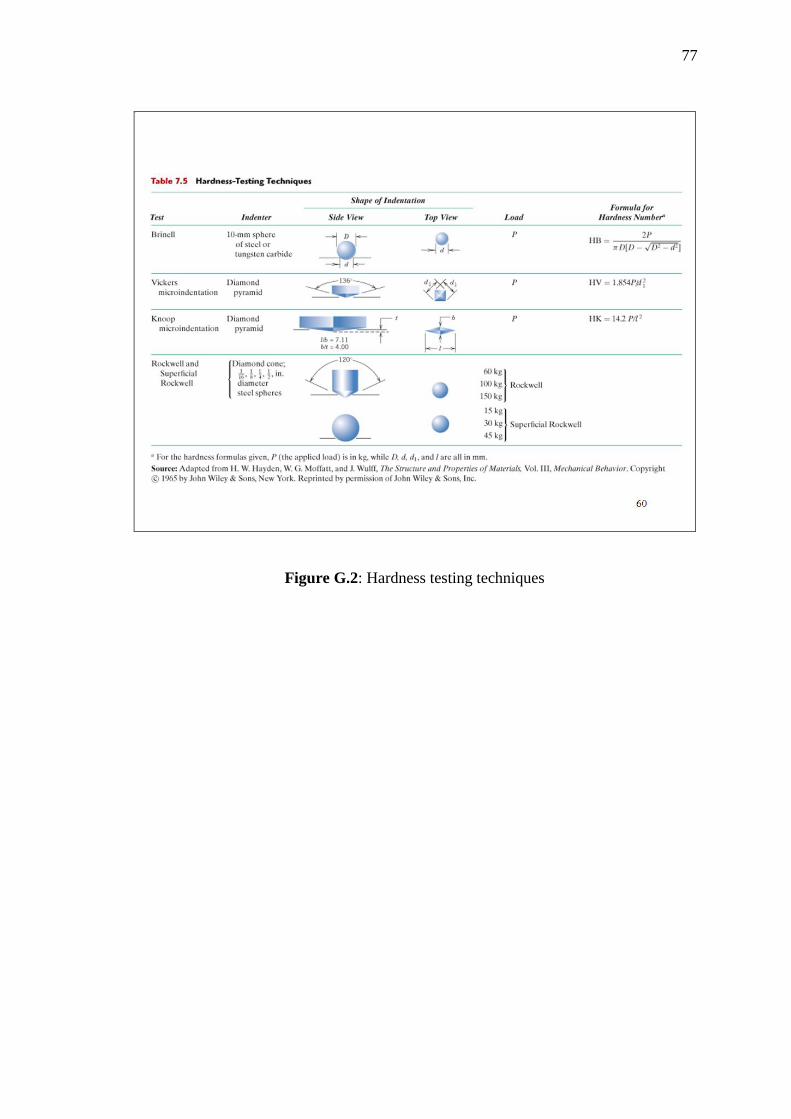
77
Figure G.2: Hardness testing techniques
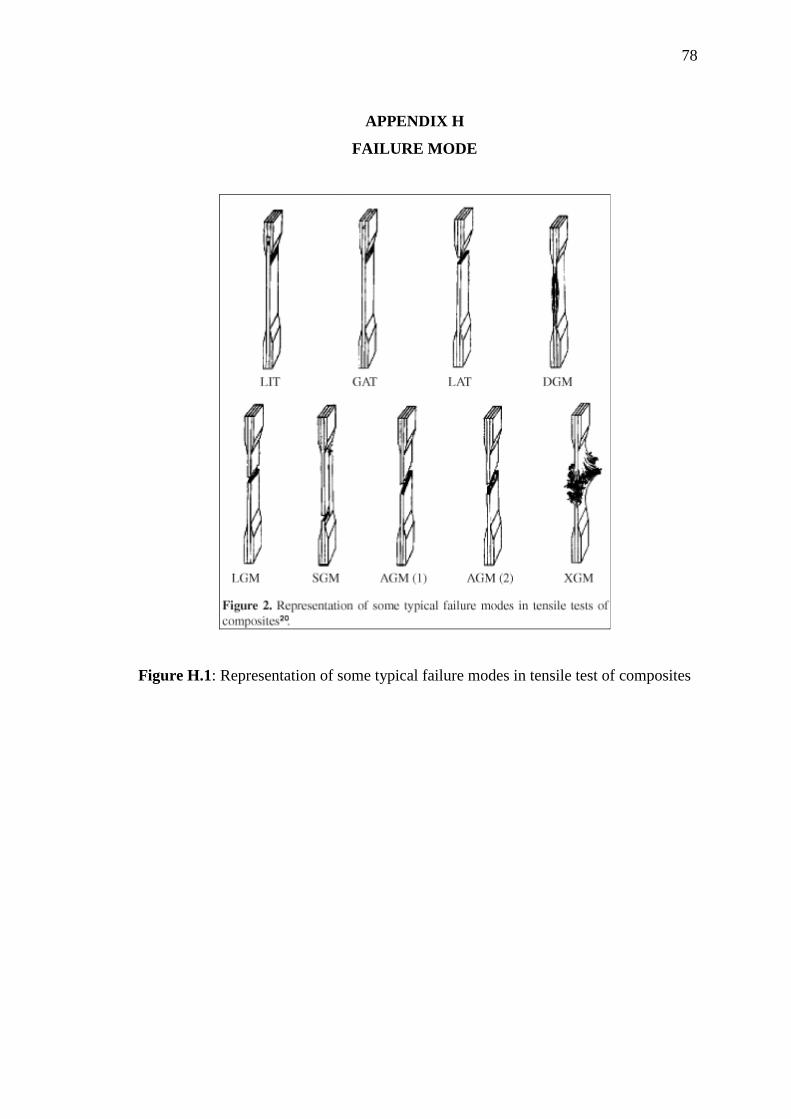
78
APPENDIX H
FAILURE MODE
Figure H.1: Representation of some typical failure modes in tensile test of composites
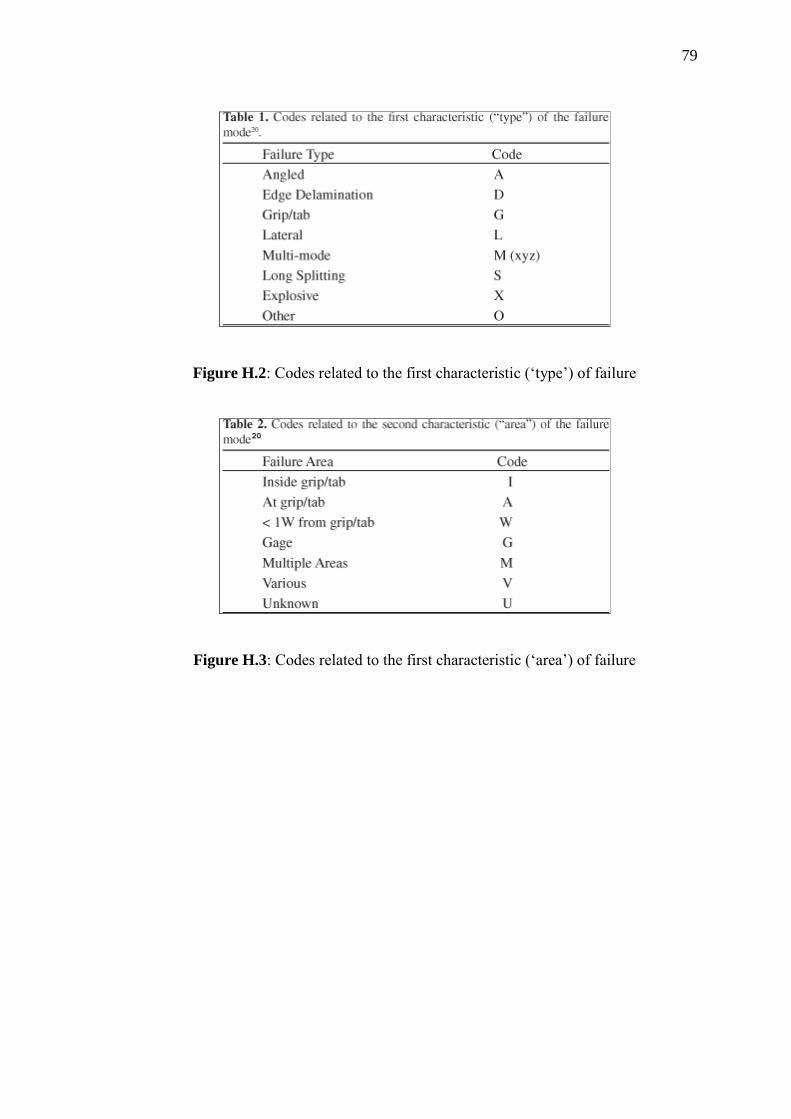
79
Figure H.2: Codes related to the first characteristic („type‟) of failure
Figure H.3: Codes related to the first characteristic („area‟) of failure
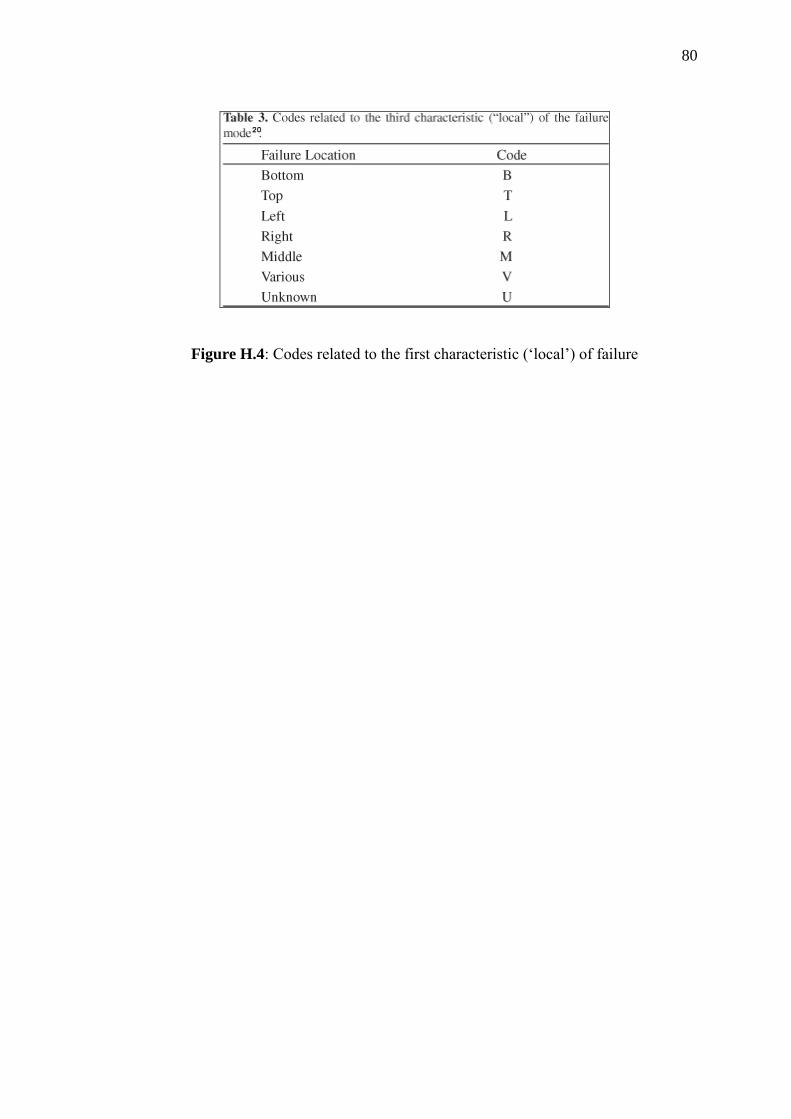
80
Figure H.4: Codes related to the first characteristic („local‟) of failure
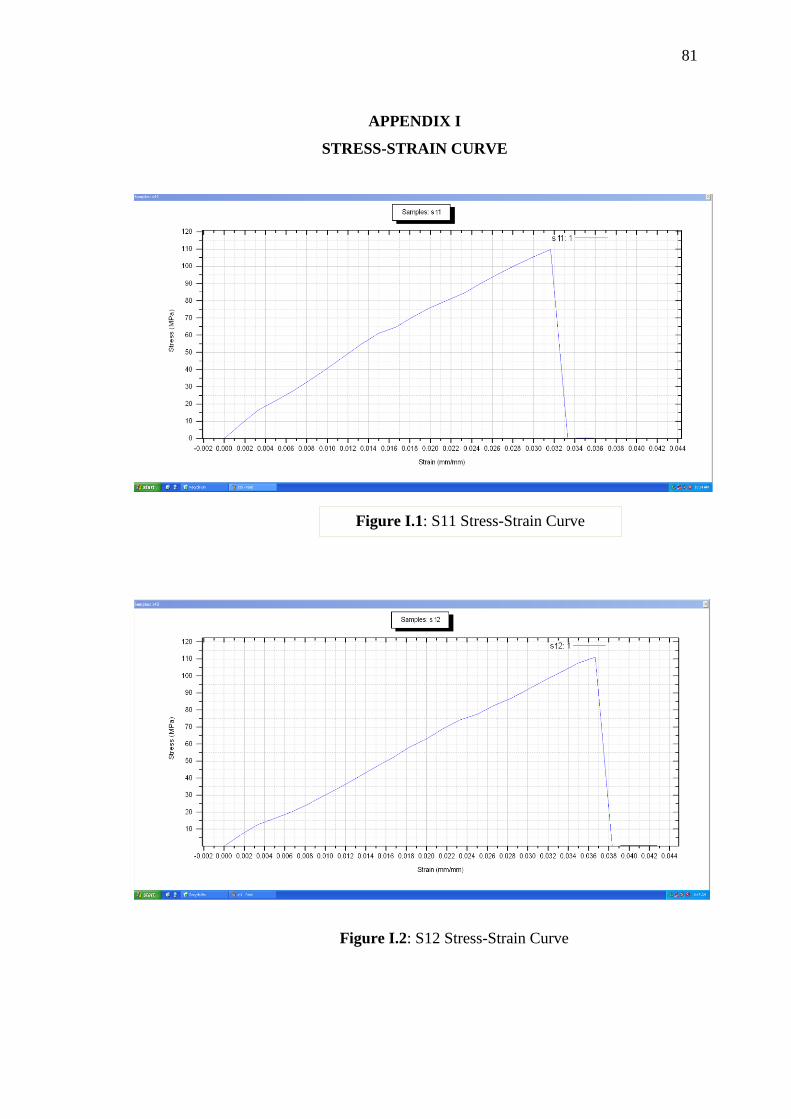
81
APPENDIX I
STRESS-STRAIN CURVE
Figure I.1: S11 Stress-Strain Curve
Figure I.2: S12 Stress-Strain Curve
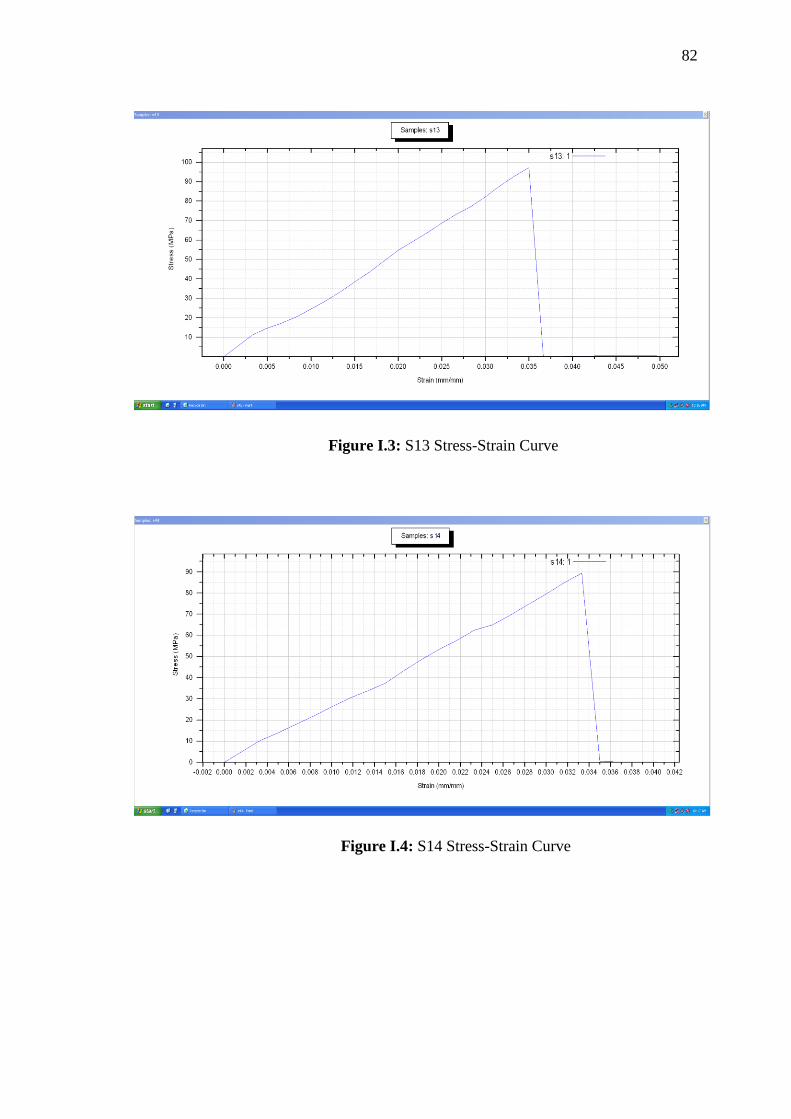
82
Figure I.3: S13 Stress-Strain Curve
Figure I.4: S14 Stress-Strain Curve
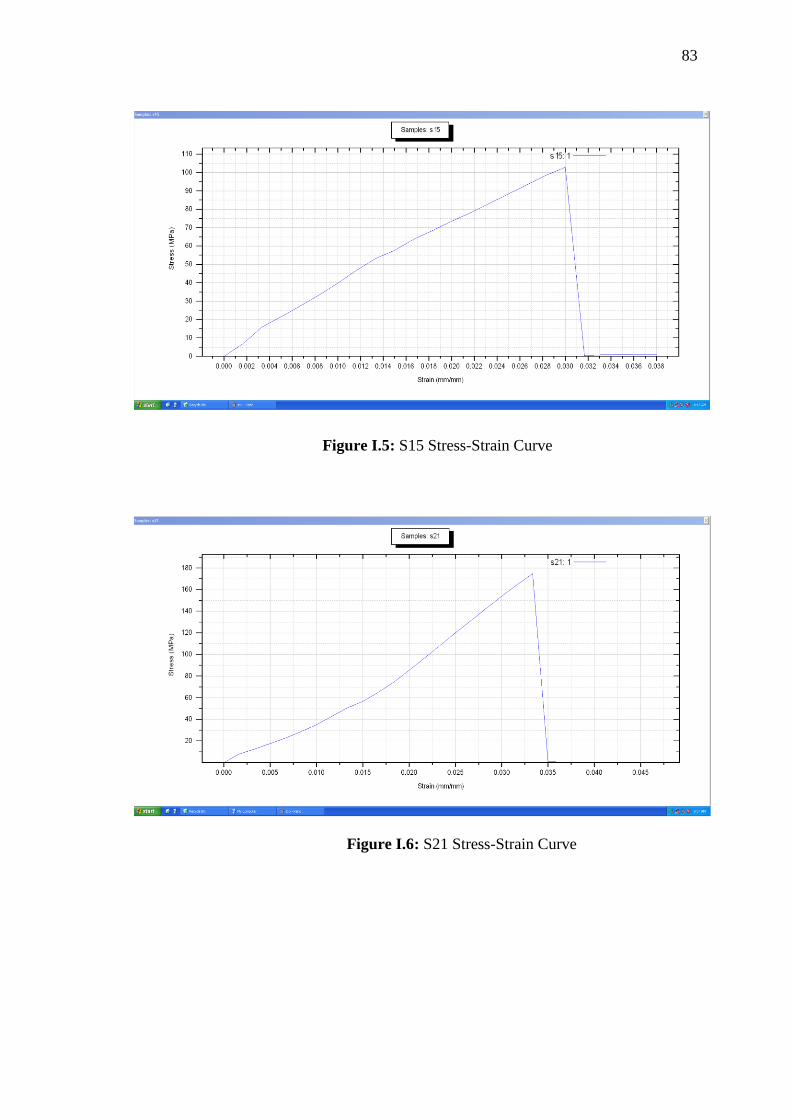
83
Figure I.5: S15 Stress-Strain Curve
Figure I.6: S21 Stress-Strain Curve
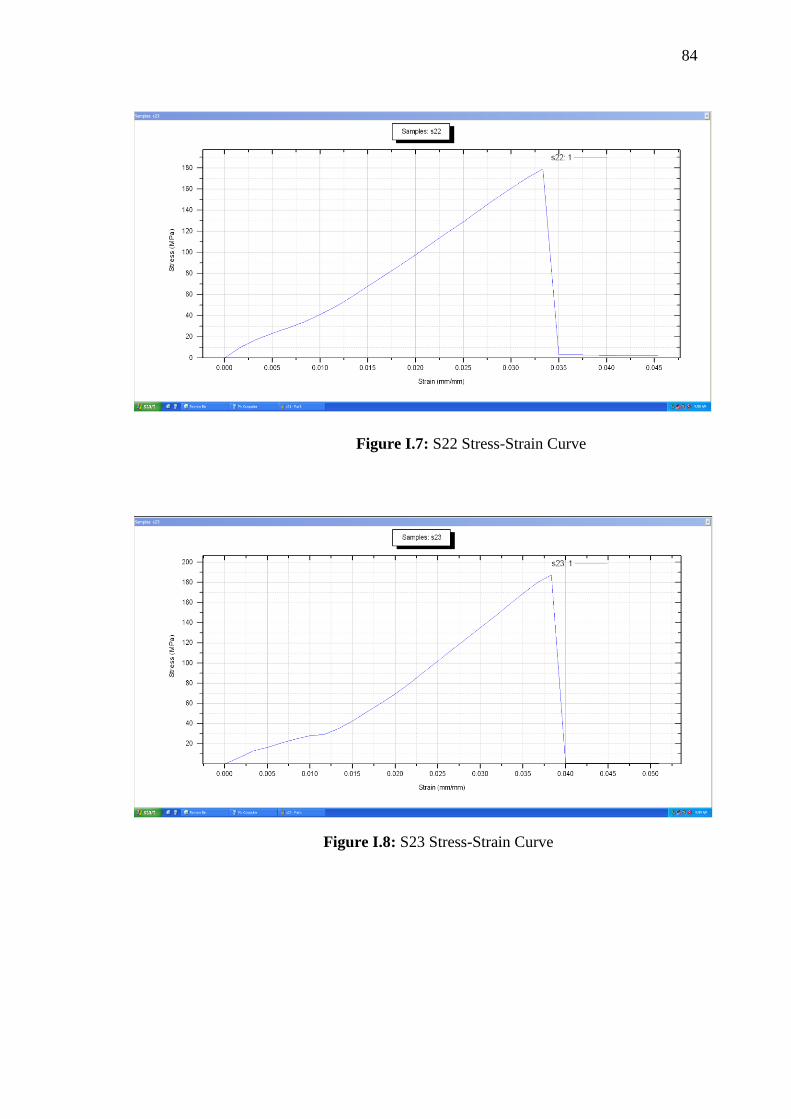
84
Figure I.7: S22 Stress-Strain Curve
Figure I.8: S23 Stress-Strain Curve
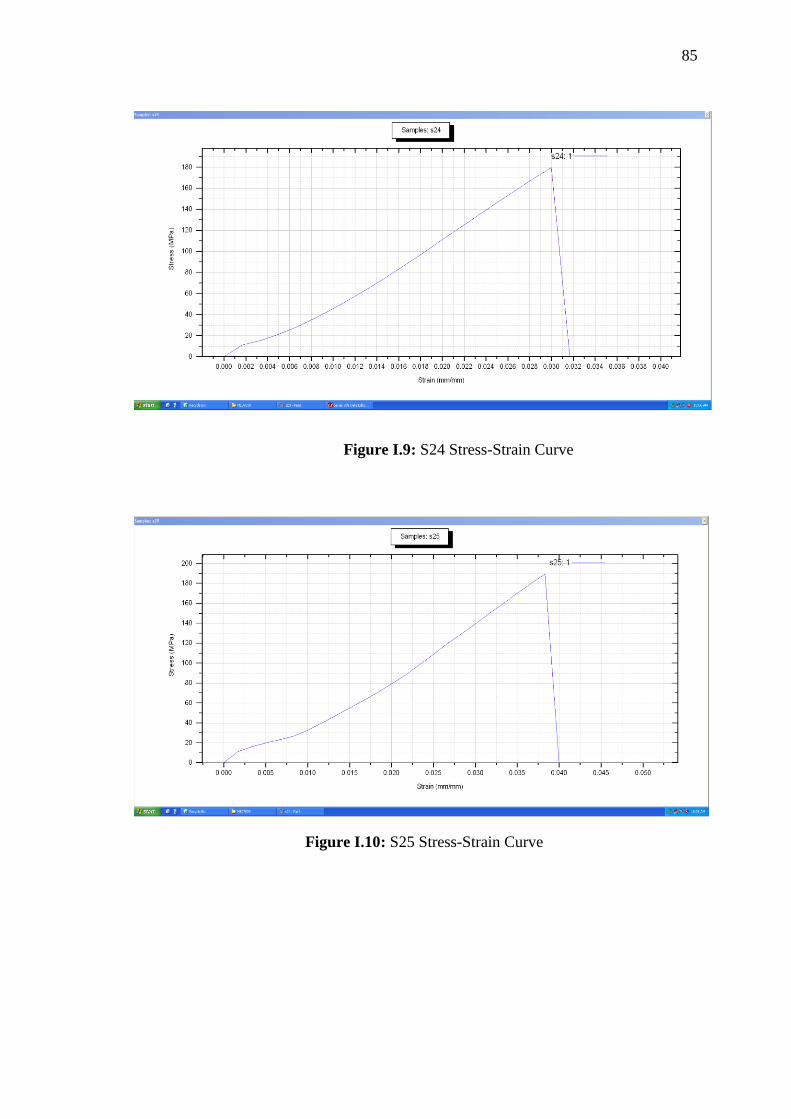
85
Figure I.9: S24 Stress-Strain Curve
Figure I.10: S25 Stress-Strain Curve
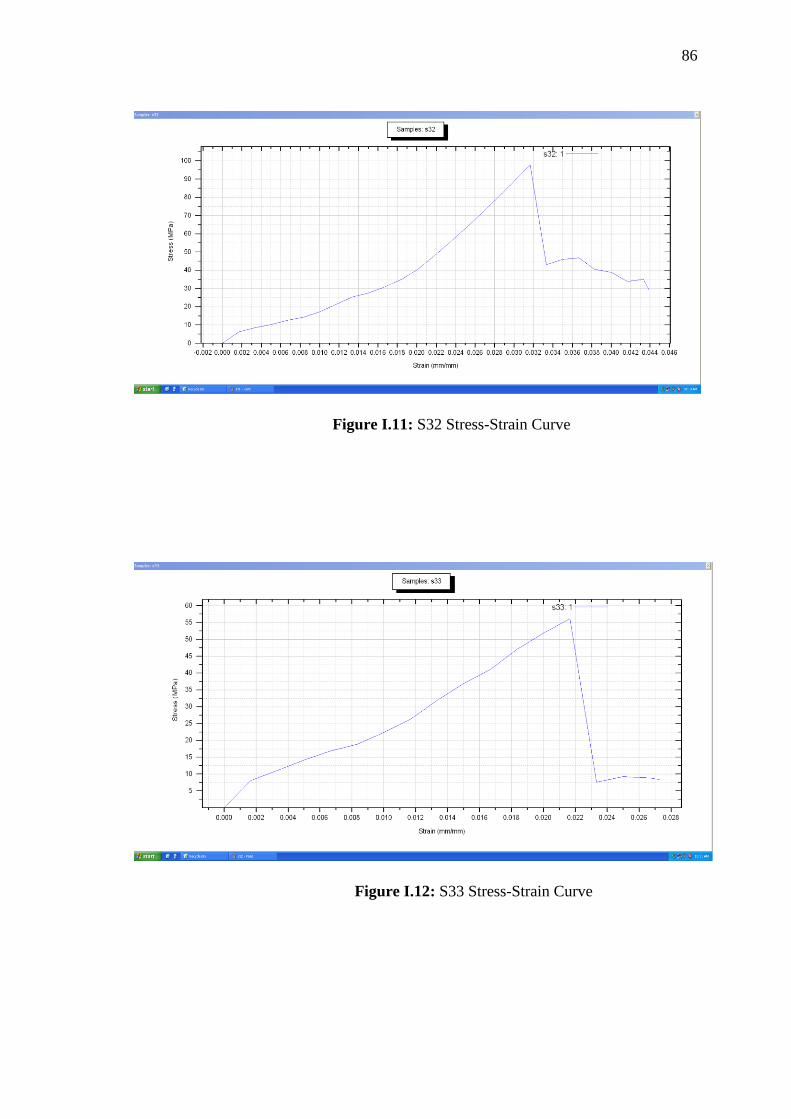
86
Figure I.12: S33 Stress-Strain Curve
Figure I.11: S32 Stress-Strain Curve
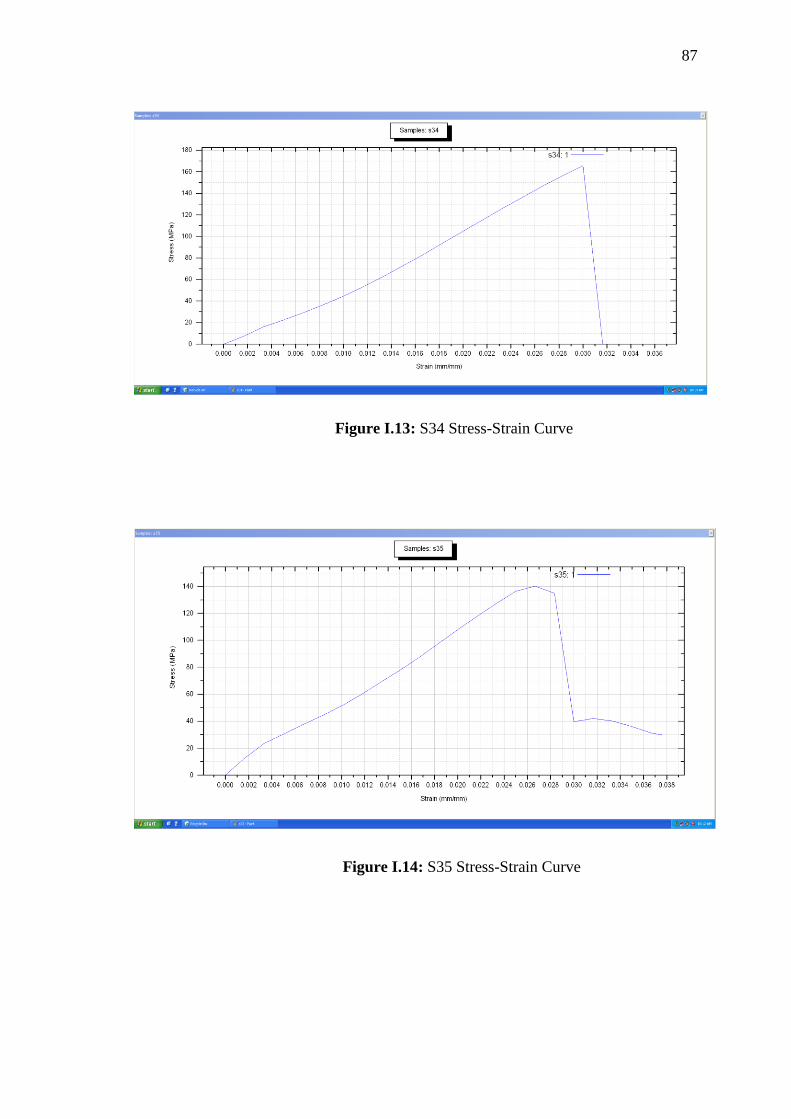
87
Figure I.14: S35 Stress-Strain Curve
Figure I.13: S34 Stress-Strain Curve
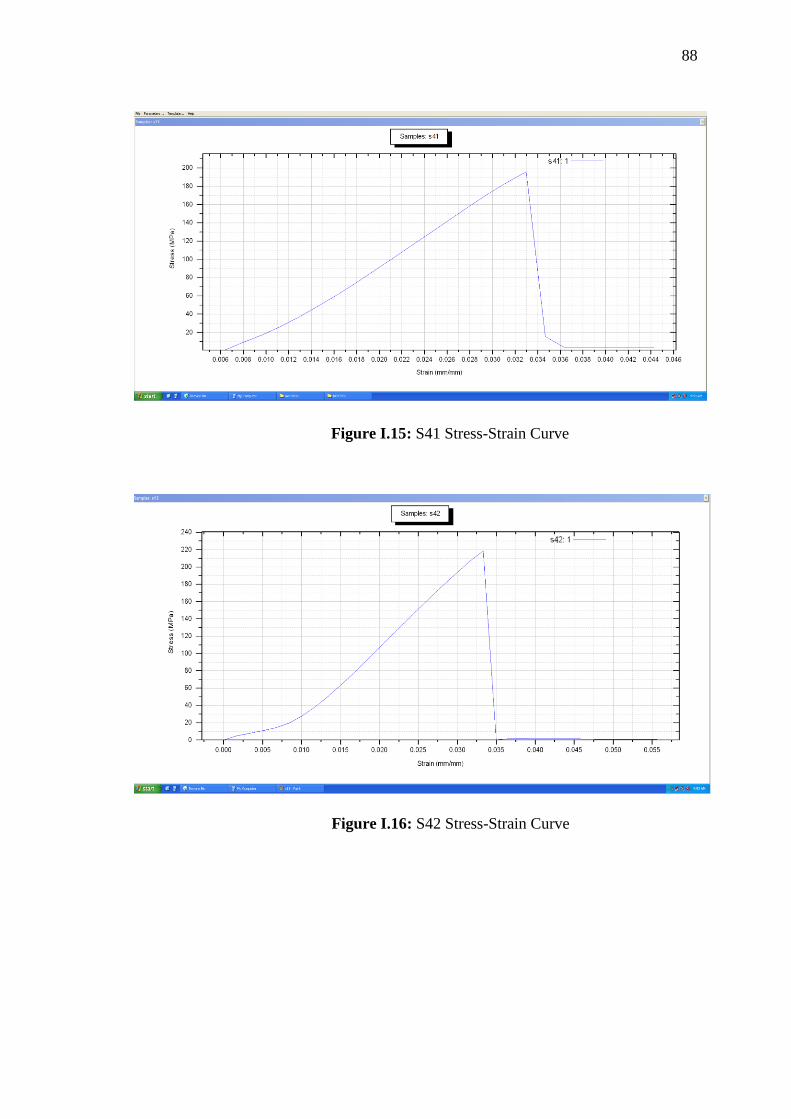
88
Figure I.16: S42 Stress-Strain Curve
Figure I.15: S41 Stress-Strain Curve
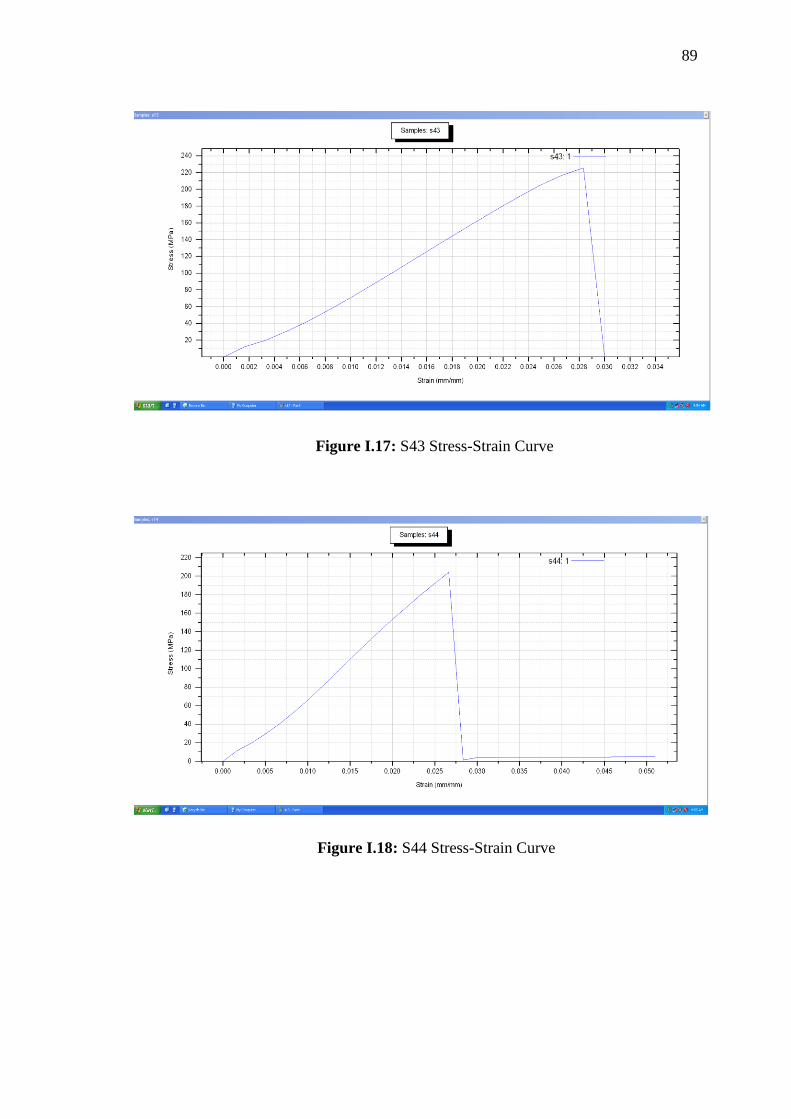
89
Figure I.17: S43 Stress-Strain Curve
Figure I.18: S44 Stress-Strain Curve
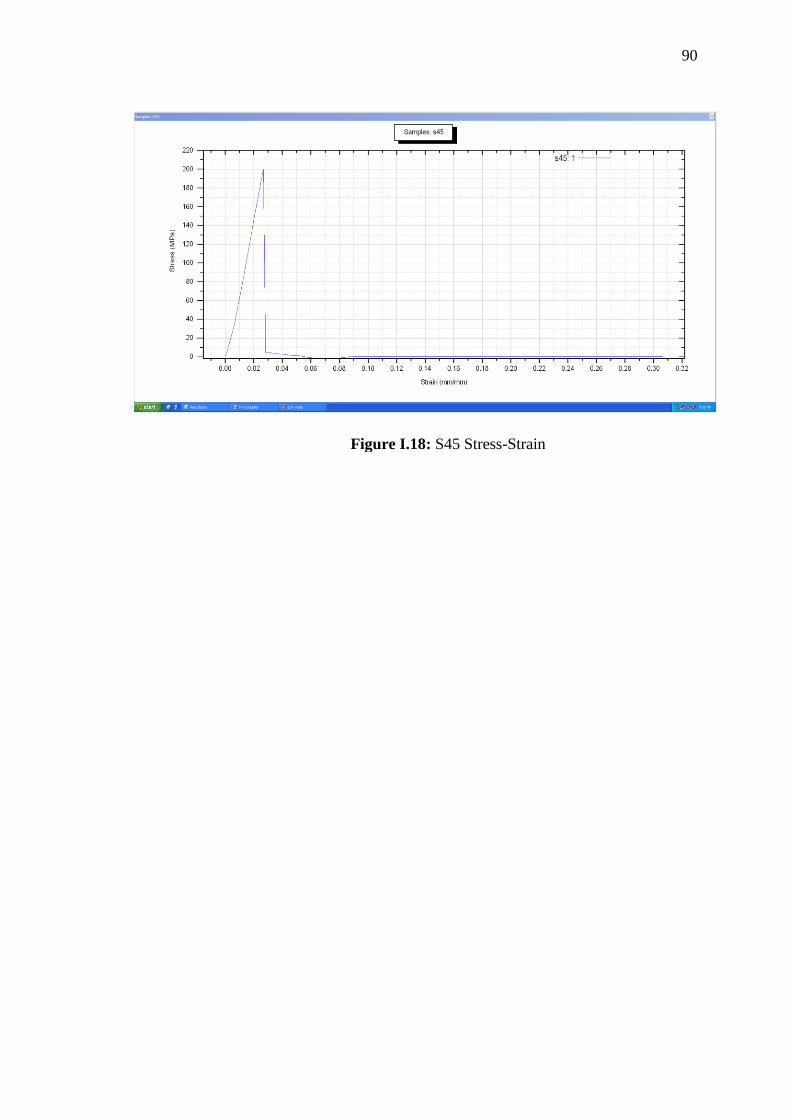
90
Figure I.18: S45 Stress-Strain
Curve