Embed Size (px)
Citation preview
Shafts and rock mass strengthCalibration using numerical models
Erik Tjäder
Civil Engineering, master's level
2018
Luleå University of Technology
Department of Civil, Environmental and Natural Resources Engineering
i
PREFACE
This thesis is the final part of my studies on the Master Programme in Civil Engineering at
Luleå University of Technology (LTU). The work has been carried out at LKAB in Kiruna with
start in January 2017.
I am very grateful for the assistance and help that I have received from numerous of people at
LKAB during this time. The work would not have been possible without my two supervisors,
Erik Swedberg at LKAB and Adjunct Professor Jonny Sjöberg at LTU/Itasca. Thank you for
your support and encouragement!
Erik Tjäder
Kiruna, April 2018
ii
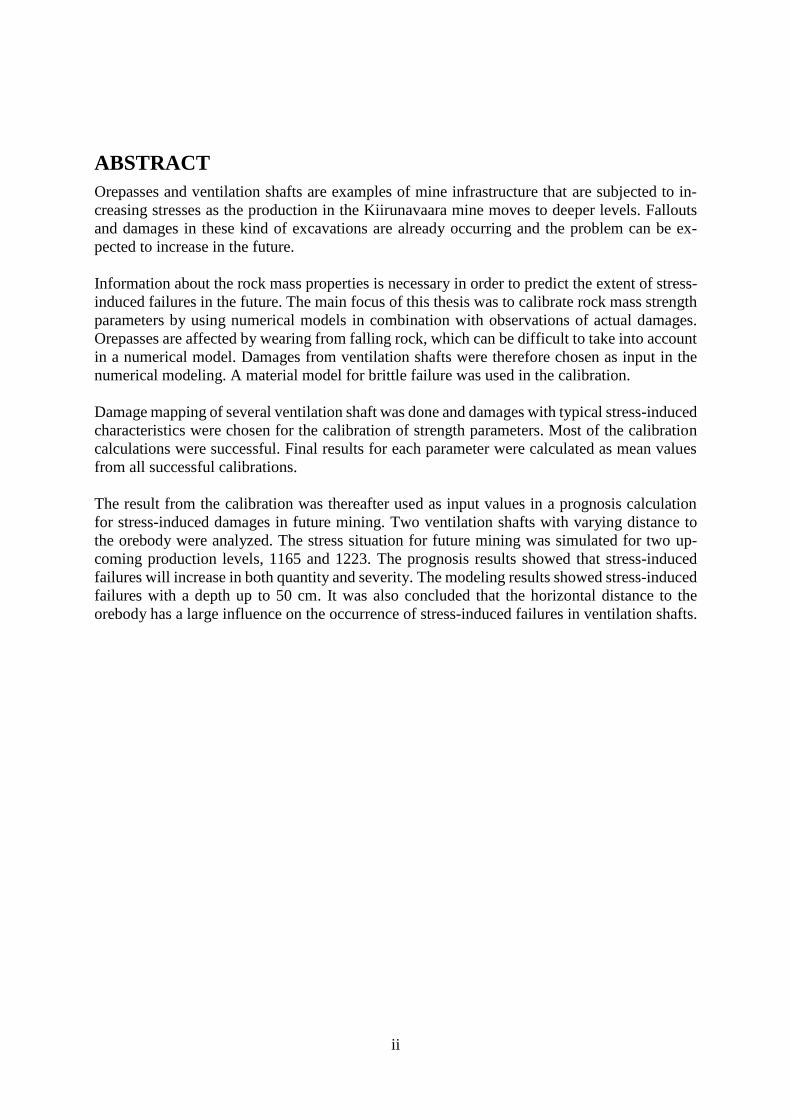
ABSTRACT
Orepasses and ventilation shafts are examples of mine infrastructure that are subjected to in-
creasing stresses as the production in the Kiirunavaara mine moves to deeper levels. Fallouts
and damages in these kind of excavations are already occurring and the problem can be ex-
pected to increase in the future.
Information about the rock mass properties is necessary in order to predict the extent of stress-
induced failures in the future. The main focus of this thesis was to calibrate rock mass strength
parameters by using numerical models in combination with observations of actual damages.
Orepasses are affected by wearing from falling rock, which can be difficult to take into account
in a numerical model. Damages from ventilation shafts were therefore chosen as input in the
numerical modeling. A material model for brittle failure was used in the calibration.
Damage mapping of several ventilation shaft was done and damages with typical stress-induced
characteristics were chosen for the calibration of strength parameters. Most of the calibration
calculations were successful. Final results for each parameter were calculated as mean values
from all successful calibrations.
The result from the calibration was thereafter used as input values in a prognosis calculation
for stress-induced damages in future mining. Two ventilation shafts with varying distance to
the orebody were analyzed. The stress situation for future mining was simulated for two up-
coming production levels, 1165 and 1223. The prognosis results showed that stress-induced
failures will increase in both quantity and severity. The modeling results showed stress-induced
failures with a depth up to 50 cm. It was also concluded that the horizontal distance to the
orebody has a large influence on the occurrence of stress-induced failures in ventilation shafts.
iii
SAMMANFATTNING
Berg- och ventilationsschakt i Kirunagruvan är exempel på bergrum som utsätts för högre berg-
spänningar när brytningen går allt djupare. Utfall och skador förekommer i dessa schakt och
problemen kan förväntas öka i framtiden.
Information om bergmassans egenskaper är nödvändigt för att kunna prognosticera omfatt-
ningen av spänningsinducerade skador i framtiden. Huvudfokus i detta examensarbete har varit
att kalibrera bergmassans hållfasthetsparametrar med hjälp av numeriska modeller i kombinat-
ion med observationer av verkliga skador. Bergschakt utsätts för nötning och stötskador från
tippat berg, vilket kan vara problematiskt att ta hänsyn till i en numerisk modell. Verkliga ska-
dor i ventilationsschakt valdes därför som input till den numeriska modelleringen. En materi-
almodell för spröda brott användes i kalibreringsberäkningarna.
Skadekartering av ventilationsschakt har gjorts och fall med tydliga spänningsinducerade ska-
dor valdes som input till kalibreringen av hållfasthetsparametrar. De flesta kalibreringarna var
lyckade och utifrån dessa beräknades ett slutgiltigt resultat för respektive parameter.
Resultatet från kalibreringen användes därefter som input till en prognosberäkning för spän-
ningsinducerade skador för framtida brytning. Två ventilationsschakt med olika avstånd till
malmkroppen analyserades. Spänningssituationen simulerades för två framtida brytningsni-
våer, nivå 1165 och 1223. Resultatet visade att spänningsinducerade skador kommer öka i både
antal och omfattning. Modellering indikerade på upp emot 50 cm djupa skador. Det framkom
även att det horisontella avståndet till malmkroppen har en stor inverkan på uppkomsten av
skador i ventilationsschakt.
iv
TABLE OF CONTENTS
PREFACE ................................................................................................................................... i
ABSTRACT ............................................................................................................................... ii SAMMANFATTNING ............................................................................................................. iii TABLE OF CONTENTS .......................................................................................................... iv 1. INTRODUCTION .................................................................................................................. 1
1.1 Background ................................................................................................................ 1
1.2 The Kiirunavaara Mine .............................................................................................. 1 1.3 Problem description .................................................................................................... 3
1.4 Aim and objective ...................................................................................................... 4
2. THEORETICAL BACKGROUND ....................................................................................... 5 2.1 Brittle failure of rock ........................................................................................................ 5 2.2 Modelling of brittle failure ............................................................................................... 6
2.2.1 The Cohesion-Weakening and Friction-Strengthening Model ................................. 6 2.2.2 Damage Initiation and Spalling Limit ....................................................................... 9
2.2.3 Other approaches ....................................................................................................... 9
2.3 Case studies .................................................................................................................... 10 2.3.1 Numerical modeling of orepasses and ventilation shaft in the Malmberget Mine .. 10
2.3.2 Brittle failure in footwall drifts in the Kiirunavaara Mine ...................................... 11 3. DAMAGE- AND GEOLOGICAL MAPPING .................................................................... 13
3.1 Procedure ........................................................................................................................ 13
3.2 Results ............................................................................................................................ 15
4. CALIBRATION OF ROCK MASS STRENGTH PARAMETERS ................................... 22 4.1 Introduction .................................................................................................................... 22 4.2 Model setup .................................................................................................................... 22
4.3 Stresses and boundary conditions .................................................................................. 23 4.4 Material models and parameters .................................................................................... 24
4.5 Procedure ........................................................................................................................ 26 4.6 Calibration results .......................................................................................................... 26
4.6.1 Ventilation shaft 20F ............................................................................................... 26 4.6.2 Ventilation shaft 25T ............................................................................................... 27
4.6.3 Ventilation shaft 25F ............................................................................................... 28 4.6.4 Ventilation shaft 29T ............................................................................................... 29
4.6.5 Ventilation shaft 36F ............................................................................................... 30 4.6.6 Ventilation shaft 36T ............................................................................................... 31
4.7 Summarized results ........................................................................................................ 33 5. PROGNOSIS OF FUTURE SPALLING ............................................................................. 34
5.1 Introduction .................................................................................................................... 34
5.2 Stress field ...................................................................................................................... 34 5.2 Results ............................................................................................................................ 35
5.2.1 Mining at level 1165 ............................................................................................... 35 5.2.2 Mining at level 1223 ............................................................................................... 36
6. DISCUSSION AND CONCLUSIONS ................................................................................ 38
7. RECOMMENDATIONS ..................................................................................................... 40 REFERENCES ......................................................................................................................... 41 APPENDIX A – DAMAGE MAPPING .................................................................................. 43
v
APPENDIX B – STRESS EVALUATION FOR PROGNOSIS CALCULATIONS.............. 46
1
1. INTRODUCTION
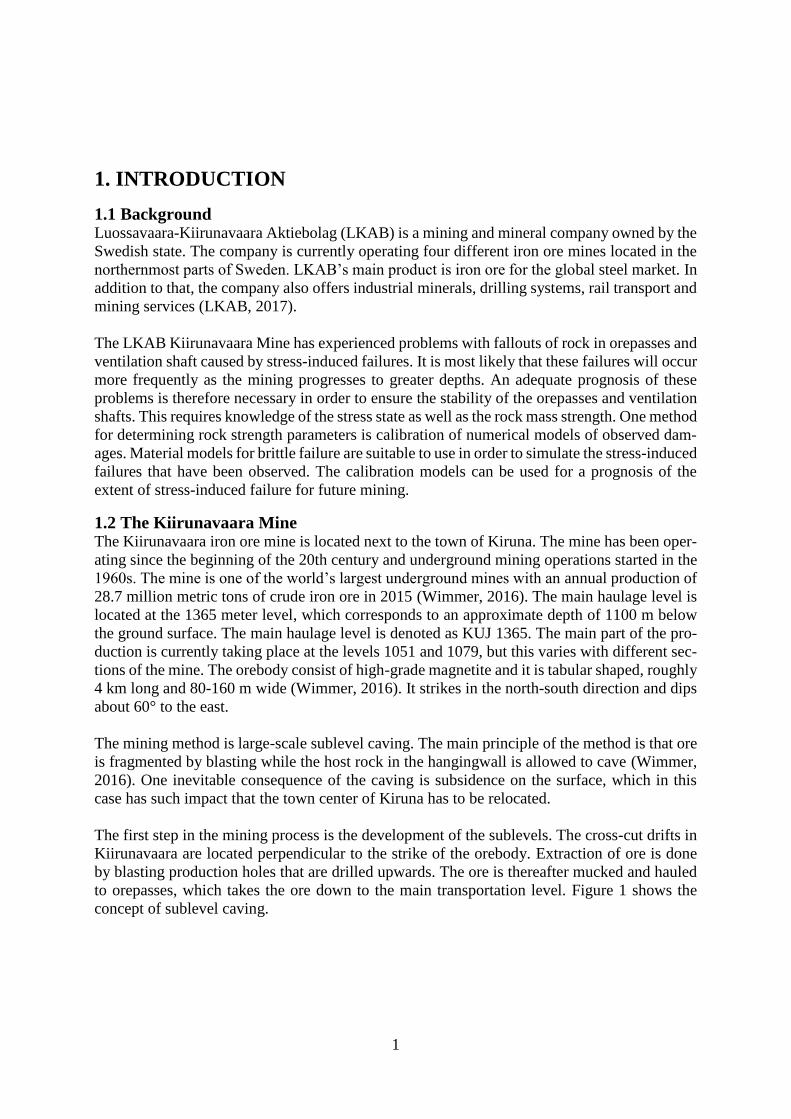
1.1 Background Luossavaara-Kiirunavaara Aktiebolag (LKAB) is a mining and mineral company owned by the
Swedish state. The company is currently operating four different iron ore mines located in the
northernmost parts of Sweden. LKAB’s main product is iron ore for the global steel market. In
addition to that, the company also offers industrial minerals, drilling systems, rail transport and
mining services (LKAB, 2017).
The LKAB Kiirunavaara Mine has experienced problems with fallouts of rock in orepasses and
ventilation shaft caused by stress-induced failures. It is most likely that these failures will occur
more frequently as the mining progresses to greater depths. An adequate prognosis of these
problems is therefore necessary in order to ensure the stability of the orepasses and ventilation
shafts. This requires knowledge of the stress state as well as the rock mass strength. One method
for determining rock strength parameters is calibration of numerical models of observed dam-
ages. Material models for brittle failure are suitable to use in order to simulate the stress-induced
failures that have been observed. The calibration models can be used for a prognosis of the
extent of stress-induced failure for future mining.
1.2 The Kiirunavaara Mine The Kiirunavaara iron ore mine is located next to the town of Kiruna. The mine has been oper-
ating since the beginning of the 20th century and underground mining operations started in the
1960s. The mine is one of the world’s largest underground mines with an annual production of
28.7 million metric tons of crude iron ore in 2015 (Wimmer, 2016). The main haulage level is
located at the 1365 meter level, which corresponds to an approximate depth of 1100 m below
the ground surface. The main haulage level is denoted as KUJ 1365. The main part of the pro-
duction is currently taking place at the levels 1051 and 1079, but this varies with different sec-
tions of the mine. The orebody consist of high-grade magnetite and it is tabular shaped, roughly
4 km long and 80-160 m wide (Wimmer, 2016). It strikes in the north-south direction and dips
about 60° to the east.
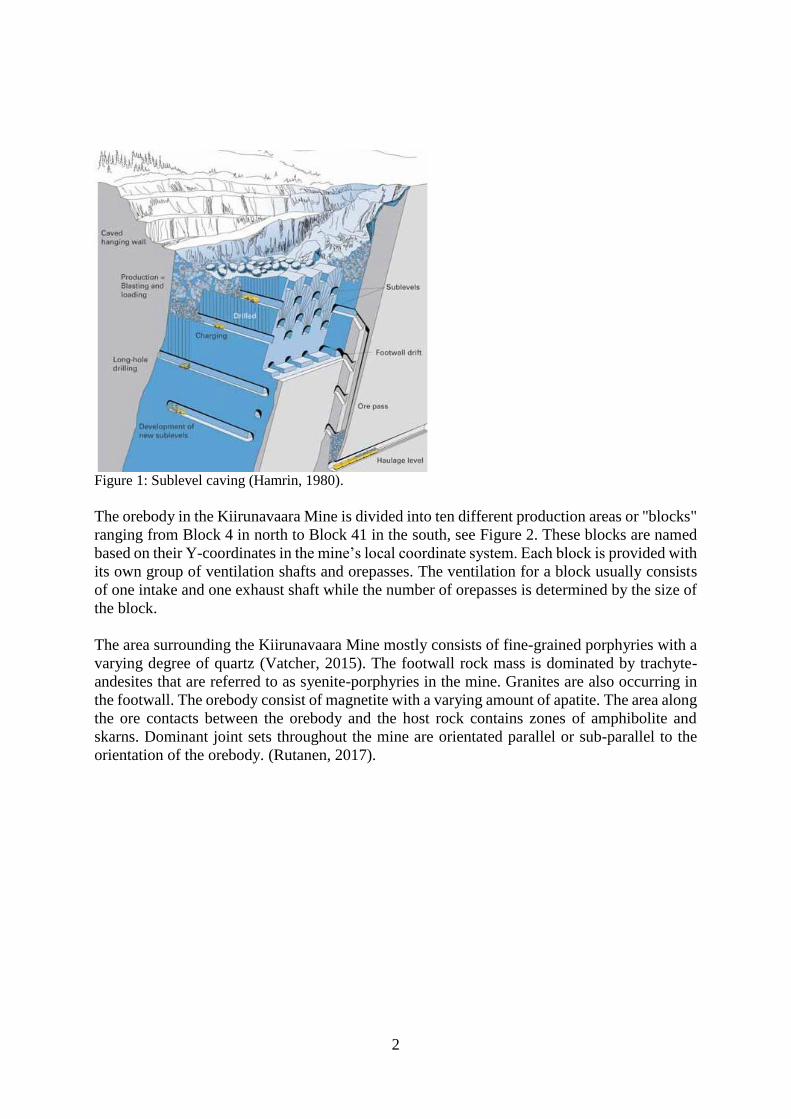
The mining method is large-scale sublevel caving. The main principle of the method is that ore
is fragmented by blasting while the host rock in the hangingwall is allowed to cave (Wimmer,
2016). One inevitable consequence of the caving is subsidence on the surface, which in this
case has such impact that the town center of Kiruna has to be relocated.
The first step in the mining process is the development of the sublevels. The cross-cut drifts in
Kiirunavaara are located perpendicular to the strike of the orebody. Extraction of ore is done
by blasting production holes that are drilled upwards. The ore is thereafter mucked and hauled
to orepasses, which takes the ore down to the main transportation level. Figure 1 shows the
concept of sublevel caving.
2
Figure 1: Sublevel caving (Hamrin, 1980).
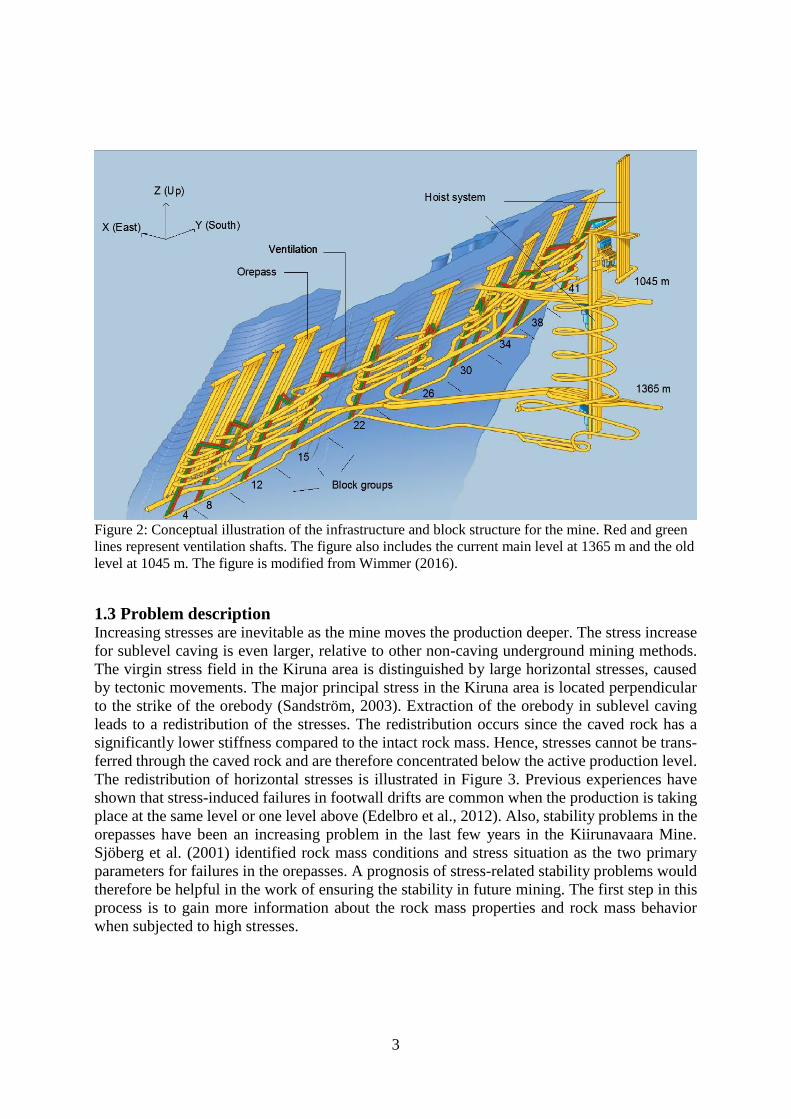
The orebody in the Kiirunavaara Mine is divided into ten different production areas or "blocks"
ranging from Block 4 in north to Block 41 in the south, see Figure 2. These blocks are named
based on their Y-coordinates in the mine’s local coordinate system. Each block is provided with
its own group of ventilation shafts and orepasses. The ventilation for a block usually consists
of one intake and one exhaust shaft while the number of orepasses is determined by the size of
the block.
The area surrounding the Kiirunavaara Mine mostly consists of fine-grained porphyries with a
varying degree of quartz (Vatcher, 2015). The footwall rock mass is dominated by trachyte-
andesites that are referred to as syenite-porphyries in the mine. Granites are also occurring in
the footwall. The orebody consist of magnetite with a varying amount of apatite. The area along
the ore contacts between the orebody and the host rock contains zones of amphibolite and
skarns. Dominant joint sets throughout the mine are orientated parallel or sub-parallel to the
orientation of the orebody. (Rutanen, 2017).
3
Figure 2: Conceptual illustration of the infrastructure and block structure for the mine. Red and green
lines represent ventilation shafts. The figure also includes the current main level at 1365 m and the old
level at 1045 m. The figure is modified from Wimmer (2016).
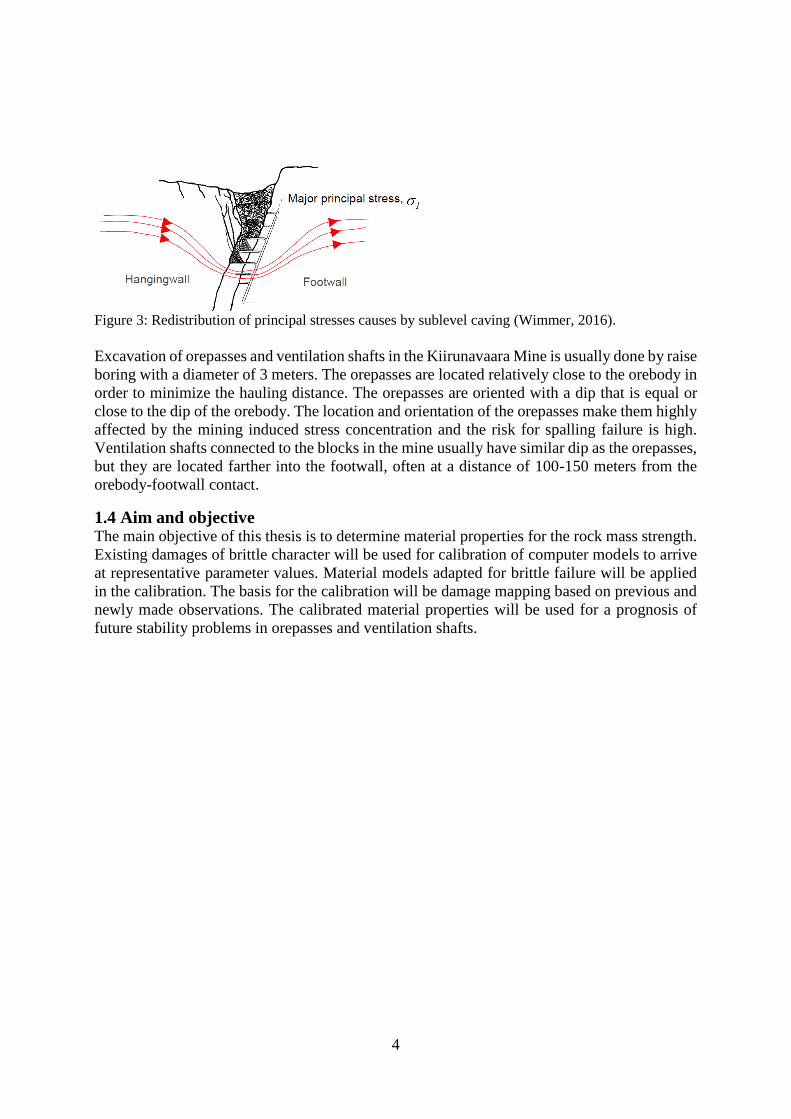
1.3 Problem description Increasing stresses are inevitable as the mine moves the production deeper. The stress increase
for sublevel caving is even larger, relative to other non-caving underground mining methods.
The virgin stress field in the Kiruna area is distinguished by large horizontal stresses, caused
by tectonic movements. The major principal stress in the Kiruna area is located perpendicular
to the strike of the orebody (Sandström, 2003). Extraction of the orebody in sublevel caving
leads to a redistribution of the stresses. The redistribution occurs since the caved rock has a
significantly lower stiffness compared to the intact rock mass. Hence, stresses cannot be trans-
ferred through the caved rock and are therefore concentrated below the active production level.
The redistribution of horizontal stresses is illustrated in Figure 3. Previous experiences have
shown that stress-induced failures in footwall drifts are common when the production is taking
place at the same level or one level above (Edelbro et al., 2012). Also, stability problems in the
orepasses have been an increasing problem in the last few years in the Kiirunavaara Mine.
Sjöberg et al. (2001) identified rock mass conditions and stress situation as the two primary
parameters for failures in the orepasses. A prognosis of stress-related stability problems would
therefore be helpful in the work of ensuring the stability in future mining. The first step in this
process is to gain more information about the rock mass properties and rock mass behavior
when subjected to high stresses.
4
Figure 3: Redistribution of principal stresses causes by sublevel caving (Wimmer, 2016).
Excavation of orepasses and ventilation shafts in the Kiirunavaara Mine is usually done by raise
boring with a diameter of 3 meters. The orepasses are located relatively close to the orebody in
order to minimize the hauling distance. The orepasses are oriented with a dip that is equal or
close to the dip of the orebody. The location and orientation of the orepasses make them highly
affected by the mining induced stress concentration and the risk for spalling failure is high.
Ventilation shafts connected to the blocks in the mine usually have similar dip as the orepasses,
but they are located farther into the footwall, often at a distance of 100-150 meters from the
orebody-footwall contact.
1.4 Aim and objective The main objective of this thesis is to determine material properties for the rock mass strength.
Existing damages of brittle character will be used for calibration of computer models to arrive
at representative parameter values. Material models adapted for brittle failure will be applied
in the calibration. The basis for the calibration will be damage mapping based on previous and
newly made observations. The calibrated material properties will be used for a prognosis of
future stability problems in orepasses and ventilation shafts.
5
2. THEORETICAL BACKGROUND
2.1 Brittle failure of rock Brittle failure, or spalling, is a common failure type in deep hard rock excavations. This type of
failure is dependent of the rock mass strength and the in situ stresses (Martin & Christiansson,
2009). The failure process associated with brittle failure was early on described by Bieniawski
(1967). In his work, he identified the following five stages in the process of brittle failure:
i. Closing of existing cracks
ii. Linear elastic deformations
iii. Stable fracture propagation
iv. Unstable fracture propagation
v. Forking and coalescence of cracks
The risk for spalling occurs at excavation boundaries where there is a concentration of tangen-
tial compressive stresses together with low confinement. When the rock is subject to high com-
pressive stress with low confinement, micro-cracks parallel to the loading direction starts grow-
ing. The appearance of these micro-cracks is mainly caused by natural weaknesses in the rock
such as small grains for example. These weaknesses in the material will cause a local change
of the force direction that deviates from the global force direction (Nordlund, Rådberg, &
Sjöberg, 1998). The deviating force generates tensile stresses that initiate the growth of micro-
cracks. Increasing stresses will enhance this growth of micro-cracks and will eventually lead to
fracture coalescence. Since both initiation of new fracture and propagation of existing ones
require a stress increase, these processes can be regarded as the third stage in Bieniawski’s
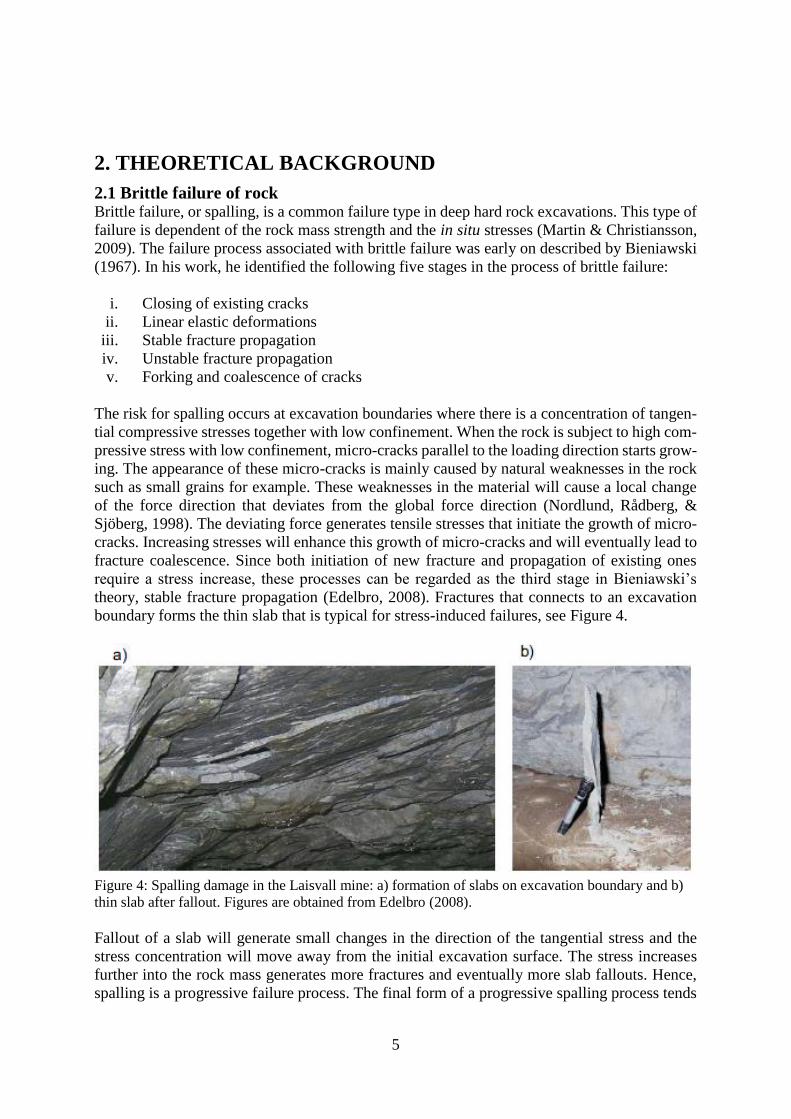
theory, stable fracture propagation (Edelbro, 2008). Fractures that connects to an excavation
boundary forms the thin slab that is typical for stress-induced failures, see Figure 4.
Figure 4: Spalling damage in the Laisvall mine: a) formation of slabs on excavation boundary and b)
thin slab after fallout. Figures are obtained from Edelbro (2008).
Fallout of a slab will generate small changes in the direction of the tangential stress and the
stress concentration will move away from the initial excavation surface. The stress increases
further into the rock mass generates more fractures and eventually more slab fallouts. Hence,
spalling is a progressive failure process. The final form of a progressive spalling process tends
6
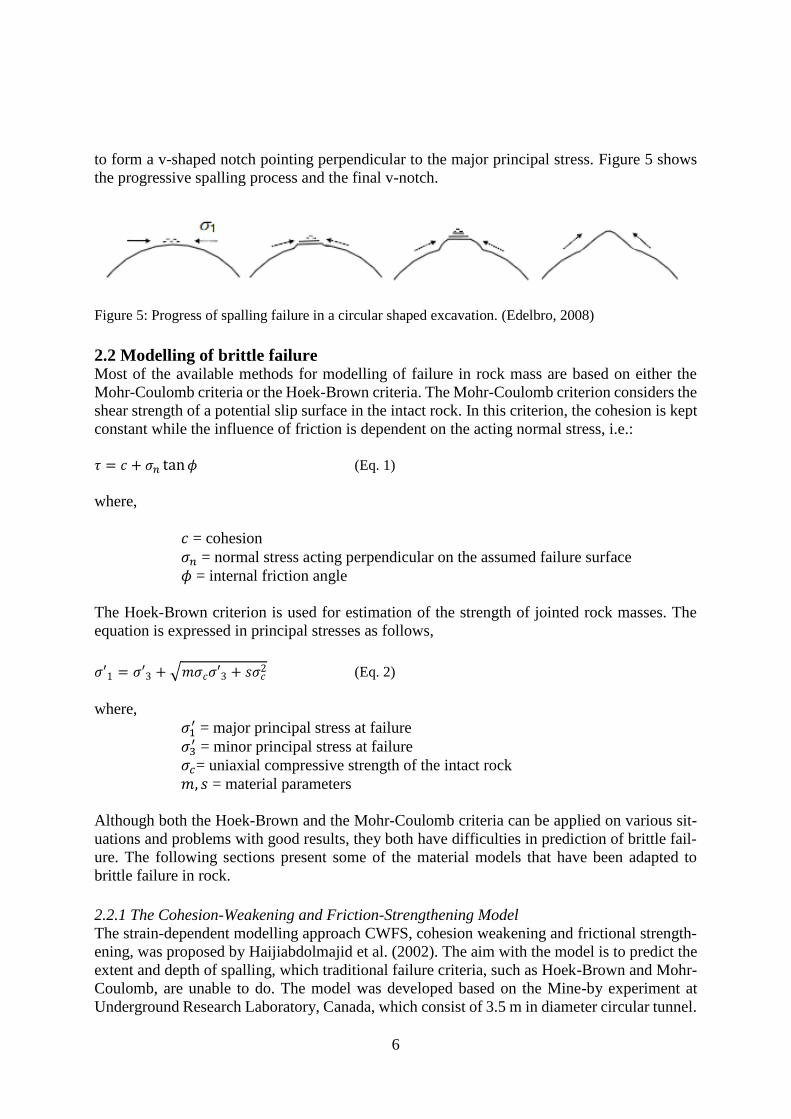
to form a v-shaped notch pointing perpendicular to the major principal stress. Figure 5 shows
the progressive spalling process and the final v-notch.
Figure 5: Progress of spalling failure in a circular shaped excavation. (Edelbro, 2008)
2.2 Modelling of brittle failure Most of the available methods for modelling of failure in rock mass are based on either the
Mohr-Coulomb criteria or the Hoek-Brown criteria. The Mohr-Coulomb criterion considers the
shear strength of a potential slip surface in the intact rock. In this criterion, the cohesion is kept
constant while the influence of friction is dependent on the acting normal stress, i.e.:
𝜏 = 𝑐 + 𝜎𝑛 tan 𝜙 (Eq. 1)
where,
𝑐 = cohesion
𝜎𝑛 = normal stress acting perpendicular on the assumed failure surface
𝜙 = internal friction angle
The Hoek-Brown criterion is used for estimation of the strength of jointed rock masses. The
equation is expressed in principal stresses as follows,
𝜎′1 = 𝜎′3 + √𝑚𝜎𝑐𝜎′3 + 𝑠𝜎𝑐2 (Eq. 2)
where,
𝜎1′ = major principal stress at failure
𝜎3′ = minor principal stress at failure
𝜎𝑐= uniaxial compressive strength of the intact rock
𝑚, 𝑠 = material parameters
Although both the Hoek-Brown and the Mohr-Coulomb criteria can be applied on various sit-
uations and problems with good results, they both have difficulties in prediction of brittle fail-
ure. The following sections present some of the material models that have been adapted to
brittle failure in rock.
2.2.1 The Cohesion-Weakening and Friction-Strengthening Model
The strain-dependent modelling approach CWFS, cohesion weakening and frictional strength-
ening, was proposed by Haijiabdolmajid et al. (2002). The aim with the model is to predict the
extent and depth of spalling, which traditional failure criteria, such as Hoek-Brown and Mohr-
Coulomb, are unable to do. The model was developed based on the Mine-by experiment at
Underground Research Laboratory, Canada, which consist of 3.5 m in diameter circular tunnel.
7
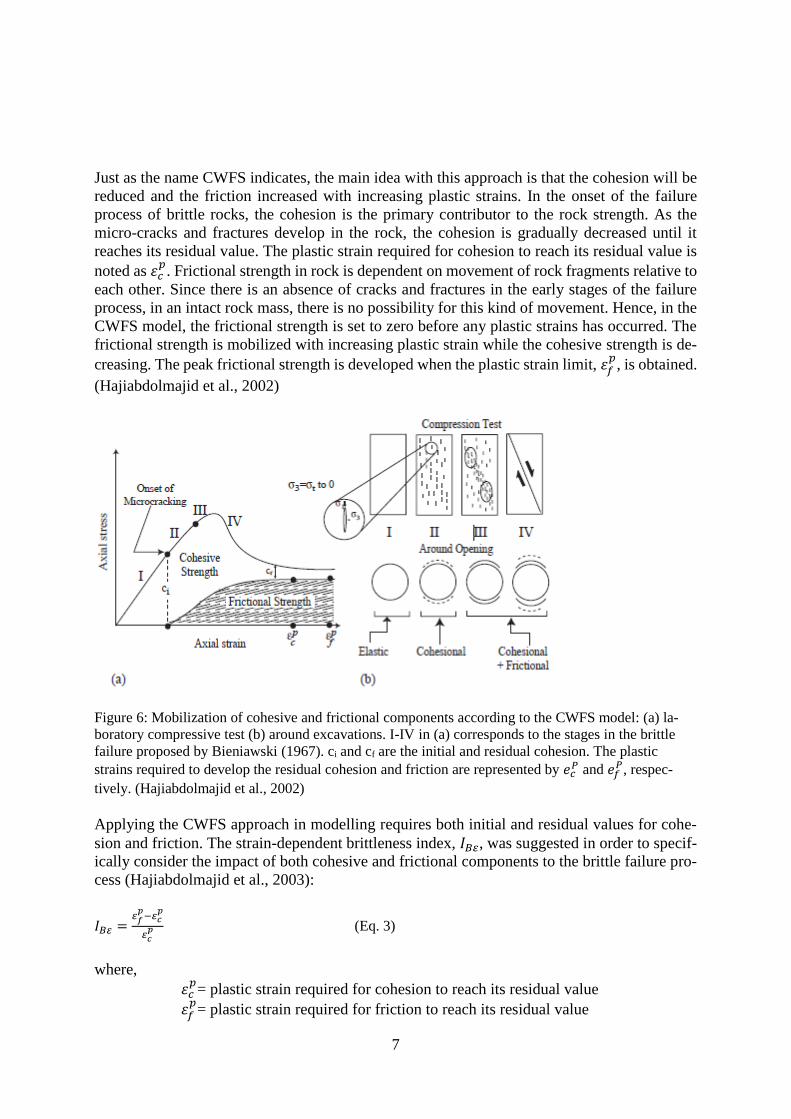
Just as the name CWFS indicates, the main idea with this approach is that the cohesion will be
reduced and the friction increased with increasing plastic strains. In the onset of the failure
process of brittle rocks, the cohesion is the primary contributor to the rock strength. As the
micro-cracks and fractures develop in the rock, the cohesion is gradually decreased until it
reaches its residual value. The plastic strain required for cohesion to reach its residual value is
noted as 𝜀𝑐𝑝. Frictional strength in rock is dependent on movement of rock fragments relative to
each other. Since there is an absence of cracks and fractures in the early stages of the failure
process, in an intact rock mass, there is no possibility for this kind of movement. Hence, in the
CWFS model, the frictional strength is set to zero before any plastic strains has occurred. The
frictional strength is mobilized with increasing plastic strain while the cohesive strength is de-
creasing. The peak frictional strength is developed when the plastic strain limit, 𝜀𝑓𝑝
, is obtained.
(Hajiabdolmajid et al., 2002)
Figure 6: Mobilization of cohesive and frictional components according to the CWFS model: (a) la-
boratory compressive test (b) around excavations. I-IV in (a) corresponds to the stages in the brittle
failure proposed by Bieniawski (1967). ci and cf are the initial and residual cohesion. The plastic
strains required to develop the residual cohesion and friction are represented by 𝑒𝑐𝑃 and 𝑒𝑓
𝑃, respec-
tively. (Hajiabdolmajid et al., 2002)
Applying the CWFS approach in modelling requires both initial and residual values for cohe-
sion and friction. The strain-dependent brittleness index, 𝐼𝐵𝜀, was suggested in order to specif-
ically consider the impact of both cohesive and frictional components to the brittle failure pro-
cess (Hajiabdolmajid et al., 2003):
𝐼𝐵𝜀 =𝜀𝑓
𝑝−𝜀𝑐
𝑝
𝜀𝑐𝑝 (Eq. 3)
where,
𝜀𝑐𝑝= plastic strain required for cohesion to reach its residual value
𝜀𝑓𝑝= plastic strain required for friction to reach its residual value
8
The brittleness index considers both shear and tensile mechanisms in the initiation phase of
microcracks. It also involves the microcracks ability to propagate freely. The brittleness index
declares if the mobilization of frictional strength is delayed or in advance, compared with the
decay of the cohesion strength. For excavations of large underground openings in hard rocks,
the plane strain loading conditions can be described with 𝐼𝐵𝜀 > 0, i.e. when 𝜀𝑓𝑝 is larger than 𝜀𝑐
𝑝.
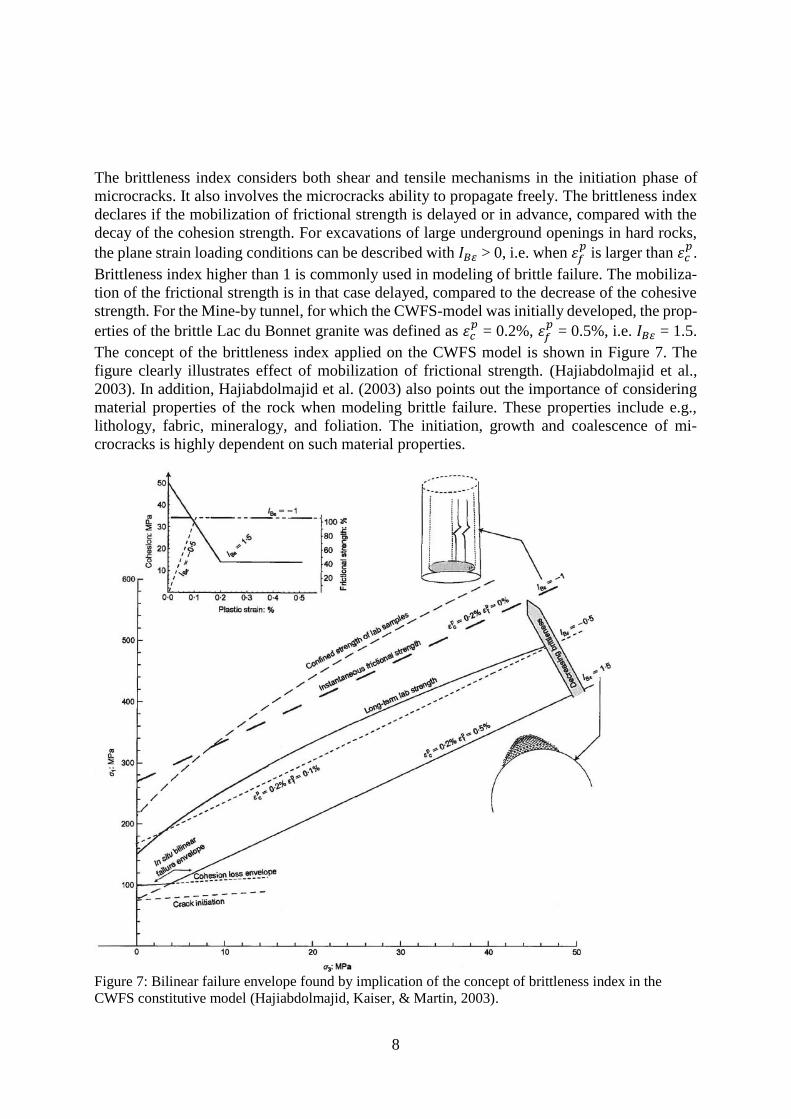
Brittleness index higher than 1 is commonly used in modeling of brittle failure. The mobiliza-
tion of the frictional strength is in that case delayed, compared to the decrease of the cohesive
strength. For the Mine-by tunnel, for which the CWFS-model was initially developed, the prop-
erties of the brittle Lac du Bonnet granite was defined as 𝜀𝑐𝑝 = 0.2%, 𝜀𝑓
𝑝 = 0.5%, i.e. 𝐼𝐵𝜀 = 1.5.
The concept of the brittleness index applied on the CWFS model is shown in Figure 7. The
figure clearly illustrates effect of mobilization of frictional strength. (Hajiabdolmajid et al.,
2003). In addition, Hajiabdolmajid et al. (2003) also points out the importance of considering
material properties of the rock when modeling brittle failure. These properties include e.g.,
lithology, fabric, mineralogy, and foliation. The initiation, growth and coalescence of mi-
crocracks is highly dependent on such material properties.
Figure 7: Bilinear failure envelope found by implication of the concept of brittleness index in the
CWFS constitutive model (Hajiabdolmajid, Kaiser, & Martin, 2003).
9
2.2.2 Damage Initiation and Spalling Limit
Another model for simulation of brittle failure is the Damage Initiation and Spalling Limit
(DISL) model, introduced by Diederichs (2007). The main idea of this model is that the strength
is highly dependent on the level of confinement. The model aims to include the low confine-
ment conditions on the surface boundary of an excavation, where spalling damages occurs. The
method combines the thresholds for damage initiation and spalling into a combined envelope.
The lower bound strength, damage initiation, represents the initiation of damage by extension
cracks. It is mainly dependent on internal flaws, density, and heterogeneity of the rock material.
Damage initiation in compressive loading has been found to be around 0.3-0.5 of the UCS-
value determined from laboratory testing. The value does not coincide with the UCS-value
since laboratory tests tends to hold back the propagation of extension cracks while it instead
promotes propagation of shear damages (Diederichs, 2007). This is often unlike field situations
where extension cracks are allowed to propagate freely and later develop into spalling failures.
This damage initiation limit is set as the lower bound in the DISL-method.
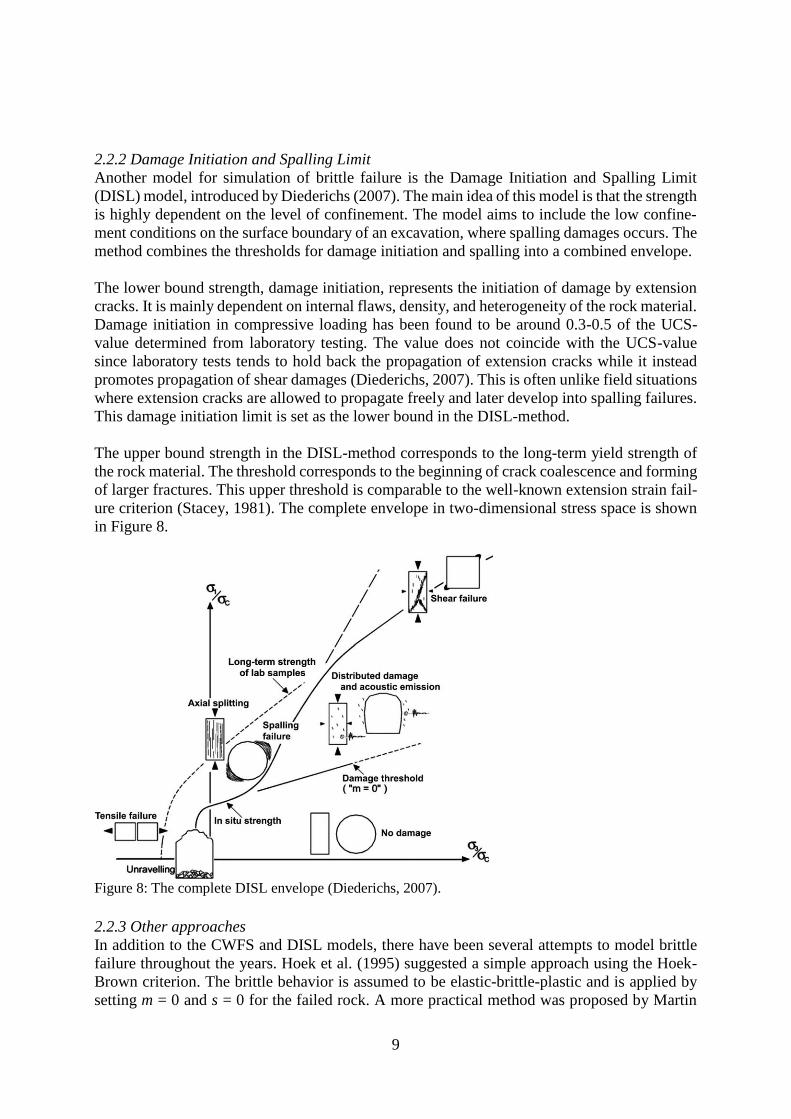
The upper bound strength in the DISL-method corresponds to the long-term yield strength of
the rock material. The threshold corresponds to the beginning of crack coalescence and forming
of larger fractures. This upper threshold is comparable to the well-known extension strain fail-
ure criterion (Stacey, 1981). The complete envelope in two-dimensional stress space is shown
in Figure 8.
Figure 8: The complete DISL envelope (Diederichs, 2007).
2.2.3 Other approaches
In addition to the CWFS and DISL models, there have been several attempts to model brittle
failure throughout the years. Hoek et al. (1995) suggested a simple approach using the Hoek-
Brown criterion. The brittle behavior is assumed to be elastic-brittle-plastic and is applied by
setting m = 0 and s = 0 for the failed rock. A more practical method was proposed by Martin
10
and Cristiansson (2009). The method was developed and calibrated by case studies with brittle
failures. It describes the probabilistic risk for spalling failure and is intended to be used as a
tool in the early stages of design.
Most theories on fracture initiation are based on the Griffith theory about failure of brittle ma-
terial from the beginning of the 20th century (Griffith, 1921). His theory was that cracks initiates
at the tip of voids in a material. These open cracks are in most cases replaced by small defects
such as grain boundaries, when dealing with rock materials. Hoek and Martin (2014) did a
review of the research concerning fracture initiation and propagation and its significance for
brittle failure. They concluded that the current grain-based models are viable for explaining the
complex processes in fracture initiation and propagation. However, they also point out that
while the current approach is promising, there is still a lot of research that needs to be done
before the approach becomes reliable. One of the challenges in this research includes a better
understanding of the complicated interaction of tensile and shear processes involved with deep
spall notches. Another large step is moving from two-dimensional into three-dimensional mod-
els. Due to the fact that the brittle failure process is three-dimensional (Martin, 1997), it may
not be optimal to use two-dimensional models to correctly represent the phenomena.
2.3 Case studies
2.3.1 Numerical modeling of orepasses and ventilation shaft in the Malmberget Mine
LKAB’s other underground mine in Malmberget is in many ways similar to the Kiirunavaara
Mine. It is also an iron ore mine and the mining method is the same as in Kiruna. The stress
situation in the mine is however somewhat different due to the complex forms of the orebodies,
but a similarity with Kiruna is the increase of stress related problems. Sjöberg, et al. (2015) did
a study on the orepass design for future mining in the Malmberget Mine. The study included a
calibration of the rock mass material properties by numerical modeling using the two-dimen-
sional finite difference software FLAC.
Two orepasses located at two different orebodies were included in the study. The damages in
the orepasses were caused by a combination of stress influence and wearing from falling rocks.
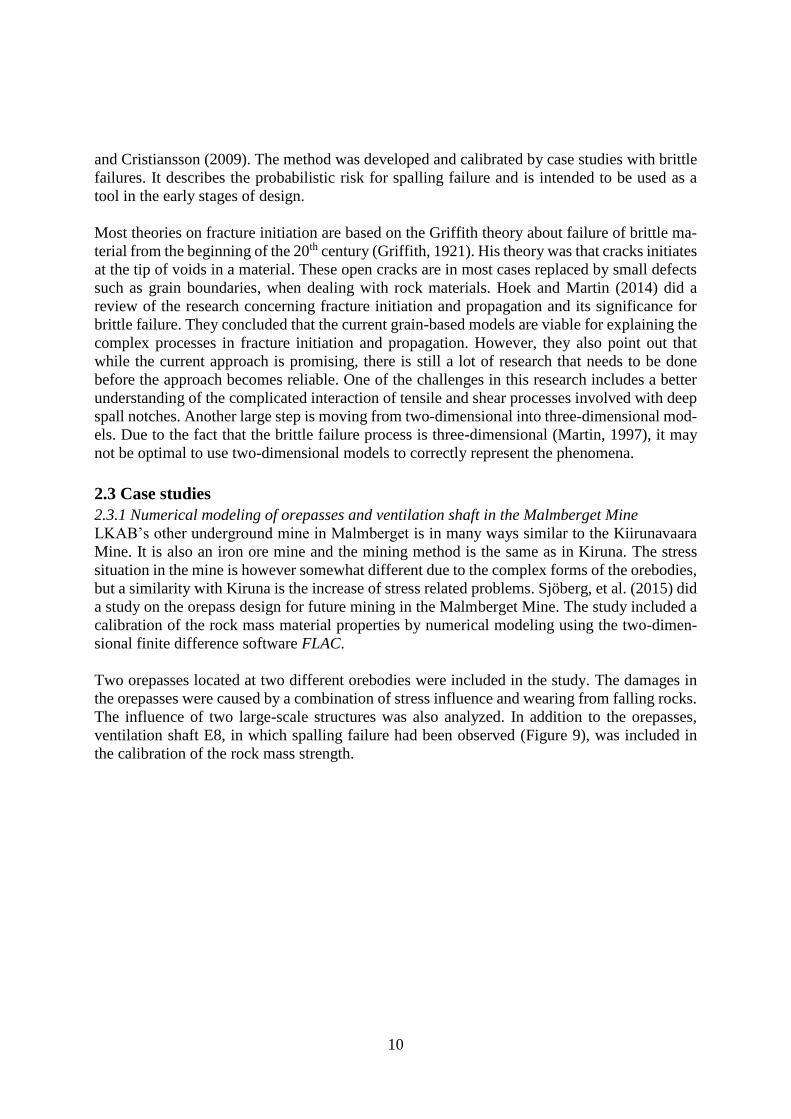
The influence of two large-scale structures was also analyzed. In addition to the orepasses,
ventilation shaft E8, in which spalling failure had been observed (Figure 9), was included in
the calibration of the rock mass strength.
11
Figure 9: Spalling failures in ventilation shaft E8 in the Malmberget Mine. The picture shows two dif-
ferent levels of the shaft with similar spalling-type damages. (Sjöberg, et al., 2015)
Various constitutive material models were used in attempt to reproduces the observed failures
in the numerical models. The cohesive weakening and frictional strengthening model (CWFS)
developed by Hajiabdolmajid et al. (2002) showed the most satisfying result. The shape of the
fallouts in the orepasses was successfully reproduced with CWFS, but the variation of the extent
between different levels in the orepass could not be simulated. Sjöberg et al. (2015) concluded
that this variation was most likely due to orepass usage. Especially successful was the simula-
tion of the damages in the ventilation shaft, which consisted of typical spalling damages that
can be seen in Figure 9. Strength parameters of the rock mass were successfully calibrated from
that case.
Table 1: Calibrated rock mass strength parameters from Sjöberg et al. (2015).
2.3.2 Brittle failure in footwall drifts in the Kiirunavaara Mine
The amount of stress-induced failures and the magnitude of these are likely to increase as the
mining is reaching greater depths in Kiirunavaara. The problem is most noticeable in the foot-
wall drifts since their orientation and location makes them highly affected by the stress redis-
tribution (Krekula, 2017). This issue was studied by Edelbro et al. (2012) using numerical mod-
eling and observations of failures. The main objective of the study was to predict compressive
stress-induced failures and follow-up the predictions against real fallouts in the footwall drifts
at the Kiirunavaara Mine.
12
The numerical modeling was done in the finite element software Phase2 version 6.0. The stress
situation in the mine was simulated with a global-local modeling approach. Progressive mining
was simulated in the global model and the acquired stress values were applied as boundary
conditions to the local model. A cohesive-softening friction-hardening material model was used
in order to simulate brittle failure. Fallout indicators in the prediction model consisted of yielded
elements and maximum shear strength.
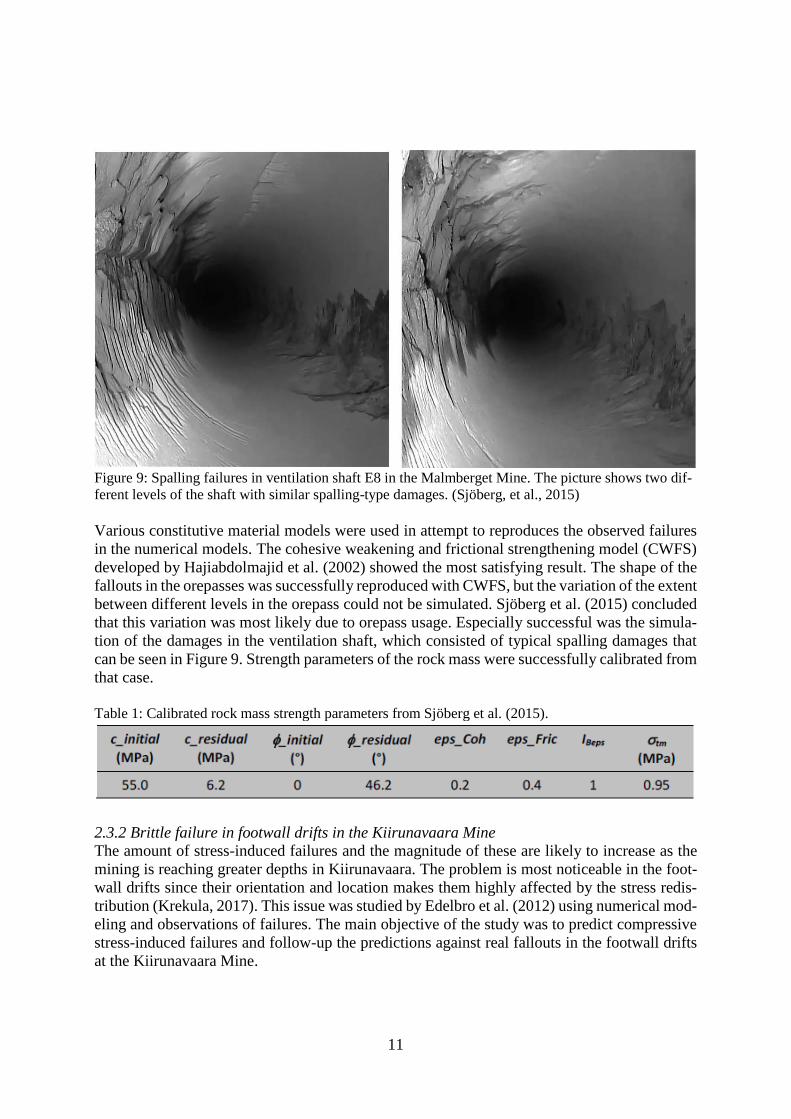
Observation of the footwall drifts revealed that the profile of the drifts often differed from the
planned shape. Also, results from the modeling showed that the extent of brittle failure was
sensitive to the profile of the footwall drifts. The effect of progressive mining was also studied.
It showed that a large portion of damage indicators occurs at the footwall drift located one level
below the currently active production level (Figure 10). These results are useful for the design
of future footwall drifts.
Figure 10: Red color marks yielded elements in shear of a footwall drift located at level 993 with vary-
ing cross-section shapes. Progressive mining (different production levels) were also simulated. Figure
is obtained from Edelbro et al. (2012).
13
3. DAMAGE- AND GEOLOGICAL MAPPING
3.1 Procedure Damage mapping of shafts in the Kiirunavaara mine is routinely done by a few different meth-
ods. Orepasses are usually surveyed using video-filming or laser-scanning. Video-filming is
done by lowering a small wagon equipped with video camera and laser-scanner. This gives a
good visual perception of the orepass and what kind of damages that exists. The purpose of
laser-scanning is mainly to measure the cross-sectional area in the orepass. (Jatko & Gidemalm,
2017).
Ventilation shafts are video-filmed with a high-resolution camera that is fixed at the start or end
of the shaft. The zooming function on the camera is used in order to get more detailed infor-
mation about damages deeper into the shaft. This method has some disadvantages compared to
the film wagon used for orepasses. Damages deep in the ventilation shaft might be difficult to
evaluate properly due to limited visibility. Geological mapping using the video footage is not
possible. The film wagon would be a better option for filming the ventilation shaft, but access
restriction caused by concrete wall in front of ventilation shafts makes this currently impossible.
In addition to the above-mentioned mapping methods, visual inspection of the start- and end
points of the ventilation shafts is also done. LKAB is currently testing and developing a method
to use drones (UAVs) equipped with video cameras for the purpose of mapping inaccessible
areas, such as ventilations shafts and orepasses (Jatko & Gidemalm, 2017).
The results from damage mapping of ventilation shaft using the fixed camera and some visual
observations are used in this work. Previously existing material and new material, produced
within this project, were used for damage mapping. However, the work has been focused on
some specific shafts.
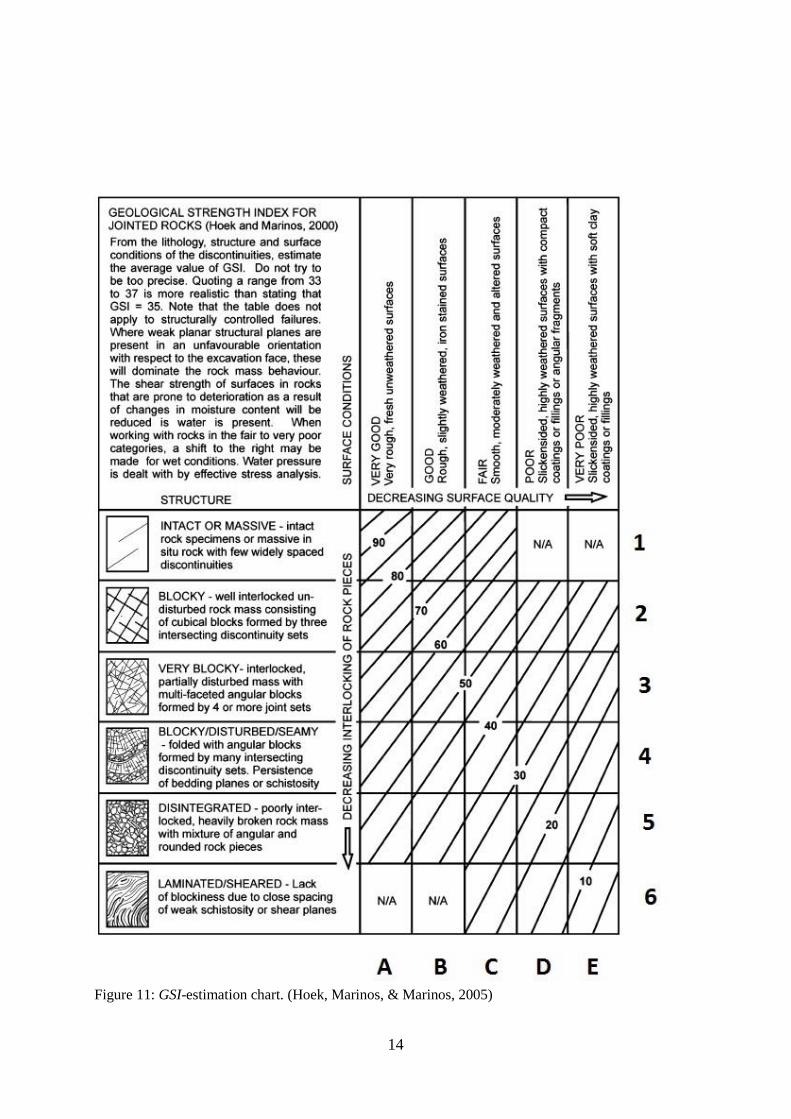
The geological mapping presented in this report is based on the previous work done by LKAB.
This mainly includes structural mapping and GSI estimation (Hoek, Marinos, & Marinos,
2005). The chart in Figure 11 is used for classification. In addition to the GSI-value, LKAB
also uses the numbers 1-6 for estimating the amount of structures and letters A-E for evaluation
of surface conditions.
14
Figure 11: GSI-estimation chart. (Hoek, Marinos, & Marinos, 2005)
15
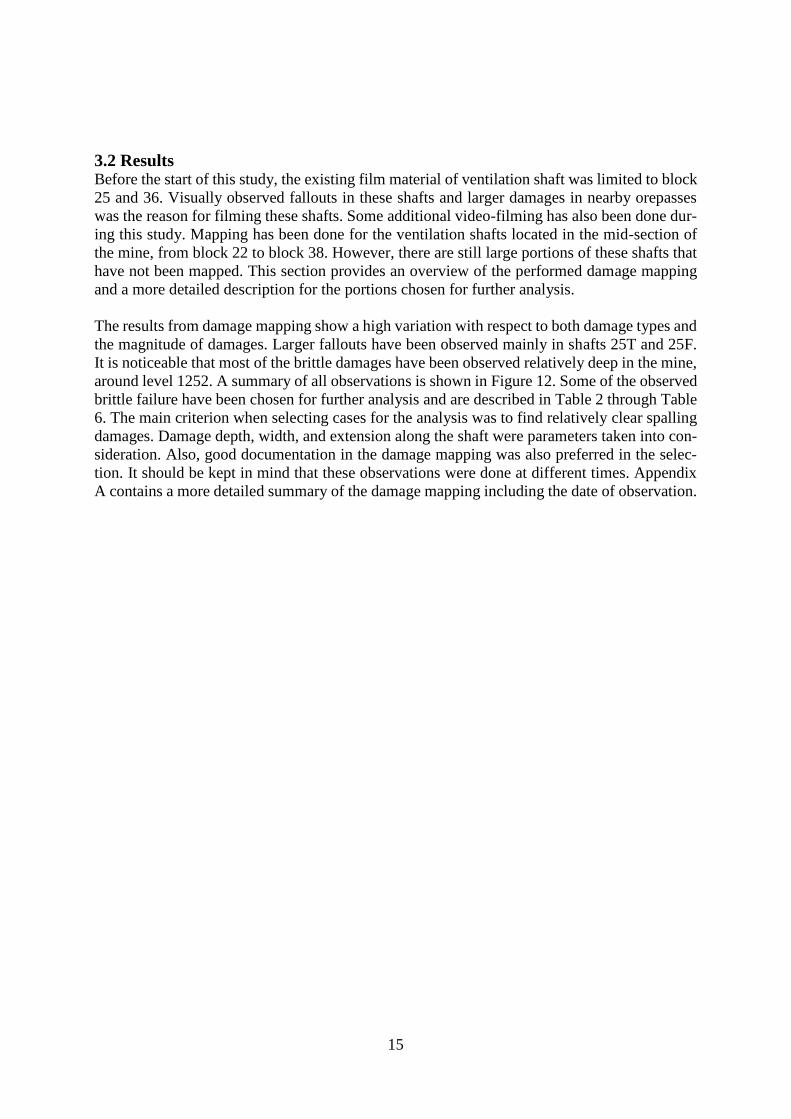
3.2 Results Before the start of this study, the existing film material of ventilation shaft was limited to block
25 and 36. Visually observed fallouts in these shafts and larger damages in nearby orepasses
was the reason for filming these shafts. Some additional video-filming has also been done dur-
ing this study. Mapping has been done for the ventilation shafts located in the mid-section of
the mine, from block 22 to block 38. However, there are still large portions of these shafts that
have not been mapped. This section provides an overview of the performed damage mapping
and a more detailed description for the portions chosen for further analysis.
The results from damage mapping show a high variation with respect to both damage types and
the magnitude of damages. Larger fallouts have been observed mainly in shafts 25T and 25F.
It is noticeable that most of the brittle damages have been observed relatively deep in the mine,
around level 1252. A summary of all observations is shown in Figure 12. Some of the observed
brittle failure have been chosen for further analysis and are described in Table 2 through Table
6. The main criterion when selecting cases for the analysis was to find relatively clear spalling
damages. Damage depth, width, and extension along the shaft were parameters taken into con-
sideration. Also, good documentation in the damage mapping was also preferred in the selec-
tion. It should be kept in mind that these observations were done at different times. Appendix
A contains a more detailed summary of the damage mapping including the date of observation.
16
Figure 12: Summary of the damage mapping of ventilations shaft. “X” marks locations with brittle
failures that have been chosen for further analysis.
Vent. Shaft 20F 20T 25F 25T* 25T 29T 29F 33F 33F 33T 33T 36T 36F
Level [m] Level [m]
1020 1020
1060 1060
1079 1079
X
X
1165 1165
1214 1214
X X
1252 1252
X
Vent. Shaft 20F 20T 25F 25T 29T 29F 33F 33F 33T 33T 36T 36F
No information Small damages (not brittle)
No or only minor damages Larger fallouts
Brittle failues/spalling
17
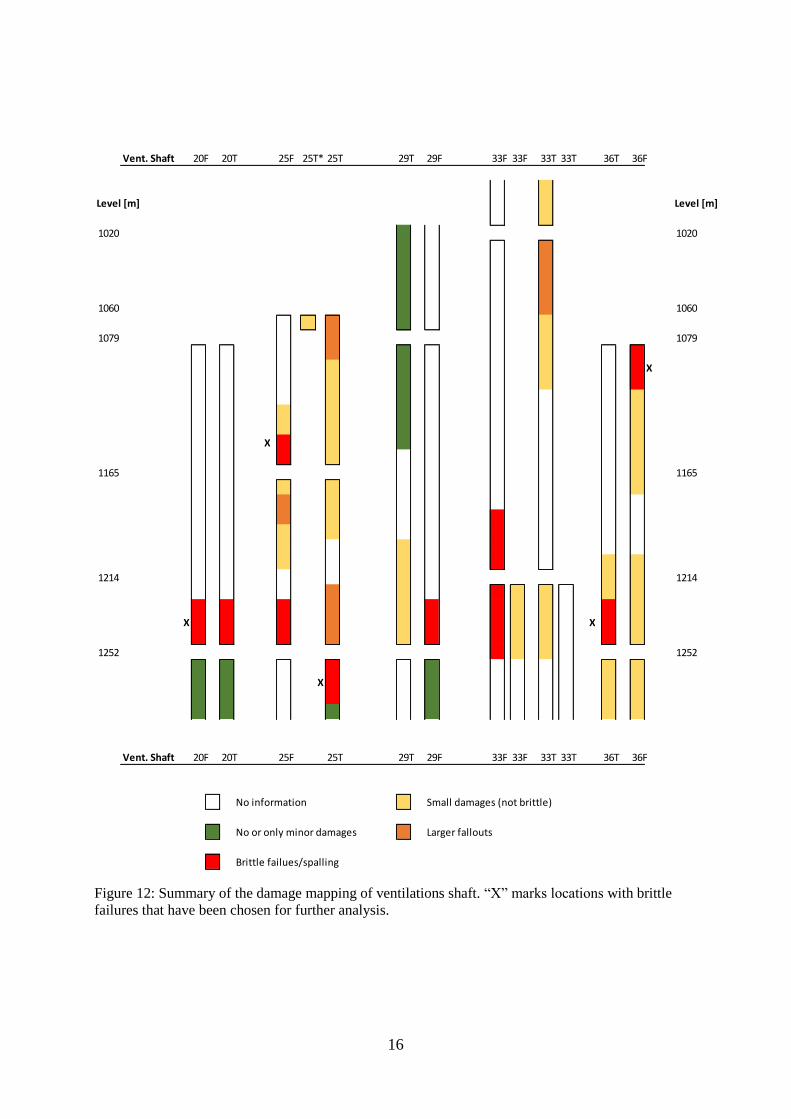
Table 2: Summary of results from geological and damage mapping for ventilation shaft 20F.
Object: Ventilation shaft 20F
Date of observation: January 1, 2017
Type of observation: Visual
Location: Block 22 above the 1252 m level. The shaft is located in
the footwall, 140 m from the orebody.
Production at the observation
date:
100 % of level 993 mined out
0 % of level 1022 mined out, see Figure 13.
Failure type: Spalling damages on the north and south walls of the shaft.
The damages are approximately 20 cm deep and located
above level 1252.
Rock type: Red syenite porphyry
GSI: 65, B2
Figure 13: Figure showing the level of production when the observation was done.
18
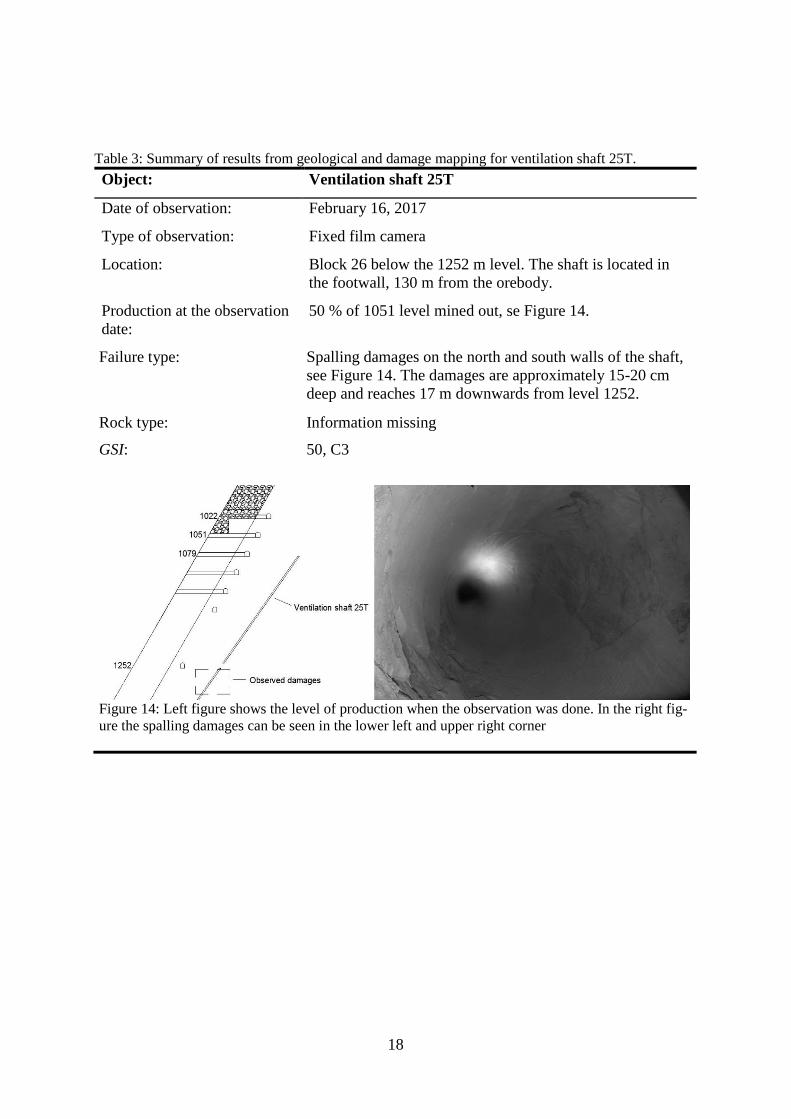
Table 3: Summary of results from geological and damage mapping for ventilation shaft 25T.
Object: Ventilation shaft 25T
Date of observation: February 16, 2017
Type of observation: Fixed film camera
Location: Block 26 below the 1252 m level. The shaft is located in
the footwall, 130 m from the orebody.
Production at the observation
date:
50 % of 1051 level mined out, se Figure 14.
Failure type: Spalling damages on the north and south walls of the shaft,
see Figure 14. The damages are approximately 15-20 cm
deep and reaches 17 m downwards from level 1252.
Rock type: Information missing
GSI: 50, C3
Figure 14: Left figure shows the level of production when the observation was done. In the right fig-
ure the spalling damages can be seen in the lower left and upper right corner
19
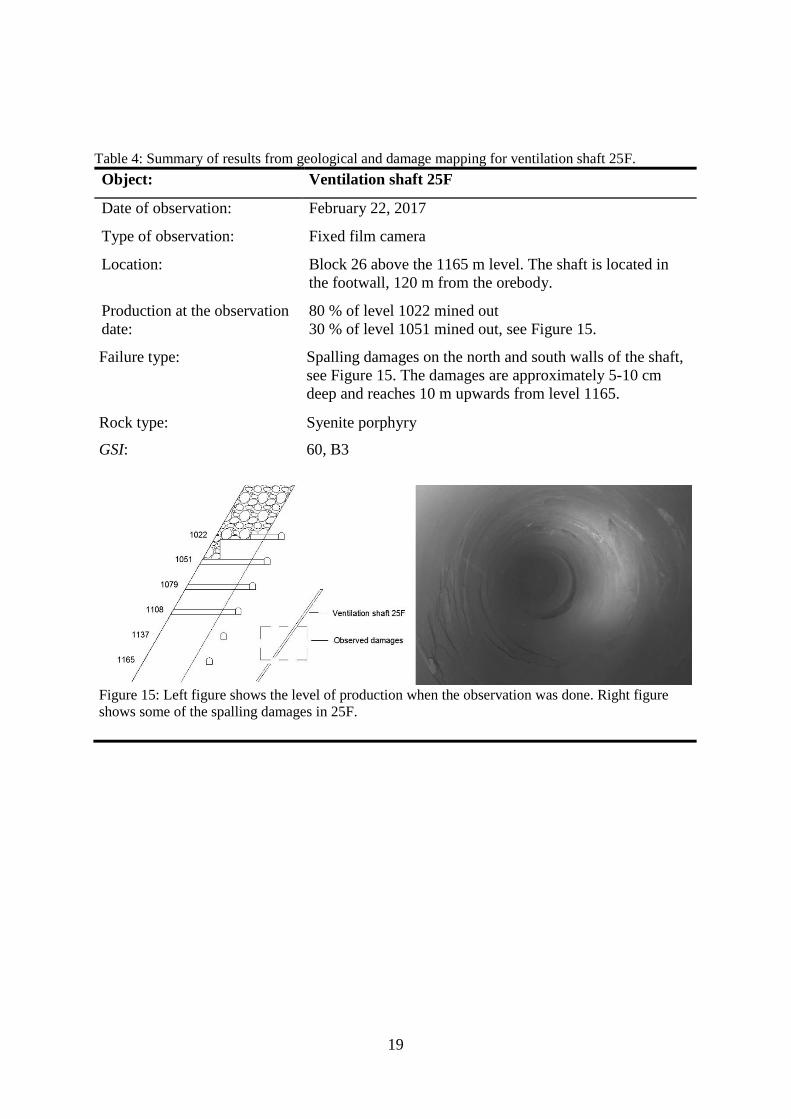
Table 4: Summary of results from geological and damage mapping for ventilation shaft 25F.
Object: Ventilation shaft 25F
Date of observation: February 22, 2017
Type of observation: Fixed film camera
Location: Block 26 above the 1165 m level. The shaft is located in
the footwall, 120 m from the orebody.
Production at the observation
date:
80 % of level 1022 mined out
30 % of level 1051 mined out, see Figure 15.
Failure type: Spalling damages on the north and south walls of the shaft,
see Figure 15. The damages are approximately 5-10 cm
deep and reaches 10 m upwards from level 1165.
Rock type: Syenite porphyry
GSI: 60, B3
Figure 15: Left figure shows the level of production when the observation was done. Right figure
shows some of the spalling damages in 25F.
20
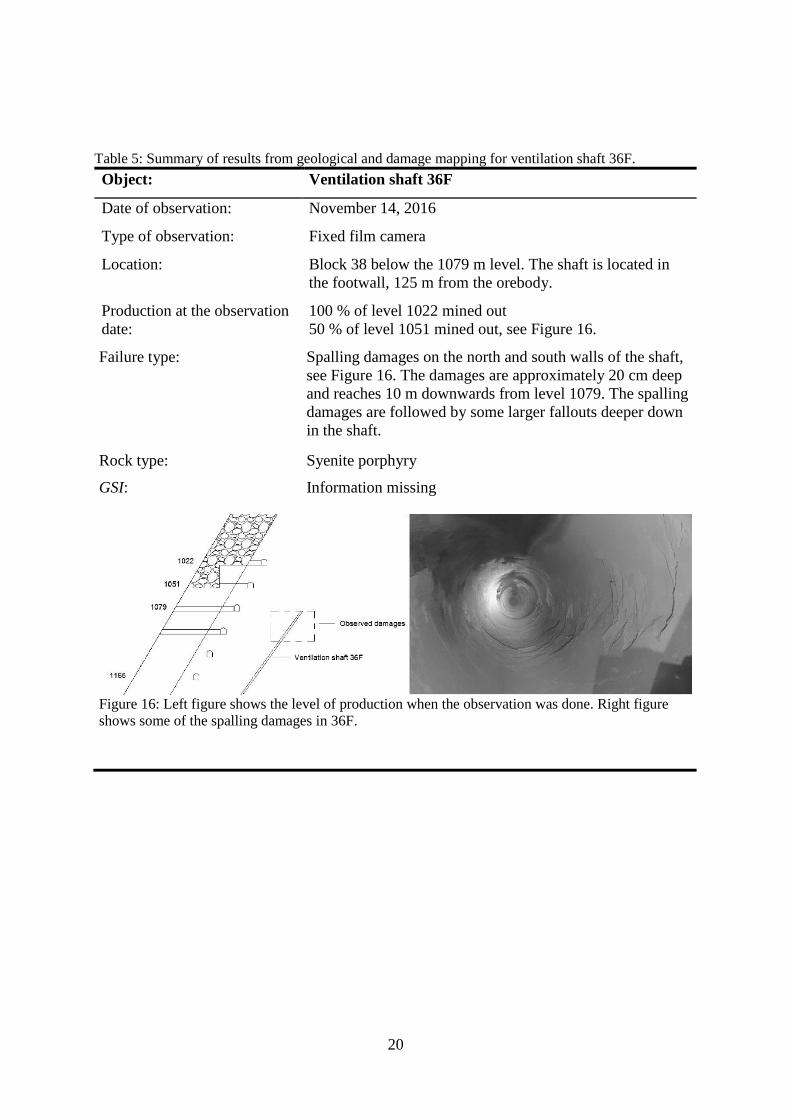
Table 5: Summary of results from geological and damage mapping for ventilation shaft 36F.
Object: Ventilation shaft 36F
Date of observation: November 14, 2016
Type of observation: Fixed film camera
Location: Block 38 below the 1079 m level. The shaft is located in
the footwall, 125 m from the orebody.
Production at the observation
date:
100 % of level 1022 mined out
50 % of level 1051 mined out, see Figure 16.
Failure type: Spalling damages on the north and south walls of the shaft,
see Figure 16. The damages are approximately 20 cm deep
and reaches 10 m downwards from level 1079. The spalling
damages are followed by some larger fallouts deeper down
in the shaft.
Rock type: Syenite porphyry
GSI: Information missing
Figure 16: Left figure shows the level of production when the observation was done. Right figure
shows some of the spalling damages in 36F.
21
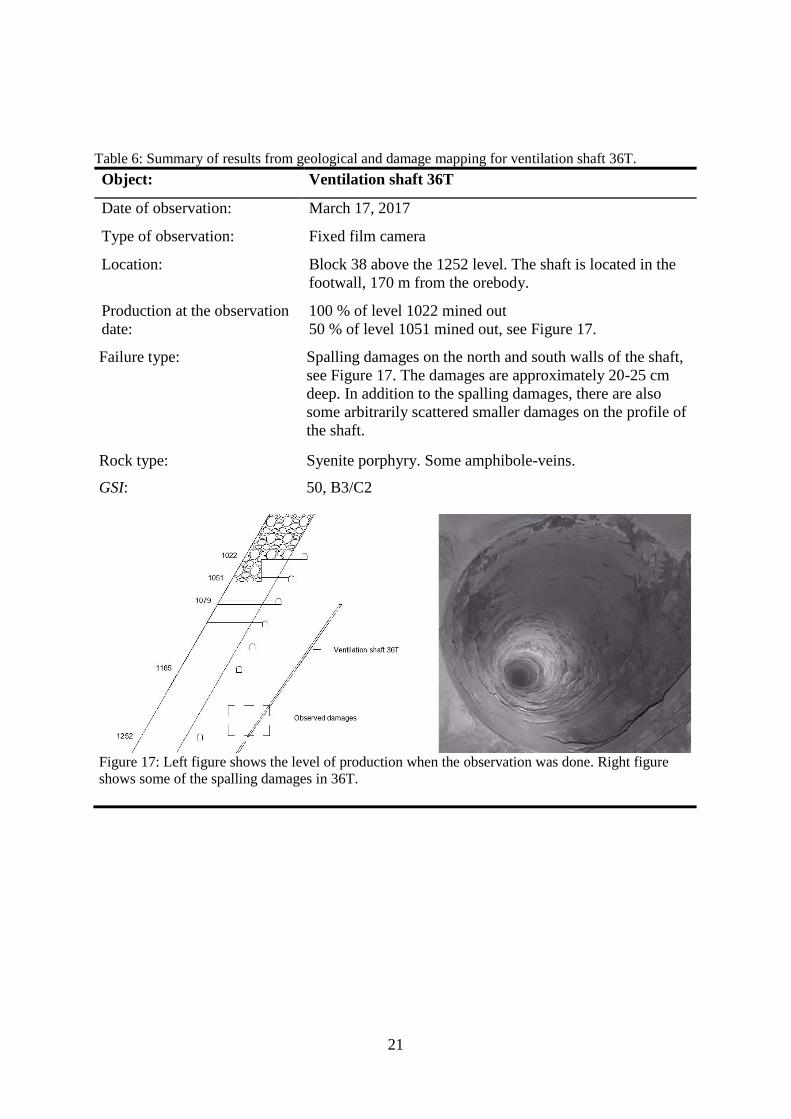
Table 6: Summary of results from geological and damage mapping for ventilation shaft 36T.
Object: Ventilation shaft 36T
Date of observation: March 17, 2017
Type of observation: Fixed film camera
Location: Block 38 above the 1252 level. The shaft is located in the
footwall, 170 m from the orebody.
Production at the observation
date:
100 % of level 1022 mined out
50 % of level 1051 mined out, see Figure 17.
Failure type: Spalling damages on the north and south walls of the shaft,
see Figure 17. The damages are approximately 20-25 cm
deep. In addition to the spalling damages, there are also
some arbitrarily scattered smaller damages on the profile of
the shaft.
Rock type: Syenite porphyry. Some amphibole-veins.
GSI: 50, B3/C2
Figure 17: Left figure shows the level of production when the observation was done. Right figure
shows some of the spalling damages in 36T.
22
4. CALIBRATION OF ROCK MASS STRENGTH PARAME-
TERS
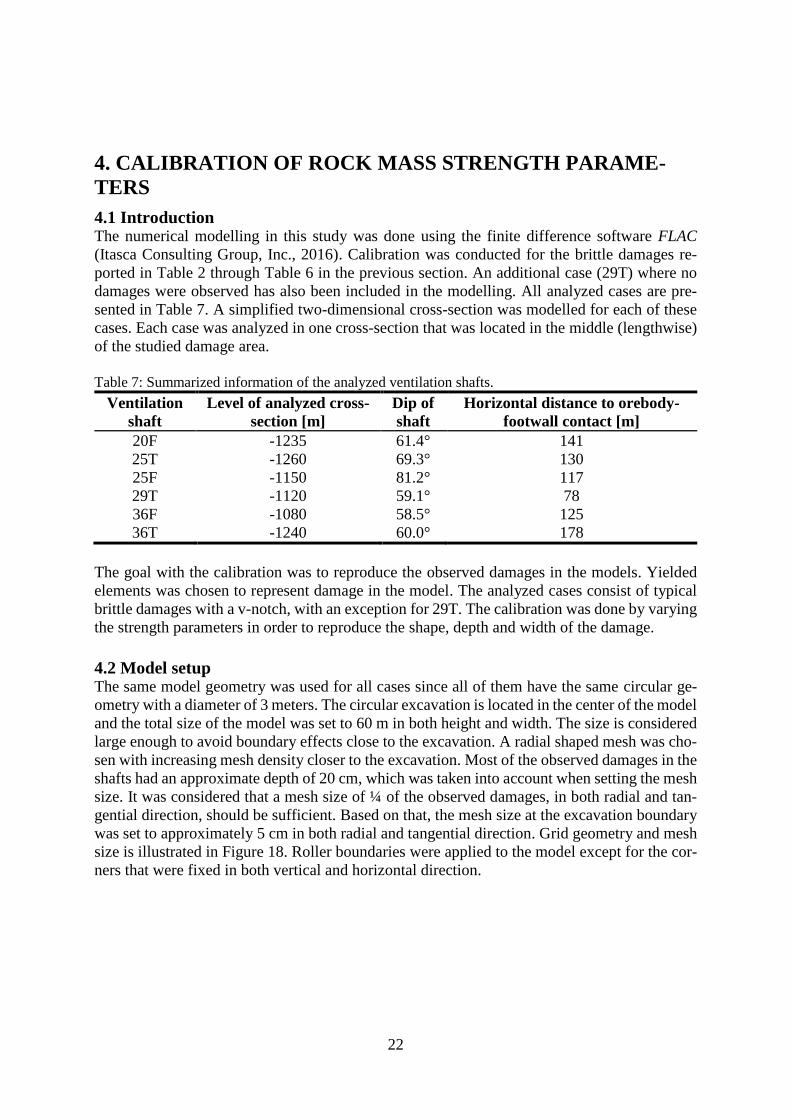
4.1 Introduction The numerical modelling in this study was done using the finite difference software FLAC
(Itasca Consulting Group, Inc., 2016). Calibration was conducted for the brittle damages re-
ported in Table 2 through Table 6 in the previous section. An additional case (29T) where no
damages were observed has also been included in the modelling. All analyzed cases are pre-
sented in Table 7. A simplified two-dimensional cross-section was modelled for each of these
cases. Each case was analyzed in one cross-section that was located in the middle (lengthwise)
of the studied damage area.
Table 7: Summarized information of the analyzed ventilation shafts.
Ventilation
shaft
Level of analyzed cross-
section [m]
Dip of
shaft
Horizontal distance to orebody-
footwall contact [m]
20F -1235 61.4° 141
25T -1260 69.3° 130
25F -1150 81.2° 117
29T -1120 59.1° 78
36F -1080 58.5° 125
36T -1240 60.0° 178
The goal with the calibration was to reproduce the observed damages in the models. Yielded
elements was chosen to represent damage in the model. The analyzed cases consist of typical
brittle damages with a v-notch, with an exception for 29T. The calibration was done by varying
the strength parameters in order to reproduce the shape, depth and width of the damage.
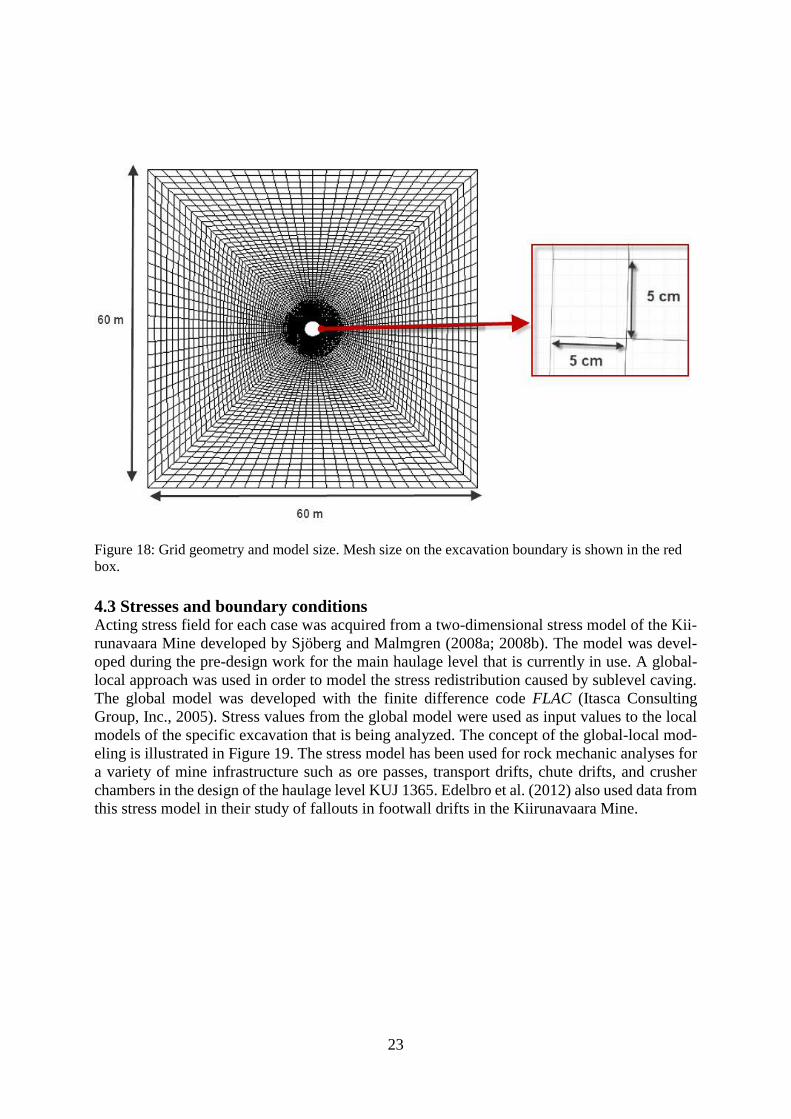
4.2 Model setup The same model geometry was used for all cases since all of them have the same circular ge-
ometry with a diameter of 3 meters. The circular excavation is located in the center of the model
and the total size of the model was set to 60 m in both height and width. The size is considered
large enough to avoid boundary effects close to the excavation. A radial shaped mesh was cho-
sen with increasing mesh density closer to the excavation. Most of the observed damages in the
shafts had an approximate depth of 20 cm, which was taken into account when setting the mesh
size. It was considered that a mesh size of ¼ of the observed damages, in both radial and tan-
gential direction, should be sufficient. Based on that, the mesh size at the excavation boundary
was set to approximately 5 cm in both radial and tangential direction. Grid geometry and mesh
size is illustrated in Figure 18. Roller boundaries were applied to the model except for the cor-
ners that were fixed in both vertical and horizontal direction.
23
Figure 18: Grid geometry and model size. Mesh size on the excavation boundary is shown in the red
box.
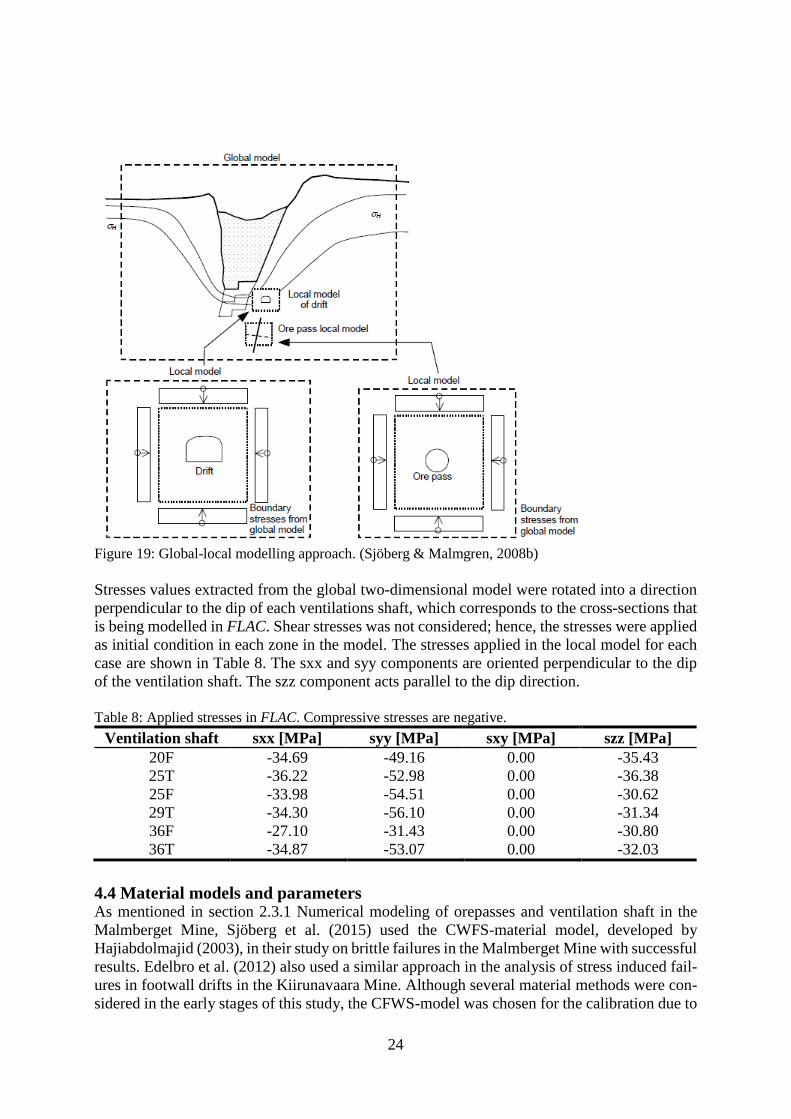
4.3 Stresses and boundary conditions Acting stress field for each case was acquired from a two-dimensional stress model of the Kii-
runavaara Mine developed by Sjöberg and Malmgren (2008a; 2008b). The model was devel-
oped during the pre-design work for the main haulage level that is currently in use. A global-
local approach was used in order to model the stress redistribution caused by sublevel caving.
The global model was developed with the finite difference code FLAC (Itasca Consulting
Group, Inc., 2005). Stress values from the global model were used as input values to the local
models of the specific excavation that is being analyzed. The concept of the global-local mod-
eling is illustrated in Figure 19. The stress model has been used for rock mechanic analyses for
a variety of mine infrastructure such as ore passes, transport drifts, chute drifts, and crusher
chambers in the design of the haulage level KUJ 1365. Edelbro et al. (2012) also used data from
this stress model in their study of fallouts in footwall drifts in the Kiirunavaara Mine.
24
Figure 19: Global-local modelling approach. (Sjöberg & Malmgren, 2008b)
Stresses values extracted from the global two-dimensional model were rotated into a direction
perpendicular to the dip of each ventilations shaft, which corresponds to the cross-sections that
is being modelled in FLAC. Shear stresses was not considered; hence, the stresses were applied
as initial condition in each zone in the model. The stresses applied in the local model for each
case are shown in Table 8. The sxx and syy components are oriented perpendicular to the dip
of the ventilation shaft. The szz component acts parallel to the dip direction.
Table 8: Applied stresses in FLAC. Compressive stresses are negative.
Ventilation shaft sxx [MPa] syy [MPa] sxy [MPa] szz [MPa]
20F -34.69 -49.16 0.00 -35.43
25T -36.22 -52.98 0.00 -36.38
25F -33.98 -54.51 0.00 -30.62
29T -34.30 -56.10 0.00 -31.34
36F -27.10 -31.43 0.00 -30.80
36T -34.87 -53.07 0.00 -32.03
4.4 Material models and parameters As mentioned in section 2.3.1 Numerical modeling of orepasses and ventilation shaft in the
Malmberget Mine, Sjöberg et al. (2015) used the CWFS-material model, developed by
Hajiabdolmajid (2003), in their study on brittle failures in the Malmberget Mine with successful
results. Edelbro et al. (2012) also used a similar approach in the analysis of stress induced fail-
ures in footwall drifts in the Kiirunavaara Mine. Although several material methods were con-
sidered in the early stages of this study, the CFWS-model was chosen for the calibration due to
25
the positive experiences in the previous mentioned studies. More information about the CWFS-
model can be found in section 2.2.1. The actual calibration was done on the initial and residual
cohesion, and the residual friction. The remaining material properties were kept constant
throughout the calibration process.
The elastic parameters and the density were based on the previous work by Sjöberg et al. (2012)
and are considered as representative values for the footwall material in Kiirunavaara. The in-
fluence of the tensile strength was tested in the early stages of the analysis. The test showed
that the tensile strength has some minor influence on the shape of the damages, while the max-
imum depth and width are not affected significantly when the tensile strength is varied within
reasonable values. The tensile strength was kept constant at 0 MPa in the continued analysis in
this work. Typical values of dilation angle for rock material varies between 0 and 20° according
to Vermeer and de Borst (1984). An average value of 10° was chosen for this study. A summary
of the material parameters is shown in Table 9.
Table 9: Material parameters values used in the calibration.
Young’s modulus,
E [GPa]
Poisson’s
ratio,
Density, ρ
[kg/m3]
Tensile strength,
σt [MPa]
Dilation
angle [°]
70 0.27 2800 0 10
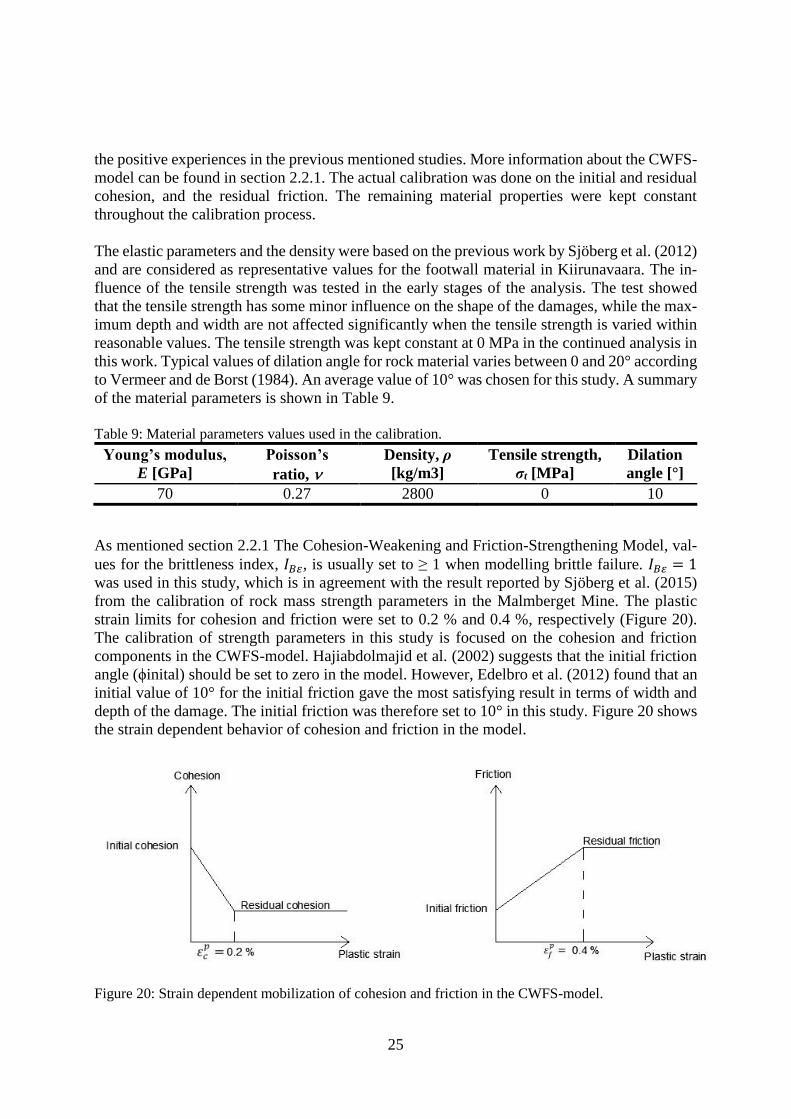
As mentioned section 2.2.1 The Cohesion-Weakening and Friction-Strengthening Model, val-
ues for the brittleness index, 𝐼𝐵𝜀, is usually set to ≥ 1 when modelling brittle failure. 𝐼𝐵𝜀 = 1
was used in this study, which is in agreement with the result reported by Sjöberg et al. (2015)
from the calibration of rock mass strength parameters in the Malmberget Mine. The plastic
strain limits for cohesion and friction were set to 0.2 % and 0.4 %, respectively (Figure 20).
The calibration of strength parameters in this study is focused on the cohesion and friction
components in the CWFS-model. Hajiabdolmajid et al. (2002) suggests that the initial friction
angle (ϕinital) should be set to zero in the model. However, Edelbro et al. (2012) found that an
initial value of 10° for the initial friction gave the most satisfying result in terms of width and
depth of the damage. The initial friction was therefore set to 10° in this study. Figure 20 shows
the strain dependent behavior of cohesion and friction in the model.
Figure 20: Strain dependent mobilization of cohesion and friction in the CWFS-model.
26
4.5 Procedure The purpose with the calibration is to determine material properties that successfully reproduce
the observed damages in the model. This study has focused on calibrating the strength param-
eters of friction and cohesion by using the CWFS-model. Starting values for the parameters
was obtained from Edelbro et al. (2012). These parameters were initially varied randomly
within a span of approximately ±20 % in order to get a feeling of the level of influence for each
parameter.
One of the first conclusions was that the initial cohesion has the highest influence on damage
initiation and also the extent of the damage. The first step was therefore to find a value of the
initial cohesion that resulted in a rough reproduction of the observed damage. The residual
cohesion and residual friction was kept constant at the values obtained from Edelbro et al.
(2012) during this process. The model was thereafter fine-tuned by adjusting the residual cohe-
sion and residual friction. Shape, depth (radial direction), and width (tangential direction) of
the damages was taken into account in the calibration.
The procedure when calibrating against the observation of ventilation shaft 29T was somewhat
different since it was undamaged. The calibration of this case only consisted of determination
of the initial cohesion. The result from this case can only be interpreted as the lowest possible
value for the initial cohesion. Any value lower will result in damage initiation in the model.
4.6 Calibration results
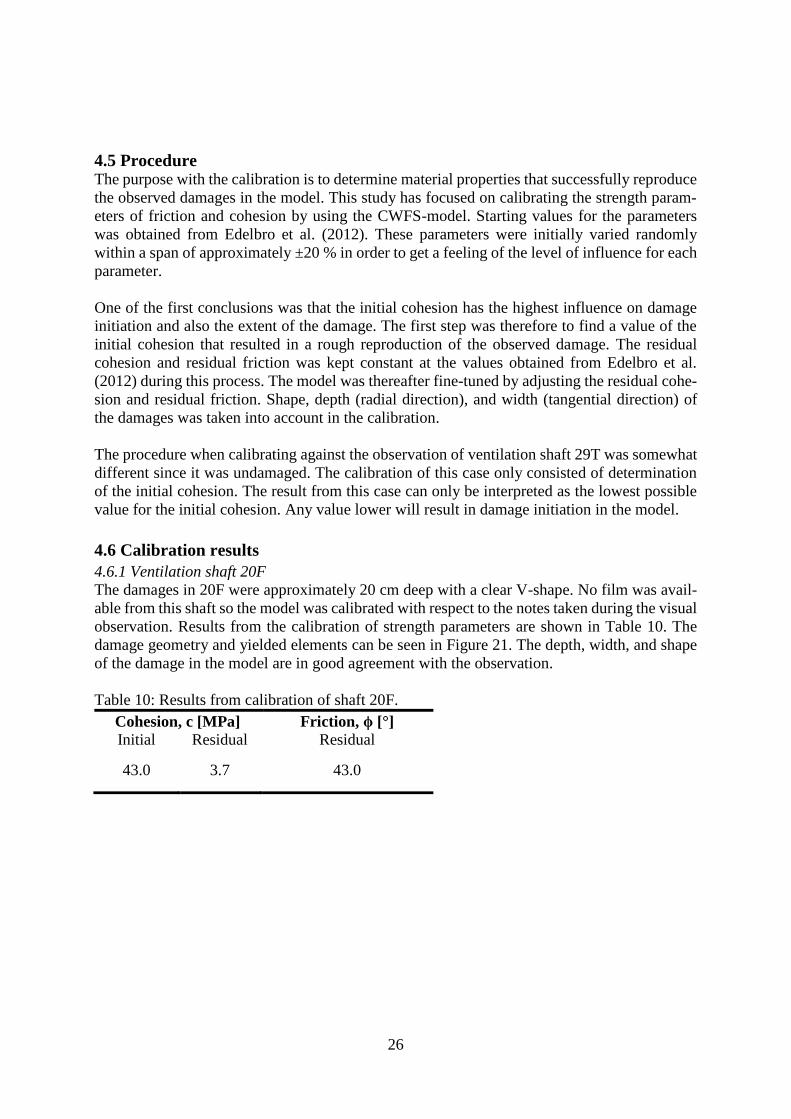
4.6.1 Ventilation shaft 20F
The damages in 20F were approximately 20 cm deep with a clear V-shape. No film was avail-
able from this shaft so the model was calibrated with respect to the notes taken during the visual
observation. Results from the calibration of strength parameters are shown in Table 10. The
damage geometry and yielded elements can be seen in Figure 21. The depth, width, and shape
of the damage in the model are in good agreement with the observation.
Table 10: Results from calibration of shaft 20F.
Cohesion, c [MPa] Friction, ϕ [°]
Initial Residual Residual
43.0 3.7 43.0
27
Figure 21: Yielded elements in the FLAC-model for ventilation shaft 20F.
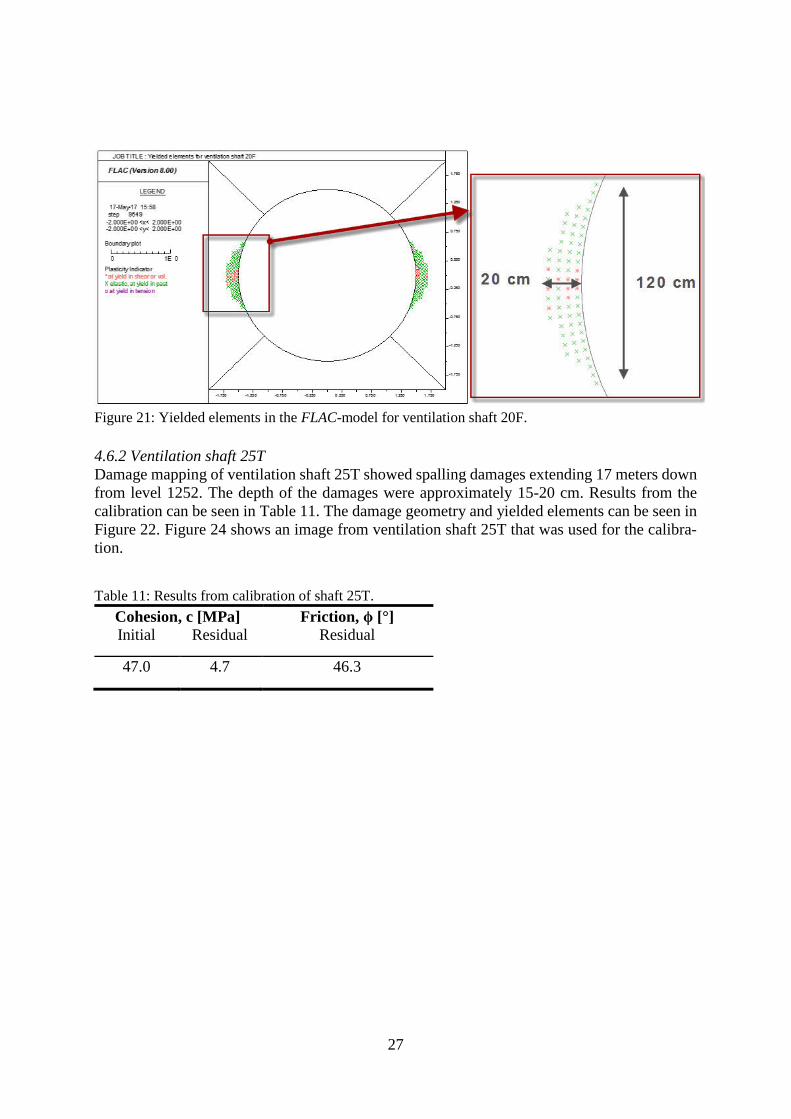
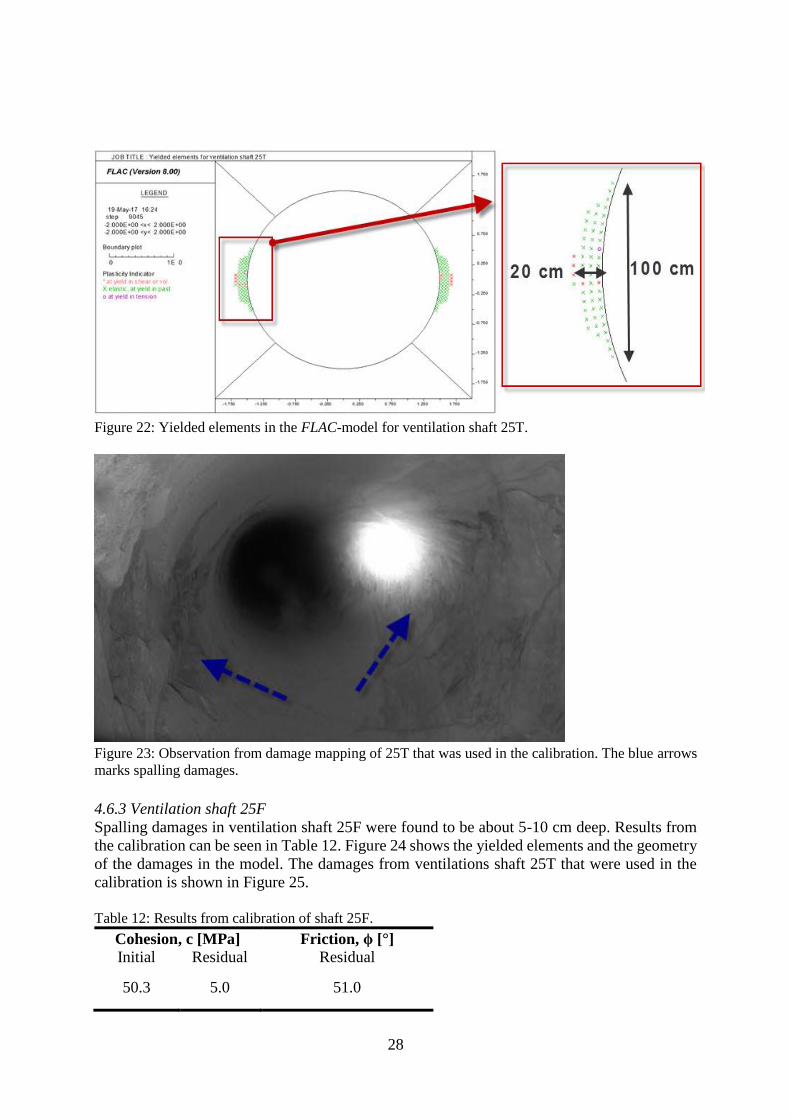
4.6.2 Ventilation shaft 25T
Damage mapping of ventilation shaft 25T showed spalling damages extending 17 meters down
from level 1252. The depth of the damages were approximately 15-20 cm. Results from the
calibration can be seen in Table 11. The damage geometry and yielded elements can be seen in
Figure 22. Figure 24 shows an image from ventilation shaft 25T that was used for the calibra-
tion.
Table 11: Results from calibration of shaft 25T.
Cohesion, c [MPa] Friction, ϕ [°]
Initial Residual Residual
47.0 4.7 46.3
28
Figure 22: Yielded elements in the FLAC-model for ventilation shaft 25T.
Figure 23: Observation from damage mapping of 25T that was used in the calibration. The blue arrows
marks spalling damages.
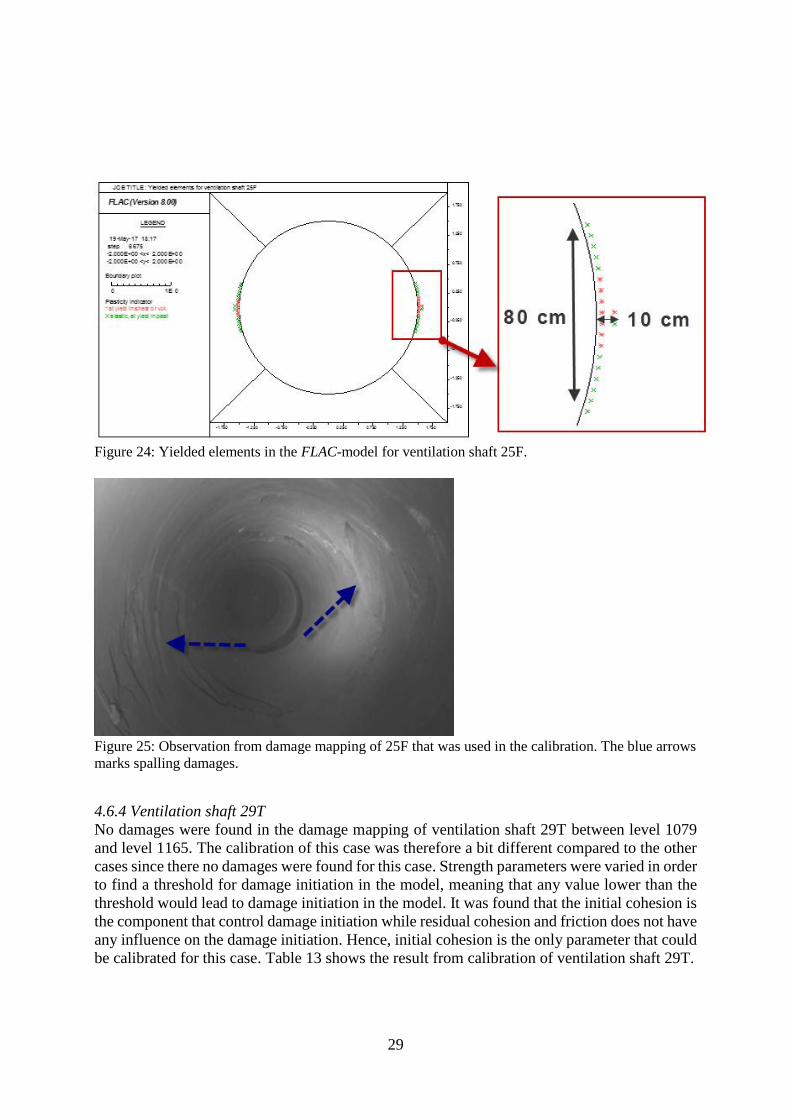
4.6.3 Ventilation shaft 25F
Spalling damages in ventilation shaft 25F were found to be about 5-10 cm deep. Results from
the calibration can be seen in Table 12. Figure 24 shows the yielded elements and the geometry
of the damages in the model. The damages from ventilations shaft 25T that were used in the
calibration is shown in Figure 25.
Table 12: Results from calibration of shaft 25F.
Cohesion, c [MPa] Friction, ϕ [°]
Initial Residual Residual
50.3 5.0 51.0
29
Figure 24: Yielded elements in the FLAC-model for ventilation shaft 25F.
Figure 25: Observation from damage mapping of 25F that was used in the calibration. The blue arrows
marks spalling damages.
4.6.4 Ventilation shaft 29T
No damages were found in the damage mapping of ventilation shaft 29T between level 1079
and level 1165. The calibration of this case was therefore a bit different compared to the other
cases since there no damages were found for this case. Strength parameters were varied in order
to find a threshold for damage initiation in the model, meaning that any value lower than the
threshold would lead to damage initiation in the model. It was found that the initial cohesion is
the component that control damage initiation while residual cohesion and friction does not have
any influence on the damage initiation. Hence, initial cohesion is the only parameter that could
be calibrated for this case. Table 13 shows the result from calibration of ventilation shaft 29T.
30
Table 13: Results from calibration of shaft 29T.
Cohesion, c [MPa] Friction, ϕ [°]
Initial Residual Residual
≥ 55.1 - -
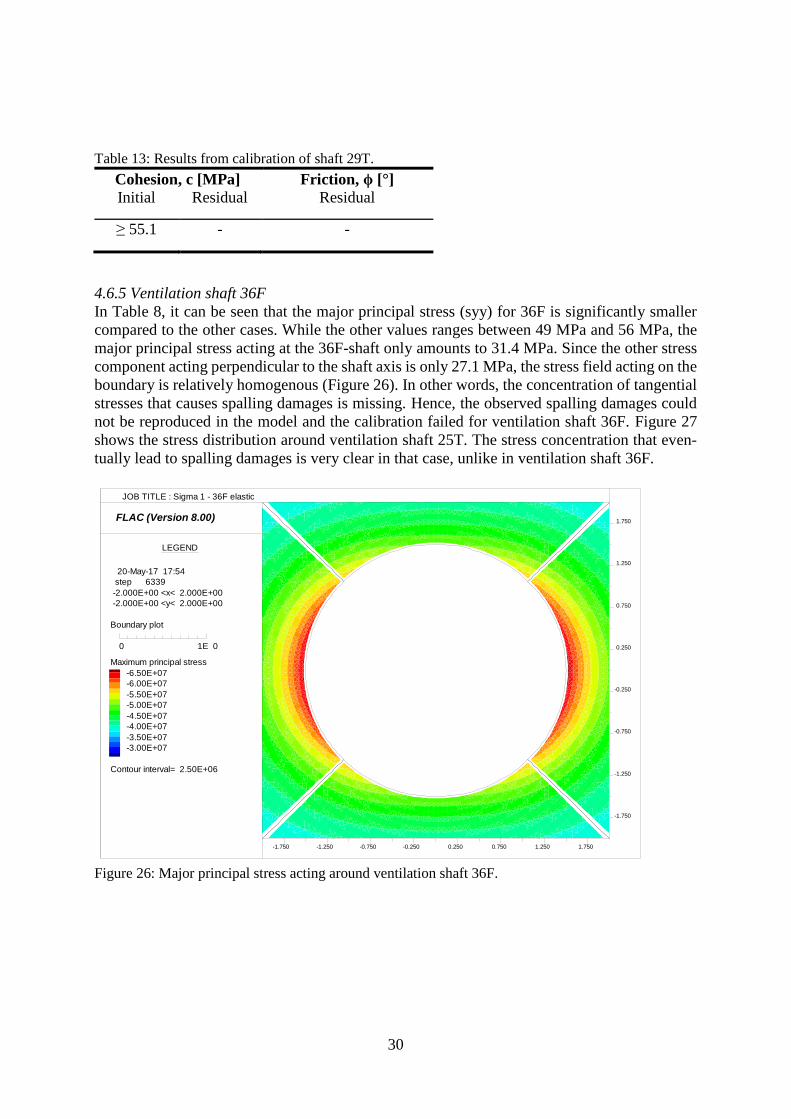
4.6.5 Ventilation shaft 36F
In Table 8, it can be seen that the major principal stress (syy) for 36F is significantly smaller
compared to the other cases. While the other values ranges between 49 MPa and 56 MPa, the
major principal stress acting at the 36F-shaft only amounts to 31.4 MPa. Since the other stress
component acting perpendicular to the shaft axis is only 27.1 MPa, the stress field acting on the
boundary is relatively homogenous (Figure 26). In other words, the concentration of tangential
stresses that causes spalling damages is missing. Hence, the observed spalling damages could
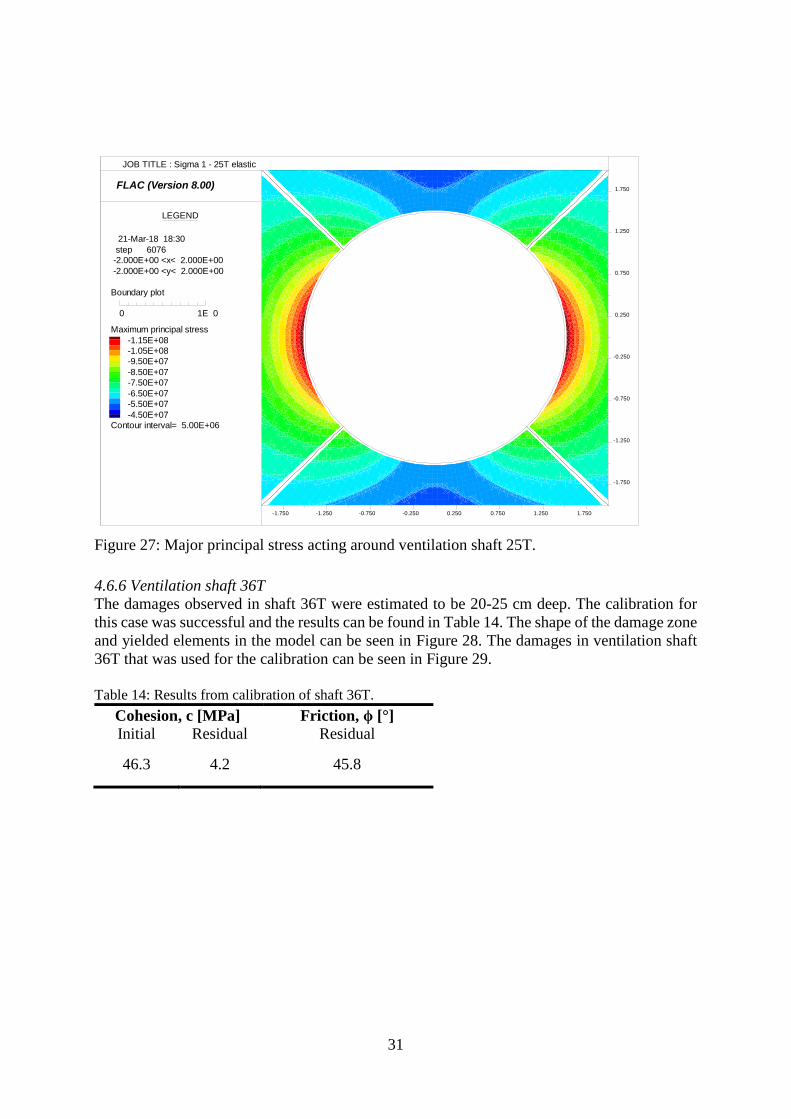
not be reproduced in the model and the calibration failed for ventilation shaft 36F. Figure 27
shows the stress distribution around ventilation shaft 25T. The stress concentration that even-
tually lead to spalling damages is very clear in that case, unlike in ventilation shaft 36F.
Figure 26: Major principal stress acting around ventilation shaft 36F.
FLAC (Version 8.00)
LEGEND
20-May-17 17:54
step 6339
-2.000E+00 <x< 2.000E+00
-2.000E+00 <y< 2.000E+00
Boundary plot
0 1E 0
Maximum principal stress
-6.50E+07
-6.00E+07
-5.50E+07
-5.00E+07
-4.50E+07
-4.00E+07
-3.50E+07
-3.00E+07
Contour interval= 2.50E+06
-1.750
-1.250
-0.750
-0.250
0.250
0.750
1.250
1.750
-1.750 -1.250 -0.750 -0.250 0.250 0.750 1.250 1.750
JOB TITLE : Sigma 1 - 36F elastic
31
Figure 27: Major principal stress acting around ventilation shaft 25T.
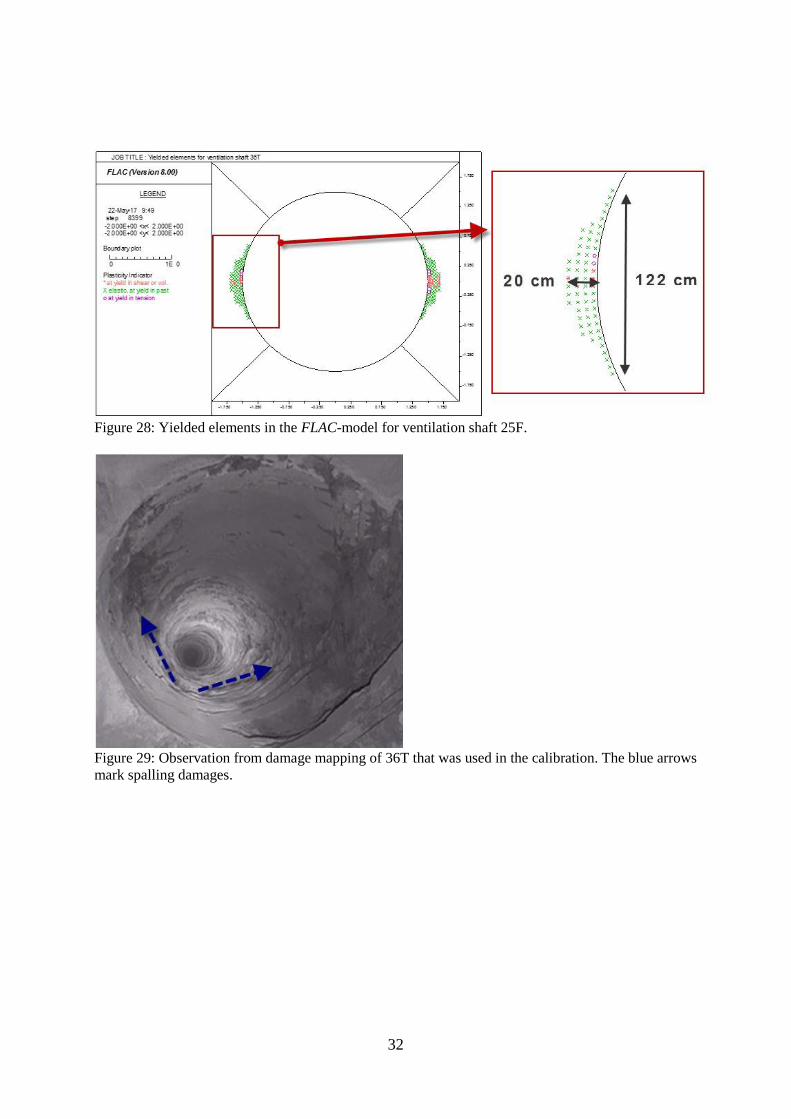
4.6.6 Ventilation shaft 36T
The damages observed in shaft 36T were estimated to be 20-25 cm deep. The calibration for
this case was successful and the results can be found in Table 14. The shape of the damage zone
and yielded elements in the model can be seen in Figure 28. The damages in ventilation shaft
36T that was used for the calibration can be seen in Figure 29.
Table 14: Results from calibration of shaft 36T.
Cohesion, c [MPa] Friction, ϕ [°]
Initial Residual Residual
46.3 4.2 45.8
FLAC (Version 8.00)
LEGEND
21-Mar-18 18:30
step 6076
-2.000E+00 <x< 2.000E+00
-2.000E+00 <y< 2.000E+00
Boundary plot
0 1E 0
Maximum principal stress
-1.15E+08
-1.05E+08
-9.50E+07
-8.50E+07
-7.50E+07
-6.50E+07
-5.50E+07
-4.50E+07
Contour interval= 5.00E+06
-1.750
-1.250
-0.750
-0.250
0.250
0.750
1.250
1.750
-1.750 -1.250 -0.750 -0.250 0.250 0.750 1.250 1.750
JOB TITLE : Sigma 1 - 25T elastic
32
Figure 28: Yielded elements in the FLAC-model for ventilation shaft 25F.
Figure 29: Observation from damage mapping of 36T that was used in the calibration. The blue arrows
mark spalling damages.
33
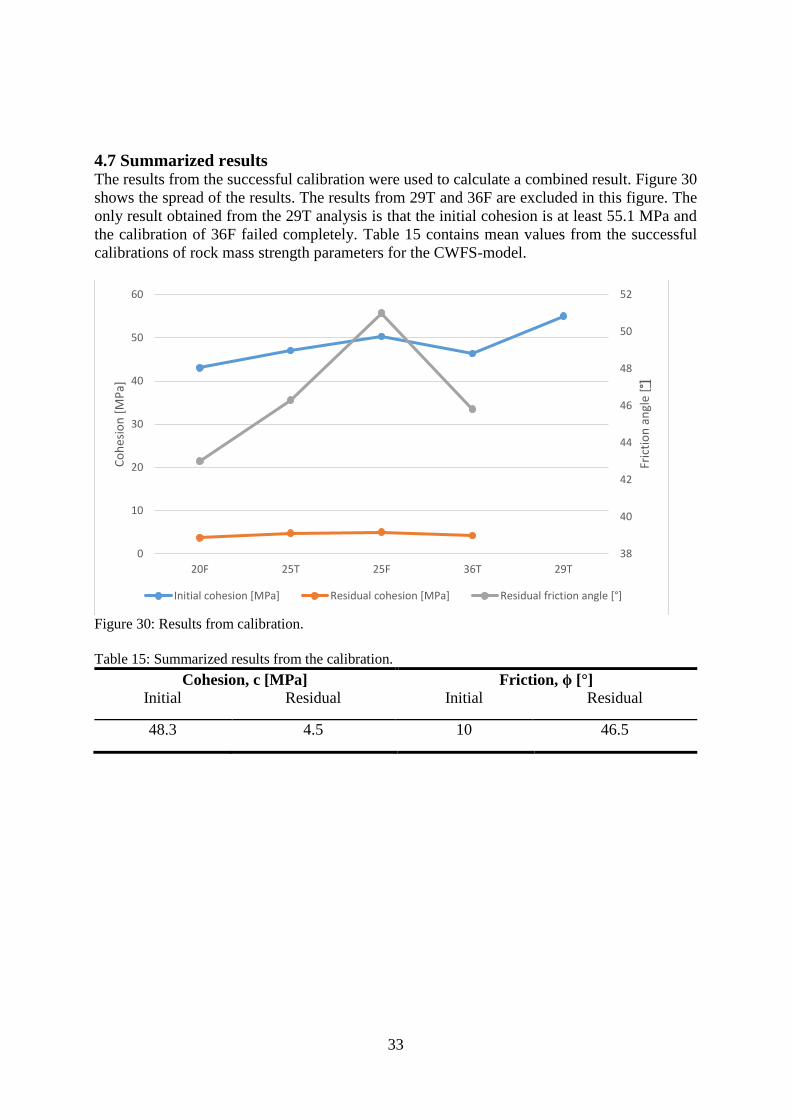
4.7 Summarized results The results from the successful calibration were used to calculate a combined result. Figure 30
shows the spread of the results. The results from 29T and 36F are excluded in this figure. The
only result obtained from the 29T analysis is that the initial cohesion is at least 55.1 MPa and
the calibration of 36F failed completely. Table 15 contains mean values from the successful
calibrations of rock mass strength parameters for the CWFS-model.
Figure 30: Results from calibration.
Table 15: Summarized results from the calibration.
Cohesion, c [MPa] Friction, ϕ [°]
Initial Residual Initial Residual
48.3 4.5 10 46.5
38
40
42
44
46
48
50
52
0
10
20
30
40
50
60
20F 25T 25F 36T 29T
Fric
tio
n a
ngl
e [°
]
Co
hes
ion
[M
Pa]
Initial cohesion [MPa] Residual cohesion [MPa] Residual friction angle [°]
34
5. PROGNOSIS OF FUTURE SPALLING
5.1 Introduction As mentioned earlier in the report, future mining at greater depth might lead to increasing prob-
lems with stress-induced failures. This section presents a prediction of the extent of spalling in
two ventilation shafts for future mining. The CWFS-material model used in the calibration was
used in this part as well. The numerical model setup presented in section 4.2 was also used in
this part. Material parameters were also kept the same as in the calibration including the results
from the calibration. Density and elastic parameters can be seen in Table 16 and rock mass
strength parameters in Table 17. The plastic strain limits for cohesion and friction were set to
0.2 % and 0.4 %, respectively.
Table 16: Density and elastic parameters used in prognosis calculations.
Young’s modulus, E [GPa] Poisson’s ratio, ν Density, ρ [kg/m3]
70 0.27 2800
Table 17: Rock mass strength parameters used in prognosis calculations.
Tensile strength, σt
[MPa]
Dilation angle
[°]
Cohesion, c
[MPa]
Friction, ϕ [°]
0 10 Initial Residual Initial Residual
48.3 4.5 10 46.5
Two ventilation shafts were chosen for the prognosis calculation, 25T and 29F. These were
chosen mainly based on their location in the mine, which is block 26 and block 30, respectively.
These locations are considered as suitable to apply in the two-dimensional model. Some of the
other blocks, such as block 19 and 34, might have slightly deviating stress field compared to
other blocks of the mine. In block 19, this can be caused by an alternative mining sequence that
is currently being used. The irregular shape of the orebody in block 34 might also cause varia-
tions in the stress field. Production at the future levels 1165 and 1223 was simulated in order to
get an indication of the extent of spalling damages in the future.
5.2 Stress field The two-dimensional stress model presented in section 4.3 was used for this part as well
(Sjöberg & Malmgren, 2008a; 2008b). The stress redistribution caused by the mining method
generates stress concentrations below the active production level. The first step in this prognosis
was therefore to investigate how the ventilation shafts are affected by the stress redistribution
and where in the shaft spalling damages are most likely to occur, i.e., determining the level in
each shaft that will have the highest concentration of tangential stresses.
The virgin stress values were extracted for different levels along the location of each shaft. The
tangential stresses on the excavation boundary of the shaft were thereafter calculated with the
equation presented by Kirsch (1898). This was done for several levels along the shaft reaching
about 100 meters below the actual mining level. Appendix B contains results from the stress
evaluation of ventilation shafts caused by future mining. High tangential stress concentration
was the main parameter that was considered when selecting level for further analysis.
35
The first level chosen for the prognosis analysis is level 1165, which is three levels below the
deepest level that is currently active. The stress evaluation showed that the tangential stresses
will increase linearly with increasing depth (Figure 35 and Figure 36 in Appendix B). The eval-
uation was done to level 1245, which was chosen for further analysis. However, it is possible
that the stress increases even farther down into the shaft but the evaluation was limited to level
1245.
Level 1223 was chosen as the second level for prognosis analysis. The stress evaluation of this
case showed that the stresses increase linearly down to level 1360 approximately where the
curve flattens out (Figure 37 and Figure 38 in Appendix B). Level 1360 was therefore chosen
for the prognosis calculation. The stresses applied to the FLAC model for prognosis calculation
are shown in Table 18. Ventilation shaft 25T is exposed to higher stresses compared to 29F for
both mining levels. That is caused by the fact that shaft 25T is located closer to the orebody
than 29F.
Table 18: Analyzed ventilation shaft in prognosis calculation and the stresses applied to the FLAC-
model for each case.
Ventila-
tion shaft
Active min-
ing level [m]
Studied level in
ventilation shaft
[m]
sxx
[MPa]
syy
[MPa]
sxy
[MPa]
szz
[MPa]
25T 1165 1245 -33.79 -53.86 0.00 -27.04
29F 1165 1245 -32.88 -44.07 0.00 -33.45
25T 1223 1359 -38.35 -63.54 0.00 -30.05
29F 1223 1360 -38.94 -59.09 0.00 -36.66
5.2 Results
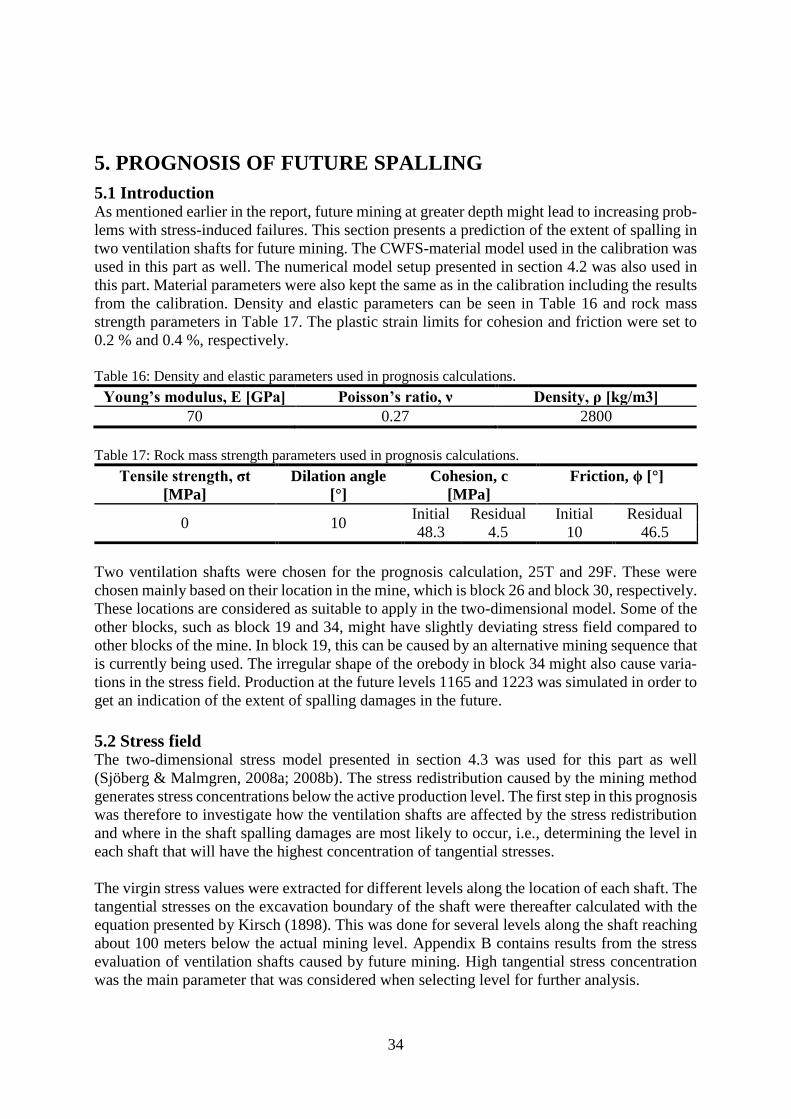
5.2.1 Mining at level 1165
The results from the prognosis calculation of ventilation shaft 25T at level 1245 can be seen in
Figure 31 and Figure 32. It shows that spalling damages with a depth of 20 cm and a width of
100 cm could be expected when the mining reaches level 1165. As mentioned previously, the
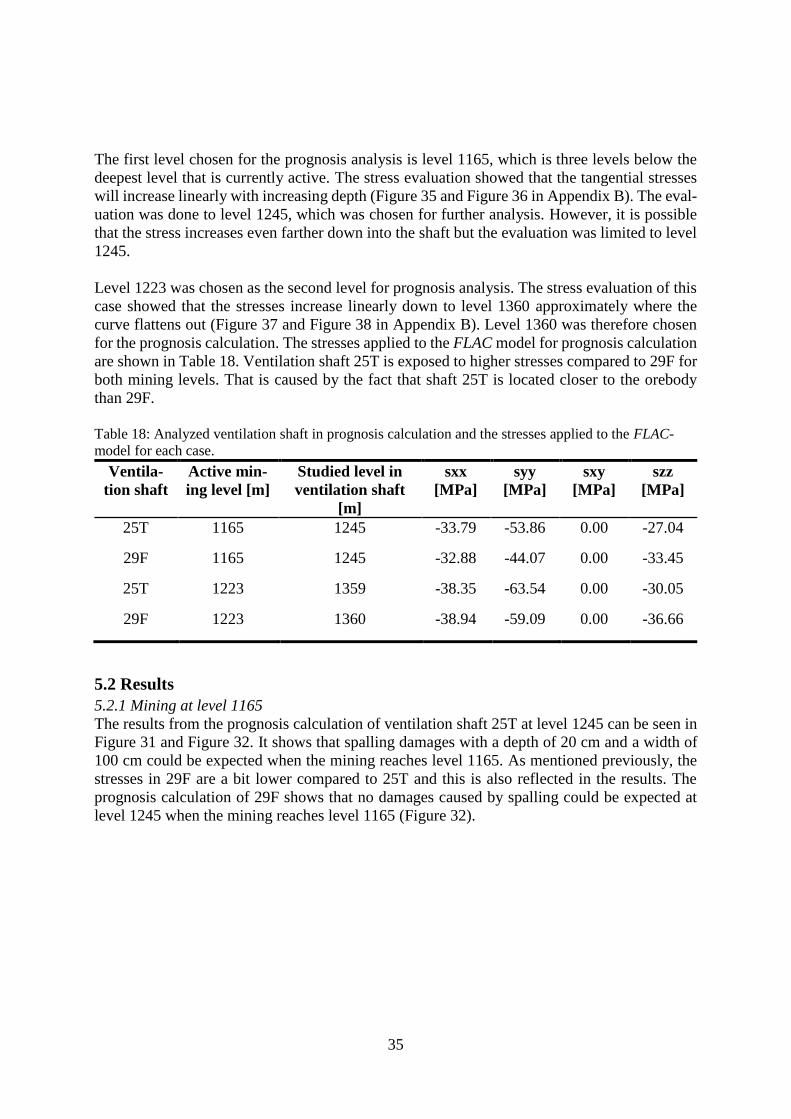
stresses in 29F are a bit lower compared to 25T and this is also reflected in the results. The
prognosis calculation of 29F shows that no damages caused by spalling could be expected at
level 1245 when the mining reaches level 1165 (Figure 32).
36
Figure 31: Prognosis of yielded elements for 25T, level 1245 when mining is conducted at level 1165.
Figure 32: Prognosis of yielded elements for 29F, level 1245 when mining is conducted at level 1165.
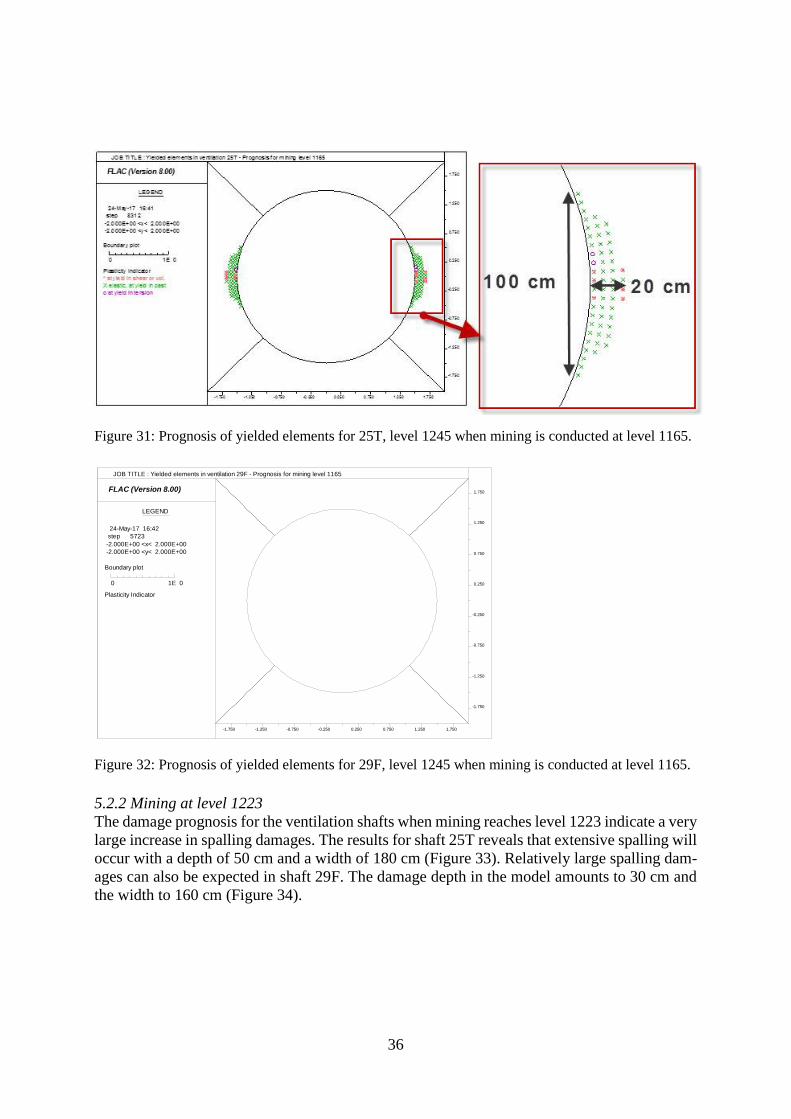
5.2.2 Mining at level 1223
The damage prognosis for the ventilation shafts when mining reaches level 1223 indicate a very
large increase in spalling damages. The results for shaft 25T reveals that extensive spalling will
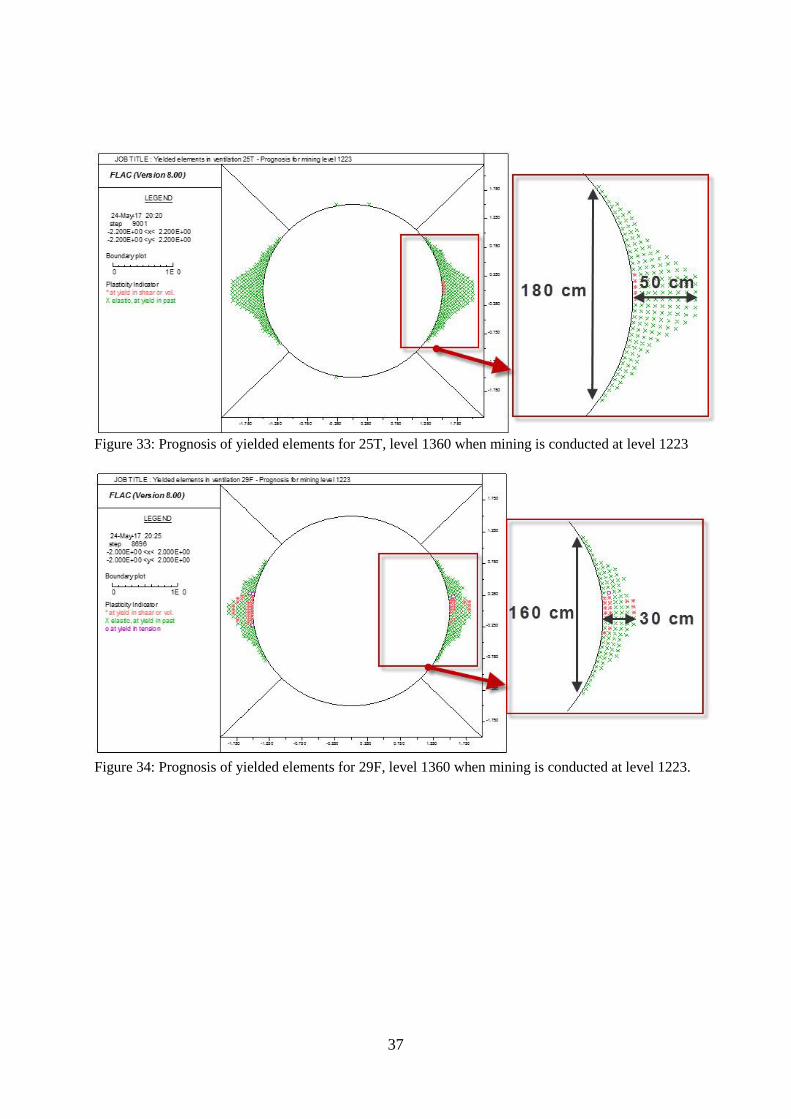
occur with a depth of 50 cm and a width of 180 cm (Figure 33). Relatively large spalling dam-
ages can also be expected in shaft 29F. The damage depth in the model amounts to 30 cm and
the width to 160 cm (Figure 34).
FLAC (Version 8.00)
LEGEND
24-May-17 16:42
step 5723
-2.000E+00 <x< 2.000E+00
-2.000E+00 <y< 2.000E+00
Boundary plot
0 1E 0
Plasticity Indicator
-1.750
-1.250
-0.750
-0.250
0.250
0.750
1.250
1.750
-1.750 -1.250 -0.750 -0.250 0.250 0.750 1.250 1.750
JOB TITLE : Yielded elements in ventilation 29F - Prognosis for mining level 1165
37
Figure 33: Prognosis of yielded elements for 25T, level 1360 when mining is conducted at level 1223
Figure 34: Prognosis of yielded elements for 29F, level 1360 when mining is conducted at level 1223.
38
6. DISCUSSION AND CONCLUSIONS
The calibration of ventilation shaft 36F failed due to the low stress field applied to the FLAC-
model. It should be kept in mind that the stress values were obtained for the mining situation at
the time of the observation and that it is possible that the shaft has been exposed to higher
stresses previously. For the 36F case, the mining production was taking place one level above
the studied cross-section at the time of observation. It is therefore most likely that it has been
exposed to higher stresses before that time, which caused the observed spalling damages.
Most of the brittle damages that were used in the calibration had a depth of approximately 20
cm, with 25F as a clear exception with its 10 cm damage depth. The size of the observed dam-
ages was taken into consideration when the zone size in the FLAC-model was configured. The
zone size was set to 5 cm in both radial and tangential direction, which was considered a suitable
size for modelling damages with a depth of 20 cm. This zone size is, however, not optimal for
the case with 10 cm damages where smaller zone size might have been better to use. Neverthe-
less, the results from calibration of 25F were reasonable in comparison with the other results.
The fact that the stresses were relatively high, in combination with the small damages, indicated
that the strength values should be slightly higher compared to the other cases. The results from
the calibration confirmed this.
The scatter of the results from the calibration is shown in Figure 30. It is noticeable that the
scatter in strength is relatively low for all parameters. They are also in fair agreement with the
parameter values used in previously works, such as Edelbro et al. (2012), see Table 19 for a
comparison. The calibrated values for residual cohesion and residual friction are within the
range of values that Edelbro et al. used in their work. However, the result for initial cohesion is
slightly lower.
Table 19: Results from calibration and values from Edelbro et al. (2012).
Mean value of cali-
bration results
Input values in Edelbro et al. (2012)
Low Typical High
Initial cohesion [MPa] 48.3 51 60 62
Residual cohesion [MPa] 4.5 2.8 4.2 6.3
Residual friction [°] 46.5 44 52 57
Another conclusion from the calibration was that the modeling result was quite sensitive to
changes in parameter values, especially regarding the initial cohesion. Changes of 1-2 % caused
considerable differences in the modelling result. Residual cohesion and residual friction were
slightly less sensitive. Changes of 3-4 % were, however, large enough to affect the modelling
result significantly.
It is worth noting that most of the spalling damages found in the ventilation shaft are located
around the 1252 level. Some damages were observed higher up in the mine, but all the obser-
vations done below the 1252 did not contain any spalling damages. Most of the production was
taking place at the 1051 level when the observation was done, which is about 200 m above the
39
damages. These results show that the redistribution of stresses due to mining causes spalling
damages up to 200 m below the active production level at the location of the shafts.
The prognosis calculation for mining production at level 1223 indicates that the problem with
stress-induced failure might cause more serious problems in the future. Spalling damages with
a depth of up to 50 cm in ventilation shaft is considered being relatively large. The results also
show that the distance between the ventilation shaft and the orebody-footwall contact influence
the extent of spalling damages. The 25T shaft had around 20 % higher stresses acting perpen-
dicular to the shaft axis, compared to the 29F shaft. The prognosis calculation shows that this
20 % difference had a relatively large impact on the extent of spalling damage in the model.
For the case when mining was conducted at level 1165, the 25T shaft had 20 cm deep spalling
failures while the 29F shaft was undamaged. In the second case, when mining was conducted
at level 1223, shaft 25T had a damage depth of 50 cm and 29F 30 cm.
40
7. RECOMMENDATIONS
Based on the results and experiences gained during this study, there are some recommendations
for future research and improvements, as follows:
Continued improvement of damage mapping in orepasses and ventilation shafts. LKAB
is currently developing methods in order to improve the mapping, which is good. How-
ever, there are some details in the procedure of damage mapping that could be improved
in order to be more useful from a rock mechanics perspective:
o Information about what depth in the shaft the damages occur. The camera cur-
rently used contains a laser that can be used for this measurement. It is therefore
only a question of documentation improvement.
o Some of the films of the orepasses are missing information of which level the
filming was done from.
o Inspect ventilation shaft on a more regular basis. The scanning and filming is
currently focused on the orepasses. But more information from the ventilation
shafts could be of great value from a rock mechanical perspective. This would
be particulary valuable considering the results from the prognosis calculation
that indicates increasing problems with spalling in the ventilation shafts.
Spalling damages are not limited to ventilation shafts. Prognosis of future spalling dam-
ages should therefore be done for other objects in the mine such as orepasses, footwall
drifts, crosscut drifts, and other excavations. Rock mass strength values obtained from
the calibration in this study should be tested on other types of excavations.
The influence of increasing spalling damages in ventilation shaft for future mining re-
quires a more extensive analysis. Spalling damages with a depth of 50 cm might have a
negative effect on the performance of the ventilation shafts.
The results indicates that continued mining down to 1223 will lead to deeper spalling
failures. Although the spalling issue was not studied for deeper levels, it can be expected
that the problem will increase even more for levels below 1223 due to increasing
stresses. It should therefore be taken into consideration in the planning and pre-design
of future mining and infrastructure location.
41
REFERENCES
Bieniawski, Z. (1967). Mechanism of brittle fracture of rock. Part I. Theory of the fracture
process. International Journal of Rock Mechanics and Mining Sciences, 39, 185-216.
Diederichs, M. (2007). Mechanistic interpretation and practical application of damage and
spalling prediction criteria for deep tunneling. Canadian Geotechnical Journal, 44,
1082-1116.
Edelbro, C. (2008). Strength, fallouts and numerical modelling of hard rock masses. Doctoral
thesis, ISSN 1402-1544 ; 2008:56, Luleå University of Technology.
Edelbro, C., Sjöberg, J., Malmgren, L., & Dahnér-Lindkvist, C. (2012). Prediction and
follow-up of failure and fallouts in footwall drifts in the Kiirunavaara mine. Canadian
Geotechnical Journal, 49, 546-559.
Griffith, A. (1921). The phenomena of rupture and flow in solids. Philosophical Transactions
of the Royal Society A, 221, 163-197.
Hajiabdolmajid, V., Kaiser, P., & Martin, C. (2002). Modelling brittle failure of rock.
International Journal of Rock Mechanics & Mining Sciences 39, 731-741.
Hajiabdolmajid, V., Kaiser, P., & Martin, C. (2003). Mobilised strength components in brittle
failure of rock. Gèotechnique 53, 327-336.
Hamrin, H. (1980). Underground Mining Methods and Applications. Stockholm: Atlas
Copco.
Hoek, E., & Martin, C. (2014). Fracture initiation and propagation in intact rock - A review.
Journal of Rock Mechanics and Geotechnical Engineering, 287-300.
Hoek, E., Kaiser, P., & Bawden, W. (1995). Support of underground excavations in hard
rock.
Hoek, E., Marinos, V., & Marinos, P. (2005). The geological strength index: applications and
limitations. Bulletin of Engineering and the Environment, 64, 55-65. DOI
10.1007/s10064-004-0270-5.
Itasca Consulting Group, Inc. (2005). FLAC. Version 5.0 Manual. Minneapolis: Itasca
Consulting Group, Inc.
Itasca Consulting Group, Inc. (2016). FLAC. Version 8.0 Manual. Minneapolis: Itasca
Consulting Group, Inc.
Jatko, D., & Gidemalm, A. (2017, March). Personal communication.
Kirsch, G. (1898). Die theorie der elastizitat und die bedürfnisse der festigkeitslehre.
Zeitschrift des Vereines deutscher Ingenieure, 42, pp. 797-807.
Krekula, S. (2017). Evaluation of the rock support system subjected to dynamic loads in
Kiirunavaara. Master thesis. Luleå: Luleå University of Technology.
LKAB. (2017). LKAB in brief. Retrieved April 20, 2017, from
https://www.lkab.com/en/about-lkab/lkab-in-brief/
Martin, C. (1997). The effect of cohesion loss and stress path on brittle rock strength.
Canadian Geotechnical Journal, 34, 698-725.
Martin, C., & Christiansson, R. (2009). Estimating the potential for spalling around a deep
nuclear waste repository in crystalline rock. International Journal of Rock Mechanics
& Mining Services, 46, 219-228.
Nordlund, E., Rådberg, G., & Sjöberg, J. (1998). Bergmekanikens grunder. Luleå: Luleå
University of Tecnhology.
Rutanen, H. (2017, April). Personal communication.
42
Sandström, D. (2003). Analysis of the Virgin State of Stress at the Kiirunavaara Mine.
Licentiate thesis, ISSN 1402-1757 ; 2003:02, Luleå University of Technology.
Sjöberg, J., & Malmgren, L. (2008a). Application of global-local modeling to mining rock
mechanics problems. Proc. First International FLAC/DEM Symposium on Numerical
Modeling (Minneapolis, August 25–27, 2008) (pp. 351-358). Minneapolis: Itasca
Consulting Group, Inc.
Sjöberg, J., & Malmgren, L. (2008b). New haulage level at Kiirunavaara - rock mechanics
challenges and analyses. Proc. MassMin 2008 5th International Conference and
Exhibition on Mass Mining (Luleå, June 9-11, 2008) (pp. 729-838). Luleå: Luleå
University of Technology.
Sjöberg, J., Bolin, A., Sanchez Juncal, A., Wettainen, T., Mas Ivars, D., & Perman, F. (2015).
Input to orepass design - a numerical study. Underground Design Methods 2015 - Y.
Potvin (ed.) (pp. 571-584). 2015 Australian Centre for Geomechanics, Perth, ISBN
978-0-9924810-3-2.
Sjöberg, J., Lundman, P., & Nordlund, E. (2001). Analys och prognos av utfall i bergschakt,
KUJ 1045. Report 01-762, LKAB. Kiruna: LKAB.
Sjöberg, J., Perman, F., Quinteiro, C., Malmgren, L., Dahnér-Lindkvist, C., & Boskovic, M.
(2012). Numerical analysis of alternative mining sequences to minimise potential for
fault slip rockbursting. Mining Technology, 121(4), 226-235.
Stacey, T. (1981). A simple extension strain criterion for fracture of brittle rock. International
Jorunal of Rock Mechanics and Mining Science, 18(6), 469-474.
Vatcher, J. (2015). Mine-scale Rock Mass Behaviour at the Kiirunavaara Mine. Luleå:
Licentiate thesis, ISSN 1402-1757, Luleå University of Technology.
Vermeer, P., & de Borst, R. (1984). Non-associated plasticity for soils, concrete and rock.
HERON, 29(3), 1-64.
Wimmer, M. (2016, September 20). Sublevel Caving. Powerpoint presentation from the class
"T7008B Open Pit and Underground Mining". Luleå University of Technology, Luleå
September 20, 2016, Norrbotten, Sweden.
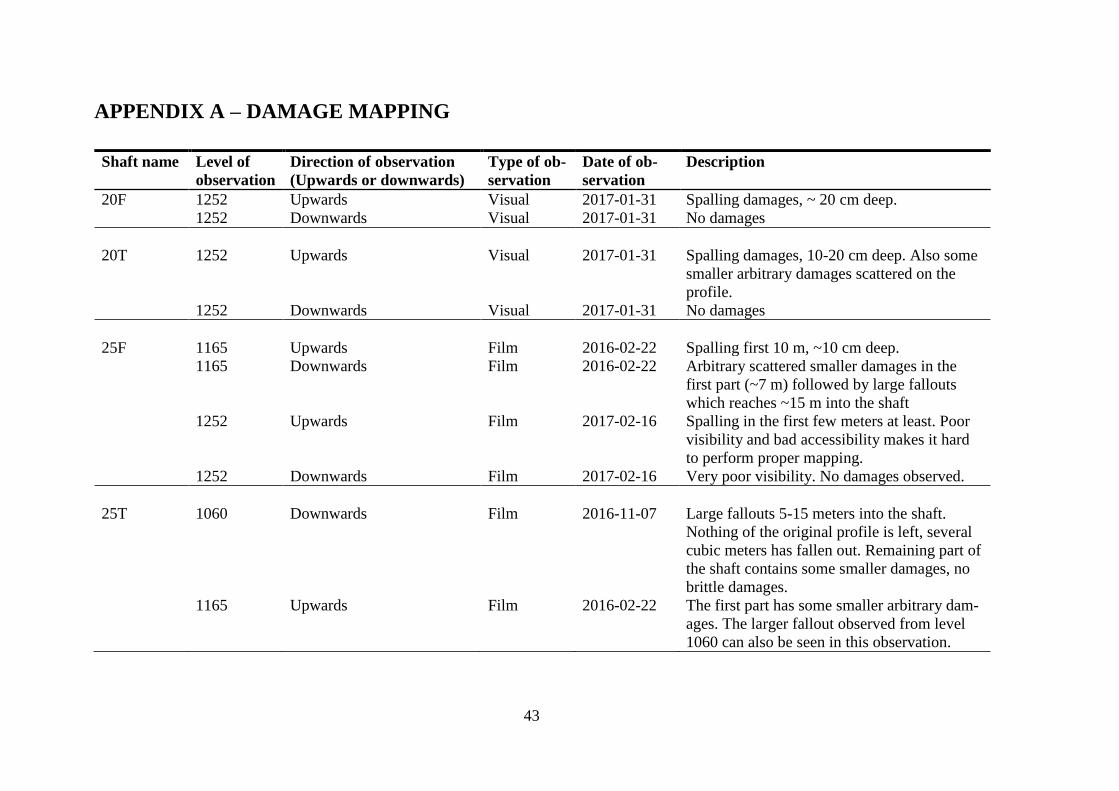
43
APPENDIX A – DAMAGE MAPPING
Shaft name Level of
observation
Direction of observation
(Upwards or downwards)
Type of ob-
servation
Date of ob-
servation
Description
20F 1252 Upwards Visual 2017-01-31 Spalling damages, ~ 20 cm deep.
1252 Downwards Visual 2017-01-31 No damages
20T 1252 Upwards Visual 2017-01-31 Spalling damages, 10-20 cm deep. Also some
smaller arbitrary damages scattered on the
profile.
1252 Downwards Visual 2017-01-31 No damages
25F 1165 Upwards Film 2016-02-22 Spalling first 10 m, ~10 cm deep.
1165 Downwards Film 2016-02-22 Arbitrary scattered smaller damages in the
first part (~7 m) followed by large fallouts
which reaches ~15 m into the shaft
1252 Upwards Film 2017-02-16 Spalling in the first few meters at least. Poor
visibility and bad accessibility makes it hard
to perform proper mapping.
1252 Downwards Film 2017-02-16 Very poor visibility. No damages observed.
25T 1060 Downwards Film 2016-11-07 Large fallouts 5-15 meters into the shaft.
Nothing of the original profile is left, several
cubic meters has fallen out. Remaining part of
the shaft contains some smaller damages, no
brittle damages.
1165 Upwards Film 2016-02-22 The first part has some smaller arbitrary dam-
ages. The larger fallout observed from level
1060 can also be seen in this observation.
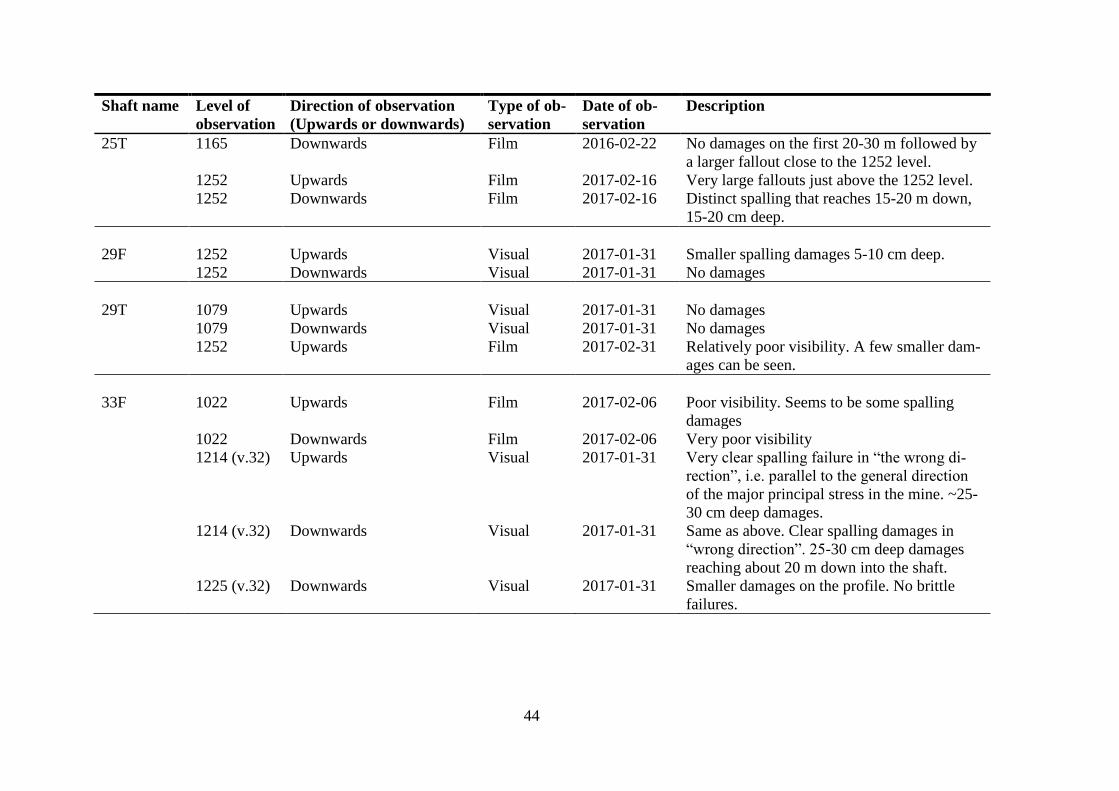
44
Shaft name Level of
observation
Direction of observation
(Upwards or downwards)
Type of ob-
servation
Date of ob-
servation
Description
25T 1165 Downwards Film 2016-02-22 No damages on the first 20-30 m followed by
a larger fallout close to the 1252 level.
1252 Upwards Film 2017-02-16 Very large fallouts just above the 1252 level.
1252 Downwards Film 2017-02-16 Distinct spalling that reaches 15-20 m down,
15-20 cm deep.
29F 1252 Upwards Visual 2017-01-31 Smaller spalling damages 5-10 cm deep.
1252 Downwards Visual 2017-01-31 No damages
29T 1079 Upwards Visual 2017-01-31 No damages
1079 Downwards Visual 2017-01-31 No damages
1252 Upwards Film 2017-02-31 Relatively poor visibility. A few smaller dam-
ages can be seen.
33F 1022 Upwards Film 2017-02-06 Poor visibility. Seems to be some spalling
damages
1022 Downwards Film 2017-02-06 Very poor visibility
1214 (v.32) Upwards Visual 2017-01-31 Very clear spalling failure in “the wrong di-
rection”, i.e. parallel to the general direction
of the major principal stress in the mine. ~25-
30 cm deep damages.
1214 (v.32) Downwards Visual 2017-01-31 Same as above. Clear spalling damages in
“wrong direction”. 25-30 cm deep damages
reaching about 20 m down into the shaft.
1225 (v.32) Downwards Visual 2017-01-31 Smaller damages on the profile. No brittle
failures.
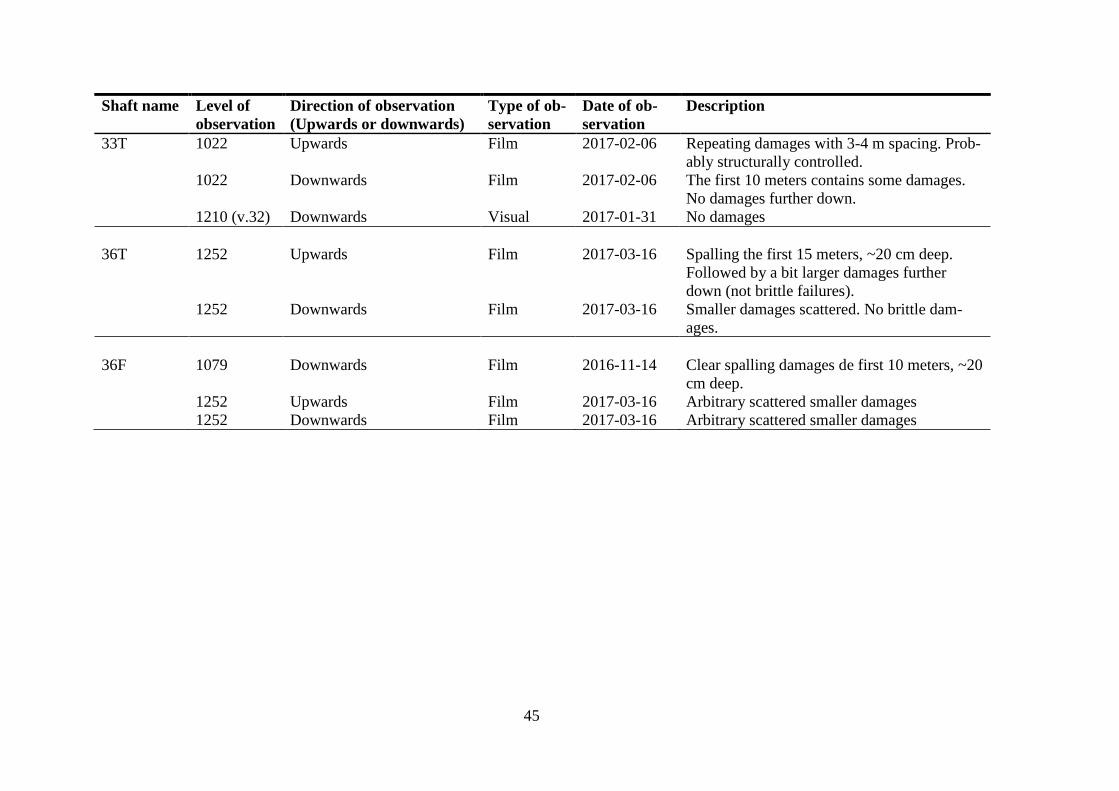
45
Shaft name Level of
observation
Direction of observation
(Upwards or downwards)
Type of ob-
servation
Date of ob-
servation
Description
33T 1022 Upwards Film 2017-02-06 Repeating damages with 3-4 m spacing. Prob-
ably structurally controlled.
1022 Downwards Film 2017-02-06 The first 10 meters contains some damages.
No damages further down.
1210 (v.32) Downwards Visual 2017-01-31 No damages
36T 1252 Upwards Film 2017-03-16 Spalling the first 15 meters, ~20 cm deep.
Followed by a bit larger damages further
down (not brittle failures).
1252 Downwards Film 2017-03-16 Smaller damages scattered. No brittle dam-
ages.
36F 1079 Downwards Film 2016-11-14 Clear spalling damages de first 10 meters, ~20
cm deep.
1252 Upwards Film 2017-03-16 Arbitrary scattered smaller damages
1252 Downwards Film 2017-03-16 Arbitrary scattered smaller damages
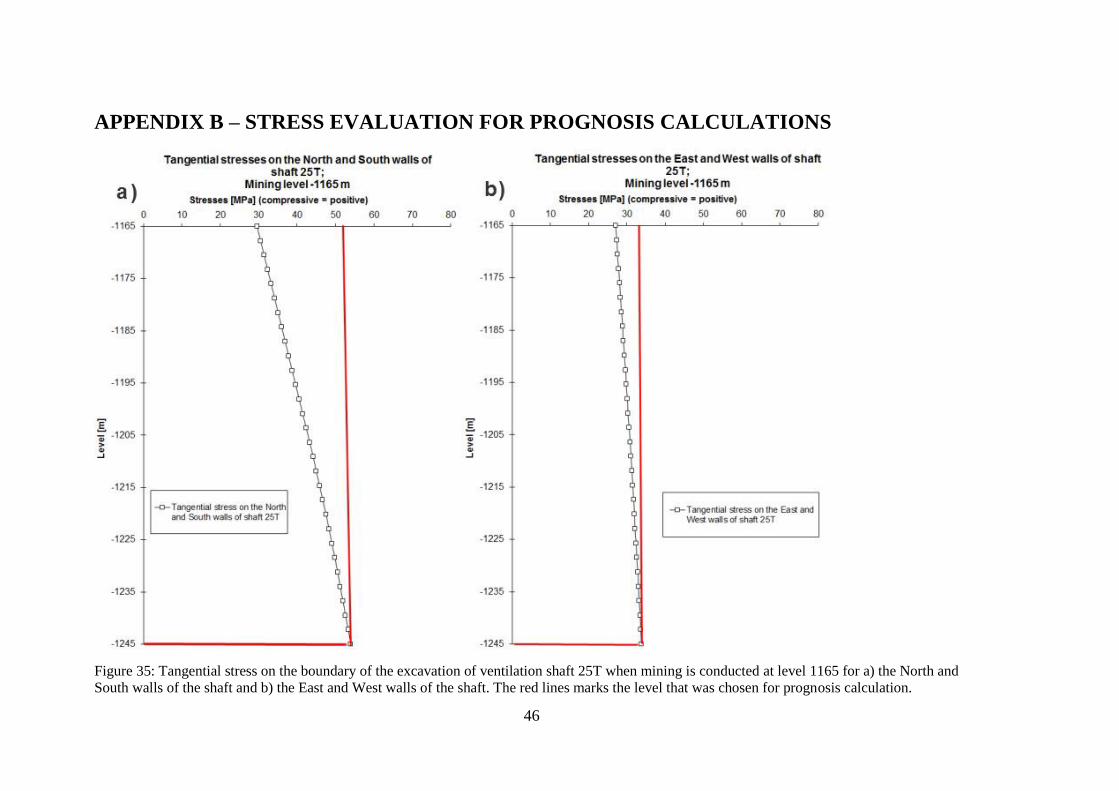
46
APPENDIX B – STRESS EVALUATION FOR PROGNOSIS CALCULATIONS
Figure 35: Tangential stress on the boundary of the excavation of ventilation shaft 25T when mining is conducted at level 1165 for a) the North and
South walls of the shaft and b) the East and West walls of the shaft. The red lines marks the level that was chosen for prognosis calculation.
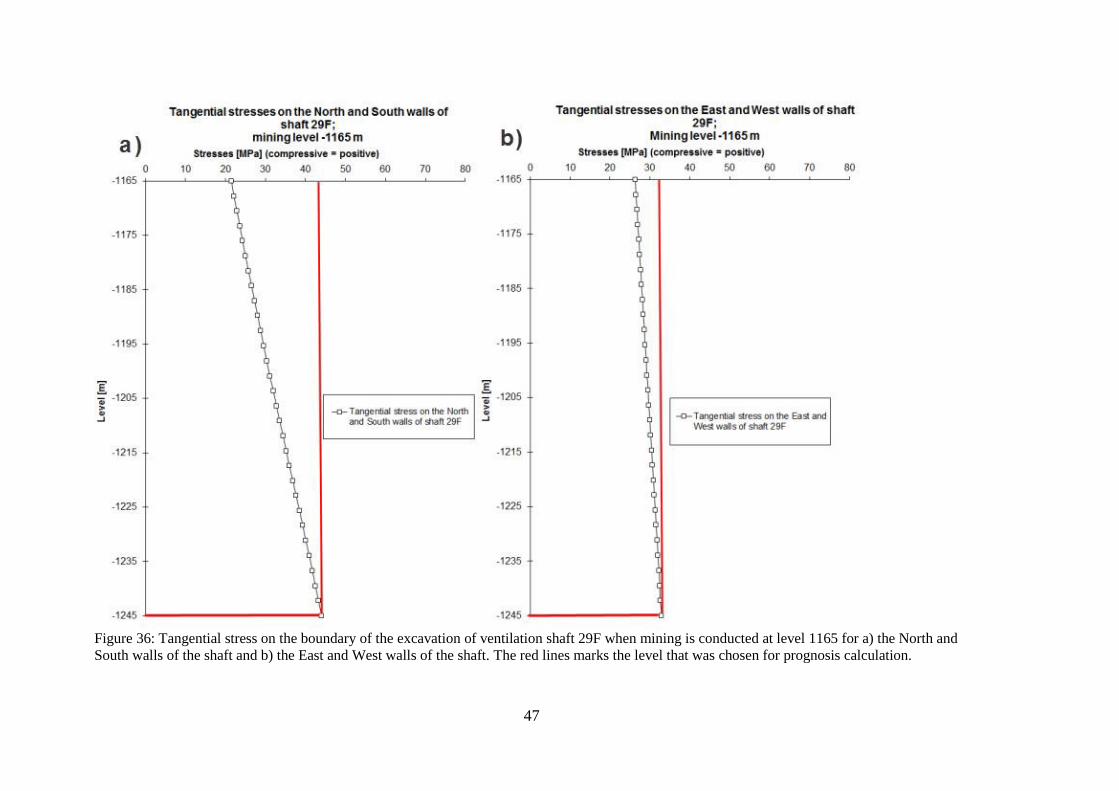
47
Figure 36: Tangential stress on the boundary of the excavation of ventilation shaft 29F when mining is conducted at level 1165 for a) the North and
South walls of the shaft and b) the East and West walls of the shaft. The red lines marks the level that was chosen for prognosis calculation.
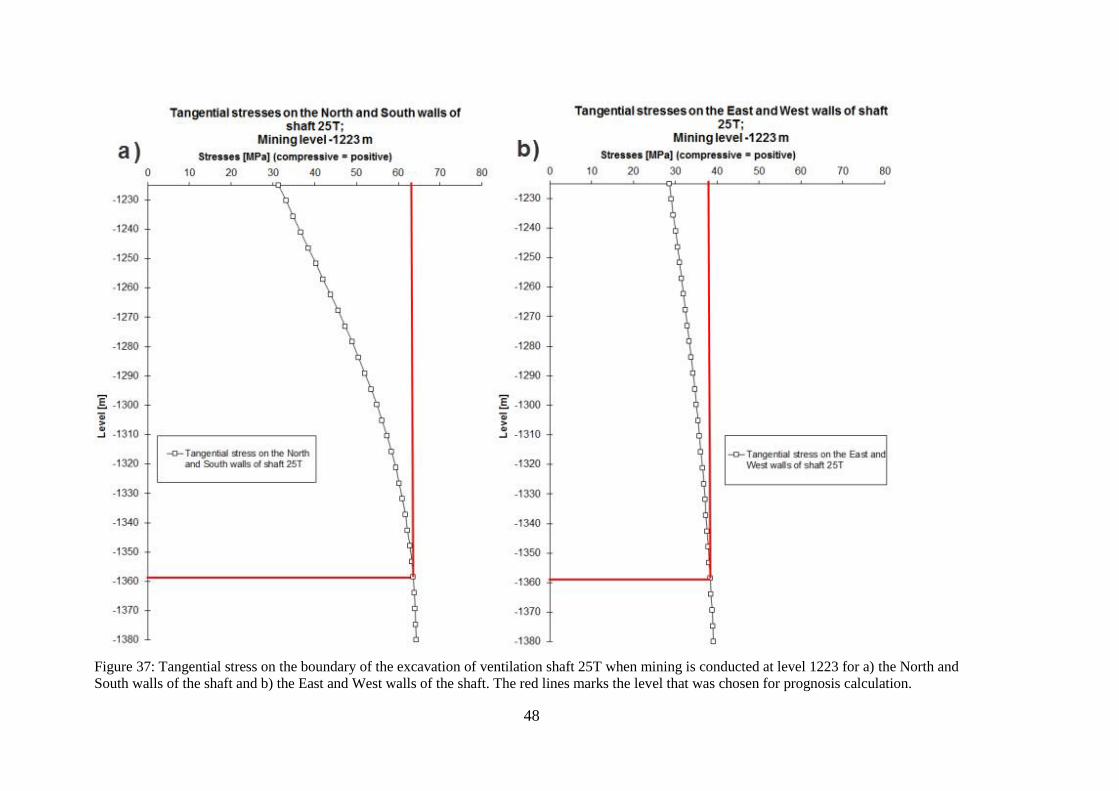
48
Figure 37: Tangential stress on the boundary of the excavation of ventilation shaft 25T when mining is conducted at level 1223 for a) the North and
South walls of the shaft and b) the East and West walls of the shaft. The red lines marks the level that was chosen for prognosis calculation.
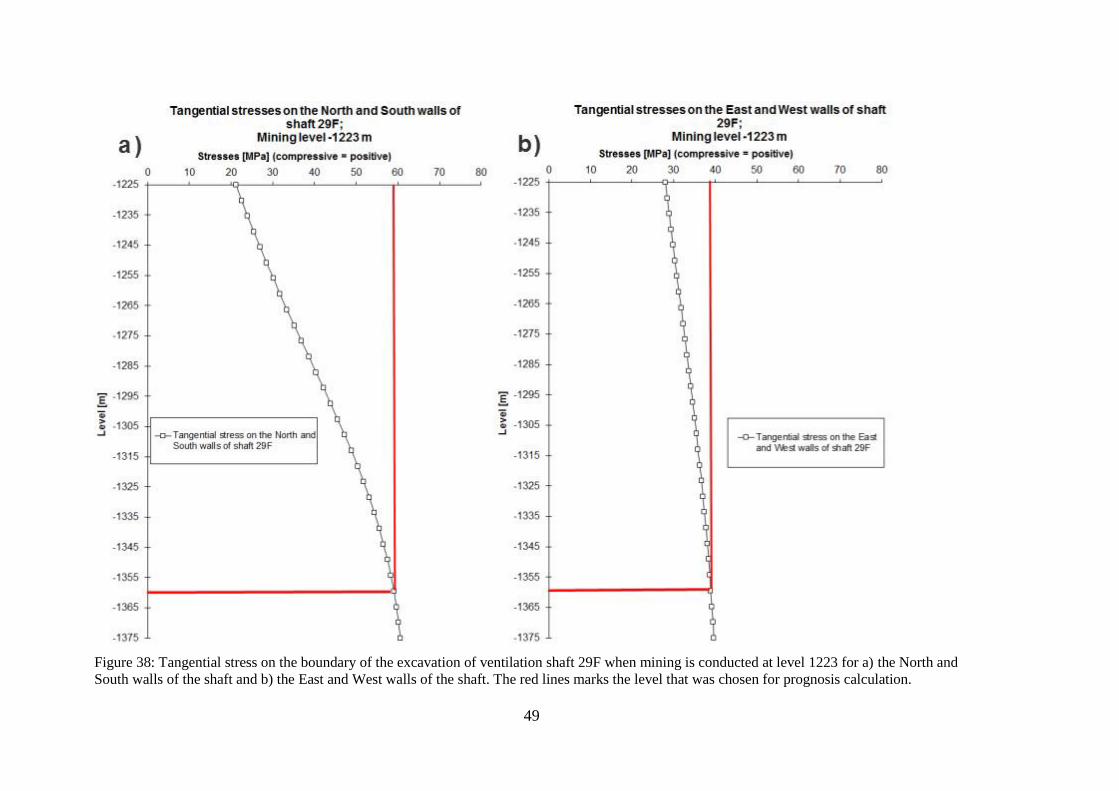
49
Figure 38: Tangential stress on the boundary of the excavation of ventilation shaft 29F when mining is conducted at level 1223 for a) the North and
South walls of the shaft and b) the East and West walls of the shaft. The red lines marks the level that was chosen for prognosis calculation.