Embed Size (px)
Citation preview
FILE COPY XSWP609
Shadow Prices for Economic Appraisalof Projects
An Application to Thailand
Sadiq Ahmed
WOIRLD BANK STAFF WORKING PAPERSNumber 609
' 1 1
_ I~~~~~~~~~~~~~~~~~~~~~~~~~~~~~~~~~~~~~~~~~~~~~~
Pub
lic D
iscl
osur
e A
utho
rized
Pub
lic D
iscl
osur
e A
utho
rized
Pub
lic D
iscl
osur
e A
utho
rized
Pub
lic D
iscl
osur
e A
utho
rized

WORLD BANK STAFF WRKING PAPERSNumber 609
Shadow Prices for Economic Appraisalof Projects
An Application to Thailand
Sadiq Ahmed
,tMATIOAL MONETARY FUND
W4TERNArTOtA~LGAM(Foll
WASHING .D.C, 20431
The World BankWashington, D.C., U.S.A.
Copyright ® 1983The Intemational Bank for Reconstructionand Development / THE WORLD BANK1818 H Street, N.W.Washington, D.C. 20433, U.S.A.
First printing September 1983All rights reservedManufactured in the United States of America
This is a working document published informally by the World Bank. Topresent the results of research with the least possible delay, the typescript hasnot been prepared in accordance with the procedures appropriate to formalprinted texts, and the World Bank accepts no responsibility for errors. Thepublication is supplied at a token charge to defray part of the cost ofmanufacture and distribution.
The views and interpretations in this document are those of the author(s) andshould not be attributed to the World Bank, to its affiliated organizations, or toany individual acting on their behalf. Any maps used have been preparedsolely for the convenience of the readers; the denominations used and theboundaries shown do not imply, on the part of the World Bank and its affiliates,any judgment on the legal status of any territory or any endorsement oracceptance of such boundaries.
The full range of World Bank publications is described in the Catalog of WorldBank Publications; the continuing research program of the Bank is outlined inWorld Bank Research Program: Abstracts of Current Studies. Both booklets areupdated annually; the most recent edition of each is available without chargefrom the Publications Distribution Unit of the Bank in Washington or from theEuropean-Office of the Bank, 66, avenue d'Iena, 75116 Paris, France.
Sadiq Ahmed is a country economist in the Europe, Middle East, and NorthAfrica Regional Office of the World Bank; he was formerly with the ProgramsDepartment of the East Asia and Pacific Regional Office.
Library of Congress Cataloging in Publication Data
Ahmed, Sadiq. ,*C ,Shadow prices for eco ic;'a}a-isaof proJects,
(World Bank staff working papers ; no. 609)Includes bibliographical references.1. Economic development projects--Thafl-ans--Evalnatioan
2. Shadow ;rices--4hnlad.p. I'. Title. II. Series.HC445.A55 1983 33805- 2-JAA 83-14620ISBN o-82313-C244-2
Abstract
The study reviews past estimates of shadow prices in Thailandand their use in World Bank appraisals. Applying the Squire-van der Takmethodology, it proceeds to estimate conversion factors for project analysisin Thailand. Efficiency conversion factors were estimated for broadcategories of commodities, as well as for selected sub-categories, includingconstruction, electricity, transportation and rice. Estimates were alsomade of the shadow wage rate and of the opportunity cost of capital andland, drawing on an assessment of factor markets in Thailand. An annexalso provides estimates of social conversion factors allowing for growthand income distribution considerations.
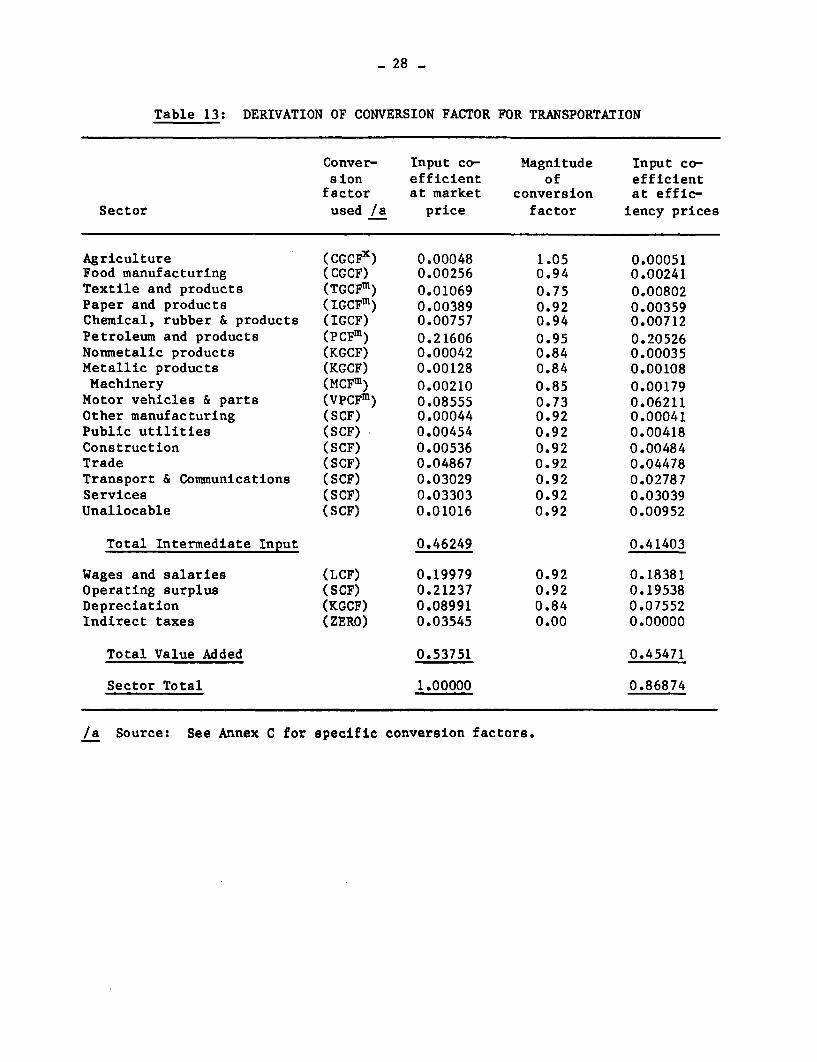
Besides providing up-to-date estimates of shadow prices (conversionfactors) for use in economic (and social) analysis of projects in Thailand,the study provides a case study of application of the Squire-van der Takmethodology. It also confirms the findings of other studies that Thailandis a country with relatively undistorted prices, as indicated by the factthat there is relatively little dispersion in conversion factors and thatmost of them are close to unity.
Acknowledgments
This paper is an outcome of my stay in the Thailand/IndochinaDivision of the East Asia and Pacific Programs Department as a YoungProfessional. The study benefitted from comments by Piyasvasti Amranand,Dhananjaya Kumar, Johannes Linn, Roy Pepper, and Dusan Vujovic. Cooperationfrom the Department of Customs and the Bank of Thailand during field workin Bangkok is gratefully acknowledged.
Table of Contents
Page No.
I. INTRODUCTION . . . . . . . . . . . . . . . . . . . . . . . . 1
Role of Cost-Benefit Analysis . . . . . . . . . . . . . . 2Project Evaluation in Practice .. . . . . . . . . . . . . 3Scope and Methodology of the Present Study . . . . . . . . 4
11. REVIEW OF EXISTING SHADOW PRICING STUDIES FOR THAILANDAND SUMMARY OF RESULTS . .Ae .RE.T.S. . .................. 4
Review of Existing Studies wof xistinagSa................. 4Summary of Results Based on the Present Study . . . . . . 7Limitations of the Present Study.. . . . . . . .. . . . 10
III. ESTIMATION OF EFFICIENCY PARAMETERS . . . . . . . . . . . . 11
Functioning of Commodity Markets: History . . . . . . . . 11Functioning of Commodity Markets: Efficiency Issue . . . . 12Distortionary Effects of Government Policies . . . . . . . 13Numerical Estimates of General Conversion Factors . . . . 16Non-Traded Goods Conversion Factor . . . . . . . . . . . . 25
IV. ESTIMATION OF ECONOMIC RETURNS TO FACTORS . . . . . . . . . 30
The Labor Market: Review of Existing Theories of WageDetermination in Developing Countries . . . . . . . . . 30
Characteristics of Labor Markets in Thailand . . . . . . . 32The Capital Market ... o . .... a..a...................... 35Government Intervention in Financial Markets . . . . . . . 37Estimation of Marginal Productivity of Capital . . . , . . 39
V. ESTIMATION OF CONVERSION FACTOR FOR RICE . . . . . . . . . . 45
Government Intervention in Rice Trade . . . . . . . . . . 45Estimation of Conversion Factor for Rice . . . . . . . . . 47
ANNEXES
A. ESTIMATION OF SOCIAL PARAMETERS . . . . . . . . . . . . .. 53
Introduction . .. ... . . . .......................a........ 53The Government Policy Towards Income Distribution andGrowth .................. a.............a............ .. C.. 53
Value Judgements: The Consumption Rate of Interest,Pure Time Preference, Elasticity of Social MarginalUtility of Income . . . . . . . . . . . . . . . . . . 55
Page No.
The Consumption Distribution Weight . . . . . . . . . . . . . 56The Summary Distribution Measure . *....... .. .. 57Derivation of Value of Public Income . . . . . . . . . . . . 59The Critical Consumption Level . .. .. .. ..... . 61The Accounting Rate of Interest . . . . . .. .... .. . 64The Social Price of Labor ... ............... 64
B. DATA SOURCES . . . . . . . . . . . . . . . . . . . . . . . . . 66
C. ESTIMATION OF TAX EQUIVALENCE OF RICE RESERVE REQUIREMENT . . . 67
D. ESTIMATION OF SPECIFIC CONVERSION FACTORS USED IN DERIVINGCONVERSION FACTORS FOR NONTRADED GOODS . . . . . . . . . . . 68
Eo AVERAGE CONVERSION FACTORS FOR EXPORTED AND IMPORTED GOODSCONSIDERED SEPARATELY ... . . . . . . . . . . . . . . . . . 69
F. ESTIMATION OF CONVERSION FACTOR FOR RICE WITH LESS THANPERFECTLY ELASTIC WORLD DEMAND FOR RICE AND ALLOWING FORDOMESTIC CONSUMPTION ... . . . . . . . . . . o. . . . . . 70
G. DATA FOR ESTIMATION OF MARGINAL PROPENSITY TO SAVE . . . . 71
H. ECONOMIC VALUE OF LAND ....... . ........ .. . 73
I. INTRODUCTION
1. Adam Smith,/1 writing in the eighteenth century, argued that undera competitive environment individual entrepreneurs left to themselves wouldtend to maximize social welfare at the same time as they seek to maximizetheir own individual welfare. Later, Pareto /2 laid down conditions underwhich individuals' welfare would be maximized. Other classical economistspointed out that a perfectly competitive economy would satisfy theseconditions. Stronger advocates of the market mechanism extended the Paretoapproach to argue that under a competitive system not only would privatewelfare be maximized, but also social welfare would be maximized. Byimplication, the set of prices generated by a competitive economy would be'optimal.'
2. Pigou was one of the earliest critics of the optimality of marketsolution./3 He pointed out that the competitive solution would not be optimalsince it does not take into account the 'externalities in the system. Othercriticisms include, neglect of the issue of income distribution, indeter-minacy in the Pareto approach, i.e., a large number of soluti.ns, presenceof natural monopolies and public goods, and absence of perfect information.Further complications arise when the issue of deducing the social welfarefunction is raised. One line of argument is that the social welfarefunction can be formulated through the political voting procedure. But in apowerful work Arrow /4, himself a firm believer in the efficiency of themarket economy, came up with the paradoxical result that majority decisionsneed not be consistent. Thus, a social welfare function generated bymajority decisions would not necessarily satisfy the consistency property -
a characteristic necessary to obtain meaningful results. Hence, thequantities and prices obtaining in the market solution are not necessarilythe optimal ones.
3. A second type of problem with the market solution is that inpractice all countries of the world have government interventions in theeconomy. Such interventions have often created further distortions in theeconomy. This is another reason why market solution may yield inoptimalprices and quantities.
/1 Adam Smith, An Inquiry into the Nature and Causes of the Wealth ofNations, Vol. 1, Dent., 1933.
/2 Vilfredo Pareto, Manual d'economie publique, Girard, Paris 1909.
/3 A.C. Pigou, The Economics of Welfare, Macmillan, 4th ed. 1932.
/4 K.J. Arrow, Social Choice and Individual Values, Wiley, 1951.
2-
Role of Cost-Benefit Analysis
4. Critics of the market solution have provided justification forgovernment investment in the economy. But investible resources are limitedrelative to the number of activities possible and market prices are inappro-priate, hence some decision rules for public investment are required.Economists have, therefore, devised techniques for making investmentdecisions. Such techniques, broadly known as Cost-Benefit analysis, havetwo main parts: identifying benefit and cost streams, and devising appro-priate value weights for determining social profitability. While theobjective of Cost-Benefit analysis is fairly simple and convincing-maximizenet social welfare from any project, the welfare base of the appropriateweights (prices) and methodology for deriving these weights remain highlycontroversial issues.
5. A more serious issue raised by a number of critics of Cost-Benefitanalysis concerns its logic. If all distortions in the economy arecorrected, then prices derived from this simulated competitive economy arecalled the 'first best shadow prices.' Cost-Benefit analysis does not seekto derive these set of prices because it recognizes that in practice alldistortions cannot be corrected. What it aims at is deriving the secondbest shadow prices by assuming some constraints as fixed and correcting forother distortions. In 1956 Lipsey and Lancaster/l derived a devastatingtheorem known as the "general theory of second best" which says that anymove which corrects for some distortions but leaves unchanged otherdistortions does not necessarily constitute an improvement in welfare. Arelated criticism made by Rudra /2 is that optimal projects and optimalprices are interdependent and can only be derived simultaneously. Hence,prices derived separately from the choice of optimal projects will notnecessarily be optimal. Both arguments are valid in a puristic sense. Thedefense of supporters of Cost-Benefit analysis is that it is a pragmaticapproach to planning and in practice corrections for some distortions, evenif other distortions remain uncorrected, are more likely to result in animprovement rather than further deterioration in welfare. As Sen /3 has
/1 R.G. Lipsey and R.K. Lancaster, "The General Theory of Second Best,"Review of Economic Studies, Vol. XXIV(1), 1956-7.
/2 A. Rudra, "Use of Shadow Prices in Project Evaluation," paper presentedat the World Econometric Congress, Cambridge 1970.
/3 A.K. Sen, "Interrelations Between Project, Sector and AggregatePlanning," Economic Bulletin for the Asia and Pacific, UN, ESCAP,Bangkok, 1970.
- 3 -
argued: "Even in many-commodity models it is not at all obvious why theseimprovements will not operate, but it is possible to think of a complex ofrelationships that would make these corrections have a negative impact onsocial welfare. What is at issue in all these cases is the practicalrelevance of rules that work with sure-fire efficacy in models involvingsome abstraction, the real world does have features that do not figure inthese models. This is a general problem to which all analytical planningtechniques are exposed, and the use of shadow prices in project evaluationis no exception."
project Evaluation in Practice
6. A large number of economists have contributed to the developmentof analytical tools of Cost-Benefit analysis. Most studies have, however,dealt with one aspect or another in isolation. Three well known andcomplete works on project evaluation in developing countries are those ofLittle and Mirrlees /1, Dasgupta, Sen and Marglin /2 and Squire and van derTak./3 Since 1971 the first two groups of authors have been pitched againsteach other in a series of debates concerning the proposal made by Little andMirrlees (L-M) that world prices be used as appropriate shadow prices. Themain objection raised by Dasgupta, Sen and Marglin (UNIDO) is that use ofworld prices assumes that the project evaluator can persuade governments ofdeveloping countries to follow trade policies such that there are noquantitative restrictions - a questionable assumption for most developingcountries.
7. The Squire and van der Tak (S-T) method is essentially an exten-sion of the L-M approach, going one step forward. Like the L-M approach, italso advocates use of world prices as appropriate shadow prices, but takesinto account the criticism of the trade policy assumption by arguing thatshould project evaluator fail to influence the government to removequantitative restrictions, such commodities be treated as nontraded andvalued differently i.e., according to their social marginal cost or socialmarginal benefit or a weighted average of the two. The S-T approach goesfurther by explicitly introducing income distribution consideration in
/L I.M.D. Little and J.A. Mirrlees, Project Appraisal and Planning forDeveloping Countries, Basic Books, Inc., New York, 1974.
/2 UNIDO, Guidelines for Project Evaluation, written by P.S. Dasgupta,A.K. Sen, and S.A. Marglin, United Nations, New York 1968.
/3 Lyn Squire and H. G. van der Tak, Economic Analysis of Projects,John Hopkins University Press, Baltimore, 1975.
- 4 -
deriving shadow prices. The authors suggest a two-step procedure. In stepone the "efficiency prices" are derived - so called because these areobtained on the basis of resource allocation considerations only. In steptwo considerations of income distribution are introduced and efficiencyprices are converted into "social prices." The implicit assumption is thatthe resultant income redistribution does not have significant feed-backeffects on the efficiency component of the shadow prices. Apart from thisinnovation, the other advantage of the S-T approach is that it is relativelysimple and less demanding in practical work.
Scope and Methodology of the Present Study
8. The objective of this paper is to apply the S-T methodology forderiving conversion factors (ratio of shadow prices to domestic prices) forThailand. Following the S-T classification, distinction is made betweenefficiency prices and social prices. Further, estimation of conversionfactors relevant for the economy as a whole - known as national levelparameters, is the main topic of discussion. Conversion factors by specificcommodities, except rice, are not considered here.
9. The study is organized as follows. In Part II, earlier works onshadow prices in Thailand are briefly discussed and the summary results ofthe present study are presented. Estimation of efficiency conversionfactors is considered in Part III. The discussion in this Part is dividedinto two sections. In the first section, estimation of general conversionfactors for traded and nontraded goods is considered, while in the secondsection, the estimation of marginal productivity of capital and shadow wagerate is discussed. Derivation of conversion factor for rice is discussed inPart IV. This commodity is given special attention in view of the contro-versy over the Thai government's rice trade policy. Social parameters areconsidered in Annex I. Other annexes containing data and sources andadditional notes follow the presentation of the discussion on socialparameters.
II. REVIEW OF EXISTING SHADOW PRICING STUDIESFOR THAILAND AND SUMMARY OF RESULTS
Review of Existing Studies
10. There are at least three studies directly concerned with the esti-mation of shadow prices in Thailand. The first work was undertaken byMcCleary /1 in 1973. The study derived shadow prices based on the UNIDOmethodology. The second study was prepared by the Mekong Secretariat under
/1 W.A. McCleary, Equipment Versus Employment: A Social Cost-BenefitAnalysis of Alternative Techniques of Feeder Road Construction ofThailand, ILO, Geneva, 1976.
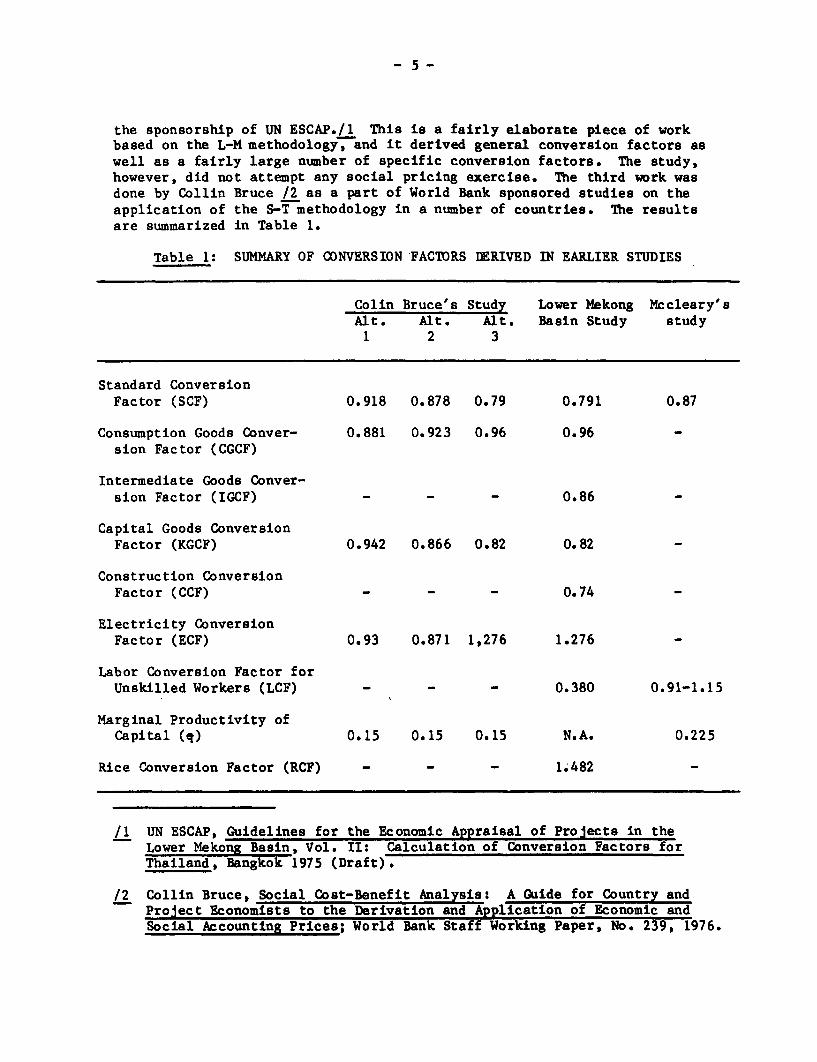
the sponsorship of UN ESCAP./1 This is a fairly elaborate piece of workbased on the L-M methodology, and it derived general conversion factors aswell as a fairly large number of specific conversion factors. The study,however, did not attempt any social pricing exercise. The third work wasdone by Collin Bruce /2 as a part of World Bank sponsored studies on theapplication of the S-T methodology in a number of countries. The resultsare summarized in Table 1.
Table 1: SUMMARY OF CONVERSION FACTORS DERIVED IN EARLIER STUDIES
Colin Bruce's Study Lower Mekong Mccleary'sAlt. Alt. Alt. Basin Study study
1 2 3
Standard ConversionFactor (SCF) 0.918 0.878 0.79 0.791 0.87
Consumption Goods Conver- 0.881 0.923 0.96 0.96 -sion Factor (CGCF)
Intermediate Goods Conver-sion Factor (IGCF) - - - 0.86 -
Capital Goods ConversionFactor (KGCF) 0.942 0.866 0.82 0.82 -
Construction ConversionFactor (CCF) - - - 0.74 -
Electricity ConversionFactor (ECF) 0.93 0.871 1,276 1.276 -
Labor Conversion Factor forUnskilled Workers (LCF) - - - 0.380 0.91-1.15
Marginal Productivity ofCapital (q) 0.15 0.15 0.15 N.A. 0.225
Rice Conversion Factor (RCF) - - - 1.482 -
/1 UN ESCAP, Guidelines for the Economic Appraisal of Projects in theLower Mekong Basin, Vol. II: Calculation of Conversion Factors forThailand, Bangkok 1975 (Draft).
/2 Collin Bruce, Social Cost-Benefit Analysis: A Guide for Country andProject Economists to the Derivation and Application of Economic andSocial Accounting Prices; World Bank Staff Working Paper, No. 239, 1976.
- 6 -
11. Alternatives 1 and 2 in Bruce's work were derived independently ofthe Mekong study. Alternative 3 is based on the Mekong Basin study. Themain reason for differences between alternatives 1 and 2 is use of number ofyears for which the trade data were averaged to derive the conversionfactors, ranging from 5 to 8 years for alternative 1, and 3 to 5 years foralternative 2. The differences between Bruce's results and Mekong resultsare partly explained by differences in time period, and partly by the factthat the later study involved a higher level of disaggregation. Thedifferences are particularly large in the cases of electricity conversionfactor and standard conversion factor (SCF). In the Lower Mekong Basinstudy the SCF was derived as a weighted average of a large number ofconversion factors for traded and nontraded items, whereas in Bruce's work(for both alternatives) the SCF is based entirely on traded goods. The highvalue of conversion factor for electricity derived in the Mekong studyappears implausible. The authors overestimated the border price value of"profit and other value added" component of the input-output coefficientstructure of electricity by using a conversion factor greater than unity.If this component is converted into border price terms by applying the SCF,the conversion factor for electricity falls dramatically to 0.776.
12. In McCleary's work, the ratio of shadow exchange rate to theofficial exchange rate (SER/OER), obtained as a weighted average of theeffective tariff rates on imports and tax rates on exports, was estimated
1
as 1.15. The value of SCF (SER/OER) is, therefore, very close to Bruce'sestimate. The significant difference in the marginal productivity ofcapital (q) estimates is explained by the fact that while McCleary esti-mated q by using various sources of information, Bruce simply assumed avalue for q. The results for labor conversion factor (LCF) obtained byMcCleary and the Lower Mekong Basin study are not directly comparablebecause they are based on different methodologies. Nevertheless, it shouldbe noted that the later study assumed significant labor market imperfectionswhile McCleary took the view that labor market imperfections were small.
13. Apart from these three studies, some information on shadowprices in Thailand is also available from various Bank project appraisalreports. These reports shed some light on three conversion factors whichare of interest for this study. These are LCF, SCF and rice conversionfactor (RCF). The information is summarized in Table 2.
14. In most appraisal reports, estimates of SCF and consumption goodsconversion factor (CGCF) are based on Bruce's work i.e., SCF = 0.79 andCGCF = 0.96. The values of 0.91-0.92 for SCF used in a number of reportsare based on the assumption that the exchange rate is overvalued by 9-10percent. The source of this latter assumption is not mentioned. The two
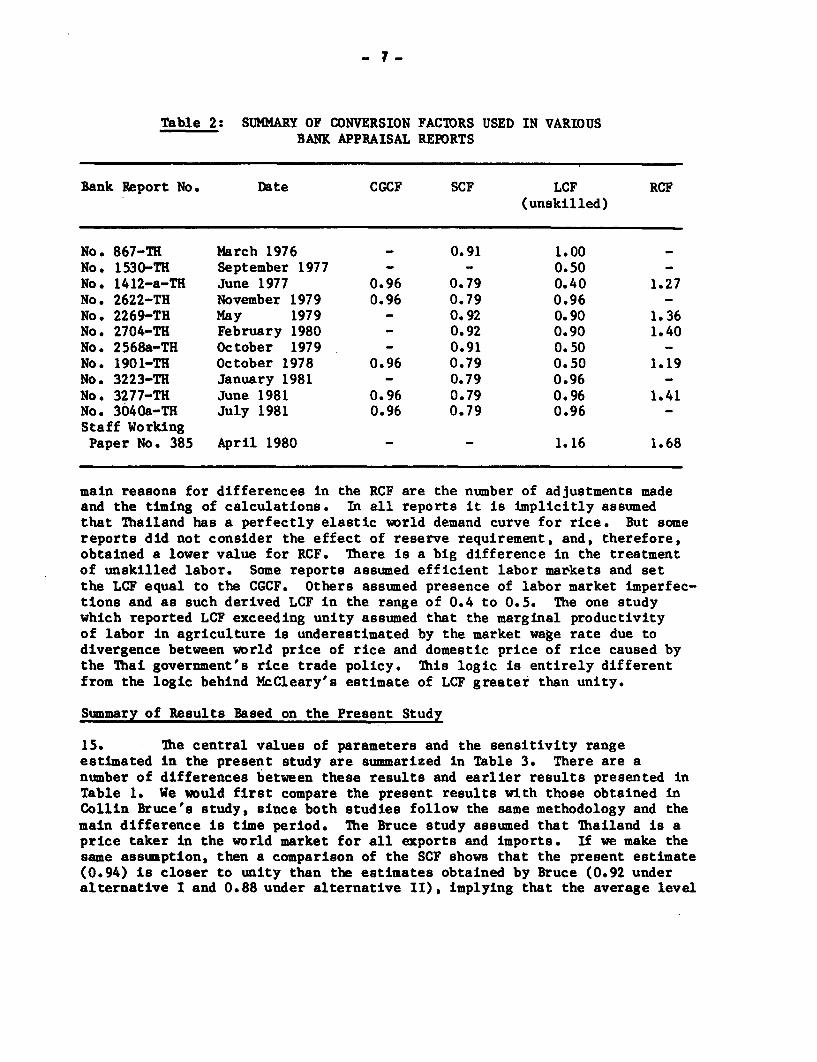
Table 2: SUMMARY OF CONVERSION FACTORS USED IN VARIOUSBANK APPRAISAL REPORTS
Bank Report No. Date CGCF SCF LCF RCF(unskilled)
No. 867-TH March 1976 - 0.91 1.00No. 1530-TH September 1977 - - 0.50 -No. 1412-a-TH June 1977 0.96 0.79 0.40 1.27No. 2622-TH November 1979 0.96 0.79 0.96 -No. 2269-TH May 1979 - 0.92 0.90 1.36No. 2704-TH February 1980 - 0.92 0.90 1.40No. 2568a-TH October 1979 - 0.91 0.50 -No. 1901-TH October 1978 0.96 0.79 0.50 1.19No. 3223-TH January 1981 - 0.79 0.96 -No. 3277-TH June 1981 0.96 0.79 0.96 1.41No. 3040a-TH July 1981 0.96 0.79 0.96 -Staff WorkingPaper No. 385 April 1980 - - 1.16 1.68
main reasons for differences in the RCF are the number of adjustments madeand the timing of calculations. In all reports it is implicitly assumedthat Thailand has a perfectly elastic world demand curve for rice. But somereports did not consider the effect of reserve requirement, and, therefore,obtained a lower value for RCF. There is a big difference in the treatmentof unskilled labor. Some reports assumed efficient labor markets and setthe LCF equal to the CGCF. Others assumed presence of labor market imperfec-tions and as such derived LCF in the range of 0.4 to 0.5. The one studywhich reported LCF exceeding unity assumed that the marginal productivityof labor in agriculture is underestimated by the market wage rate due todivergence between world price of rice and domestic price of rice caused bythe Thai government's rice trade policy. This logic is entirely differentfrom the logic behind McCleary's estimate of LCF greater than unity.
Summary of Results Based on the Present Study
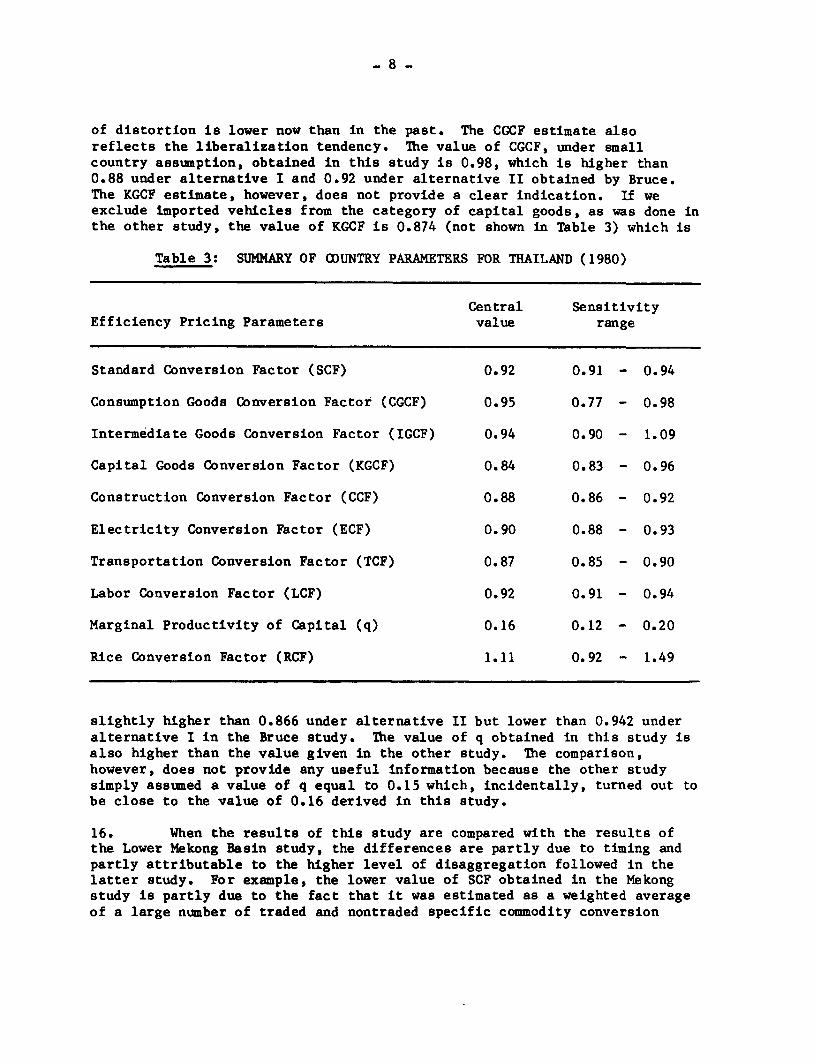
15. The central values of parameters and the sensitivity rangeestimated in the present study are summarized in Table 3. There are anumber of differences between these results and earlier results presented inTable 1. We would first compare the present results with those obtained inCollin Bruce's study, since both studies follow the same methodology and themain difference is time period. The Bruce study assumed that Thailand is aprice taker in the world market for all exports and imports. If we make thesame assumption, then a comparison of the SCF shows that the present estimate(0.94) is closer to unity than the estimates obtained by Bruce (0.92 underalternative I and 0.88 under alternative II), implying that the average level
- 8 -
of distortion is lower now than in the past. The CGCF estimate alsoreflects the liberalization tendency. The value of CGCF, under smallcountry assumption, obtained in this study is 0.98, which is higher than0.88 under alternative I and 0.92 under alternative II obtained by Bruce.The KGCF estimate, however, does not provide a clear indication. If weexclude imported vehicles from the category of capital goods, as was done inthe other study, the value of KGCF is 0.874 (not shown in Table 3) which is
Table 3: SUMMARY OF OWUNTRY PARAMETERS FOR THAILAND (1980)
Central SensitivityEfficiency Pricing Parameters value range
Standard Conversion Factor (SCF) 0.92 0.91 - 0.94
Consumption Goods Conversion Factof (CGCF) 0.95 0.77 - 0.98
Intermediate Goods Conversion Factor (IGCF) 0.94 0.90 - 1.09
Capital Goods Conversion Factor (KGCF) 0.84 0.83 - 0.96
Construction Conversion Factor (CCF) 0.88 0.86 - 0.92
Electricity Conversion Factor (ECF) 0.90 0.88 - 0.93
Transportation Conversion Factor (TCF) 0.87 0.85 - 0.90
Labor Conversion Factor (LCF) 0.92 0.91 - 0.94
Marginal Productivity of Capital (q) 0.16 0.12 - 0.20
Rice Conversion Factor (RCF) 1.11 0.92 - 1.49
slightly higher than 0.866 under alternative II but lower than 0.942 underalternative I in the Bruce study. The value of q obtained in this study isalso higher than the value given in the other study. The comparison,however, does not provide any useful information because the other studysimply assumed a value of q equal to 0.15 which, incidentally, turned out tobe close to the value of 0.16 derived in this study.
16. When the results of this study are compared with the results ofthe Lower Mekong Basin study, the differences are partly due to timing andpartly attributable to the higher level of disaggregation followed in thelatter study. For example, the lower value of SCF obtained in the Mekongstudy is partly due to the fact that it was estimated as a weighted averageof a large number of traded and nontraded specific commodity conversion
- 9 - -
factors, whereas in this study the SCF is based entirely on traded goods. Thevalue of ECF is lower in this study because of differences in calculationreferred to above. The low value of LCF obtained in the Mekong study is basedon the assumption that agricultural labor markets are highly imperfect inThailand. The present study takes the position that labor markets arereasonably efficient and the only reason why LCF is not equal to unity isbecause of distortions in the product market as reflected by the averageconversion factors. In this study the SCF is taken as a proxy for theaccounting ratio required to convert labor's marginal product in efficiencyprice terms. The value of LCF for a specific project may also be greater thanunity. This would happen for example, if labor is withdrawn from a sectorwhich has high export taxes that cannot be justified as optimal. In this casethe accounting factor for converting labor's marginal product into efficiencyunits would be greater than unity. This is the logic used in Staff WorkingPaper No. 385 in deriving LCF equal to 1.16 (Table 2).
17. The results in the McCleary study are based on differentmethodology. The value of SCF and q are, however, comparable. The highervalue of SCF in the present study reflects a lower level of average distor-tion. So far as the value of q is concerned, the lower estimate obtained inthis study is partly due to the fact that q is expressed in border price termswhereas in the McCleary study q was expressed in domestic currency unit, andpartly because the estimation procedure is somewhat different. The LCF valueobtained in this study is not comparable with the McCleary study because ofdifferences in methodology.
18. Neither the Bruce study nor the Mekong study allowed for thepossibility that Thailand may have some monopoly power in its major export -rice. This is done in the present study. The central values of SCF and CGCFare based on this more realistic assumption. The assumption is critical, inparticular, for the estimation of RCF and LCF specific to the rice sector. Asshown in Table 3, under small country assumption, the value of RCF is 1.49.When it is assumed that the world demand elasticity for Thai rice is (-) 4.0(based on an empirical study), rather than infinity, the RCF fallsdramatically to 1.11. Although a more careful study is required to obtain afirm estimate for the world demand elasticity for Thai rice and the estimatewould need to be revised from time to time, the assumption of perfectlyelastic world demand for Thai rice is not satisfactory.
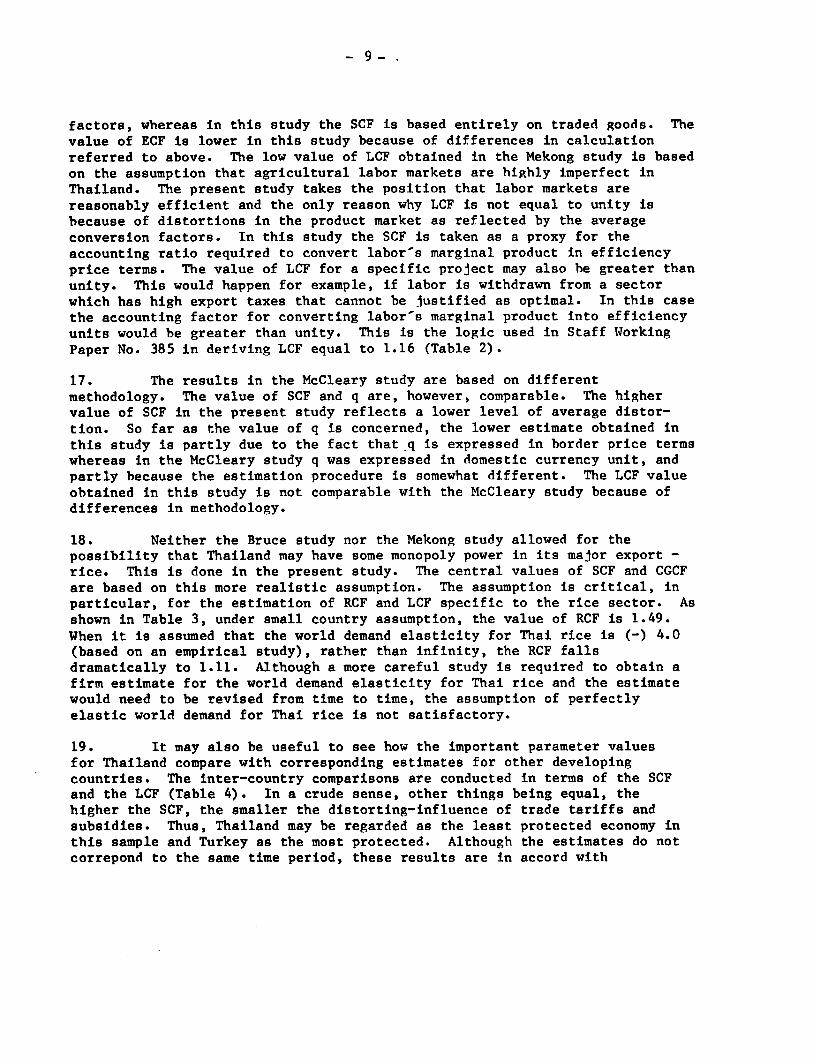
19. It may also be useful to see how the important parameter valuesfor Thailand compare with corresponding estimates for other developingcountries. The inter-country comparisons are conducted in terms of the SCFand the LCF (Table 4). In a crude sense, other things being equal, thehigher the SCF, the smaller the distorting-influence of trade tariffs andsubsidies. Thus, Thailand may be regarded as the least protected economy inthis sample and Turkey as the most protected. Although the estimates do notcorrepond to the same time period, these results are in accord with
- 10 -
preconceived notions. Similarly, the higher the LCF, the more likely it isthat the labor market works efficiently. Once again, the value of the LCFindicates that the labor market in Thailand is relatively more efficientthan labor markets in other countries in the sample.
Table 4: CROSS-COUNTRY COMPARISON OF IWO IMPORTANT NATIONAL PARAMETERS
Parameters/country SCF LCF
Turkey (1980) 0.59 0.39Morocco (1979) 0.60 0.51Ghana (1975) 0.75 NATanzania (1974) 0.77 0.45Ivory Coast (1977) 0.83 0.83Malaysia (1976) 0.85 0.42Colombia (1979) /a 0.90 0.58Philippines (1976) 0.91 NAThailand (1981) 0.92 0.92
/a Based on trade data approach forcomparability.
Limitations of the Present Study
20. There are a number of limitations of the present study. First,the conversion factors are based on current and past data. The values,therefore, reflect the present distortions. No attempt is made to projectfuture distortions. The justification for use of these parameters in theeconomic analysis of projects in the future is based on the assumption thatthe government would continue to pursue the present policies, mainly inrespect of trade policies, for a number of years. Any major policy changeaffecting the present trade regime would require a re-estimation of mostconversion factors. Second, it was not possible to check on the accuracy ofthe CGCF by using a more disaggregated approach, since relevant income-expenditure data for consumers were not available. Third, the estimation ofq involves a number of approximations which may have an adverse effect onthe accuracy of this estimate. Fourth, the values for CFR are based on thepresent rice export tax structure and available evidence on the relevantelasticity parameters. Since the Thai government's rice export policy hasundergone frequent changes in the past, it is expected that there would bechanges in the future as well. Moreover, the elasticity estimates areillustrative rather than definitive. Hence, for both reasons, the value ofCFR would need to be estimated in the context of specific projects.Finally, the SCF is used in this study as a proxy for the accounting ratiorequired to convert labors marginal product at market prices into border
-11 -
price terms. In actual project analysis the accounting ratio would depend onthe distortions specific to the sector from which labor is withdrawn.
III. ESTIMATION OF EFFICIENCY PARAMETERS
Functioning of Commodity Markets: History
21. Any discussion on the structure of commodity markets in Thailand andthe role of government therein would be incomplete without reference to pasteconomic history. Since the early times, the market mechanism has been thedominant force in the evolution of the Thai economy. The Thai government didnot attempt to impede the functioning of the market mechanism; on thecontrary, it helped promote active competition in the economy.
22. From the point of view of development of commodity markets, thesigning of the Bowring Treaty in 1855 between King Mongkut of Thailand andGreat Britain probably marks a watershed. The treaty not only exposedThailand to the west, it also imposed a regime of free trade - both internallyas well as externally. The mobility of goods across borders also had afavorable impact on the extent of monetization in the economy.
23. Two other developments during the reigns of Mongkut and his sonChulalongkorn - know as the "modern monarchs", had significant impact on theeconomy. The first development was the abolishment of 'Corvee'/2 and slaverysystems. This measure had two types of effects. First, the Thai farmersbecame free to engage themselves fully on their own land as well as to explorenew lands and second, the demand for wage labor increased rapidly whichattracted new streams of Chinese migrants. The later effect increased thecompetition in internal and external trading as the new immigrants sought toexploit the available opportunities while at the same time internal mobilityof goods and services was promoted through increased monetization and thedevelopment of transportation system.
24. The second important development during this period was the crea-tion of a government structure to administer the nation. In the absence of
/1 The discussion on Thailand's economic history is based on the followingworks: Dole A. Anderson, Marketing and Development: The ThailandExperience, Michigan State University, International Business andEconomic Studies, East Lansing, 1970; T.H. Silcock, The EconomicDevelopment of Thai Agriculture, Cornell University Press, 1970.
/2 A system of compulsory labor.
- 12 -
an administrative machinery, the government was forced to "farm out" thecollection of taxes. The introduction of direct collection by the govern-ment in 1892 increased tax collections three-fold in a decade even withoutimposition of new taxes. At the same time the Thai government becameincreasingly concerned about the growing power of the Chinese community.Beginning in the 1930's a number of laws were passed which attempted torestrict the Chinese economic power. Such laws included the requirement toemploy a minimum proportion of Thai citizens in certain activities andbarring alien participation in a number of important activities, includingrice cultivation. The impact of these controls, however, was rather limiteddue to the enforcement problem. This, however, provided incentives to thealiens to get assimilated in the Thai society by becoming citizens.
25. A second type of response of the government was the creation ofState-owned enterprise, on a limited scale, to provide competition to theprivate sector and to provide employment to Thai nationals. But oncecreated, unfortunately, these public enterprises increasingly becameimportant sources of income and patronage to the politicians and bureaucratsassociated with the management of these enterprises.
26. Apart from these small-order interventions, traditionally thegovernment's role in the economy has been to create an environment favorableto the growth of private enterprises. Moreover, the objective of the aboveinterventions was to limit the economic power of any one group so that morecompetition may be possible. But, beginning in the early 1960s, thegovernment decided to play a more active role in the economy. The concernwas generated by a rather unsatisfactory progress in the industrial sector.The first development plan was launched in 1961. Although the statedobjectives in this Plan and other successive Plans, maintained that thegovernment's role is to promote private enterprise through profit incentivesand more efficient functioning of the market mechanism, these Plans mark thebeginning of the period of significant government interventions in the Thaieconomic history. Even now, however, direct participation in economicactivity is very small relative to most developing countries of the world.
Functioning of Commodity Markets: Efficiency Issue
27. Marketing Channels in Industry. In the Industry sector there arethree distribution channels - wholesalers, retailers and direct consumers.Although distribution through wholesalers and retailers is dominant relativeto direct sales to consumers, there is no clear evidence on the relativeranking of wholesale distribution versus retail distribution. There is someevidence that smaller industrial firms sell less of their outputs towholesalers and more to retailers or directly to consumers than do largerfirms. There are however no documented allegations concerning inefficiencyin the distribution of industrial goods. The number of firms engaged intrading (wholesale or retail) is sufficiently large to ensure significantcompetition amongst traders.
- 13 -
28. Marketing Channels in Agriculture. The first transaction in theagricultural channel occurs on the farm or in the village. The farmer doesnot transport his crop to the market, rather, the middleman seeks out thefarmer and purchases his produce. The first middleman collects smallquantities from individual farmers and transports them to the district orprovincial centers where he sells to the second middleman or to theprocessing mill.
29. In view of the presence of a chain of middlemen, concern has beenraised about the efficiency of agricultural marketing system. A number ofcritics believe that farmers are exploited. There is, however, very littleevidence to support this allegation./l There are some problems with thedistribution of fertilizer. But marketing of agricultural output isreasonably efficient. The two main reasons why exploitation is unlikely tobe significant are: first, there are a large number of traders competingwith each other and second, there is an excellent transportation network inThailand.
30. Special Role of Development of Transportation. Few other govern-ment programs have had as large a role in integrating the Thai economy as thedevelopment of a network of roadways. The effect on the operation of thecommodity markets has been dramatic. Wrote Anderson, "the resulting revolu-tion in mobility has made possible for the first time in Thailand's historya national market for a variety of consumers goods. It is true that forcenturies imported goods have been carried to all parts of the Kingdom byitinerant traders, but the high cost of transportation by animals, bicycles,and human backs restricted the flow of goods to a trickle. What has changedwith lower-cost, year-round road transport is the volume of the flow and inconsequence, the roles of the existing marketing agencies and sectors"(p. 139)./2 And further, "evidence suggests that for consumer goods thetraditional pattern of higher prices with increasing distance from Bangkokis giving way to uniform prices to retailers throughout the nationalterritory" (p. 145) ./2
Distortionary Effects of Government Policies
31. While the government's transportation program has helped promotecompetition, a number of government policies have introduced distortion in the
/1 In particular see: Millard F. Long and Channond Aranjakonda, "RiceMarketing in Thailand," Bangkok Bank Monthly Review, Vol. 4, July1963, pp. 19-25; and also: William I. Baldwin, "The Thai Rice Tradeas a Vertical Market Network: Structure, Performance and PolicyImplications," Economic Development and Cultural Change, Vol.22, No. 2,January 1974; pp. 79-97.
/2 Anderson, op. cit.
- 14 -
commodities market. These policies are classified into four groups: (1)Trade taxes, (2) domestic taxes, (3) quantitative restrictions and (4)price controls and subsidies.
32. Trade Taxes. The two categories of trade taxes are (1) taxes onimports and (2) taxes on exports: On the export side only agriculturalcommodities are subject to export taxes.
33. Agricultural Export Taxes. The distortionary impact of agricul-tural export taxes has been hotly debated, mainly in respect of Thailand'smajor agricultural product 'rice.' At the one extreme there is the viewthat "the most important form of government intervention in the ruraleconomy has been through restricting access to world markets for the majoragricultural products, mainly via export taxation of rice and rubber."/1 Onthe other side there is the view that "Thailand is in the rather peculiarposition of being one of the largest rice exporters but not amongst thelargest producers. Although under free trade Thailand could not be expectedto have any appreciable influence on world prices, it does exercise somemonopoly power under existing conditions in the international market. Theexport premium could therefore be justified as an optimal export tax onrice."/2 Since the concern is only in respect of rice taxation, it will bediscussed in some greater detail in the section dealing with conversionfactor for rice. For the present, the issue of optimal tax on rice exportis ignored and it is assumed that agricultural taxation introducesdistortion by driving a wedge between world prices and domestic prices oftaxed commodities.
34. Only two major agricultural crops are subject to export taxes -rice and rubber. The main types of explicit taxes on rice are: (1) Theexport tax and (2) the rice premium. In addition, there is an importantform of implicit taxation on rice which is known as the 'rice reserverequirement'. The main tax on rubber is the export tax. There is also a taxcalled the 'cess.' The proceeds of the cess goes to the Rubber ReplantingAid Fund to finance rubber replanting. Hence, in effect the cess does notconstitute a tax.
/1 Trend Bertrand, Thailand: Case Study of Agricultural Input and OutputPricing, World Bank Staff Working Paper No. 385, Washington, April1980, p. 39.
/2 George S. Tolley et. al. Agricultural Price Policies and the DevelopingCountries. The Johns Hopkins University Press, 1982, pp. 96-97.
_ 15 _
35. Tariff Policy. On the import side the main type of governmentintervention is impositon of tariffs on different categories of imports.As a rule all types of imports are subject to taxation. However, importedinputs entering manufactured exports are allowed exemptions through the'Export Tax Rebate' and the 'Import Drawback Scheme.'
36. Domestic Taxes. The three main domestic taxes are (1) excisetax, (2) business tax and (3) municipal tax. Since the excise tax isimposed on both domestically produced goods as well as imported goods andpart of the objective is to correct for externalities (i.e. tax on liquorand tobacco), it is rather difficult to determine its distortionary effect.Therefore, following L-M suggestion, it is assumed that these taxes are"corrective" rather than distortionary./l Most goods, whether imported ordomestically produced, are subject to business and municipal taxes. Inaddition, there are some local taxes which, however, are ignored in thisstudy as negligible.
37. Quantitative Restrictions. In general, quantitative restrictions ontrade are selective and, for most items, of limited duration. The aggregateimpact is not likely to be significant. The main quantitative restrictionis in the form of export and/or import quotas. The export quota restrictionhas played an important role only for cassava exports, the quota restriction,in the first instance, being imposed by the main importing bloclc - theEEC./2 On the import side, the two most important quantitative restrictionare the ban on imports of fully assembled cars and the requirement to have aminimum domestic input content in car manufacturing./3
38. Three other forms of nonprice intervention are: the government togovernment (G to G) sales of rice, the restriction on the establishment ofsugar mills, and restrictions on private slaughterhouses. The distortionaryeffects of these policies are rather difficult to measure. But, theaggregate distortionary impact is not likely to be significant.
/1 Little-Mirrlees take an even stronger view. "In general we wouldregard taxes on goods sold to final consumers as 'corrective:' meaningby this that the net-of-taxes price is a better measure of the socialvalue of the good than market price." See Little-Mirrlees, op. cit,p. 224.
/2 For detailed discussion on quantitative restrictions on export, seeTrent Bertrand, op. cit.
/3 See: Back round Paper: Thailand's Industrial Sector: The ChangingRole ot Poicies to the eport: Thailand - Toward a Development Strategyof Full Participation, World Bank Country Study, March 1980.
- 16 -
39. Price Controls and Subsidies: From time to time the Thai Governmenthas imposed price controls on a number of consumer goods. The scope of pricecontrols has decreased recently. At present only six products are under pricecontrol at the retail level./l The main implication of price controls forshadow pricing is that domestic prices of items with price controls can nolonger be used as a measure of consumer's willingness to pay. Thus, if acommodity which is to be shadow priced on the basis of social marginal productfalls in the controlled price group, a direct estimate of consumerswillingness to pay will have to be made to obtain the appropriate shadowprice.
40. In order to promote manufactured exports the Thai Government hasdevised a number of incentive schemes, including various tax reimbursements oninputs. The channels of tax reimbursements are: the "Import Drawback Scheme"and the "Export Tax Rebate". On the agricultural export side, some indirectsubsidy is provided through cheap credit policy and through the "Farmer's AidFund". These subsidies tend to only partially offset the impact of varioustaxes. Hence, in the aggregate there is no net subsidy on either agriculturalexports or manufactured exports.
Numerical Estimates of General Conversion Factors
41. In this section numerical estimates of general conversion factorsand a number of specific nontraded goods conversion factors will be derived.The general conversion factors include: the standard conversion factor (SCF),the consumption goods conversion factor (CGCF), the intermediate goodsconversion factor (IGCF) and the capital goods conversion factor (KGCF);non-traded items include: construction conversion factor (CCF), transporta-tion conversion factor (TCF) and electricity conversion factor (ECF). Beforepresenting the numerical estimates, the logic and use of these conversionfactors in actual project appraisal are discussed briefly.
42. As mentioned earlier, the S-T approach advocates use of world pricesfor all actually traded goods and most tradeables which are not presentlytraded due to quantitative restrictions but for which the project evaluatorhas some assurance that such restrictions are temporary or that the governmentcan be pursuaded to modify its' policies. For nontradeables and all suchtradeables which are rendered nontraded by government policy and projectevaluator has no assurance that these restrictions will be removed, worldprices are not appropriate. Such commodities are to be shadow priced on thebasis of marginal social benefit (MSB), marginal social cost (MSC) or aweighted average of the two, as appropriate. The MSC is decomposed, throughvarious iterations using input-output table, into tradeables and labor. Thetradables are to be shadow priced in terms of border prices directly, whilelabor is to be converted into border price term by using the shadow price oflabor. The MSB is to be derived based on consumer's willingness to pay.
/1 Information provided by the Bank of Thailand.
- 17 .
43. In actual project appraisal it is usually feasible to obtainspecific shadow prices for only a few major commodities, either due to lackof information or because there are a large number of small items andestimating shadow prices for each item is a lengthy process. In such casesit is sufficient normally to use general conversion factors for all suchitems for which direct shadow prices cannot be obtained. In the case ofnontraded goods, also, it is sufficient normally to decompose SMC intofirst or second rounds of disaggregation using input-output tables. Sinceinput-output tables themselves are generally fairly aggregative, the commonpractice is to apply general conversion factors to these first and secondround decomposed inputs, rather than to try to reach the stage wherespecific conversion factors can be applied to each individual input.
44. The Standard Conversion Factor. The simplest way of calculatingthe SCF is to use what is known as the trade-data approach. The formulafor estimating SCF under this approach is:
M + XSCF =
M(l+t m) + X(l-t x)
where M = c.i.f. value of importsX - f.o.b. value of exportst m = average tax on importst x = net average tax on exports
45. The practical usefulness of this approach is that it requiresknowledge of mainly aggregate trade data which are relatively easily avail-able and, moreover, the actual computation is very simple. The simplicityof the formulation is also its main limitation. A number of specialassumptions are required for its validity. These are: (a) the countrydoes not have monopoly power in trade; (b) marginal changes in expenditureon nontradeables can be neglected; (c) income effects can be ignored orthat all income elasticities of spending are roughly equal to one; (d) shareof imports and exports adequately reflect the relative importance of tradedgoods in nontraded production and consumption; and (e) quantitativerestrictions on trade can be ignored as relatively small.
46. When these assumptions are inappropriate, this formulation mayyield misleading results. A more accurate, though fairly elaborateprocedure is to derive specific conversion factors for a large number oftraded and nontraded commodities and derive the SCF as a weighted averageof these conversion factors. The choice of estimation procedure,therefore, depends both on the criteria of convenience and relevance.
47. In the case of Thailand the estimation of SCF and all othergeneral conversion factors are based on the trade data approach. Apart fromits' convenience, the underlying assumptions also are not likely to be very
- 18 -
inappropriate./I One questionable aspect, though, is the assumption ofperfectly elastic world demand for Thai rice exports. There is someevidence that Thailand may have some monopoly power in the world market forrice. The approach adopted here is to first obtain the value of SCF basedon the standard model and subsequently do some sensitivity tests byrelaxing the assumption of perfectly elastic world demand for rice.
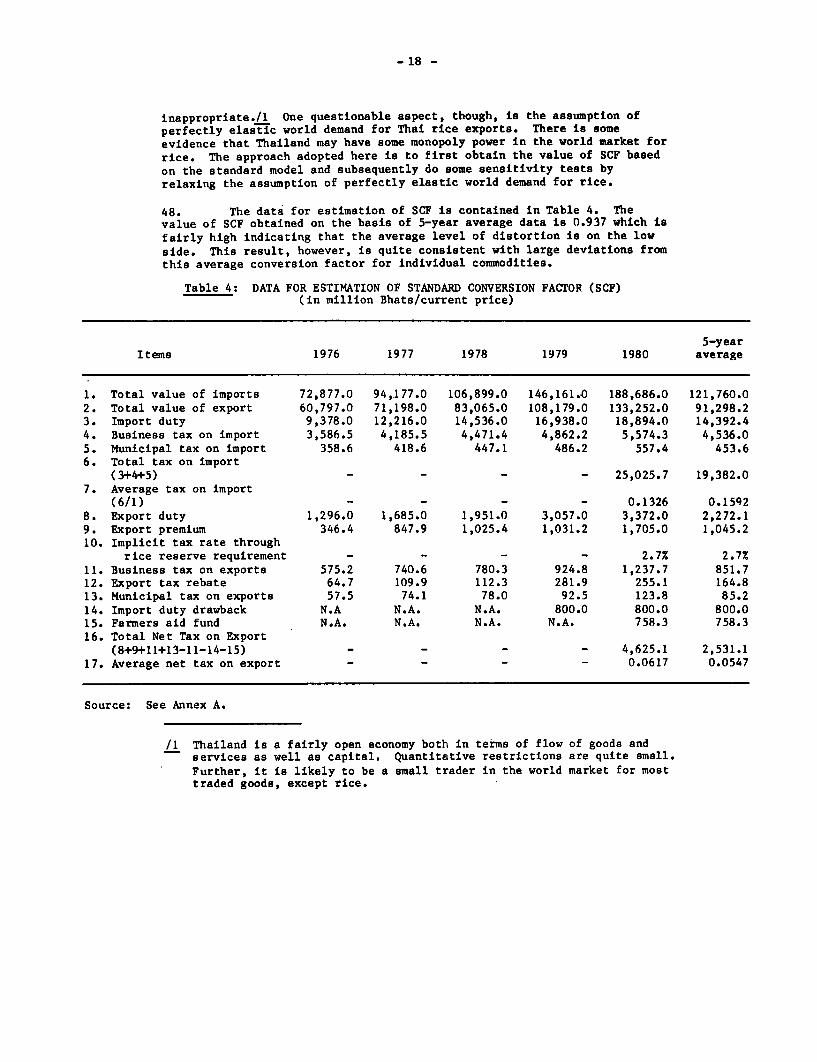
48. The data for estimation of SCF is contained in Table 4. Thevalue of SCF obtained on the basis of 5-year average data is 0.937 which isfairly high indicating that the average level of distortion is on the lowside. This result, however, is quite consistent with large deviations fromthis average conversion factor for individual commodities.
Table 4: DATA FOR ESTIMATION OF STANDARD CONVERSION FACTOR (SCF)(in million Bhats/current price)
5-yearItems 1976 1977 1978 1979 1980 average
1. Total value of imports 72,877.0 94,177.0 106,899.0 146,161.0 188,686.0 121,760.02. Total value of export 60,797.0 71,198.0 83,065.0 108,179.0 133,252.0 91,298.23. Import duty 9,378.0 12,216.0 14,536.0 16,938.0 18,894.0 14,392.44. Business tax on import 3,586.5 4,185.5 4,471.4 4,862.2 5,574.3 4,536.05. Municipal tax on import 358.6 418.6 447.1 486.2 557.4 453.66. Total tax on import
(3+4+5) - - - - 25,025.7 19,382.07. Average tax on import
(6/1) - - - - 0.1326 0.1592
8. Export duty 1,296.0 1,685.0 1,951.0 3,057.0 3,372.0 2,272.19. Export premium 346.4 847.9 1,025.4 1,031.2 1,705.0 1,045.210. Implicit tax rate through
rice reserve requirement - - - - 2.7% 2.7%
11. Business tax on exports 575.2 740.6 780.3 924.8 1,237.7 851.712. Export tax rebate 64.7 109.9 112.3 281.9 255.1 164.813. Municipal tax on exports 57.5 74.1 78.0 92.5 123.8 85.214. Import duty drawback N.A N.A. N.A. 800.0 800.0 800.015. Farmers aid fund N.A. N.A. N.A. N.A. 758.3 758.316. Total Net Tax on Export
(8+9+11+13-11-14-15) - - - - 4,625.1 2,531.117. Average net tax on export - - - - 0.0617 0.0547
Source: See Annex A.
/1 Thailand is a fairly open economy both in terms of flow of goods andservices as well as capital. Quantitative restrictions are quite small.Further, it is likely to be a small trader in the world market for mosttraded goods, except rice.
- 19 -
49. The SCF bears a close relationship to the concept of the shadowexchange rate (SER) suggested in the UNIDO methodology./l The relationshipbetween the two is given by:
SCF = OER/SER
where OER is the official exchange rate. Thus, the reciprocal- of the SCFgives the premium on foreign exchange. The premium, on the basis of 5-yearaverage data, is 6.73%. A direct estimate of SER was made by Chunanuntathumin 1976./2 He obtained a foreign exchange premium ranging from 3% to 8.8%.The two results are, therefore, reasonably close.
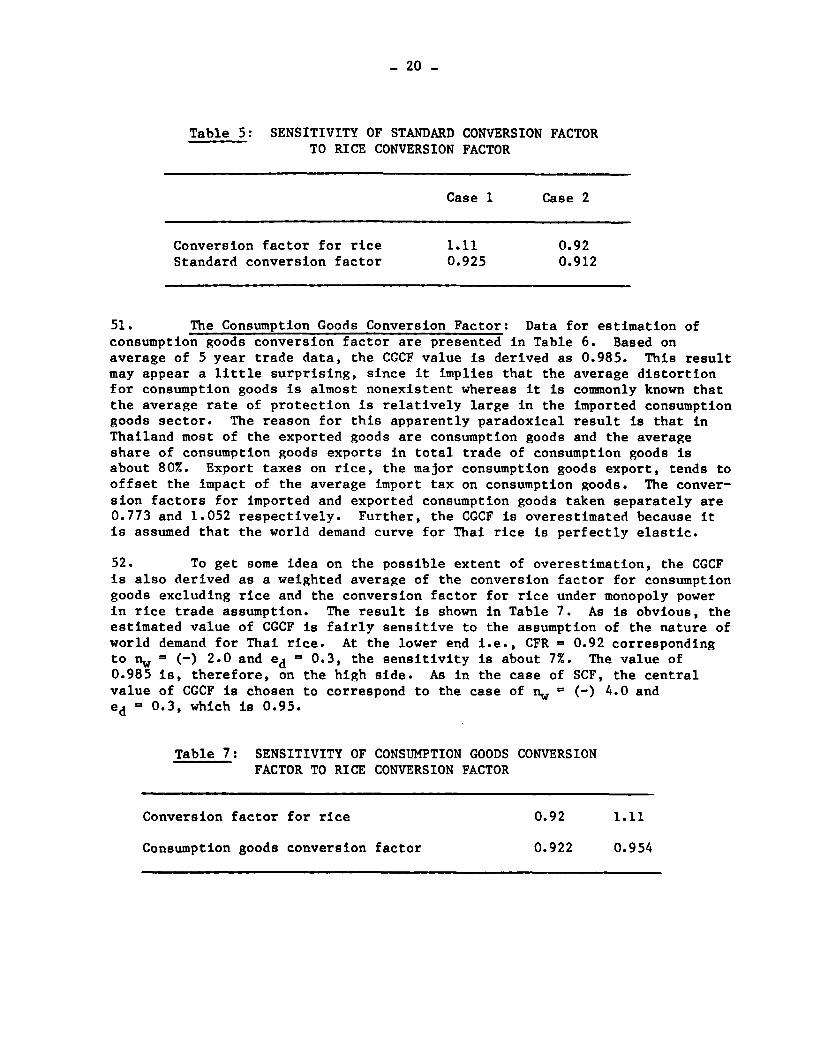
50. If, however, it is assumed that Thailand has some monopoly powerin rice trade, the value of SCF is then overestimated. To get some idea onthe possible magnitude of overestimation, an alternative estimate of SCF isderived by taking a weighted average of SCF excluding rice and the conversionfactor for rice derived under the assumption of less than perfectly elasticworld demand for Thai rice (see Part V). The result is shown below. Theprecentage variation is not very large, i.e., only 3% at the lower end.This implies that the estimated value of 0.937 is not wide off the mark.Nevertheless, since presently available evidence does not justify anassumption of perfectly elastic world demand for rice, the central value ofSCF is chosen as 0.92 corresponding to the case of elasticity of worlddemand for Thai rice (nw) of (-) 4.0 and Thai rice supply elasticity (ed)of 0.3.
/1 In the UNIDO methodology it is suggested that in practice the SER maybe derived by using the following formula:
M XSER - OER (1 + M+X (t ) + M+X (-t ) )
m x
It is clear that SER/OER * 1/SCF. This formulation has also been advo-cated by E.J. Mishan, Cost Benefit Analysis, New York, PraegerPublishers, 1971; D.M. Schydlowsky, On the Choice of a Shadow Price forForeign Exchange, Economic development report, No.108, Cambridge, Mass.,Development Advisory Service, Harvard University, revised Oct. 1968.
/2 S. Chunanuntathum, Trade and Balance of Payments of Thailand, UnpublishedDiscussion Paper No. 72, Faculty of Economics, Thammasat University,Bangkok, March 1979.
- 20 -
Table 5: SENSITIVITY OF STANDARD CONVERSION FACTORTO RICE CONVERSION FACTOR
Case 1 Case 2
Conversion factor for rice 1.11 0.92Standard conversion factor 0.925 0.912
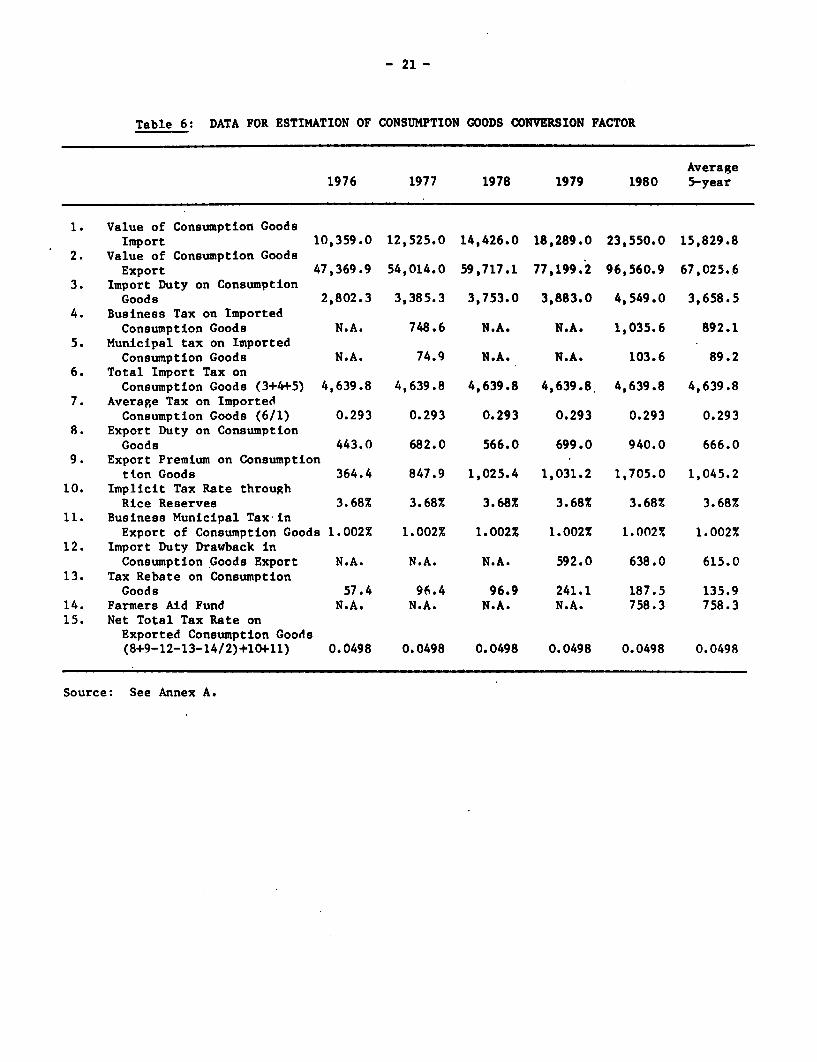
51. The Consumption Goods Conversion Factor: Data for estimation ofconsumption goods conversion factor are presented in Table 6. Based onaverage of 5 year trade data, the CGCF value is derived as 0.985. This resultmay appear a little surprising, since it implies that the average distortionfor consumption goods is almost nonexistent whereas it is commonly known thatthe average rate of protection is relatively large in the imported consumptiongoods sector. The reason for this apparently paradoxical result is that inThailand most of the exported goods are consumption goods and the averageshare of consumption goods exports in total trade of consumption goods isabout 80%. Export taxes on rice, the major consumption goods export, tends tooffset the impact of the average import tax on consumption goods. The conver-sion factors for imported and exported consumption goods taken separately are0.773 and 1.052 respectively. Further, the CGCF is overestimated because itis assumed that the world demand curve for Thai rice is perfectly elastic.
52. To get some idea on the possible extent of overestimation, the CGCFis also derived as a weighted average of the conversion factor for consumptiongoods excluding rice and the conversion factor for rice under monopoly powerin rice trade assumption. The result is shown in Table 7. As is obvious, theestimated value of CGCF is fairly sensitive to the assumption of the nature ofworld demand for Thai rice. At the lower end i.e., CFR = 0.92 correspondingto nw = (-) 2.0 and ed - 0.3, the sensitivity is about 7%. The value of0.985 is, therefore, on the high side. As in the case of SCF, the centralvalue of CGCF is chosen to correspond to the case of nw (-) 4.0 anded - 0.3, which is 0.95.
Table 7: SENSITIVITY OF CONSUMPTION GOODS CONVERSIONFACTOR TO RICE CONVERSION FACTOR
Conversion factor for rice 0.92 1.11
Consumption goods conversion factor 0.922 0.954
- 21 -
Table 6: DATA FOR ESTIMATION OF CONSUMPTION GOODS CONVERSION FACTOR
Average1976 1977 1978 1979 1980 5-year
1. Value of Consumption GoodsImport 10,359.0 12,525.0 14,426.0 18,289.0 23,550.0 15,829.8
2. Value of Consumption GoodsExport 47,369.9 54,014.0 59,717.1 77,199.2 96,560.9 67,025.6
3. Import Duty on ConsumptionGoods 2,802.3 3,385.3 3,753.0 3,883.0 4,549.0 3,658.5
4. Business Tax on ImportedConsumption Goods N.A. 748.6 N.A. N.A. 1,035.6 892.1
5. Municipal tax on ImportedConsumption Goods N.A. 74.9 N.A. N.A. 103.6 89.2
6. Total Import Tax onConsumption Goods (3+4+5) 4,639.8 4,639.8 4,639.8 4,639.8. 4,639.8 4,639.8
7. Average Tax on ImportedConsumption Goods (6/1) 0.293 0.293 0.293 0.293 0.293 0.293
8. Export Duty on ConsumptionGoods 443.0 682.0 566.0 699.0 940.0 666.0
9. Export Premium on Consumptiontion Goods 364.4 847.9 1,025.4 1,031.2 1,705.0 1,045.2
10. Implicit Tax Rate throughRice Reserves 3.68% 3.68% 3.68% 3.68% 3.68% 3.68%
11. Business Municipal Tax inExport of Consumption Goods 1.002% 1.002% 1.002% 1.002% 1.002% 1.002%
12. Import Duty Drawback inConsumption Goods Export N.A. N.A. N.A. 592.0 638.0 615.0
13. Tax Rebate on ConsumptionGoods 57.4 96.4 96.9 241.1 187.5 135.9
14. Farmers Aid Fund N.A. N.A. N.A. N.A. 758.3 758.315. Net Total Tax Rate on
Exported Consumption Goods(8+9-12-13-14/2)+10+11) 0.0498 0.0498 0.0498 0.0498 0.0498 0.0498
Source: See Annex A.
_ 22 _
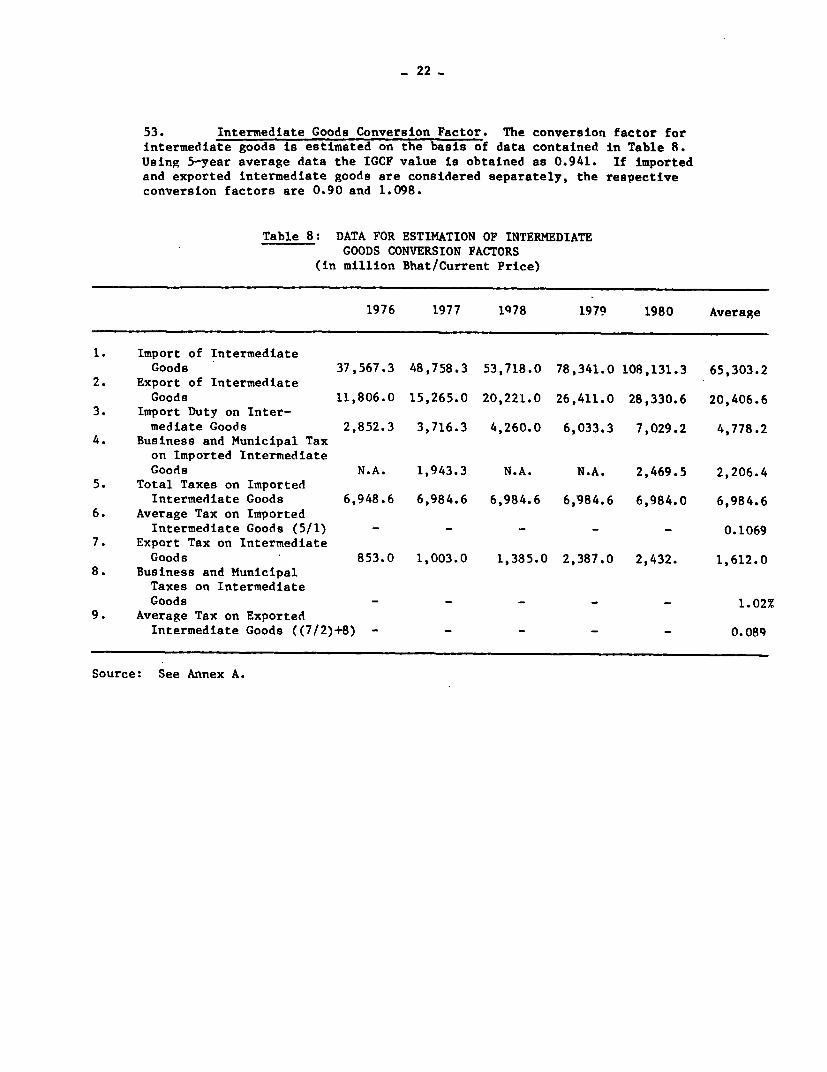
53. Intermediate Goods Conversion Factor. The conversion factor forintermediate goods is estimated on the basis of data contained in Table 8.Using 5-year average data the IGCF value is obtained as 0.941. If importedand exported intermediate goods are considered separately, the respectiveconversion factors are 0.90 and 1.098.
Table 8: DATA FOR ESTIMATION OF INTERMEDIATEGOODS CONVERSION FACTORS
(in million Bhat/Current Price)
1976 1977 1978 1979 1980 Average
1. Import of IntermediateGoods 37,567.3 48,758.3 53,718.0 78,341.0 108,131.3 65,303.2
2. Export of IntermediateGoods 11,806.0 15,265.0 20,221.0 26,411.0 28,330.6 20,406.6
3. Import Duty on Inter-mediate Goods 2,852.3 3,716.3 4,260.0 6,033.3 7,029.2 4,778.2
4. Business and Municipal Taxon Imported IntermediateGoods N.A. 1,943.3 N.A. N.A. 2,469.5 2,206.4
5. Total Taxes on ImportedIntermediate Goods 6,948.6 6,984.6 6,984.6 6,984.6 6,984.0 6,984.6
6. Average Tax on ImportedIntermediate Goods (5/1) - - - - - 0.1069
7. Export Tax on IntermediateGoods 853.0 1,003.0 1,385.0 2,387.0 2,432. 1,612.0
8. Business and MunicipalTaxes on IntermediateGoods - - - - - 1.02%
9. Average Tax on ExportedIntermediate Goods ((7/2)+8) - - - - - 0.089
Source: See Annex A.
- 23
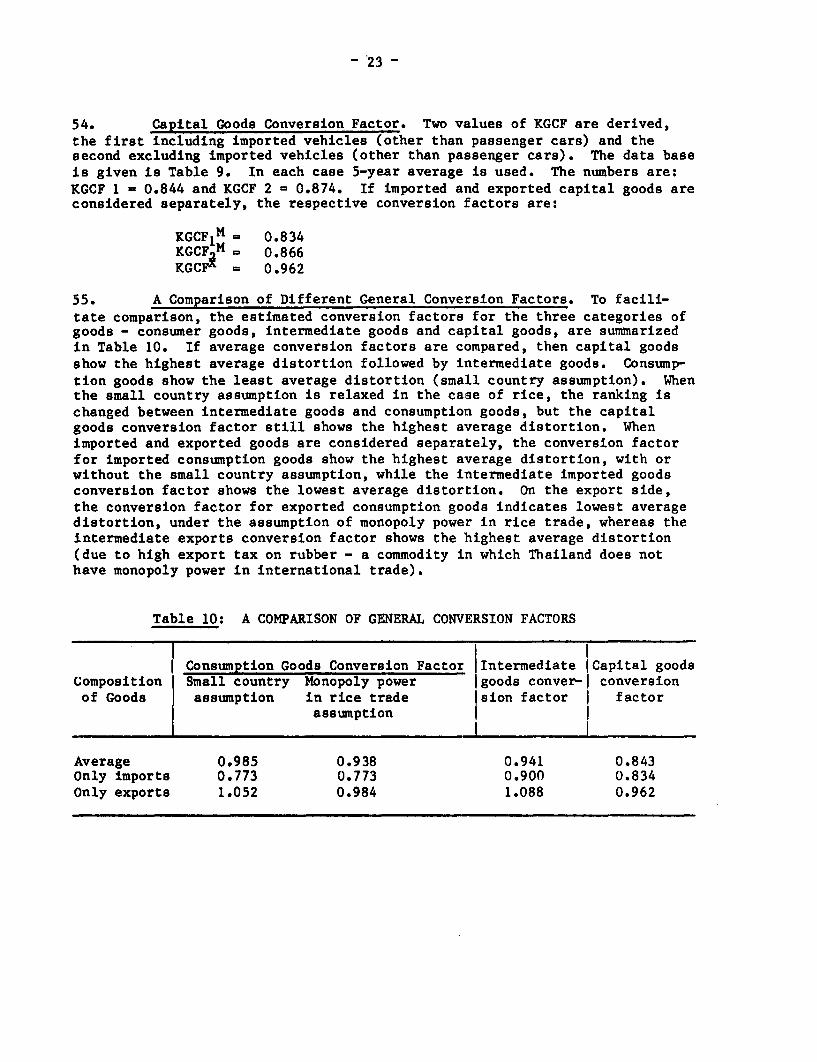
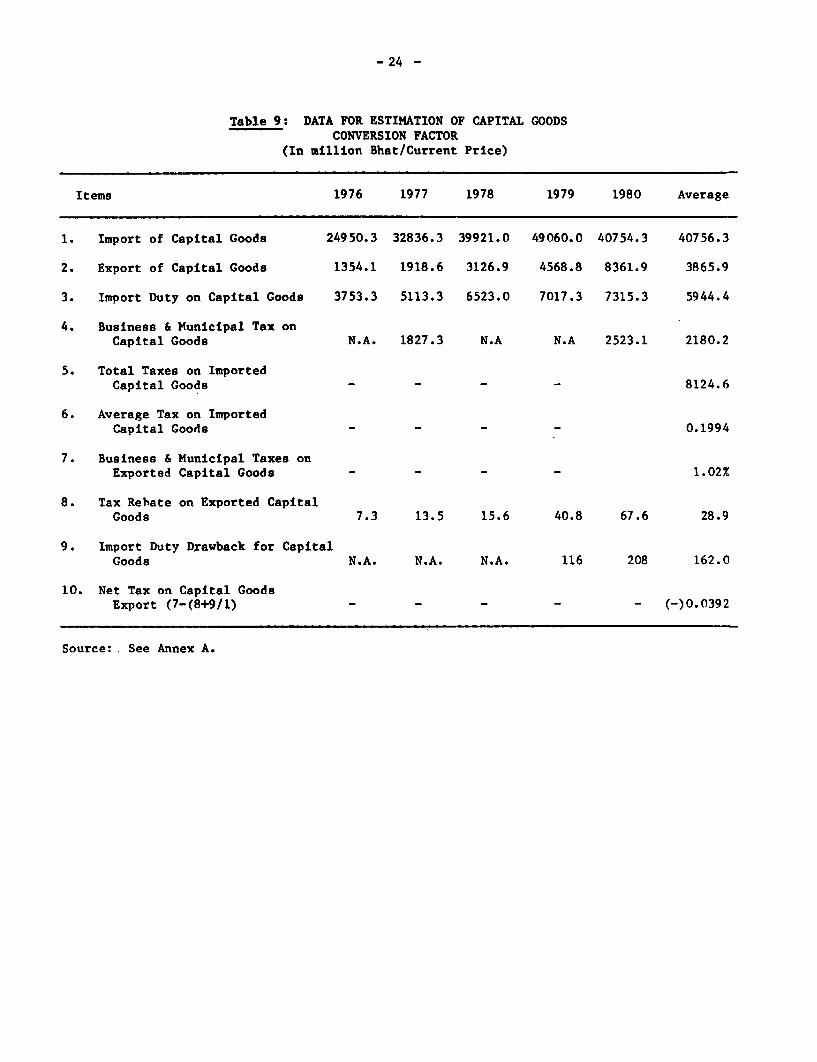
54. Capital Goods Conversion Factor. Two values of KGCF are derived,the first including imported vehicles (other than passenger cars) and thesecond excluding imported vehicles (other than passenger cars). The data baseis given is Table 9. In each case 5-year average is used. The numbers are:KGCF 1 = 0.844 and KGCF 2 = 0.874. If imported and exported capital goods areconsidered separately, the respective conversion factors are:
KGCFlM - 0.834KGCF M = 0.866KGCF* = 0.962
55. A Comparison of Different General Conversion Factors. To facili-tate comparison, the estimated conversion factors for the three categories ofgoods - consumer goods, intermediate goods and capital goods, are summarizedin Table 10. If average conversion factors are compared, then capital goodsshow the highest average distortion followed by intermediate goods. Consump-tion goods show the least average distortion (small country assumption). Whenthe small country assumption is relaxed in the case of rice, the ranking ischanged between intermediate goods and consumption goods, but the capitalgoods conversion factor still shows the highest average distortion. Whenimported and exported goods are considered separately, the conversion factorfor imported consumption goods show the highest average distortion, with orwithout the small country assumption, while the intermediate imported goodsconversion factor shows the lowest average distortion. On the export side,the conversion factor for exported consumption goods indicates lowest averagedistortion, under the assumption of monopoly power in rice trade, whereas theintermediate exports conversion factor shows the highest average distortion(due to high export tax on rubber - a commodity in which Thailand does nothave monopoly power in international trade).
Table 10: A COMPARISON OF GENERAL CONVERSION FACTORS
Consumption Goods Conversion Factor Intermediate ICapital goodsComposition Small country Monopoly power goods conver-I conversionof Goods assumption in rice trade Ision factor I factor
assumption l
Average 0.985 0.938 0.941 0.843Only imports 0.773 0.773 0.900 0.834Only exports 1.052 0.984 1.088 0.962
- 24 -
Table 9: DATA FOR ESTIMATION OF CAPITAL GOODSCONVERSION FACTOR
(In million Bhat/Current Price)
Items 1976 1977 1978 1979 1980 Average
1. Import of Capital Goods 24950.3 32836.3 39921.0 49060.0 40754.3 40756.3
2. Export of Capital Goods 1354.1 1918.6 3126.9 4568.8 8361.9 3865.9
3. Import Duty on Capital Goods 3753.3 5113.3 6523.0 7017.3 7315.3 5944.4
4. Business & Municipal Tax onCapital Goods N.A. 1827.3 N.A N.A 2523.1 2180.2
5. Total Taxes on ImportedCapital Goods - - - - 8124.6
6. Average Tax on ImportedCapital Goods - - - - 0.1994
7. Business & Municipal Taxes onExported Capital Goods - - - - 1.02%
8. Tax Rehate on Exported CapitalGoods 7.3 13.5 15.6 40.8 67.6 28.9
9. Import Duty Drawback for CapitalGoods N.A. N.A. N.A. 116 208 162.0
10. Net Tax on Capital GoodsExport (7-(8+9/1) - - - - - (-)0.0392
Source: See Annex A.
- 25 -
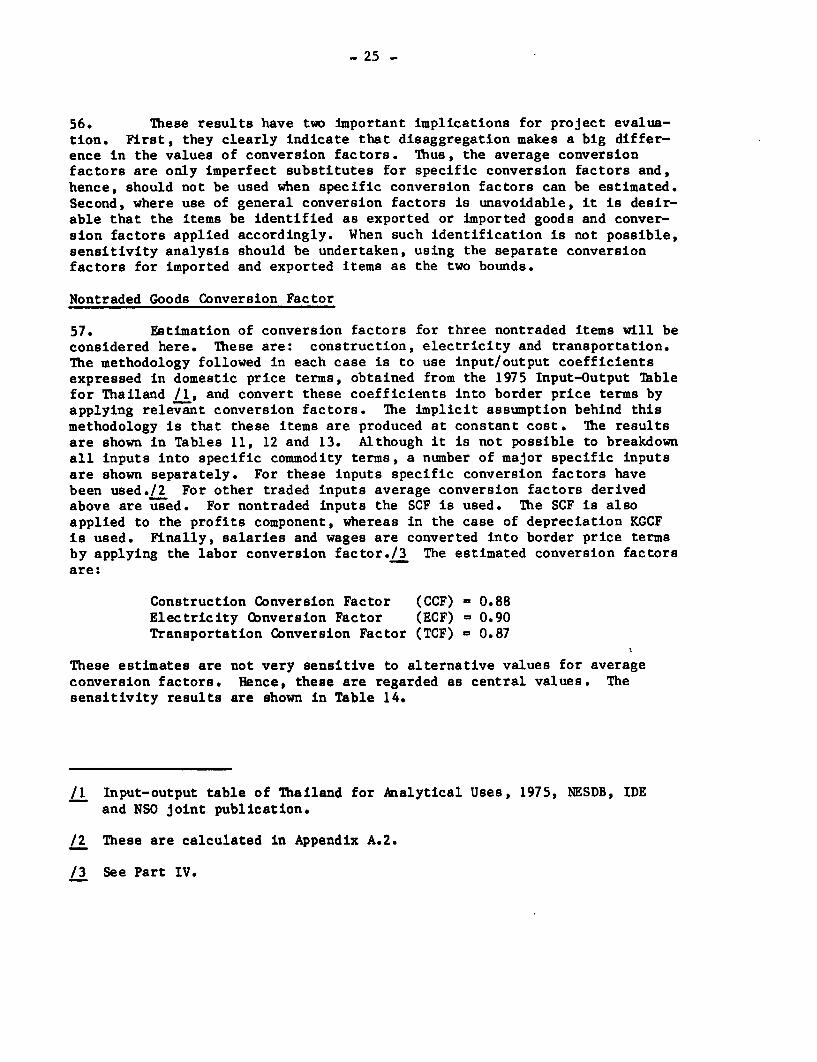
56. These results have two important implications for project evalua-tion. First, they clearly indicate that disaggregation makes a big differ-ence in the values of conversion factors. Thus, the average conversionfactors are only imperfect substitutes for specific conversion factors and,hence, should not be used when specific conversion factors can be estimated.Second, where use of general conversion factors is unavoidable, it is desir-able that the items be identified as exported or imported goods and conver-sion factors applied accordingly. When such identification is not possible,sensitivity analysis should be undertaken, using the separate conversionfactors for imported and exported items as the two bounds.
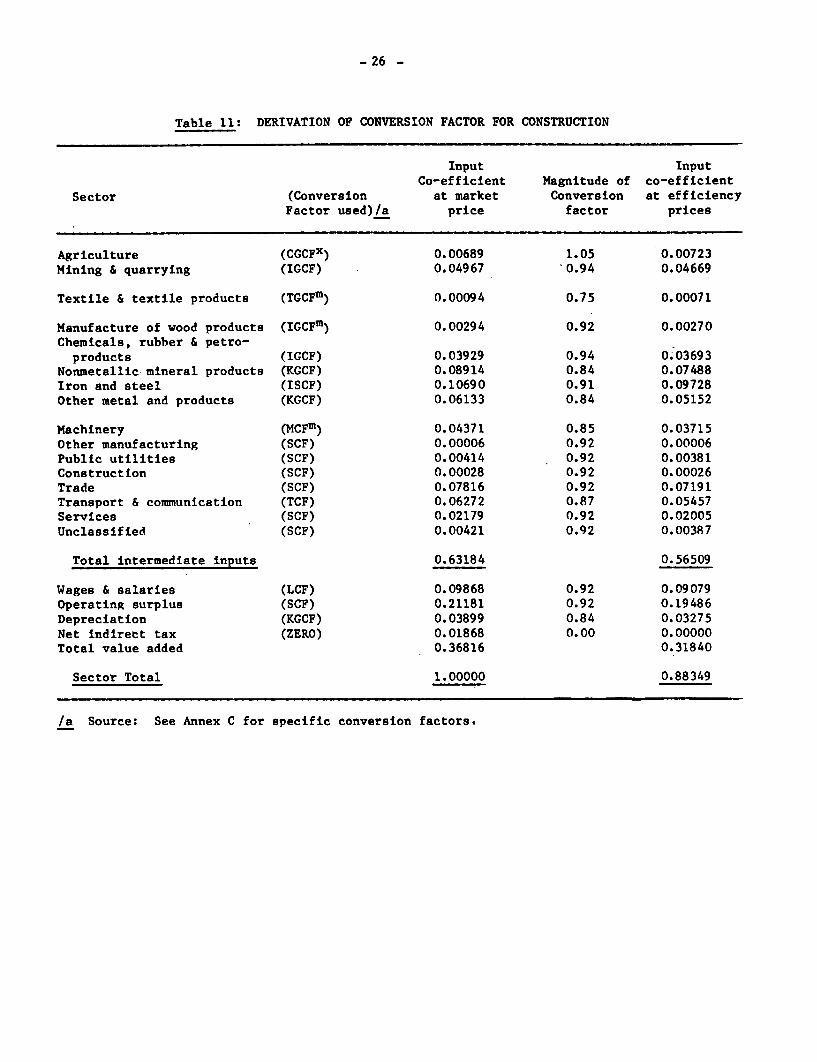
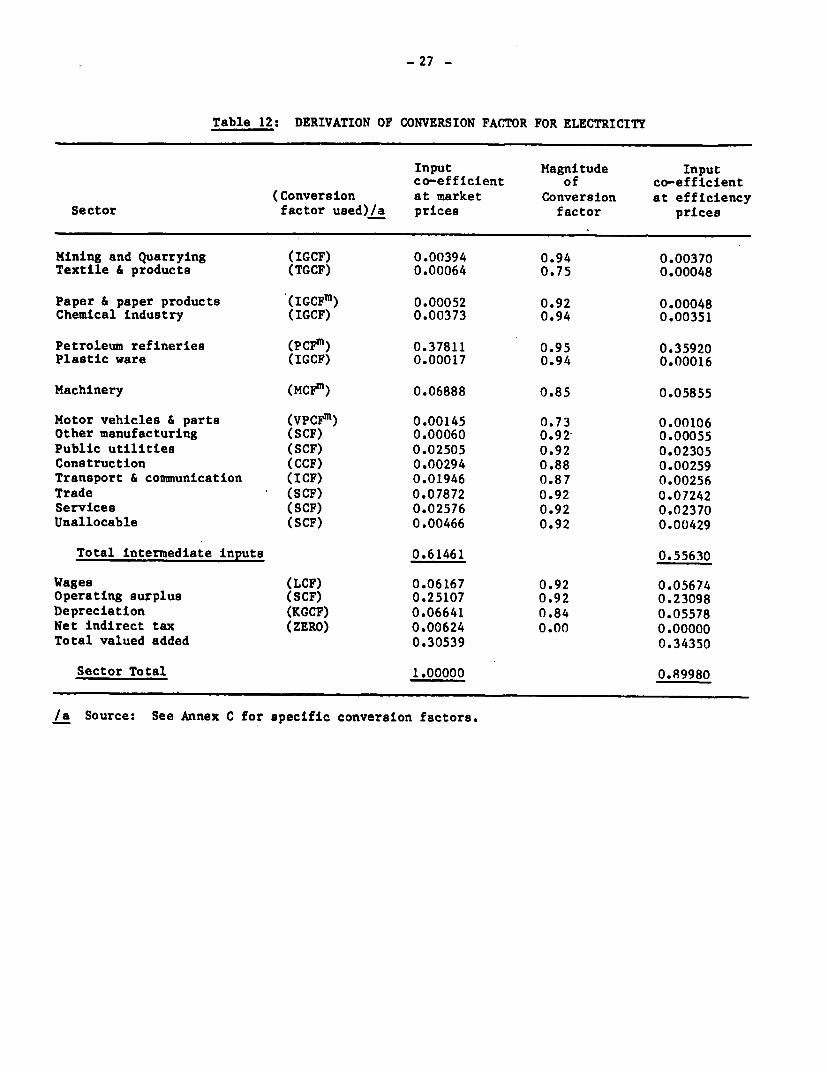
Nontraded Goods Conversion Factor
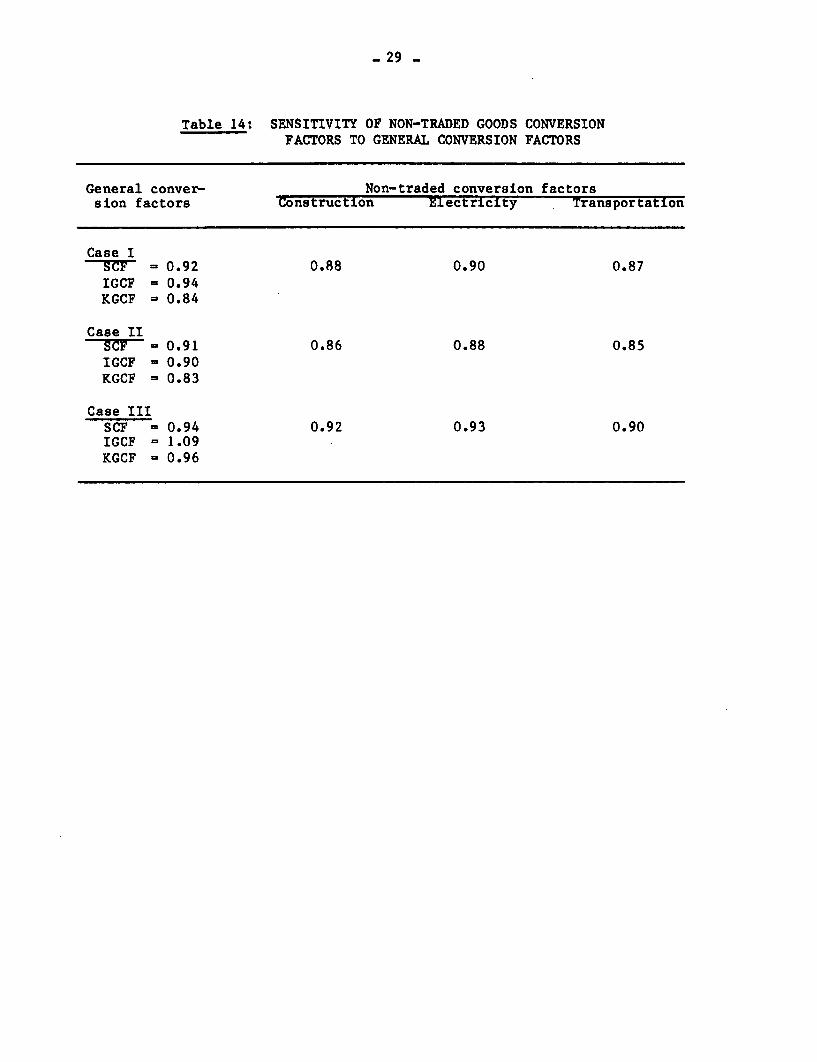
57. Estimation of conversion factors for three nontraded items will beconsidered here. These are: construction, electricity and transportation.The methodology followed in each case is to use input/output coefficientsexpressed in domestic price terms, obtained from the 1975 Input-Output Tablefor Thailand /1, and convert these coefficients into border price terms byapplying relevant conversion factors. The implicit assumption behind thismethodology is that these items are produced at constant cost. The resultsare shown in Tables 11, 12 and 13. Although it is not possible to breakdownall inputs into specific commodity terms, a number of major specific inputsare shown separately. For these inputs specific conversion factors havebeen used./2 For other traded inputs average conversion factors derivedabove are used. For nontraded inputs the SCF is used. The SCF is alsoapplied to the profits component, whereas in the case of depreciation KGCFis used. Finally, salaries and wages are converted into border price termsby applying the labor conversion factor./3 The estimated conversion factorsare:
Construction Conversion Factor (CCF) - 0.88Electricity Conversion Factor (ECF) = 0.90Transportation Conversion Factor (TCF) = 0.87
These estimates are not very sensitive to alternative values for averageconversion factors. Hence, these are regarded as central values. Thesensitivity results are shown in Table 14.
/1 Input-output table of Thailand for Analytical Uses, 1975, NESDB, IDEand NSO joint publication.
/2 These are calculated in Appendix A.2.
/3 See Part IV.
- 26 -
Table 11: DERIVATION OF CONVERSION FACTOR FOR CONSTRUCTION
Input InputCo-efficient Magnitude of co-efficient
Sector (Conversion at market Conversion at efficiencyFactor used)/a price factor prices
Agriculture (CGCFx) 0.00689 1.05 0.00723Mining & quarrying (IGCF) 0.04967 '0.94 0.04669
Textile & textile products (TGCFm) 0.00094 0.75 0.00071
Manufacture of wood products (IGCFm) 0.00294 0.92 0.00270Chemicals, rubber & petro-
products (IGCF) 0.03929 0.94 0.03693Nonmetallic mineral products (KGCF) 0.08914 0.84 0.07488Iron and steel (ISCF) 0.10690 0.91 0.09728Other metal and products (KGCF) 0.06133 0.84 0.05152
Machinery (MCFm) 0.04371 0.85 0.03715Other manufacturing (SCF) 0.00006 0.92 0.00006Public utilities (SCF) 0.00414 0.92 0.00381Construction (SCF) 0.00028 0.92 0.00026Trade (SCF) 0.07816 0.92 0.07191Transport & communication (TCF) 0.06272 0.87 0.05457Services (SCF) 0.02179 0.92 0.02005Unclassified (SCF) 0.00421 0.92 0.00387
Total intermediate inputs 0.63184 0.56509
Wages & salaries (LCF) 0.09868 0.92 0.09079Operating surplus (SCF) 0.21181 0.92 0.19486Depreciation (KGCF) 0.03899 0.84 0.03275Net indirect tax (ZERO) 0.01868 0.00 0.00000Total value added 0.36816 0.31840
Sector Total 1.00000 0.88349
/a Source: See Annex C for specific conversion factors.
_27 -
Table 12: DERIVATION OF CONVERSION FACTOR FOR ELECTRICITY
Input Magnitude Inputco-efficient of co-efficient
(Conversion at market Conversion at efficiencySector factor used)/a prices factor prices
Mining and Quarrying (IGCF) 0.00394 0.94 0.00370Textile & products (TGCF) 0.00064 0.75 0.00048
Paper & paper products (IGCFm) 0.00052 0.92 0.00048Chemical industry (IGCF) 0.00373 0.94 0.00351
Petroleum refineries (PCFm) 0.37811 0.95 0.35920Plastic ware (IGCF) 0.00017 0.94 0.00016
Machinery (MCFm) 0.06888 0.85 0.05855
Motor vehicles & parts (VPCFp) 0.00145 0.73 0.00106Other manufacturing (SCF) 0.00060 0.92 0.00055Public utilities (SCF) 0.02505 0.92 0.02305Construction (CCF) 0.00294 0.88 0.00259Transport & communication (ICF) 0.01946 0.87 0.00256Trade (SCF) 0.07872 0.92 0.07242Services (SCF) 0.02576 0.92 0.02370Unallocable (SCF) 0.00466 0.92 0.00429
Total intermediate inputs 0.61461 0.55630
Wages (LCF) 0.06167 0.92 0.05674Operating surplus (SCF) 0.25107 0.92 0.23098Depreciation (KGCF) 0.06641 0.84 0.05578Net indirect tax (ZERO) 0.00624 0.00 0.00000Total valued added 0.30539 0.34350
Sector Total 1.00000 0.89980
/a Source: See Annex C for specific conversion factors.
- 28 -
Table 13: DERIVATION OF CONVERSION FACTOR FOR TRANSPORTATION
Conver- Input co- Magnitude Input co-sion efficient of efficientfactor at market conversion at effic-
Sector used /a price factor iency prices
Agriculture (CGCFX) 0.00048 1.05 0.00051Food manufacturing (CGCF) 0.00256 0.94 0.00241Textile and products (TGCFm) 0.01069 0.75 0.00802Paper and products (IGCFm) 0.00389 0.92 0.00359Chemical, rubber & products (IGCF) 0.00757 0.94 0.00712Petroleum and products (PCFm) 0.21606 0.95 0.20526Nonmetalic products (KGCF) 0.00042 0.84 0.00035Metallic products (KGCF) 0.00128 0.84 0.00108Machinery (MCFm) 0.00210 0.85 0.00179Motor vehicles & parts (VPCFT) 0.08555 0.73 0.06211Other manufacturing (SCF) 0.00044 0.92 0.00041Public utilities (SCF) 0.00454 0.92 0.00418Construction (SCF) 0.00536 0.92 0.00484Trade (SCF) 0.04867 0.92 0.04478Transport & Communications (SCF) 0.03029 0.92 0.02787Services (SCF) 0.03303 0.92 0.03039Unallocable (SCF) 0.01016 0.92 0.00952
Total Intermediate Input 0.46249 0.41403
Wages and salaries (LCF) 0.19979 0.92 0.18381Operating surplus (SCF) 0.21237 0.92 0.19538Depreciation (KGCF) 0.08991 0.84 0.07552Indirect taxes (ZERO) 0.03545 0.00 0.00000
Total Value Added 0.53751 0.45471
Sector Total 1.00000 0.86874
/a Source: See Annex C for specific conversion factors.
_ 29 _
Table 14: SENSITIVITY OF NON-TRADED GOODS CONVERSIONFACTORS TO GENERAL CONVERSION FACTORS
General conver- Non-traded conversion factorssion factors Construction Electricity Transportation
Case ISCF - 0.92 0.88 0.90 0.87IGCF = 0.94KGCF = 0.84
Case IISCF = 0.91 0.86 0.88 0.85IGCF - 0.90KGCF - 0.83
Case IIISCF = 0.94 0.92 0.93 0.90IGCF = 1.09KGCF = 0.96
- 30 -
IV. ESTIMATION OF ECONOMIC RETURNS TO FACTORS
58. The two main factors traded in the factor market are labor andcapital. Estimation of economic returns to these two factors - the shadowwage rate and social marginal productivity of capital, would be consideredhere.
The Labor Market
59. Review of Theories of Wage Determination in Developing Countries.The determination of wage rates in the rural and urban centers of developingcountries has been extensively discussed in the literature, following thelead from the works of Lewis /1, Fei-Ranis /2, and Harris-Todaro /3.The common characteristic of these models is the assumption that there isdualism in the labor market - either in the rural sector or in the urbansector, in the sense that the price of labor exceeds the marginal productof labor. In the Lewis-Fei-Ranis model dualism prevails in the traditionalrural sector, while in the Harris-Todaro model dualism prevails in the modernurban sector. These works have dominated economic thinking in this area forquite sometime and have been frequently used as a basis for classifyingactual labor markets in developing countries as following either of the twoschemes but, unfortunately, often without a strong empirical justification.
60. Dualism in the Traditional Sector. Lewis' basic argument is thatin developing countries the traditional sector is characterized by a largesurplus of underemployed labor with close to zero marginal product oflabor. But labor earnings are positive and significantly greater thanmarginal product. As a result, private cost of employment exceeds its socialcost. The policy implication of this model is that the government shouldinitiate a process of labor transfer from rural sector to the urban sector.For project analysis purpose, the Lewis model implies that not only labor'ssocial marginal product is zero but also its utilization is sociallycostless; hence labor's shadow price, both in efficiency terms as well associal terms, is zero.
/1 W. A. Lewis, "Economic Development with Unlimited Supplies of Labor,"Manchester School, Vol. 22, 1951.
/2 J.C.H. Fei and G. Ranis, "A Theory of Economic Development," AmericanEconomic Review 51, September 1961.
/3 J. R. Harris and M. P. Todaro, "Migration, Unemployment and Development:a Two-Sector Analysis," American Economic Review, Vol. 60, 1970.
- 31 -
61. Dualism in the Urban Center. The main argument of urban sectordualism, as developed by liarris and Todaro, is that, due to prevalence ofminimum wages, wages in the urban organized labor market exceeds correspond-ing marginal product as well as wages in the rural sector. This wage gapinduces a process of rural-urban migration, causing the presence of a largepool of underemployed urban workers as well as a reduction in agriculturaloutput due to withdrawal of labor from rural areas. The main policy impli-cation of this model is that the government should remove the minimum wageclause. For project analysis purpose this model implies that shadow priceof labor in the urban organized sector is less than the market price. Thus,labor conversion factor for organized sector is less than one and laborconversion factor in the efficiency sense is different from labor conversionfactor in the social sense.
62. Justification of Labor Market Dualism. The most complete state-ment on the implication of dual agriculture was provided by Sen./l Thereare two major propositions:
(a) Agricultural households may be classified into two groups - smallfarmers who employ only family labor and maximize utility andlarge farmers who use hired labor and maximize profit.
(b) Supply price of family labor is lower than that of hired labor.
A number of arguments have been given in support of the second proposition.One line of argument is that labor - at least female and child labor - isnot fully mobile due to various forms of social impediments. A second viewforwarded by Mazumdar /2 and Marbo /3, is that family employment is certainwhile wage employment is uncertain. The probability of finding a joboutside family farm is less than one and, as such, a family worker would wantto be compensated for the search cost incurred in obtaining a nonfamilyemployment. A closely related argument is that in inflationary economieswages tend to lag behind price increase while in family farm an increase inoutput price is transformed into an increase in nominal income as well inthe same period. A third argument is that it may be impossible for thefamily to send income supplement to the worker transferred. Fourth, theremight be a preference for work on the family farm as work in someone else'sfarm (for prestige reasons). A more powerful argument is based on the
/1 A. K. Sen, "Peasants and Dualism With or Without Surplus Labor,"Journal of Political Economy, Vol. 74, 1966.
/1 D. Mazumdar, "Size of Farms and Productivity: A problem of IndianPeasant Agriculture," Economica, Vol. 32, May 1965.
/2 Robert Marbo, "Employment and Wages in Dual Agriculture," OxfordEconomic Papers, No. 3, November 1971.
- 32 -
seasonal pattern of agricultural prodSction and employment. Marbo,/1pointed out that due to seasonality there may be certain indivisibility inthe demand for labor. During slack seasons employers would typically beinterested in very short contract on a day-to-day or even hourly basis,while in busy seasons due to relative scarcity of labor supply and urgencyof work employers would want to enter into longer contracts. There is noadjustment problem for landless laborers, but for family farm workerscontractual arrangements during the peak period may not be acceptablebecause the arrangements may be in conflict with their own family farminterests. This argument, therefore, provides a logic for prevalence of agap between supply prices of family and hired workers even in peak periods.
63. Critique of Dualism Assumption. The assumption that family farmand capitalist farm are dichotomous has been challenged recently byRosenzweig./2 Citing evidence from Indian agriculture, he has argued thatthis assumption is unnecessarily restrictive and counterfactual. Once thepossibility that capitalist farmers may also use family labor and familyfarms may hire labor from outside (permanent or temporary) is allowed, thedichotomy as well as surplus labor assumptions fall apart. As Lal /3 haspointed out "if a family hires a permanent worker or at least one casuallaborer on all or most family farm operations, then there cannot be surpluslabor in such farms even in the slack seasons."
Characteristics of Labor Markets in Thailand
64. The above discussion implies that the model underlying thedetermination of wage rates in actual labor markets should be based on thecharacteristics of the labor market being analyzed. The functioning oflabor markets in Thailand has been extensively discussed, based on existingcensus and survey data, by a number of authors./4 The main findings areas follows:
/1 Marbo, op cit.
/2 M.R. Rosenzweig, "Rural Wages, Labor Supply and Land Reform" inAmerican Economic Review, Vol. 68, No. 5, December 1978
/3 D. Lal, "Supply Price of Surplus Labor: Some Indian Evidence," inWorld Development, Vol. 4, No. 10/11, 1976, p.894.
/4 See Trent Bertrand, op, cit.; Lyn Squire and Trent Bertrand, "TheRelevance of the Dual Economy Model: A Case Study of Thailand,"Oxford Economic Paper, Vol. 32, No. 3, November 1980; EmploymentAspects of Thailand Development, World Bank, Working Paper No. 3,East Asia and Pacific Programs Department, Nov. 1978, Rural Non-FarmEmployment Study; World Bank, Research Report in Progress, 1981; FredArnold and Susan Cochrane, Economic Motivation versus City Lights:Testing Hypotheses About Inter-Changwat Migration in Thailand, WorldBank Staff Working Paper No. 6, Sept. 1980.
_ 33 -
65. Characteristics of Rural Labor Market:
(a) There is no evidence of significant open unemployment in ruralThailand. Unemployment for all regions of the country and forboth the wet and dry seasons has been typically well below onepercent of the labor force.
(b) There is a significant change in utilization patterns between thepeak and slack agricultural seasons. This variation is mostpronounced in the Northeast.
(c) The labor force expands in response to heavy demands for laborin on-farm activities during the rainy season by drawing onfemales and children who in the great majority of cases arenot engaged in dry season off-farm employment by choice.
(d) In the dry season, the labor force contracts with a large declinein the participation by females and children, a shift to off-farmemployment by members of farm families, and a substantialreduction in work hours.
(e) Labor utilization is characterized by considerable off-farm andnonagricultural employment that account for large part of moneyincome and significant shares of total income.
(f) Available data on the movement of real wages in the rural areasindicate that real wages are responsive to forces of demand andsupply.
66. Characteristics of Labor Markets in Urban Areas
(a) Wage rates have in general remained subject to forces of supplyand demand.
(b) Urban labor markets have expanded rapidly and have beencharacterized by low unemployment rates.
(c) The very active informal sector in Bangkok provides employmentat terms competitive with the wage-sector and cannot be charact-erized as a residual labor market providing low income employmentto those unable to enter the wage labor market.
67. Rural-Urban Labor Mobility
(a) Regional and sectoral wage differentials of unskilled workersare not very great and certainly not as large as those in manydeveloping countries.
_34 -
(b) The available evidence on migration flows indicates that the Thairural population is relatively stable and that the rate ofurbanization is relatively low.
(c) There is, however, significant mobility of labor within ruraland urban areas.
(d) Migration has taken place mainly in response to economic factors.For example, there is empirical support for the followinghypotheses: the higher the per capita income, the lower theunemployment; the lower the proportion of land farmed in thedestination relative to the origin, the greater the flow ofmigration between areas holding population size and distanceconstant.
(e) Male and female migration streams seem to respond to per capitaincome and unemployment in the same way. Males, however, aremore responsive than female to the scarcity or availability offarmland.
(f) Participation rates of Bangkok migrant workers have beengenerally very high and there is some evidence that the jobsearch procedure has not been very difficult.
68. Government Intervention in the Labor Market: Role of MinimumWages
(a) Minimum wages legislated for rural sector are largely ineffectivein the private labor markets either because in some cases theyare below market wages or because in some other cases they arenot enforced.
(b) In the past minimum wages have been effective only in narrowsegments of the urban labor market - mainly large scale manu-facturing, and for short duration of time.
(c) Minimum wages are certainly ineffective for unskilled workersin general since a recent survey shows that for all categoriesof unskilled workers actual wages have exceeded minimum wages(Annex G, Table A.2).
69. All these characteristics indicate that dualistic labor marketmodels are irrelevant for describing the'Thai labor markets. Availableevidence indicates that in Thailand labor markets work quite effectivelywith significant labor mobility in response to wage incentives and wages in
- 35 -
turn respond to forces of demand and supply. The level of nonmarketintervention is very small and confined to small segments of the labormarket. It is, however, possible that the importance of governmentintervention may gain significance in the future. As of now the impact oftrade unions on the determination of wage rate is only marginal. But it ispossible that trade unions may gain more political influence in the future.Since these changes are difficult to predict, the conclusion at present isthat the wages are roughly equal to marginal products in most occupationsand in most regions of Thailand.
70. Implication for Efficiency Labor Conversion Factor. In generalthe market wage for most sectors can be regarded as good measure of themarginal product of labor./f In view of product market imperfections, we needto estimate an accounting ratio (8) to convert market wage rate intoefficiency units. Since, at the margin, labor can be withdrawn from anysector of the economy, the SCF may be used as a proxy for e. Thus, thelabor conversion factor (LCF) is given by the SCF, i.e., LCF - 0.92./2
71. The only exception is in the case of large-scale urban based manu-facturing industries. Depending upon the effectiveness of minimum wages inthese activities, project specific conversion factors for labor may need tobe estimated. If minimum wages are effective, the wages in these activitieswould overestimate the marginal product of labor and a separate estimate ofmarginal product of labor would be required. If labor is withdrawn fromsectors where minimum wages are not effective (as is likely to be the case),then that sector's wages can be used as a measure of labor's marginal product.
The Capital Market
72. As in the case of commodity and labor markets, it is useful to getsome insights on the functioning of the financial market in Thailand and thenature of government intervention in its operation.
/1 The wage rate in the rural areas may, of course, vary over the year dueto seasonality of agricultural production. Hence, for a projectproviding year-round employment to agricultural labor, the wage rateat any particular point in time should not be used as a measure oflabor's marginal product in agriculture or for other rural activitiesaffected by seasonality. A weighted average of monthly wage ratesshould be used in such cases.
/2 Choice of accounting ratio (e) for specific projects would depend onthe sector from which labor is withdrawn. If labor is actually withdrawnfrom rice production, then e should be set equal to RCF rather than SCF.This was assumed in Staff Working Paper No. 385 (page 12 above). If itis not possible to identify precisely the sector from which labor iswithdrawn, then e should be set equal to SCF.
_36 _
73. The structure of financial markets in Thailand evolved mostly inresponse to the need of the time and the opportunities to earn profit fromfinancial activities./1 There has been little conscious attempt by thegovernment to develop a financial structure geared directly to the objectiveof fostering economic development in the country.
74. The organized money market in Thailand, concentrating mostly inurban areas, is dominated by commercial banks. The role of foreign bankshas gradually decreased in importance, and at present locally ownedcommercial banks account for most of the financial asests and lendingoperations. The "Finance Companies", though relatively new, are second inline of importance in the organized financial market hierarchy. Othercategories of financial institutions are the life insurance companies,agricultural cooperatives, savings cooperatives, pawn shops and creditfoncier companies. Apart from these institutions, there are a number ofspecialized financial institutions: Government Savings Banks, the Bank forAgriculture and Agriculture Cooperatives, the Industrial Finance Corporationof Thailand, the Government Housing Bank, and the Small Industries FinanceOffice.
75. In the early sixties, the financial needs of the largest segment ofthe Thai economy, the rural sector, were predominately served by theunorganized money market; so called because such financial transactions donot go through legally registered financial institutions. For example, thesample survey of agricultural credit in Thailand for 1962-63 indicated that94.5% of total volumes of loans to farmers came from non-institutionalsources./2 Begining in the seventies the situation improved significantlydue to the government's efforts to channel institutional loans to agriculture.For example, in 1978, according to the Bank of Thailand, financial institu-tions provided about 67% of total farm credit./3 Non-institutional sources ofcredit now cater mainly to the needs of small borrowers who cannot takeadvantage of institutional credit due to collateral requirements.
/1 The discussion here is based on the following works: A.A. Rozenthal,Finance and Development in Thailand, published by Prager, New York,1970; "Financial Insitutes in Thailand" prepared by Money & FinanceSection, Department of Economic Research, Bank of Thailand, andpublished in BOT Quantity Bulletin Vol. 21, No. 1 March 1981 (pp. 13-58)
/2 Millard Long, et.al., Agricultural Credit in Thailand, Theory Dataand Policy, Kasetsart University, Bangkok, 1965, p. 35.
/3 Bangkok Bank Monthly Review, December 1979, p. 467.
- 37
76. So far as the distribution of credit is concerned, there is someevidence that in the past the financial markets, both organized and unorga-nized, tended to favor the traders over manufacturers. The bias was moreprominent for unorganized markets./l Information on the present situation,unfortunately, is not available. The government's special creditinstitutions, such as IFCT, have, however, sought to correct this imbalance.
77. Although the major financial institutions are owned and operated bythe private sector, there are significant imperfections in the creditmarket./2 Apart from distortions in the system introduced by governmentregulations, there is a major imperfection in the market itself. The bulk ofagricultural producers are smallholders with significant credit requirementsbut inadequate creditworthiness in the legal sense. Hence these producershave to depend on noninstitutional sources by paying a "high price" for their"creditworthiness". Since lack of creditworthiness is a private risk, ratherthan social risk, the payment of risk premium creates a divergence betweenprivate profitability and social profitability in agriculture. By loweringeffective private profit, investible resources are diverted away fromagriculture into other relatively less socially profitable activities,primarily trading.
Government Interventions in the Financial Markets
78. The Government has intervened in the operation of financial marketsin two ways:
(a) by enacting various rules of operations; and
(b) by directly participating in various market operations.
The rules of operations are enforced through the Central Bank - known as theBank of Thailand (BOT). The BOT is authorized to regulate the activities ofthe commercial banks through the following measures:
(a) adjust the amount of loan extended to commercial banks andvary its loan rate;
(b) vary the legal cash reserves requirement in relation to thevolume of deposits or the volume of borrowing;
(c) prescribe a liquidity ratio;
/1 See Rozenthal, op. cit.
/2 The financial markets in Thailand, however, are possibly morecompetitive than those in many developing countries.
- 38 -
(d) vary the ratio of capital risk assets;
(e) prescribe the ratios of capital to specified assets;
(f) set maximum interest rates on loans and various types ofdeposits;
(g) regulate the proportion of loans to any one borrower.
79. The activities of other financial companies may be regulated byuse of the following:
(a) the prescription of a liquidity ratio;
(b) the prescription of a capital to risk assets ratio;
(c) the fixing of minimum registered capital;
(d) the fixing of minimum amount for promissory note;
(e) the fixing of maximum amount of loans to any one person;
(f) the prescription of terms and conditions for hire purchasefinance;
(g) the imposition of selective credit control;
(h) the fixing of maximum interest rate on loans;
(i) the fixing of maximum interest rate on promissory notes.
80. It appears from this list of regulations that the government's aimin seeking to influence the operation of financial markets is to achieve thefollowing objectives;
(a) regulate the supply of money and credit;
(b) obtain a desired distribution of credit;
(c) reduce the cost of credit either in general or selectively orboth.
The main distortion is induced through the third objective. Even withoutgovernment intervention, there may be substantial difference between averagerate of interest charged by institutional sources and average rate ofinterest charged by non-institutional sources. When government intervenesby imposing a maximum ceiling on rates of interest that may be charged byregistered financial institutions, the normal result is an excess demand for
- 39 -
institutional credit which in turn implies credit rationing in some form oranother.
81. The other type of government intervention in Thailand is directoperation of government controlled financial institutions. These are special-ized institutions operating on a relatively limited scale. The government'smain objective is to provide incentives through access to cheap credit tocertain activities, such as manufacturing export industries and certainagricultural activities, on economic development ground. To the extent thatthere is divergence between social and private profitability in theseactivities and subsidized credit helps narrow the gap, such interventionsare corrective rather than distortive. In practice, however, the mainproblem is proper administration of this policy and the associated misuse ofthe facility.
Estimation of Marginal Productivity of Capital /
82. In "perfect" capital markets, with no government interventions,the market rate of interest would reflect the social time preference rateas well as the social marginal productivity of capital, provided there isperfect competition in all other markets and there are no externalities.In Thailand not only are capital markets not perfect, other conditionsrequired to equate the market rate of interest to the social marginal produc-tivity of capital are not likely to be satisfied, i.e. perfect knowledge ofevery individual's investment plans, knowledge about future demand patternand prices of all goods, to name only two conditions. Thus, the market rateof interest is only of limited value in judging the level of the marginalproductivity of capital.
83. Direct estimation of the marginal productivity of capital is notan easy task. There are numerous conceptual and empirical problemsassociated with this./2 In practice most of these issues are side-trackedand an estimate of SMP of capital is obtained by comparing estimates from anumber of alternative approaches./3 These alternatives are:
/1 See the excellent articles on this issue by M.S. Feldstein, "The SocialTime Preference Rate", Economic Journal, Vol. 74, 1964 and by J.Hirshleifer, "On the Theory of Optimal Investment Decision", Journalof Political Economy, Vol. 66, 1958.
/2 For a good flavor of the nature of conceptual difficulties see:G.C. Harcourt, Some Cambridge Controversies in the Theory of Capital,Cambridge, Cambridge University Press 1972.
/3 See Squire and van der Tak, op. cit.
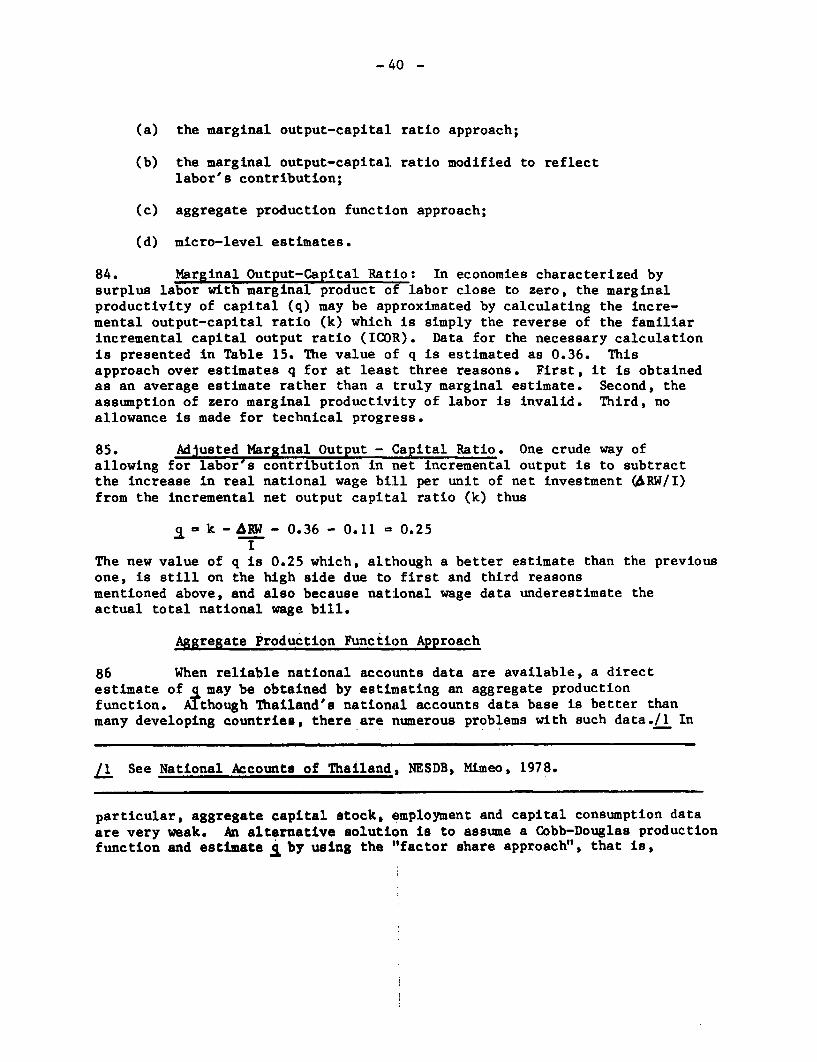
- 40 -
(a) the marginal output-capital ratio approach;
(b) the marginal output-capital ratio modified to reflectlabor's contribution;
(c) aggregate production function approach;
(d) micro-level estimates.
84. Marginal Output-Capital Ratio: In economies characterized bysurplus labor with marginal product of labor close to zero, the marginalproductivity of capital (q) may be approximated by calculating the incre-mental output-capital ratio (k) which is simply the reverse of the familiarincremental capital output ratio (ICOR). Data for the necessary calculationis presented in Table 15. The value of q is estimated as 0.36. Thisapproach over estimates q for at least three reasons. First, it is obtainedas an average estimate rather than a truly marginal estimate. Second, theassumption of zero marginal productivity of labor is invalid. Third, noallowance is made for technical progress.
85. Adjusted Marginal Output - Capital Ratio. One crude way ofallowing for labor's contribution in net incremental output is to subtractthe increase in real national wage bill per unit of net investment (6RW/I)from the incremental net output capital ratio (k) thus
- k - ARW - 0.36 - 0.11 = 0.25I
The new value of q is 0.25 which, although a better estimate than the previousone, is still on the high side due to first and third reasonsmentioned above, and also because national wage data underestimate theactual total national wage bill.
Aggregate Production Function Approach
86 When reliable national accounts data are available, a directestimate of j may be obtained by estimating an aggregate productionfunction. Although Thailand's national accounts data base is better thanmany developing countries, there are numerous problems with such data./l In
/1 See National Accounts of Thailand, NESDB, Mimeo, 1978.
particular, aggregate capital stock, employment and capital consumption dataare very weak. An alternative solution is to assume a Cobb-Douglas productionfunction and estimate g by using the "factor share approach", that is,
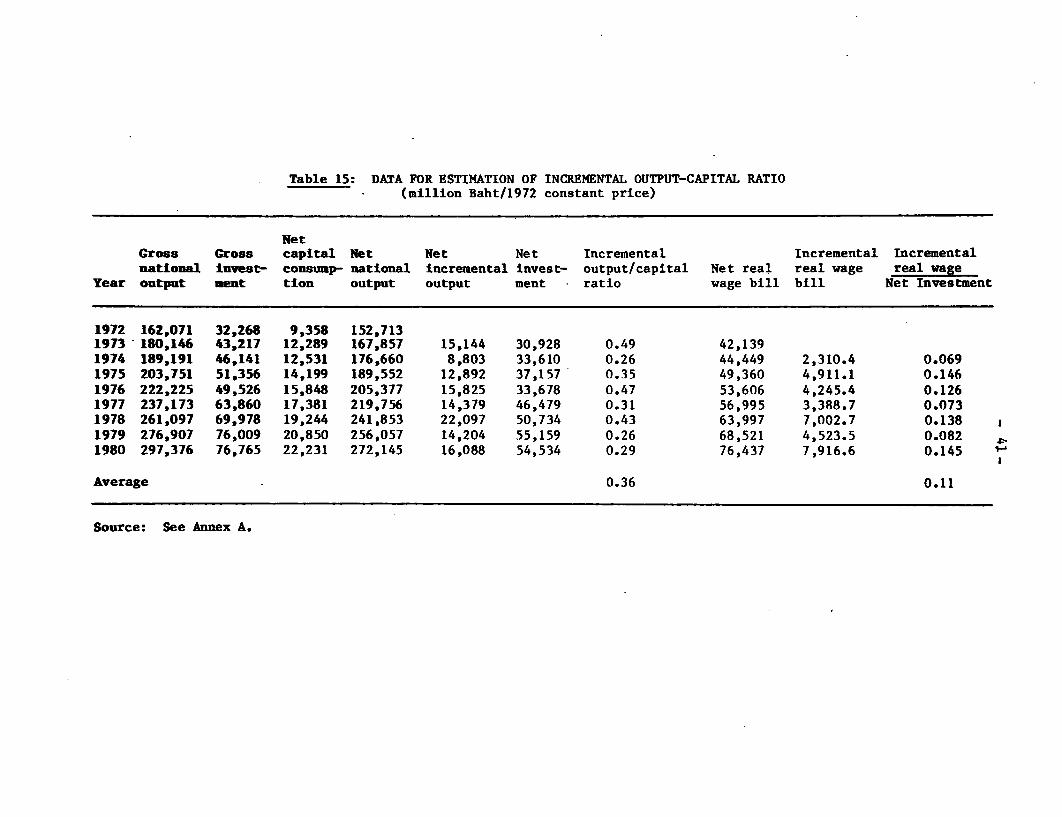
Table 15: DATA FOR ESTIMATION OF INCREMENTAL OUTPUT-CAPITAL RATIO(million Baht/1972 constant price)
NetCross Cross capital Net Net Net Incremental Incremental Incrementalnational invest- consump- national incremental invest- output/capital Net real real wage real wage
Year output ment tion output output ment ratio wage bill bill Net Investment
1972 162,071 32,268 9,358 152,7131973 180,146 43,217 12,289 167,857 15,144 30,928 0.49 42,1391974 189,191 46,141 12,531 176,660 8,803 33,610 0.26 44,449 2,310.4 0.0691975 203,751 51,356 14,199 189,552 12,892 37,157 0.35 49,360 4,911.1 0.1461976 222,225 49,526 15,848 205,377 15,825 33,678 0.47 53,606 4,245.4 0.1261977 237,173 63,860 17,381 219,756 14,379 46,479 0.31 56,995 3,388.7 0.0731978 261,097 69,978 19,244 241,853 22,097 50,734 0.43 63,997 7,002.7 0.1381979 276,907 76,009 20,850 256,057 14,204 55,159 0.26 68,521 4,523.5 0.0821980 297,376 76,765 22,231 272,145 16,088 54,534 0.29 76,437 7,916.6 0.145 t
Average 0.36 0.11
Source: See Annex A.
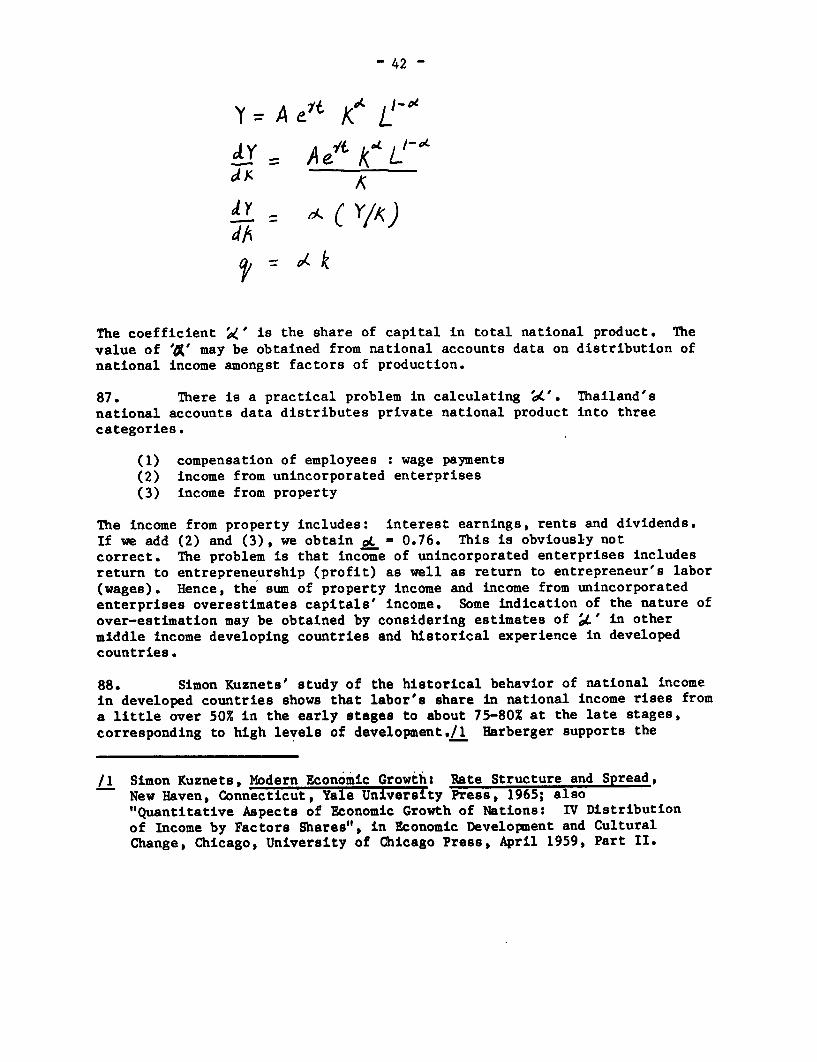
- 42 -
kY-A.> Aeh^L'-id.Y A tkL,dS -A
Ja, = g k
The coefficient '4' is the share of capital in total national product. Thevalue of 'J' may be obtained from national accounts data on distribution ofnational income amongst factors of production.
87. There is a practical problem in calculating 'o4'. Thailand'snational accounts data distributes private national product into threecategories.
(1) compensation of employees : wage payments(2) income from unincorporated enterprises(3) income from property
The income from property includes: interest earnings, rents and dividends.If we add (2) and (3), we obtain oL = 0.76. This is obviously notcorrect. The problem is that income of unincorporated enterprises includesreturn to entrepreneurship (profit) as well as return to entrepreneur's labor(wages). Hence, the sum of property income and income from unincorporatedenterprises overestimates capitals' income. Some indication of the nature ofover-estimation may be obtained by considering estimates of ;C' in othermiddle income developing countries and historical experience in developedcountries.
88. Simon Kuznets' study of the historical behavior of national incomein developed countries shows that labor's share in national income rises froma little over 50% in the early stages to about 75-80% at the late stages,corresponding to high levels of development./l Harberger supports the
/1 Simon Kuznets, Modern Economic Growth: Rate Structure and Spread,New Haven, Connecticut, Yale University Press, 1965; also"Quantitative Aspects of Economic Growth of Nations: IV Distributionof Income by Factors Shares", in Economic Development and CulturalChange, Chicago, University of Chicago Press, April 1959, Part II.
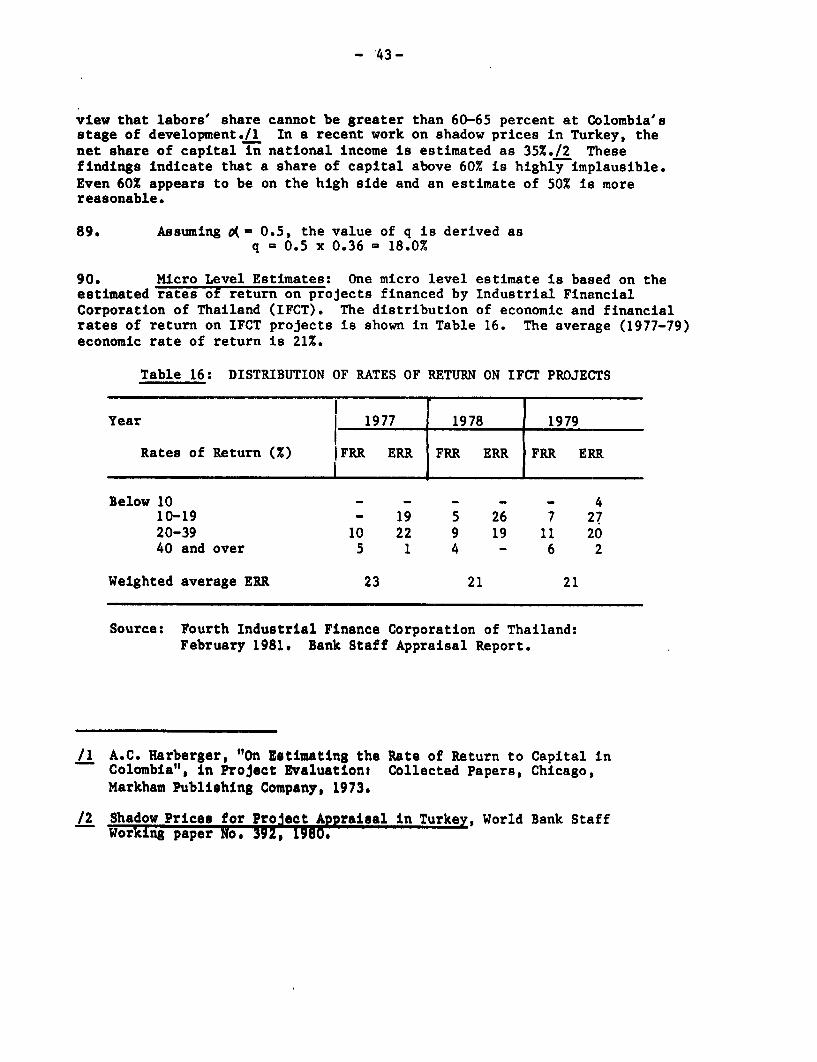
- 43-
view that labors' share cannot be greater than 60-65 percent at Colombia'sstage of development./1 In a recent work on shadow prices in Turkey, thenet share of capital in national income is estimated as 35%./2 Thesefindings indicate that a share of capital above 60% is highly implausible.Even 60% appears to be on the high side and an estimate of 50% is morereasonable.
89. Assuming d - 0.5, the value of q is derived asq - 0.5 x 0.36 - 18.0%
90. Micro Level Estimates: One micro level estimate is based on theestimated rates of return on projects financed by Industrial FinancialCorporation of Thailand (IFCT). The distribution of economic and financialrates of return on IFCT projects is shown in Table 16. The average (1977-79)economic rate of return is 21%.
Table 16: DISTRIBUTION OF RATES OF RETURN ON IFCT PROJECTS
Year 1977 j 1978 1979
Rates of Return (%) IFRR ERR FRR ERR FRR ERRI
Below 10 - - - - - 410-19 - 19 5 26 7 2720-39 10 22 9 19 11 2040 and over 5 1 4 - 6 2
Weighted average ERR 23 21 21
Source: Fourth Industrial Finance Corporation of Thailand:February 1981. Bank Staff Appraisal Report.
/1 A.C. Harberger, "On Estimating the Rate of Return to Capital inColombia", in Project Evaluation: Collected Papers, Chicago,Markham Publishing Company, 1973.
/2 Shadow Prices for Prolect APpraisal in Turkey, World Bank StaffWorkng paper No. 392, i9a0.
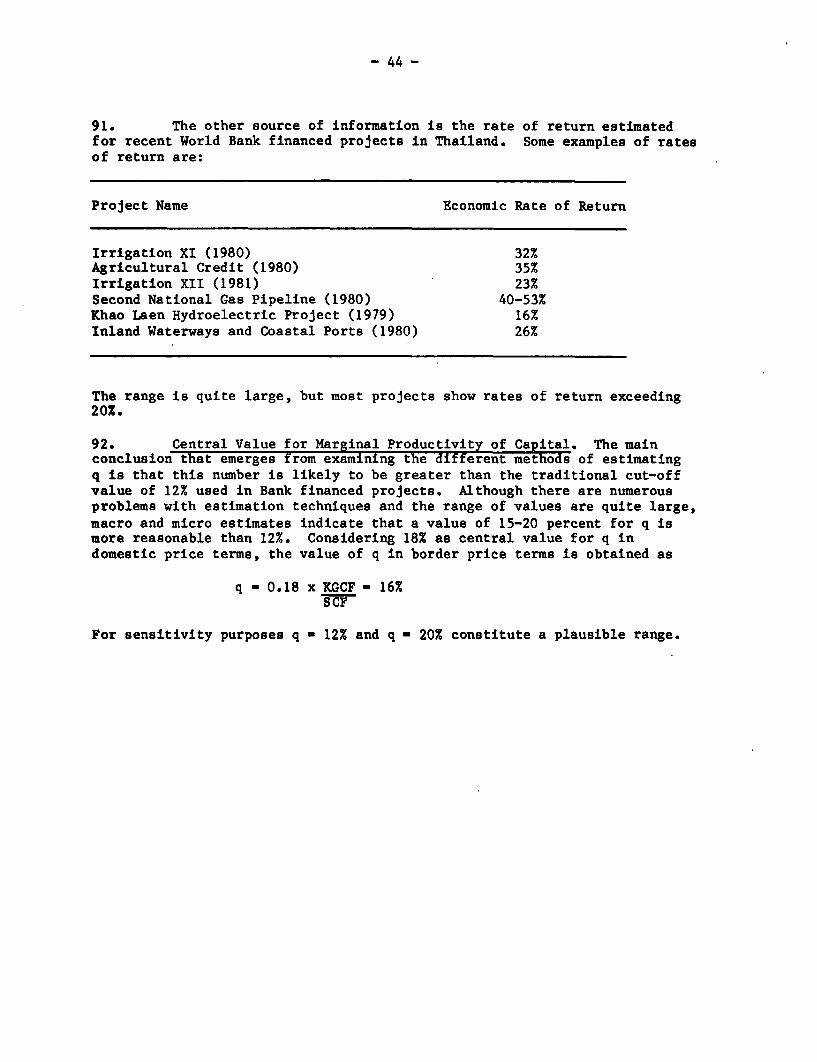
- 44 -
91. The other source of information is the rate of return estimatedfor recent World Bank financed projects in Thailand. Some examples of ratesof return are:
Project Name Economic Rate of Return
Irrigation XI (1980) 32%Agricultural Credit (1980) 35%Irrigation XII (1981) 23%Second National Gas Pipeline (1980) 40-53%Khao Laen Hydroelectric Project (1979) 16%Inland Waterways and Coastal Ports (1980) 26%
The range is quite large, but most projects show rates of return exceeding20%.
92. Central Value for Marginal Productivity of Capital. The mainconclusion that emerges from examining the different methods of estimatingq is that this number is likely to be greater than the traditional cut-offvalue of 12% used in Bank financed projects. Although there are numerousproblems with estimation techniques and the range of values are quite large,macro and micro estimates indicate that a value of 15-20 percent for q ismore reasonable than 12%. Considering 18% as central value for q indomestic price terms, the value of q in border price terms is obtained as
q - 0.18 x KGCF - 16%SCF
For sensitivity purposes q - 12% and q - 20% constitute a plausible range.
- 45 -
V. ESTIMATION OF CONVERSION FACTOR FOR RICE
93. In this chapter the conversion factor for rice will be estimated.There are three main reasons for giving special attention to this specificcommodity. First, rice is the single most important consumption item inthe country. Second, rice is also the single most important export good.Its share in total exports is about 15% (1976-1980 average). And thirdly,there is strong disagreement on the nature of world demand for Thai rice.One view is that Thailand faces a perfectly elastic world demand for rice.The other view is that the demand curve is less than perfectly elasticimplying that Thailand has some monopoly power in world rice trade. Thislatter characteristic has important implications for deriving aggregateconversion factors in general and conversion factors for rice in particular.Before we go into the estimation process, we present a brief discussion onthe different types of government intervention in rice trade.
94. Government Intervention in Rice Trade may be classified into sixcategories:
(a) Export Duty;(b) Rice Premium;(c) Rice Reserve Requirements;(d) Business and Municipal Tax;(e) Government to Government Sales of Rice; and(f) Quantitative Restrictions
The first four categories fall under "price interventions", while the lasttwo may be termed "non-price interventions".
Price Interventions /
95. Export Duty. The export duty was introduced in 1952. This is anad-valorem tax on rice export collected by the Customs Department and therevenue accrues to the government treasury. At present the tax rate is 5%of the export price.
96. Rice Premium. The use of "Rice Premium" is by far the mostcontroversial government policy in the history of the rice trade./l Until1974 this was the most important form of government intervention in riceexports. The term "premium", unlike its usual connotation, is a tax onrice and has an interesting history which dates back to the Second World
/1 See: Ammar Siamwalla, A Ristory of Rice Policies in Thailand, FoodResearch Institute Stu5Ies, L975.
- 46 -
War./1 The rice premium originated with the compulsory post-war deliveriesof rice to the UN as a war reparation contribution. The government set up theRice Bureau under the Ministry of Commerce to buy rice from millers andtraders to fulfill the treaty obligation. But, once established, the RiceBureau continued to exist even after the obligation was fulfilled.
97. The Rice Bureau monopolized the rice export trade. All rice to beexported had to be sold to the Rice Bureau which dictated the price to thedomestic sellers. The price was fixed below the export price and the monopolyprofit thus derived went to the government exchequer. The significantdivergence between world price and domestic price encouraged large scalesmuggling which forced the government to relax its control over rice exports.Private export of rice was permitted with proper licensing. As a "price" foraccess to export license the government introduced a rice premium in 1950.
98. In 1955 the Rice Bureau was abolished and most of rice export,except Government to Government sales, was left to the private traders. Therice premium was also significantly reorganized and since then, until 1974,the rice premium has been used as a major policy tool to regulate rice trade.
99. Initially, the primary objective of the rice premium was to raiserevenue for the government. Subsequently, the rice premium came to be used asa means of ensuring adequate domestic supply and to stablize rice prices. Asa result of the price stabilization objective, rice price became a function ofworld price of rice, increasing when world price is very high and decreasingwhen world price is very low. After the rice crisis of 1973, this objectivebecame the primary concern. Further, since 1975 the premium revenue accruesto the Farmers' Aid Fund rather than to the government treasury.
100. The rice premium, unlike the export tax, is not a uniform tax. Therate varies according to the quality of rice. The present and historicalstructure of rice premium is shown in Annex G, Table A.1.
101. Rice Reserve Requirement. The rice reserve requirement policy datesback to 1962, but it gained prominence after 1973. Since then, this hasreplaced rice premium as the major government policy tool in the rice exportmarket.
/1 See: (a) T. H. Silcock, The Economic Development of Thai Agriculture,Cornell University Press, 1970;
(b) S. C. Yang, A Multiple Exchange Rate System: An Appraisalof Thailands' Mperience 1Y4b-55, university or WisconsinPress, 1957;
(c) A. Lew Chalermwong, Taxation and Tax Reforms in Thailand,Krushapa Ladprao Press, Bangkok, 1972.
-47 -
102. Unlike the export tax or the rice premium, the rice reserverequirement is not a tax yielding revenue to the government, but a commoditylevy, since all rice exporters receiving export licenses must surrender to thePublic Warehouse Organization (PWO) an amount of rice in proportion to theirexport order./l The Ministry of commerce decides the quality of rice and theprice to be paid for this compulsory surrender. The price is always fixedbelow the actual export price resulting in a tax on the rice exporter - theimplicit tax amount and rate depending on the divergence between export priceand the price paid by PWO. The government does not get any direct tax revenuebecause rice collected by the PWO is sold to the consumers at a price close tothe purchase price through the "cheap rice" program designed to reach poorurban consumers.
103. Business and Municipal Taxes. Like other business activities,rice trade, whether internal or for export, is also subject to a businessand a municipal tax. This tax is paid by the rice millers.
Nonprice Interventions
104. Government-to-Government Sales. Even though the Rice Bureau wasabolished long ago, a significant part of rice exports is channeled throughthe government. This is in the form of contractual sales between the Thaigovernment and other foreign governments. The G-to-G sales, as this isknown, has in the recent years accounted for 27 to 45 percent of total riceexport. The mechanism works as follows. The Ministry of Commerce announcesto the private traders the type and quantity of rice it wants to buy andalso the price it is willing to pay. Unlike reserve requirement, thistransaction between government and private traders is voluntary.
105. Licensing and Quota Policies. All potential private rice exportersare required to obtain an export license. Further, they are also requiredto obtain an export permit for each shipping period. Through this policy thegovernment seeks to regulate the distribution of total rice productionamongst exports and domestic consumption. When the domestic market situationis tight, the conditions for issuing export permit are also tightened. Incrisis situations the government has also issued export quotas to limitexports and ensure adequate domestic supply.
Estimation of Conversion Factor for Rice
106. Tax Equivalence of Government Interventions. The nominal exportduty on rice is 5X of value, but the effective average tax rate, obtainedas the ratio of tax revenue collected and value of exports over a five-yearperiod, is 4.62X (Table 17). The five-year average tax rate on rice exportdue to the rice premium comes to about 9.0%. Data on the amount of business
L As in August 1980, this was one half ton for every ton exported.
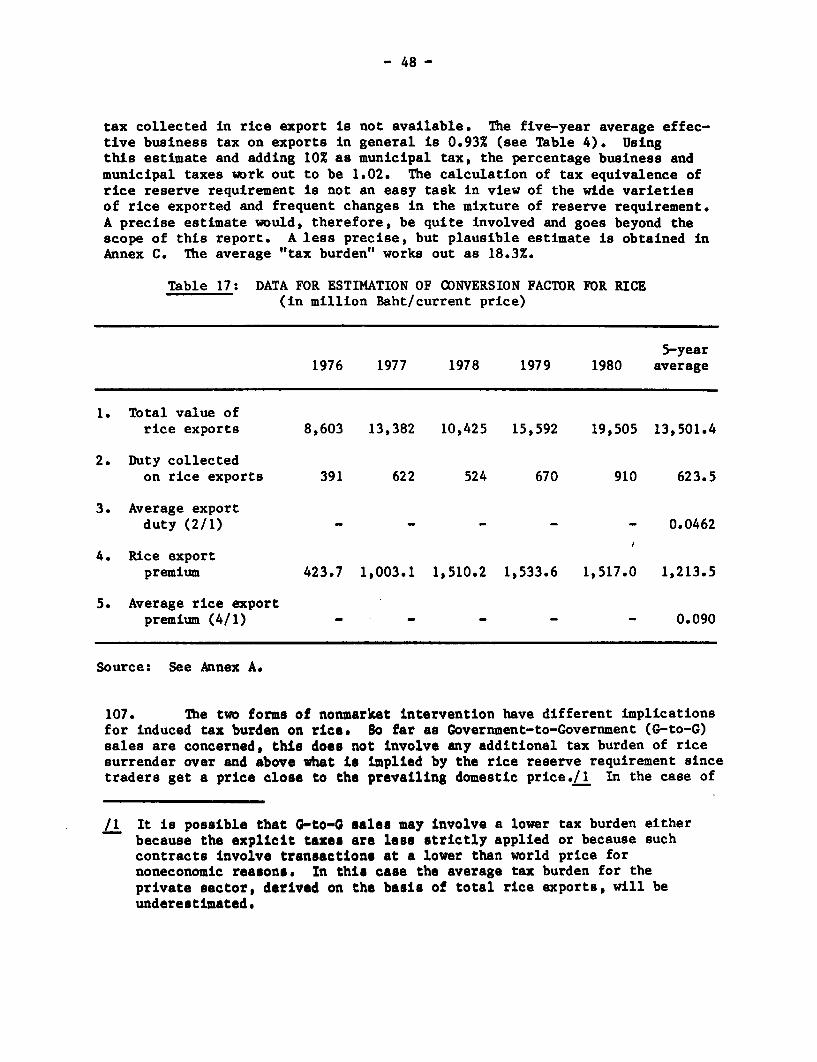
- 48 -
tax collected in rice export is not available. The five-year average effec-tive business tax on exports in general is 0.93% (see Table 4). Usingthis estimate and adding 10% as municipal tax, the percentage business andmunicipal taxes work out to be 1.02. The calculation of tax equivalence ofrice reserve requirement is not an easy task in view of the wide varietiesof rice exported and frequent changes in the mixture of reserve requirement.A precise estimate would, therefore, be quite involved and goes beyond thescope of this report. A less precise, but plausible estimate is obtained inAnnex C. The average "tax burden" works out as 18.3%.
Table 17: DATA FOR ESTIMATION OF CONVERSION FACTOR FOR RICE(in million Baht/current price)
5-year1976 1977 1978 1979 1980 average
1. Total value ofrice exports 8,603 13,382 10,425 15,592 19,505 13,501.4
2. Duty collectedon rice exports 391 622 524 670 910 623.5
3. Average exportduty (2/1) - - - - - 0.0462
4. Rice exportpremium 423.7 1,003.1 1,510.2 1,533.6 1,517.0 1,213.5
5. Average rice exportpremium (4/1) - - - - - 0.090
Source: See Annex A.
107. The two forms of nonmarket intervention have different implicationsfor induced tax burden on rice. So far as Government-to-Government (G-to-G)sales are concerned, this does not involve any additional tax burden of ricesurrender over and above what is implied by the rice reserve requirement sincetraders get a price close to the prevailing domestic price./l In the case of
/1 It is possible that G-to-G sales may involve a lower tax burden eitherbecause the explicit taxes are less strictly applied or because suchcontracts involve transactions at a lower than world price fornoneconomic reasons. In this case the average tax burden for theprivate sector, derived on the basis of total rice exports, will beunderestimated.
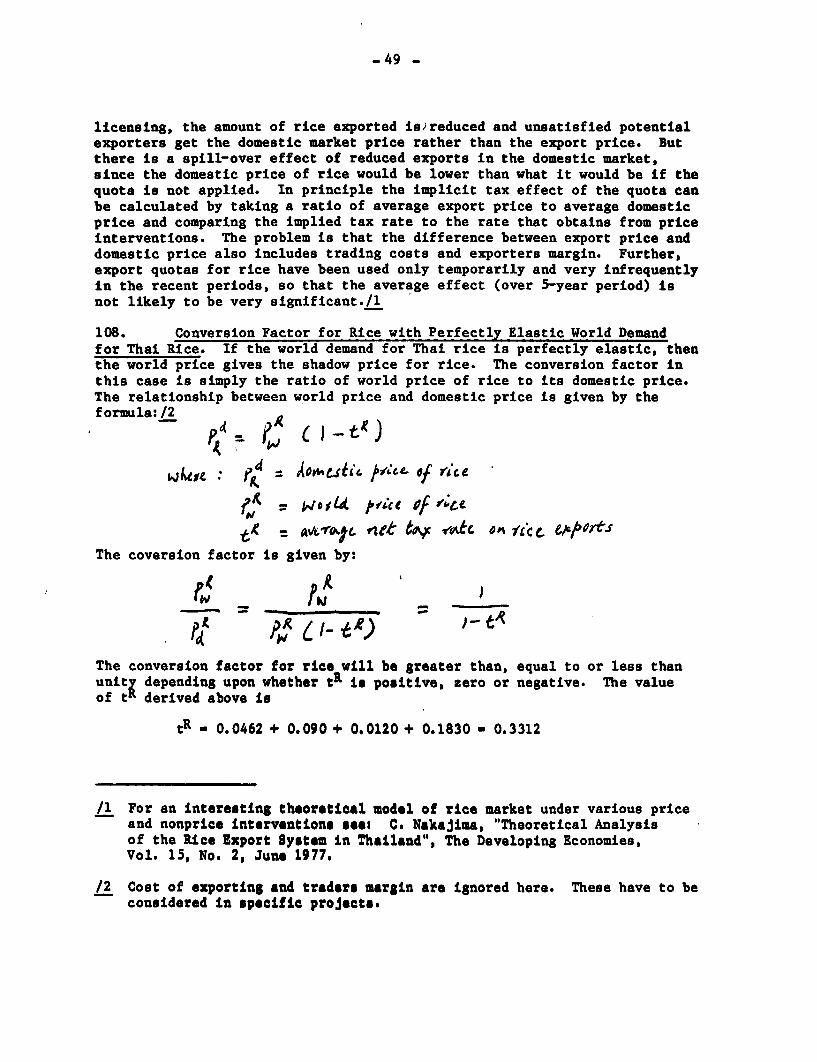
-49 -
licensing, the amount of rice exported is)reduced and unsatisfied potentialexporters get the domestic market price rather than the export price. Butthere is a spill-over effect of reduced exports in the domestic market,since the domestic price of rice would be lower than what it would be if thequota is not applied. In principle the implicit tax effect of the quota canbe calculated by taking a ratio of average export price to average domesticprice and comparing the implied tax rate to the rate that obtains from priceinterventions. The problem is that the difference between export price anddomestic price also includes trading costs and exporters margin. Further,export quotas for rice have been used only temporarily and very infrequentlyin the recent periods, so that the average effect (over 5-year period) isnot likely to be very significant./l
108. Conversion Factor for Rice with Perfectly Elastic World Demandfor Thai Rice. If the world demand for Thai rice is perfectly elastic, thenthe world price gives the shadow price for rice. The conversion factor inthis case is simply the ratio of world price of rice to its domestic price.The relationship between world price and domestic price is given by theformula: /2
Pjkbut 4: AOt,o C4ost fr4U.. of rs*ce
kW.d pti(e Of r'49mo- Av C t to\ ,de 'Op fcrCcc C#G/otXS
The coversion factor is given by:
pd iXt -- e 2-
The conversion factor for rice will be greater than, equal to or less thanuniti depending upon whether tR is positive, zero or negative. The valueof t derived above is
tR _ 0.0462 + 0.090 + 0.0120 + 0.1830 - 0.3312
/1 For an interesting theoretical model of rice market under various priceand nonprice Interventions seet C. Nakajima, "Theoretical Analysisof the Rice Export System in Thailand", The Developing Economies,Vol. 15, No. 2, June 1977.
/2 Cost of exporting and traders margin are ignored here. These have to beconsidered in specific projects.
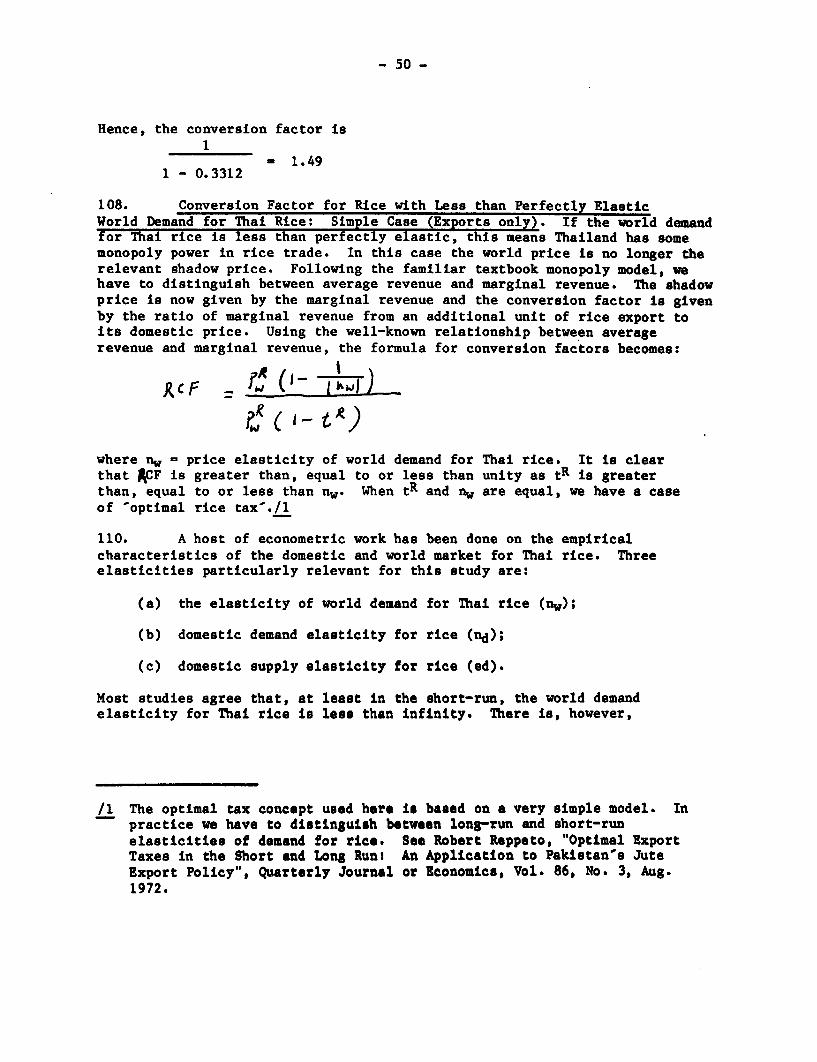
- 50 _
Hence, the conversion factor is1
- 1.491 - 0.3312
108. Conversion Factor for Rice with Less than Perfectly ElasticWorld Demand for Thai Rice: Simple Case (Exports only). If the world demandfor Thai rice is less than perfectly elastic, this means Thailand has somemonopoly power in rice trade. In this case the world price is no longer therelevant shadow price. Following the familiar textbook monopoly model, wehave to distinguish between average revenue and marginal revenue. The shadowprice is now given by the marginal revenue and the conversion factor is givenby the ratio of marginal revenue from an additional unit of rice export toits domestic price. Using the well-known relationship between averagerevenue and marginal revenue, the formula for conversion factors becomes:
R'F = it (' r^sl)?g ( I-_t R)
where nw price elasticity of world demand for Thai rice. It is clearthat R F is greater than, equal to or less than unity as tR is greaterthan, equal to or less than nw. When tR and nw are equal, we have a caseof 'optimal rice tax'./l
110. A host of econometric work has been done on the empiricalcharacteristics of the domestic and world market for Thai rice. Threeelasticities particularly relevant for this study are:
(a) the elasticity of world demand for Thai rice (nw);
(b) domestic demand elasticity for rice (nd);
(c) domestic supply elasticity for rice (ed).
Most studies agree that, at least in the short-run, the world demandelasticity for Thai rice is less than infinity. There is, however,
/1 The optimal tax concept used here is based on a very simple model. Inpractice we have to distinguish between long-run and short-runelasticities of demand for rice. See Robert Reppeto, "Optimal ExportTaxes in the Short and Long Runt An Application to Pakistan's JuteExport Policy", Quarterly Journal or Economics, Vol. 86, No. 3, Aug.1972.
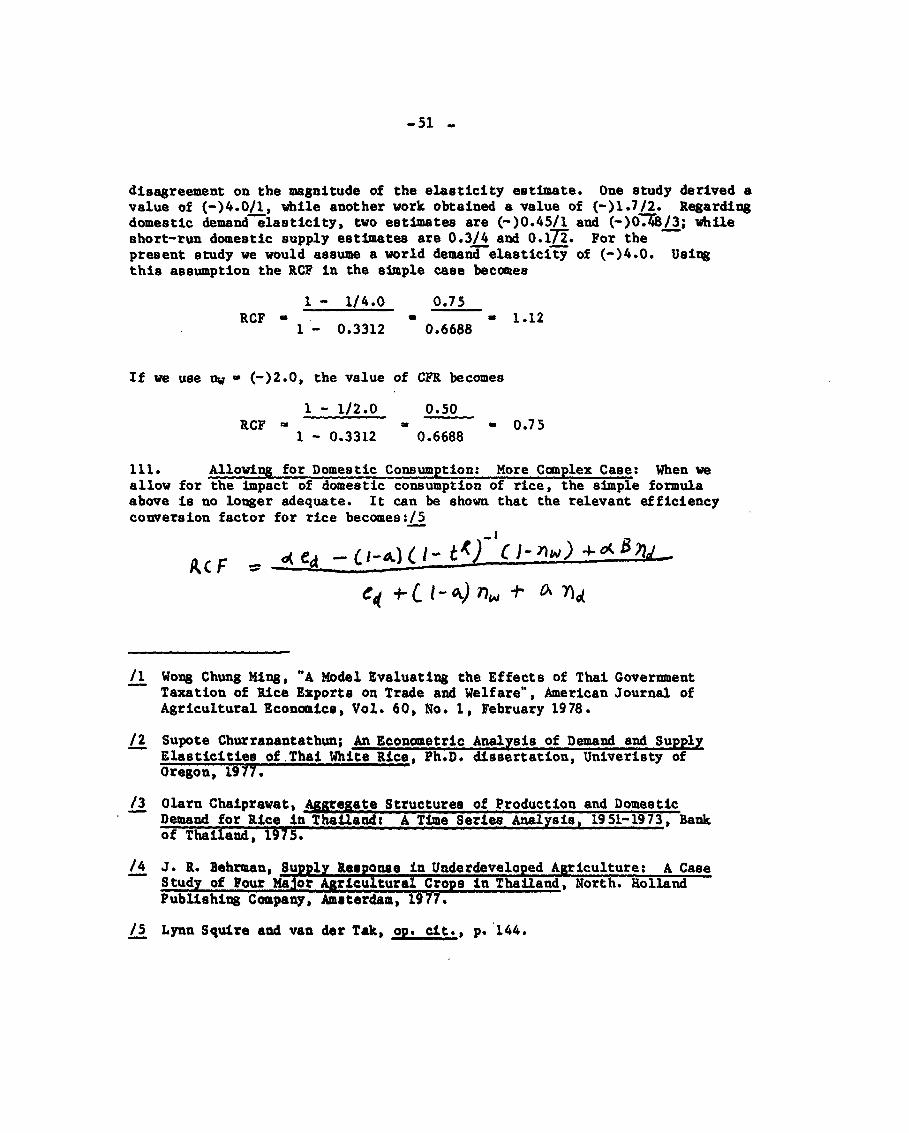
-51 -
disagreement on the magnitude of the elasticity estimate. One study derived avalue of (-)4.0/1, while another work obtained a value of (-)1.7/2. Regardingdomestic demand elasticity, two estimates are (-)0.45/1 and (-)OUI8/3; whileshort-run domestic supply estimates are 0.3/4 and 0.17-2. For thepresent study we would assume a world demazndelastieity of (-)4.0. Usingthis assumption the RCF in the simple case becomes
1 - 1/4.0 0.75RCF - - - 1.12
1 - 0.3312 0.6688
If we use nw - (-)2.0, the value of CFR becomes
1 - 1/2.0 0.50RCF - 0 - 0.75
1 - 0.3312 0.6688
111. Allowing for Domestic Consumption: More Complex Case: When weallow for the Impact of domestic consumption of rice, the simple formulaabove is no longer adequate. It can be shown that the relevant efficiencyconversion factor for rice becomes:/5
AcF =0e 4 -a -
/1 Wong Chung Ming, "A Model Evaluating the Effects of Thai GovernmentTaxation of Rice Exports on Trade and Welfare", American Journal ofAgricultural Economics, Vol. 60, No. 1, February 1978.
/2 Supote Churranantathun; An Econometric Analysis of Demand and SupplyElasticities of Thai White Rice, Ph.D. dissertation, Univeriety ofOregon, 1977.
/3 Olarn Chaiprawat, AgRreaate Structures of Production and DomesticDemand for Rice in Thailead: A Time Series Analysis, 1951-1973, Bankof Thailand,, 1975.
/4 J. R. Behrman, Supply Response in Underdeveloped Agriculture: A CaseStudy of Four Major Agricultural Crops In Thailand, North. HollandPublishing Company, Amsterdam, 1977.
/5 Lynn Squire and van der Tak, op. cit., p. 144.
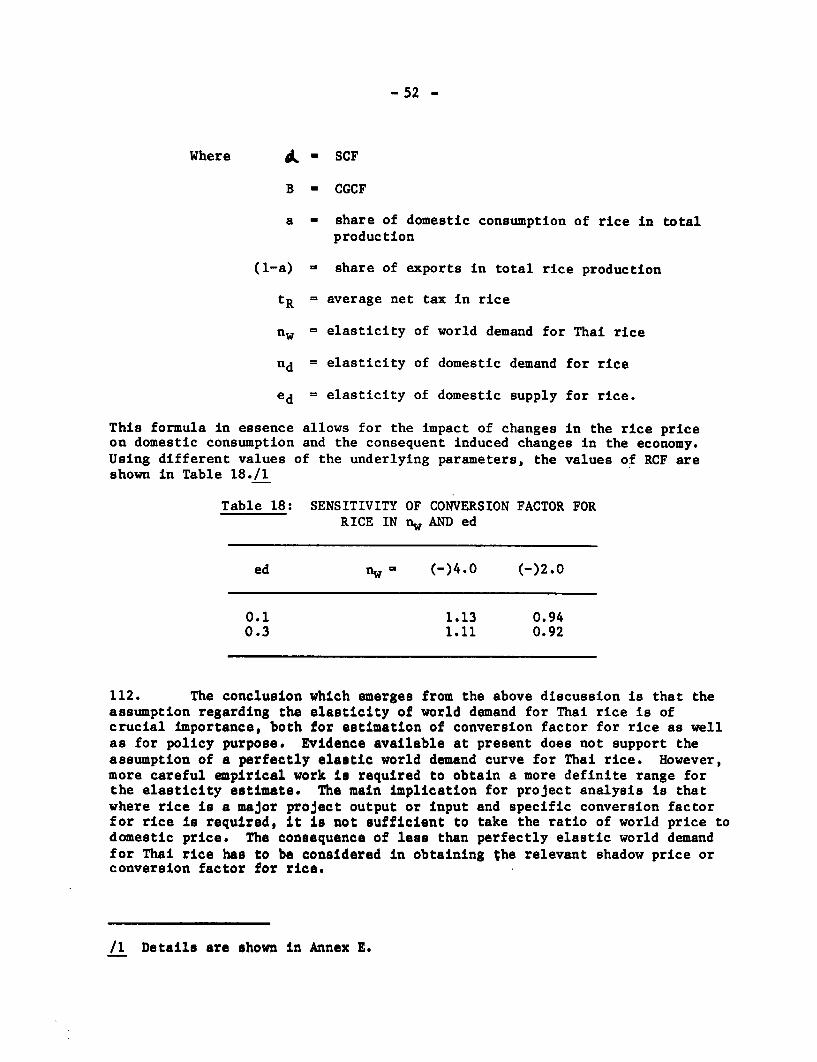
- 52 -
Where - SCF
B - CGCF
a - share of domestic consumption of rice in totalproduction
(1-a) share of exports in total rice production
tR - average net tax in rice
nw = elasticity of world demand for Thai rice
nd = elasticity of domestic demand for rice
ed = elasticity of domestic supply for rice.
This formula in essence allows for the impact of changes in the rice priceon domestic consumption and the consequent induced changes in the economy.Using different values of the underlying parameters, the values of RCF areshown in Table 18./I
Table 18: SENSITIVITY OF CONVERSION FACTOR FORRICE IN nw AND ed
ed nw (-)4.0 (-)2.0
0.1 1.13 0.940.3 1.11 0.92
112. The conclusion which emerges from the above discussion is that theassumption regarding the elasticity of world demand for Thai rice is ofcrucial importance, both for estimation of conversion factor for rice as wellas for policy purpose. Evidence available at present does not support theassumption of a perfectly elastic world demand curve for Thai rice. However,more careful empirical work is required to obtain a more definite range forthe elasticity estimate. The main implication for project analysis is thatwhere rice is a major project output or input and specific conversion factorfor rice is required, it is not sufficient to take the ratio of world price todomestic price. The consequence of less than perfectly elastic world demandfor Thai rice has to be considered in obtaining the relevant shadow price orconversion factor for rice.
/1 Details are shown in Annex E.
ANNEX APage 1
ESTIMATION OF SOCIAL PARAMETERS
1. Introduction. Apart from the growth objective, another justifica-tion for government intervention in the economy is that income distributionobtaining in a free market economy is considered socially undesirable andthe government is expected to improve the income distribution throughvarious measures. Economists, however, recognize that in practice there maybe a trade-off between growth and income distribution objectives. Thegovernment may, therefore, need to balance one against the other.
2. A number of instruments are available to the government to pursuethe income distribution objective. One suggested approach is to use projectsas a possible mechanism for income redistribution. The idea is that if, dueto political and administrative constraints, it is not possible to use fiscalor other policy instruments to achieve the desired income distributiondirectly, it may be possible to attain this objective by building incomedistribution considerations in the project design or selection process. Thismay be achieved by identifying the various beneficiaries and putting different"weights" on benefits accruing to different beneficiaries in deriving themeasure of total "social profitability." The derivation of income distribu-tion weights for a particular group, in turn, involves estimation of a numberof national level parameters which are called "social parameters" in the S-Tapproach because they relate to both income distribution and growthobjectives, as distinguished from the efficiency parameters which relate toonly the growth objective. These parameters would be estimated in this Annex.
3. Thai Government Policy Towards Income Distribution and Growth.Historically, the Thai goverment's basic attitude has been to create an atmos-phere favorable for the growth of economic activity in the private sector.The government has considered its main role as providing infrastructurefacilities for promotion of private economic activities. Conscious attemptsto promote either growth or equity or both, are very recent phenomena. Eventhe First Plan (1961-67) was launched at the urging of the World Bank andother international financial institutions. The Plan's basic objective wasto encourage a diversification of economic activities from agriculturetowards industry. It sought to achieve this objective through heavyinvestment in infrastructure as well as through development of serviceindustries and mining activities. The Second Five-Year Plan was acontinuation of the task set in the First Plan. In both these Plans therewas very little concern for the promotion of equity.
4. Income distribution as a social objective was first recognized inthe Third Plan, and it gained prominence in the Fourth and Fifth Plans.The Fifth Plan (1982-86), in particular, has expressed a very serious concernfor improving income distribution in the country. Two of the five majorobjectives of the Fifth Plan ares L
/1 Outline of the Fifth National Economic and Social Development Plan(1982-86), NESDB, January 1981, pp. 4-5.
ANNEX APage 2
(a) "to reduce absolute poverty and accelerate rural developmentin backward areas;" and
(b) "to adjust social structure in order to make it more stable anddisciplined, fair and safe, as well as to provide more educa-tional and employment opportunities for the poor."
5. The goveriment's present policy, therefore, is to balance the needfor high economic growth with the social need for a more equitable distri-bution of income. In view of the fact that Thailand is presently goingthrough a process of structural change in the economy, the government willneed to concentrate its attention on this task which implies that the govern-ment may not be able to pursue its equity objective with as much enthusiasmas the stated objectives indicate. Hence, in choosing subjective parametersrelating to equity and growth objectives, the Thai Government's attitudetowards income distribution may be considered as "moderate" compared to"radical" and "no concern" positions.
6. The above view is also supported by actual government policiespursued so far to improve income distribution. The interest in improvingincome distribution is reflected by a number of programs undertaken by thegovernment. These include:
(a) legislation of minimum wages;
(b) providing subsidized rice to consumers;
(c) increasing the tax exempt income level and a mildly pro-gressive income tax rate;
(d) the desire to reduce the impact of agricultural taxation on in-centives through various special programs such as Farmer's AidFunds, price supports to farmers and greater access to cheapcredit;
(e) creation of special programs to aid poverty pockets; and
(f) developing regional cities to reduce concentration of income andeconomic activities in Bangkok.
At the same time, a critical examination of these programs shows that someof these measures are not very effective in improving income distribution.There is no attempt to change the asset distribution in the country, neitheris there a major effort to reduce the concentration of wealth and incomethrough large increases in wealth and property taxes and a highly progressiveincome tax structure, both enforced strictly.
ANNEX A55 - PasPe 3
Value Judgements: The Consumption Rate of Interest (CRI), Pure TimePreference Rate (P) and the Elasticity of Social Marginal Utility of Income() v
7. The CRI is defined as the rate of discount to be used in deriv-ing the present value of future consumption. In the S-T formulation theCRI is given by
CRI- i ng + P {S-T page 691
Where P - rate of pure time preference;
n - elasticity of social marginal utility of income;
g - rate of growth of per capita consumption.
Estimation of CRI, therefore, involves estimation of two value Judgements(P, n) and an objective parameter (g). The value of g can be obtained fromnational accounts data (see Annex F Table Al). The trend growth rate of percapita real consumption over an 11 year period, 1970-1980, is 4.25%. Thevalue of P depends on society's preference between present consumption andfuture consumption due to difference only in timing of'consumption. In ademocratic society individuals' time preference may be used to obtain someguidance on the possible range for P./1 For an individual P will certainlybe greater than zero because of future uncertainty. There is also someevidence that a Thai may have a relatively high preference for present overfuture consumption. One such evidence is the observed "low levels ofownership of insurance and financial assets and relatively high levels ofownership of consumer goods in comparison with other Asians./l But, someallowance should also be made in respect of the government's desire to havea reasonable rate of growth as well as its responsibility towards futuregenerations which are not being represented now. Based on these considera-tions, the S-T approach suggests use of a low value for P between 0 to 5%.In this work a value of 3% is selected, and for sensitivity purpose a rangeof 2-4% is used.
/1 The idea of society having a ,pure time preference other than zerohas been hotly debated in the literature. Critics argue that indivi-dual time preference due to future uncertainties cannot serve as abasis for society's time preference because such uncertainties reflectmostly private rather than social risks. Supporters argue that in ademocratic society the government should reflect to some extent theindividual's preference. For an excellent discussion see S. Chakravarty,Capital and Development Planning, MIT Press, Cambridge, Mass. 1969.
/2 Anderson, op cit., p. 138.
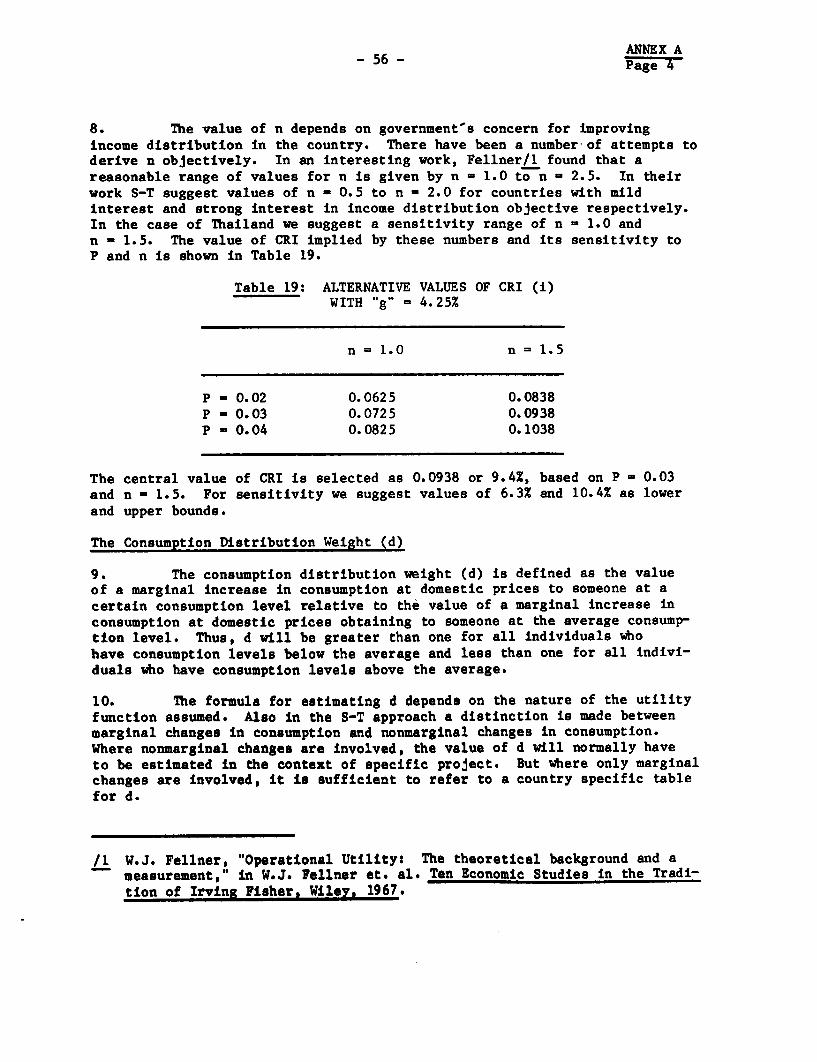
- 56 - ANNEX A- 56 - ~~~~~Page 4
8. The value of n depends on government's concern for improving
income distribution in the country. There have been a number of attempts toderive n objectively. In an interesting work, Fellner/l found that areasonable range of values for n is given by n - 1.0 to n - 2.5. In theirwork S-T suggest values of n - 0.5 to n - 2.0 for countries with mildinterest and strong interest in income distribution objective respectively.In the case of Thailand we suggest a sensitivity range of n - 1.0 and
n - 1.5. The value of CRI implied by these numbers and its sensitivity toP and n is shown in Table 19.
Table 19: ALTERNATIVE VALUES OF CRI (i)WITH "g" = 4.25%
n = 1.0 n = 1.5
P - 0.02 0.0625 0.0838P - 0.03 0.0725 0.0938P - 0.04 0.0825 0.1038
The central value of CRI is selected as 0.0938 or 9.4%, based on P - 0.03
and n - 1.5. For sensitivity we suggest values of 6.3% and 10.4% as lowerand upper bounds.
The Consumption Distribution Weight (d)
9. The consumption distribution weight (d) is defined as the valueof a marginal increase in consumption at domestic prices to someone at acertain consumption level relative to the value of a marginal increase inconsumption at domestic prices obtaining to someone at the average consump-tion level. Thus, d will be greater than one for all individuals whohave consumption levels below the average and less than one for all indivi-duals who have consumption levels above the average.
10. The formula for estimating d depends on the nature of the utilityfunction assumed. Also in the S-T approach a distinction is made betweenmarginal changes in consumption and nonmarginal changes in consumption.Where nonmarginal changes are involved, the value of d will normally haveto be estimated in the context of specific project. But where only marginalchanges are involved, it is sufficient to refer to a country specific table
for d.
/1 W.J. Fellner, "Operational Utility: The theoretical background and ameasurement," in W.J. Fellner et. al. Ten Economic Studies in the Tradi-tion of Irving Fisher, Wiley, 1967.
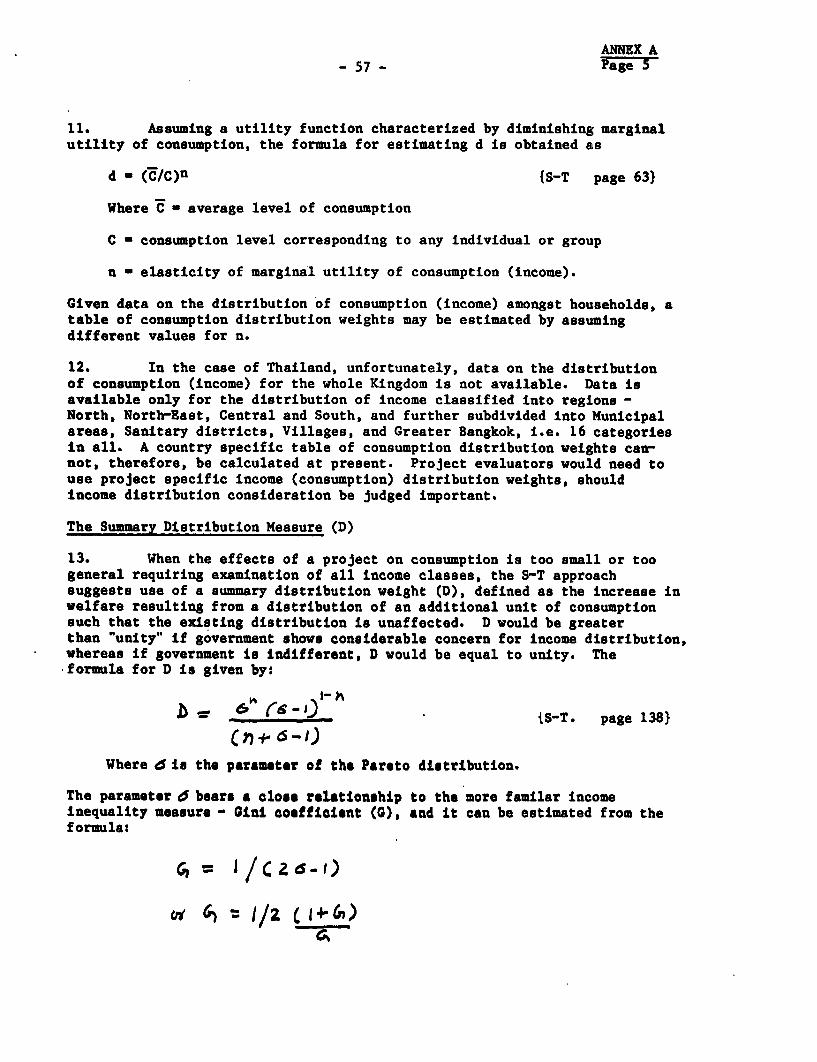
ANNEX A57 - Page 5
11. Assuming a utility function characterized by diminishing marginalutility of consumption, the formula for estimating d is obtained as
d - (C/C)n {S-T page 63)
Where C - average level of consumption
C - consumption level corresponding to any individual or group
n - elasticity of marginal utility of consumption (income).
Given data on the distribution of consumption (income) amongst households, atable of consumption distribution weights may be estimated by assumingdifferent values for n.
12. In the case of Thailand, unfortunately, data on the distributionof consumption (income) for the whole Kingdom is not available. Data isavailable only for the distribution of income classified into regions -North, North-East, Central and South, and further subdivided into Municipalareas, Sanitary districts, Villages, and Greater Bangkok, i.e. 16 categoriesin all. A country specific table of consumption distribution weights canrnot, therefore, be calculated at present. Project evaluators would need touse project specific income (consumption) distribution weights, shouldincome distribution consideration be judged important.
The Summary Distribution Measure (D)
13. When the effects of a project on consumption is too small or toogeneral requiring examination of all income classes, the S-T approachsuggests use of a summary distribution weight (D), defined as the increase inwelfare resulting from a distribution of an additional unit of consumptionsuch that the existing distribution is unaffected. D would be greaterthan "unity" if government shows considerable concern for income distribution,whereas if government is indifferent, D would be equal to unity. Theformula for D is given by:
b _ 6 6 -I) tS-T. page 1381
( JJ 6-I)
Where d Is the parameter of the Pareto distribution.
The parameter d bears a close relationship to the more familar incomeinequality measure - Olni coefficient (O), and it can be estimated from theformula:
X = ;C6I
-1/2 c Ih)
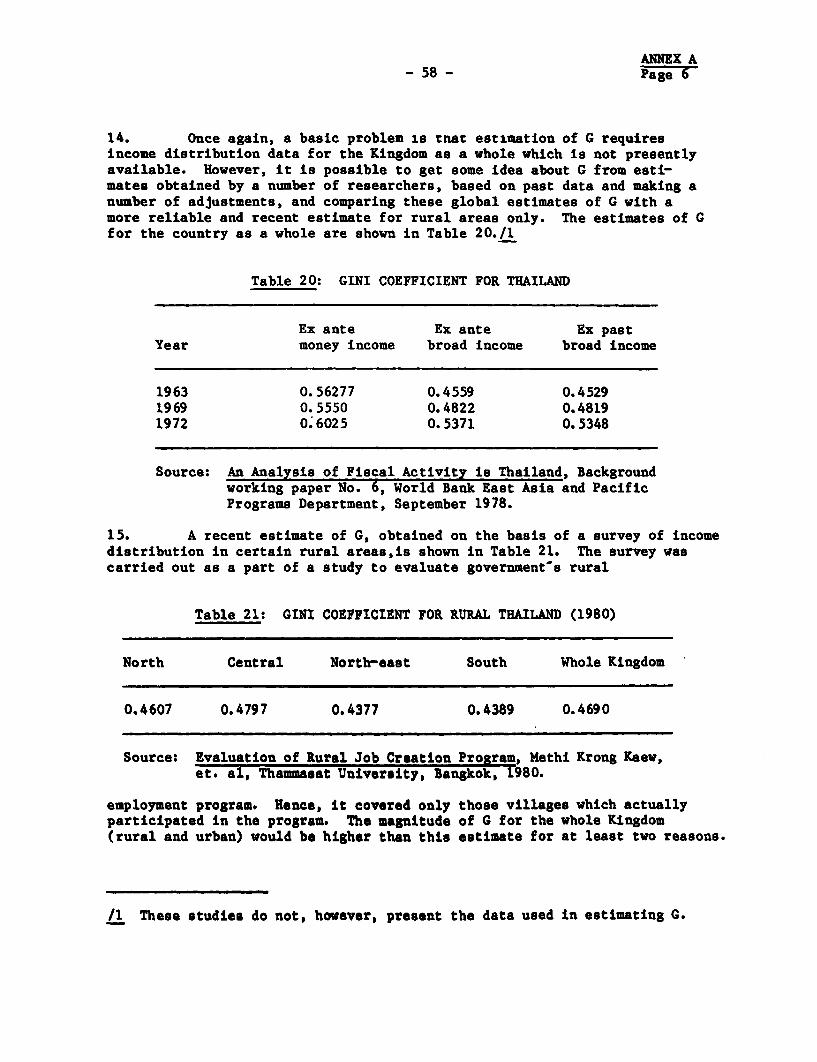
ANNEX A- 58 - Page 6
14. Once again, a basic problem is tnat estimation of G requiresincome distribution data for the Kingdom as a whole which is not presentlyavailable. However, it is possible to get some idea about G from esti-mates obtained by a number of researchers, based on past data and making anumber of adjustments, and comparing these global estimates of G with amore reliable and recent estimate for rural areas only. The estimates of Gfor the country as a whole are shown in Table 20./i
Table 20: GINI COEFFICIENT FOR THAILAND
Ex ante Ex ante Ex pastYear money income broad income broad income
1963 0.56277 0.4559 0.45291969 0.5550 0.4822 0.48191972 0.6025 0.5371 0.5348
Source: An Analysis of Fiscal Activity is Thailand, Backgroundworking paper No. 6, World Bank East Asia and PacificPrograms Department, September 1978.
15. A recent estimate of G, obtained on the basis of a survey of incomedistribution in certain rural areas,is shown in Table 21. The survey wascarried out as a part of a study to evaluate government's rural
Table 21: GINI COEFFICIENT FOR RURAL THAILAND (1980)
North Central North-east South Whole Kingdom
0.4607 0.4797 0.4377 0.4389 0.4690
Source: Evaluation of Rural Job Creation Program, Methi Krong Kaew,et. al, Thammasat University, Bangkok, 1980.
employment program. Hence, it covered only those villages which actuallyparticipated in the program. The magnitude of G for the whole Kingdom(rural and urban) would be higher than this estimate for at least two reasons.
/1 These studies do not, however, present the data used in estimating G.
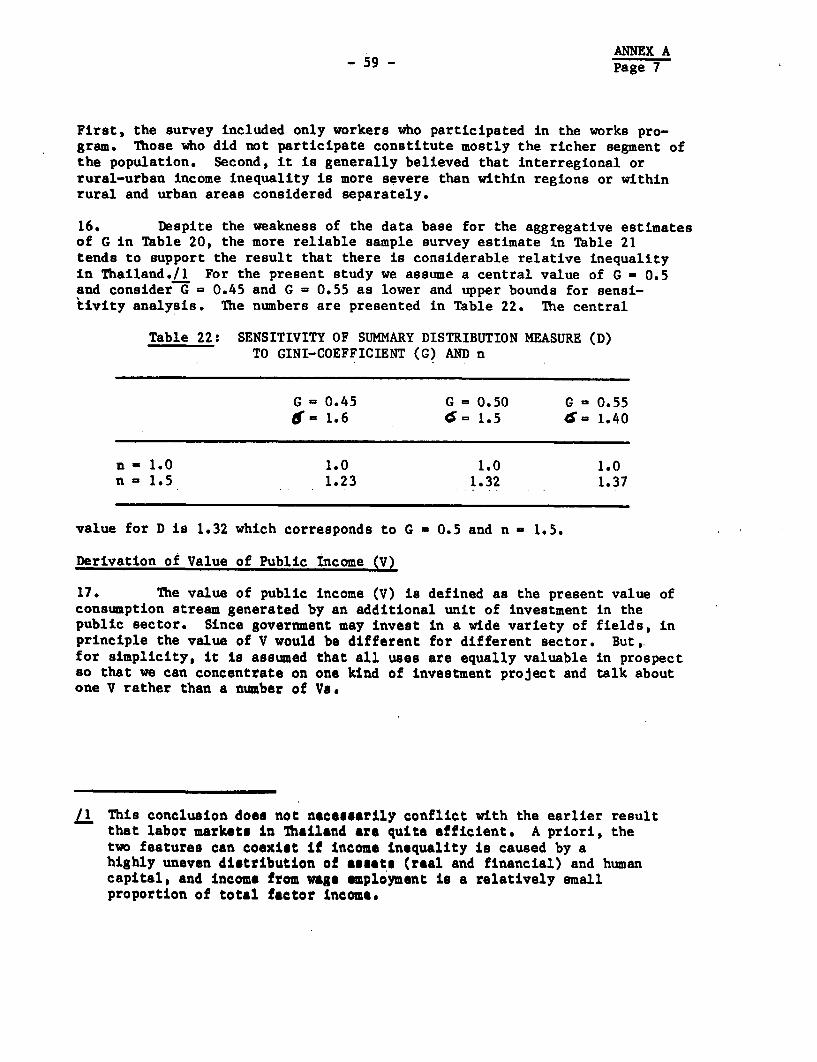
ANNEX A- 59 - Page 7
First, the survey included only workers who participated in the works pro-gram. Those who did not participate constitute mostly the richer segment ofthe population. Second, it is generally believed that interregional orrural-urban income inequality is more severe than within regions or withinrural and urban areas considered separately.
16. Despite the weakness of the data base for the aggregative estimatesof G in Table 20, the more reliable sample survey estimate in Table 21tends to support the result that there is considerable relative inequalityin Thailand./l For the present study we assume a central value of G - 0.5and consider = 0.45 and G = 0.55 as lower and upper bounds for sensi-tivity analysis. The numbers are presented in Table 22. The central
Table 22: SENSITIVITY OF SUMMARY DISTRIBUTION MEASURE (D)TO GINI-COEFFICIENT (G) AND n
G =0.45 G - 0.50 G - 0.556- 1.6 6- 1.5 6- 1.40
n - 1.0 1.0 1.0 1.0n - 1.5 1.23 1.32 1.37
value for D is 1.32 which corresponds to G - 0.5 and n - 1.5.
Derivation of Value of Public Income XV)
17. The value of public income (V) is defined as the present value ofconsumption stream generated by an additional unit of investment in thepublic sector. Since government may invest in a wide variety of fields, inprinciple the value of V would be different for different sector. But,.for simplicity, it is assumed that all uses are equally valuable in prospectso that we can concentrate on one kind of investment project and talk aboutone V rather than a number of Vs.
L/ This conclusion doei not necessarily conflict with the earlier resultthat labor markets in Thailand are quite efficient. A priori, thetwo features can coexist if income inequality is caused by ahighly uneven distribution of assets (real and financial) and humancapital, and income from wage employment is a relatively smallproportion of total factor income.
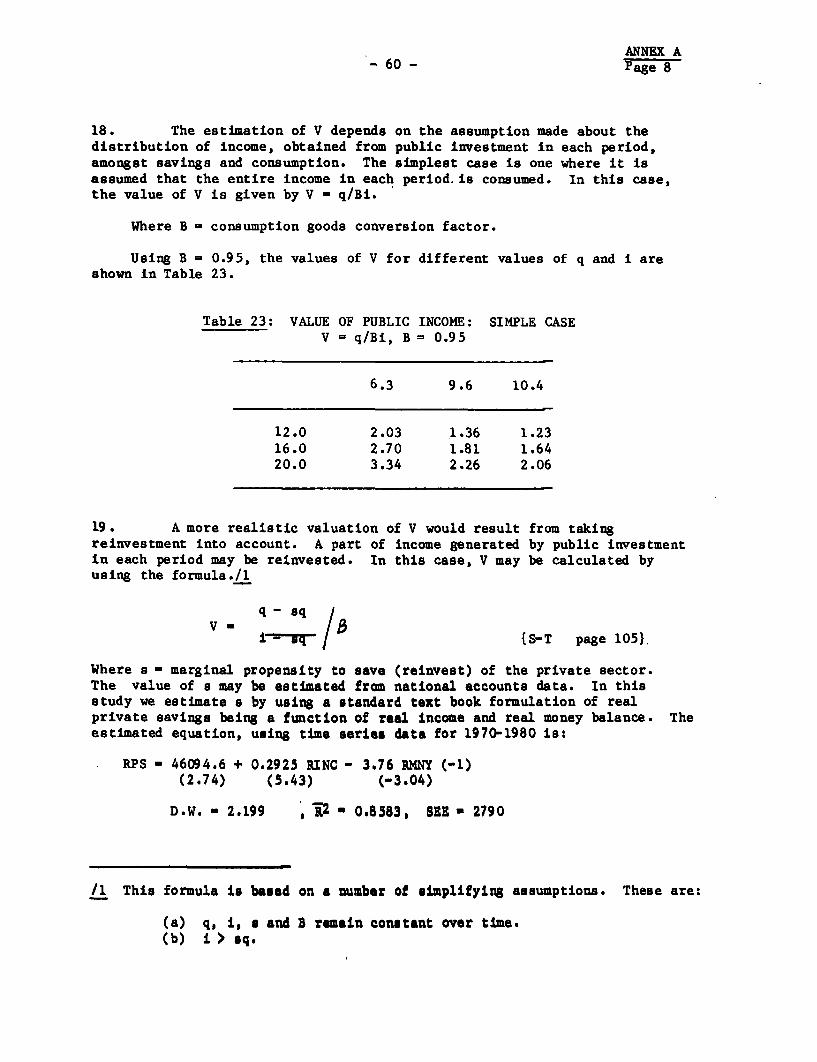
ANNEX A-60 - Page 8
18. The estimation of V depends on the assumption made about thedistribution of income, obtained from public investment in each period,amongst savings and consumption. The simplest case is one where it isassumed that the entire income in each period is consumed. In this case,the value of V is given by V - q/Bi.
Where B - consumption goods conversion factor.
Using B - 0.95, the values of V for different values of q and i areshown in Table 23.
Table 23: VALUE OF PUBLIC INCOME: SIMPLE CASEV = q/Bi, B = 0.9 5
6.3 9.6 10.4
12.0 2.03 1.36 1.2316.0 2.70 1.81 1.6420.0 3.34 2.26 2.06
19. A more realistic valuation of V would result from takingreinvestment into account. A part of income generated by public investmentin each period may be reinvested. In this case, V may be calculated byusing the formula./l
q - sq /
i~Tq / {S-T page 105}.
Where s - marginal propensity to save (reinvest) of the private sector.The value of s may be estimated from national accounts data. In thisstudy we estimate a by using a standard text book formulation of realprivate savings being a function of real income and real money balance. Theestimated equation, using time series data for 1970-1980 is:
RPS - 46094.6 + 0.2925 RINC - 3.76 RHNY (-1)(2.74) (5.43) (-3.04)
D.W. - 2.199 , R2 - 0.8583, SEE - 2790
/1 This formula is based on a number of simplifying assumptions. These are:
(a) q, i, a and B remain constant over time.(b) i > sq.
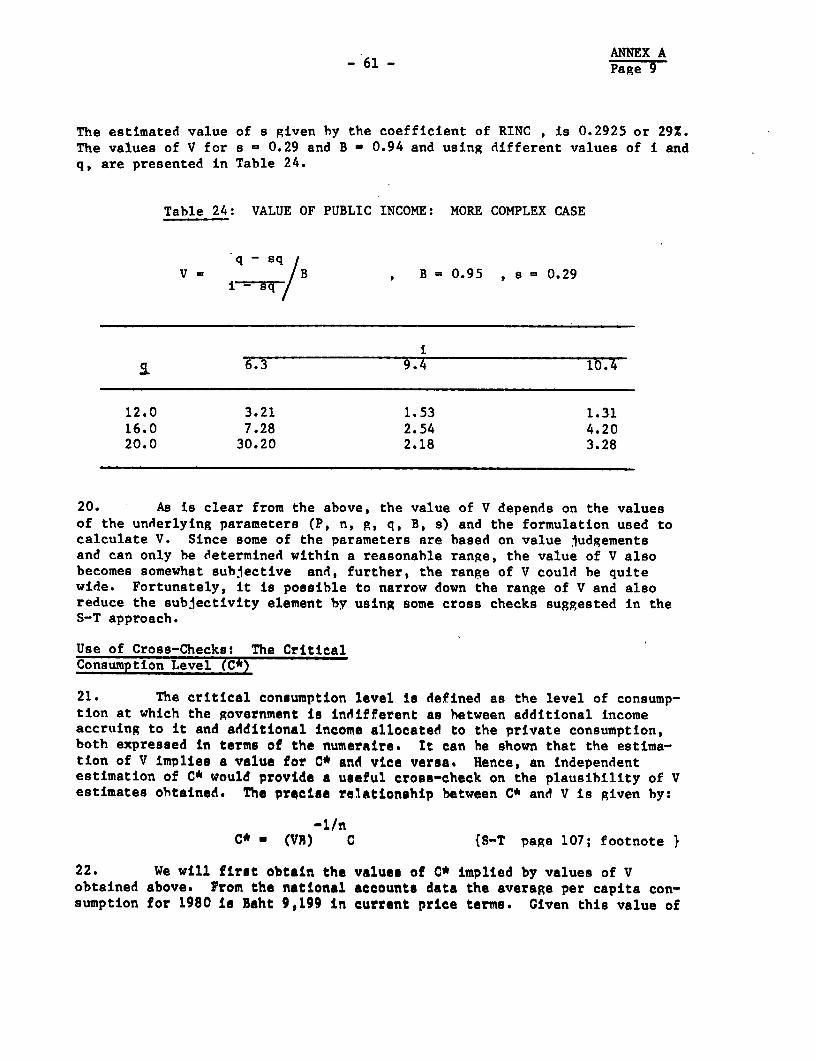
ANNEX A- 61 - Page 9
The estimated value of s given by the coefficient of RINC , is 0.2925 or 29%.The values of V for s = 0.29 and B - 0.94 and using different values of i andq, are presented in Table 24.
Table 24: VALUE OF PUBLIC INCOME: MORE COMPLEX CASE
q - sqV - B , B= 0.95 ,s a= 0.29
i6.3 9.4 10.4
12.0 3.21 1.53 1.3116.0 7.28 2.54 4.2020.0 30.20 2.18 3.28
20. As is clear from the above, the value of V depends on the valuesof the underlying parameters (P, n, g, q, B, a) and the formulation used tocalculate V. Since some of the parameters are based on value Judgementsand can only be determined within a reasonable range, the value of V alsobecomes somewhat subjective and, further, the range of V could be quitewide. Fortunately, it is possible to narrow down the range of V and alsoreduce the subjectivity element by using some cross checks suggested in theS-T approach.
Use of Cross-Checks: The CriticalConsumption Level (C*)
21. The critical consumption level is defined as the level of consump-tion at which the government is indifferent as hetween additional incomeaccruing to it and additional income allocated to the private consumption,both expressed in terms of the numeraire. It can he shown that the estima-tion of V implies a value for C* and vice versa. Hence, an independentestimation of C* would provide a useful cross-check on the plausibility of Vestimates obtained. The precise relationship between C* and V is given by:
-./nC* * (VE) C {S-T page 107; footnote }
22. We will first obtain the values of C* implied by values of Vobtained above. From the national accounts data the average per capita con-sumption for 1980 is Baht 9,199 in current price terms. Given this value of
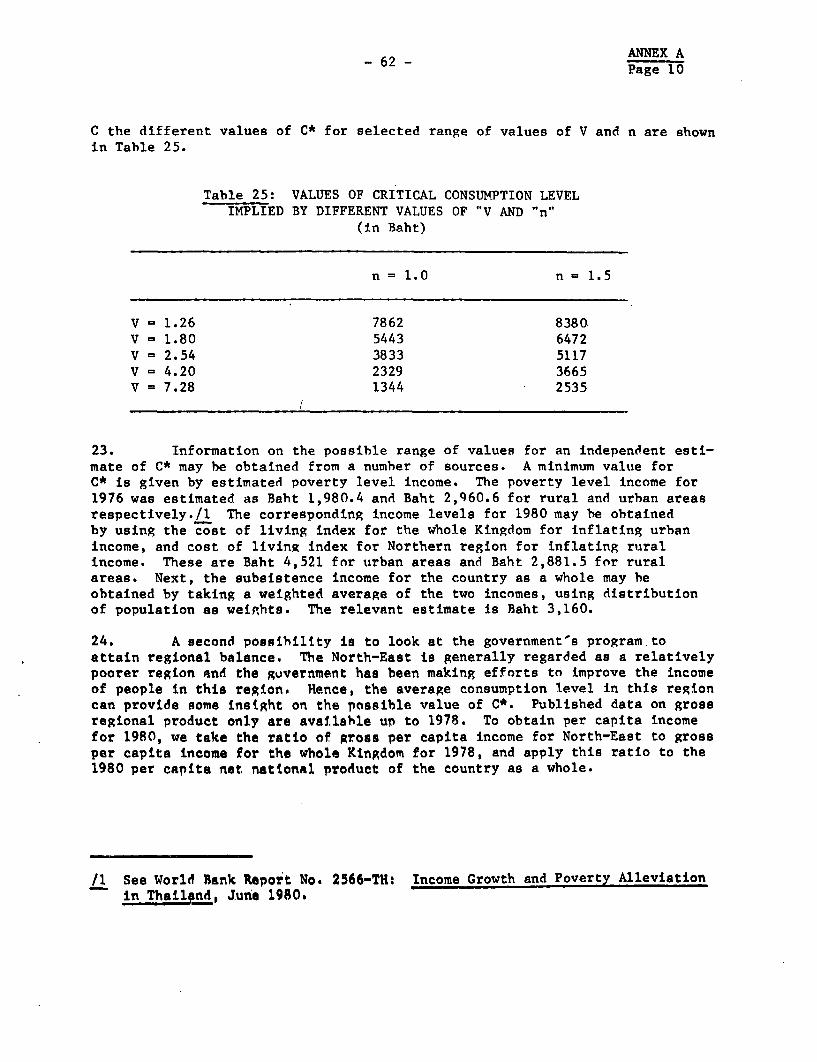
- 62 - ANNEX APage 10
C the different values of C* for selected range of values of V and n are shownin Table 25.
Table 25: VALUES OF CRITICAL CONSUMPTION LEVELIMPLIED BY DIFFERENT VALUES OF "V AND "n"
(in Baht)
n = 1.0 n = 1.5
V = 1.26 7862 8380V 1.80 5443 6472V = 2.54 3833 5117V = 4.20 2329 3665V = 7.28 1344 2535
23. Information on the possible range of values for an independent esti-mate of C* may be obtained from a number of sources. A minimum value forC* is given by estimated poverty level income. The poverty level income for1976 was estimated as Baht 1,980.4 and Baht 2,q60.6 for rural and urban areasrespectively./l The corresponding income levels for 1980 may be obtainedby using the cost of living index for the whole Kingdom for inflating urbanincome, and cost of living index for Northern region for inflating ruralincome. These are Baht 4,521 for urban areas and Baht 2,881.5 for ruralareas. Next, the subsistence income for the country as a whole may beobtained by taking a weighted average of the two incomes, using distributionof population as weights. The relevant estimate is Baht 3,160.
24. A second possibility is to look at the government's program.toattain regional balance. The North-East is generally regarded as a relativelypoorer region and the guvernment has been making efforts to improve the incomeof people in this region. Hence, the average consumption level in this regioncan provide somne insight on the possible value of C*. Published data on grossregional product only are available up to 1978. To obtain per capita incomefor 1980, we take the ratio of gross per capita income for North-East to grossper capita income for the whole Kingdom for 1978, and apply this ratio to the1980 per capita net national product of the country as a whole.
/1 See World Bank Report No. 2566-TH: Income Growth and Poverty Alleviationin Thailqnd, Jtune 1980.
- 63 - ANNEX APage 11
The number thus derived is Baht 5,050. Next, allowintg for the price differ-ential between North - East, and the whole Kingdom and using the relation-ship between average income and average consumption for the country ingeneral, we obtain a value of C* equal to Baht 3,241. Thib is quite closeto the value obtained as poverty level income.
25. A third source of information is the government's payment of con-sumption and production subsidies. In general consumption subsidy is notsignificant in Thailand./l The main consumption subsidy policy is cheaprice distribution programs. Rice reserved from exporters is sold to urbanconsumers, primarily in Bangkok area, at a price close to the procurementprice. Although the government's stated objective is to benefit the poor,there is no "target income" group and access is almost free. Hence, cri-tical consumption level cannot be identified from this scheme. Other con-sumption subsidies are given in the form of lower price for electricity,water and transport facilities./2 Once again these are open to all consumersirrespective of income level. Production subsidies are intended toencourage certain economic activities. Income distribution effects aremostly incidental and benefits are not directed to any target group.Hence, no insight for C* is available from production subsidy schemeseither.
25. An upper limit for C* can be obtained by considering the legal taxexempt income level. Before 1980 the minimum income required for a personto file tax return was Baht 7,000. The ceiling was raised to Baht 10,000 inMay 1980. If we assume that the marginal savings rate is equal to 29% atthis income level, the corresponding consumption level is Baht 7100. Thisoverestimates C* because, in setting tax exempt income, the government isinfluenced by income distribution consideration as well as collection cost,consideration.
26. The range of values obtained for an independent estimate of C* i.e.,Baht 3,160 - Baht 7,100, can be used to narrow down the range for V. ThusV - 1.24 and V - 7.28 may be eliminated from consideration since these implyvalues of C* outside the range obtained independently. The central value ofV - 2.54, suggested ealier, appears quite reasonable since it implies avalue of C* which is almost half-way between the two ranges for C* obtainedindependently. By implication, the central values of the subjectiveparameters - n-l.5 and P - 0.03, also appear reasonahle.
/1 See: An Analysis of Fiscal Activity in Thailand, op. cit.
/2 The scope of subsidization from these facilities has been narrowed downconsiderably since late 1980.
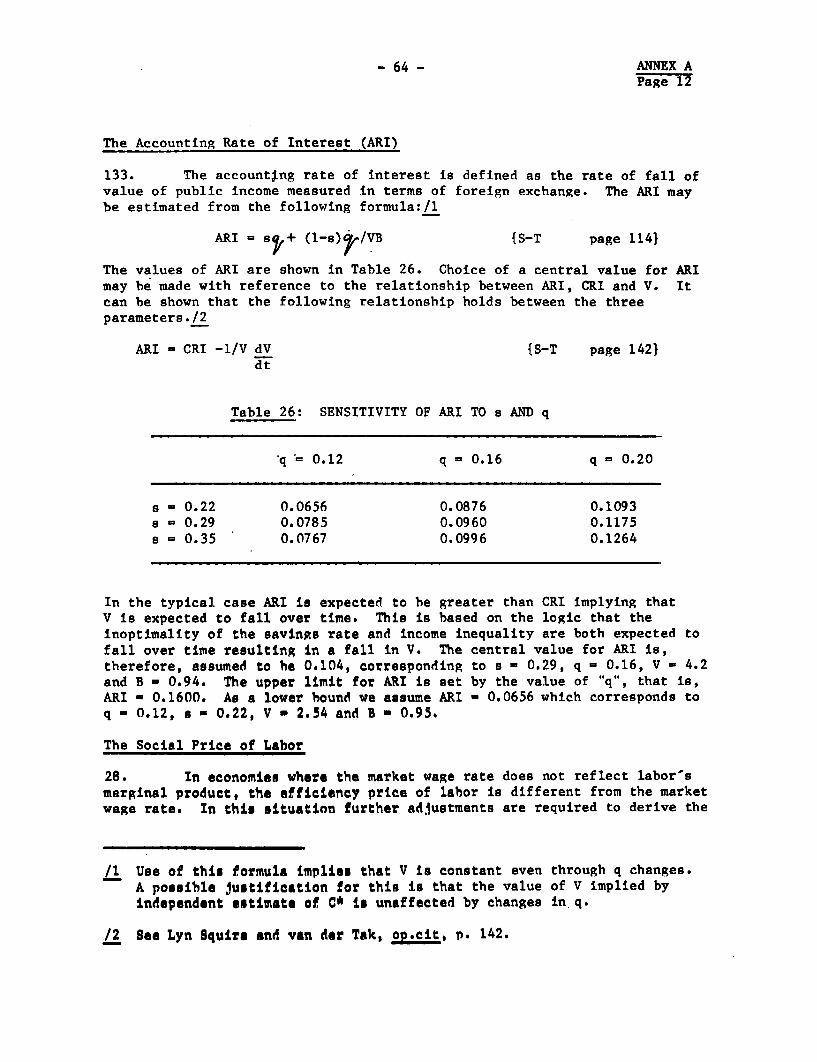
-64 - ANNEX APage 12
The Accounting Rate of Interest (ARI)
133. The accounting rate of interest is defined as the rate of fall ofvalue of public income measured in terms of foreign exchange. The ARI maybe estimated from the following formula:/1
ARI = sF + (l-s) s/VB {S-T page 114}
The values of ARI are shown in Table 26. Choice of a central value for ARImay be made with reference to the relationship between ARI, CRI and V. Itcan be shown that the following relationship holds between the threeparameters./2
ARI = CRI -1/V dV {S-T page 142}dt
Table 26: SENSITIVITY OF ARI TO s AND q
q '= 0.12 q = 0.16 q = 0.20
s 0.22 0.0656 0.0876 0.1093s = 0.29 0.0785 0.0960 0.1175S G 0.35 0.0767 0.0996 0.1264
In the typical case ARI is expected to be greater than CRI implying thatV is expected to fall over time. This is based on the logic that theinoptimality of the savings rate and income inequality are both expected tofall over time resulting in a fall in V. The central value for ARI is,therefore, assumed to be 0.104, corresponding to s - 0.29, q - 0.16, V - 4.2and B - 0.94. The upper limit for ARI is set by the value of "q", that is,ARI - 0.1600. As a lower hound we assume ARI - 0.0656 which corresponds toq - 0.12, s - 0.22, V - 2.54 and B - 0.95.
The Social Price of Labor
28. In economies where the market wage rate does not reflect labor'smarginal product, the efficiency price of labor is different from the marketwage rate. In this situation further adjlustments are required to derive the
A Use of this formula lmplies that V is constant even through q changes.A poasible justification for this is that the value of V implied byindependent estimate of C* is unaffected by changes in.q.
/2 See Lyn Squire and van der Tak, op.cit, p. 142.
- 65- ANNEX APage 13
social price of labor. A general formulation for shadow wage rate, suggestedin the S-T approach, is
SWR = m e +(w-m) (B-d/V)+ (w-m) 0 ed/V {S-T page 83}
Where m = lahors marginal product at market prices
e = accounting ratio to convert "m" into efficiency units
w - market wage rate
d = income distribution weight
V - social value of income
0 = ratio of social to private evaluation of disutility of effort
e - ratio of wage earners own evaluation of the disutility ofeffort to his additional income.
This forumula simply adjusts the efficiency price of labor (m 0) for thedisutility of effort and income distribution effects. As is obvious, whenlabor markets work reasonably efficiently so that the market wage rate re-flects labor's marginal product, i.e, m - w, the formula reduces to:
SWR - m ie
which is the efficiency price of labor.
29. In the case of Thailand, we have shown that the available evi-dence suggests that labor markets function reasonably efficiently implyingthat w - m. Rence in Thailand, the efficiency price of labor and itssocial price are the same./l
/1 The only exception, as pointed out earlier, is in the case of projectsin large-scale manufacturinR sector with effective minimum wages. Socialprice of labor will be different from the efficiency price.
- 66 - ANNEX B
DATA SOURCES
1. Data used in this report are obtained from a number of sources.Specifically, these are as follows. Data on the value of aggregate importsand exports are obtained from the Bank of Thailand (BOT). Disaggregateddata on value of imports - classified into four groups: consumer goods,intermediate goods, capital goods, and other imports, are also obtainedfrom BOT. The "other import" group includes vehicles and parts, fuels andlubricants and a miscellaneous category. We reclassified imports in termsof first three groups only by reassigning other imports. Passenger carsare included in the category of consumer goods. All other vehicles areconsidered as capital goods. Fuels and lubricants are assigned tointermediate goods. Finally, the miscellaneous category is equally dividedamongst the three groups.
2. A similar classification for exports is not available. However,disaggregation of exports into broad commodity groups is available. Thisis used to obtain economic classification of exports. The methodologyfollowed in deriving this classification is broadly similar to themethodology followed by BOT in obtaining economic grouping for imports.
3. Data on import duties and export taxes are obtained from BOT.Information on business taxes on imports and exports are obtained from theCutoms Departments. Municipal taxes are calculated as 10% of businesstaxes. Unfortunately, disaggregated data on business taxes for exportscould not be obtained. Hence, it is assumed that all categories of exportshave uniform business tax. Data on rice premium is obtained from the Ministryof Commerce, while information on agricultural subsidy administered throughthe Farmer's Aid Fund is obtained from the Comptroller Office. Finally,information on export subsidy administered through the "Export Rebate" and"Import Drawback Scheme" are obtained from the Ministry of Finance.
4. National accounts data are available in various World Bank reportson Thailand as well as in different official publications of the Thai Govern-ment. The two main official publications consulted are: Bank of Thailand,Quarterly Bulletin published by BOT, and National Accounts of Thailandpublished by NESDB. In addition, a large amount of information processed byBOT for the IMF and made available to the SAL mission of the World Bank, isused to supplement data from other sources./l
/1 Six months after this Report was complete, the author was informed thatdata on economic classification of exports and income distributionfor the Kingdom as a whole have been compiled and are now available incomputer tapes in Thailand. These data would be useful in updatingthe parameters of this study.
- 67 - ANNEX C
ESTIMATION OF TAX EQUIVALENCE OF RICE RESERVE REqUIREMENT
1. The Bank of Thailand has estimated the implicit tax involved in
rice reserve requirements for six varieties of rice for the months
June and July 1981. The six varieties are: white rice (5%), white
rice (15%), broken rice (A1 super), broken rice (A1 special), parboiled
rice (5%) and parboiled rice (15%). Aggregating these six varieties into
three categories - white rice, broken rice super and parboiled rice, the
implicit export tax rate (June-July average) on these three categories work
out as 19.8%, 6.9% and 22.2% respectively. An examination of rice trade
structure reveals that on an average (1979-80) white rice accounts for 63%,
parboiled rice 14% and broken super rice 17% of the total rice exports from
Thailand. The remaining 6% is comprised of glutinous rice (4%), cargo rice
(2%) and other rice (negligible). The average tax equivalence of reserve
requirement is, therefore, obtained as a weighted average of implicit rice
export taxes on the 3 varieties - the weights being share of each variety in
total export of rice. The magnitude comes to about 18.3%.
2. To convert this implicit rice export tax into a tax rate on total
exports, the 18.3% tax rate is multiplied by the average value weight of
rice exports in total export, i.e., 0.1479, based on five-year average
(1976-1980). Hence, the average rate of export tax implied by rice
reserve requirement policy is 2.7% (calculated in terms of total exports
as base).
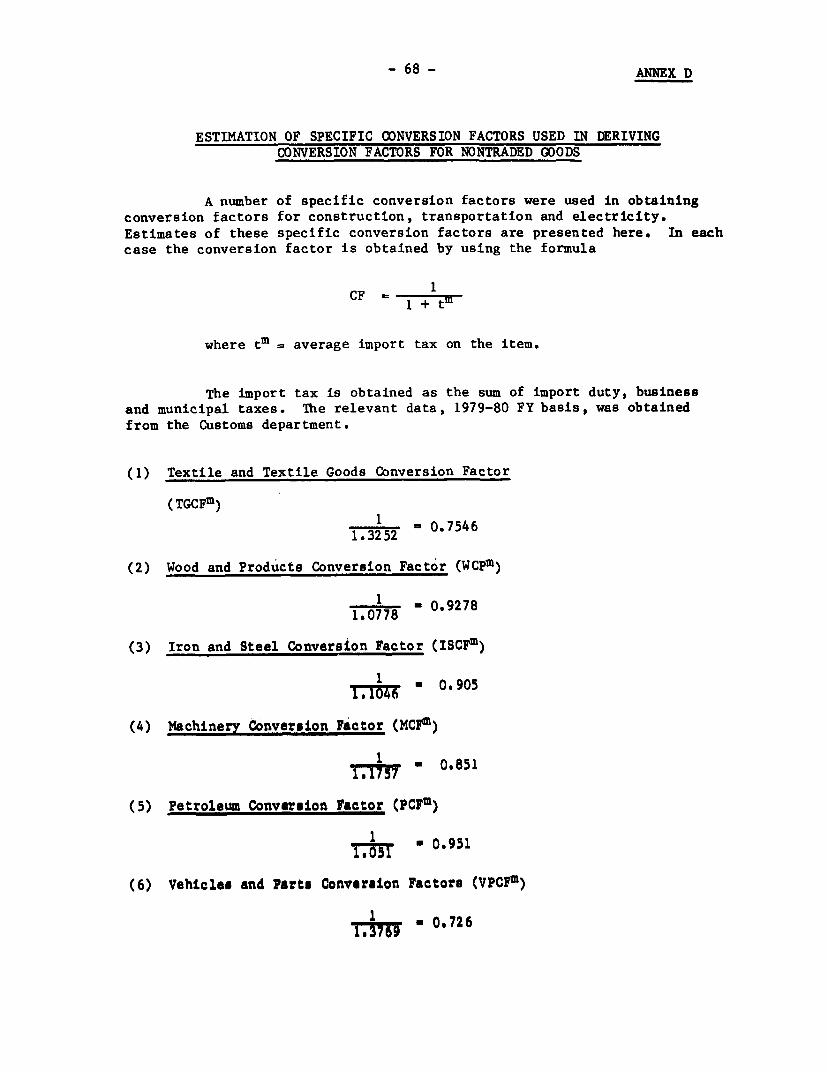
- 68 - ANNEX D
ESTIMATION OF SPECIFIC CONVERSION FACTORS USED IN DERIVINGCONVERSION FACTORS FOR NONTRADED GOODS
A number of specific conversion factors were used in obtainingconversion factors for construction, transportation and electricity.Estimates of these specific conversion factors are presented here. In eachcase the conversion factor is obtained by using the formula
CF- I1 + tm
where tm average import tax on the item.
The import tax is obtained as the sum of import duty, businessand municipal taxes. The relevant data, 1979-80 FY basis, was obtainedfrom the Customs department.
(1) Textile and Textile Goods Conversion Factor
(TGCF m )
1 = 0.75461.*3252
(2) Wood and Products Conversion Factor (WCPm)
1 0.92781.*0778
(3) Iron and Steel Conversion Factor (ISCFm)
Ir ' 0'905
(4) Nachinery Conversion Factor (MCFm)
' 0.851
(5) Petroleum Converslon Factor (PCFm)
1 ' 0.951
(6) Vehiclee and Parts Conversion Factors (VPCFm)
I - 0.726
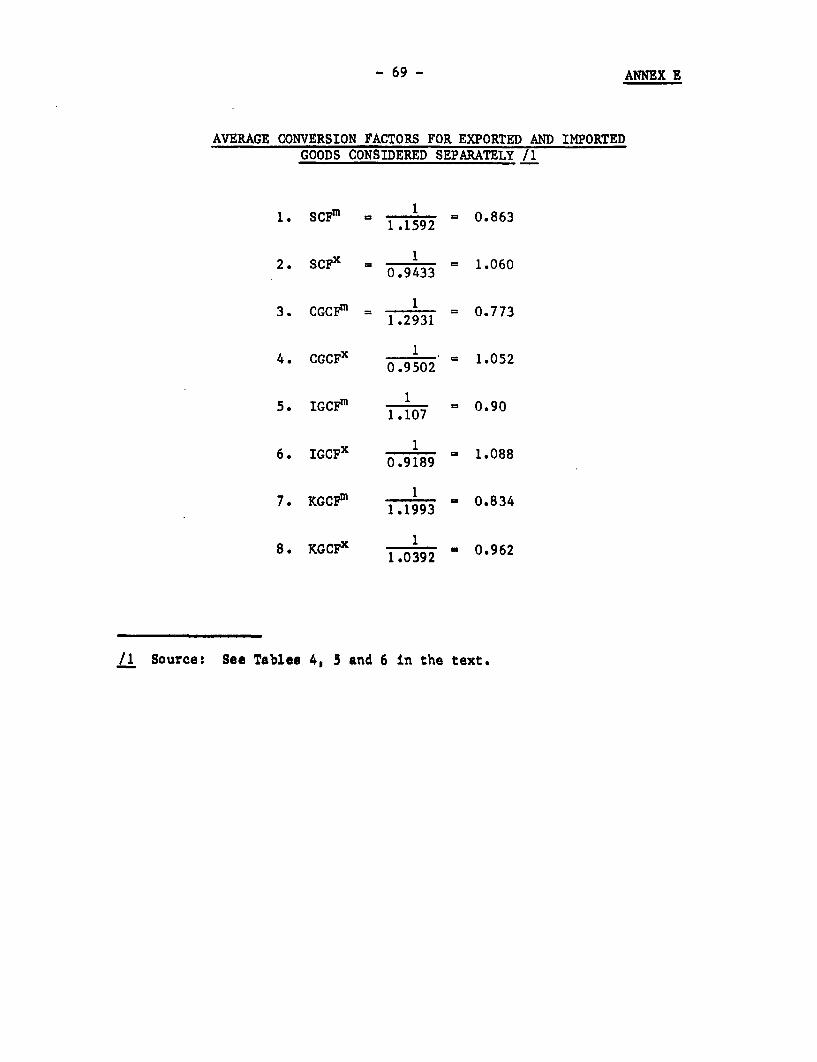
-69 - ANNEX 1
AVERAGE CONVERSION FACTORS FOR EXPORTED AND IMPORTEDGOODS CONSIDERED SEPARATELY /1
1. SCF0 1.1592 = 0.863
1.9
2. SCFX - 0.9433 = 1.060
3. CGCFn = 1.2931 0.773
4. CGCFx' 1 1.0520.9 502
5. IGCFm 1.107 0.90
6. IGCFX 1 1.088
0.9 189
7. KGCFm 1 - 0.8341. 1993
8. KGCFX 1 ' 0.9621.0 392
/1 Source: See Tables 49 5 and 6 in the text.
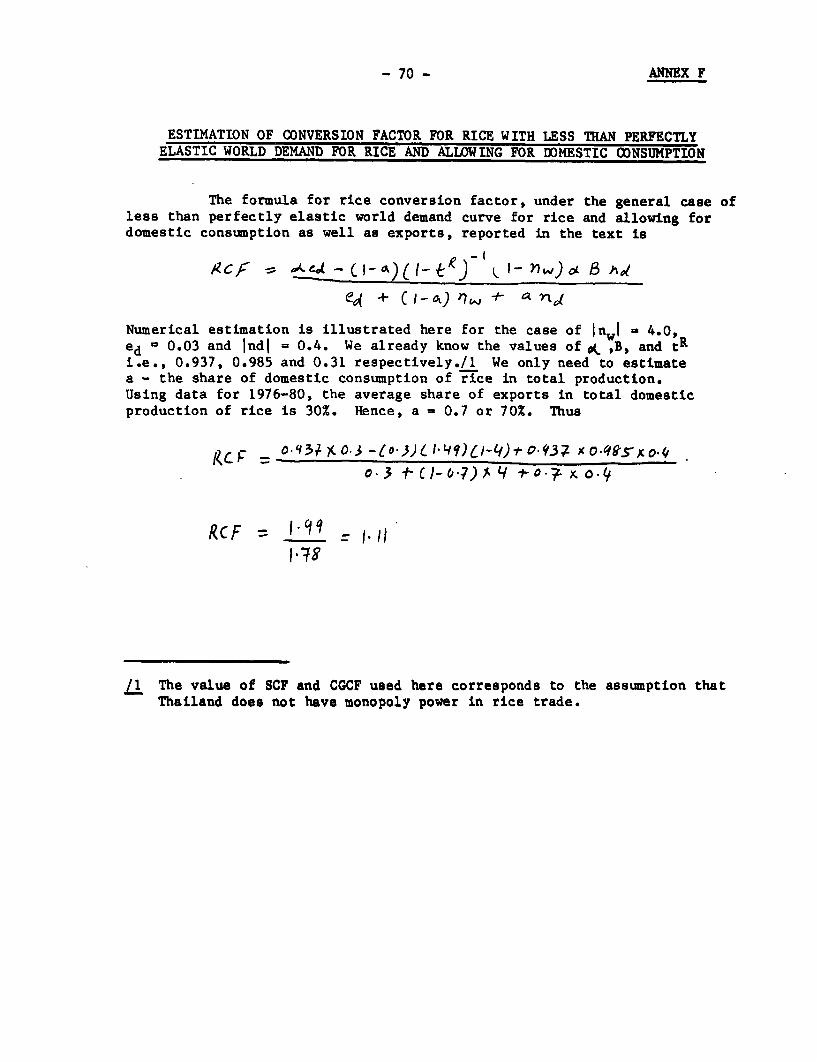
- 70 - ANNEX F
ESTIMATION OF CONVERSION FACTOR FOR RICE WITH LESS THAN PERFECTLYELASTIC WORLD DEMAND FOR RICE AND ALLOWING FOR DOMESTIC CONSUMPTION
The formula for rice conversion factor, under the general case ofless than perfectly elastic world demand curve for rice and allowing fordomestic consumption as well as exports, reported in the text is
e'( + C-I )t1 - + ij
Numerical estimation is illustrated here for the case of In.1 - 4.0,ed - 0.03 and Indl = 0.4. We already know the values of .' ,B, and tRi.e., 0.937, 0.985 and 0.31 respectively./l We only need to estimatea - the share of domestic consumption of rice in total production.Using data for 1976-80, the average share of exports in total domesticproduction of rice is 30%. Hence, a - 0.7 or 70%. Thus
Rcj F °3' ?( 0°3 -(o*3))L I36 g o*q9-s:-o.c,o 3 -+ C C1-t 7) Ai o x. o
RCF 1./1
L1 The value of SCF and CGCF used here corresponds to the assumption thatThailand does not have monopoly power in rice trade.
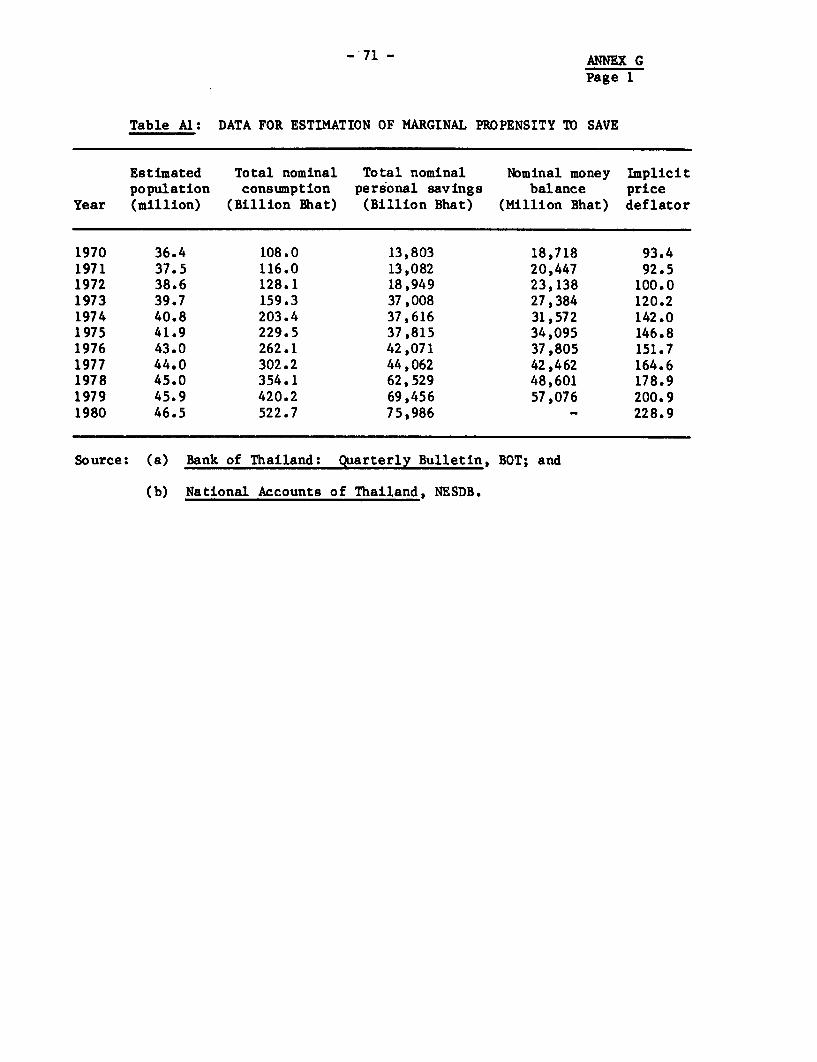
-'71- ANNEX G
Page 1
Table Al: DATA FOR ESTIMATION OF MARGINAL PROPENSITY TO SAVE
Estimated Total nominal Total nominal Nominal money Implicitpopulation consumption personal savings balance price
Year (million) (Billion Bhat) (Billion Bhat) (Million Bhat) deflator
1970 36.4 108.0 13,803 18,718 93.41971 37.5 116.0 13,082 20,447 92.51972 38.6 128.1 18,949 23,138 100.01973 39.7 159.3 37,008 27,384 120.21974 40.8 203.4 37,616 31,572 142.01975 41.9 229.5 37,815 34,095 146.81976 43.0 262.1 42,071 37,805 151.71977 44.0 302.2 44,062 42,462 164.61978 45.0 354.1 62,529 48,601 178.91979 45.9 420.2 69,456 57,076 200.91980 46.5 522.7 75,986 - 228.9
Source: (a) Bank of Thailand: Quarterly Bulletin, BOT; and
(b) National Accounts of Thailand, NESDB.
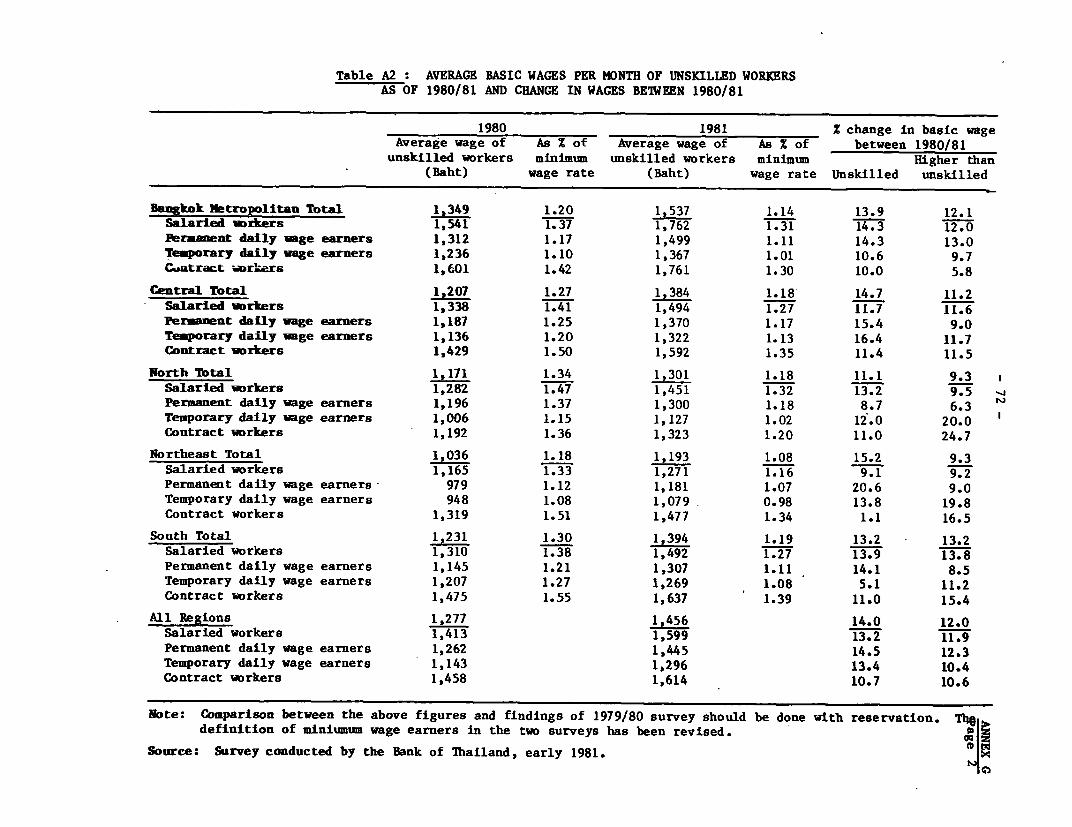
Table A2 : AVERAGE BASIC WAGES PER MONTH OF UNSKILLED WORKERSAS OF 1980/81 AND CHANGE IN WAGES BEIWEEN 1980/81
1980 1981 Z change in basic wage
Average wage of As % of Average wage of As % of between 1980/81
unskilled workers minimum unskilled workers minimum Higher than(Baht) wage rate (Baht) wage rate Unskilled unskilled
Bangkok Metropolitan Tbtal 1,349 1.20 1,537 1.14 13.9 12.1
Salaried workers 1,541 1.37 1,762 1.31 14.3 12.0
Permanent daily wage earners 1,312 1.17 1,499 1.11 14.3 13.0
Temporary daily wage earners 1,236 1.10 1,367 1.01 10.6 9.7
C.Ratract iwr;kers 1,601 1.42 1,761 1.30 10.0 5.8
Central Total 1,207 1.27 1,384 1.18 14.7 11.2
Salaried workers 1,338 1.41 1,494 1.27 11.7 11.6
Permanent daily wage earners 1,187 1.25 1,370 1.17 15.4 9.0
Temporary daily wage earners 1,136 1.20 1,322 1.13 16.4 11.7
Contract workers 1,429 1.50 1,592 1.35 11.4 11.5
North Total 1,171 1.34 1,301 1.18 11.1 9.3
Salaried workers 1,282 1.47 1,451 1.32 13.2 9.5Permanent daily wage earners 1,196 1.37 1,300 1.18 8.7 6.3
Temporary daily wage earners 1,006 1.15 1,127 1.02 12.0 20.0
Contract workers 1,192 1.36 1,323 1.20 11.0 24.7
Northeast Total 1,036 1.18 1,193 1.08 15.2 9.3
Salaried workers 1,165 1.33 1,271 1.16 9.1 9.2
Permanent daily wage earners 979 1.12 1,181 1.07 20.6 9.0
Temporary daily wage earners 948 1.08 1,079 0.98 13.8 19.8
Contract workers 1,319 1.51 1,477 1.34 1.1 16.5
South Total 1,231 1.30 1,394 1.19 13.2 13.2
Salaried workers 1,310 1.38 1,492 1.27 13.9 13.8
Permanent daily wage earners 1,145 1.21 1,307 1.11 14.1 8.5
Temporary daily wage earners 1,207 1.27 1,269 1.08 5.1 11.2
Contract workers 1,475 1.55 1,637 1.39 11.0 15.4
All Regions 1,277 1,456 14.0 12.0
Salaried workers 1,413 1,599 13.2 11.9
Permanent daily wage earners 1,262 1,445 14.5 12.3
Temporary daily wage earners 1,143 1,296 13.4 10.4
Contract workers 1,458 1,614 10.7 10.6
Note: Comparison between the above figures and findings of 1979/80 survey should be done with reservation. Thdefinition of miniumum wage earners in the two surveys has been revised. T
Source: Survey conducted by the Bank of Thailand, early 1981.
73 ANNEX HPage 1
ECONOMIC VALUE OF LAND
A. The Opportunity Cost of Land
1. mhe general principle underlying the determination of the economicvalue of land is the same as for any other resource - the value of theresource depends on the "opportunity cost" of using the resource in anyparticular project. The opportunity cost in turn depends on the "realchoices" available for the use of land. The choices open may precludeemploying land in the most profitable project or in its most efficient use.Hence, the opportunity cost depends on the alternative "best available use"rather than the "best technically possible use" of land. For example,suppose it is technically possible to use land in A, B, C, D and E and weare trying to determine the opportunity cost of using land as an input inB. Suppose also that land is most productive if used in A, but environment,policy or custom precludes using land for A. The opportunity cost of usingland in B cannot be determined by calculating the net profitability of landin A. The real alternatives are C, D and E and the opportunity costdepends on the maximum net economic profitability foregone by not usingland in *C, D or E.
2. Measuring the opportunity cost of land, therefore, involvescalculating the net economic profitability of land in the best available usewithout the project. This requires a knowledge of not only what alternativeuses of land are available, but also knowledge of different input-output andprice configurations. Since alternative possible uses of land depends onlocation, the opportunity cost of land would differ from project to projectand no general conversion factor or shadow price of land can be derived.
B. Project Interaction and Opportunity Cost
3. One very important point which is often overlooked in determiningthe opportunity cost of land is that there are two opportunity costconcepts - one without the project and the second with the project completed.Which measure is relevant? On first thought it may appear that the oppor-tunity cost of land without the project is the relevant measure. If theproject is using "X" amount of land, the society is losing whatever neteconomic benefit the beot available alternative use would have yielded.However, this provides only a partial answer. Let us elaborate a littlemore.
4. Before a project is undertaken, a tract of land may have littlescope for alternative uses, But once the project is installed, the alter-native uses of the land may increase dramatically. The low value oppor-tunity cost of land before the project may be far below the high valueopportunity cost of land after the project is completed. Thus, there aretwo decisions that have to be takent first, should the project be undertakenand second, what is the optimal mix of land and other inputs. If land can
- 74 - ANNEX HPage 2
be used only for the project due to "use restrictions", or if the amount ofland available is the minimum required for the project, the substitutionissue is irrelevant and consideration of before-project opportunity cost issufficient. But, if the substitution of land for other inputs is possible,determining the optimal mix of land and other inputs requires that theopportunity cost of land be measured under the assumption that the projectis installed. In other words, both measures are relevant - thewithout-project measure is required to decide whether the project should beundertaken or not, and the with-project measure is required to determine theoptimal mix of land and other inputs.
C. Measurement of Opportunity Cost of Land in Practice
5. In practice it is possible to obtain only an approximate measureof the opportunity cost of land. First, it is not often possible to knowfor sure all the alternative uses. When land is diverted from an existinguse, the usual practice is to consider this as the best alternative avail-able use and measure economic profitability based on the existing input-output configuration. Second, the opportunity cost of land would vary overtime. The best available use of one tract of land today is likely to bedifferent from the best available use of the same tract of land 5 or 10 yearslater. But there is no way this can be predicted correctly. Therefore, indetermining opportunity cost a constant alternative use pattern over thelife of the project is assumed. Finally, the productivity of land in anyexisting or assumed alternative use depends on (a) price of outputrelative to the general price level, (b) prices of inputs relative to thegeneral price level, (c) technology and (d) laws and regulations andother constraints on land use. Any or all of these may vary over the lifeof the project, which would change the productivity of the alternative useand, hence, the opportunity cost of land from year to year. In practice,these factors are assumed to remain constant in measuring opportunity cost.
D. The Market Rent as a Measure of Opportunity Cost
6. If a number of assumptions are satisfied, then the market rentwould also reflect the opportunity cost of land. These assumptions are:
(a) the market rent is competitively determined;
(b) individuals are free to trade contractual agreements onland use and state laws protect such voluntary contracts;
(c) market prices fully reflect social scarcities;
(d) there are no externalities associated with land use, oralternatively, all externalities are fully internalizedthrough government policies.
- 75- ANNEX HPage 3
The market rent obtained under these assumptions is called the "true" or"economic" rent. It is clear that the set of assumptions is fairly restric-tive. It is commonly believed that in many developing countries landlordsexert some monopoly power in the rent determination process. Further, zoninglaws and use restrictions are frequently imposed by the governments of bothdeveloped and developing countries which imply that individuals are notalways free to trade contractual rights. Even if rents are competitivelydetermined and individuals are reasonably free to enter into contractualagreements on land use, market prices are likely to diverge from thecorresponding shadow prices. Moreover, the problem of externality isparticularly pervasive in the case of land use.
7. A final point is that, given that the above assumptions aresatisfied, the "market price" of land (present value of annual rents) wouldreflect the "ecottomic price" only if the market rate of interest reflectsthe opportunity cost of capital. We have already pointed out why the marketrate of interest may not reflect the opportunity cost of capital./l Hence,in practice rarely would it be appropriate to measure the opportunity costof land by referring to its market price.
E. Valuation of Land in Previous Bank Projects in Thailand
8. There are at least two Bank projects undertaken in Thailand inthe past in which the services of land entered as a major input or output.These are:
(a) National Sites and Services Project (1980);
(b) Lat Krabang Industrial Estate Project (1977).
In the National Sites and Services project the benefit from constructionof dwellings is measured in terms of imputed rents based on existing marketrent in comparable units. Cost of land used in the project is also measuredin market price terms. We pointed out above that the conditions required touse market rent or market price of land to measure the opportunity cost ofland are quite stringent and a careful analysis would be required for thespecific tracts of land to establish whether or not these conditions are infact satisfied. The extent to which such an analysis has been carried outcannot be discerned from the appraisal report.
9. In the Lat Krabang Industrial Estate Project the opportunity costof land is measured on the basis of net value of output lost from divertingland from its previous use. More specifically, land was previously used as
/1 See the discussion on the marginal productivity of capital in thetext.
-76- ANNEX HPage 4
a paddy field. Net annual value of output is measured by calculatingannual value of rice production and subtracting an assumed value as cost ofproduction. The net present value is derived by assuming that the netannual benefit remains constant throughout the project life and using anassumed discount rate to reflect the time preference rate. This isdefinitely an improvement over the practice of using the market value ofland. Nevertheless, two problems remain. First, the output of rice isvalued in terms of the domestic market price. Since rice is a tradeable andis actually exported, the relevant measure and output value is the marginalrevenue from exporting rice. Secondly, use of time preference rate as thediscount rate implies that the project evaluator is undertaking socialanalysis. Since this does not appear to be the case, i.e. only economicanalysis is undertaken, the opportunity cost of capital is the appropriatediscount rate.
World Bank Italian: AnalLsi economica del progettl The Effects of Populationdl lnuestimento"in Analisi del progetti Growth, of the Pattern of
Publications di investimento: iI metodo della Banca Demand, and of TechnologyMondiale. Marsillo Editorl. s.p.a., on the Process of Urbaniza-of Related S. Croce 518/A, 30125 Venice, tion: An Application to India
Interest Italy. 1978. Rakesh MohanISBN 10-4108-8. L8,800. This paper uses a non-linear, three-
Portuguese: Analise econ6mica de pro- sector, two-region wage-and-pricejetos. LTC-Liuros T4cnicos e Clenttficos. endogenous dynamic generalS. A., Au. Venezuela. 163, 20.220-Rio de equilibrium model to study the effect
Approaches to Purchasing Janelro, R J, Brazil. 1979. of populaton growth, the pattern ofdemand, and of technological changePower Parity and Real ISBl 85-216-0017-8, $8.00 equivalent. on urbanization In the context of aProduct Comparisons paperback. low-income developing country start-Using Shortcuts and SpanishI AnMisis economico de proyec- Ing at a low level of urbanization.Reduced Information tos. Editorial Tecnos, 1977. World Bank Staff Working PaperSultan Ahmad ISBN 84-309-0719-X, 435 pesetas. No. 520. 1982. 47 pages.World Bank Staff Working Paper No. ISBN 0-8213-0008-3. $3.00.418. September 1980.11 + 60 pages(including 14 tables, bibliography). Economic and SocialStock No. WP-0418. S3.00. Analysis of Projects and of NEW
Price Policy: The MoroccoFourth Agrcultural Financing of Investment inComparative Study of the Credtt Priuect u India, 1975-1985: A
Management and Organoza- Kevin M. Cleaver Sources and Uses of Fundstion of Irilgation Projects * ApproachAnthony E Bottrall World Bank Staff Working Paper NO. Armando Pinell-Slles andWorld Bank Staff Working Paper Mo. 369. January 1980. 59 pages (includ- VUJ. Ravishankar458. May 1981. 274 pages (Includi i nS a table69. This paper presents sources and uses3 appendixes). Stock No, WP-0369, S3,00. of funds accounts Integrated in aStock Mo. WP-0458. $10.00. macroeconomic framework for
Economy-Wide Models and analyzing flnancing patterns andDevelopment Planningeconomic interdependence amongDeveopment Planning sectors In India, contrasting the
Economic Analysis Charles R. Blitzer, period 1975-80 with the Sixth Planof Projects Peter B. Clark, and period. 1980-85.Lyn Squire and Lance Taylor, editors World Bank Staff Working Paper No.hierman G. van der Tak Surveys the specification and uses of 543.1982. 92 pages.Reconsiders project appraisal and medium-term and perspective ISBN 0-8213-0205-5. $3.00.recommends a more systematic andconsistent estimation and application Oxford Uniuersity Press, 1975; 4th General Equilibrium Modelsof shadow prices and a calculation of printing, 1982. 382 pages (including for Development Policyrates of return that take explicit selected additional readings, bibliogra- KemaI D J de Me1account of the project's impact on the phy, subject and author Index), eman S erms, aime e o,distribution of Income.LC7297.IB0199072,adSemnRbso
The Johns Hopkins University Pmess, LC 74-29171. 15BN 0-19-920074-2, Provides a comprehensive study of1975; 4th printing, 1981. 164 pages multisector. economywide planning
models with particular emphasis on(including appendi, glossary, issues of trade, distribution, growth,bibliography). and structural change. TheoreticalLC 75-40228. ISBN 0-8018-1818-4, discussion of the properties of$6.50 (2. 75) paperback. multisector, appiled general
equilibrium models is combined withFrench: Analyse economique numerical applications to particulardes projets. Economica, 1977; 2nd countries and problems. The modelsprinting, 1981. considered range from input-outputISBN 2-7178-0014-X, 29 francs. and linear programming to the more
recent nonlinear computable generalequilibrium (CGE) models. Theauthors consider how these modeis
can be used to analyze questions of Human Resource Develop- Phae 1: A System of Inter-growth and structural change. the ment and Economic Growth n onal Comparisons ofselecdon of foreign exchange regime. In Developing Countries: A Gross Product andand the Impact of alternative develop-ment strategies on the distribution of Simultaneous Model Purct asing PowerIncome. The empirical applications David Wheeler Irving B. Kravis,are based both on cross-country World Bank Staf Working fpar No. Zoltan Kenessey, Alan Hleston,analysIs and on the experience of par- 40.Jl 18-3 paes icuig adRbr u mrticular countries and demonstrate 407 July 1980.130pages (Including an oeresue rshow such models provide a useful 8 appendixes, biblography). Establishes the methodology and pre-framework for policy analysis. Particu- Stock lo. WP-0407. $5.00. sents comparisons of gross domesticlar attention is focused on the product per capita and currencyproblems of planning and policy for- purchasing power for ten countries Inmulation in mixed-market economies 1970 and six of the same countriesand on the nature of models required NEW In 1967.to capture the Important mechanisms The Johns 11opkins Unioersity Press,that constrain policy markets. Incorporating Uncertainty 1975. 306 pages (includingCambridge Uniuersity Prems 32 East Into Planning of Industrial- glossary, index).57th Street Nlew York, N1.Y. 10022. Ization Strategies for LC 73-19352. 15B11 0-8018-1606-8.1982. xvll + 526 pages. Developing Countries $27.50 (X16.50) hardcover,LC 81-12307. ISBNS 0-521-24490-0, Alexander H. Sarris and 15Bt 0-8018-1669-6, $8.95 (5.50)$42.50 hardcouer; ISBl 0-521-27030-8, Irma Adelman paperback.$17.95 paperback. This survey of existing literature on
planning under uncertainty focuseson issues of international trade and Phase 1l: Intamtonal CoM-
NYEW Investment allocation. Various ways of parsons of Real ProductIncorporating uncertainty Into target- and Purhasing Powver
The GlobalFi FratewoIk planning models are discussed and Irving B. Kravis, Alan Heston,The GloM Fmmework.,proposals for possible empirical and Robert SummersAn Update applications are outined.Brian Nolan World Bank Staff Working Paper Plo. Updates Phase I and adds six newWorl Ban Staf WokingPape No. countries, comparing the flgures forThis paper presents the methodologi- 503. January 1982. 58 pages (ircluding the sixteen countries for the yearscal background to the Global Model- appendfx. references). 1970 and 1973.ling Framework used In the WorldDevelopment Report exercises of the Stock llo. WP-0503. $3.00. The Johns Hopkins Uniuersity Press,World Bank. It gives an overall view of 1978. 274 pages (includingthis framework and discusses In l fndex'some detail the data base supporting Interdependence In giossary. nd).the global analysis and the methods Planning: Multilevel LC 77-17251. ISBII 0-8018-2019- 7,of reconciling data from various Programming Studies of the $25.00 (415.00) hardcover; ISBNsources. Ivory Coast 0-8018-2020-0, $8.50 (f5.00)World Bank Staff Working Paper Louis M. Goreux paperback.rio. 533.1982. 58 pages. Provides a system for analyzing eachISBN5 0-8213-0047-4. $3.00. component of a country's economy Phase III: World Product and
Independently and relates the interde- Income: International Com-pendencues between the components. parisons of Real GDP
Human FacitorsrIn The Johns Hopkins University Press, Irving B. Kravis, Alan Heston,Project Work 1977. 448 pages (including bibliogra- and Robert SummersHei Perrett phy, index)and Francis J. Lethem py ' This report restates and extends theLC 77-4793. 15BN 0-8018-2001-4. methodology set out in the flrst twoWorld Bank Staff Working Paper {to. $27.00 (I16.20) hardcover; volumes. Particular attention is given397. June 1980. 85 pages (including 15B1N 0-8018-2006-5, $9.95 to the problem of comparing services3 annexes, 5 charts, bibliography). (X6.00) paperback. and to the conlicting demands ofStock Yo. WP-039 7. $3.00. parisons are given of prices, real per
The International capita quantities, and flnal expendi-Comparlson Project ture components of GDP for thirty-
four countries for 1975. By reiatingThree volumes that establish aworldwide system of internationalcomparisons of real product and ofthe purchasing power of currencies.
the results to certain widely available A Model of an Agricultural used to estimate the projects effectsnaUonal Income accounUng data and Household: Theory and on key national variables, thus per-reiated variables, the authors develop Evidence mitting a full social cost-benefitextrapolating equations to estmate encr analysis of the project.per capita GDP for the thirty-four THoward e. Barnum Th Johns Hopkins UniuersIty Pess.countrIes for 1.950 to 1978. In addi- and Lyn Squire192 3pae(icuIgmsantion, the 1975 distribution of world Innovative model of short-run lndandproduct by region and per capita behavior that combines productonIncome class Is estimated. The and consumption decisions In a LC 81-48173. 15BI( 0-8018-2802-3,1975 results confirn relations theomtically consistent fashion for an S30.00 hardcover.between both quantities and prices agricultural household.and per capita income found In theearlier volumes. The Johns Hopkins UnIuersity Prs, Rediotribution with GrowthThe Johns Hopkins UnIuersity Press, 1980. xi + 107 pages (Including Haolis Chenery,1982. 398 pages. appendx references).MontekS AhluwalLC 81-15569. ISB1N 0-8018-2359-5, LC 78-21397. ISBN1 0-8018-2225-4, Clive Bell John H. Duloy,$35.00 hardcouer; ISBN1 0-8018-2360-9, $6.95 (04.75) paperback. and Richard Jolly$15.00 paperback. Describes existing Inequality In
The Polltical Economy of incomes In developing countries andLandsat Index Atlas of the Specalized Farm Credit proposes a reorientation of develop-
Developing Countries Institutions in Low-Income ment policy to achieve more equitableDf the Worid Countries distribution.Fourteen four-color maps, applica- J. D. Von Pischke, Oxford University Pss. 1974; 4thtons of Loandsat lmagery reading and Peter J. ileffeman, and printing, 1981. 324 pages (includinguses of the Index maps, and pro- Dale W. Adams annex, bibliography).cedure for securing Imagery. ISBNt 0-19-920070-X, $9.95 (15.00)World Bank Staff Working Paper (1o. paperback.The Johns Hopkins UnIversity Press, 446. April 1981. Ill + 99 pages.1976.17 pages, 1312" x 21", spiral Stock No. WP-0446. $5.00. french: Redistribution et croissance.bound. P'esses Universitaires de France, 108,LC 76-46190. ISBN1 0-8018-1923-7, bouleuard Salnt-Germaln, 75006 Paris,$12.00 (1725) paperback. MEW France, 1977.
ISBN1 22403102, 5820 francs.Methodologies for Measur. Project Evaluation in Spanish: Redlstribucl6n con creci-ing Agricultural Price Regional Perspective: A miento. Editorlal Tecnos, 1976.Intervention Effects Study of an Irrigation ISBNl 84-309-0624-X, 880 pesetas.Project In N4orthwestPasquale L. Scandizzo Malaysiaand Colin Bruce Clive Bell, Peter Hlazell, andWorld Bank Staff Working Paper tNo. Roger Slade394. June 1980: x + 96 pages This Innovative study develops quan-(Including 4 appendixes, references). titative methods for measuring theStock (1o. WP-0394. $5.00. direct and Indirect effects of
agricultural projects on their sur-rounding regional and nationaleconomies. These methods are thenapplied to a study of the Muda Irriga-tion project in northwest Malaysia. Alinear programming model is used toanalyze how a project changes thefarm economy, and a social account-Ing matrix of the regional economy Isthen estimated. This provides thebasis for a semi-input-output modeLwhich Is used to estimate the Indirecteffects of the project on Its reglon.Thereafter, a similar methodology is
Risk Analysis in Techniques for Project WRIrNsProject Apprai"sa Appraial under Uncertainty The Meaning of Technological Mastery
LusY. PuqenShlomo Reutlinger In Relation to Tmaasfer of TechnoloLouisY Pouliquen Slm etnerCarl J.Dahiaun and Larry r. westpaDiscusses methodological problems Presents a method of evaluating risk World Bank Reprmnt Serrs: Eumber 217.and the usefulness of simulation; In Investment projects and means for Reprinted m Annals of the AmNrican Acad myIllustrated by three case studies. using quantitative measures of risk in of Political and Social Science. wol. 458 (tlouem-
The Johns Hopkins University Press5 decisionmaking. ber 1981).12-26.1970; 4th printing, 1979. 90 pages. The Johns Hopkins University Press, Stock (1o. RP-0217. free of charge.LC 79-12739. ISBI5 0-8018-1155-4. 1970; 4th printing, 1979.108 pages$5.50 (£3.25) paperback. (including annex, bibliography). The Model of an Agricultural
LC 74-94827. ISBN1 0-8018-1154-6 llousehold In a Multl-Crop EcononoiFrench: L'appreciation du risque dans S5.9S (S.50) paperback. The Came of KoreaIevaiuation des projets. Dunod Editeur, Choonrg Yong Ahn. lnderjit Slngh,. and24-26, bouleuard de '116pltal, 75005 Lyn SquireParls, France, 1972. World Bank Reprint SEries: Number 222.What Is a SAM? A Layman's Reprinted ftom The Review of Economics and21 francs. Guide to Social Accounting Statistics, uol. 63. no. 4 (Nlovember 1981:520-25.
Matrices Stock Nio. RP-0222. Free of charge.
Shadow Prices for Project Benjamin B. King The Relevance of the Dual EconomyAppraisal In Turkey World Bank Staff Working Paper No. Model: A Case Study of ThalandAfsaneh Mashayekhi 463. June 1981. 59 pages (including Trent Bertrand and Lyn SquireWorld Bank Staff Working Paper No. references). World Bank ReprlntI Series: Nfumber 219.World ~~~~~~~~~~~~~~~~~~~~~~~~Reprinted from Oxford Economic Papers, uol. .52392. May 1980. 57 pages. Stock No. WP-0463. $3.00. (1980):480-5L.Stock No. WP-0392. $3.00. Stock /Yo. RP-0219. free of charge.
Social Cost-Beneflt Analysis:A Guide for Country andProject Economists to theDerivation and Applicationof Economic and SocialAccounting PricesColin BruceWorld Bank Staff Working Paper llo.239. August 1976. ii, iil + 143 pages(including 6 annexes).Stock No. WP-0239. $5.00.
WORLD BANK PUBUCATIONSORDER FORM
SEND TO:WORLD BANK PUBLICATIONS WORLD BANK PUBUCATIONSP.O. BOX 37525 or 66, AVENUE D'IENAWASHINGTON, D.C. 20013 75116 PARIS, FRANCEU.S.A.
Name:
Address:
Stock or ISBN # Author, Title Qty. Price Total
Sub-Total Cost:______
Postage & handling fee for more than two free items ($1.00 each):
Total copies: _____ Air mail surcharge ($2.00 each):
TTAL PAYMENT ENCLOSED:
Make checks payable: WORLD BANK PUBLICATIONS
Prepayment on orders from individuals is requested. Purchase orders are accepted from booksellers, library suppliers, libraries, and institutions.All prices include cost of postage by the least expensive means. The prices and publication dates quoted in this Catalog are subject to changewithout notice.
No refunds will be given for items that cannot be filled. Credit will be applied towards future orders.No more than two free publications will be provided without charge. Requests for additional copies will be filled at a charge of US 51.00 per
copy to cover handling and postage costs.Airmail delivery will require a prepayment of US f2.00 per copy.Mall-order payment to the World Bank need not be in U.S. dollars, but the amount remitted must be at the rate of exchange on the day the
order is placed. The World Bank will also accept Unesco coupons.


The World Bank
Headquarters * European Office Tokyo Office U1818 H Street, N.W. 66, avenue d'I6na Kokusai Building,Washington, D.C. 20433, U.S.A. 75116 Paris, France 1-1 Marunpuchi 3.chorneTelephone: (202) 477-1234 Telephone: (1) 723-54.21 Chiyoda-ku, Tokyo 100 JapanTelex: WUI 64145 WORLDBANK Telex: 842-620628 Telephone: (03) 214-5001
RCA 248423 WORLDBK Telex: 781-26838Cable Address: INTBAFRAD
WASHINGTONDC
ISSN 0253-2115/ISBN 0-8213-0244-2