Embed Size (px)
Citation preview

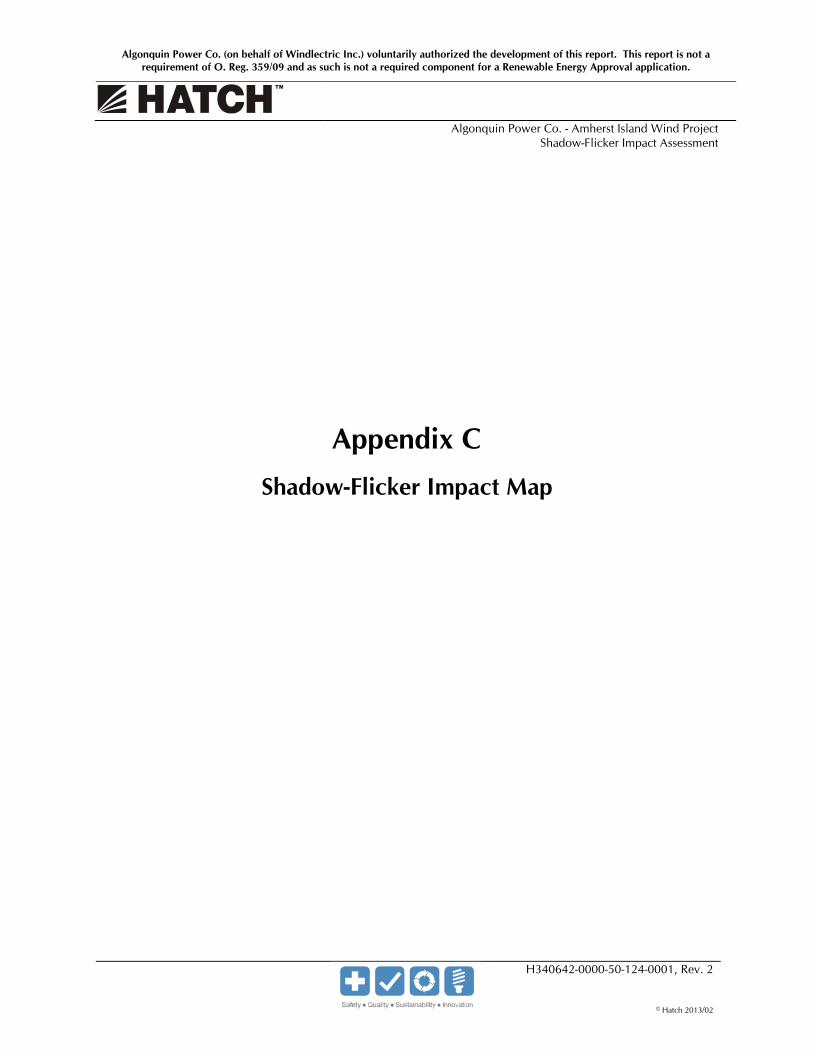
Algonquin Power Co. (on behalf of Windlectric Inc.) voluntarily authorized the development of this report. This report is not a requirement of O. Reg. 359/09 and as such is not a required component for a Renewable Energy Approval application.
Algonquin Power Co.
Shadow Flicker Impact Assessment
For
Amherst Island Wind Project
H340642-0000-50-124-0001 Rev. 2
February 26, 2013
Algonquin Power Co. (on behalf of Windlectric Inc.) voluntarily authorized the development of this report. This report is not a requirement of O. Reg. 359/09 and as such is not a required component for a Renewable Energy Approval application.
Algonquin Power Co. - Amherst Island Wind Project Shadow-Flicker Impact Assessment
H340642-0000-50-124-0001, Rev. 2 Page i
© Hatch 2013/02
Project Report
February 26, 2013
Algonquin Power Co.
Amherst Island Wind Project
DISTRIBUTION Homer Lensink – Algonquin Power
Alex Tsopelas – Algonquin Power Sean Fairfield – Algonquin Power Rick Harrop – Algonquin Power Bob Ilett – Hatch Ltd. Joaquin Moran – Hatch Ltd.
Shadow-Flicker Impact Assessment
Feb 26/2013 2 Approved
J. Moran
R. Ilett
A. Tsopelas
Date Rev. Status Prepared By Checked By Approved By
Client

Algonquin Power Co. (on behalf of Windlectric Inc.) voluntarily authorized the development of this report. This report is not a requirement of O. Reg. 359/09 and as such is not a required component for a Renewable Energy Approval application.
Algonquin Power Co. - Amherst Island Wind Project Shadow-Flicker Impact Assessment
H340642-0000-50-124-0001, Rev. 2 Page i
© Hatch 2013/02
Table of Contents
1. Introduction ............................................................................................................................................ 1
2. Shadow Modeling .................................................................................................................................... 1
2.1 Model Description ......................................................................................................................... 1 2.2 SHADOW – The Shadow-Flicker Module ...................................................................................... 1 2.3 Model Setup and Calculation Procedure ........................................................................................ 1 2.4 Shadow-Flicker Guidelines and Model Assumptions ...................................................................... 3
3. Shadow Flicker Impact Results ................................................................................................................ 4
3.1 Astronomical Shadow – Worst Case Scenario ................................................................................ 4 3.2 Meteorological Probable Shadow – Real Case ................................................................................ 4
4. Summary ................................................................................................................................................. 5
5. References ............................................................................................................................................... 5
List of Tables Table 1: Sunshine Statistics – Kingston A (WMO ID 71620) .......................................................................... 5
List of Figures Figure 1: Schematic Diagram of Shadow Cast from a Wind Turbine on a Receptor ........................................ 2 Appendix A Wind Turbine Layout and Shadow Reports Appendix B Shadow Flicker Impact Results Appendix C Shadow Flicker Impact Map Appendix D Summary of Wind Data – Meteorological Shadow

Algonquin Power Co. (on behalf of Windlectric Inc.) voluntarily authorized the development of this report. This report is not a requirement of O. Reg. 359/09 and as such is not a required component for a Renewable Energy Approval application.
Algonquin Power Co. - Amherst Island Wind Project Shadow-Flicker Impact Assessment
H340642-0000-50-124-0001, Rev. 2 Page ii
© Hatch 2013/02
Report Disclaimer
This report has been prepared by Hatch Ltd. (Hatch) for the sole and exclusive use of Algonquin Power Co. (the “Client”) for the purpose of assisting the management of the Client in making decisions with respect to the Amherst Island Wind Project, and shall not be (a) used for any other purpose, or (b) provided to, relied upon or used by any third party.
This report contains opinions, conclusions and recommendations made by Hatch, using its professional judgment and reasonable care. Use of or reliance upon this report by Client is subject to the following conditions:
(a) the report being read in the context of and subject to the terms of the agreement between Hatch and the Client dated January 20, 2012 (the “Agreement”), including any methodologies, procedures, techniques, assumptions and other relevant terms or conditions that were specified or agreed therein;
(b) the report being read as a whole, with sections or parts hereof read or relied upon in context;
(c) the conditions of the site may change over time or may have already changed due to natural forces or human intervention, and Hatch takes no responsibility for the impact that such changes may have on the accuracy or validity or the observations, conclusions and recommendations set out in this report; and
(d) the report is based on information made available to Hatch by the Client or by certain third parties (Siemens, Land Information Ontario, LIO), including publicly available information; and unless stated otherwise in the Agreement, Hatch has not verified the accuracy, completeness or validity of such information, makes no representation regarding its accuracy and hereby disclaims any liability in connection therewith.
Algonquin Power Co. (on behalf of Windlectric Inc.) voluntarily authorized the development of this report. This report is not a requirement of O. Reg. 359/09 and as such is not a required component for a Renewable Energy Approval application.
Algonquin Power Co. - Amherst Island Wind Project Shadow-Flicker Impact Assessment
H340642-0000-50-124-0001, Rev. 2 Page 1
© Hatch 2013/02
1. Introduction Hatch was retained by Algonquin Power Co. (Algonquin) to carry out a shadow-flicker impact assessment for the 75-MW Amherst Island Wind Project. This memorandum presents a description of the methodology used and results obtained in the assessment of the project, located in the Loyalist Township, Ontario. Algonquin Power Co. (on behalf of Windlectric Inc.) voluntarily authorized the development of this report. This report is not a requirement of O. Reg. 359/09 and as such is not a required component for a Renewable Energy Approval application.
The project consists of thirty six (36) wind turbine generators. The turbines will be manufactured by Siemens, and will correspond to model SWT 2.3-113. The rated capacity of the turbines is 2.3 MW, with a rotor diameter of 113 m, located at 99.5 m above ground level.
2. Shadow Modeling 2.1 Model Description
WindPRO, a commercial software developed by EMD International A/S (EMD) (www.emd.dk) was used to determine the shadow-flicker impact on receptors surrounding and within the wind farm boundaries. WindPRO is a fully integrated modular software package that is recognized and accepted worldwide by developers, planners, utilities and wind turbine manufacturers. The model is widely used for design and planning of large wind farms.
2.2 SHADOW – The Shadow-Flicker Module SHADOW is the WindPRO calculation module that estimates how often and in which intervals a specific neighbour or area will be affected by shadows generated by one or more wind turbines. These calculations are usually worst-case scenarios (astronomical maximum shadow, e.g., calculations which are solely based on the positions of the sun relative to the wind turbine). Shadow impact may occur when the blades of a wind turbine pass through the sun’s rays as seen from a specific position (e.g., a window in an adjacent settlement). If the weather is overcast or calm, or if the wind direction forces the rotor plane of the wind turbine to stand parallel with the line between the sun and the neighbour, the wind turbine will not produce shadow flicker, but the impact will still appear in the calculations. The calculation of the worst-case scenario represents the maximum potential risk of shadow impact.
Apart from calculating the potential shadow impact at a given location, Hatch has created maps rendering the isolines of the shadow impact (see Appendices C and D). The maps show the areas where shadow impact is expected to be higher than the suggested guidelines.
2.3 Model Setup and Calculation Procedure For the shadow-flicker calculations, the model utilizes the position of the sun relative to the wind turbine rotor disk, and the resulting shadow is calculated in steps of 1 minute throughout a complete year. If the shadow of the rotor disk (which in the calculation is assumed solid) at any time casts a shadow reflection on a shadow receptor object, then this step will be registered as 1 minute of potential shadow impact (see Figure 1). A shadow receptor object is defined as a window with a certain orientation and dimensions.
Algonquin Power Co. (on behalf of Windlectric Inc.) voluntarily authorized the development of this report. This report is not a requirement of O. Reg. 359/09 and as such is not a required component for a Renewable Energy Approval application.
Algonquin Power Co. - Amherst Island Wind Project Shadow-Flicker Impact Assessment
H340642-0000-50-124-0001, Rev. 2 Page 2
© Hatch 2013/02
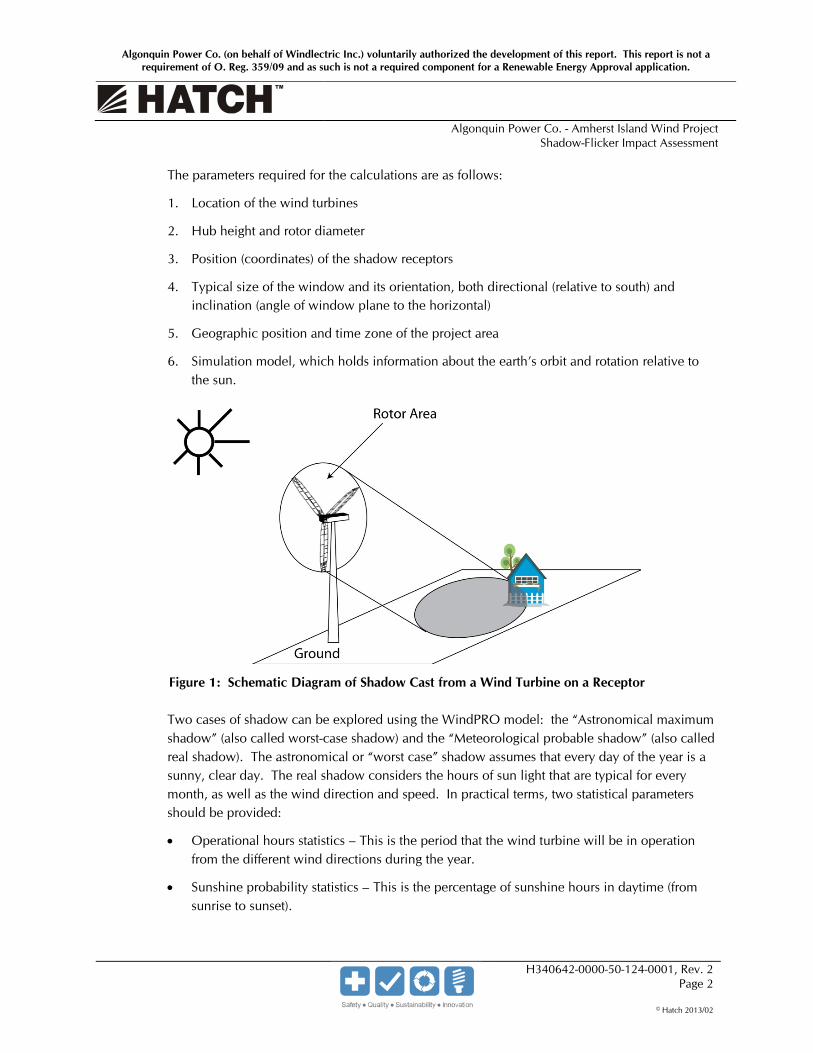
The parameters required for the calculations are as follows:
1. Location of the wind turbines
2. Hub height and rotor diameter
3. Position (coordinates) of the shadow receptors
4. Typical size of the window and its orientation, both directional (relative to south) and inclination (angle of window plane to the horizontal)
5. Geographic position and time zone of the project area
6. Simulation model, which holds information about the earth’s orbit and rotation relative to the sun.
Figure 1 : Schematic Diagram of Shadow Cast from a Wind Turbine on a Receptor
Two cases of shadow can be explored using the WindPRO model: the “Astronomical maximum shadow” (also called worst-case shadow) and the “Meteorological probable shadow” (also called real shadow). The astronomical or “worst case” shadow assumes that every day of the year is a sunny, clear day. The real shadow considers the hours of sun light that are typical for every month, as well as the wind direction and speed. In practical terms, two statistical parameters should be provided:
• Operational hours statistics – This is the period that the wind turbine will be in operation from the different wind directions during the year.
• Sunshine probability statistics – This is the percentage of sunshine hours in daytime (from sunrise to sunset).
Algonquin Power Co. (on behalf of Windlectric Inc.) voluntarily authorized the development of this report. This report is not a requirement of O. Reg. 359/09 and as such is not a required component for a Renewable Energy Approval application.
Algonquin Power Co. - Amherst Island Wind Project Shadow-Flicker Impact Assessment
H340642-0000-50-124-0001, Rev. 2 Page 3
© Hatch 2013/02
For this project, the primary inputs consisted of a digital elevation model that spans the entire area of interest and the locations of shadow receptors and wind turbine generators. The contours were provided by Land Information Ontario (LIO) in 2011. For the estimation of the real shadow, the wind speed data has been gathered using three meteorological masts installed on the island from 2005 to 2008. The wind data is required to determine the time periods where the turbine is moving and the position of the rotor plane relative to the receptors. If the turbine is not moving, no shadow flicker is produced.
The location of receptors and wind turbine generators is shown in Figure A.1, Appendix A. The total number of receptors considered is 427, and their location was based on the existing noise receptors associated to the Amherst Island Wind Project.
2.4 Shadow-Flicker Guidelines and Model Assumptions At present, only Germany has detailed guidelines on limits and conditions for calculating shadow impact [Ref 1]. Denmark and Sweden have some guidelines, but they are for practical purposes only. According to the German guidelines, the limit of the shadow is set by two factors:
1. The angle of the sun over the horizon must be at least 3 degrees.
2. The blade of the wind turbine must cover at least 20% of the sun.
The maximum shadow impact on a neighbour from a wind farm according to the German guidelines should be:
• maximum 30 h/yr of astronomical maximum shadow (worst case)
• maximum 30 minutes worst day of astronomical maximum shadow (worst case).
Demark and Sweden suggest a threshold of 10 and 8 h/yr respectively if the sunshine statistics or cloud cover index are included in the shadow calculations. In this case, the SHADOW module of WindPRO was used to determine the time intervals (maximum hours per year and minutes per day) in which the presence of the wind turbines could cast shadows over nearby receptors based on the German guidelines. The assumptions used for the shadow modelling were:
1. Wind turbines are Siemens SWT-2.3, with a rotor diameter of 113 m and hub height of 99.5 m
2. The shadow flicker receptors locations are based on existing potential receptors on the island
3. Window at the receptor is assumed to be facing perpendicular to the wind turbines (worst case).
4. Window dimensions considered: 1 m x 1 m, at 1 m from the ground. The window was oriented at 90 degrees (normal vertical window)
5. Both cases (Astronomical shadow and Real Shadow) were calculated.

Algonquin Power Co. (on behalf of Windlectric Inc.) voluntarily authorized the development of this report. This report is not a requirement of O. Reg. 359/09 and as such is not a required component for a Renewable Energy Approval application.
Algonquin Power Co. - Amherst Island Wind Project Shadow-Flicker Impact Assessment
H340642-0000-50-124-0001, Rev. 2 Page 4
© Hatch 2013/02
3. Shadow Flicker Impact Results 3.1 Astronomical Shadow – Worst Case Scenario
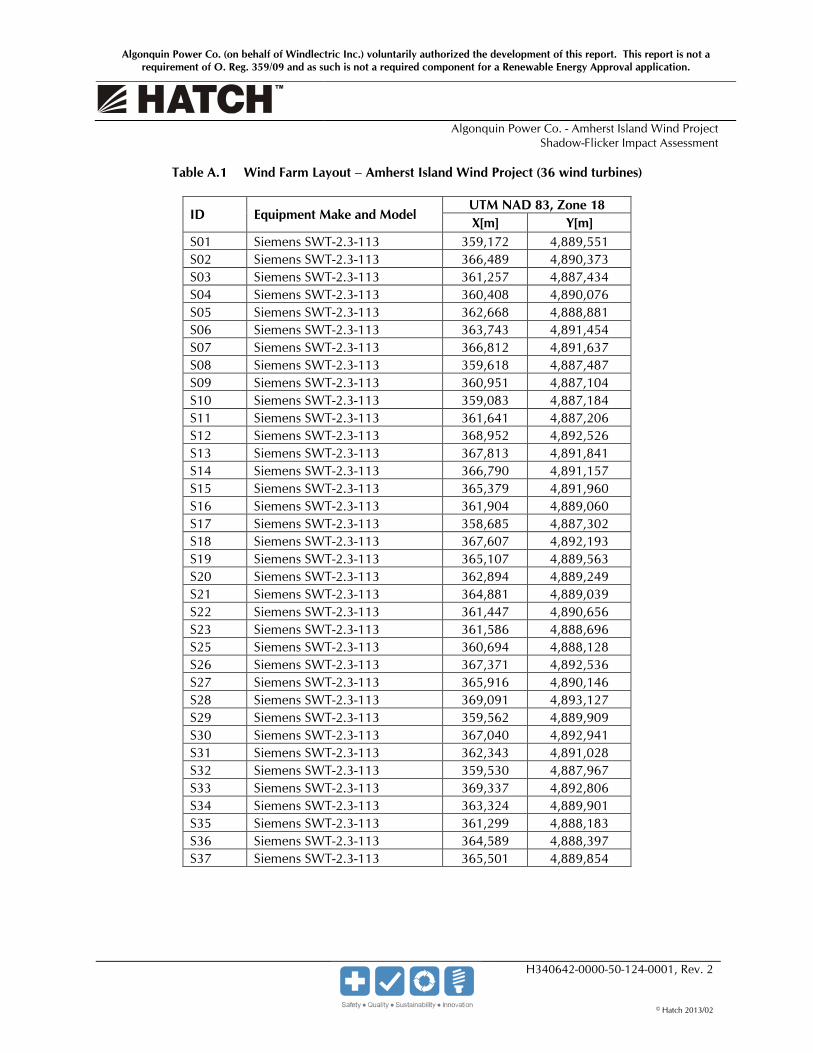
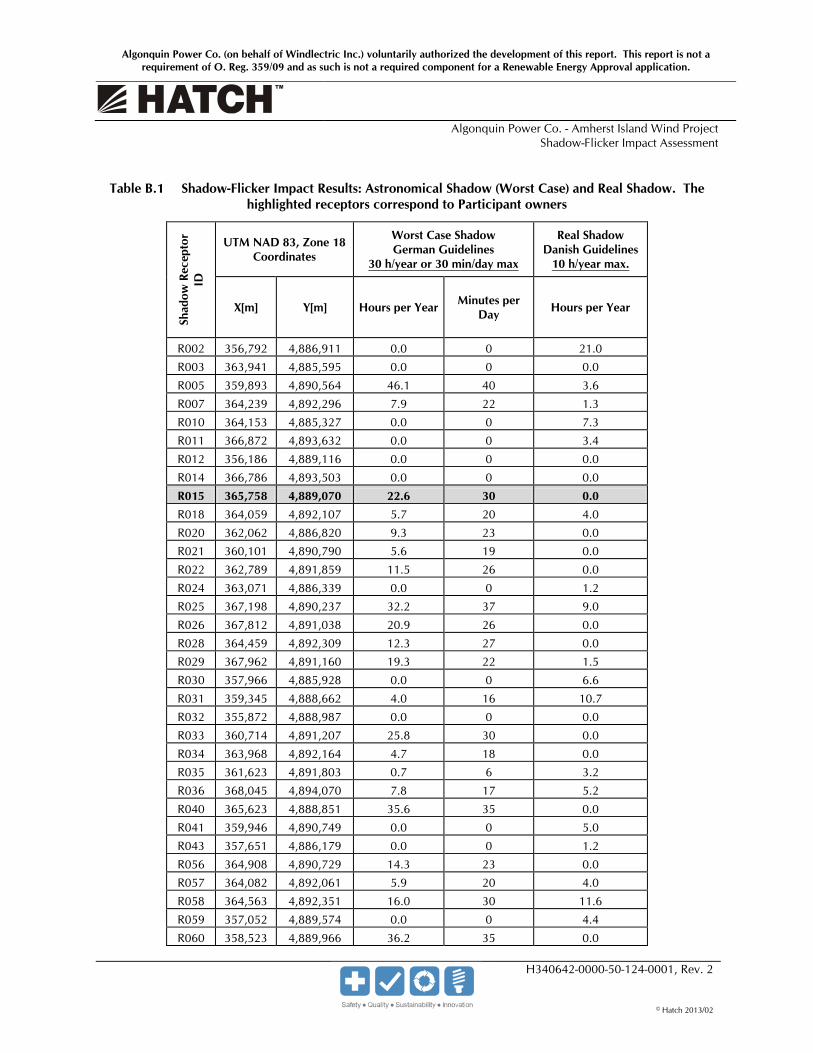
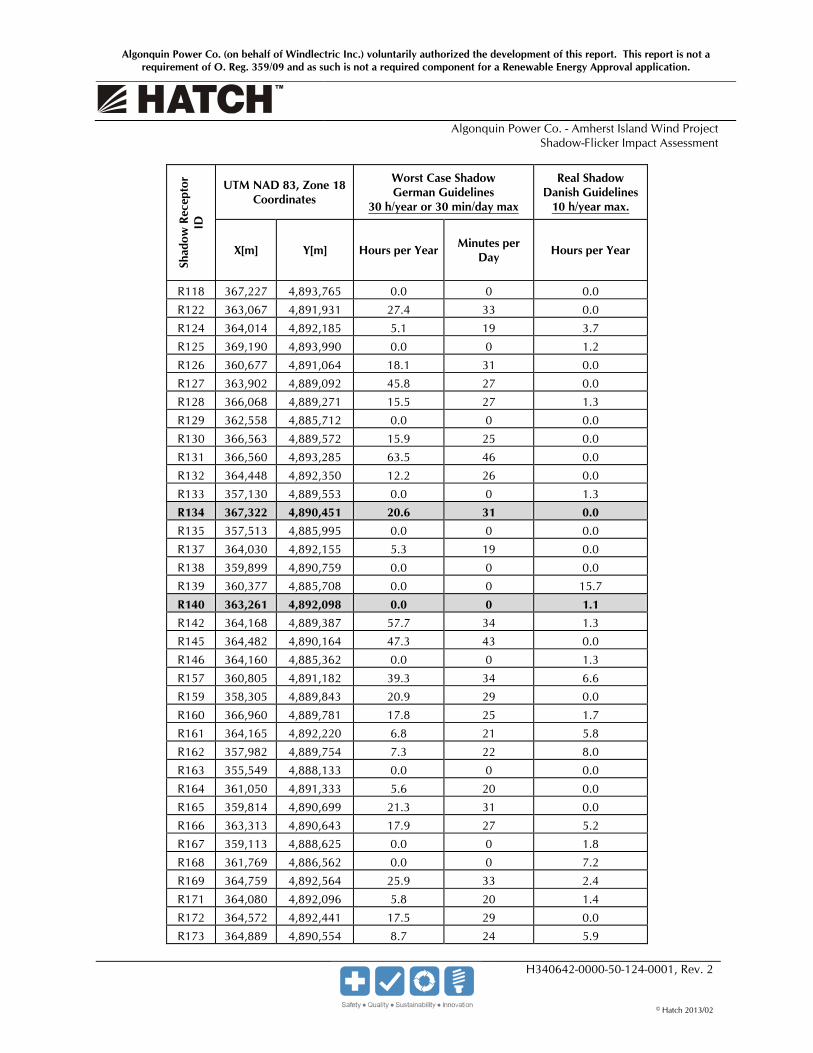
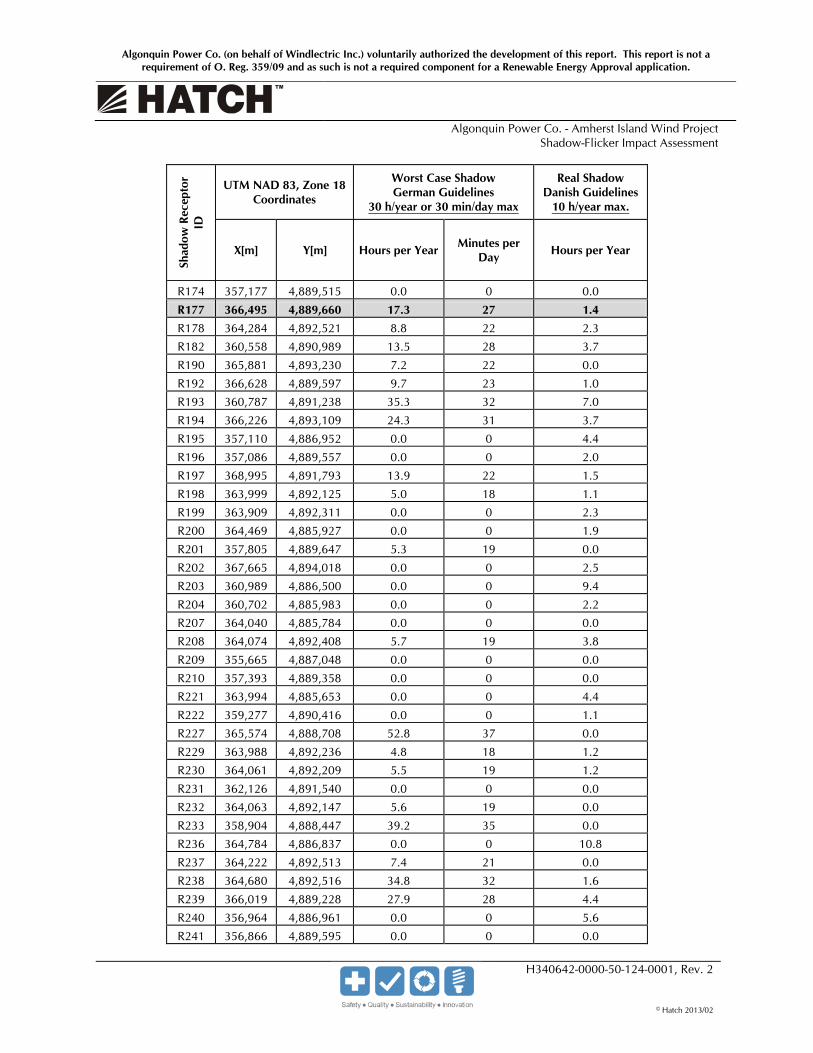
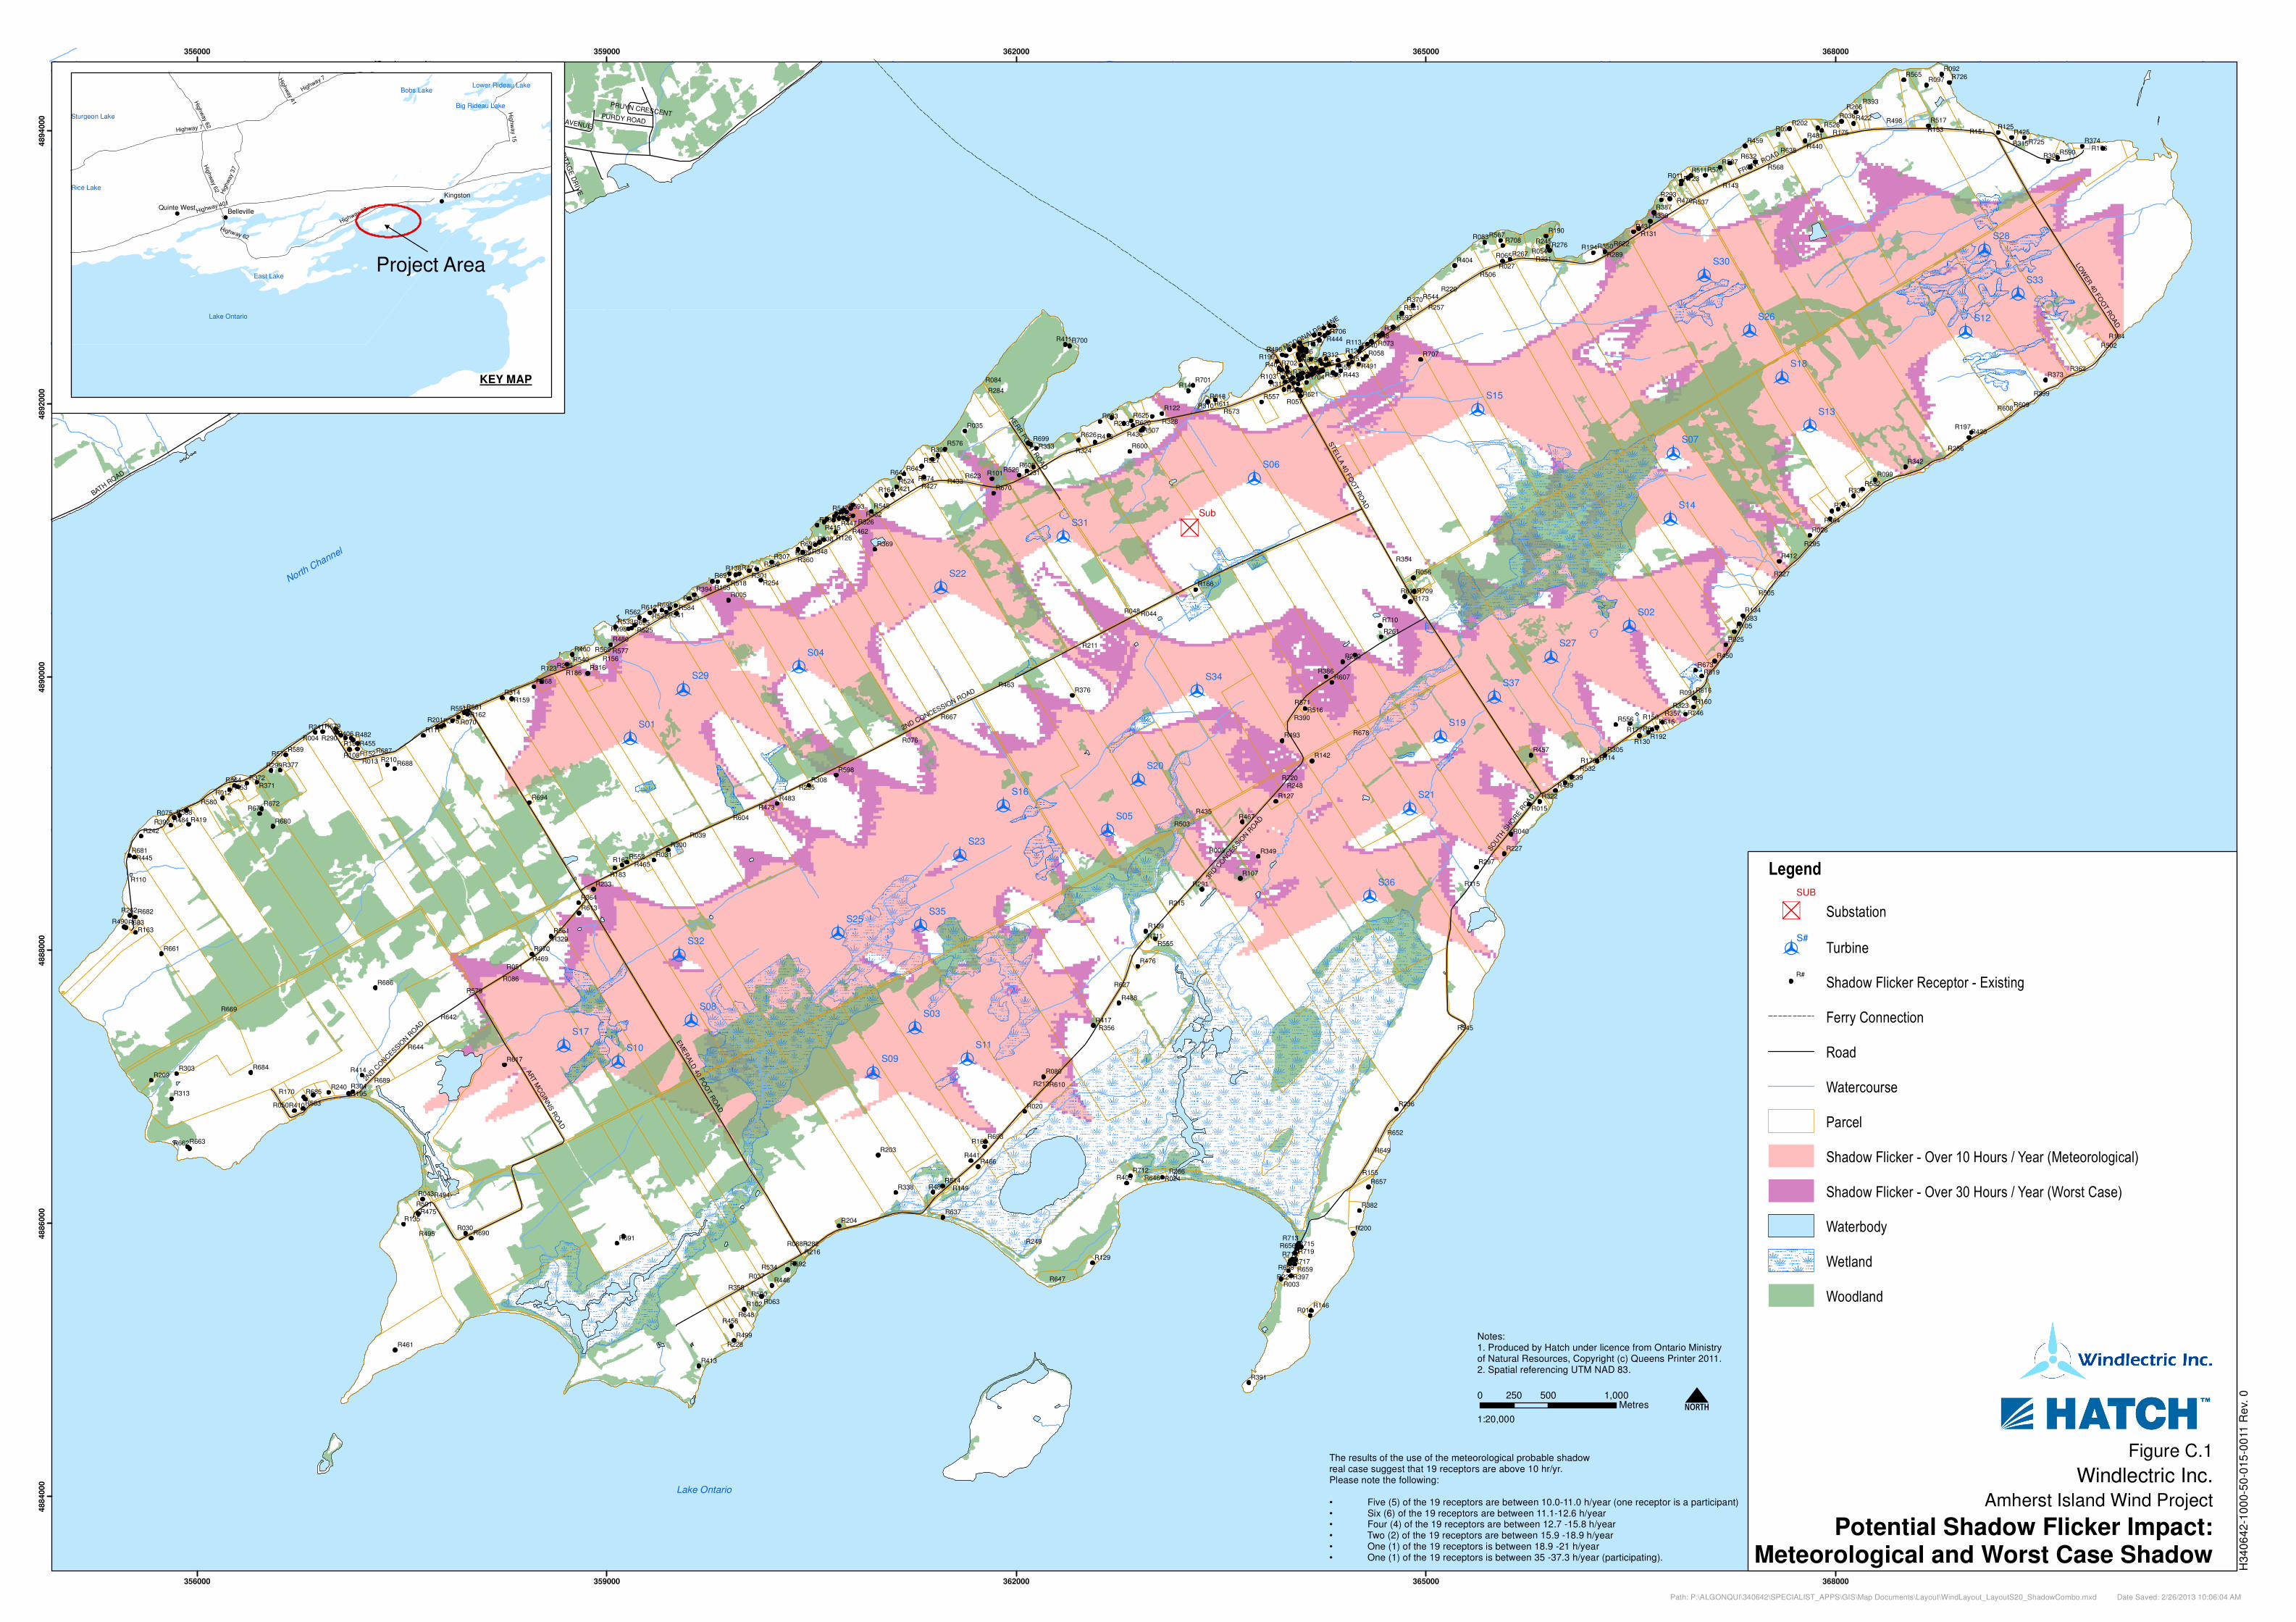
The shadow flicker results for each of the receptors are presented in Table B.1, Appendix B. For the worst case scenario, a total of 48 receptors are above the recommended hours-per-year (30 h/yr) and 60 exceed the shadow minutes-per-day. Most of the receptors that do not comply with the hours of shadow per year also exceed on a min/day basis (42). In addition to Table B.1, the shadow-flicker results from WindPRO can be presented as a shadow map (shown in Figure C.1, Appendix C). The shadow map allows for a quick qualitative observation of the shadow receptors, presenting the different levels of shadow flicker impact in hours/year.
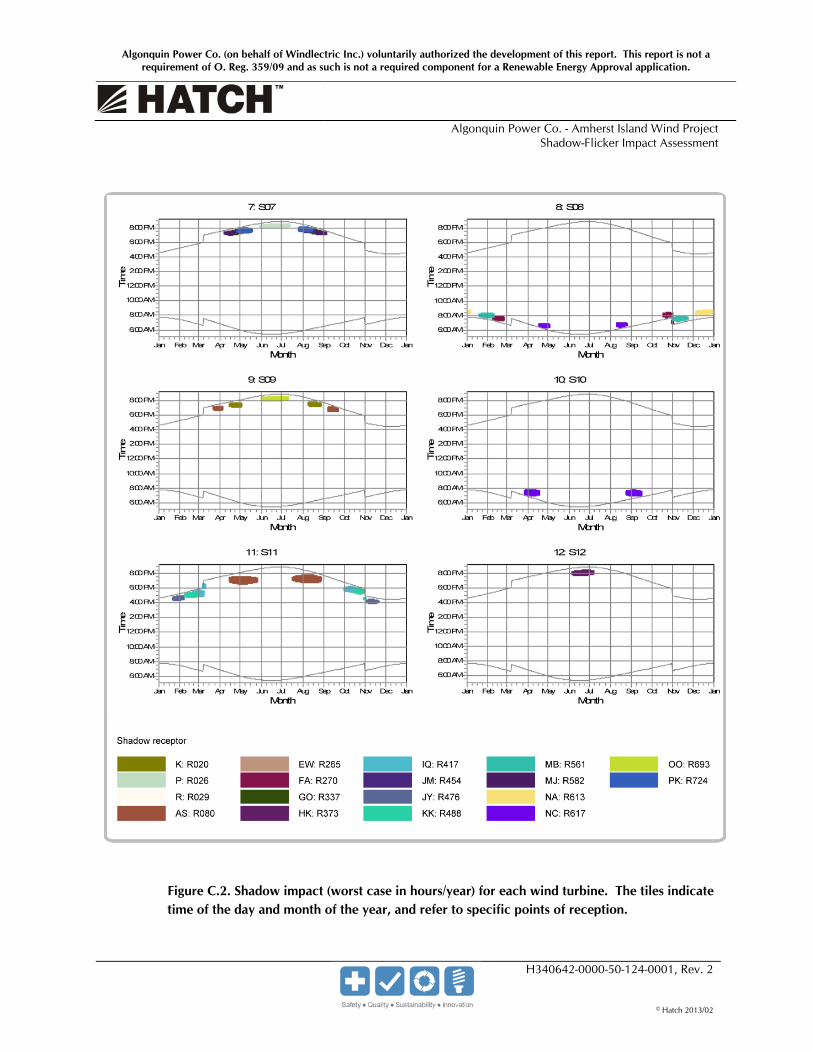
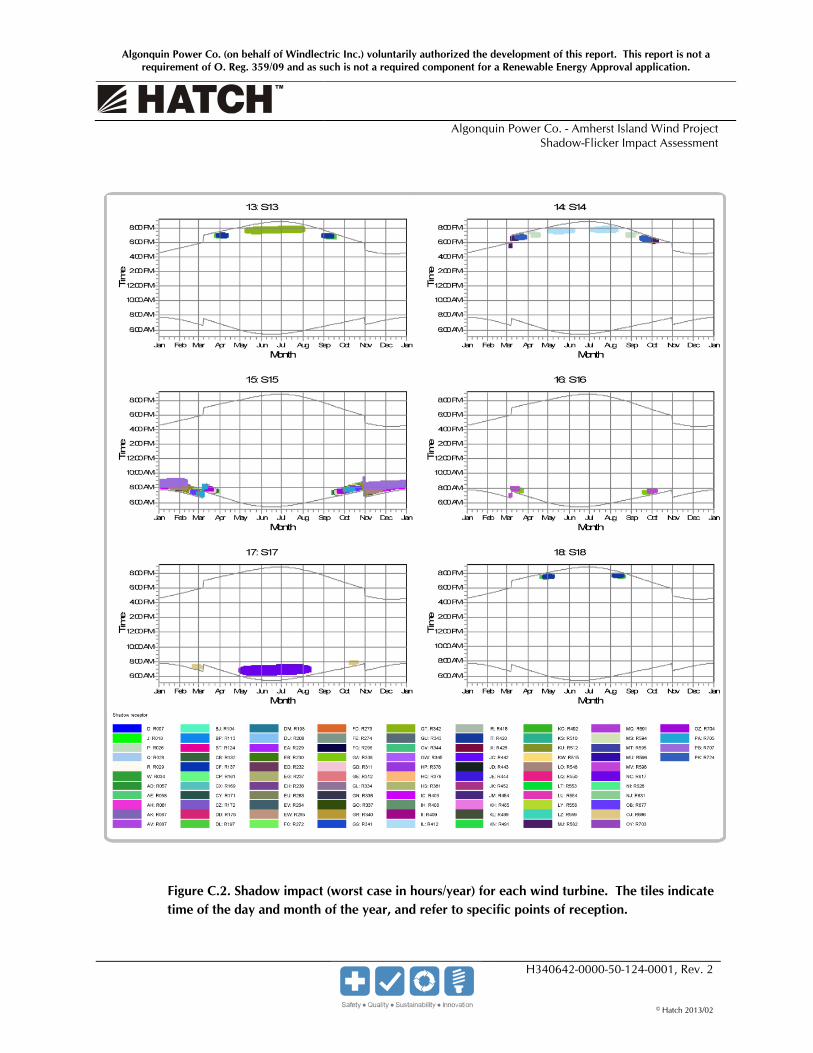
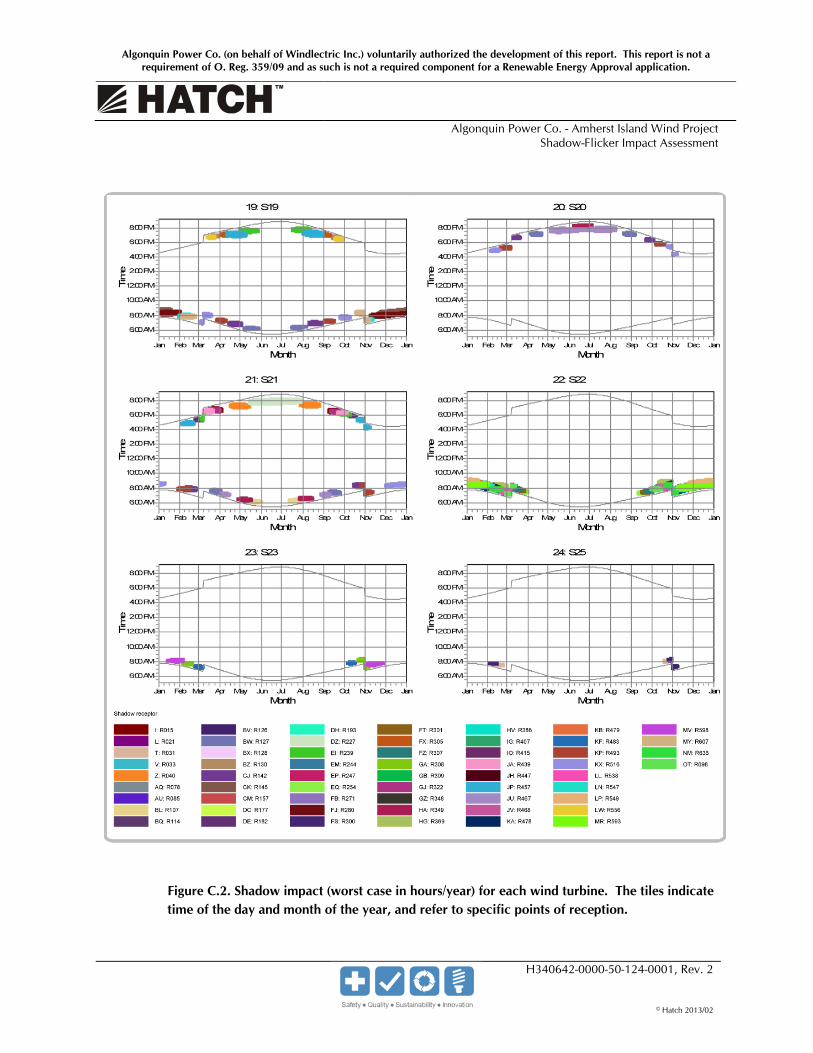
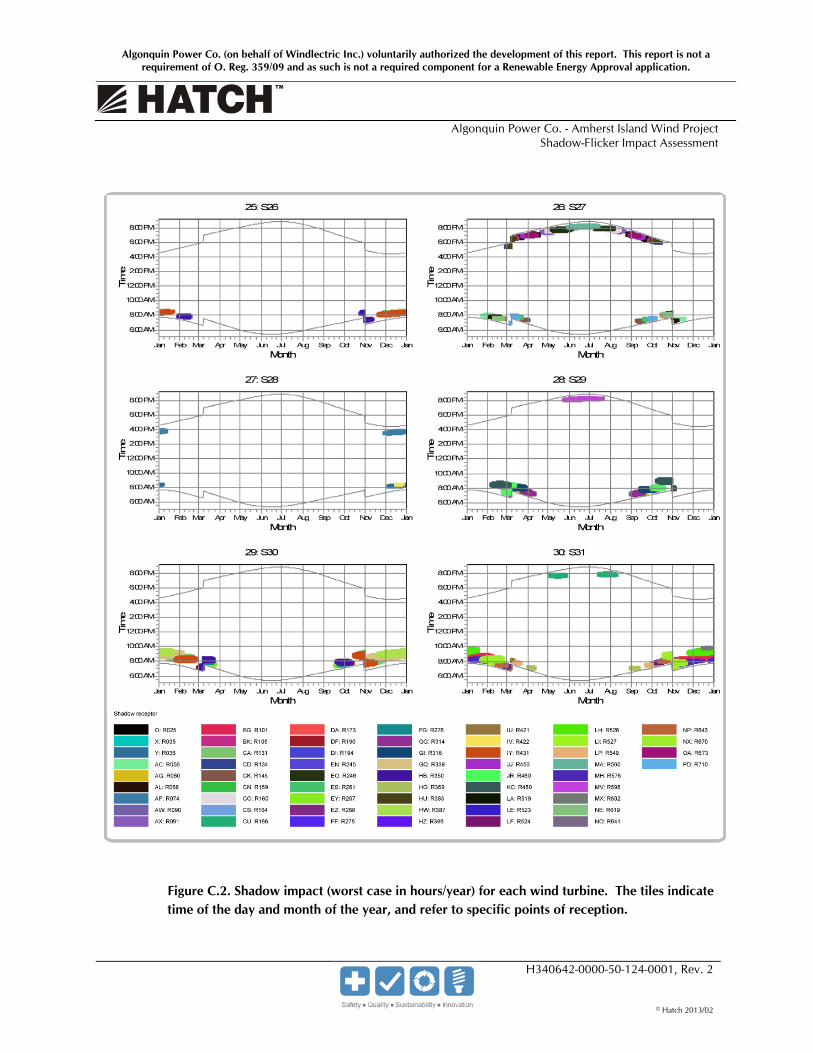
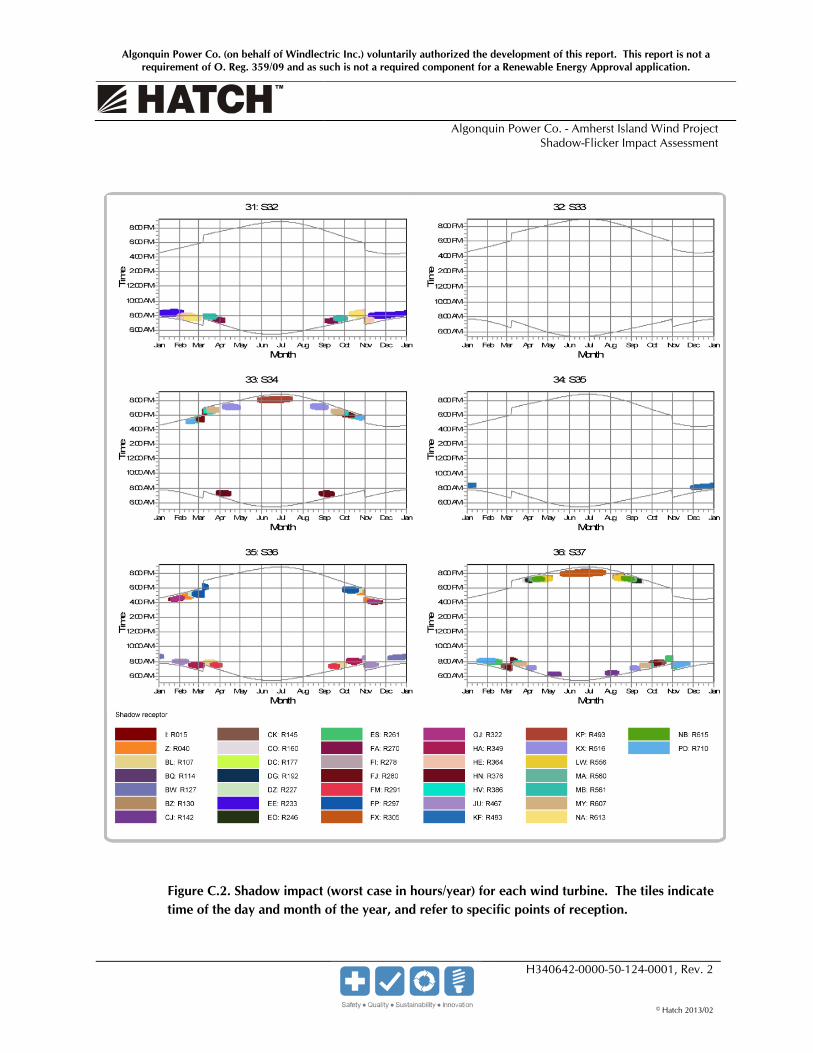
Figures C.2 present the “shadow flicker calendar” for the Amherst Island Wind Project, which indicates the approximate hours of the day and months of the year where the flicker impact from each turbine may potentially affect certain locations. These figures are for reference purposes and were derived based on the worst-case shadow scenario presented in Table B.1. It can be seen that shadows are potentially cast mostly during sunrise and sunset, when the sunlight is diffuse (rather than direct) and with lower intensity than in the middle of the day.
3.2 Meteorological Probable Shadow – Real Case In order to determine shadow-flicker impact on potential receptors, based on the Danish guidelines, the local meteorological conditions were taken into consideration. This method considers both the time where the wind is not blowing and the sky conditions above the project area. Since sunshine data was not available at the site, the sunshine statistics were taken from the Kingston A Weather Station (Climate Normals, 1971-2000), which is located less than 10 km away from the project site. Table 1 presents the sunshine statistics used in the calculations as a percentage of daylight hours. The wind speed frequency distribution and direction are shown in Appendix D.
Table B.1 shows the shadow flicker results for the meteorological shadow case. Based on the Danish guidelines (of 10 h/yr), the number of potentially affected receptors decreases from 48 to 19. This assessment can be further refined by describing more accurately the location and orientation of the windows. Note that the SHADOW module of WindPRO does not estimate the shadow minutes per day for the real shadow case, given that the sunshine statistics are recorded in a per month basis. The shadow map for the meteorological shadow case is shown in Figure C.1, Appendix C.

Algonquin Power Co. (on behalf of Windlectric Inc.) voluntarily authorized the development of this report. This report is not a requirement of O. Reg. 359/09 and as such is not a required component for a Renewable Energy Approval application.
Algonquin Power Co. - Amherst Island Wind Project Shadow-Flicker Impact Assessment
H340642-0000-50-124-0001, Rev. 2 Page 5
© Hatch 2013/02
Table 1: Sunshine Statistics – Kingston A (WMO ID 71620)
Month Total Hours of
Days with
% of Possible Jan 66 21.2 33.1
Feb 92 21.8 40.4 Mar 120 23.4 38.2 Apr 162 24.8 43.8 May 221 27.8 48.6 Jun 243 28.0 52.5 Jul 262 29.9 59.7 Aug 222 29.4 55.7 Sep 163 26.0 43.3 Oct 128 26.1 42.8 Nov 70 21.0 30.4 Dec 52 19.5 27.1
4. Summary Algonquin power Co. (on behalf of Windlectric Inc.) voluntarily authorized the development of this report. This report is not a requirement of O. Reg. 359/09 and as such is not a required component for a Renewable Energy Approval application. Hatch undertook the shadow flicker assessment using the two guidelines referenced in previous sections, however, the meteorological probable shadow methodology (using the sunshine statistics provide by Environment Canada) is the most practical. The results of the use of the meteorological probable shadow real case suggest that 19 receptors are above 10 hr/yr. Please note the following:
1. Five (5) of the 19 receptors are between 10.0-11.0 h/year (one receptor is a participant)
3. Five (6) of the 19 receptors are between 11.1-12.6 h/year
4. Four (4) of the 19 receptors are between 12.7 -15.8 h/year
5. Two (2) of the 19 receptors are between 15.9 -18.9 h/year
6. One (1) of the 19 receptors is between 18.9 -21 h/year
7. One (1) of the 19 receptors is between 35 -37.3 h/year (participating).
For the potential shadow receptors, the number of shadow hours per year could be further refined by defining the real window orientation and size for each case.
5. References [1] EMD International A/S. WindPRO 2.6 User Guide. Denmark, 2008.

Algonquin Power Co. (on behalf of Windlectric Inc.) voluntarily authorized the development of this report. This report is not a requirement of O. Reg. 359/09 and as such is not a required component for a Renewable Energy Approval application.
Algonquin Power Co. - Amherst Island Wind Project Shadow-Flicker Impact Assessment
H340642-0000-50-124-0001, Rev. 2
© Hatch 2013/02
Appendix A Wind Turbine Layout and Shadow Receptors
Algonquin Power Co. (on behalf of Windlectric Inc.) voluntarily authorized the development of this report. This report is not a requirement of O. Reg. 359/09 and as such is not a required component for a Renewable Energy Approval application.
Algonquin Power Co. - Amherst Island Wind Project Shadow-Flicker Impact Assessment
H340642-0000-50-124-0001, Rev. 2
© Hatch 2013/02
Table A.1 Wind Farm Layout – Amherst Island Wind Project (36 wind turbines)
ID Equipment Make and Model UTM NAD 83, Zone 18 X[m] Y[m]
S01 Siemens SWT-2.3-113 359,172 4,889,551 S02 Siemens SWT-2.3-113 366,489 4,890,373 S03 Siemens SWT-2.3-113 361,257 4,887,434 S04 Siemens SWT-2.3-113 360,408 4,890,076 S05 Siemens SWT-2.3-113 362,668 4,888,881 S06 Siemens SWT-2.3-113 363,743 4,891,454 S07 Siemens SWT-2.3-113 366,812 4,891,637 S08 Siemens SWT-2.3-113 359,618 4,887,487 S09 Siemens SWT-2.3-113 360,951 4,887,104 S10 Siemens SWT-2.3-113 359,083 4,887,184 S11 Siemens SWT-2.3-113 361,641 4,887,206 S12 Siemens SWT-2.3-113 368,952 4,892,526 S13 Siemens SWT-2.3-113 367,813 4,891,841 S14 Siemens SWT-2.3-113 366,790 4,891,157 S15 Siemens SWT-2.3-113 365,379 4,891,960 S16 Siemens SWT-2.3-113 361,904 4,889,060 S17 Siemens SWT-2.3-113 358,685 4,887,302 S18 Siemens SWT-2.3-113 367,607 4,892,193 S19 Siemens SWT-2.3-113 365,107 4,889,563 S20 Siemens SWT-2.3-113 362,894 4,889,249 S21 Siemens SWT-2.3-113 364,881 4,889,039 S22 Siemens SWT-2.3-113 361,447 4,890,656 S23 Siemens SWT-2.3-113 361,586 4,888,696 S25 Siemens SWT-2.3-113 360,694 4,888,128 S26 Siemens SWT-2.3-113 367,371 4,892,536 S27 Siemens SWT-2.3-113 365,916 4,890,146 S28 Siemens SWT-2.3-113 369,091 4,893,127 S29 Siemens SWT-2.3-113 359,562 4,889,909 S30 Siemens SWT-2.3-113 367,040 4,892,941 S31 Siemens SWT-2.3-113 362,343 4,891,028 S32 Siemens SWT-2.3-113 359,530 4,887,967 S33 Siemens SWT-2.3-113 369,337 4,892,806 S34 Siemens SWT-2.3-113 363,324 4,889,901 S35 Siemens SWT-2.3-113 361,299 4,888,183 S36 Siemens SWT-2.3-113 364,589 4,888,397 S37 Siemens SWT-2.3-113 365,501 4,889,854
Algonquin Power Co. (on behalf of Windlectric Inc.) voluntarily authorized the development of this report. This report is not a requirement of O. Reg. 359/09 and as such is not a required component for a Renewable Energy Approval application.
Algonquin Power Co. - Amherst Island Wind Project Shadow-Flicker Impact Assessment
H340642-0000-50-124-0001, Rev. 2
© Hatch 2013/02
Appendix B Shadow-Flicker Impact Results
Algonquin Power Co. (on behalf of Windlectric Inc.) voluntarily authorized the development of this report. This report is not a requirement of O. Reg. 359/09 and as such is not a required component for a Renewable Energy Approval application.
Algonquin Power Co. - Amherst Island Wind Project Shadow-Flicker Impact Assessment
H340642-0000-50-124-0001, Rev. 2
© Hatch 2013/02
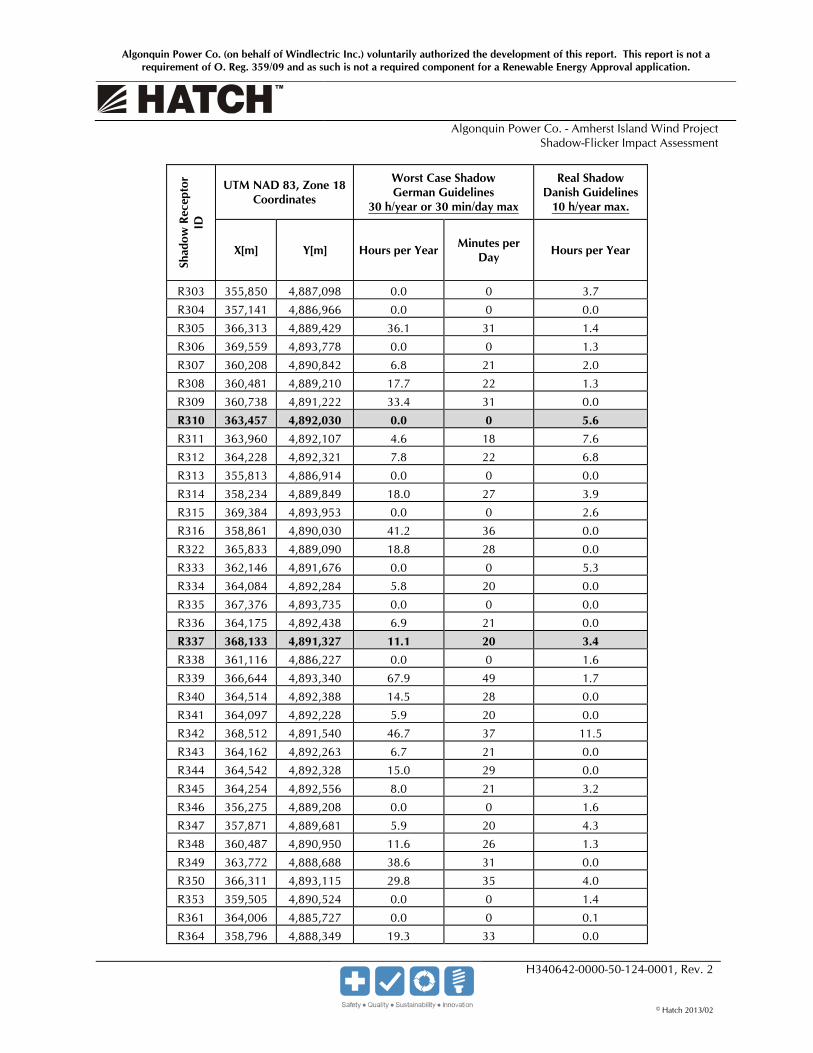
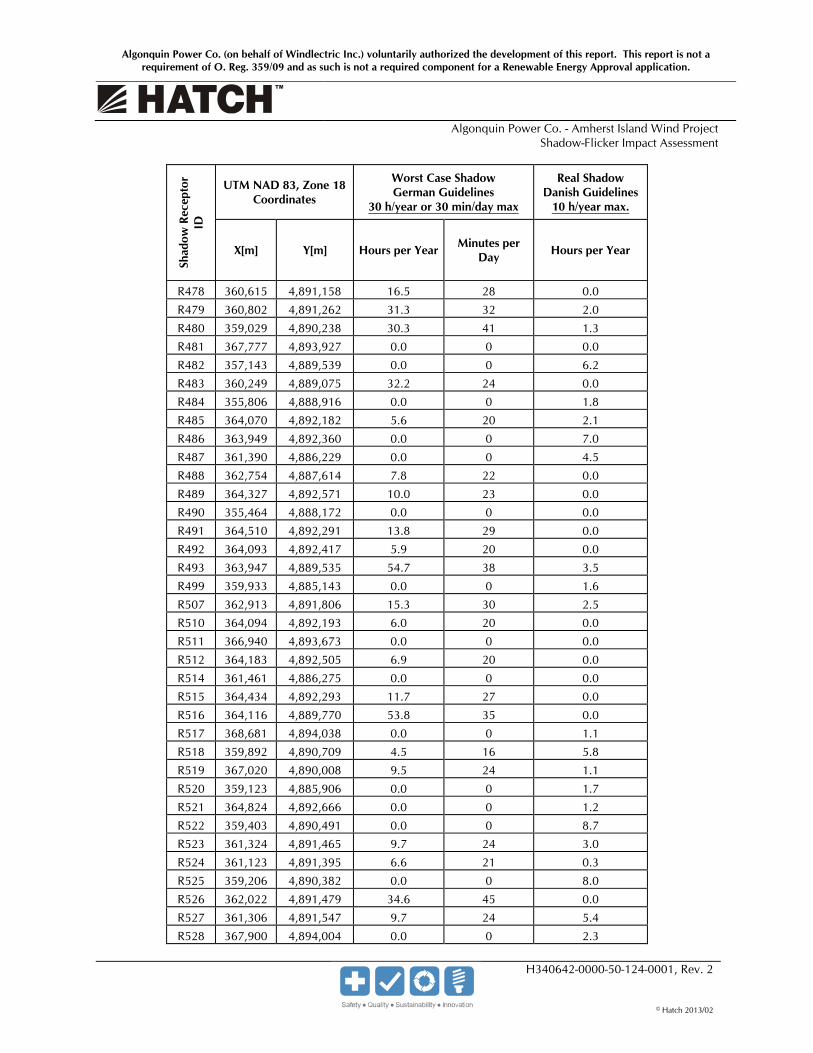
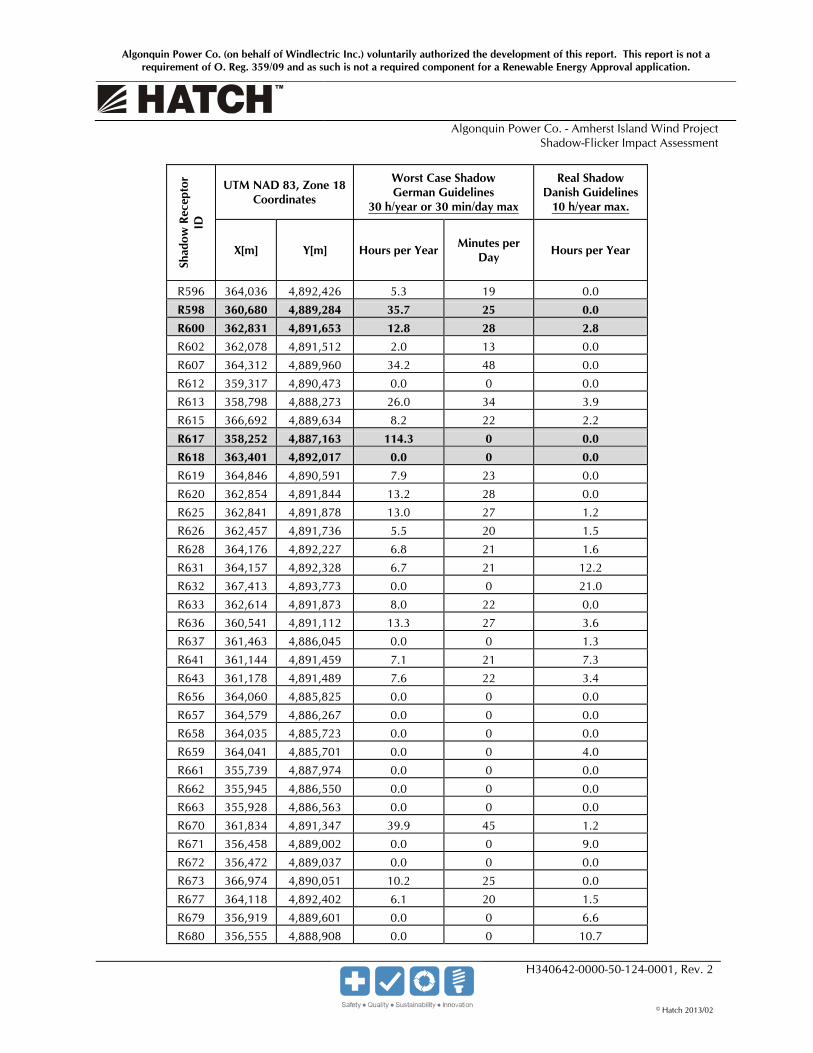
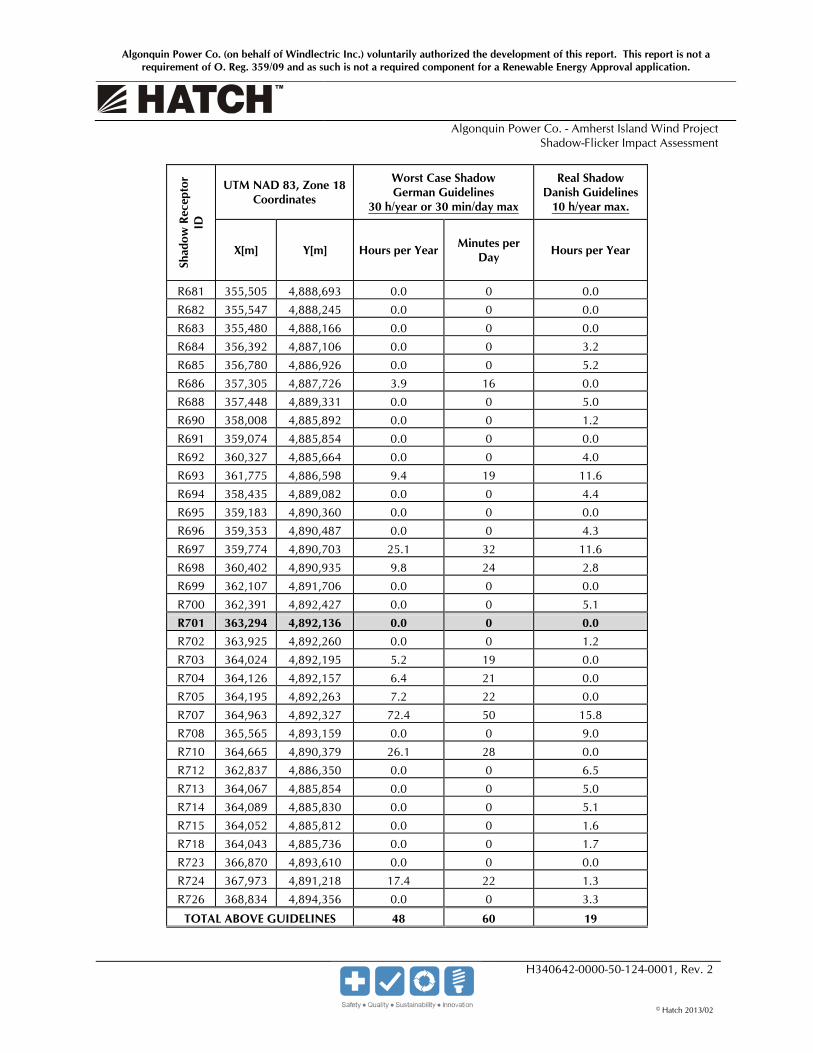
Table B.1 Shadow-Flicker Impact Results: Astronomical Shadow (Worst Case) and Real Shadow. The
highlighted receptors correspond to Participant owners
Shad
ow R
ecep
tor
ID
UTM NAD 83, Zone 18 Coordinates
Worst Case Shadow German Guidelines
30 h/year or 30 min/day max
Real Shadow Danish Guidelines
10 h/year max.
X[m] Y[m] Hours per Year Minutes per Day Hours per Year
R002 356,792 4,886,911 0.0 0 21.0
R003 363,941 4,885,595 0.0 0 0.0
R005 359,893 4,890,564 46.1 40 3.6
R007 364,239 4,892,296 7.9 22 1.3
R010 364,153 4,885,327 0.0 0 7.3
R011 366,872 4,893,632 0.0 0 3.4
R012 356,186 4,889,116 0.0 0 0.0
R014 366,786 4,893,503 0.0 0 0.0
R015 365,758 4,889,070 22.6 30 0.0 R018 364,059 4,892,107 5.7 20 4.0
R020 362,062 4,886,820 9.3 23 0.0
R021 360,101 4,890,790 5.6 19 0.0
R022 362,789 4,891,859 11.5 26 0.0
R024 363,071 4,886,339 0.0 0 1.2
R025 367,198 4,890,237 32.2 37 9.0
R026 367,812 4,891,038 20.9 26 0.0
R028 364,459 4,892,309 12.3 27 0.0
R029 367,962 4,891,160 19.3 22 1.5
R030 357,966 4,885,928 0.0 0 6.6
R031 359,345 4,888,662 4.0 16 10.7
R032 355,872 4,888,987 0.0 0 0.0
R033 360,714 4,891,207 25.8 30 0.0
R034 363,968 4,892,164 4.7 18 0.0
R035 361,623 4,891,803 0.7 6 3.2
R036 368,045 4,894,070 7.8 17 5.2
R040 365,623 4,888,851 35.6 35 0.0
R041 359,946 4,890,749 0.0 0 5.0
R043 357,651 4,886,179 0.0 0 1.2
R056 364,908 4,890,729 14.3 23 0.0
R057 364,082 4,892,061 5.9 20 4.0
R058 364,563 4,892,351 16.0 30 11.6
R059 357,052 4,889,574 0.0 0 4.4
R060 358,523 4,889,966 36.2 35 0.0

Algonquin Power Co. (on behalf of Windlectric Inc.) voluntarily authorized the development of this report. This report is not a requirement of O. Reg. 359/09 and as such is not a required component for a Renewable Energy Approval application.
Algonquin Power Co. - Amherst Island Wind Project Shadow-Flicker Impact Assessment
H340642-0000-50-124-0001, Rev. 2
© Hatch 2013/02
Shad
ow R
ecep
tor
ID
UTM NAD 83, Zone 18 Coordinates
Worst Case Shadow German Guidelines
30 h/year or 30 min/day max
Real Shadow Danish Guidelines
10 h/year max.
X[m] Y[m] Hours per Year Minutes per Day Hours per Year
R061 364,298 4,892,572 9.0 22 4.3
R063 360,135 4,885,467 0.0 0 11.6
R065 365,563 4,893,048 0.0 0 2.8
R067 364,146 4,892,216 6.5 21 0.0
R068 364,914 4,890,629 9.2 24 5.1
R069 367,873 4,894,024 0.0 0 0.0
R070 357,913 4,889,708 6.4 21 1.2
R071 355,922 4,889,025 0.0 0 0.0
R074 369,960 4,893,872 15.4 24 0.0
R078 360,762 4,891,155 26.8 33 0.0
R079 359,604 4,890,575 18.0 29 15.8
R080 362,200 4,887,075 72.5 9 9.0
R083 365,430 4,893,185 0.0 0 0.0
R085 360,668 4,891,181 19.7 29 6.5
R087 364,076 4,892,451 5.7 19 5.0
R090 358,709 4,890,096 40.0 36 5.1
R091 366,966 4,889,848 12.1 25 1.6
R092 368,778 4,894,417 0.0 0 1.7
R093 359,060 4,888,604 0.0 0 0.0
R094 367,581 4,893,976 0.0 0 1.3
R096 362,996 4,891,908 20.5 31 3.3
R097 368,666 4,894,336 0.0 0 5.4
R098 359,161 4,890,353 0.0 0 0.0
R099 368,290 4,891,445 0.0 0 0.0
R100 357,760 4,889,636 4.8 18 4.0
R101 361,821 4,891,454 53.4 41 1.4
R102 360,008 4,885,371 0.0 0 3.4
R103 363,864 4,892,163 0.0 0 2.0
R104 364,124 4,892,384 6.3 20 0.0
R105 367,259 4,890,334 25.1 34 4.8
R107 363,640 4,888,526 36.7 35 1.9
R108 357,116 4,889,471 0.0 0 3.1
R109 362,949 4,888,140 0.0 0 1.6
R111 357,658 4,889,573 0.0 0 2.7
R113 364,528 4,892,413 15.1 28 5.7
R114 366,256 4,889,386 18.9 23 5.5
Algonquin Power Co. (on behalf of Windlectric Inc.) voluntarily authorized the development of this report. This report is not a requirement of O. Reg. 359/09 and as such is not a required component for a Renewable Energy Approval application.
Algonquin Power Co. - Amherst Island Wind Project Shadow-Flicker Impact Assessment
H340642-0000-50-124-0001, Rev. 2
© Hatch 2013/02
Shad
ow R
ecep
tor
ID
UTM NAD 83, Zone 18 Coordinates
Worst Case Shadow German Guidelines
30 h/year or 30 min/day max
Real Shadow Danish Guidelines
10 h/year max.
X[m] Y[m] Hours per Year Minutes per Day Hours per Year
R118 367,227 4,893,765 0.0 0 0.0
R122 363,067 4,891,931 27.4 33 0.0
R124 364,014 4,892,185 5.1 19 3.7
R125 369,190 4,893,990 0.0 0 1.2
R126 360,677 4,891,064 18.1 31 0.0
R127 363,902 4,889,092 45.8 27 0.0
R128 366,068 4,889,271 15.5 27 1.3
R129 362,558 4,885,712 0.0 0 0.0
R130 366,563 4,889,572 15.9 25 0.0
R131 366,560 4,893,285 63.5 46 0.0
R132 364,448 4,892,350 12.2 26 0.0
R133 357,130 4,889,553 0.0 0 1.3
R134 367,322 4,890,451 20.6 31 0.0 R135 357,513 4,885,995 0.0 0 0.0
R137 364,030 4,892,155 5.3 19 0.0
R138 359,899 4,890,759 0.0 0 0.0
R139 360,377 4,885,708 0.0 0 15.7
R140 363,261 4,892,098 0.0 0 1.1 R142 364,168 4,889,387 57.7 34 1.3
R145 364,482 4,890,164 47.3 43 0.0
R146 364,160 4,885,362 0.0 0 1.3
R157 360,805 4,891,182 39.3 34 6.6
R159 358,305 4,889,843 20.9 29 0.0
R160 366,960 4,889,781 17.8 25 1.7
R161 364,165 4,892,220 6.8 21 5.8
R162 357,982 4,889,754 7.3 22 8.0
R163 355,549 4,888,133 0.0 0 0.0
R164 361,050 4,891,333 5.6 20 0.0
R165 359,814 4,890,699 21.3 31 0.0
R166 363,313 4,890,643 17.9 27 5.2
R167 359,113 4,888,625 0.0 0 1.8
R168 361,769 4,886,562 0.0 0 7.2
R169 364,759 4,892,564 25.9 33 2.4
R171 364,080 4,892,096 5.8 20 1.4
R172 364,572 4,892,441 17.5 29 0.0
R173 364,889 4,890,554 8.7 24 5.9
Algonquin Power Co. (on behalf of Windlectric Inc.) voluntarily authorized the development of this report. This report is not a requirement of O. Reg. 359/09 and as such is not a required component for a Renewable Energy Approval application.
Algonquin Power Co. - Amherst Island Wind Project Shadow-Flicker Impact Assessment
H340642-0000-50-124-0001, Rev. 2
© Hatch 2013/02
Shad
ow R
ecep
tor
ID
UTM NAD 83, Zone 18 Coordinates
Worst Case Shadow German Guidelines
30 h/year or 30 min/day max
Real Shadow Danish Guidelines
10 h/year max.
X[m] Y[m] Hours per Year Minutes per Day Hours per Year
R174 357,177 4,889,515 0.0 0 0.0
R177 366,495 4,889,660 17.3 27 1.4 R178 364,284 4,892,521 8.8 22 2.3
R182 360,558 4,890,989 13.5 28 3.7
R190 365,881 4,893,230 7.2 22 0.0
R192 366,628 4,889,597 9.7 23 1.0
R193 360,787 4,891,238 35.3 32 7.0
R194 366,226 4,893,109 24.3 31 3.7
R195 357,110 4,886,952 0.0 0 4.4
R196 357,086 4,889,557 0.0 0 2.0
R197 368,995 4,891,793 13.9 22 1.5
R198 363,999 4,892,125 5.0 18 1.1
R199 363,909 4,892,311 0.0 0 2.3
R200 364,469 4,885,927 0.0 0 1.9
R201 357,805 4,889,647 5.3 19 0.0
R202 367,665 4,894,018 0.0 0 2.5
R203 360,989 4,886,500 0.0 0 9.4
R204 360,702 4,885,983 0.0 0 2.2
R207 364,040 4,885,784 0.0 0 0.0
R208 364,074 4,892,408 5.7 19 3.8
R209 355,665 4,887,048 0.0 0 0.0
R210 357,393 4,889,358 0.0 0 0.0
R221 363,994 4,885,653 0.0 0 4.4
R222 359,277 4,890,416 0.0 0 1.1
R227 365,574 4,888,708 52.8 37 0.0
R229 363,988 4,892,236 4.8 18 1.2
R230 364,061 4,892,209 5.5 19 1.2
R231 362,126 4,891,540 0.0 0 0.0
R232 364,063 4,892,147 5.6 19 0.0
R233 358,904 4,888,447 39.2 35 0.0
R236 364,784 4,886,837 0.0 0 10.8
R237 364,222 4,892,513 7.4 21 0.0
R238 364,680 4,892,516 34.8 32 1.6
R239 366,019 4,889,228 27.9 28 4.4
R240 356,964 4,886,961 0.0 0 5.6
R241 356,866 4,889,595 0.0 0 0.0

Algonquin Power Co. (on behalf of Windlectric Inc.) voluntarily authorized the development of this report. This report is not a requirement of O. Reg. 359/09 and as such is not a required component for a Renewable Energy Approval application.
Algonquin Power Co. - Amherst Island Wind Project Shadow-Flicker Impact Assessment
H340642-0000-50-124-0001, Rev. 2
© Hatch 2013/02
Shad
ow R
ecep
tor
ID
UTM NAD 83, Zone 18 Coordinates
Worst Case Shadow German Guidelines
30 h/year or 30 min/day max
Real Shadow Danish Guidelines
10 h/year max.
X[m] Y[m] Hours per Year Minutes per Day Hours per Year
R242 355,590 4,888,836 0.0 0 1.1
R244 360,730 4,891,215 30.8 30 1.8
R245 365,893 4,893,153 7.9 23 0.0
R246 366,902 4,889,729 24.6 26 4.3
R247 360,436 4,890,915 10.5 25 0.0
R254 360,129 4,890,712 5.9 20 8.2 R258 364,002 4,885,706 0.0 0 4.5
R261 364,674 4,890,296 26.1 29 0.0
R262 355,507 4,888,255 0.0 0 1.3
R263 364,092 4,892,390 5.9 20 0.0
R264 364,356 4,892,322 10.0 24 1.6
R265 368,058 4,891,269 13.6 21 3.0
R266 368,149 4,894,137 0.0 0 0.0
R267 365,616 4,893,060 4.2 17 10.9
R268 358,467 4,889,930 30.5 34 3.2
R270 358,452 4,887,973 14.9 24 1.4
R271 360,734 4,891,167 24.7 32 14.3
R272 364,271 4,892,333 8.5 23 1.5
R273 364,132 4,892,204 6.4 21 3.5
R274 363,976 4,892,355 4.6 18 1.7
R275 361,386 4,891,597 12.2 25 0.0
R276 365,906 4,893,126 8.2 23 1.4
R277 356,850 4,886,941 0.0 0 2.6
R278 366,657 4,889,616 9.0 23 10.6
R280 364,392 4,890,113 49.1 47 6.6
R283 362,698 4,891,900 9.6 24 0.0
R290 357,026 4,889,597 0.0 0 0.0
R291 363,359 4,888,447 13.9 20 4.2
R292 359,462 4,890,503 0.0 0 0.0
R293 366,725 4,893,495 0.0 0 10.6
R297 365,371 4,888,610 17.6 32 0.0 R298 364,002 4,892,399 4.9 18 0.0
R299 356,542 4,889,318 0.0 0 0.0
R300 359,452 4,888,735 5.4 18 2.8
R301 360,046 4,890,779 5.1 19 0.0
R302 364,059 4,885,842 0.0 0 1.2
Algonquin Power Co. (on behalf of Windlectric Inc.) voluntarily authorized the development of this report. This report is not a requirement of O. Reg. 359/09 and as such is not a required component for a Renewable Energy Approval application.
Algonquin Power Co. - Amherst Island Wind Project Shadow-Flicker Impact Assessment
H340642-0000-50-124-0001, Rev. 2
© Hatch 2013/02
Shad
ow R
ecep
tor
ID
UTM NAD 83, Zone 18 Coordinates
Worst Case Shadow German Guidelines
30 h/year or 30 min/day max
Real Shadow Danish Guidelines
10 h/year max.
X[m] Y[m] Hours per Year Minutes per Day Hours per Year
R303 355,850 4,887,098 0.0 0 3.7
R304 357,141 4,886,966 0.0 0 0.0
R305 366,313 4,889,429 36.1 31 1.4
R306 369,559 4,893,778 0.0 0 1.3
R307 360,208 4,890,842 6.8 21 2.0
R308 360,481 4,889,210 17.7 22 1.3
R309 360,738 4,891,222 33.4 31 0.0
R310 363,457 4,892,030 0.0 0 5.6 R311 363,960 4,892,107 4.6 18 7.6
R312 364,228 4,892,321 7.8 22 6.8
R313 355,813 4,886,914 0.0 0 0.0
R314 358,234 4,889,849 18.0 27 3.9
R315 369,384 4,893,953 0.0 0 2.6
R316 358,861 4,890,030 41.2 36 0.0
R322 365,833 4,889,090 18.8 28 0.0
R333 362,146 4,891,676 0.0 0 5.3
R334 364,084 4,892,284 5.8 20 0.0
R335 367,376 4,893,735 0.0 0 0.0
R336 364,175 4,892,438 6.9 21 0.0
R337 368,133 4,891,327 11.1 20 3.4 R338 361,116 4,886,227 0.0 0 1.6
R339 366,644 4,893,340 67.9 49 1.7
R340 364,514 4,892,388 14.5 28 0.0
R341 364,097 4,892,228 5.9 20 0.0
R342 368,512 4,891,540 46.7 37 11.5
R343 364,162 4,892,263 6.7 21 0.0
R344 364,542 4,892,328 15.0 29 0.0
R345 364,254 4,892,556 8.0 21 3.2
R346 356,275 4,889,208 0.0 0 1.6
R347 357,871 4,889,681 5.9 20 4.3
R348 360,487 4,890,950 11.6 26 1.3
R349 363,772 4,888,688 38.6 31 0.0
R350 366,311 4,893,115 29.8 35 4.0
R353 359,505 4,890,524 0.0 0 1.4
R361 364,006 4,885,727 0.0 0 0.1
R364 358,796 4,888,349 19.3 33 0.0

Algonquin Power Co. (on behalf of Windlectric Inc.) voluntarily authorized the development of this report. This report is not a requirement of O. Reg. 359/09 and as such is not a required component for a Renewable Energy Approval application.
Algonquin Power Co. - Amherst Island Wind Project Shadow-Flicker Impact Assessment
H340642-0000-50-124-0001, Rev. 2
© Hatch 2013/02
Shad
ow R
ecep
tor
ID
UTM NAD 83, Zone 18 Coordinates
Worst Case Shadow German Guidelines
30 h/year or 30 min/day max
Real Shadow Danish Guidelines
10 h/year max.
X[m] Y[m] Hours per Year Minutes per Day Hours per Year
R368 356,297 4,889,198 0.0 0 1.7
R369 360,965 4,890,937 47.7 48 11.6
R370 364,908 4,892,724 0.0 0 3.7
R371 356,438 4,889,232 0.0 0 2.3
R372 356,365 4,889,224 0.0 0 0.0
R373 369,538 4,892,176 9.3 23 1.9 R374 369,808 4,893,889 0.0 0 2.3
R375 357,788 4,889,639 5.1 19 1.8
R376 362,412 4,889,866 13.6 29 0.0 R377 356,609 4,889,319 0.0 0 0.0
R378 364,102 4,892,355 6.0 20 3.9
R379 364,062 4,892,364 5.5 19 0.0
R380 362,677 4,891,770 8.8 24 18.9
R381 364,083 4,892,222 5.7 20 2.2
R382 364,514 4,886,095 0.0 0 0.0
R383 367,296 4,890,391 22.3 32 4.2 R386 364,270 4,890,005 33.1 48 0.0
R387 366,670 4,893,402 42.3 47 0.0
R391 363,703 4,884,834 0.0 0 0.0
R394 359,641 4,890,604 21.3 30 3.6
R396 361,426 4,891,626 14.4 25 0.0
R397 364,010 4,885,618 0.0 0 0.0
R402 363,945 4,892,249 0.0 0 18.6
R403 364,660 4,892,504 31.4 31 3.6
R404 365,210 4,893,014 0.0 0 0.0
R405 362,809 4,886,297 0.0 0 0.0
R406 357,013 4,889,619 0.0 0 1.4
R407 360,590 4,891,007 14.4 29 0.0
R408 364,184 4,892,238 7.0 21 3.3
R409 364,214 4,892,234 7.6 22 4.9
R410 356,713 4,886,827 0.0 0 6.9
R411 362,360 4,892,437 0.0 0 0.0
R412 367,587 4,890,848 39.1 33 0.0
R413 359,675 4,884,957 0.0 0 7.5
R414 357,207 4,887,086 0.0 0 0.0
R415 360,594 4,891,137 15.4 28 1.3

Algonquin Power Co. (on behalf of Windlectric Inc.) voluntarily authorized the development of this report. This report is not a requirement of O. Reg. 359/09 and as such is not a required component for a Renewable Energy Approval application.
Algonquin Power Co. - Amherst Island Wind Project Shadow-Flicker Impact Assessment
H340642-0000-50-124-0001, Rev. 2
© Hatch 2013/02
Shad
ow R
ecep
tor
ID
UTM NAD 83, Zone 18 Coordinates
Worst Case Shadow German Guidelines
30 h/year or 30 min/day max
Real Shadow Danish Guidelines
10 h/year max.
X[m] Y[m] Hours per Year Minutes per Day Hours per Year
R416 362,577 4,891,721 7.1 22 0.0
R417 362,565 4,887,449 17.4 28 0.0
R418 364,078 4,892,326 5.7 20 2.1
R419 355,937 4,888,922 0.0 0 1.9
R420 368,977 4,891,757 14.8 23 0.0
R421 361,093 4,891,340 6.1 20 3.2
R422 368,133 4,894,055 0.9 6 1.4
R425 369,291 4,893,952 0.0 0 14.4
R428 364,219 4,892,470 7.4 21 0.0
R431 366,520 4,893,262 60.6 44 3.6
R436 362,930 4,891,822 16.0 30 1.4
R439 365,949 4,889,171 9.1 24 0.0
R441 361,668 4,886,460 0.0 0 1.6 R442 364,265 4,892,287 8.3 23 0.0
R443 364,378 4,892,243 10.4 25 2.7
R444 364,258 4,892,501 8.3 22 12.6
R445 355,541 4,888,682 0.0 0 0.0
R446 360,211 4,885,546 0.0 0 0.7
R447 360,700 4,891,163 21.4 31 2.6
R449 364,023 4,885,738 0.0 0 0.0
R450 367,116 4,890,118 63.1 41 0.0
R452 364,340 4,892,217 9.6 25 0.0
R453 356,236 4,889,175 0.0 0 2.3
R454 368,019 4,891,231 15.4 22 1.5
R455 357,175 4,889,475 0.0 0 0.0
R456 359,916 4,885,248 0.0 0 5.6
R459 367,339 4,893,889 0.0 0 2.1
R460 358,748 4,890,166 16.0 31 0.0
R461 357,452 4,885,074 0.0 0 0.0
R466 361,721 4,886,415 0.0 0 2.9
R467 363,656 4,888,940 67.8 34 0.0
R468 360,663 4,891,152 18.7 29 3.9
R474 359,973 4,890,759 0.0 0 3.6
R475 357,620 4,886,072 0.0 0 5.2
R476 362,890 4,887,884 6.5 18 2.3
R477 366,920 4,893,657 0.0 0 1.7
Algonquin Power Co. (on behalf of Windlectric Inc.) voluntarily authorized the development of this report. This report is not a requirement of O. Reg. 359/09 and as such is not a required component for a Renewable Energy Approval application.
Algonquin Power Co. - Amherst Island Wind Project Shadow-Flicker Impact Assessment
H340642-0000-50-124-0001, Rev. 2
© Hatch 2013/02
Shad
ow R
ecep
tor
ID
UTM NAD 83, Zone 18 Coordinates
Worst Case Shadow German Guidelines
30 h/year or 30 min/day max
Real Shadow Danish Guidelines
10 h/year max.
X[m] Y[m] Hours per Year Minutes per Day Hours per Year
R478 360,615 4,891,158 16.5 28 0.0
R479 360,802 4,891,262 31.3 32 2.0
R480 359,029 4,890,238 30.3 41 1.3
R481 367,777 4,893,927 0.0 0 0.0
R482 357,143 4,889,539 0.0 0 6.2
R483 360,249 4,889,075 32.2 24 0.0
R484 355,806 4,888,916 0.0 0 1.8
R485 364,070 4,892,182 5.6 20 2.1
R486 363,949 4,892,360 0.0 0 7.0
R487 361,390 4,886,229 0.0 0 4.5
R488 362,754 4,887,614 7.8 22 0.0
R489 364,327 4,892,571 10.0 23 0.0
R490 355,464 4,888,172 0.0 0 0.0
R491 364,510 4,892,291 13.8 29 0.0
R492 364,093 4,892,417 5.9 20 0.0
R493 363,947 4,889,535 54.7 38 3.5
R499 359,933 4,885,143 0.0 0 1.6
R507 362,913 4,891,806 15.3 30 2.5
R510 364,094 4,892,193 6.0 20 0.0
R511 366,940 4,893,673 0.0 0 0.0
R512 364,183 4,892,505 6.9 20 0.0
R514 361,461 4,886,275 0.0 0 0.0
R515 364,434 4,892,293 11.7 27 0.0
R516 364,116 4,889,770 53.8 35 0.0
R517 368,681 4,894,038 0.0 0 1.1
R518 359,892 4,890,709 4.5 16 5.8
R519 367,020 4,890,008 9.5 24 1.1
R520 359,123 4,885,906 0.0 0 1.7
R521 364,824 4,892,666 0.0 0 1.2
R522 359,403 4,890,491 0.0 0 8.7
R523 361,324 4,891,465 9.7 24 3.0
R524 361,123 4,891,395 6.6 21 0.3
R525 359,206 4,890,382 0.0 0 8.0
R526 362,022 4,891,479 34.6 45 0.0
R527 361,306 4,891,547 9.7 24 5.4
R528 367,900 4,894,004 0.0 0 2.3

Algonquin Power Co. (on behalf of Windlectric Inc.) voluntarily authorized the development of this report. This report is not a requirement of O. Reg. 359/09 and as such is not a required component for a Renewable Energy Approval application.
Algonquin Power Co. - Amherst Island Wind Project Shadow-Flicker Impact Assessment
H340642-0000-50-124-0001, Rev. 2
© Hatch 2013/02
Shad
ow R
ecep
tor
ID
UTM NAD 83, Zone 18 Coordinates
Worst Case Shadow German Guidelines
30 h/year or 30 min/day max
Real Shadow Danish Guidelines
10 h/year max.
X[m] Y[m] Hours per Year Minutes per Day Hours per Year
R533 359,064 4,890,367 0.0 0 37.3
R538 360,529 4,890,971 12.7 27 0.0
R541 359,436 4,890,475 0.0 0 1.8
R547 360,683 4,891,197 21.6 30 3.1
R548 364,600 4,892,460 19.5 30 3.0
R549 360,940 4,891,214 31.2 36 1.3
R550 364,362 4,892,284 10.0 25 1.6
R551 357,981 4,889,730 7.4 22 1.5
R552 359,148 4,888,646 0.0 0 0.0
R553 364,289 4,892,295 8.8 23 1.9
R554 364,070 4,892,343 5.6 19 3.0
R555 363,019 4,888,085 0.0 0 0.0
R556 366,391 4,889,653 22.7 29 1.6 R557 363,796 4,892,015 0.0 0 1.8
R558 364,246 4,892,246 8.0 23 0.0
R559 364,319 4,892,230 9.1 24 0.0
R560 366,733 4,889,671 23.8 27 0.0
R561 358,595 4,888,104 21.1 28 0.0
R562 359,240 4,890,437 0.0 0 0.0
R563 356,775 4,886,842 0.0 0 0.0
R565 368,500 4,894,374 0.0 0 0.0
R567 365,546 4,893,199 0.0 0 8.2
R570 367,045 4,893,676 0.0 0 0.0
R576 361,477 4,891,672 20.6 25 0.0
R581 357,958 4,889,741 7.0 21 2.7
R582 368,198 4,891,377 9.5 18 1.4
R584 359,512 4,890,469 0.0 0 0.0
R585 362,088 4,891,716 0.0 0 0.0
R587 367,153 4,893,734 0.0 0 0.0
R588 355,832 4,888,972 0.0 0 0.0
R589 356,648 4,889,431 0.0 0 0.0
R590 369,626 4,893,805 0.0 0 0.0
R591 363,953 4,892,194 4.6 18 0.0
R593 360,756 4,891,210 34.7 32 0.9
R594 363,983 4,892,268 4.8 18 0.0
R595 364,229 4,892,241 7.7 22 0.0
Algonquin Power Co. (on behalf of Windlectric Inc.) voluntarily authorized the development of this report. This report is not a requirement of O. Reg. 359/09 and as such is not a required component for a Renewable Energy Approval application.
Algonquin Power Co. - Amherst Island Wind Project Shadow-Flicker Impact Assessment
H340642-0000-50-124-0001, Rev. 2
© Hatch 2013/02
Shad
ow R
ecep
tor
ID
UTM NAD 83, Zone 18 Coordinates
Worst Case Shadow German Guidelines
30 h/year or 30 min/day max
Real Shadow Danish Guidelines
10 h/year max.
X[m] Y[m] Hours per Year Minutes per Day Hours per Year
R596 364,036 4,892,426 5.3 19 0.0
R598 360,680 4,889,284 35.7 25 0.0 R600 362,831 4,891,653 12.8 28 2.8 R602 362,078 4,891,512 2.0 13 0.0
R607 364,312 4,889,960 34.2 48 0.0
R612 359,317 4,890,473 0.0 0 0.0
R613 358,798 4,888,273 26.0 34 3.9
R615 366,692 4,889,634 8.2 22 2.2
R617 358,252 4,887,163 114.3 0 0.0 R618 363,401 4,892,017 0.0 0 0.0 R619 364,846 4,890,591 7.9 23 0.0
R620 362,854 4,891,844 13.2 28 0.0
R625 362,841 4,891,878 13.0 27 1.2
R626 362,457 4,891,736 5.5 20 1.5
R628 364,176 4,892,227 6.8 21 1.6
R631 364,157 4,892,328 6.7 21 12.2
R632 367,413 4,893,773 0.0 0 21.0
R633 362,614 4,891,873 8.0 22 0.0
R636 360,541 4,891,112 13.3 27 3.6
R637 361,463 4,886,045 0.0 0 1.3
R641 361,144 4,891,459 7.1 21 7.3
R643 361,178 4,891,489 7.6 22 3.4
R656 364,060 4,885,825 0.0 0 0.0
R657 364,579 4,886,267 0.0 0 0.0
R658 364,035 4,885,723 0.0 0 0.0
R659 364,041 4,885,701 0.0 0 4.0
R661 355,739 4,887,974 0.0 0 0.0
R662 355,945 4,886,550 0.0 0 0.0
R663 355,928 4,886,563 0.0 0 0.0
R670 361,834 4,891,347 39.9 45 1.2
R671 356,458 4,889,002 0.0 0 9.0
R672 356,472 4,889,037 0.0 0 0.0
R673 366,974 4,890,051 10.2 25 0.0
R677 364,118 4,892,402 6.1 20 1.5
R679 356,919 4,889,601 0.0 0 6.6
R680 356,555 4,888,908 0.0 0 10.7
Algonquin Power Co. (on behalf of Windlectric Inc.) voluntarily authorized the development of this report. This report is not a requirement of O. Reg. 359/09 and as such is not a required component for a Renewable Energy Approval application.
Algonquin Power Co. - Amherst Island Wind Project Shadow-Flicker Impact Assessment
H340642-0000-50-124-0001, Rev. 2
© Hatch 2013/02
Shad
ow R
ecep
tor
ID
UTM NAD 83, Zone 18 Coordinates
Worst Case Shadow German Guidelines
30 h/year or 30 min/day max
Real Shadow Danish Guidelines
10 h/year max.
X[m] Y[m] Hours per Year Minutes per Day Hours per Year
R681 355,505 4,888,693 0.0 0 0.0
R682 355,547 4,888,245 0.0 0 0.0
R683 355,480 4,888,166 0.0 0 0.0
R684 356,392 4,887,106 0.0 0 3.2
R685 356,780 4,886,926 0.0 0 5.2
R686 357,305 4,887,726 3.9 16 0.0
R688 357,448 4,889,331 0.0 0 5.0
R690 358,008 4,885,892 0.0 0 1.2
R691 359,074 4,885,854 0.0 0 0.0
R692 360,327 4,885,664 0.0 0 4.0
R693 361,775 4,886,598 9.4 19 11.6
R694 358,435 4,889,082 0.0 0 4.4
R695 359,183 4,890,360 0.0 0 0.0
R696 359,353 4,890,487 0.0 0 4.3
R697 359,774 4,890,703 25.1 32 11.6
R698 360,402 4,890,935 9.8 24 2.8
R699 362,107 4,891,706 0.0 0 0.0
R700 362,391 4,892,427 0.0 0 5.1
R701 363,294 4,892,136 0.0 0 0.0 R702 363,925 4,892,260 0.0 0 1.2
R703 364,024 4,892,195 5.2 19 0.0
R704 364,126 4,892,157 6.4 21 0.0
R705 364,195 4,892,263 7.2 22 0.0
R707 364,963 4,892,327 72.4 50 15.8
R708 365,565 4,893,159 0.0 0 9.0
R710 364,665 4,890,379 26.1 28 0.0
R712 362,837 4,886,350 0.0 0 6.5
R713 364,067 4,885,854 0.0 0 5.0
R714 364,089 4,885,830 0.0 0 5.1
R715 364,052 4,885,812 0.0 0 1.6
R718 364,043 4,885,736 0.0 0 1.7
R723 366,870 4,893,610 0.0 0 0.0
R724 367,973 4,891,218 17.4 22 1.3
R726 368,834 4,894,356 0.0 0 3.3
TOTAL ABOVE GUIDELINES 48 60 19
Algonquin Power Co. (on behalf of Windlectric Inc.) voluntarily authorized the development of this report. This report is not a requirement of O. Reg. 359/09 and as such is not a required component for a Renewable Energy Approval application.
Algonquin Power Co. - Amherst Island Wind Project Shadow-Flicker Impact Assessment
H340642-0000-50-124-0001, Rev. 2
© Hatch 2013/02
Appendix C Shadow-Flicker Impact Map
Ò)
��
��
��
��
��
����
��
���� ��
��
��
��
��
��
��
��
��
��
��
��
��
��
��
��
��
��
��
��
��
��
��
����
��
FRONT ROAD
SO
UTH S
HO
RE R
OAD
MAIN
STR
EE
T
3RD C
ONCESSIO
N R
OAD
2ND CONCESSION ROAD
EM
ER
ALD
40 F
OO
T R
OA
D
STELLA 4
0 F
OO
T R
OA
D
CH
UR
CH
STR
EE
T
AR
T M
CG
INN
S R
OA
D
LO
WER
40 F
OO
T R
OA
D
ACADEMY STREET
ABBEY DAW
N DRIV
E PURDY ROADWESTBURY AVENUE
KER
R P
OIN
T R
OA
D
HE
RIT
AG
E D
RIV
E
MCDONALDS LANE
1S
T S
TR
EE
T
GLENORA DRIVE
PRUYN CRESCENT
BATH ROAD
2ND C
ONCES
SIO
N R
OAD
QUEEN STREET
Lake Ontario
NorthChannel
Sub
S37
S36
S35
S34
S33
S32
S31
S30
S29
S28
S27
S26
S25
S23
S22
S21
S20
S19
S18
S17
S16
S15
S14
S13
S12
S11S10S09
S08
S07
S06
S05
S04
S03
S02
S01
R726
R725
R724
R723
R720
R719R718R717
R715R713
R712
R711
R710
R709
R708
R707
R706
R705
R704R703
R702
R701
R700
R699
R698
R697
R696
R695
R694
R693
R692
R691R690
R689
R688
R687
R686
R685
R684
R683
R682
R681
R680
R679R678
R677R676
R675
R673
R672R671
R670
R669
R667
R664
R663R662
R661
R659R658
R657
R656
R652
R649
R648
R647
R646
R644
R643
R642
R641
R638
R637
R636
R633
R632
R627
R626
R625
R623
R622
R621
R620
R619
R618
R617
R616
R615R614
R613
R612
R611
R610
R609R608
R607
R604
R602
R600
R598
R597
R594
R593
R591
R590
R589
R588
R587
R584
R582
R581
R580
R579
R577
R576
R575
R574
R573
R571
R570
R569
R568
R567
R565
R563
R562
R561
R559R558
R557
R556
R555
R552
R551
R549
R548
R547
R545
R544
R541
R540
R538
R537
R534
R533
R532
R528
R527
R526
R525
R524
R522
R521
R519
R518
R517
R516
R515
R514
R511
R509
R507
R506
R505
R503
R502
R501
R500
R499
R498
R495
R494
R493
R491
R490
R488
R487
R486
R484
R483
R482
R481
R480
R476
R475
R474
R473
R470
R469
R468
R467
R466
R465
R464
R463
R462
R461
R460
R459
R457
R456
R455
R453
R450
R447
R446
R445
R444
R443
R441
R440
R439
R436
R435
R433
R431
R430
R427
R425
R422
R421
R420
R419
R417
R416
R415
R414
R413
R412
R411
R410
R406
R405
R404
R402
R399
R397
R396
R394
R393
R392
R391
R390
R387
R386
R383
R382
R377
R376
R375
R374
R373
R372R371
R370
R369
R364
R362
R360
R358
R357
R356
R354
R350
R349
R348
R342
R340
R339
R338
R337
R333
R332
R331
R329
R328
R327
R326
R324
R323
R322
R316
R315
R314
R313
R312
R311
R310
R308
R307
R306
R305
R304
R303
R301
R300
R299
R297
R295
R293
R291
R290
R289
R286
R284
R283
R282
R280
R276
R270
R268
R267
R266
R262
R261
R259
R257
R256
R255
R254
R249
R248
R246
R245
R242
R241
R240
R239
R238
R236
R233
R232
R231
R228
R227
R221
R220
R216
R215
R213
R211
R210
R209
R205
R204
R203
R202
R201
R200
R199
R197
R196
R195
R194
R192
R190
R186
R184
R183
R179
R177
R176
R175
R173
R170
R168
R167
R166R165
R164
R163
R162
R160R159
R156
R155
R153
R152
R151
R150
R149
R146
R143
R142
R140
R138
R135
R134
R132
R131
R130
R129
R127
R126
R125
R123
R122
R115
R114
R113
R111
R110
R109
R108
R107
R105
R103
R102
R101 R099
R098
R097
R094
R092
R091
R088
R086
R084
R083
R080
R076
R075
R073
R070
R065
R063
R058
R057
R056
R054
R051
R050
R048R044
R043
R040R039
R037
R036
R035
R031
R030
R027
R026
R025
R024
R020
R015
R013
R012
R011
R010
R008
R005
R004
R003
356000
356000
359000
359000
362000
362000
365000
365000
368000
368000
48
84
00
04
88
60
00
48
88
00
04
89
00
00
48
92
00
04
89
40
00
!
!
!Highway 401
Highway 33
Highway 7
Hig
hw
ay 1
5
Hig
hw
ay
37
Hig
hw
ay 6
2
Hig
hw
ay 4
1
Highway 62
Highway 7
Hig
hw
ay 6
2
Kingston
BellevilleQuinte West
Lake Ontario
Bobs LakeLower Rideau Lake
Big Rideau Lake
East Lake
Rice Lake
Sturgeon Lake
Project Area
KEY MAP
Legend
Ò) Substation
�� Turbine
Shadow Flicker Receptor - Existing
Ferry Connection
Road
Watercourse
Parcel
Shadow Flicker - Over 10 Hours / Year (Meteorological)
Shadow Flicker - Over 30 Hours / Year (Worst Case)
Waterbody
Wetland
Woodland
Notes:1. Produced by Hatch under licence from Ontario Ministryof Natural Resources, Copyright (c) Queens Printer 2011.2. Spatial referencing UTM NAD 83.
Windlectric Inc.
Potential Shadow Flicker Impact:Meteorological and Worst Case Shadow
Amherst Island Wind Project
1:20,000
N0 500 1,000250
Metres
Path: P:\ALGONQUI\340642\SPECIALIST_APPS\GIS\Map Documents\Layout\WindLayout_LayoutS20_ShadowCombo.mxd Date Saved: 2/26/2013 10:06:04 AM
S#
H34
06
42-1
00
0-5
0-0
15
-00
11
Re
v. 0
Figure C.1
SUB
R#
The results of the use of the meteorological probable shadowreal case suggest that 19 receptors are above 10 hr/yr.Please note the following:
• Five (5) of the 19 receptors are between 10.0-11.0 h/year (one receptor is a participant)• Six (6) of the 19 receptors are between 11.1-12.6 h/year• Four (4) of the 19 receptors are between 12.7 -15.8 h/year• Two (2) of the 19 receptors are between 15.9 -18.9 h/year• One (1) of the 19 receptors is between 18.9 -21 h/year• One (1) of the 19 receptors is between 35 -37.3 h/year (participating).

Algonquin Power Co. (on behalf of Windlectric Inc.) voluntarily authorized the development of this report. This report is not a requirement of O. Reg. 359/09 and as such is not a required component for a Renewable Energy Approval application.
Algonquin Power Co. - Amherst Island Wind Project Shadow-Flicker Impact Assessment
H340642-0000-50-124-0001, Rev. 2
© Hatch 2013/02
Figure C.2. Shadow impact (worst case in hours/year) for each wind turbine. The tiles indicate time of the day and month of the year, and refer to specific points of reception.
Algonquin Power Co. (on behalf of Windlectric Inc.) voluntarily authorized the development of this report. This report is not a requirement of O. Reg. 359/09 and as such is not a required component for a Renewable Energy Approval application.
Algonquin Power Co. - Amherst Island Wind Project Shadow-Flicker Impact Assessment
H340642-0000-50-124-0001, Rev. 2
© Hatch 2013/02
Appendix D Summary of Wind Data – Meteorological Shadow

Algonquin Power Co. (on behalf of Windlectric Inc.) voluntarily authorized the development of this report. This report is not a requirement of O. Reg. 359/09 and as such is not a required component for a Renewable Energy Approval application.
Algonquin Power Co. - Amherst Island Wind Project Shadow-Flicker Impact Assessment
H340642-0000-50-124-0001, Rev. 2
© Hatch 2013/02
Figure D.1: Weibull Distribution at Tower 5908 site, 60 m above ground level

Algonquin Power Co. (on behalf of Windlectric Inc.) voluntarily authorized the development of this report. This report is not a requirement of O. Reg. 359/09 and as such is not a required component for a Renewable Energy Approval application.
Algonquin Power Co. - Amherst Island Wind Project Shadow-Flicker Impact Assessment
H340642-0000-50-124-0001, Rev. 2
© Hatch 2013/02
Figure D.2: Wind Rose at Tower 5908 site, 60 m above ground level

Sheridan Science and Technology Park, 2800 Speakman Drive Mississauga, Ontario, Canada L5K 2R7 Tel 905 855 7600 Fax 905 855 8270