Embed Size (px)
Citation preview
Advisory Services Agreement on
Strengthening Planning and Budgeting Capacity and Supporting the Introduction of Performance Budgeting (P156889)
Output No. 3Institutional Strategic Plan 2017-2020 for the Ministry of National Education
April 2017
Project co-financed from the European Social Fund through the Operational Programme for Administrative Capacity 2014-2020
0

This report has been delivered under the Advisory Services Agreement on Strengthening Planning and Budgeting Capacity and Supporting the Introduction of Performance Budgeting signed between the General Secretariat of the Government and the International Bank for Reconstruction and Development on June 8, 2016. It corresponds to Output 3 under the above-mentioned agreement.
Disclaimer
This report is a product of the International Bank for Reconstruction and Development / the World Bank. The findings, interpretation, and conclusions expressed in this paper do not necessarily reflect the views of the Executive Directors of the World Bank or the governments they represent. The World Bank does not guarantee the accuracy of the data included in this work.
This report does not necessarily represent the position of the European Union or the Romanian Government.
Copyright Statement
The material in this publication is copyrighted. Copying and/or transmitting portions of this work without permission may be a violation of applicable laws.
For permission to photocopy or reprint any part of this work, please send a request with the complete information to either: (i) the General Secretariat of the Government (1 Victoriei Square, Bucharest, Romania); or (ii) the World Bank Group Romania (Vasile Lascăr Street, No 31, Et 6, Sector 2, Bucharest, Romania).
1
Table of Contents
List of Acronyms..............................................................................................................................3
List of Figures..................................................................................................................................3
List of Tables....................................................................................................................................4
List of Graphs...................................................................................................................................5
Preamble.........................................................................................................................................7
Executive Summary.........................................................................................................................9
I. Context.......................................................................................................................................11
II. Mission and Vision.....................................................................................................................14
III. Strategic Objectives, Programs, Measures and Indicators..........................................................15
Strategic Objective 1: The reduction and prevention of early school leaving and promoting equal access to quality education at all school levels.................................................................................15
Strategic Objective 2: In 2020 Romania will have a tertiary education sector that can energize economic growth, contribute to increased productivity and promote social cohesion, thus serving as the foundation of a knowledge-based economy..........................................................................26
Strategic Objective 3: To develop an initial and continuous vocational education and training system adapted to the needs of the labour market and direct beneficiaries...................................37
Strategic Objective 4: In 2020 Romania will have an educational and training system that is able to fully valorize human capital for the objective of smart and sustainable growth..............................46
Strategic Objective 5: Improve the institutional framework of educational, research and science sector...............................................................................................................................................54
IV. Arrangements for the Implementation, Monitoring and Evaluation of the ISP...........................60
V. Financial Resources...................................................................................................................63
Annexes.........................................................................................................................................65
Annex 1.a: Budgetary Programs and Financial Resources 2017-2020..............................................65
Annex 1.b: Education budget breakdown per years (2017-2020) and specific measures.................68
Annex 2: Institutional Strategic Plan (summary table)....................................................................80
Annex 3: Programs, related Measures and Outputs (summary table).............................................86
Annex 4: Institutional Profile........................................................................................................112
2
List of Acronyms
ES
GoR
ECEC
ESIF
ESL
ETM
EU
GDP
GSG
ISP
IT
M&E
MNE
MoPF
NIS
Education Sector
Government of Romania
Early Childhood Education and Care
European Social and Investment Funds
Early School Leaving
Education and Training Monitor
European Union
Gross Domestic Product
General Secretariat of the Government
Institutional Strategic Plan
Information Technology
Monitoring and Evaluation
Ministry of National Education
Ministry of Public Finance
National Institute of Statistics
OECD
PIRLS
Organisation for Economic Co-operation and Development
Progress in International Reading Literacy Study
RAS
ROSE
TIMSS
VET
Reimbursable Advisory Services
Romania Secondary Education Project
Trends in International Mathematics and Science Study
Vocational Education and Training
List of Figures
Figure 1. Strategic Objective 1: Structure on Programs and Measures................................................18
Figure 2. Strategic Objective 1: Impacts, outcomes and indicators......................................................19
Figure 3. Strategic Objective 2 : Structure on Programs and Measures...............................................29
Figure 4. Strategic Objective 2: Impacts, outcomes and indicators......................................................30
Figure 5. Strategic Objective 3: Structure on Programs and Measures................................................39
Figure 6. Strategic Objective 3: Impacts, outcomes and indicators......................................................40
Figure 7. Strategic Objective 4: Structure on Programs and Measures................................................49
3
Figure 8. Strategic Objective 4: Impacts, outcomes and indicators......................................................50
Figure 9. Strategic Objective 5: Structure on Programs and Measures................................................55
Figure 10. Strategic Objective 5: Impacts, outcomes and indicators....................................................56
Figure 11. Monitoring Cycle for MNE Strategic Plan............................................................................61
Figure 12. Sub-programs (sets of measures) within the school education program..........................124
Figure 13. Sub-program on fostering access to school education......................................................125
Figure 14. Sub-program on provision of quality school education.....................................................126
Figure 15. Sub-programs of the tertiary education program..............................................................127
Figure 16. Measures for enhancing competitiveness /quality of higher education institutions.........128
List of Tables
Table 1. Strategic Objective 1: Breakdown of financing by budgetary program (thousand RON)........19
Table 2. Strategic Objective 2: Breakdown of financing by budgetary program (thousand RON)........31
Table 3. Employment rates of graduates in ISCED 3 level vocational, 1 to 3 years after graduation....38
Table 4. Strategic Objective 3: Breakdown of financing by budgetary program (thousand RON)........40
Table 5. Number and educational units by level of education and area type (2014)...........................48
Table 6. Number of Education Institutions (legal entities and sattelites).............................................48
Table 7. Strategic Objective 4: Breakdown of financing by budgetary program (thousand RON)........50
Table 8. Strategic Objective 5: Breakdown of financing by budgetary program (thousand RON)........56
Table 9. Financial resources for operationalizing the 2017-20 ISP (thousand RON).............................63
Table 10. Number and educational units by level of education and area type (2014).......................117
Table 11. Number of Education Institutions (legal entities and satellites).........................................117
Table 12. Transition rates into upper - secondary education (2009 - 2015) by educational route and gender................................................................................................................................................119
Table 13. Multi-annual program-based budget of the Ministry of Education....................................123
Table 14. Main chapters of the Ministry's priorities in negotiating the budget (% of measures).......123
Table 15. % of mention of measures fostering access in the school education program (% in total measures)...........................................................................................................................................124
Table 16. % of mention of measures aiming at quality in the school education program (% in total measures)...........................................................................................................................................126
Table 17. % of measures aiming at quality/competitiveness of higher education (% of total measures)...........................................................................................................................................................128
List of Graphs
4
Graph 1. Early leavers from education and training (%).......................................................................12
Graph 2. Percent of 15 year-old students achieving minimum proficiency in PISA by domain (level 2 or above)..................................................................................................................................................13
Graph 3. Evolution of early school leaving rate in Romania and the EU...............................................15
Graph 4. Comparative data of early school leaving in several European countries (percentages in the 18-24 years old)....................................................................................................................................16
Graph 5. The evolution of ESL in Romania across development regions..............................................16
Graph 6. Evolution of tertiary attainment levels in Romania and the European Union........................26
Graph 7. Tertiary attainment levels - comparative data at European level..........................................27
Graph 8. Tertiary attainment levels in Romania across development regions.....................................28
Graph 9. The evolution of participation rates in education and training in Romania and the EU........37
Graph 10. Comparative data on the participation rates in education and training - selection of various European countries..............................................................................................................................38
Graph 11. Participation rates in the (share of participants 6-23) age group %.....................................46
Graph 12. Participation rates by level of education and place of residence (2014 / 2015 school year).............................................................................................................................................................47
Graph 13. Structure of the ISP budget, by funding sources (%, 2017-20).............................................63
Graph 14. Breakdown of estimated financial resources, by year and strategic objective (thousand RON, 2017-2020)..................................................................................................................................64
Graph 15. Early leavers from education and training (%)...................................................................112
Graph 16. Percent of 15 year-old students achieving minimum proficiency in PISA by domain (level 2 or above)............................................................................................................................................113
Graph 17. Participation rate in education and training (% of 18-64 age group), selected countries (2009-2015)........................................................................................................................................114
Graph 18. Participation rates in the (share of participants 6 -23) age group %..................................116
Graph 19. Participation rates by level of education and place of residence (2014 / 2015 school year)...........................................................................................................................................................116
Graph 20. Graduation rates from upper secondary education (2009 - 2014) by sex..........................120
Graph 21. Enrolments in tertiary education between 2009-2015 (absolute numbers)......................121
5
Acknowledgments
This report was prepared by a team comprised of Catalin Pauna (TTL, Senior Economist), Alina Sava (Education Specialist), Mihai Păunescu, Mihai Vilnoiu and Costel Todor (World Bank experts). The report benefited from thoughtful comments from Mariana Moarcas (Senior Operations Officer), Corina Grigore (Operations Officer), and Oana Caraba (Operations Analyst), and overall guidance from Elisabetta Capannelli (Romania Country Manager), and Ivailo Izvorski (Practice Manager, Macro Economics and Fiscal Management).
The team would like to thank the staff at the General Secretariat of the Government (GSG) for the support and excellent collaboration provided throughout the elaboration of this report, and in particular to Secretary of State Radu Puchiu and General Director Dragos Negoiță. Counselor Radu Iacob and project team provided outstanding advice and project management. In addition, the team would like to thank the Ministry of National Education for the excellent collaboration, especially Director Valentin Popescu and Counselor Monica Munteanu.
6
Preamble
Rationale
The General Secretariat of the Government (GSG) has engaged the World Bank in a Reimbursable Advisory Services (RAS) to strengthen the planning, budgeting and policy monitoring capacity in the Center of the Government, Ministry of Public Finance (MoPF), and selected line ministries. With the purpose of enhancing the efficiency of public spending, the RAS focuses on i) further strengthening the existing Institutional Strategic Plan (ISP) development processes under the guidance of the General Secretariat of the Government (GSG); ii) building capacity in the government to monitor ISP updates and implementation with a common IT tool, developed with support from the Bank; and iii) developing a central dashboard in the GSG for reporting on the implementation of the high level ISP priorities of the selected ministries.
The defined activities of this RAS derive from the functional reviews of the Public Administration, which made evident that the public sector is suffering from a disconnect between planning and budgeting, leading to poor linkages between resources used and results. The government has therefore requested the Bank to help institutionalize a process for monitoring policy implementation, with clear roles and responsibilities for the GSG, the MoPF and the line ministries, using the methodologies, tools and processes developed under this RAS. This will be an integral part of the budgeting reforms promoted by the government. With the objective to make the strategic planning process compulsory for every ministry in Romania, the GSG is seeking that the ISP becomes a regular product developed by every ministry.
As one of the selected line ministries, the Ministry of National Education (MNE) has committed to undertaking a far-reaching reform program, covering both policy and public administration. Strengthening the strategic planning function in the education sector (ES) is an important component of this reform.
The development of an ISP for the budgeting cycle 2017-20 comes at a momentous time in the ES policy cycle 2014-20.
Romania adopted a set of education strategies to reduce early school leaving, improve tertiary education, vocational education and lifelong learning (also representing ex-ante conditionalities for the country’s access to European Funds), including measures for disadvantaged groups, especially Roma. Now the implementation of these strategies is included in the strategic plan of the ministry as well as a permanent monitoring and evaluation system. The achievement of important Europe 2020 targets assumed by Romania is at risk as the strategies needs speeding up their implementation. This is particularly evidenced by the share of early school leavers that reached an alarming 19.1 percent, actually having increased every year by 1 percent since 2013 while Romania’s target for 2020 is 11.3 percent.
These efforts are collectively expected to impact 4.1 mill people with the utilization of approximately €3.28 billion during of 7 years (2016-2022).
7
Methodology
The preparation of MNE’s draft ISP 2017-20 was carried out mostly over the period from August to November 2016, with some preparatory work conducted before. The process enjoyed a wide, steady and substantial engagement of all relevant MNE senior management and operational staff, as well as senior experts of the GSG.
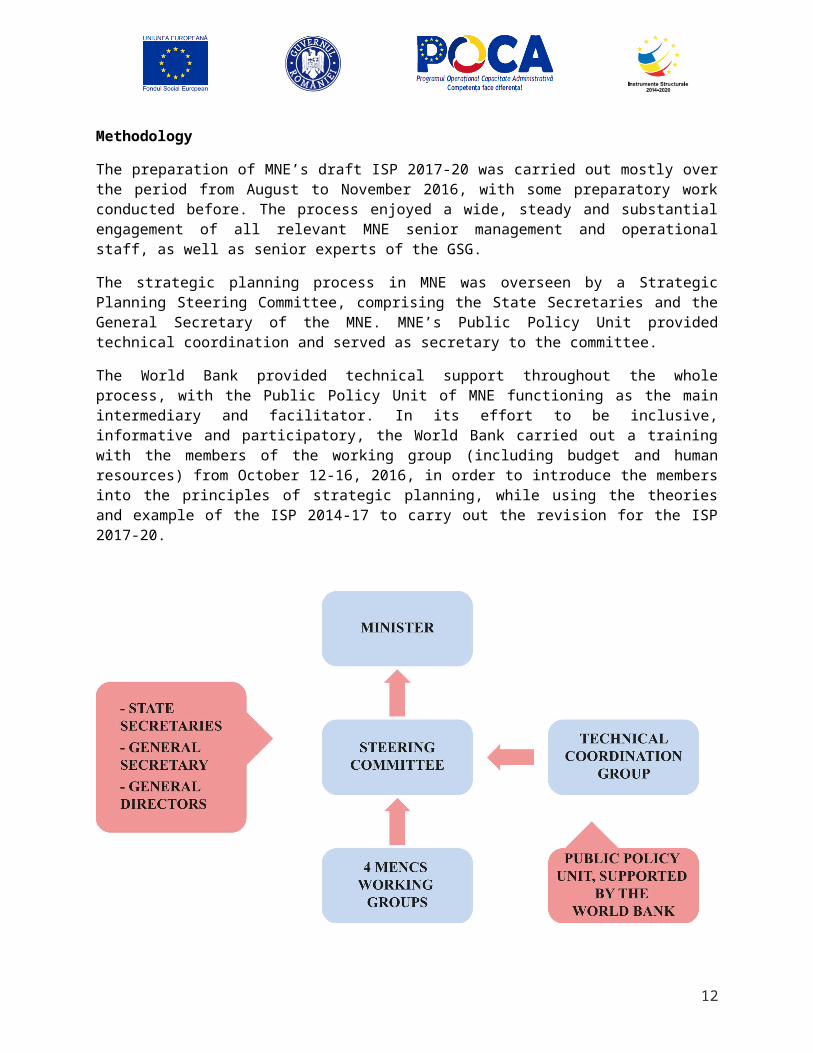
The strategic planning process in MNE was overseen by a Strategic Planning Steering Committee, comprising the State Secretaries and the General Secretary of the MNE. MNE’s Public Policy Unit provided technical coordination and served as secretary to the committee.
The World Bank provided technical support throughout the whole process, with the Public Policy Unit of MNE functioning as the main intermediary and facilitator. In its effort to be inclusive, informative and participatory, the World Bank carried out a training with the members of the working group (including budget and human resources) from October 12-16, 2016, in order to introduce the members into the principles of strategic planning, while using the theories and example of the ISP 2014-17 to carry out the revision for the ISP 2017-20.
The working group convened as needed from September 2016 until March 2017. The final product will be presented to the Steering Committee, and it is envisaged that the ISP will be approved by the Minister.
8
Executive Summary
The General Secretariat of the Government (GSG) is committed to enhance the efficiency of public spending. By establishing an Institutional Strategic Plan (ISP) for the budgeting cycle 2017-20 in the Ministry of Public Finance and selected thirteen line ministries, the GSG aims at strengthening the budgeting, planning and monitoring capacity of the Romanian government.
As the Ministry of National Education (MNE) had already drafted an ISP for the budget cycle 2015-17, the senior staff of MNE is familiar with this important tool for the implementation of strategic planning and budgeting and planning in the Romanian educational administration. The revised ISP 2017-20 amplifies the leading role that the MNE takes in developing an ISP within the Romanian government.
The ISP 2017-20 is anchored in the strategic objectives of the education sector (ES), institutional priorities and goals to which MNE is committed; it also provides clear programs and measures (including budgets) that are needed to achieve these goals in the medium-term, and a sound performance assessment framework to measure progress against these targets.
The ISP is structured along the main five strategic pillars for the ES, as follows:
OS1 - The reduction and prevention of early school leaving by promoting equal access to quality education at all school levels
This strategic objective rests on 3 programs:
(i) Program 1.1 - Increased access to Early Education and Care
(ii) Program 1.2 - Enhance the participation in primary and secondary education and attainment in compulsory education for all
(iii) Program 1.3 - Evaluation and quality assurance in primary and secondary education
OS2 - In 2020 Romania will have a tertiary education sector that can energize economic growth, contribute to increased productivity and promote social cohesion, thus serving as the foundation of a knowledge-based economy.
The three main programs to support this strategic objective are:
(i) Program 2.1 - Committing the Sector to diversity, access and improved Attainment in all Areas
(ii) Program 2.2 - Promoting the Establishment of High Quality, Adaptive Academic Programs
(iii) Program 2.3 - Promoting Strategic Engagement with Economy
9
OS3 - To develop an initial and continuous vocational education and training system adapted to the needs of the labour market and direct beneficiaries
Three programs support this strategic objective:
(i) Program 3.1 - Increase participation and facilitate access to initial and in-service education and training programs
(ii) Program 3.2 - Improve the relevance of the vocational education and training systems for the labour market
(iii) Program 3.3 - Develop national and international cooperation in vocational education and training
OS4 - In 2020 Romania will have an educational and training system that is able to fully valorize human capital for the objective of smart and sustainable growth
This strategic objective rests on the following 2 programs:
(i) Program 4.1 - Capital investments in education.
(ii) Program 4.2 - Supporting students to Baccalaureate exam and facilitate transition for better access in higher education.
OS5 - Improve the institutional framework
This is based on Program 5.1, which aims to build a knowledge-driven, lean and information-based ES administration.
10
I. Context
The Romanian education system consists of more than 19,200 education units and institutions offering educational services ranging from early childhood to tertiary education. More than 3.4 million students are currently enrolled in these education institutions.
The Romanian school's educational ideal is the free, comprehensive and harmonious human individuality development by assuming a value system centered on the personal fulfillment, social inclusion and competitiveness in the labor market. The primary aim or purpose of children, youth and adult education and training, as stated in the national education law is the development of competences, skills / abilities and knowledge required for:
a. Personal fulfillment by achieving their goals in life, according to the interests and aspirations of each, and a commitment to learn throughout life;
b. social integration and participation as active citizens in the society;
c. Filling a job and participating in the operation and development of a sustainable economy;
d. Development of a concept of life, based on scientific and humanistic values, on national and universal culture and fostering intercultural dialogue;
e. Development of a culture of dignity, tolerance and respect for human rights and fundamental freedoms;
f. Growing sensitivity towards human problems, moral and civic values to and respect for nature and the natural environment, social and cultural.
The analysis of the Romanian education system shows that ever widening gaps exists along the lines of gender and area of residence in terms of key objectives from the point of view of European and global concerns in education.
Female students participate more in education then male students, while rural areas are at a constant disadvantage compared to urban ones in terms of participation, school infrastructure and human resources engaged in the system and, along these, the school drop-out is a system wide phenomenon, affecting all levels of education.1
The link between education and the labor market seems to be less and less visible since unemployment for young people is not related to their level of educational attainment. VET education, after a process of dismantling between 2009 – 2014 shows that it is an increasingly preferred educational route in the
1 School drop-out rate - 1.5% of the pupils starting the school year for primary and secondary education in each grade (from preparatory grade which marks the entry to compulsory education until the end of the eighth grade). At upper-secondary level dropout averages 2.8% of the cohort for each grade and is significantly higher for male students, which constantly record higher values than female students (e.g. at the end of the 2014 school year 3.2% of the boys left upper-secondary education compared to 2.4% of girls).
11
context of rather low performance rates at national exams at the end of the eighth grade and the national baccalaureate exam.
Education as a whole is still massively underfunded, with around 3.70% of GDP allocated towards education through various sources. Fragmentation of financing of education, especially at the pre-university level, is a major challenge, since a unitary strategy and policies are difficult to implement at this stage, due to the large number of administrative organizational actors involved in financing education.
While the largest share of educational spending goes to finance salaries of teaching personnel, salaries are still among the lowest by comparison with other EU member states and huge salary differences exist between entry level and senior employees. Thus, the teaching profession is still an unattractive career for young professionals, which leads to an increasing share of unqualified personnel being hired in the educational system on a temporary basis.
Romania is part of EU market and the education and training processes are linked with the European policies and try follow the four strategic objectives set under European Commissions’ Council conclusions of 12 May 2009 on a strategic framework for European cooperation in education and training (‘ET 2020’)2 upon in the timeframe of 2020: making lifelong learning and mobility a reality; improving the quality and efficiency of education and training; promoting equity, social cohesion and active citizenship; enhancing creativity and innovation, including entrepreneurship, at all levels of education and training.
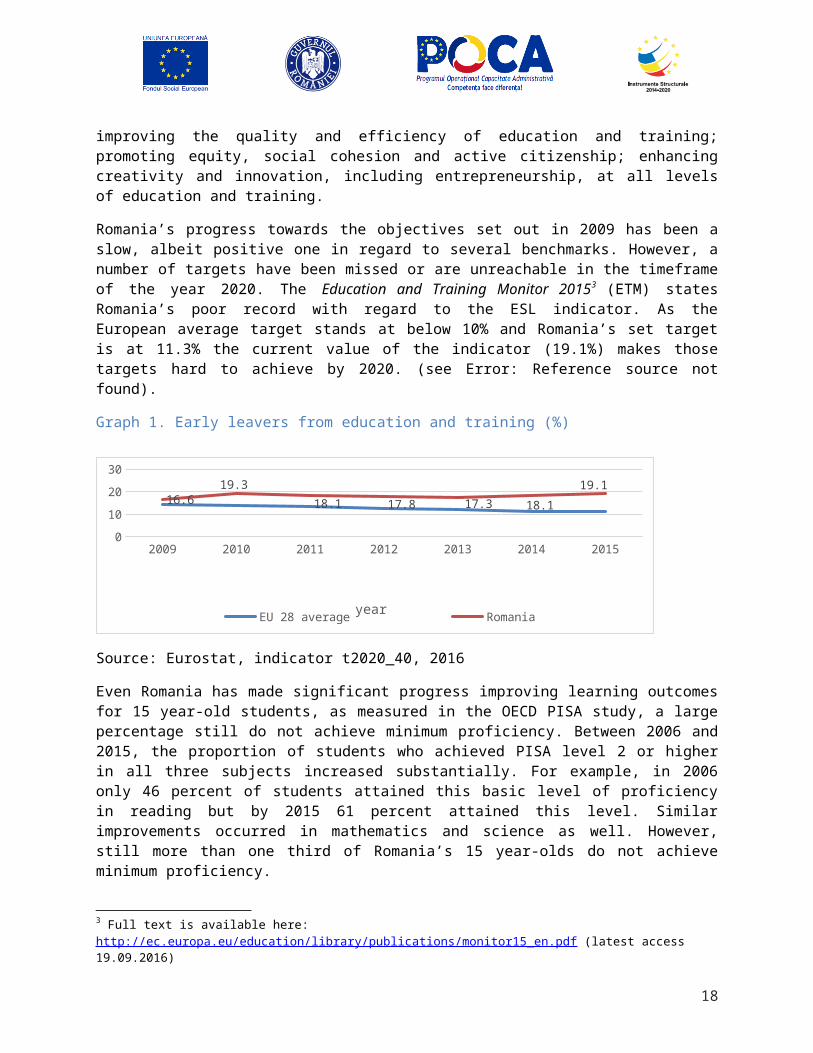
Romania’s progress towards the objectives set out in 2009 has been a slow, albeit positive one in regard to several benchmarks. However, a number of targets have been missed or are unreachable in the timeframe of the year 2020. The Education and Training Monitor 20153 (ETM) states Romania’s poor record with regard to the ESL indicator. As the European average target stands at below 10% and Romania’s set target is at 11.3% the current value of the indicator (19.1%) makes those targets hard to achieve by 2020. (see Error: Reference source not found).
Graph 1. Early leavers from education and training (%)
Source: Eurostat, indicator t2020_40, 2016
2 Document no. 2009/C 119/023 Full text is available here: http://ec.europa.eu/education/library/publications/monitor15_en.pdf (latest access 19.09.2016)
12
2009 2010 2011 2012 2013 2014 20150
5
10
15
20
25
16.6
19.3
18.1 17.8 17.3 18.1
19.1
EU 28 average Romania
year
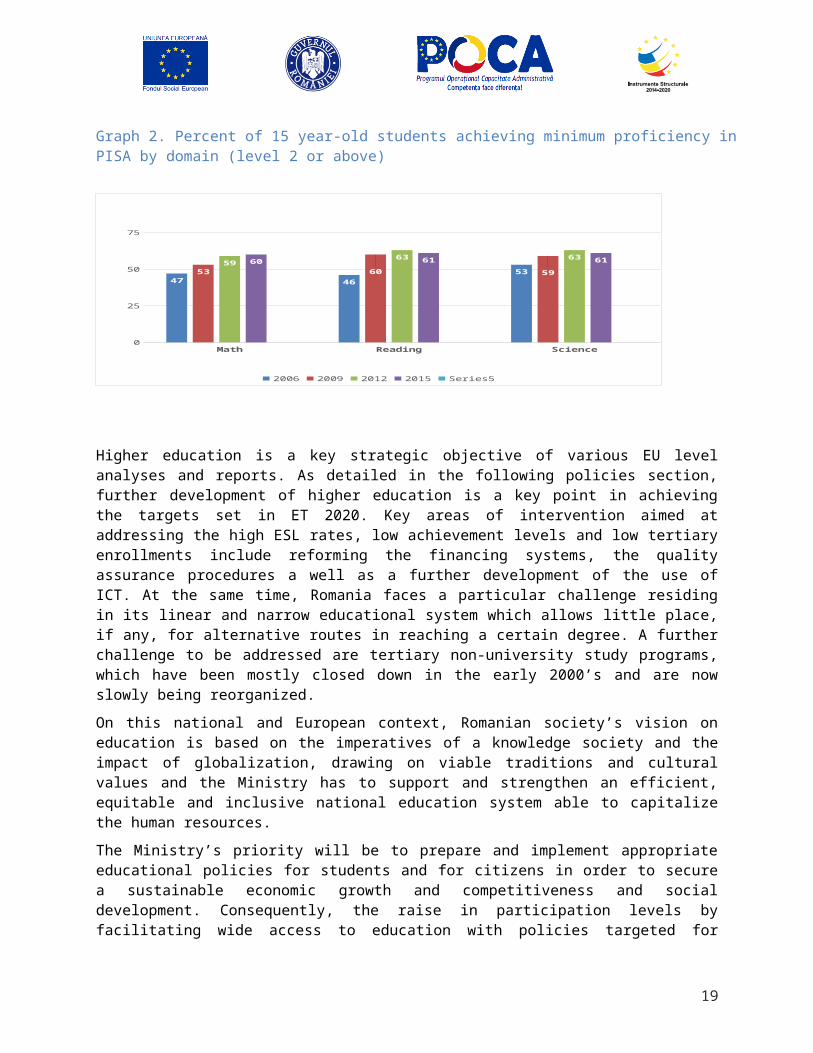
Even Romania has made significant progress improving learning outcomes for 15 year-old students, as measured in the OECD PISA study, a large percentage still do not achieve minimum proficiency. Between 2006 and 2015, the proportion of students who achieved PISA level 2 or higher in all three subjects increased substantially. For example, in 2006 only 46 percent of students attained this basic level of proficiency in reading but by 2015 61 percent attained this level. Similar improvements occurred in mathematics and science as well. However, still more than one third of Romania’s 15 year-olds do not achieve minimum proficiency.
Graph 2. Percent of 15 year-old students achieving minimum proficiency in PISA by domain (level 2 or above)
Higher education is a key strategic objective of various EU level analyses and reports. As detailed in the following policies section, further development of higher education is a key point in achieving the targets set in ET 2020. Key areas of intervention aimed at addressing the high ESL rates, low achievement levels and low tertiary enrollments include reforming the financing systems, the quality assurance procedures a well as a further development of the use of ICT. At the same time, Romania faces a particular challenge residing in its linear and narrow educational system which allows little place, if any, for alternative routes in reaching a certain degree. A further challenge to be addressed are tertiary non-university study programs, which have been mostly closed down in the early 2000’s and are now slowly being reorganized.
On this national and European context, Romanian society’s vision on education is based on the imperatives of a knowledge society and the impact of globalization, drawing on viable traditions and cultural values and the Ministry has to support and strengthen an efficient, equitable and inclusive national education system able to capitalize the human resources.
The Ministry’s priority will be to prepare and implement appropriate educational policies for students and for citizens in order to secure a sustainable economic growth and competitiveness and social development. Consequently, the raise in participation levels by facilitating wide access to education with policies targeted for disadvantaged groups, the enhancement in school retention and attainment levels are the main priorities for the period 2017-2020.
Additionally, the enhancement of the managerial capacity in order to implement evidence-based policies and to absorb EU funds for financing the policy objectives will be pursued by priority.
In this context, the Ministry of National Education has developed a medium term Institutional Strategic Plan 2017 to operationalize the long term vision of Romania’s educational system.
13
Math Reading Science0
25
50
75
47 465353 60 59
5963 63
60 61 61
2006 2009 2012 2015 Series5
II. Mission and Vision
MNE’s Mission
To create and consolidate a national education system that is efficient, equitable and inclusive and able to achieve the full potential of the human capital with a view of raising the competitiveness of the national economy and the now and present Romanian society.
A well-performing education means that Romania’s full human capital potential can be harnessed to the objective of economic growth and social development.
The above goal cannot be reached without creating and implementing appropriate, coherent and stable public policies that meet the consensus of the largest possible number of stakeholders in education and research and development sector.
MNE has to develop and implement the public policies in the education sector within the framework of European Union’s policies. This is not a simple, passive act of adopting a European policy; rather, it is an active one that promotes Romania’s own solutions, consistently with the country’s needs, and is agreed with MNE’s partners.
The support for Romania’s education research and science areas brings benefits to the country and to the region. Such benefits, when quantified, exceed in value the short and long term costs, which confirm the responsibility of creating consistent and sustainable sectorial public policies and strategies.
MNE’s Vision
The Ministry's vision is based on the commitment to develop the national system of education centred on national and European values, creativity, knowledge, competences and abilities for personal development, entrepreneurship, active citizenship, social inclusion and professional development. As a central public organization, the Ministry commits to be a trustworthy, transparent and responsible organization, working to serve the education sector, the learning community and society as a whole.
The Ministry of Education is the main public institution responsible for education, research and development policies in Romania.
The Ministry assumes this responsibility observing the highest standards of transparency, accountability and integrity, in collaboration with other public institutions, the private sector and civil society organizations.
The Ministry strives to improve its management capacity and organizational performance in order to deal with the significant responsibilities entrusted to it by the Romanian citizens.
The Ministry is responsive to the citizens’ needs. It is interested in the problems, opinions and the dialogue with the citizens and continuously measures the results of its actions in order to adjust its activity to the demand.
14
III.Strategic Objectives, Programs, Measures and Indicators
Strategic Objective 1: The reduction and prevention of early school leaving and promoting equal access to quality education at all school levels
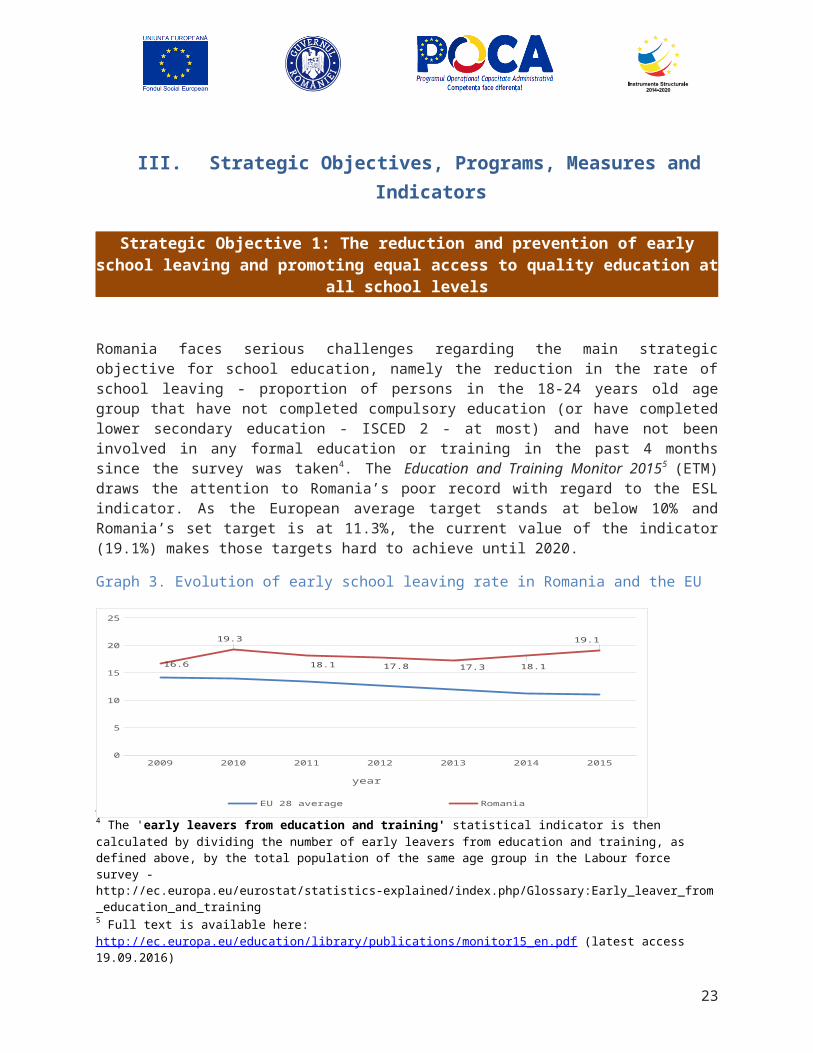
Romania faces serious challenges regarding the main strategic objective for school education, namely the reduction in the rate of school leaving - proportion of persons in the 18-24 years old age group that have not completed compulsory education (or have completed lower secondary education - ISCED 2 - at most) and have not been involved in any formal education or training in the past 4 months since the survey was taken4. The Education and Training Monitor 20155 (ETM) draws the attention to Romania’s poor record with regard to the ESL indicator. As the European average target stands at below 10% and Romania’s set target is at 11.3%, the current value of the indicator (19.1%) makes those targets hard to achieve until 2020.
Graph 3. Evolution of early school leaving rate in Romania and the EU
Source: Eurostat, indicator t2020_40, 2016
There is even more reason of concern as data provided shows that Romania is, along with three other countries, in the group of states for which the situation is worst […] combining early school leaving rates above 10% with a lack of progress between 2011 and 20146.
4 The 'early leavers from education and training' statistical indicator is then calculated by dividing the number of early leavers from education and training, as defined above, by the total population of the same age group in the Labour force survey - http://ec.europa.eu/eurostat/statistics-explained/index.php/Glossary:Early_leaver_from_education_and_training5 Full text is available here: http://ec.europa.eu/education/library/publications/monitor15_en.pdf (latest access 19.09.2016)6 ET Monitor 2015, p.34
15
2009 2010 2011 2012 2013 2014 20150
5
10
15
20
25
16.6
19.3
18.1 17.8 17.3 18.1
19.1
EU 28 average Romania
year
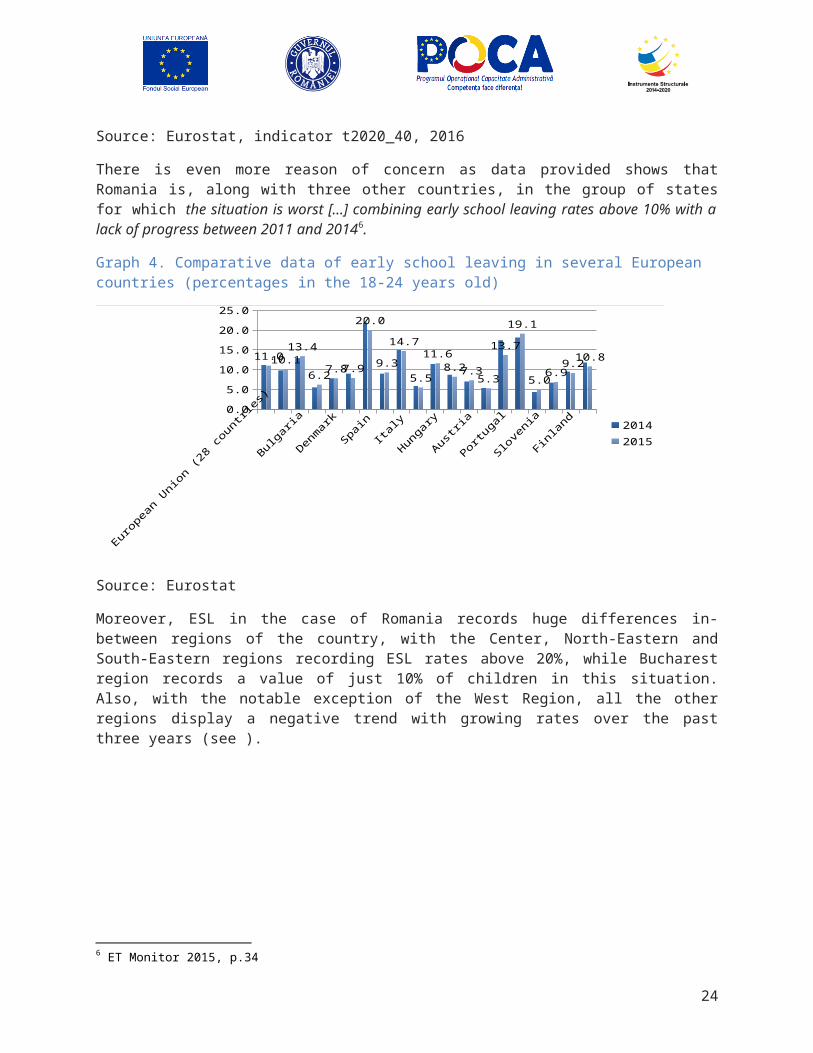
Graph 4. Comparative data of early school leaving in several European countries (percentages in the 18-24 years old)
Euro
pean U
nion (2
8 countri
es)
Belgiu
m
Bulgaria
Czech
Rep
ublic
Denm
ark
Greec
e
Spain
Fran
ceIta
ly
Lithuan
ia
Hungary
Nether
lands
Austria
Poland
Portuga
l
Roman
ia
Slove
nia
Slova
kia
Finlan
d
United K
ingd
om0.0
5.0
10.0
15.0
20.0
25.0
11.010.1
13.4
6.27.8 7.9
20.0
9.3
14.7
5.5
11.6
8.2 7.35.3
13.7
19.1
5.06.9
9.210.8
20142015
Source: Eurostat
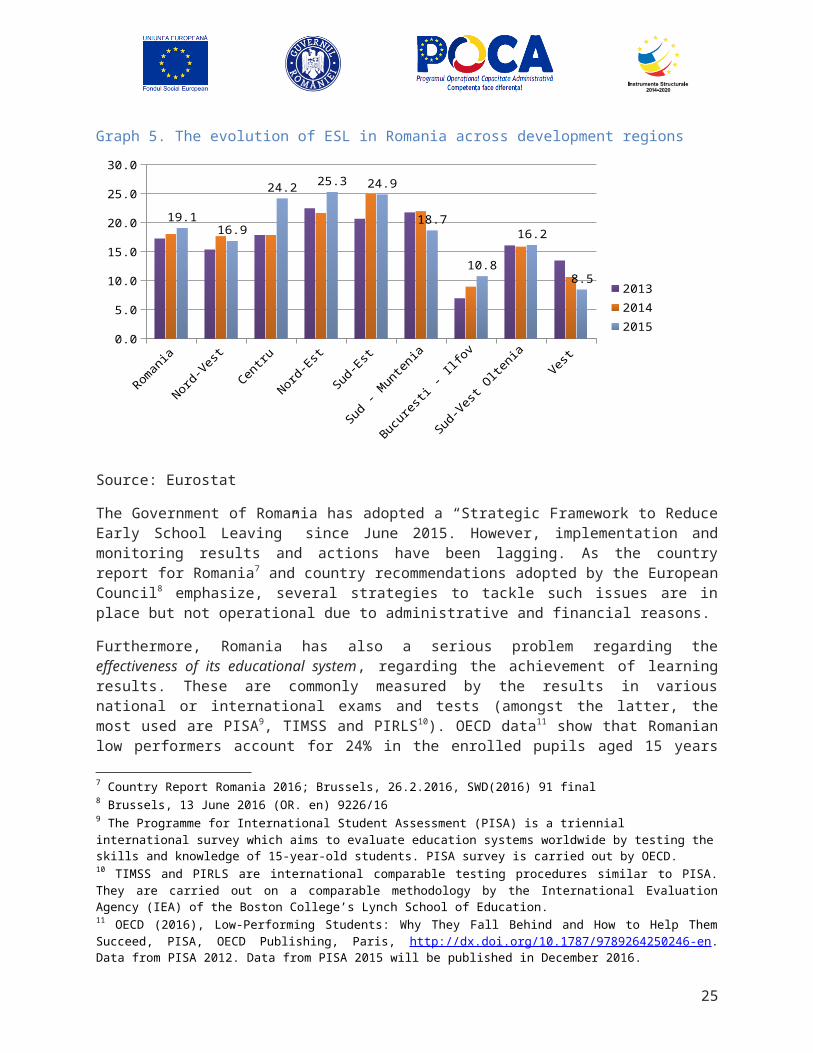
Moreover, ESL in the case of Romania records huge differences in-between regions of the country, with the Center, North-Eastern and South-Eastern regions recording ESL rates above 20%, while Bucharest region records a value of just 10% of children in this situation. Also, with the notable exception of the West Region, all the other regions display a negative trend with growing rates over the past three years (see ).
Graph 5. The evolution of ESL in Romania across development regions
Romania
Nord-Vest
Centru
Nord-Es
t
Sud-Es
t
Sud - M
untenia
Bucures
ti - Ilfo
v
Sud-Ves
t Olte
niaVest
0.0
5.0
10.0
15.0
20.0
25.0
30.0
19.116.9
24.225.3 24.9
18.7
10.8
16.2
8.5
201320142015
Source: Eurostat
16
The Government of Romania has adopted a “Strategic Framework to Reduce Early School Leaving” since June 2015. However, implementation and monitoring results and actions have been lagging. As the country report for Romania7 and country recommendations adopted by the European Council8
emphasize, several strategies to tackle such issues are in place but not operational due to administrative and financial reasons.
Furthermore, Romania has also a serious problem regarding the effectiveness of its educational system, regarding the achievement of learning results. These are commonly measured by the results in various national or international exams and tests (amongst the latter, the most used are PISA9, TIMSS and PIRLS10). OECD data11 show that Romanian low performers account for 24% in the enrolled pupils aged 15 years old in all subjects12. Individually, for maths, reading and sciences the proportion of low achievers is higher and hovers around 37%, with mathematics recording the highest proportion of low achievers with 40% of the pupils.
Low achievement of Romanian pupils is also documented by referring to results from TIMSS and PIRLS, which test fourth and eighth grade students’ abilities in reading, mathematics and sciences. Results 13
from the latest wave of testing show that approximately 27% of fourth graders in Romania fail to reach the lowest benchmark for all three subjects in international comparisons, among participating countries.
The ET Monitor 201514 mentions that low achievement among Romanian pupils marks a wide difference between children according to their families socio economic status index (SES). Based on PISA data 60% of children aged 15 with a low SES underperform in mathematics, while almost 15% of those with a high SES have low performances in the same testing subject.
ESL and low achievement are two of the most important issues facing the Romanian education system at school level. They are both linked with the SES of families and its influence upon education participation and achievement of children. They also have a bearing on other strategic indicators, such as tertiary education attainment, employment and even adult participation in lifelong learning, since they influence the way future adults relate to education during their lifetime.
7 Country Report Romania 2016; Brussels, 26.2.2016, SWD(2016) 91 final8 Brussels, 13 June 2016 (OR. en) 9226/169 The Programme for International Student Assessment (PISA) is a triennial international survey which aims to evaluate education systems worldwide by testing the skills and knowledge of 15-year-old students. PISA survey is carried out by OECD.10 TIMSS and PIRLS are international comparable testing procedures similar to PISA. They are carried out on a comparable methodology by the International Evaluation Agency (IEA) of the Boston College’s Lynch School of Education. 11 OECD (2016), Low-Performing Students: Why They Fall Behind and How to Help Them Succeed, PISA, OECD Publishing, Paris, http://dx.doi.org/10.1787/9789264250246-en. Data from PISA 2012. Data from PISA 2015 will be published in December 2016.12 Calculation based on tables published in OECD (2016), p. 48 (Table 1.7 part 2/2)13 Timss and pirls 2011: Relationships Among Reading, Mathematics, and Science Achievement at the Fourth Grade—Implications for Early Learning (2013), available online: http://timss.bc.edu/timsspirls2011/downloads/TP11_Relationship_Report.pdf14 page 19
17
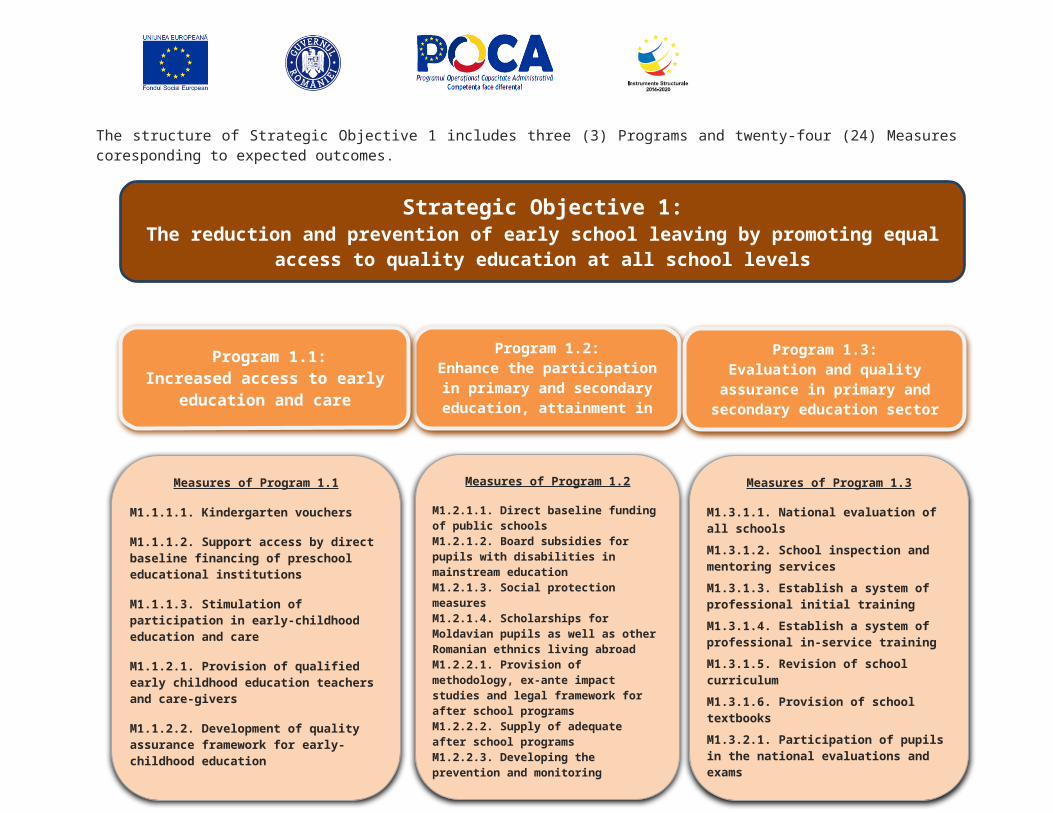
The structure of Strategic Objective 1 includes three (3) Programs and twenty-four (24) Measures coresponding to expected outcomes.
18
Strategic Objective 1: The reduction and prevention of early school leaving by promoting equal access to quality education at
all school levels
Program 1.2:Enhance the participation in primary and secondary education, attainment
in compulsory education for all
Program 1.3:Evaluation and quality assurance in
primary and secondary education sector
Measures of Program 1.2
M1.2.1.1. Direct baseline funding of public schoolsM1.2.1.2. Board subsidies for pupils with disabilities in mainstream education M1.2.1.3. Social protection measuresM1.2.1.4. Scholarships for Moldavian pupils as well as other Romanian ethnics living abroadM1.2.2.1. Provision of methodology, ex-ante impact studies and legal framework for after school programsM1.2.2.2. Supply of adequate after school programs M1.2.2.3. Developing the prevention and monitoring capacity of segregation in schools M1.2.2.4. Provide teacher training in the area of early warning, prevention and intervention systems to detect children at risk of repetition and dropoutM1.2.2.5. Complete and support existing fragmented counseling initiatives
Measures of Program 1.3
M1.3.1.1. National evaluation of all schools
M1.3.1.2. School inspection and mentoring services
M1.3.1.3. Establish a system of professional initial training
M1.3.1.4. Establish a system of professional in-service training
M1.3.1.5. Revision of school curriculum
M1.3.1.6. Provision of school textbooks
M1.3.2.1. Participation of pupils in the national evaluations and exams
M1.3.2.2. Participation of pupils in the PISA international evaluation
M1.3.2.3. Support excellence through supplementary financing of accredited school education institutions
Program 1.1:Increased access to early education
and care
Measures of Program 1.1
M1.1.1.1. Kindergarten vouchers
M1.1.1.2. Support access by direct baseline financing of preschool educational institutions
M1.1.1.3. Stimulation of participation in early-childhood education and care
M1.1.2.1. Provision of qualified early childhood education teachers and care-givers
M1.1.2.2. Development of quality assurance framework for early-childhood education
M1.1.2.3. Develop the curricular framework for early childhood education
Figure 1. Strategic Objective 1: Structure on Programs and Measures
19

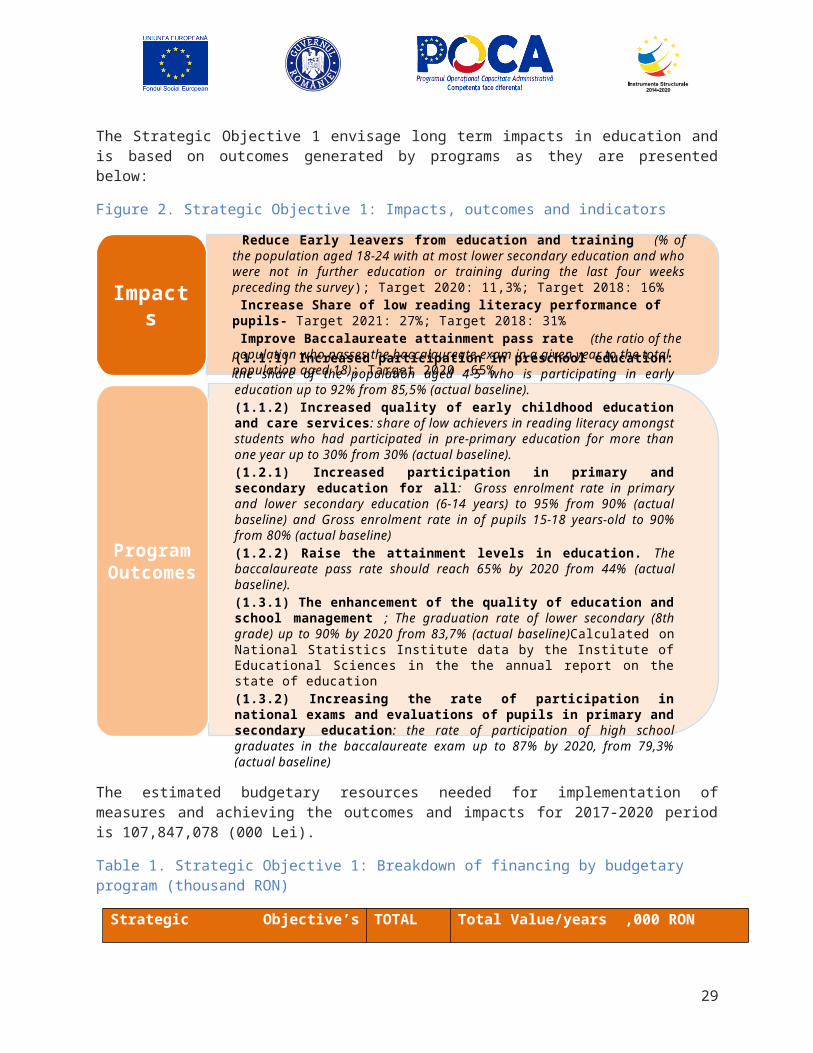
The Strategic Objective 1 envisage long term impacts in education and is based on outcomes generated by programs as they are presented below:
Figure 2. Strategic Objective 1: Impacts, outcomes and indicators
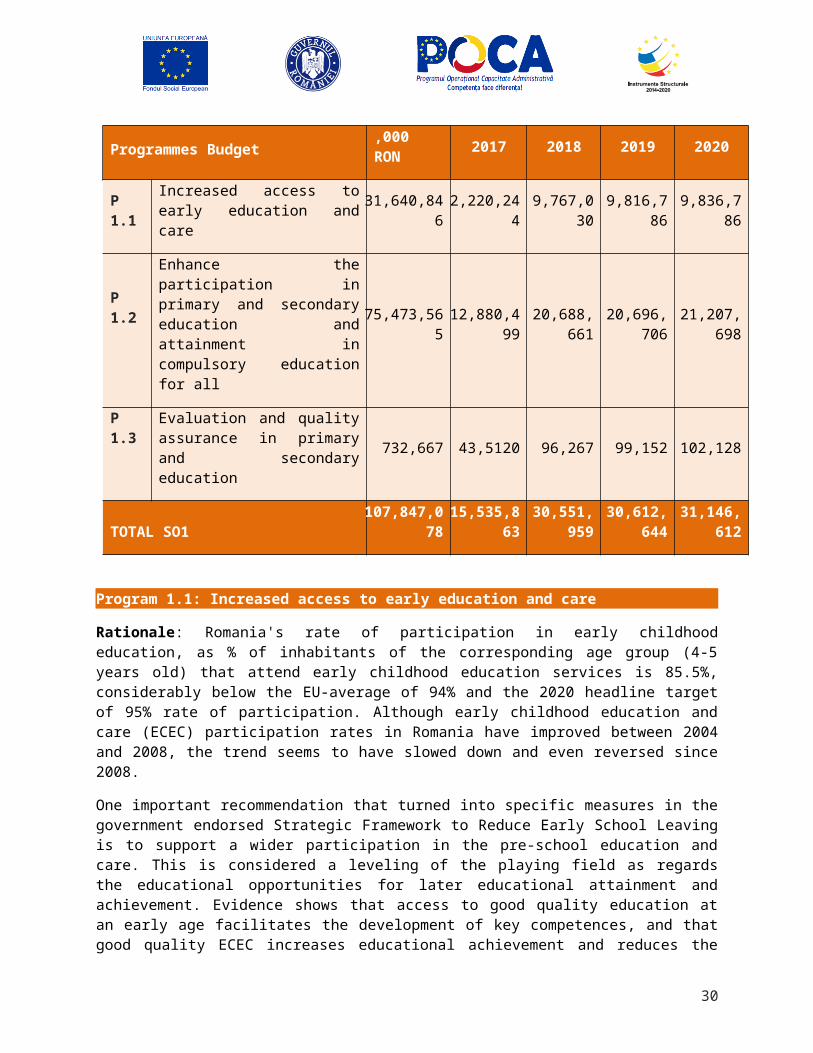
The estimated budgetary resources needed for implementation of measures and achieving the outcomes and impacts for 2017-2020 period is 107,847,078 (000 Lei).
Table 1. Strategic Objective 1: Breakdown of financing by budgetary program (thousand RON)
Strategic Objective’s Programmes Budget
TOTAL ,000 RON
Total Value/years ,000 RON
2017 2018 2019 2020
P 1.1 Increased access to early education and care 31,640,846 2,220,244 9,767,030 9,816,786 9,836,786
20
Reduce Early leavers from education and training (% of the population aged 18-24 with at most lower secondary education and who were not in further education or training during the last four weeks preceding the survey); Target 2020: 11,3%; Target 2018: 16% Increase Share of low reading literacy performance of pupils- Target 2021: 27%; Target 2018: 31% Improve Baccalaureate attainment pass rate (the ratio of the population who passes the baccalaureate exam in a given year to the total population aged 18); Target 2020 -65%
Impacts
(1.1.1) Increased participation in preschool education: the share of the population aged 4-5 who is participating in early education up to 92% from 85,5% (actual baseline). (1.1.2) Increased quality of early childhood education and care services: share of low achievers in reading literacy amongst students who had participated in pre-primary education for more than one year up to 30% from 30% (actual baseline).(1.2.1) Increased participation in primary and secondary education for all: Gross enrolment rate in primary and lower secondary education (6-14 years) to 95% from 90% (actual baseline) and Gross enrolment rate in of pupils 15-18 years-old to 90% from 80% (actual baseline)(1.2.2) Raise the attainment levels in education. The baccalaureate pass rate should reach 65% by 2020 from 44% (actual baseline). (1.3.1) The enhancement of the quality of education and school management ; The graduation rate of lower secondary (8th grade) up to 90% by 2020 from 83,7% (actual baseline)Calculated on National Statistics Institute data by the Institute of Educational Sciences in the the annual report on the state of education(1.3.2) Increasing the rate of participation in national exams and evaluations of pupils in primary and secondary education: the rate of participation of high school graduates in the baccalaureate exam up to 87% by 2020, from 79,3% (actual baseline)
Program Outcomes
P 1.2
Enhance the participation in primary and secondary education and attainment in compulsory education for all
75,473,565 12,880,499 20,688,661 20,696,706 21,207,698
P 1.3 Evaluation and quality assurance in primary and secondary education
732,667 43,5120 96,267 99,152 102,128
TOTAL SO1 107,847,078 15,535,863 30,551,959 30,612,644 31,146,612
Program 1.1: Increased access to early education and care
Rationale: Romania's rate of participation in early childhood education, as % of inhabitants of the corresponding age group (4-5 years old) that attend early childhood education services is 85.5%, considerably below the EU-average of 94% and the 2020 headline target of 95% rate of participation. Although early childhood education and care (ECEC) participation rates in Romania have improved between 2004 and 2008, the trend seems to have slowed down and even reversed since 2008.
One important recommendation that turned into specific measures in the government endorsed Strategic Framework to Reduce Early School Leaving is to support a wider participation in the pre-school education and care. This is considered a leveling of the playing field as regards the educational opportunities for later educational attainment and achievement. Evidence shows that access to good quality education at an early age facilitates the development of key competences, and that good quality ECEC increases educational achievement and reduces the risk of ESL at a later stage 15. Flagship programme 1.1: specifically refers to increasing the access to Early Childhood Education and Care (ECEC).
Objectives: Program 1.1 is intended to achieve till 2020 the following outcomes:
- Increased participation in preschool education: the share of the population aged 4-5 who is participating in early education up to 92% from 85,5% (actual baseline).
- Increased quality of early childhood education and care services: share of low achievers in reading literacy amongst students who had participated in pre-primary education for more than one year up to 30% from 35% (actual baseline).
Description: Program 1.1 is aimed at the whole early childhood and care services, thus covering the age group between 0 and 6 years old, before the the starting age of compulsory primary education. It addresses both the beneficiaries of the programme, by stimulating the participation of pupils especially from socio-economically disadvantaged families, as well as the providers, by further developing the curricula, investments in teacher training as well as capital investments, especially in rural areas.
Success factors: In order to be able to face the challenges related to the participation of disadvantaged and rural pupils to early childhood education and care, direct financial incentives should be offered to
15 Strategic Framework to Reduce Early School Leaving
21
families, such as kindergarten and nursery vouchers in order to reduce the private costs of participation to education and increase the opportunity cost of not participating. At the same time, developing the curricular framework especially for 0-3 years old and provision of qualified teachers through initial teacher training are important for ensuring quality educational services across all the regions.
Coordination with key ministries (Ministry of Regional Development Public Administration and European Funds), local authorities and the Regional Operational Program, respectively the Competitiveness Program will be key in developing the pre-school infrastructure and IT endowments of these schools and kindergartens, especially in the rural areas that are quite sparsely covered with school infrastructure of this level.
Measures: The primary measures that will contribute to the achievement of the program specific objectives are included below. The allocated budgets are indicated in Annex 1, and the measure-related objectives and targets are indicated in Annex 3.
(1.1.1) To increase the participation to preschool education
Measures that address the participation:
1 - Kindergarten vouchers
2 - Support access by direct baseline financing of preschool educational institutions
3 - Stimulation of participation in early-childhood education and care by providing counseling services to parents, parental education programs and other support measures
(1.1.2) To increase the quality of early childhood education and care services
Measures that address the quality of service provision:
1 - Provision of qualified early childhood education teachers and care-givers
2 - Development of quality assurance framework for early-childhood education
3 - Develop the curricular framework for early childhood education
Program 1.2: Enhance the participation in primary and secondary education and attainment in compulsory education for all
Rationale: Romania faces serious challenges regarding the main strategic objective for school education, namely the reduction in the rate of school leaving - proportion of persons in the 18-24 years old age group that have not completed compulsory education (or have completed lower secondary education - ISCED 2 - at most) and have not been involved in any formal education or training in the past 4 months
22
since the survey was taken16. The Education and Training Monitor 201517 (ETM) draws the attention to Romania’s poor record with regard to the ESL indicator. As the European average target stands at below 10% and Romania’s set target is at 11.3%, the current value of the indicator (19.1%) makes those targets hard to achieve until 2020. There is even more reason for concern, as data provided shows that Romania is, along with three other countries, in the group of states for which the situation is worst […] combining early school leaving rates above 10% with a lack of progress between 2011 and 201418.
Moreover, ESL in the case of Romania exhibits huge differences between regions of the country, with the Center, North-Eastern and South-Eastern regions recording ESL rates above 20%, while Bucharest region records a value of just 10% of children in this situation. Also, with the notable exception of the West Region, all the other regions display a negative trend with growing rates over the past three years. Also, the urban-rural disparities are of great concern, with urban areas having already hit the European target (below 10%), while the rural areas deal with staggering levels of almost 30%.
The Government of Romania has adopted a “Strategic Framework to Reduce Early School Leaving” since June 2015. However, implementation and monitoring results and actions have been lagging. As the country report for Romania19 and country recommendations adopted by the European Council20
emphasize, several strategies to tackle such issues are in place but not operational due to administrative and financial reasons. Monitoring and evaluation (M&E) mechanisms comprised in such strategies are not operational at this point and transparency regarding actions taken is limited at best.
ESL is closely linked to another indicator set out by the Europe 2020 Agenda: Low achievers in basic skills. This has been defined as the proportion of low-achievers in reading, maths and sciences in international comparable testing, such as PISA. The target set out in 2009 is to reduce the proportion of low-achievers in the 15 years age group below 15%. According to the latest data published by the OECD21 Romanian low performers account for 24% in the enrolled pupils aged 15 years old in all subjects22. Individually, for maths, reading and sciences the proportion of low achievers is higher and hovers around 37%, with mathematics recording the highest proportion of low achievers with 40% of the pupils.
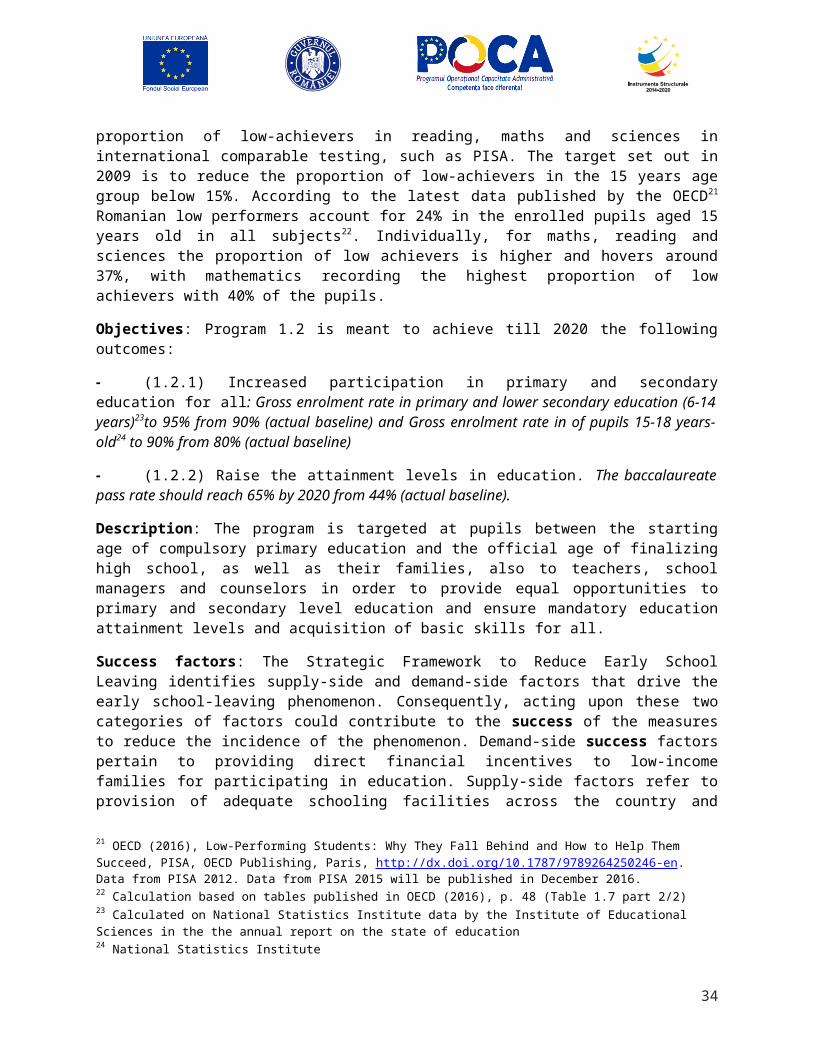
Objectives: Program 1.2 is meant to achieve till 2020 the following outcomes:
- (1.2.1) Increased participation in primary and secondary education for all: Gross enrolment rate in primary and lower secondary education (6-14 years)23to 95% from 90% (actual baseline) and Gross enrolment rate in of pupils 15-18 years-old24 to 90% from 80% (actual baseline)
16 The 'early leavers from education and training' statistical indicator is then calculated by dividing the number of early leavers from education and training, as defined above, by the total population of the same age group in the Labour force survey - http://ec.europa.eu/eurostat/statistics-explained/index.php/Glossary:Early_leaver_from_education_and_training17 Full text is available here: http://ec.europa.eu/education/library/publications/monitor15_en.pdf (latest access 19.09.2016)18 ET Monitor 2015, p.3419 Country Report Romania 2016; Brussels, 26.2.2016, SWD(2016) 91 final20 Brussels, 13 June 2016 (OR. en) 9226/1621 OECD (2016), Low-Performing Students: Why They Fall Behind and How to Help Them Succeed, PISA, OECD Publishing, Paris, http://dx.doi.org/10.1787/9789264250246-en. Data from PISA 2012. Data from PISA 2015 will be published in December 2016.22 Calculation based on tables published in OECD (2016), p. 48 (Table 1.7 part 2/2)23 Calculated on National Statistics Institute data by the Institute of Educational Sciences in the the annual report on the state of education24 National Statistics Institute
23
- (1.2.2) Raise the attainment levels in education. The baccalaureate pass rate should reach 65% by 2020 from 44% (actual baseline).
Description: The program is targeted at pupils between the starting age of compulsory primary education and the official age of finalizing high school, as well as their families, also to teachers, school managers and counselors in order to provide equal opportunities to primary and secondary level education and ensure mandatory education attainment levels and acquisition of basic skills for all.
Success factors: The Strategic Framework to Reduce Early School Leaving identifies supply-side and demand-side factors that drive the early school-leaving phenomenon. Consequently, acting upon these two categories of factors could contribute to the success of the measures to reduce the incidence of the phenomenon. Demand-side success factors pertain to providing direct financial incentives to low-income families for participating in education. Supply-side factors refer to provision of adequate schooling facilities across the country and especially in disadvantaged areas, provision of qualified teaching staff and school management. Moreover, as PISA studies show, school systems that make less use of stratification separating students into different schools, “tracks” and grade levels according to their ability or behaviour – show greater equity in education opportunities and outcomes25.
Measures: The primary measures that will contribute to the achievement of the program specific objectives are included below. The allocated budgets are indicated in Annex 1, and the measure-related objectives and targets are indicated in Annex 3.
(1.2.1) To increase the participation in primary and secondary education for all
1 - Direct baseline funding of public schools
2 - Board subsidies for pupils with disabilities in mainstream education
3 - Social protection measures: Money for high school program, Euro200, School supplies program, Milk and croissant program and Fruits in school program
4 - Scholarships for Moldavian pupils as well as other Romanian ethnics living abroad
(1.2.2) To raise the attainment levels in education
1 - Provision of methodology, ex-ante impact studies and legal framework for after school programs
2 - Supply of adequate after school programs
3 - Developing the prevention and monitoring capacity of segregation in schools
4 - Provide teacher training in the area of early warning, prevention and intervention systems to detect children at risk of repetition and dropout
25 http://www.oecd.org/pisa/keyfindings/pisa-2012-results-overview.pdf, p. 27
24
5 - Complete and support existing fragmented counseling initiatives for students within and outside of the education system
Program 1.3: Evaluation and quality assurance in primary and secondary education
Rationale: The quality of school management as well as the quality and relevance of educational services make the difference between well performing and poorly performing schools. No matter the volume of the public financial allocations to schools, these remain ineffective if there aren't evaluation and quality assurance mechanisms in place to ensure efficient use of public funds. The Law on National Education No. 1/2011, at art. 107, specifically states that the supplementary funding should be allocated to schools having high academic performances or schools that are highly inclusive.
At the same time, ensuring a high quality level in both education and school management should promote inclusiveness above all. It is already known that stratification in school systems, selecting students for different “tracks” or classes, is negatively related to equity and negatively affects students' motivation26.
Objectives: Program 1.3 is intended to achieve the following outcomes till 2020:
- (1.3.1) The enhancement of the quality of education and school management ; The graduation rate of lower secondary (8th grade)27 up to 90% by 2020 from 83,7% (actual baseline),
- (1.3.2) Increasing the rate of participation in national exams and evaluations of pupils in primary and secondary education: the rate of participation of high school graduates in the baccalaureate exam up to 87% by 2020, from 79,3% (actual baseline)
Description: The program evaluation and quality assurance specifically addresses the national evaluation of all schools, including external evaluation by an independent agency and continuous quality assurance through the Ministry's network of School Inspectorates. Furthermore, it addresses the supply of quality educational services through the initial teacher training through specific programs (Didactic Masters Program). Not least, the further development of national curriculum for the 5th - 8th grades is a measure that supports provision of quality and effective education. It also recognizes and flags outstanding achievement by awarding prizes for pupils' with outstanding results in national or international school contests and competitions
Success factors: Professional management, professionalization of the teaching career and active promotion of inclusiveness are key success factors for this program.
Measures: The measures that will contribute to the achievement of the program specific objectives are included below. The allocated budgets are indicated in Annex 1, and the measure-related objectives and targets are indicated in Annex 3.
(1.3.1) To evaluate and enhance the quality of education and school management
1 - National evaluation of all schools
26 http://www.oecd.org/pisa/keyfindings/pisa-2012-results-overview.pdf, p. 2427 Calculated on National Statistics Institute data by the Institute of Educational Sciences in the the annual report on the state of education
25
2 - School inspection and mentoring services
3 - Establish a system of professional initial training
4 - Establish a system of professional in-service training
5 - Revision of school curriculum
6 - Provision of school textbooks
(1.3.2) To assess and support the performance levels of pupils in primary and secondary education
1 - Participation of pupils in the national evaluations and exams
2 - Participation of pupils in the PISA international evaluation
3 - Support excellence through supplementary financing of accredited school education institutions
26
Strategic Objective 2: In 2020 Romania will have a tertiary education sector that can energize economic growth, contribute to increased productivity and promote social cohesion, thus
serving as the foundation of a knowledge-based economy
Tertiary education attainment is the target where Romania is most performing in the context of the ET 2020 strategy. Romania's progress has been steady and outpaced the average of the EU (see Graph 6.Evolution of tertiary attainment levels in Romania and the European Union), being now close to achieving the target of 26.7% of the 30 – 34 age group with tertiary level educational attainment. The current situation displays a value of 25.6% for 2015, according to Eurostat data.
Graph 6. Evolution of tertiary attainment levels in Romania and the European Union
2006 2007 2008 2009 2010 2011 2012 2013 2014 20155.0
10.0
15.0
20.0
25.0
30.0
35.0
40.0
45.0
29.0 30.1 31.132.3
33.8 34.836.0 37.1 37.9 38.7
12.413.9
16.0 16.818.3
20.321.7
22.925.0 25.6
f(x) = 1.11515151515152 x + 27.9466666666667R² = 0.995709648995879
f(x) = 1.50121212121212 x + 11.0333333333333R² = 0.995268542801049
European Union (28 countries)
Linear (European Union (28 coun-tries))
Romania
Linear (Romania)
Source: Eurostat
However, it must be acknowledged that this is among the lowest rates in the EU member states, with only Italy, Malta, Slovakia, and the Czech Republic (see Graph 7. Tertiary attainment levels - comparativedata at European level) recording similar rates. It is also rather low compared to the 40% target set as an average for all EU member countries. Therefore, improving participation in higher education and other tertiary non-university educational programs should remain a priority for the longer term.
27
Graph 7. Tertiary attainment levels - comparative data at European level
Euro
pean U
nion (2
8 countr
ies)
Belgi
um
Bulgar
ia
Czech
Rep
ublic
Denm
ark
Greec
e
Spai
n
Fran
ce
Croati
a
Italy
Lith
uania
Hungary
Mal
ta
Nether
lands
Portuga
l
Roman
ia
Slove
nia
Slova
kia
Finla
nd
United K
ingd
om0.010.020.030.040.050.060.070.0
38.742.7
32.130.1
47.640.440.9
45.1
30.925.3
57.6
34.327.8
46.3
31.925.6
43.4
28.4
45.547.8
Tertiary attainment levels - 2015
2015
Source: Eurostat
Furthermore, at regional level, different development regions show a quite heterogeneous picture, with considerable gaps between Bucharest or Western Regions and North-East or South-East Regions (see Graph 8. Tertiary attainment levels in Romania across development regions); these problems must be also addressed and specific policies for regions with lower rates should be implemented.
Nonetheless, the main challenges regarding the higher education programs are not the nominal convergence and attainment of the 2020 target, but the qualitative transformation of the study programs and of the institutions, in order to deliver more competent labor force, easily employable, effective and productive, contributing to achieving a knowledge economy. Moreover, the research outcomes should be more internationally relevant in order to make the Romanian universities more competitive. The quality of the study programs is thus the main challenge, as emphasized by the Report on Country Specific Recommendations on the 2016 national reform programme of Romania: The tertiary attainment rate is increasing, but the quality and labour market relevance of higher education is limited.28
Also, at the same time, the reduction of the access barriers for disadvantaged groups, and ensuring equal opportunities remains an important challenge facing the tertiary education sector.
28 http://ec.europa.eu/europe2020/pdf/csr2016/csr2016_romania_en.pdf
28
Graph 8. Tertiary attainment levels in Romania across development regions
Roman
ia
Nord-V
est
Centru
Nord-E
st
Sud-E
st
Sud -
Munte
nia
Bucure
sti -
Ilfov
Sud-V
est O
ltenia
Vest
0.0
10.0
20.0
30.0
40.0
50.0
60.0
25.6 27.024.6
15.819.9
17.6
48.4
23.5 23.2 201320142015
Source: Eurostat
29
The structure of Strategic Objective 2 includes tree (3) Programs and eighteeen (18) Measures coresponding to expected outcomes.
30
Strategic Objective 2: In 2020 Romania will have a tertiary education sector that can energize economic growth, contribute to
increased productivity and promote social cohesion, thus serving as the foundation of a knowledge-based economy.
Program 2.1: Committing the Sector to diversity, access
and improved attainment in all areas
Program 2.2: Promoting the Establishment of High Quality, Adaptive Academic Programs
Program 2.3: Promoting Strategic Engagement with
Economy
Measures of Program 2.1
M2.1.1.1. Promote institutional diversityM2.1.1.2. Extend dual training at the level of technical tertiary educationM2.1.1.3. Support merit-based access based on fee waiver for performing students; stipends for best performing studentsM2.1.1.4. Complement the merit-based fee-waiver with a program of need-based grants program - social stipends - mostly at the institutional levelM2.1.1.5. Wide social support measures - accommodation and board subsidiesM2.1.1.6. Implement a student loan program M2.1.1.7. Encourage outreach to students from underrepresented groups and to nontraditional learners, including adults and Romanian ethnics from abroadM2.1.1.8. Increase the transparency of information and provide guidance on educational opportunities and outcomes to inform study choices and reduce drop-out
Measures of Program 2.2
M2.2.1.1. Revision of Romanian Agency for Quality Assurance in Higher Education (ARACIS) Rules Governing Accreditation of Programs
M2.2.1.2. Ranking of study programs and supplementary funding based on excellence
M2.2.1.3 Supporting excellence through doctoral study grants
M2.2.1.4 Development of financial incentives to institutions judged to have developed new programs of exceptional promise in terms of developing transversal and entrepreneurial skills
Measures of Program 2.3
M2.3.1.1. Development of a national research agenda for innovation and entrepreneurship program, to encourage dialogue between the education and business sectorsM2.3.1.2. Curriculum redesign in order to focus on skills and competences that are required by the labor marketM2.3.1.3. Establishment of Industry Liaison specialists at each institution; universities and other post-secondary institutions develop plans for outreach to community businessesM2.3.1.4. Development of a national labor market data frameworkM2.3.1.5. Involvement of industry/ employers in the design and delivery of programs, supporting staff exchanges and including practical experience in courses. M2.3.1.6. Financial Support to ICT Programs
Figure 3. Strategic Objective 2 : Structure on Programs and Measures
The Strategic Objective 2 envisage long term impacts in tertiary education and economy and is based on outcomes generated by programs as they are presented below:
Figure 4. Strategic Objective 2: Impacts, outcomes and indicators
The estimated budgetary resources needed for implementation of measures and achieving the outcomes and impacts for 2017-2020 period is 13,882,013 (000 Lei).
31
Increase thetertiary educational attainment (share of 30–34 year-olds should have completed tertiary education) - Target 2020: 26.7%Raise the employability of young people with tertiary education attainment (employment rates of young people with tertiary level attainment (ISCED 5-8), in the age group 20-34, that are not in education and training) Target 2020: 85%
Impacts
(2.1.1) Institutional diversification and supporting the participation of students, especially disadvantaged, to higher education: the percentage of 25-34 year olds who have completed a tertiary degree should reach 30% by 2020 from 25.5% current baseline.(2.1.2) Diversification of financial support mechanisms for persons enrolled in tertiary level educational programs: the percentage of 30-34 year olds residing in rural areas who have completed tertiary degrees should reach 8.5% from actual baseline of 7.8%(2.1.3) Increase the transparency of information and provide guidance on educational opportunities and outcomes to inform study choices and reduce drop-out: the percentage of females graduating in science, mathematics and computing tertiary educational programs should reach 5% from 3.1% actual baseline.(2.2.1) Establishing priority study fields and the commitment to financing those by priority (art. 223 alin. 4, Law on national education). A new financing framework and methodology should be elaborated and adopted by 2018.(2.2.2) Promoting the funding for excellence principle already set through the supplementary financing of higher education institutions. Improved research impact of higher education institutions (average Hirsch index of academic staff employed by HEIs)(2.2.3) Ranking of study programs according to legal requirements; supplementary financing for excellence. The number of Romanian higher education programs (subjects) ranked amongst the first 200 in international rankings (e.g. QS World University Rankings by Subject(2.2.4) Revise program accreditation regulation; adoption of a new external evaluation methodology. A new methodology should be elaborated and adopted by the end of 2018.(2.2.5): Financing multi-annual study grants (instead of budgeted places), possibility of splitting the grants to allow more institutional autonomy and flexibility in their enrolment policies. A new financing framework and methodology should be elaborated and adopted by 2018.(2.3.1.) Increasing the employment of graduates from tertiary education); employment rate of recent graduates from tertiary education (people aged 15 – 24) who are employed and hold a tertiary level degree) up to 55% from 50,4% (actual baseline)
Program Outcomes
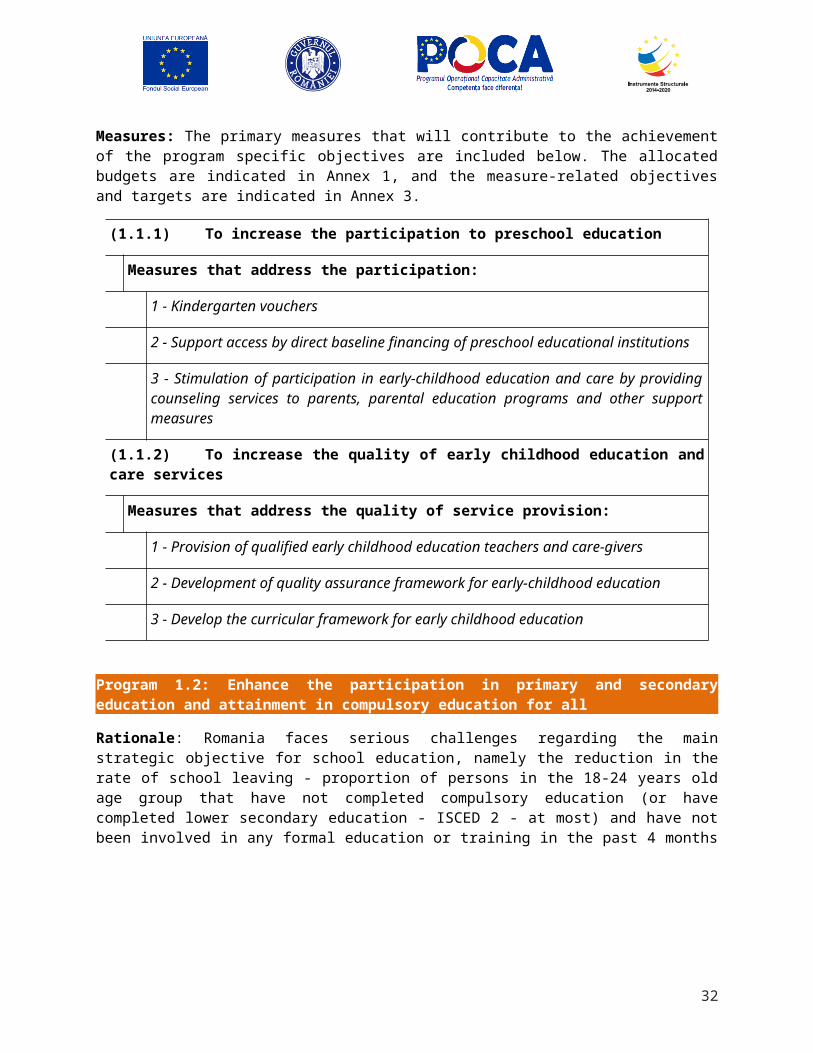
Table 2. Strategic Objective 2: Breakdown of financing by budgetary program (thousand RON)
Strategic Objective’s Programmes Budget
TOTAL ,000 RON
Total Value/years ,000 RON
2017 2018 2019 2020
P 2.1 Committing the Sector to Diversity, Access and improved Attainment in all Areas
10,429,231 1,776,344 2,830,463 2,882,981 2,939,444
P 2.2 Promoting the Establishment of High Quality, Adaptive Academic Programs
3,343,432 752,909 841,615 862,509 886,398
P 2.3 Promoting Strategic Engagement with Economy 109,350 23,047 29,707 27,995 28,600
TOTAL SO2 13,882,013 2,552,300 3,701,785 3,773,48
5 3,854,442
Program 2.1: Committing the Sector to diversity, access and improved attainment in all areas
Rationale: While close to reaching its own set target for tertiary educational attainment of the adult population, Romania is still a long way from the EU average of 40% of 30 – 34 year old’s to have a tertiary level educational attainment. Access to higher education is increasingly narrowing and widening gaps are being recorded based on gender and area of residence. Moreover, huge regional differences are being recorded, with educational attainment levels already surpassing 48% in Bucharest but barely reaching 15% of the relevant population group in the North – Eastern region.
Access to higher education is being hampered by a number of factors, among which graduation of upper-secondary education and successful completion of the baccalaureate exam are prominent. As 2 out of 10 high-school graduates do not even register for the baccalaureate exam and just under half of the remaining 8 pass the examination this is a serious bottleneck for tertiary education access. Also the lack of alternative routes to tertiary education further narrows options for young people to continue their education careers.
Objectives: Program 2.1 is intended to achieve till 2020 the following outcomes:
- (2.1.1) Institutional diversification and supporting the participation of students, especially disadvantaged, to higher education: the percentage of 25-34 year olds who have completed a tertiary degree should reach 30% by 2020 from 25.5% current baseline.
- (2.1.2.) Diversification of financial support mechanisms for persons enrolled in tertiary level educational programs: the percentage of 30-34 year olds residing in rural areas who have completed tertiary degrees should reach 8.5% from actual baseline of 7.8%.
32

- (2.1.3.) Increase the transparency of information and provide guidance on educational opportunities and outcomes to inform study choices and reduce drop-out: the percentage of females graduating in science, mathematics and computing tertiary educational programs should reach 5% from 3.1% actual baseline.
Description: Program 2.1 is aimed at the whole tertiary level of the educational system, which comprises both university as well as non-university organizations providing educational programs. As universities traditionally account for the largest part of the sector, with only a limited vocational schools offering specialised training in areas such as health – care, education and various technical areas, the measures predominantly are adressed to those organisations. Specific measures of the program aim at improving access and, at the same time, sustain participation in tertiary level educational programs. Flexibility of educational routes, along with financial support and transparency instruments, could greatly improve participation and support completion of this educational stage.
Success factors: Flexible access to tertiary education is required to overcome failure at the baccalaureate exam. Offering second and even third chances for persons not being able to pass the baccalaureate exam, or providing alternative non-university, vocationally oriented study programs are key to success and improving access to education and better careers. Universities, who face severe financial shortages due mainly to the present financing mechanisms and reduction of the cohort from which they can enroll, could also benefit from new financial instruments and diversification of their educational programs. Also, the legal framework is very important for a sustainable provision of short cycle tertiary education programs; for instance there needs to be a specific quality assurance framework for this level as well as a clear qualifications framework.
Coordination with key ministries (Ministry of Labor), local authorities and the Regional Operational Program, respectively, the Competitiveness Program, as well as the National Agency for Qualifications, is an important factor for reaching the specific targets of this Program.
Measures: The measures that will contribute to the achievement of the program specific objectives are included below. The allocated budgets are indicated in Annex 1, and the measure-related objectives and targets are indicated in Annex 3.
(2.1.1) To increase diversity, access and participation of tertiary education
Measures that address diversity of the educational offer:
1 - Promote institutional diversity. Classify higher education institutions Provide different financial incentives and earmarked budgets for each class (type) of university
2 - Extend dual training at the level of technical tertiary education
Measures that address access and participation in tertiary education:
3 - Support merit-based access based on fee waiver for performing students; stipends for best performing students.
33
4 - Complement the merit-based fee-waiver with a program of need-based grants program - social stipends - mostly at the institutional level
5 - Wide social support measures - accommodation and board subsidies - complementary financing based on needs
6 - Implement a student loan program (assuring financing as well as national regulation)
7 - Encourage outreach to students from underrepresented groups and to nontraditional learners, including adults and Romanian ethnics from abroad
8 - Increase the transparency of information and provide guidance on educational opportunities and outcomes to inform study choices and reduce drop-out
Program 2.2: Promoting the Establishment of High Quality, Adaptive Academic Programs
Rationale: The number of persons enrolled in higher education has significantly dropped over the past five years. Private universities have recorded a drop of over 81% of enrollments between 2009 – 2015. At the same time the number of subsidized places in public universities has remained constant for public universities, while enrollments dropped, thus reducing extra-budgetary revenues of public universities 29. A considerable share of upper-secondary graduates have turned recently towards non-university tertiary level educational programs, due to their more vocationally oriented content. In 2011 the only evaluation at a system level has been performed by the Ministry of Education. Out of the almost 110 evaluated public and private universities only 12 fit in the advanced research and education category, while the great majority of universities were evaluated as being education oriented organizations. However, almost all public universities also have the right, and receive funding for, to organize doctoral level programs and award doctoral level degrees. Strengthening the link between quality and financial resources is important to support universities to better focus on their strengths, such as educational programs.
An important step towards supporting quality in higher education is revising the existing external assessment methodology, quality standards and performance indicators for external quality evaluation, which are old and outdated (it dates back in 2006 when the Law on education quality was drafted a new methodology focusing on internal quality evaluation mechanisms) thus becomes central. This methodological improvement is also needed in the context of European changes in quality assurance practices, as also the “European Standards and Guidelines” for quality assurance agencies have been recently updated.
Even if the level of funding was directed towards a policy of continuous growth, it is still at a level that raises great expectations both for educational institutions and for ministerial and governmental decision-makers. The quality standards and indicators established by the new methodology for external
29 Source: Annual report on the state of higher education public financing, 2014, published by CNFIS, available online: http://www.cnfis.ro/wp-content/uploads/2014/11/CNFIS-Raport-public2013-2014-08-04_en_ultim.pdf According to official figures, the share of tuition paying students enrolled in public universities dropped from 55% in 2007 to just under 40% in 2013.
34
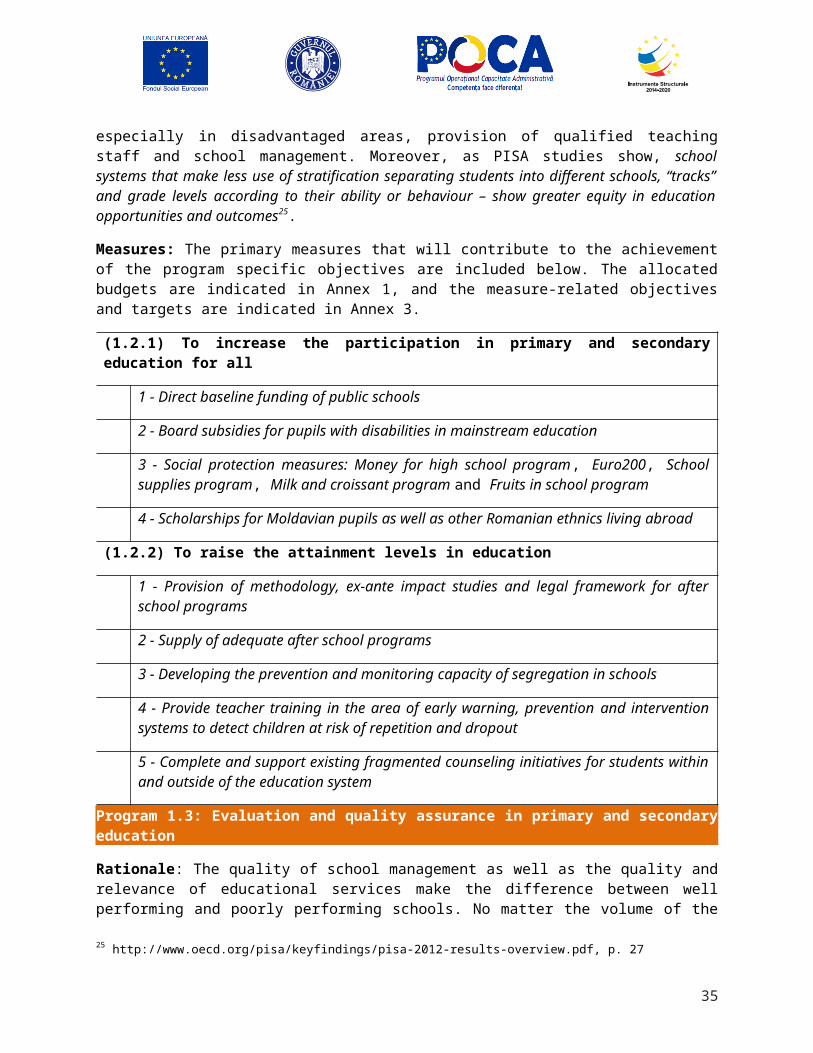
quality assurance, classification of HEIs and their program studies ranking are the foundation for programme budgeting and higher education financing.
Objectives: Program 2.2 is meant to achieve till 2020 the following outcomes:
- (2.2.1) Establishing priority study fields and the commitment to financing those by priority (art. 223 alin. 4, Law on national education). A new financing framework and methodology should be elaborated and adopted by 2018.
- (2.2.2) Promoting the funding for excellence principle already set through the supplementary financing of higher education institutions. Improved research impact of higher education institutions (average Hirsch index of academic staff employed by HEIs).
- (2.2.3) Ranking of study programs according to legal requirements; supplementary financing for excellence. The number of Romanian higher education programs (subjects) ranked amongst the first 200 in international rankings (e.g. QS World University Rankings by Subject.
- (2.2.4) Revise program accreditation regulation; adoption of a new external evaluation methodology. A new methodology should be elaborated and adopted by the end of 2018.
- (2.2.5) Financing multi-annual study grants (instead of budgeted places), possibility of splitting the grants to allow more institutional autonomy and flexibility in their enrolment policies . A new financing framework and methodology should be elaborated and adopted by 2018.
Description: The program is targeted to universities and assuring an institutional framework for them to improve educational services. Changing methodological frameworks for quality assurance, linking with instruments using public financial resources and establishing clear funding priorities will allow for medium and long term organizational strategies to be developed by individual universities. Concentrating resources in order to create poles of excellence in education, at university level and also scientific research, where organizational capacity can be proven are important in changing public policy towards tertiary education.
Success factors: Strategic Framework for Increasing Tertiary Education Attainment, Quality, and Efficiency in Romania 2014-2020 focuses on important measures such as adequate funding, effective governance as well as process enabling conditions such as monitoring or even output and outcome factors such as evidence-based policy making. As information systems and sources have greatly diversified over the past years, an important success factor for this program is making use of existing data and, at the same time, focusing on a steady collection of relevant information from the system. Evidence-based policy making is a key factor for developing this program and, at the same time, the entire tertiary education and scientific research sector. Furthermore, steering the sector to increased performance through incentives is important in flagging the authorities' commitment to rewarding quality and channeling public resources towards well achieving programs and institutions.
Measures: The measures that will contribute to the achievement of the program specific objectives are included below. The allocated budgets are indicated in Annex 1, and the measure-related objectives and targets are indicated in Annex 3.
35
(2.2.1) To increase the quality and relevance of higher education scientific research and educational services
1 - Revision of Romanian Agency for Quality Assurance in Higher Education (ARACIS) Rules Governing Accreditation of Programs
2 - Ranking of study programs and supplementary funding based on excellence
3 - Supporting excellence through doctoral study grants
4 - Development of financial incentives to institutions judged to have developed new programs of exceptional promise in terms of developing transversal and entrepreneurial skills
Program 2.3: Promoting Strategic Engagement with Economy
Rationale: The notion of a ‘knowledge triangle’ –education, research, and innovation—is central in the European Commission’s Education and Training 2020 strategy (ET2020), and is further promoted in the Joint Progress report towards ET2020. The European Council established that education and training are prerequisites for a well-functioning knowledge triangle and are vital for boosting growth and jobs. The conclusions of the Council and the Representatives of the Governments of the Member States on developing the role of education in a fully-functioning knowledge triangle establishes seven priorities for action including: pedagogical reform, partnerships with business, and developing an innovation culture within HEI, and new approaches to quality assessment.
Employment rates have increased over the past five years from 57.4% of the 15 – 64 aged population in 2009 to 60.8% in 2014, reflecting rather the improvement of the economic sector after the financial crisis of the 2009 – 2010’s. However, employment rates for young people show a rather worrisome picture of the relevance of education and its relationship to the labor market. The employment rates of young people with tertiary level attainment (ISCED 5-8), in the age group 20-34, that are not in education and training, stands at 77% in 2015, while the EU average is 82.3%. Increasing the relevancy of the tertiary education programs can contribute to reducing the relatively high and growing unemployment rate of tertiary graduates in Romania.
Unemployment rates provide even further evidence that there is little connection between outputs of the educational system in terms of graduates and competences and the labor market needs. Unemployment rates for young people (aged 15 – 24) have been rising over the past five years from 20% in 2009 to 24% in 2014. This rise maybe observed for almost all educational attainment levels, even if, in all fairness, it seems to have affected more people with primary educational attainment or those with tertiary – university attainment. Again persons who graduated from professional, VET, programs seem to be better off, since unemployment rates in their case have declined.
36
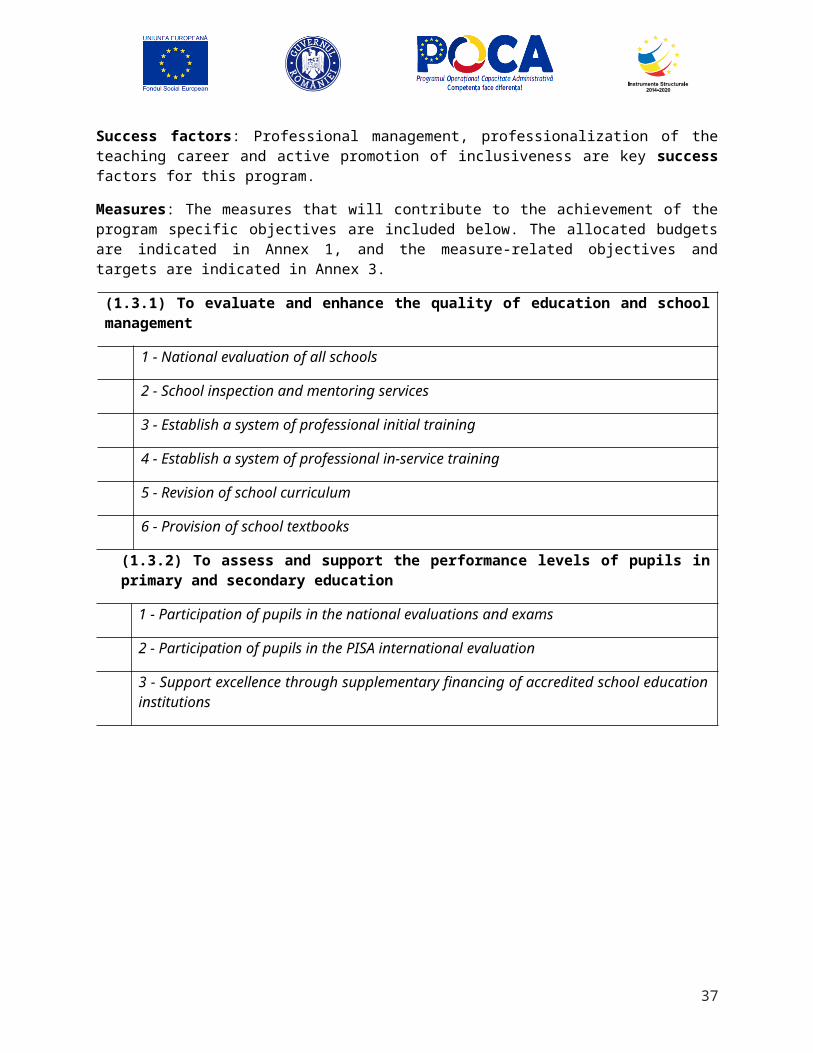
Objectives: Program 2.3 is intended to achieve till 2020 the following outcomes:
- (2.3.1.) Increasing the employment of graduates from tertiary education); employment rate of recent graduates from tertiary education (people aged 15 – 24) who are employed and hold a tertiary level degree) up to 55% from 50,4% (actual baseline).
Description: This program aims at strengthening and operationalizing existing links between tertiary education and potential employers. It should involve not only universities but also other types of organizations providing tertiary level educational services. Tracer studies are an important information source for activities within this program and existing expertise should be used to build upon existing data and inform employment policies.
Success factors: Evidence based policy making at government level as well as professional management at university level, are key success factors for this program. Coordination with other ministries, most importantly with the Ministry for Labor, is key in achieving the targets set by this program.
Measures: The measures that will contribute to the achievement of the program specific objectives are included below. The allocated budgets are indicated in Annex 1, and the measure-related objectives and targets are indicated in Annex 3.
(2.3.1) To promote strategic engagement with the economy
1 - Development of a national research agenda for innovation and entrepreneurship program, to encourage dialogue between the education and business sectors
2 - Curriculum redesign in order to focus on skills and competences that are required by the labor market
3 - Establishment of Industry Liaison specialists at each institution; universities and other post-secondary institutions develop plans for outreach to community businesses
4 - Development of a national labor market data framework
5 - Involvement of industry/employers in the design and delivery of programs, supporting staff exchanges and including practical experience in courses
6 - Financial Support to ICT Programs
37
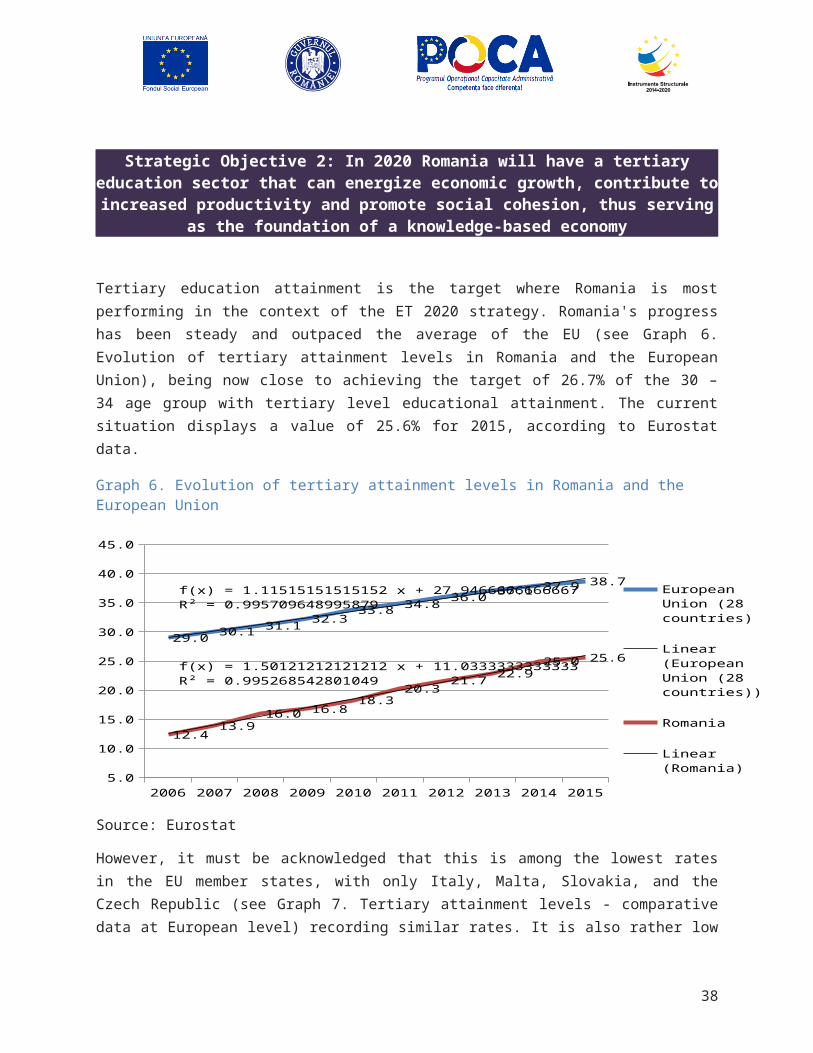
Strategic Objective 3: To develop an initial and continuous vocational education and training system adapted to the needs of the labour market and direct beneficiaries
Despite some concerns over the way it is measured that may not fully reflect the actual situation, adult education participation rates in Romania are very low. "Participation in education and training is a measure of lifelong learning. The participation rate in education and training covers participation in formal and non-formal education and training. The reference period for the participation in education and training is the four weeks prior to the interview"30.
Graph 9. The evolution of participation rates in education and training in Romania and the EU
2006 2007 2008 2009 2010 2011 2012 2013 2014 20150.0
2.0
4.0
6.0
8.0
10.0
12.0
9.6 9.4 9.5 9.5 9.3 9.1 9.2
10.7 10.8 10.7
1.5 1.5 1.8 1.81.4 1.6 1.4
2.01.5 1.3
European Union (28 countries)
Romania
Source: Eurostat
The participation of adults in education, in continuing training programs or other training programs is among the lowest in the EU, comparable only to Bulgaria. With a rate of participation around and less of 2% of population aged 25 – 64 over the past 6 years, Romania shows no signs of improvement and the 10% target set by the ET 2020 European strategy is probably unachievable. While adult education is a serious concern for EU wide education policies, as pointed out in the ET monitor 201531, Romania still has to close an ever widening gap with neighbor countries and the EU average participation in education and training.
The participation rate in education and training is closely linked with school attainment levels. As data from Eurostat show, the participation in education and training is closely correlated with the educational attainment level, those with primary or lower secondary education levels only having participation rates considerably below those with upper secondary level that, in turn, have participation rates significantly lower then those with tertiary education attainment levels.
30 http://ec.europa.eu/eurostat/cache/metadata/en/trng_lfs_4w0_esms.htm31 Se pages 77 – 81 ET Monitor 2015.
38
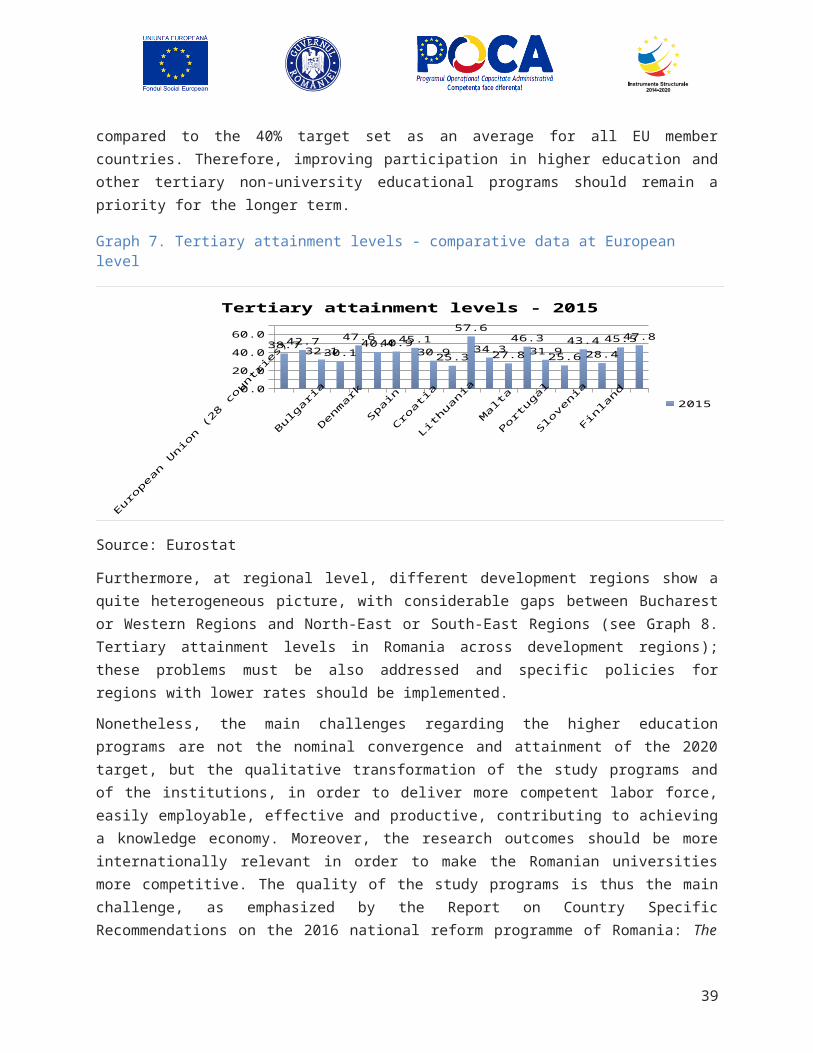
Graph 10. Comparative data on the participation rates in education and training - selection of various European countries
Euro
pean U
nion (2
8 countri
es)
Belgiu
m
Bulgaria
Czech
Rep
ublic
Denm
ark
Greec
e
Spain
Fran
ceIta
ly
Hungary
Nether
lands
Austria
Poland
Portuga
l
Roman
ia
Slove
nia
Slova
kia
Finlan
d
United K
ingd
om0.0
5.0
10.0
15.0
20.0
25.0
30.0
35.0
10.76.9
2.0
8.5
31.3
3.3
9.9
18.6
7.3 7.1
18.9
14.4
3.5
9.7
1.3
11.9
3.1
25.4
15.7
20142015
Source: Eurostat
As regards the participation in vocational training (VET) programs, in Romania almost 62% of all ISCED 3 level students are enrolled in vocational or professional training, while the remaining 38% are in general training high-schools. At a first sight, Romania fares considerable better than the EU average participation rate of 50.4% in the ISCEd level 3 population. However, the efficiency and relevance of professional or techological type educational institutions and programs is quite reduced since the proportion of students that followed the professional route and passed the baccalaureate is very low (for the 2013 - 2014 academic year, the technological high school students had the lowest participation rate (63.72%) and lowest pass rate (slightly below 45%). Also, the employment rate of graduates of ISCED 3 level vocational at 1 - 3 years after graduation is still low (58,9%) compared to EU average (70,6%). Only a few countries, Greece, Spain and Italy have employment rates for this type of graduates that are lower than Romania.
Table 3. Employment rates of graduates in ISCED 3 level vocational, 1 to 3 years after graduation
GEO/TIME 2014 2015 GEO/TIME (cont) 2014 2015
European Union (28 countries) 70,4 70,6 Italy 37,5 40,9
Belgium 68,7 73,9 Hungary 75,0 77,0
Bulgaria 62,6 56,2 Netherlands 83,1 85,7
Czech Republic 78,8 80,9 Austria 85,0 83,4
Denmark 82,7 81,5 Poland 65,6 69,2
Greece 39,7 36,5 Portugal 61,3 67,8
Spain 52,6 56,1 Romania 55,6 58,9
Source: Eurostat
39
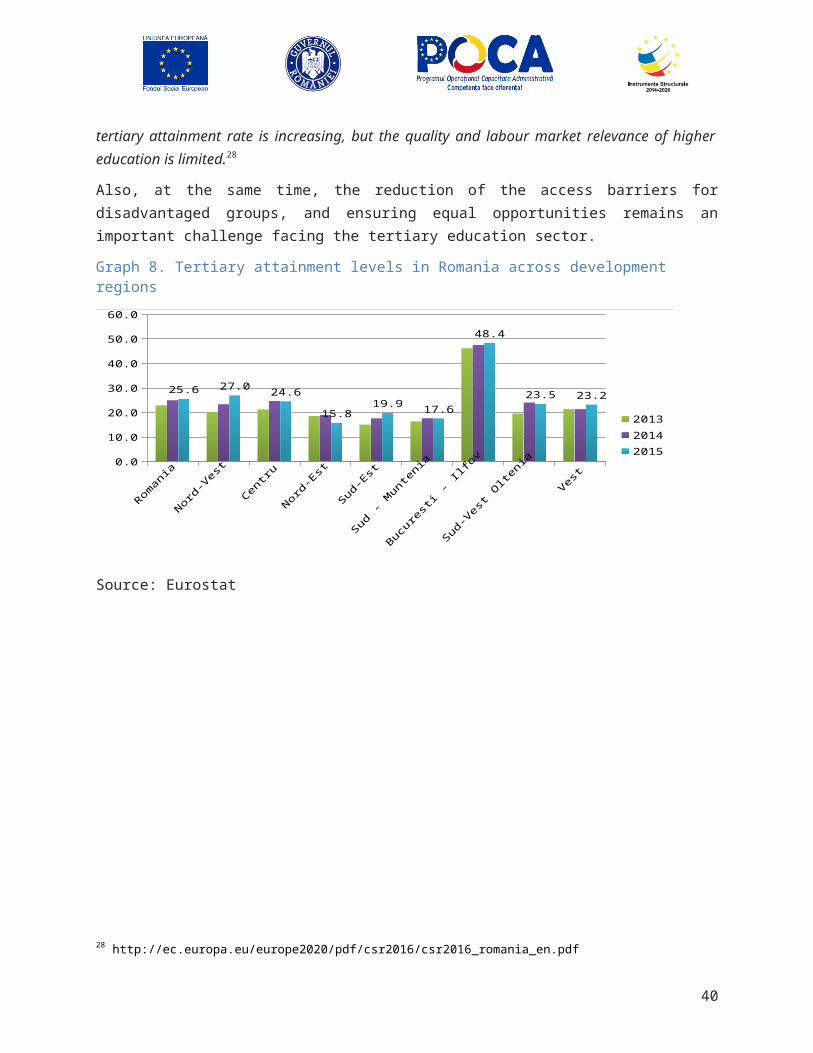
The structure of Strategic Objective 3 includes three (3) Programs and twenty-one (21) Measures corresponding to expected outcomes.
40
Strategic Objective 3:To develop an initial and continuous vocational education and training system adapted to the needs of the labour
market and direct beneficiaries
Program 3.1: Increase participation and facilitate access to initial
and in-service education and training programs
Measures of Program 3.1M3.1.1.1. Develop and implement a strategy to promote and raise awareness M3.1.1.2. Campaigns to promote vocational training among students M3.1.1.3. Financing to Enhance Lifelong Learning DemandM3.1.1.4. Develop coordination and cooperation between various national, regional and local stakeholdersM3.1.1.5. Provide training programmes for professionals with responsibilities in providing information, career counselling and guidanceM3.1.1.6. Provide financial incentives/subsidies for integrated counseling services for unemployed and inactive persons M3.1.1.7. Provide financial incentives/subsidies to employers to recruit unemployed and inactive persons into apprenticeships, traineeships, or other forms of job placement M3.1.2.1. Revise the methodology for recognising non-formal and informal learning M3.1.2.2. Develop a network of centres for evaluation and certification of prior learning outcomesM3.1.2.3. Training staff responsible for recognising and validating non-formal and informal learningM3.1.2.4. Support the participation in initial professional education and training by paying stipends to all students enrolled in this type of training M3.1.2.5. Support accommodation and food for young persons from rural and disadvantaged areas
Program 3.2: Improve the relevance of the vocational education
and training systems for the labour market
Program 3.3:Develop national and
international cooperation on VET
Measures of Program 3.2M3.2.1.1. Development of occupational standardsM3.2.1.2. Development of training curriculaM3.2.1.3. Carry out regular studies and research M3.2.1.4. Create a national mechanism for monitoring the professional insertion of the VET system graduates. M3.2.2.1. Develop a mechanism for quality assurance in work-based-learning M3.2.2.2. Develop a mechanism for quality assurance of continuous VETM3.2.2.3. Develop a mechanism for the certification of learning outcomes in initial and continuing vocational education and training (VET)M3.2.2.4. Develop mechanisms for quality assurance in the recognition and validation of non-formal and informal learningM3.2.2.5. Develop and provide continuous training programmes for trainers and teachersM3.2.2.6. Establish and develop a national centre for continuous training of teachers, trainers, external evaluators and tutorsM3.2.2.7. Establishing of Community Permanent Learning Centers (CPLC) to implement LLL initiatives at the community levelM3.2.2.8 Develop mechanisms for financing public-private and sectoral cooperation/partnership structures in vocational training
Measures of Program 3.3
M3.3.1.1. Extending the learning methods that develop entrepreneurial competences
M3.3.1.2. Extending mutual learning and best practice exchanges
M3.3.2.1. Supporting participa-tion in European mobility programs
Figure 5. Strategic Objective 3: Structure on Programs and Measures
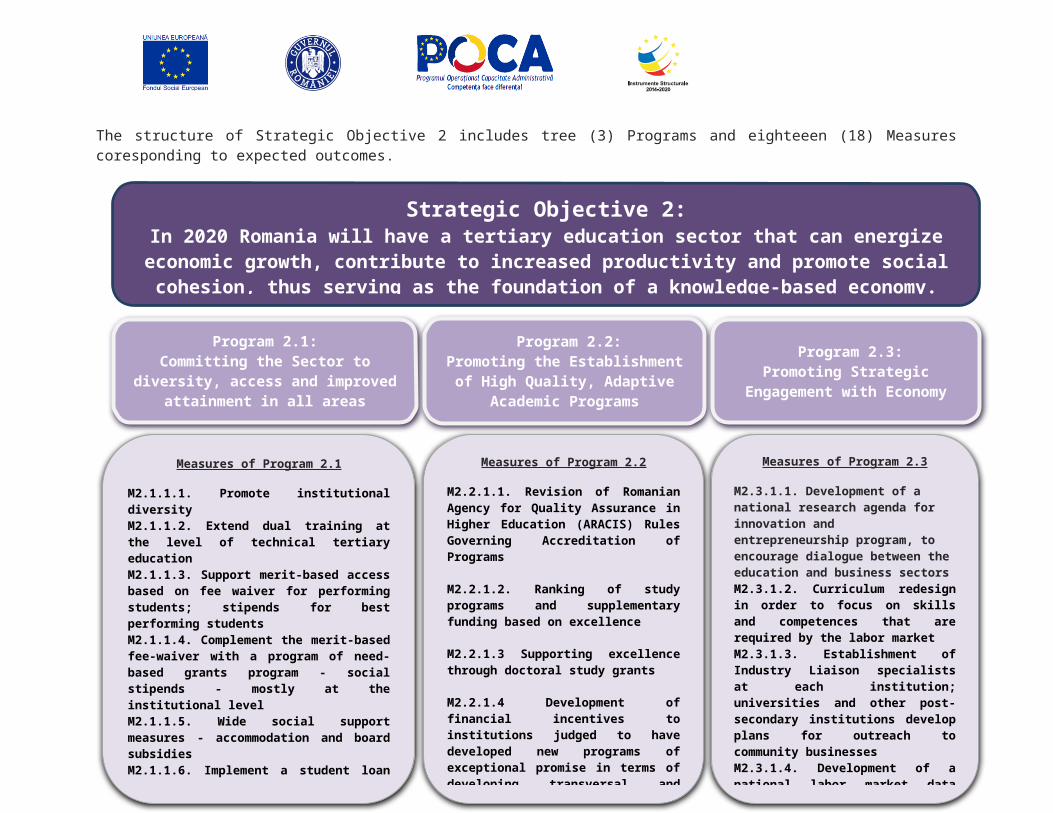
The Strategic Objective 3 envisage long term impacts on life-long learning and is based on outcomes generated by programs as they are presented below.
Figure 6. Strategic Objective 3: Impacts, outcomes and indicators
The estimated budgetary resources needed for implementation of measures and achieving the outcomes and impacts for 2017-2020 period is 2,385,586 (000 Lei).
Table 4. Strategic Objective 3: Breakdown of financing by budgetary program (thousand RON)
Strategic Objective’s Programmes Budget TOTAL ,000 RON
Total Value/years ,000 RON
2017 2018 2019 2020
P 3.1 Increase participation and facilitate access to initial and in-service education and training programs
1,973,421 82,241 627,828 630,366 632,985
41
Increase Adults' participation in life-long learning(share of 25-64 year-olds participating in education and training): Target 2020: 10%Increase Students' participation in vocational education and training (share of 15-17 year-olds participating in professional education and training); Target 2020: 17%Raise employment rate of young people with professional education attainment (employment rates of young people with professional education level attainment (ISCED 3-4), in the age group 20-34, that are not in education and training); TARGET 2020: 63%
Impacts
(3.1.1) Improve professional guidance and career counseling. The transition rate to professional education should reach 22% from the actual baseline of 14,9%.(3.1.2) Facilitate youngsters` access to vocational training programs in the educational system, focusing on the vulnerable groups. The gross enrolment rate in vocational and foremen postsecondary education should reach 25% by 2020 from 16.2% actual baseline.)(3.2.1) Update the tools used to describe the occupations and qualifications, the curricula and the curricular ancillaries, in order to increase relevance for the labour market. The drop-out rate in vocational education and training should decrease to 2.5% by 2020 from 4.3% the actual baseline(3.2.2) Improve the quality of VET. The rate of technological secondary education graduates passing baccalaureate examinations should reach 60% by 2020 from 48.6% the actual baseline(3.3.1) Develop components on innovation, creativity and entrepreneurship in vocational training programmes. Total number of students participating in entrepreneurship innovation and development programs up to 50.000 from 40.000 (actual baseline)(3.3.2) Develop international mobility in vocational and lifelong training. Total number of students participating in international mobility programmes up to 4.600 from 2.800 (actual baseline)
Program Outcomes
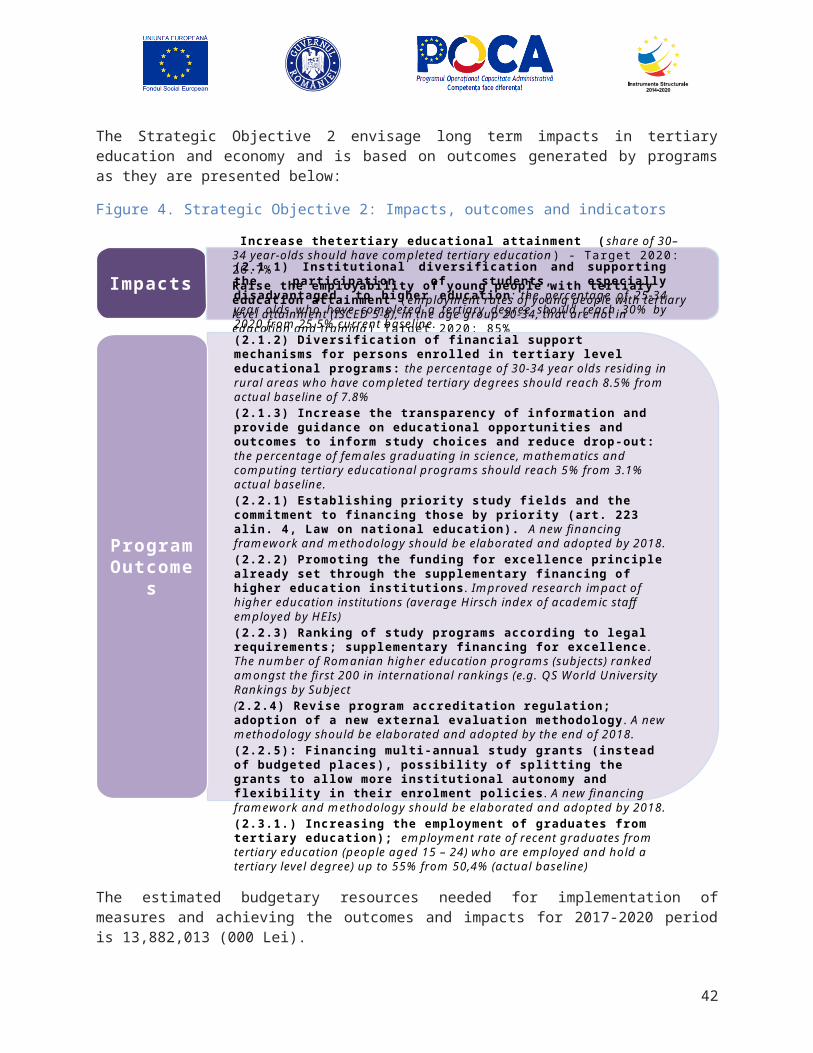
P 3.2 Improve the relevance of the vocational education and training systems for the labour market
397,447 0 132,482 132,482 132,482
P 3.3 Develop national and international cooperation in vocational education and training
14,719 0 4,906 4,906 4,906
TOTAL SO3 2,385,586 82,241 765,217 767,755 770,374
Program 3.1: Increase participation and facilitate access to initial and in-service education and training programs
Rationale: Despite some concerns that the way it is measured may not fully reflect the actual situation, adult education participation rates in Romania are dismal. Participation of adults in formal education, in continuing training programs or other formal programs is among the lowest in the EU, comparable only to Bulgaria. With a rate of participation below 2% of the population aged 25 – 64 over the past 6 years, Romania shows no signs of improvement and the 10% target set by the ET 2020 European strategy is probably unachievable. While adult education is a serious concern for EU wide education policies, as pointed out in the ET monitor 201532, Romania still has to close an ever widening gap with neighbor countries and the EU average participation in adult education.
Participation rates in the initial vocational education and training have dropped dramatically between 2009-2011 due to the closure of the schools of trades and crafts. Nonetheless, beginning with 2014/2015 year, the participation rates are increasing due to recent educational policy measures guiding more pupils towards this educational path. The participation of male students is considerably higher than that of female students. Thus in 2014/2015, the gross participation rate in vocational education and training for the 15-17 year-olds was 7,8%, with 11,2% for males and 4,2% for females33
Objectives: Program 3.1 is intended to achieve the following outcomes:
- (3.1.1): Improve professional guidance and career counseling. The transition rate to professional education should reach 22% from the actual baseline of 14,9%.
- (3.1.2): Facilitate youngsters` access to vocational training programs in the educational system, focusing on the vulnerable groups. The gross enrolment rate in vocational and foremen postsecondary education should reach 25% by 2020 from 16.2% actual baseline.
Description: Program 3.1 is aims to addresses the direct beneficiaries of the vocational education and training system, either in initial training, or continuing education, by providing information and guidance and thus reducing the asymmetry of information between the beneficiaries and the suppliers of training programs, on the one hand, and between the training providers and the employers on the other hand. Clearer and more robust access paths as well as programs' objectives expressed as learning outcomes will facilitate a better match between individual and community's learning needs and the educational opportunities providers offer. The measures associated with this program should contribute significantly
32 Se pages 77 – 81 ET Monitor 2015.33 https://www.edu.ro/sites/default/files/Raport%20Stare%20invatamant%20preuniversitar%202015.pdf, p. 35
42
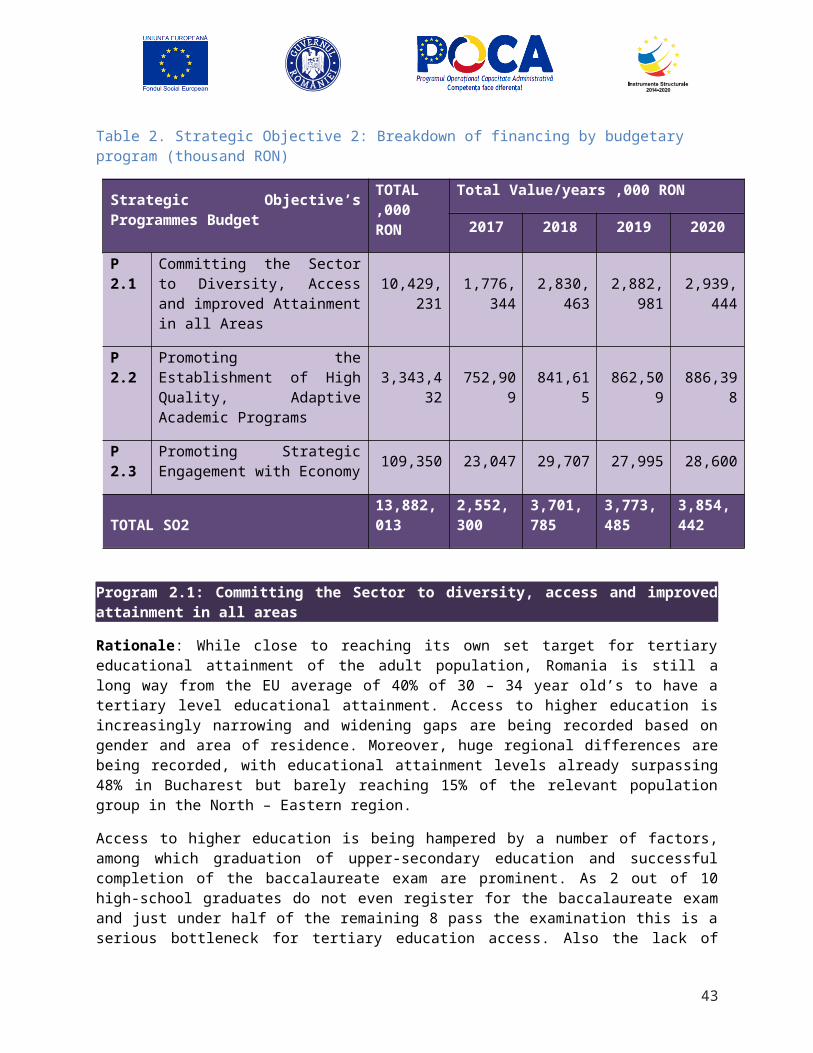
to meeting the major objective in the Europe 2020 Strategy, namely an increased employment rate, with a target of 75%.
Success factors: the development of the National Qualifications registry and its effective use as an instrument to guide the training demand and offer could contribute significantly to achieving the objectives of this program. Moreover, the legal framework for this type of education and training needs to be further refined and clarified in order to create the premises for a real market development.
Measures: The measures that will contribute to the achievement of the program objectives are included below. The allocated budgets are indicated in Annex 1, and the measure-related objectives and targets are indicated in Annex 3.
(3.1.1) To improve professional guidance and career counseling
1 - Develop and implement a strategy to promote and raise awareness of the benefits of career development, participation in initial and continuing vocational training, and recognition of non-formal and informal learning
2 - Campaigns to promote vocational training among students in the eighth grade of lower secondary education
3 - Financing to Enhance Lifelong Learning Demand
4 - Develop coordination and cooperation between various national, regional and local stakeholders
5 - Provide training programmes for professionals with responsibilities in providing information, career counselling and guidance
6 - Provide financial incentives/subsidies for integrated counseling services for unemployed and inactive persons (these will cover screening services and career guidance)
7 - Provide financial incentives/subsidies to employers to recruit unemployed and inactive persons into apprenticeships, traineeships, or other forms of job placement
(3.1.2) To facilitate youngsters` access to vocational training programs in the educational system, focusing on the vulnerable groups
1 - Revise the methodology for recognizing non-formal and informal learning
2 - Develop a network of centers for evaluation and certification of prior learning outcomes
3 - Training staff responsible for recognizing and validating non-formal and informal learning
4 - Support the participation in initial professional education and training by paying stipends to all students enrolled in this type of training (Professional Scholarship - Bursa profesională)
5 - Support accommodation and food for young persons from rural and disadvantaged areas, the Roma and disabled persons enrolled in vocational training in school campuses / vocational and technical schools
43
Program 3.2: Improve the relevance of the vocational education and training systems for the labour market
Rationale: Enhancing access and ensuring wider participation in vocational education and training as well as in lifelong learning is a necessary target of the public intervention, but it would not be effective unless the quality and labor market relevance of the educational offerings are not also improved. Employment rates of recent graduates (within 3 years from graduation) of ISCED 3-4 levels have decreased from 69% in 2001 to 59% in 2015. It is true that a slight improvement is registered over the past 3 years, from the lowest level of 55% in 2013 to 57% in 2014 and currently 59,8% in 2015. Still, the indicator has a quite low value compared to the EU average of almost 71%.
School dropout in vocational education and training, calculated on the entry-exit method, stands at 4,3% (data for 2013/2014) which is quite high compared to the average rate of upper secondary education of 2,8%, revealing problems in getting pupils motivated to follow the courses. It is even more worrisome that only below 50% of the technological path in secondary education passed the baccalaureate exam, compared to 84% in the theoretic upper secondary.
An important step towards supporting quality in vocational education is the involvement of social partners. The coordination of the educational offerings between the suppliers, beneficiaries and the employers is crucial for the delivery of educational programs that are relevant for the market demands. Furthermore the professionalization and effective cooperation at the sector level between the Sectorial Committees and the National Agency for Qualifications is necessary for supporting the development of qualifications and of the corresponding training programs. Currently, the National Qualifications Register is not yet functional, while occupational and vocational training standards and curricula are not fully developed and/or updated for all occupations/qualifications. Furthermore, the methodology for the development, validation, approval and management of occupational standards has not yet been approved.
Objectives: Program 3.2 is meant to achieve the following outcomes:
- (3.2.1) Update the tools used to describe the occupations and qualifications, the curricula and the curricular ancillaries, in order to increase relevance for the labour market. The drop-out rate in vocational education and training should decrease to 2.5% by 2020 from 4.3% the actual baseline
- (3.2.2) Improve the quality of VET. The rate of technological secondary education graduates passing baccalaureate examinations should reach 60% by 2020 from 48.6% the actual baseline.
Description: The program addresses the relevance and quality under various facets. At the system level, developing the framework for quality assurance and ensuring there are proper tools to describe occupational standards and qualifications as well as the capacity to elaborate curricula in close coordination with social partners are all key activities. Ensuring the proper financing of vocational education and lifelong learning is also important and will be addressed through various measures. Not least, the monitoring of the professional insertion of graduates and the development of mechanisms to learn about the competences required by the labor market requires action at system level.
Success factors: Success depends on the real involvement of social partners in all the measures, joint development of the tools and the methodology and on harnessing the efforts of the public and private employers to the institutional development of the vocational education and training.
44
Measures: The measures that will contribute to the achievement of the program specific objectives are included below. The allocated budgets are indicated in Annex 1, and the measure-related objectives and targets are indicated in Annex 3.
(3.2.1) To update the tools used to describe the occupations and qualifications, the curricula and the curricular ancillaries, in order to increase relevance for the labour market
1 - Development of occupational standards
2 - Development of training curricula
3 - Carry out regular studies and research
4 - Create a national mechanism for monitoring the professional insertion of the VET system graduates
(3.2.2) To Improve the quality of VET
1 - Develop a mechanism for quality assurance in work-based-learning
2 - Develop a mechanism for quality assurance of continuous VET
3 - Develop a mechanism for the certification of learning outcomes in initial and continuing vocational education and training (VET)
4 - Develop mechanisms for quality assurance in the recognition and validation of non-formal and informal learning
5 - Establish and develop a national center for continuous training of teachers, trainers, external evaluators and tutors
6 - Develop and provide continuous training programmes for trainers and teachers
7 - Establishing of Community Permanent Learning Centers (CPLC) to implement LLL initiatives at the community level
8 - Develop mechanisms for financing public-private and sectoral cooperation/partnership structures in vocational training
Program 3.3: Develop national and international cooperation in vocational education and training
Rationale: European policies focusing on Education and Training are based on the priorities set by the European Commissions’ Council conclusions of 12 May 2009 on a strategic framework for European cooperation in education and training (‘ET 2020’)34. Four strategic objectives have been set for education and training policies to focus upon in the timeframe of 2020: making lifelong learning and mobility a reality; improving the quality and efficiency of education and training; promoting equity, social cohesion
34 Document no. 2009/C 119/02
45
and active citizenship; enhancing creativity and innovation, including entrepreneurship, at all levels of education and training.
In 2015, following a series of stock taking reports, the European Commission restated the priorities set out in 2009 for European cooperation in education and training35. Transparency and recognition of skills and qualifications to facilitate learning and labor mobility remains a priority area which should be sought through various cooperation policies.
However, international mobility in vocational training is quite low. A low percentage of all trainees are included in international mobility programmes. Vocational training providers are insufficiently informed on accessing European funds for international mobility programmes in vocational training (e.g. ERASMUS+, European Social Fund). The staff of many vocational training providers have limited competences in writing applications for European funds for international mobility in vocational training (e.g. ERASMUS+, European Social Fund). A low number of vocational training programmes delivered in cross-border cooperation programmes is available
Objectives: Program 3.3 is intended to achieve till 2020 the following outcomes:- (3.3.1.) Develop components on innovation, creativity and entrepreneurship in vocational training programmes. Total number of students participating in entrepreneurship innovation and development programs up to 50.000 from 40.000 (actual baseline)- (3.3.2.) Develop international mobility in vocational and lifelong training. Total number of students participating in international mobility programmes up to 4.600 from 2.800 (actual baseline) Description: This program aims at strengthening national and international cooperation through mutual learning and best practice exchange, with a view to ensuring the preconditions for participation in an inclusive European labour market, as well as foster the mobility of trainers and learners in order to enhance the quality of the learning experience and improve transversal competences acquired.
Success factors: The success of the measure depends on developing the competences for accessing various programs that finance mobility, such as Erasmus+, developing the capacity for cooperation through setting online collaborative platforms and facilitating the participation in virtual mobility programs, as well as on recognizing the competences obtained abroad.
Measures: The primary measures that will contribute to the achievement of the program specific objectives are included below. The allocated budgets are indicated in Annex 1, and the measure-related objectives and targets are indicated in Annex 3.
(3.3.1) To develop components on innovation, creativity and entrepreneurship in vocational training programmes
1 - Extending the learning methods that develop entrepreneurial competences.
2 - Extending mutual learning and best practice exchanges
(3.3.2) To develop international mobility in vocational and lifelong training
1 - Supporting participation in European mobility programs
35 Joint Report of the Council and the Commission on the implementation of the strategic framework for European cooperation in education and training (ET 2020) New priorities for European cooperation in education and training (2015/C 417/04)
46
Strategic Objective 4: In 2020 Romania will have an educational and training system that is able to fully valorize human capital for the objective of smart and sustainable growth
The Romanian education system consists of more than 19,200 education units and institutions offering educational services ranging from early childhood to tertiary education. More than 3.4 million students are currently enrolled in these education institutions,
Participation in education has followed a downward trend over the past 6 years, however participation rates are showing signs of improvement recently. The situation is worsening for boys, as participation rates of male pupils are lower and decreasing by comparison to those of girls. The indicator is calculated for the entire educational system as the share of pupils and students aged up to 23 years old in the total population from the 6 – 23 age group. The latest figures show that 75% of persons from the relevant age group were enrolled in the formal educational system in the 2014 / 2015 school year
Graph 11. Participation rates in the (share of participants 6-23) age group %
2009/2010 2010/2011 2011/2012 2012/2013 2013/2014 2014/201566
68
70
72
74
76
78
80
82
84
Total Female Male
%
Female students not only have higher participation rates, but as an effect, they also spend more time in the educational system then boys. The average lifetime school participation expectancy is 16.5 years for girls compared to 15.4 years for boys. The one year average difference between girls and boys in school participation is mainly due to girls having a much better participation rate in higher education.
Participation rates differ dramatically when compared by level of education and residence type for pupils. Participation in primary and secondary (gymnasium) levels of education is higher for persons living in urban areas as compared to rural areas. Figures also show that, for the secondary level of education (from the 5-th up to the 8-th grade), a migratory pattern from rural to urban areas is taking shape, as participation rates for this level of education surpass 100% in urban areas. The change is striking in the case of the upper secondary level: while the number of upper-secondary enrolled students residing in urban areas is over 142% of the recorded population in the 15 – 19 age group, the
47
share of upper-secondary enrolled persons is only 11% of the relevant age group residing in rural areas36.
Graph 12. Participation rates by level of education and place of residence (2014 / 2015 school year)
pre-primary primary secondary0
20
40
60
80
100
Urban Rural
level of education
%
Statistical indicators point towards major sources of inequalities in the education system. One is the gap in participation between residents in urban and rural areas, which remains constant from pre-primary education onwards. Another major challenge is migration from rural towards urban based schools, which is only available for a minority of rural residents having resources (family networks, financial resources etc.) for supporting children to access education away from their homes. Migration of rural residents towards urban schools becomes visible during the secondary level of education (after the 5-th grade) and is mostly visible at upper secondary (high school) level. Participation in high school is 142% of the urban population and a mere 11% for the rural based population.
While schools offering primary and secondary level education are predominant in rural areas (70% of this type of schools at national level are in rural areas), kindergartens and upper-secondary schools (high schools) are almost exclusive to urban areas. The Law of National Education (no. 1/ 2011) stipulates that a school has legal entity if enroll at least 150 children for kindergartens or 300 children for primary and secondary level onwards, with some exceptions. As kindergartens in rural areas enroll less than 150 children they usually are functioning as satellite schools included in larger schools. Therefore, participation rates interpreted in conjunction with the number of school units available show that the large majority of children born in rural areas are enrolled in schools which also provide kindergarten services (participation rates are around 80% for rural areas for both levels of education). Some of those manage to graduate the grade 8, gymnasium level, but have no real opportunity to continue their studies to high school or VET due to the absence in their proximity of an upper-secondary level educational organization. Those who do continue their studies have to migrate towards urban areas, if their families have the adequate resources for such a move (some children do migrate earlier during secondary education, as shown by participation rates in secondary education in urban areas).
36Values computed on the basis of data provided by the NIS, Tempo-online data base, indicators POP106A (rezident population at 1-st July) and SCL103I (enrolled pupils by level of education and place of residence). In absolute terms a total number of 503,468 persons aged 15 – 19 resided in urban areas, in 2014, while a total number of 715,367 of persons were enrolled in upper-secondary education. At the same time, a number of 581,107 persons were living in rural areas but only 62,493 persons were enrolled in rural upper-secondary education institutions.
48
Table 5. Number and educational units by level of education and area type (2014)
Educational units with legal entity No. of units in 2014 Percentage in total
Kindergartens Urban 1111 92%
Rural 94 8%
Primary and secondary schools Urban 1215 30%
Rural 2835 70%
Upper secondary schools (including high-schools and VET schools)
Urban 1313 83%
Rural 263 17%
Source: NIS data, indicator SCL101D, 2016
Table 6. Number of Education Institutions (legal entities and sattelites)
Level of EducationNumber of Education Institutions
Total Urban Rural
Preschool (except nurseries) 8,685 2,184 6,501
Primary Schools 3,302 75 3,227
Lower Secondary Schools 5,565 1,203 4,362
Upper Secondary Education Schools 1,487 1,203 284
High Schools 1,474 1,196 278
Professional Schools 13 7 6
Schools for Special Needs Education 164 142 22
Tertiary Education Institutions 83 83 0
Post-secondary Vocational Schools 28 28 0
Public Universities 55 55 0
Total 19,286 4,890 14,396
Source: MNE (school year 2014-2015)
49
The structure of Strategic objective 4 includes two (2) Programs and nine (13) Measures coresponding to expected outcomes.
50
Strategic Objective 4:In 2020 Romania will have an educational and training system that is able to fully valorize
human capital for the objective of smart and sustainable growth.
Program 4.1: Capital investments in education system
Measures of Program 4.1
M4.1.1. Supporting the building of schools
M4.1.2. Supporting the building of kindergardens
M4.1.3. Support the school labs modernization
M4.1.4. Building facilities for students (hostels and cantines)
Program 4.2:Supporting students for the Baccalaureate exam and
facilitate transition for better access in higher education
Measures of Program 4.2
M.4.2.1.1. Supporting the transition of students from upper secondary into tertiary education using a decentralized approach based on non-competitive grants to low performing public high schoolsM4.2.2.1. Upper Secondary Education CurriculumM4.2.2.2. Professional Development for Teachers and School DirectorsM4.2.2.3. Revisions to Student AssessmentsM4.2.2.4. Grade 10 Learning AssessmentM4.2.2.5. Information Campaigns to Increase the Awareness of Students and TeachersM4.2.2.6. MESR’s Capacity to Monitor Upper Secondary Education M4.2.3.1. Non-competitive grants M4.2.3.2. Summer bridge programs competitive grant scheme M4.2.3.3. Learning centers –competitive grant scheme
Figure 7. Strategic Objective 4: Structure on Programs and Measures
The Strategic Objective 4 envisage long term impacts in education and is based on outcomes generated by programs as they are presented below.
Figure 8. Strategic Objective 4: Impacts, outcomes and indicators
The estimated budgetary resources needed for implementation of measures and achieving the outcomes and impacts for 2017-2020 period is 2,210,641 (000 Lei).
Table 7. Strategic Objective 4: Breakdown of financing by budgetary program (thousand RON)
Strategic Objective’s Programmes Budget
TOTAL ,000 RON
Total Value/years ,000 RON
2017 2018 2019 2020
P 4.1 Capital investments in education 2,540,000 620,000 630,000 640,000 650,000
P 4.2 Supporting students for the Baccalaureate exam and facilitate transition for better access in higher education
770,641 134,999 227,388 236,075 172,179
TOTAL SO4 3,310,641 754,999 857,388 876,075 822,179
51
Improved school & university infrastructure- Seat capacity increased by 10%; The number of places in refurbished student's hostel increased by 20%; Capacity in students' hostels increased by 10%Enrolment rate in higher education (the ratio of the total student population enrolled in higher education institutions to the total population aged 19-23)- Target 2018: 33%; Target 2020: 35%
Impacts
(4.1.1) Construction, rehabilitation, modernization, and equipment for nurseries, kindergartens, and primary and lower secondary education schools. - yearly rehabilitated schools and kindergardens 700 în 2018 till 1200 in 2020(4.1.2) Rehabilitation, modernization, extension, and equipment for infrastructure in technological high schools and VET schools. modernized laboratories annualy 420 in 2018 up to 12000 in 2020(4.1.3) Rehabilitation, modernization, extension, and equipment for infrastructure in universities. hostels and cantines annualy from 8 in 2018 up to 12 in 2020(4.2.1) Improving the quality of upper secondary education with a focus on reducing dropout rates, increasing completion rates, and improving participation and performance at the Baccalaureate from 86,9% to 91%(4.2.2) Improving the university level efficiency in terms of: (i) increased retention rate in the first year of tertiary education; and (ii) decreased dropout rates; form 82.3% to 83,5%(4.2.3) improving motivation and better access of disadvantaged students to quality education. increased retention rate in the first year of universitary education;
Program Outcomes
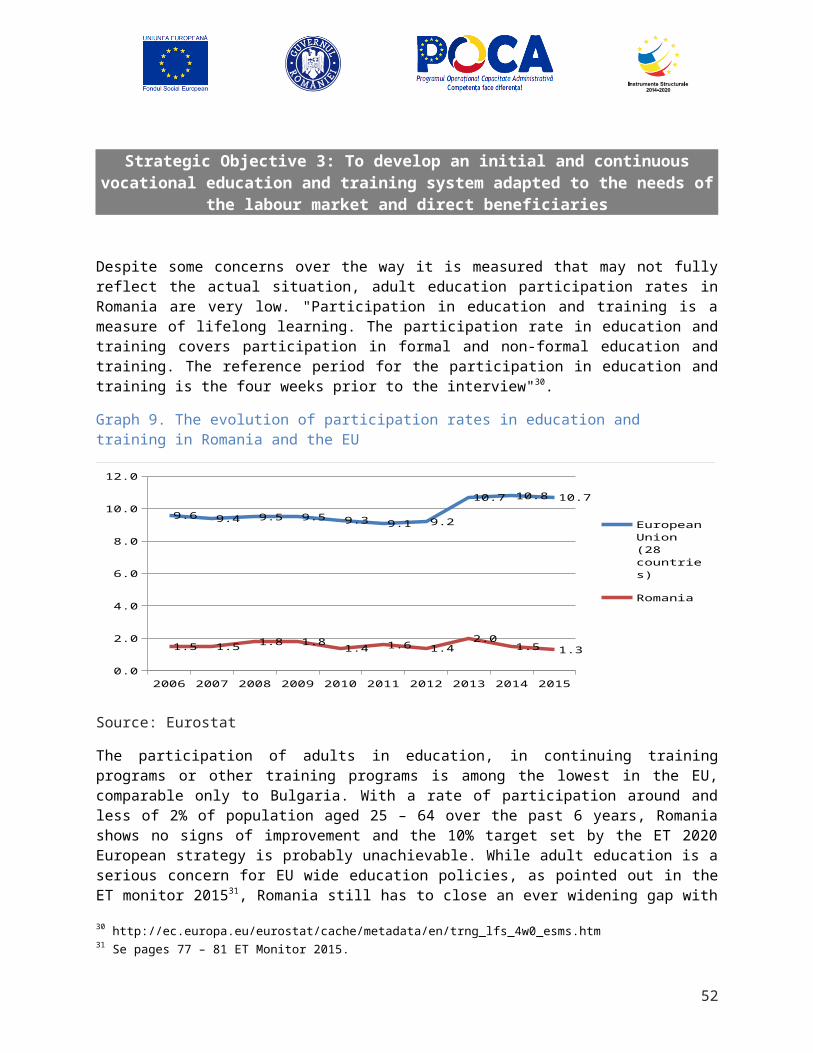
Program 4.1: Capital investments in education
Rationale: More than half of Romania’s counties currently have a significant mismatch between the demand for schooling and the supply of student spaces in schools. In 15 counties, the student-age population exceeds the total number of seats in classrooms by at least 10 percent, indicating that existing education infrastructure has insufficient capacity to meet current demand for schooling). In four counties (Giurgiu, Galati, Vaslui, and Ilfov), the student-age population exceeds the existing supply of spaces by at least 30 percent, suggesting the potential for overcrowding and intensive use of education infrastructure. On the other hand, the opposite is true in six counties, where the number of spaces exceeds the total student-age population by at least 10 percent. This excess capacity suggests that infrastructure investments in these counties should be more targeted and focused on improving the quality of existing learning environments rather than increasing the supply of spaces.
School Capacity and Student Performance. More than 10 counties in Romania have both insufficient classroom capacity and poor average performance on the Baccalaureate exam, indicating a need for more in-depth analysis on how classroom infrastructure may be affecting student performance here. Although data do not allow for drawing the conclusion that insufficient current classroom capacity contributes to the relatively low performance on the Baccalaureate, it suggests a potential relationship that necessitates further investigation, especially in connection with the quality of teaching. For example, the potential demand for schooling in Ilfov and Giurgiu is 30–40 percent in excess of current classroom capacity, suggesting significant overcrowding in some schools. At the same time, average Baccalaureate scores in these counties are among the lowest in the country. Overcrowding and its consequences (i.e., dual-shift teaching, insufficient instructional time, large class sizes, etc.) could be important results of inadequate school infrastructure that require more analysis at the level of localities and schools.
At the same time, important differences in access to education infrastructure arise based on students’ socioeconomic background. Analysis of Romania’s results from PISA 2012 show that learning outcomes are significantly related to the perceived quality of educational resources and infrastructure. Controlling for students’ socioeconomic background, the differences in material resources have a significant impact on learning outcomes.
As regards the higher education sector, there still persist important access barriers for youngsters coming from rural areas and/or socio-economically disadvantaged families. The development of students' hostels and canteens infrastructure is an essential component of the policy aiming to raise access to tertiary education and reduce regional disparities.
Objectives: Program 4.1 is intended to achieve till 2020 the following outcomes:
- (4.1.1) Construction, rehabilitation, modernization, and equipment for nurseries, kindergartens, and primary and lower secondary education schools -yearly rehabilitated schools and kindergartens 700 în 2018 till 1200 in 2020.
- (4.1.2) Rehabilitation, modernization, extension, and equipment for infrastructure in technological high schools and VET schools. modernized laboratories annually 420 in 2018 up to 12000 in 2020.
- (4.1.3) Rehabilitation, modernization, extension, and equipment for infrastructure in universities. Hostels and canteens rehabilitated annually 8 in 2018 upt to 12 in 2020.
52
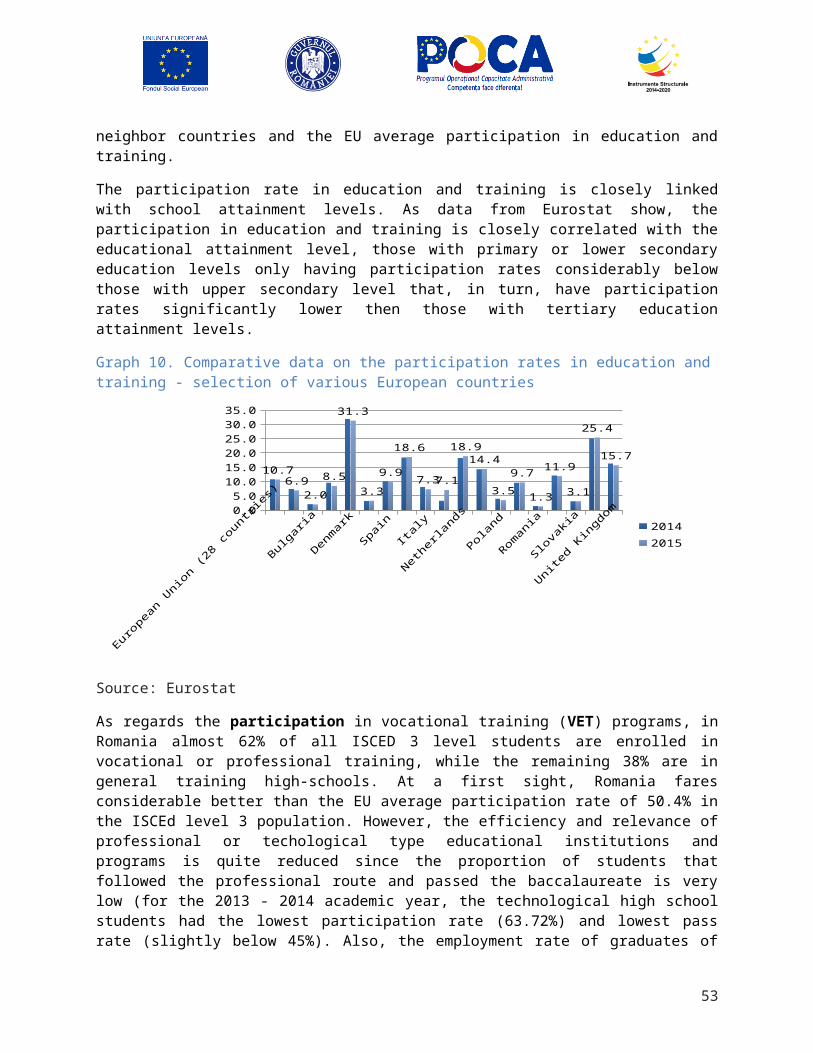
Program 4.2: Supporting students for the Baccalaureate exam and facilitate transition for better access in higher education
Rationale: Although enrollment in upper secondary education in Romania is high, the transition to tertiary education is hindered due to increasing dropout and poor performance on the Baccalaureate, the Program 4.2 is intended to improve the transition from upper secondary into tertiary education and increase the retention in the first year of tertiary education in supported public high schools and universities. On average, the Baccalaureate pass rate dropped from 78 percent to 58 percent, from 2009 to 2013, with lower rates for graduates from technological high schools (close to 20 percent in some cases). In addition, enrollment in tertiary education has decreased by 35 percent, from 716,464 (in 2005/06) to 464,592 (in 2012/13).
Data show that approximately 100,000 school students either failed to pass or did not take the Baccalaureate in 2013/14, in addition to 20,000 tertiary education students who were at risk of dropping out of universities in the first year of study.
This program will be supported through “Romanian Secondary Education Project –ROSE” financed by International Bank for Reconstruction and Development with 200 million Euro amount. ROSE Project is designed to address the needs of these students, which is fundamental for Romania to face the challenges of sustaining its economic growth with a shrinking and aging population. The proposed Project aligns with and complements EU priorities in several areas, allowing the GoR to leverage European Structural and Investments Funds. The operational programs that are being prepared by the GoR for the programming period 2014-2020 would be mainly implemented to tackle challenges in primary, lower secondary and tertiary education. Although the Thematic Objective 10 of the Partnership Agreement of Romania allows investments in secondary education, these operational programs do not include interventions addressing the challenges in upper secondary education or the transition of students into tertiary education. As the ROSE Project focuses on interventions in these two areas, it would complement EU-funded programs in the period 2014-2020.
Objectives: The following outcomes will be achieved till 2020:
- (4.2.1.) improving the quality of upper secondary education with a focus on reducing dropout rates, increasing completion rates, and improving participation and performance at the Baccalaureate from 49,6% to 56%.
- (4.2.2.) improving the university level efficiency in terms of: ( i) increased retention rate in the first year of tertiary education; and (ii) decreased dropout rates;from 86,9% to 91%.
- (4.2.3.) improving motivation and better access of disadvantaged students to quality education. from 82,3% to 83,5%.
Description: Program 4.2 will be implemented over a period of seven years, between 2016 and 2022, and would be financed through an Investment Project Financing (IPF) loan of EUR 200 million. The ROSE Project which financed the program is structured in three components, with the first two designed to address the academic and personal reasons for poor student performance in upper secondary as well as in the first year of tertiary education. The third component covers project management and monitoring and evaluation (M&E).
Based on the Loan Agreement no. 8481-RO signed in Washington on April 17th, 2015 concluded between the Romanian Government and the International Bank for Reconstruction and Development (World Bank), on October 14th, 2015, the Romania Secondary Education Project (ROSE) entered into
53
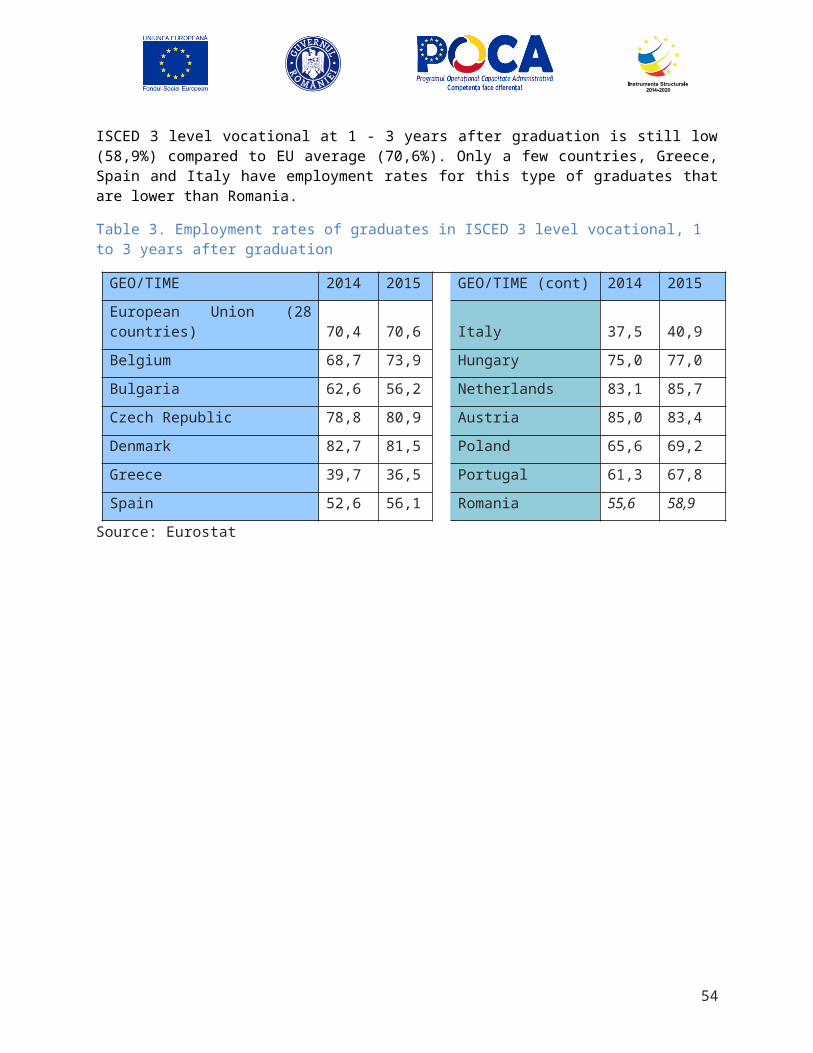
force, implemented by the Ministry of National Education (MNE), via the Unit for the Management of Externally Financed Projects (UMEFP).
Measures: The primary measures that will contribute to the achievement of the program specific objectives are included below. The allocated budgets are indicated in Annex 1, and the measure-related objectives and targets are indicated in Annex 3.
To address the academic and personal reasons that are the leading factors hindering Romanian students from transitioning from upper secondary to tertiary education, including dropping out, declining to take the Baccalaureate, or scoring a low mark on the Baccalaureate
(4.2.1) Measure that addresses bottom up approach through School-based Interventions
1 - Supporting the transition of students from upper secondary into tertiary education using a decentralized approach based on non-competitive grants to low performing public high schools
(4.2.2) Measures that address systemic challenges faced by all high schools in facilitating the transition into tertiary education
1 - Upper Secondary Education Curriculum
2 - Professional Development for Teachers and School Directors
3 - Revisions to Student Assessments
4 - Grade 10 Learning Assessment
5 - Information Campaigns to Increase the Awareness of Students and Teachers
6 - MESR’s Capacity to Monitor Upper Secondary Education
(4.2.3) Measures that support university-level interventions and bridge programs aimed at students at risk of dropping out of faculties in the first year of study
1 - Non-competitive grants
2 - Summer bridge programs competitive grant scheme
3 - Learning centers – competitive grant scheme
54
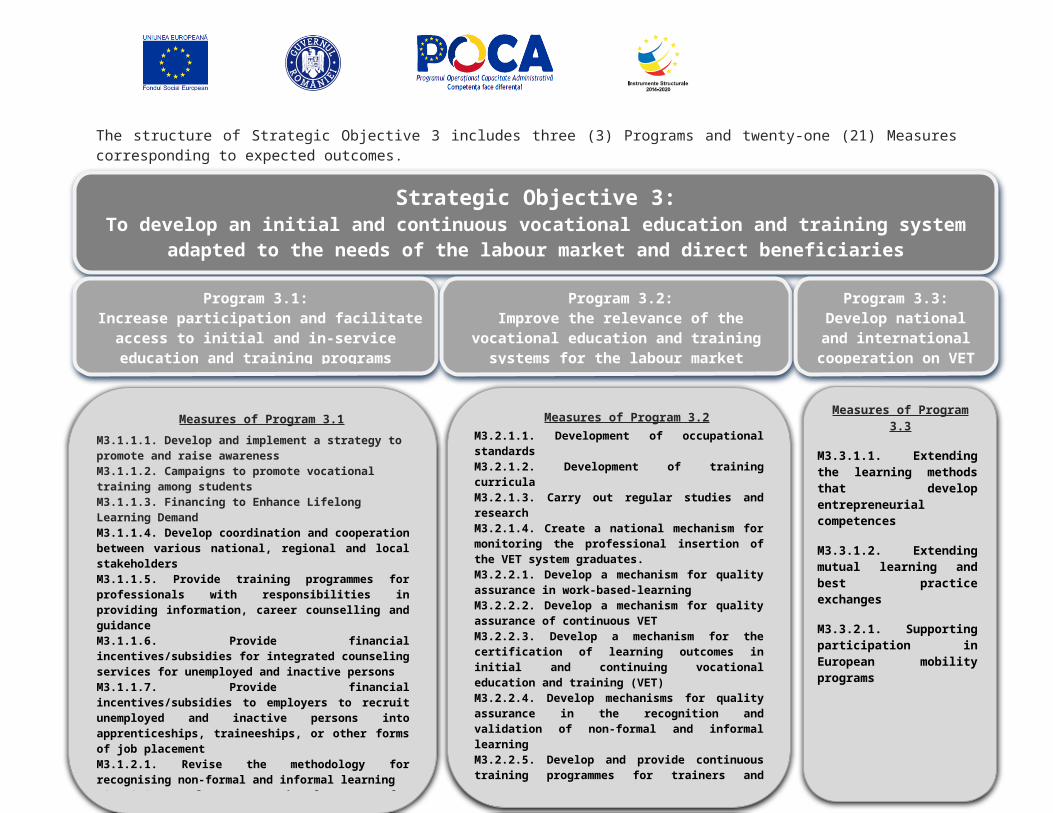
Strategic Objective 5: Improve the institutional framework of educational, research and science sector
Through its designated mandate, the Ministry of National Education, Research and Science (MNE) is one of the most important public institutions for the achievement of many of Romania’s social and economic development and European integration targets. Along with a considerable share allocated for education from the state budget (3,7% of GDP in 2015), MNE also manages important national strategic programs, in terms of funding, from European Social and Investment Funds (ESIF) of over EUR (5) billion. With this in view, the MNE needs to meet high standards of accountability and institutional capacity.
Institutional reform expected by education system’s stakeholders is including the following a clear and predictable path that is aligned with the sectoral vision and strategic goals – should be at least as important as the proper definition of sectoral goals and priorities, or the adequate targeting of policy measures. In the future, Romania needs a knowledge-driven, lean and information-based education, research and science administration, focused on ensuring that Romania’s educational sector is market-driven and sustainable, and accomplishing this by providing strong leadership in pursuing the sectoral goals, to ensure effective steering of policies and programs, and to provide better services to students, teachers, researchers, companies and citizens.
The priorities set by these institutional challenges refer to: (i) the optimization of public policy and strategy formulation and coordination, including for cross-sectoral issues; (ii) institutional consolidation and facilitation of resources, information and data flow within the entire ES administration; (iii) streamlining the information and advice to students, teachers, researchers, and organizations interested in the educational sector; and (iv) effective and efficient use of internal (national) and external (EU and international) financial resources for the ES sector and administration.
This is based on Program 5.1, which aims to build a knowledge-driven, lean and information-based ERS administration, in order to: (i) more effectively fulfill its strategic function (through better mechanisms for formulating the ES policy framework), and (ii) more efficiently deliver sector policies and services to its target beneficiaries (through an improved institutional framework). It supports measures aimed at improving the administrative capacity of sectoral policies management and implementation, with a view to achieving a better functional performance of the ministry and its coordinated or subordinated structures. Among these are (i) refinement of functional roles, procedures and mechanisms for setting Romania’s ES strategy and for delivering the ISP; (ii) closing human capacities gaps; (iii) tackling the deficient access to sector information and data; (iv) addressing the lack of performance assessment tools for both sector and staff; (v) increased coordination with other government agencies in areas with important impact on ES sector performance; (vi) higher transparency and stakeholder involvement in the policy process.
55
The structure of Strategic objective 5 includes one (1) Program and nine (18) Measures corresponding to expected outcomes.
56
Measures of Program 5.1
M5.1.1.1. Revision of organizational responsibilities and the accompanying procedures, to allow for a better strategy formulation and a smooth implementation of the ISPM5.1.1.2. Development of the ICT infrastructureM5.1.1.3. Vocational training, learning and expertise of the ministry’s specialized staffM5.1.1.4. Human resources management and adaptation to the organization needsM5.1.1.5. Performance assessment system for the ERS sector and administrationM5.1.1.6. Development of annual and multi-annual budget Programs for the full use of internal and external funds allocatedM5.1.1.7. Transparency in the decision-making process and the formulation of public policies and legal frameworkM5.1.1.8. Informing students, teachers, researchers and public policy beneficiaries about the Programs dedicated to the ERS sectorM5.1.2.1. Operationalization of ERS public policy impact analyses and policy making feedback loopsM5.1.2.2. Consultation with citizens and the stakeholders involved in the ERS sector, for the formulation and promotion of public policiesM5.1.2.3. Inter-institutional collaboration and experience sharing with relevant national and international organizations M5.1.2.4. Technical assistanceM5.1.3.1. Developing the analysis, audit, control, and risk management capacityM5.1.3.2. Securing and using external and extra-budgetary funds for the development of the administrative and institutional capacityM5.1.3.3. Effective and efficient functioning of the services provided by the ministry through its own structures and through the coordinated agencies
Program 5.1: Improving administrative capacity of sectoral policy management & implementation
Strategic Objective 5: Improve the institutional framework
Figure 9. Strategic Objective 5: Structure on Programs and Measures

The Strategic Objective 5 envisage long term impacts in education’s public administration and is based on outcomes generated by programs as they are presented below.
Figure 10. Strategic Objective 5: Impacts, outcomes and indicators
The estimated budgetary resources needed for implementation of measures and achieving the outcomes and impacts for 2017-2020 period is 3,481,355 (000 Lei).
Table 8. Strategic Objective 5: Breakdown of financing by budgetary program (thousand RON)
Strategic Objective’s Programmes Budget TOTAL ,000 RON
Total Value/years ,000 RON
2017 2018 2019 2020
P 5.1 Improved administrative capacity for sectoral policy management and implementation
1,566,493 372,708 391,343 399,183 403,259
TOTAL SO5 1,566,493 372,708 391,343 399,183 403,259
57
Increase Degree of confidence in the institution and actions of MNE: Target 2030: 65%; Target 2020: 60%Absorption rate of funds dedicated the education, research and science sector through the EU Programmes - Target 2030: 90% Target 2020: 50%State budget compliance rate: Difference between the budget planned on January 1 and the final budget on December 31, the current year: Target 2030: 0.1% ; Target 2020: 1.0%Difference between the budget planned on January 1 and the budget execution as on December 31 : Target 2030: 0.50%; Target 2020: 1.00%
Impacts
(5.1.1) Improving the structural and functional stability of MNE and its subordinated institutions: Number of yearly changes in functional structure up to max 1 from max.2/year (actual baseline) and Percentage index of public sector employees, actually employed in institutions/structures with functional duties in the national educational sector (benchmark = 2014) maintain 0,93 percent (actual baseline)(5.1.2) Increasing the effectiveness of the ES policy formulation and implementation processes: Penalties paid on EAFRD and ESF, relative to the total payments in the previous year, max 0,00001 percent from 5,82)%/(2,7)% (actual baseline); Number of changes at chapter level, and negative rectifications of the State budget up to 20/year from 30/year (actual baseline)(5.1.3) Increasing the efficiency of the use of MNE’s operational budget: Share of management expenses in the total annual budget of MNE up to 14,70 % from 14,84% (actual baseline); Management expenses per employee of MNE up to RON/pers. 77,055 from RON/pers. 74,818 (actual baseline)
Program Outcomes
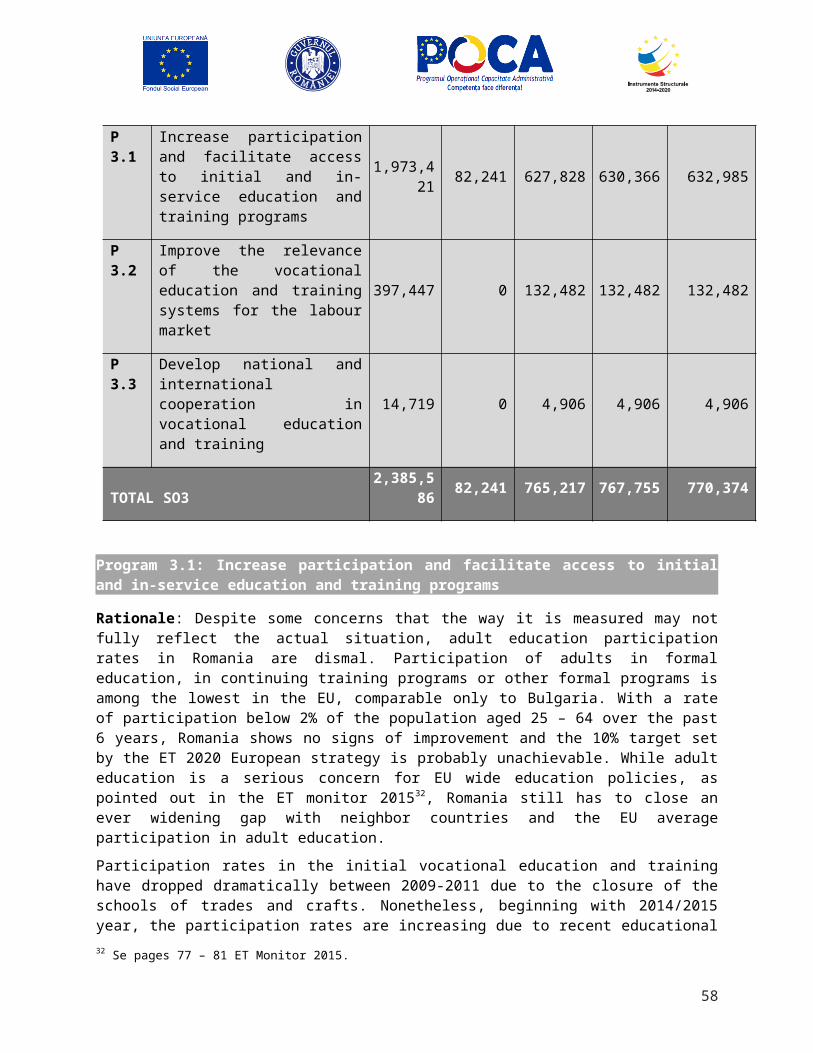
Program 5.1: Improving the administrative capacity of sectoral policy management and implementation
Rationale: The MNE is the central public authority responsible for the design and implementation of the national sector strategies in education, research and science. With the EU program resources providing significant inflows that benefit the sector, it is a priority for MNE to use its national resources to modernize the administration, and increase the efficiency and effectiveness with which it delivers policies and services to students and other beneficiaries.
Modernizing public administration must represent a major priority of the ministry. This can be achieved by promoting efficient measures inside the public administration system to increase the modern technology solutions used by the ministry; to develop and improve the relationship and collaboration with social partners and all ES stakeholders; to simplify the legislative and administrative procedures in ERS (reduce the administrative burden); and to optimize the organizational structure of the ministry.
Today, (3.6) million students and their families, i.e. over 16 % of the Romanian population, benefit, directly and indirectly, from the ministry’s policies and actions. Increasing their confidence in the ES institutions and actions is an important measure of success. This applies particularly to the following specific functions: i) strategy/policy formulation in the ES sector; ii) regulation and set-up of the legal framework governing the ES; iii) management of the state property; iv) management of national and European funds for education, research and science; v) monitoring and control of the implementation of and compliance with the relevant sectoral regulations; vi) managing authority for the national programs in the ERS sector; and vii) payment of funds and delivery of ES programs and services.
With these in mind, Romania needs a knowledge-driven, flexible and information-based ERS administration to: (i) more effectively fulfill its strategic function (through better mechanisms for formulating the ES policy framework), and (ii) more efficiently deliver sector policies and services to its target beneficiaries (through an improved institutional framework).
Areas with priority for improvement over 2017-20 include: (i) refinement of functional roles, procedures and mechanisms for setting Romania’s ES strategy and for delivering the ISP; (ii) closing human capacities gaps (such as the shortage of education economists and managers involved in policy formulation, or of ICT experts in MNE to address data management needs); (iii) tackling the deficient access to sector information and data; (iv) addressing the lack of performance assessment tools for both sector and staff; and (v) increased coordination with other government agencies in areas with important impact on ES performance (e.g. social protection, health, research and development, transportation, environment).
MNE’s mission is ambitious but can be fulfilled through the measures described further below. This will require an improvement of the ministry’s own performance through important changes that will be made during the ISP period (and beyond), covering critical areas such as: i) organizational stability; ii) public policy formulation; iii) efficient management of human, financial and material resources; iv) strategic planning; and v) public partnerships and public relations.
Objectives: Program 5.1 is intended to achieve till 2020 the following outcomes :
- (5.1.1) Improving the structural and functional stability of MNE and its subordinated institutions: Number of yearly changes in functional structure37 down to max 1 from max.2/year (actual baseline) and Percentage index of public sector employees, actually employed in institutions/structures with functional duties in the educational sector (benchmark = 2014) maintain (0,93)% (actual baseline).
37Change shall mean any amendment to Government Decision on the reorganization and functioning of MNE and certain subordinated structures, or to any regulation that annuls and replaces this Decision (including the act itself).
58
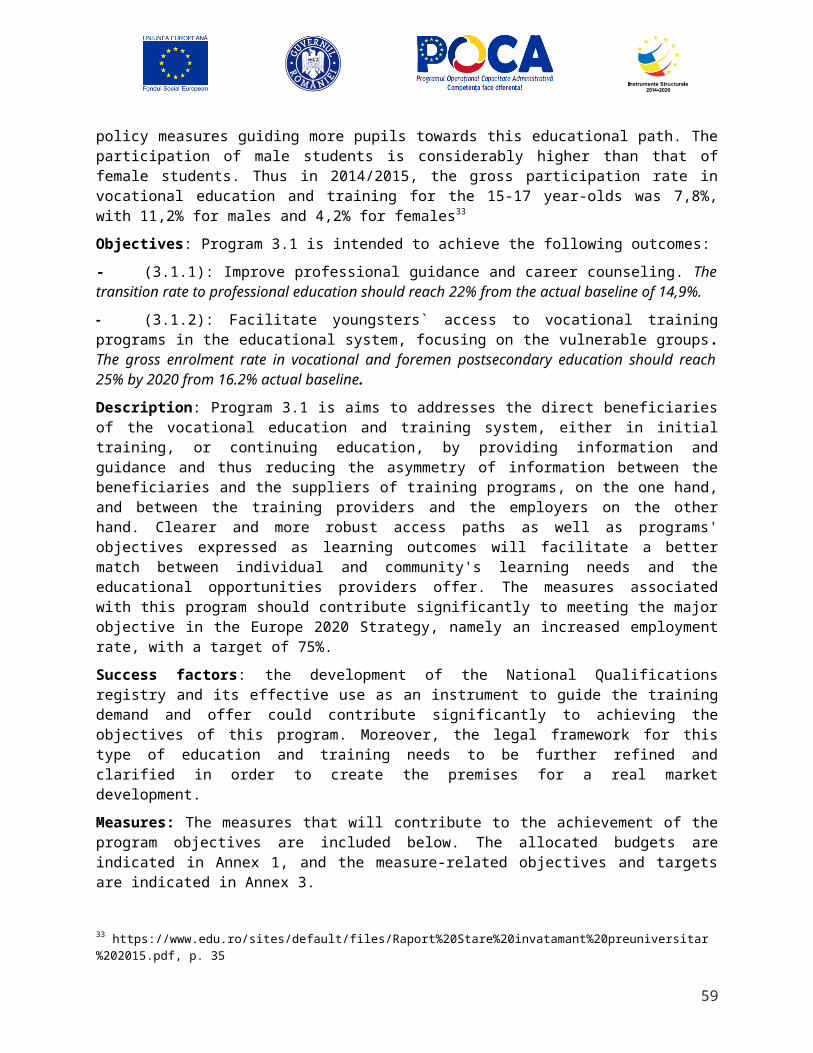
- (5.1.2) Increasing the effectiveness of the ES policy formulation and implementation processes: Penalties paid on EAFRD and ESF, relative to the total payments in the previous year, max 0,00001% from (5,82)%/(2,7)% (actual baseline); Number of changes at chapter level, and negative rectifications of the State budget down to 20/year from 30/year (actual baseline).
- (5.1.3) Increasing the efficiency of the use of MNE’s operational budget: Share of management expenses in the total annual budget of MNE down to (14,70)% from (14,84)% (actual baseline); Management expenses per employee of MNE up to RON/pers.( 77,055) from RON/pers. (74,818) (actual baseline).
Description: The successful implementation of sectoral strategic objectives requires a stable, functional, planned, transparent, well-financed and publicly assessed ES administration. Program 5.1 supports the measures aimed at improving the administrative capacity of sectoral policies management and implementation, with a view to achieving a better functional performance of the ministry and its coordinated or subordinated structures. The Program consists of two categories of measures: i) specific measures, which support a given field or sub-sector within the administration and have a dedicated budget during the implementation period; and ii) (soft) accompanying measures that support all fields and functions of the administration horizontally, require a permanent intra- and inter-institutional collaboration during the implementation period, do not have a directly allocated budget, but are indirectly supported from the State budget, through the nature of the organization’s activity.
Program 5.1 is dedicated to MNE and the structures under its coordination or subordination. Its successful implementation will be reflected in a greater stability of the ES administration, in successfully implemented sectoral public policies, and in the greater and more effective use of national and European budget funds. Such results will be noted provided that the beneficiaries and the stakeholders demand them, and are involved during the implementation process.
Equally, the administration’s decision-makers and specialists need to carry out consistent actions, in order to: i) reduce the frequency of functional structure changes; ii) reduce the specialized staff turnover and de-professionalization; iii) ensure that public policies are drafted in a coherent manner, based on well-defined procedures and are adequately informed by statistical data, analyses, prognoses; iv) ensure the use of participative and consultative methods for public policies development; v) facilitate access to information, while involving and consulting the direct beneficiaries of the sectoral public policies; vi) be open to partnerships and local and international collaborations; vii) computerize the data, information and document flows; ; viii) use the ministry’s operational budget in an efficient manner; and ix) ensure processes of periodical monitoring and evaluation, annual revision of the strategic plan measures’ implementation and the publication of results.
Measures: The primary measures that will contribute to the achievement of the Program results are included below. The allocated budgets are indicated in Annex 1, and the measure-related outputs and targets are indicated in Annex 3.
(5.1.1) With a view to improving the structural and functional stability of MNE and its subordinate institutions:
Measures dedicated to institutional modernization; increase in effectiveness; improvement of institutional processes and procedures
1 - Revision of organizational responsibilities and the accompanying procedures, to allow for a better strategy formulation and a smooth implementation of the ISP
59
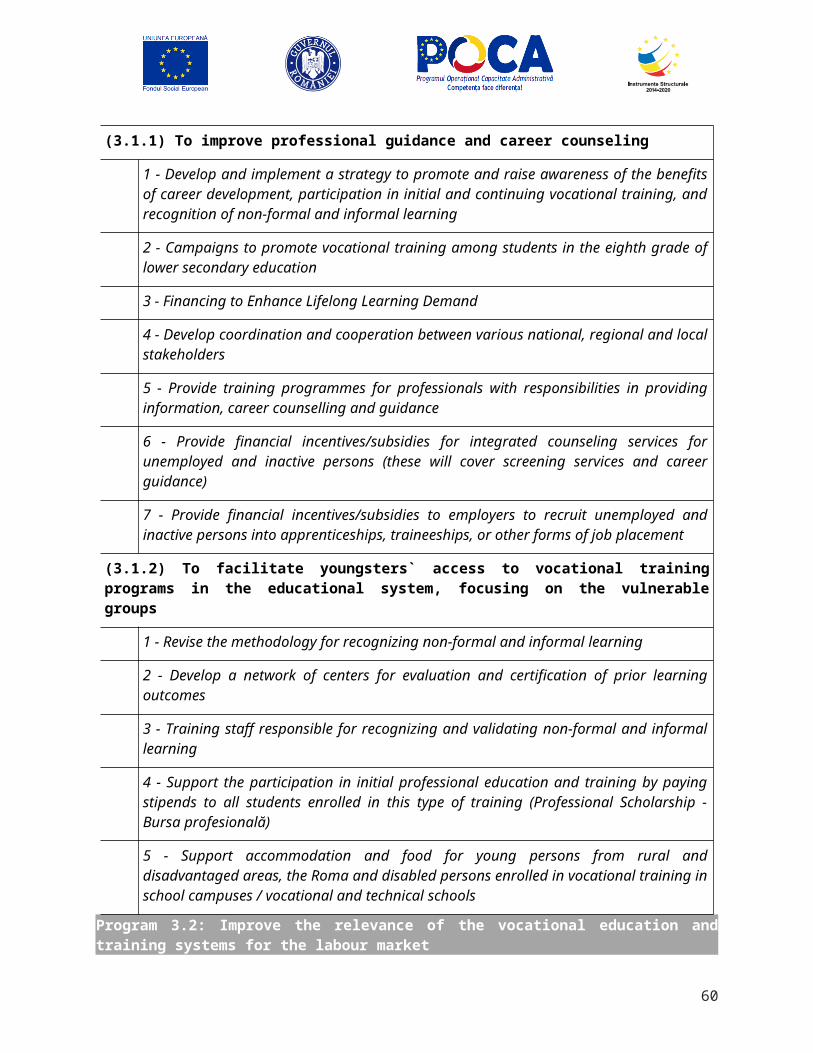
2 - Development of the ICT infrastructure
Measures targeting the specialized staff of the ES administration
3 - Human resources management and adaptation to the organization needs
4 - Vocational training, learning and expertise of the ministry’s specialized staff
Measures targeting performance assessment and financial management
5 - Performance assessment system for the ES administration
6 - Development of annual and multi-annual budget Programs for the full use of internal and external funds allocated
Measures targeting transparency and free access to public interest information, and communication/coordination with sector policy stakeholders
7 - Transparency in the decision-making process and the formulation of public policies and legal framework
8 - Informing students, teachers, researchers and public policy beneficiaries about the Programs dedicated to the ES
(5.1.2) With a view to streamlining the policy formulation and implementation in the educational sector:
Measures targeting public policy formulation and communications with stakeholders
1 - Operationalization of ES public policy impact analyses and policy making feedback loops:
2 - Consultation with citizens and the stakeholders involved in the ES, for the formulation and promotion of public policies
3 - Inter-institutional collaboration and experience sharing with relevant national and international organizations
4 - Technical assistance
(5.1.3) With a view to increasing the efficiency of the use of MNE’s administrative budget
1 - Developing the analysis, audit, control, and risk management capacity
2 - Securing and using external and extra-budgetary funds for the development of the administrative and institutional capacity
3 - Effective and efficient functioning of the services provided by the ministry through its own structures and through the coordinated agencies
60
IV.Arrangements for the Implementation, Monitoring and Evaluation of the ISP
To be relevant, an institutional strategic plan must link to the government’s core policy and financial planning processes. Accordingly, the MNE ISP 2017-20 must guide the preparation of year’s budget request, which will be prepared in 2017 for 2018-20. It is noted that, although the budget contains expenditure projections for three years, it only provides activity and expenditure details for one year. However, over time, it is anticipated that greater attention would be paid to the second and third years.
Accountability: With the parliamentary approval of the State Budget, the implementation of the strategic plan begins. MNE, through its Public Policy Unit and with the help of technical units, will prepare annual operational plans for the implementation of the ISP. They will serve as a basis for monitoring. This activity is extremely important as it enables senior management to identify and resolve potential challenges in advance.
Monitoring and evaluation framework: A monitoring and evaluation framework is laid out in Annexes 2 and 3, and provides indicators and targets for the various planning levels (see Table below). Annex 1 provides an overview of the financial inputs. To the extent possible and in order not to overburden the MNE, the ISP monitoring framework was designed such as to seamlessly integrate with the Common Monitoring and Evaluation Framework (CMEF) that mandatorily applies to the European Programs 2017-20.
Data collection and management: An IT system for strategic planning and performance assessment has been developed with the format of proposed structure of ISP. The application will illustrate key functions of ISP. The IT application is connected with GSG and MPF and the progress of ISP implementation is seen at all levels of execution and management. The progress against indicators is seen by all interested stakeholders and citizens, through an interface available for the public at large.
Reporting: in deciding what to monitor and with what frequency, it is important not to overburden MNE’s operational directorates. Typically, different levels of performance indicators require different reporting time frames. Thus:
- Input and process/product indicators will be measured monthly, or at least quarterly
- Output indicators will be measured quarterly,
- Outcome indicators will be measured semi-annually
- Impact indicators will be tracked annually.
A diagram of the monitoring cycle of for the MNE ISP is provided below.
61
Figure 11. Monitoring Cycle for MNE Strategic Plan
It is important to report to the Government, Parliament, stakeholders and general public on the progress being made towards the planned results, as per performance indicators and targets established. Although annual progress reports are not currently prepared, it will be critical that annual reports be produced and publicly released by MNE in the future.
Evaluation: Apart from the European funded programs, which are subject to rigorous ex-ante, mid-term and ex-post evaluations, MNE has not yet developed a formal approach to ex-post evaluation of its other programs and policies. In the future, this activity will provide important information for implementing changes to the way in which programs and policies are delivered. These changes will not affect dramatically the strategic plan.
It will be desirable to strengthen the periodic evaluation of the entire program portfolio that MNE is managing and outlined in the ISP, and preferably synchronize it with the EU Programmes evaluation calendar. This activity could be outsourced to the same evaluators who will cover the Human Capital Operational Programme, and thus create synergies in the evaluation efforts, while also benefitting from a holistic view on the ERS policy results.
Updating the ISP: A full strategic planning exercise will be conducted every four years. During the intervening years, MNE will prepare an annual update to determine if any changes to the strategic plan are required. The update will require the completion of three activities:
- comparing the previous year’s actual versus planned results; these would be based on targets set in the strategic and operational plans;
62
SEMI-ANNUAL RESULTS REVIEW:
OUTPUT, PRODUCT AND INPUT INDICATORS
QUARTERLY REVIEW: PROCESS/
PRODUCT AND INPUT INDICATORS
QUARTERLY REVIEW: PROCESS/
PRODUCT AND INPUT INDICATORS
QUARTERLY REVIEW: PROCESS/
PRODUCT AND INPUT INDICATORS
QUARTERLY REVIEW: PROCESS/
PRODUCT AND INPUT INDICATORS
ANNUAL RESULTS
REVIEW: ALL INDICATORS
OCT.JULYAPRILJAN.
- conducting an environmental scan to determine if any significant changes are required to the assumptions that underpin the current plan (see Chapter Context and Challenges); and
- adding one additional year to the plan.
By ensuring that the plan continues to cover at least three years beyond the planning year, the updated strategic plan can continue to inform the annual budget request, which also requires a three-year forecast. Most often, the vision, strategic goals and program goals do not change unless a major event, such as an unforeseen economic crisis, occurs. The updating exercise should be completed by May 30 each year, which allows time for the collection and analysis of results achieved from the previous year.
63
Year Set New Targets
2017 for 2021
2018 for 2022
2019 for 2023
V. Financial Resources
The viability of the 2017-20 ISP is determined by the availability of financial resources required for the implementation of the measures underneath each specific objective.
Despite the generous EU programmes envelope, securing adequate funding has remained a challenge to date when pursuing the institutional reforms. Certain relevant areas and services, either within the sector administration or under the portfolio of other government agencies remain under-funded. Equally important, there remain many policy areas with high relevance and high impact on education and research areas that are not funded through the MNE budget or that require establishing effective complementarities between resources and policies managed by MNE and those managed by other government agencies (e.g. local infrastructure for education, with a high impact on the quality of education in small towns and in rural areas).
Both for policy areas, as well as for pursuing institutional reform priorities, MNE would be well served by a transition to program budgeting. This should be useful for achieving a better articulation between the general sector goals, corresponding action plans and the resources that need to be allocated.
Lastly, Romania needs to clearly identify and prioritize, by policy areas, an adequate balance between public and private resources that need to contribute to the development of the education sector.
A budget outline that summarizes the core strategic objectives and the main measures is presented in Annex 1.
Table 9 below illustrates the financial envelopes per year needed for the operationalization of the ISP over the 2017-20 period.
Table 9. Financial resources for operationalizing the 2017-20 ISP (thousand RON)
Year Total 2017 2018 2019 2020
Estimated amounts 125,681,940 18,543,247 35,410,531 35,553,303 36,174,859
The financial resources have been classified into three main categories: (i) resources from the state budget for national policies and administrative expenses, (ii) resources from the state budget for co-financing EU policies and (iii) resources from the EU budget. Figure 7 below shows the ISP budget per funding source, with more than three quarters being covered by EU programmes funding.
64
Graph 13. Structure of the ISP budget, by funding sources (%, 2017-20)
23%
67%
10%
Structure by funding sources
State budget EU funds State budget for co-financing
The 2017 budget and the 2016-18 Fiscal-Budgetary Strategy were taken into account when planning the state budget allocations for national policies and EU programmes co-financing. The established ceilings were taken into account both for the level of co-financing and for the other types of expenses - classified under the state budget category for national policies. The EUR - RON exchange rate used is the same one used to substantiate the 2016 budget.
The number of programs has increased significantly compared to the previous ISP. Despite its obvious complexity, this new ISP shows an increased consistency in terms of programs and facilitates the implementation and monitoring process.
Graph 14. Breakdown of estimated financial resources, by year and strategic objective (thousand RON, 2017-2020)
2017 2018 2019 2020 -
2,000,000
4,000,000
6,000,000
8,000,000
10,000,000
12,000,000
14,000,000
16,000,000
SO 1 SO 2 SO 3 SO 4 SO 5
The graph above illustrates the breakdown of financial resources by strategic objectives. Over 71 % of the total resources allocated to the sector are directed towards the achievement of the strategic objective related to reducing early school leaving, while strategic objective related to tertiary education has an allocation of over 21 % of the total resources. Strategic Objectives 1 and 2 cover about 92 % each, while the other strategic objectives, which focuses on lifelong learning, VET and institutional activities, over 8 % of the total resources.
Strategic Objective 2017 2018 2019 2020
65
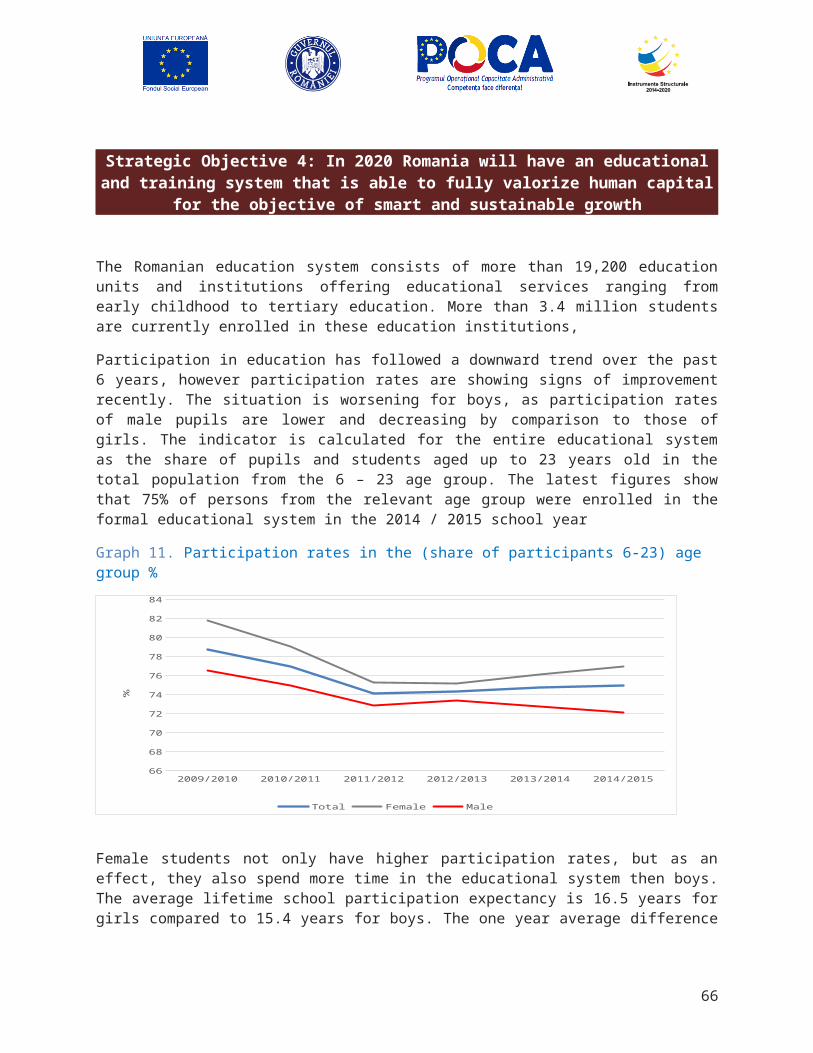
SO 1 15,535,863 30,551,959 30,612,644 31,146,612
SO 2 2,552,300 3,701,785 3,773,485 3,854,442
SO 3 82,241 765,217 767,755 770,374
SO 4 754,999 857,388 876,075 822,179
SO 5 372,708 391,343 399,183 403,259
One important institutional challenge is the ability to implement the ISP, including through budget execution based on defined programs. From an organizational and managerial perspective, this represents the main challenge for the next period - the transition from 3 programs to 12, as well as tracking their actual execution. Budget execution by programs will also bring important changes in the management of MNE’s structures, namely the budget directorate.
66
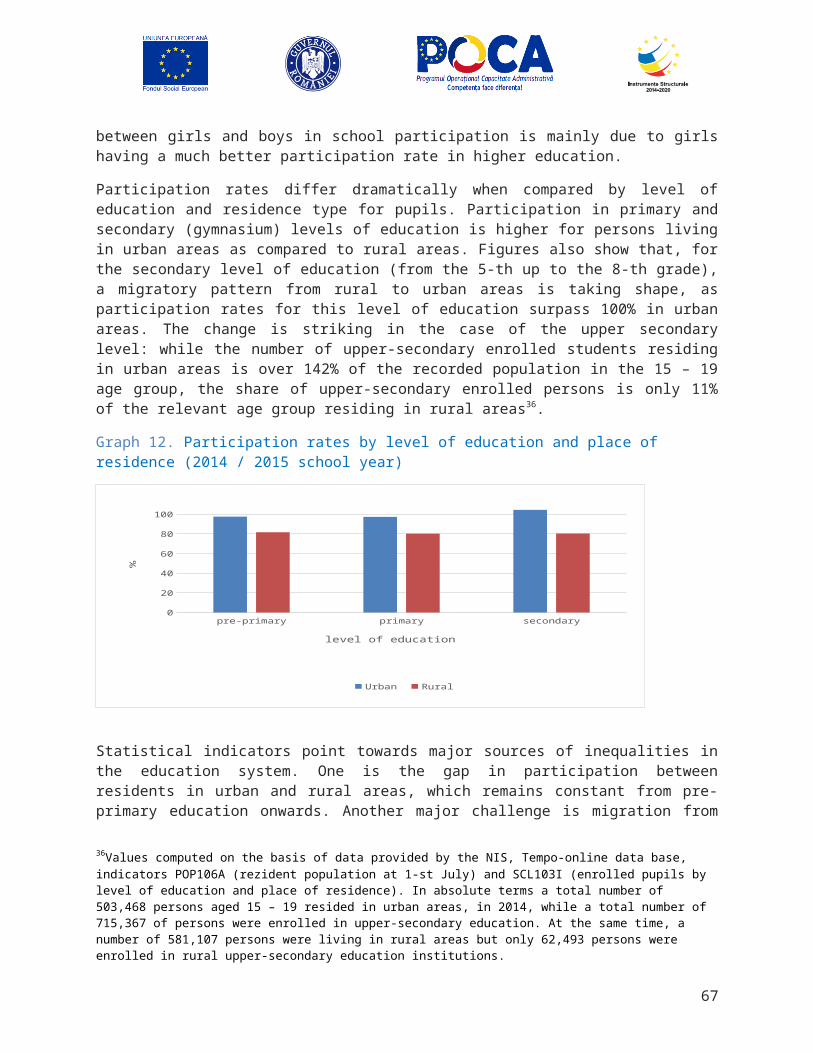
Annexes
Annex 1.a: Budgetary Programs and Financial Resources 2017-2020
Strategic Objective / ProgrammeTotal
Value ,000 RON
Total breakdown per year ,000 RON
2017 2018 2019 2020
Total 125,681,940 18,543,247 35,410,531 35,553,303 36,174,859
Strategic Objective No. 1 107,847,078 15,535,863 30,551,959 30,612,644 31,146,612
Program 1.1: Increased access to early education and care 31,640,846 2,220,244 9,767,030 9,816,786 9,836,786
Program 1.2: Enhance the participation in primary and secondary education and attainment in compulsory education for all
75,473,565 12,880,499 20,688,661 20,696,706 21,207,698
Program 1.3: Evaluation and quality assurance in primary and secondary education
732,667 43,5120 96,267 99,152 102,128
Strategic Objective No. 2 13,882,013 2,552,300 3,701,785 3,773,485 3,854,442
Program 2.1: Committing the Sector to Diversity, Access and improved Attainment in all Areas
10,429,231 1,776,344 2,830,463 2,882,981 2,939,444
Program 2.2: Promoting the Establishment of High Quality, Adaptive Academic Programs
3,343,432 752,909 841,615 862,509 886,398
Program 2.3: Promoting Strategic Engagement with Economy 109,350 23,047 29,707 27,995 28,600
Strategic Objective No. 3 2,385,586 82,241 765,217 767,755 770,374
Program 3.1: Increase participation and facilitate access to initial and in-service education and training programs
1,973,421 82,241 627,828 630,366 632,985
Program 3.2: Improve the relevance of the vocational education and training systems for the labour market
397,447 0 132,482 132,482 132,482
Program 3.3. Develop national and international cooperation in vocational education and training
14,719 0 4,906 4,906 4,906
Strategic Objective No. 4 3,310,641 754,999 857,388 876,075 822,179
Program 4.1: Capital investments in education 2,540,000 620,000 630,000 640,000 650,000
Program 4.2: Supporting students for the Baccalaureate exam and facilitate transition for better access in higher
770,641 134,999 227,388 236,075 172,179
67
Strategic Objective / ProgrammeTotal
Value ,000 RON
Total breakdown per year ,000 RON
2017 2018 2019 2020
education
Strategic Objective No. 5: Improve the institutional framework of educational, research and science sector
1,566,493 372,708 391,343 399,183 403,259
Program 5.1: Improving the administrative capacity of sectoral policy management and implementation
1,566,493 372,708 391,343 399,183 403,259
Strategic Objective/ ProgrammeFinancing from State budget ,000 RON
TOTAL 2017 2018 2019 2020
Total 14,373,814 3,693,975 3,460,427 3,560,322 3,659,089
Strategic Objective No. 1 1,822,496 695,619 364,583 375,513 386,781
Program 1.1: Increased access to early education and care 0 0 0 0 0
Program 1.2: Enhance the participation in primary and secondary education and attainment in compulsory education for all
1,089,829 260,499 268,316 276,361 284,653
Program 1.3: Evaluation and quality assurance in primary and secondary education
732,667 435,120 96,267 99,152 102,128
Strategic Objective No. 2 10,641,790 2,543,675 2,619,986 2,698,586 2,779,543
Program 2.1: Committing the Sector to Diversity, Access and improved Attainment in all Areas
7,421,941 1,774,044 1,827,266 1,882,084 1,938,547
Program 2.2: Promoting the Establishment of High Quality, Adaptive Academic Programs
3,140,267 750,609 773,127 796,321 820,210
Program 2.3: Promoting Strategic Engagement with Economy 79,582 19,022 19,593 20,181 20,786
Strategic Objective No. 3 344,066 82,241 84,710 87,248 89,867
Program 3.1: Increase participation and facilitate access to initial and in-service education and training programs
344,066 82,241 84,710 87,248 89,867
Program 3.2: Improve the relevance of the vocational education and training systems for the labour market (state budget)
0 0 0 0 0
Program 3.3. Develop national and international cooperation in vocational education and training (state budget)
0 0 0 0 0
68
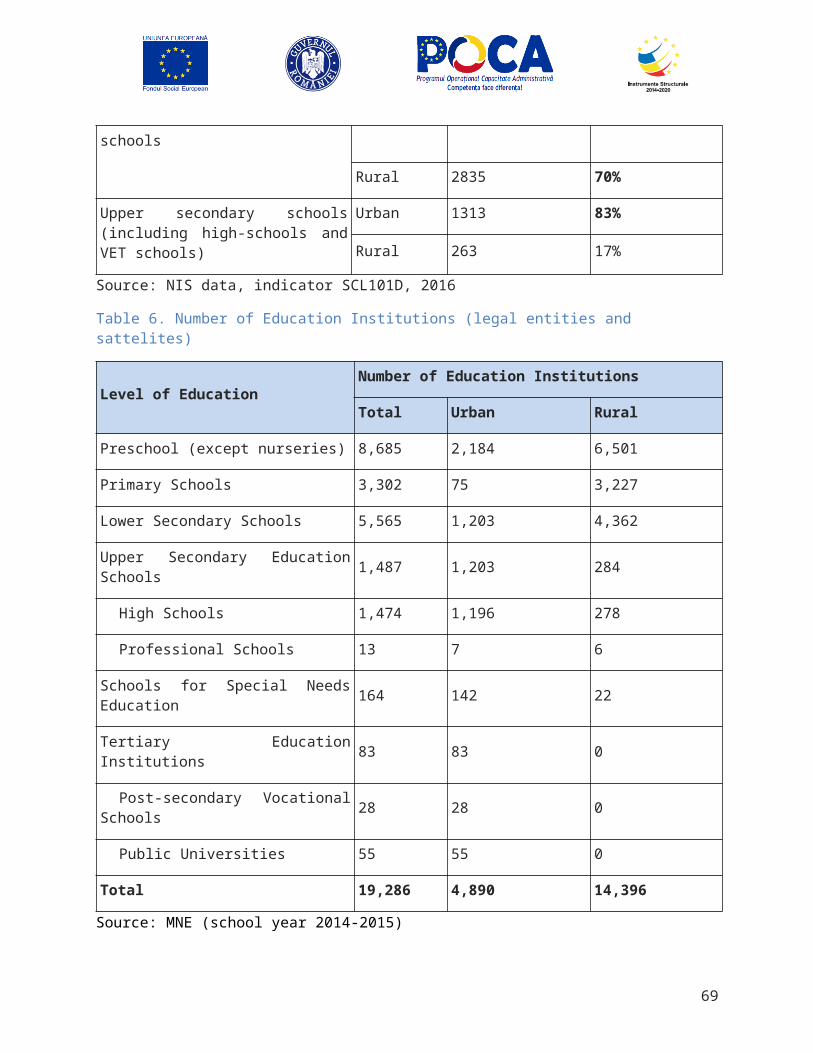
Strategic Objective/ ProgrammeFinancing from State budget ,000 RON
TOTAL 2017 2018 2019 2020
Strategic Objective No. 4 3,310,641 754,999 857,388 876,075 822,179
Program 4.1: Capital investments in education 2,540,000 620,000, 630,000 640,000 650,000
Program 4.2: Supporting students for the Baccalaureate exam and facilitate transition for better access in higher education
770,641 134,999 227,388 236,075 172,179
Strategic Objective No. 5: Improve the institutional framework of educational, research and science sector
1,564,691 372,305 390,921 398,739 402,726
Program 5.1: Improving the administrative capacity of sectoral policy management and implementation
1,564,691 372,305 390,921 398,739 402,726
69
Annex 1.b: Education budget breakdown per years (2017-2020) and specific measures
Strategic Objective / Programme / Specific Objective / Measure
Total funds including EU and local budgets State budget
Year 2017 2018 2019 2020 2017 2018 2019 2020
Total 18,543,247 35,410,531 35,553,303 36,174,859 3,693,975 3,460,427 3,560,322 3,659,089
Strategic Objective No. 1 15,535,863 30,551,959 30,612,644 31,146,612 695,619 364,583 375,513 386,781
Program 1.1: Increased access to early education and care 2,220,244 9,767,030 9,816,786 9,836,786 0 0 0 0
Kindergarten vouchers(financed from Ministry of Labor and Social Justice)
0 0 0 0
Support access by direct baseline financing of preschool educational institutions
2,220,000 2,250,000 2,300,000 2,320,000
Stimulation of participation in early-childhood education and care by providing counseling services to parents, parental education programs and other support measure
0 6,702,813 6,702,813 6,702,813
Provision of qualified early childhood education teachers and carers.
0 813,972 813,972 813,972
Development of quality assurance framework for early-childhood
0 0 0 0
70
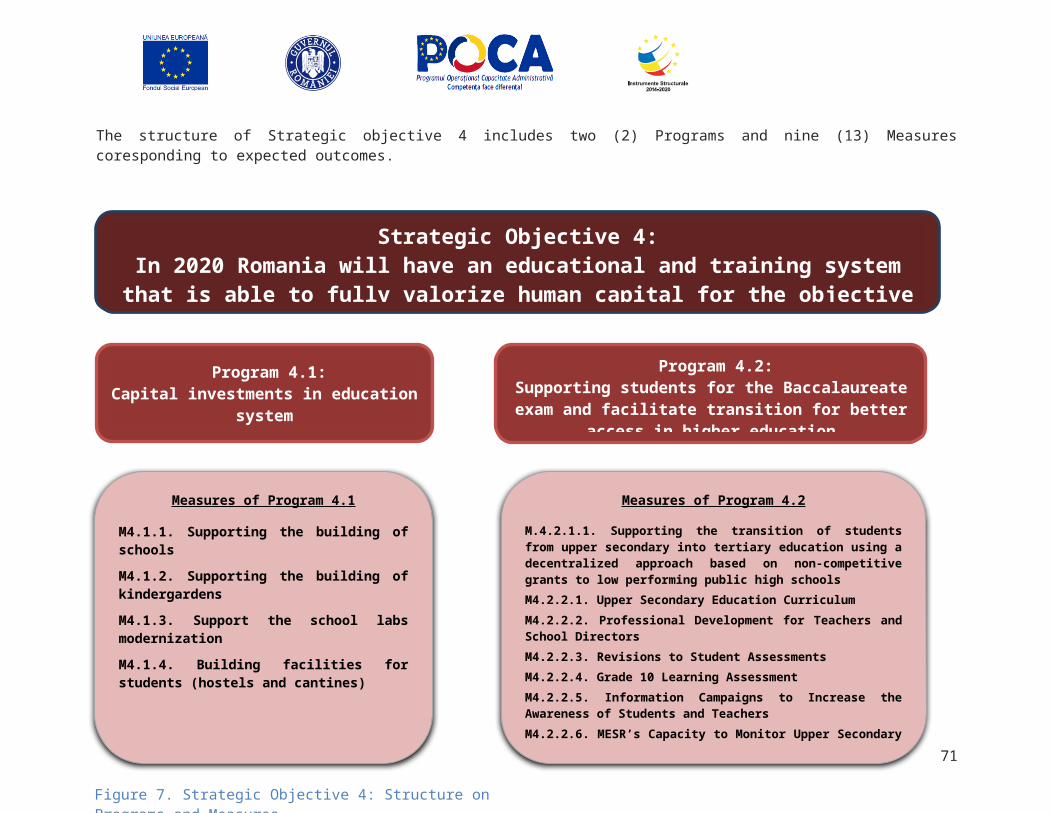
Strategic Objective / Programme / Specific Objective / Measure
Total funds including EU and local budgets State budget
education
Develop the curricular framework for early childhood education
244 244 0 0
Program 1.2: Enhance the participation in primary and secondary education and attainment in compulsory education for all
12,880,499 20,688,661 20,696,706 21,207,698 260,499 268,316 276,361 284,653
Direct baseline funding of public schools 12,500,000 13,000,000 13,000,000 13,500,000
Board subsidies for pupils with disabilities in mainstream education
120 125 125 130 120 125 125 130
Social protection measures 260,379 268,191 276,236 284,523 260,379 268,191 276,236 284,523
Provision of methodology, ex-ante impact studies and legal framework for school after school programs:
0 2,300 2,300 0
Supply of adequate school after school programs 120,000 125,000 125,000 130,000
Developing the prevention and monitoring capacity of segregation in schools:
0 0 0 0
Provide teacher training in the area of early warning, prevention and intervention systems to detect children at risk of repetition and dropout
0 5,660,540 5,660,540 5,660,540
Complete and support existing 0 1,632,506 1,632,506 1,632,506
71
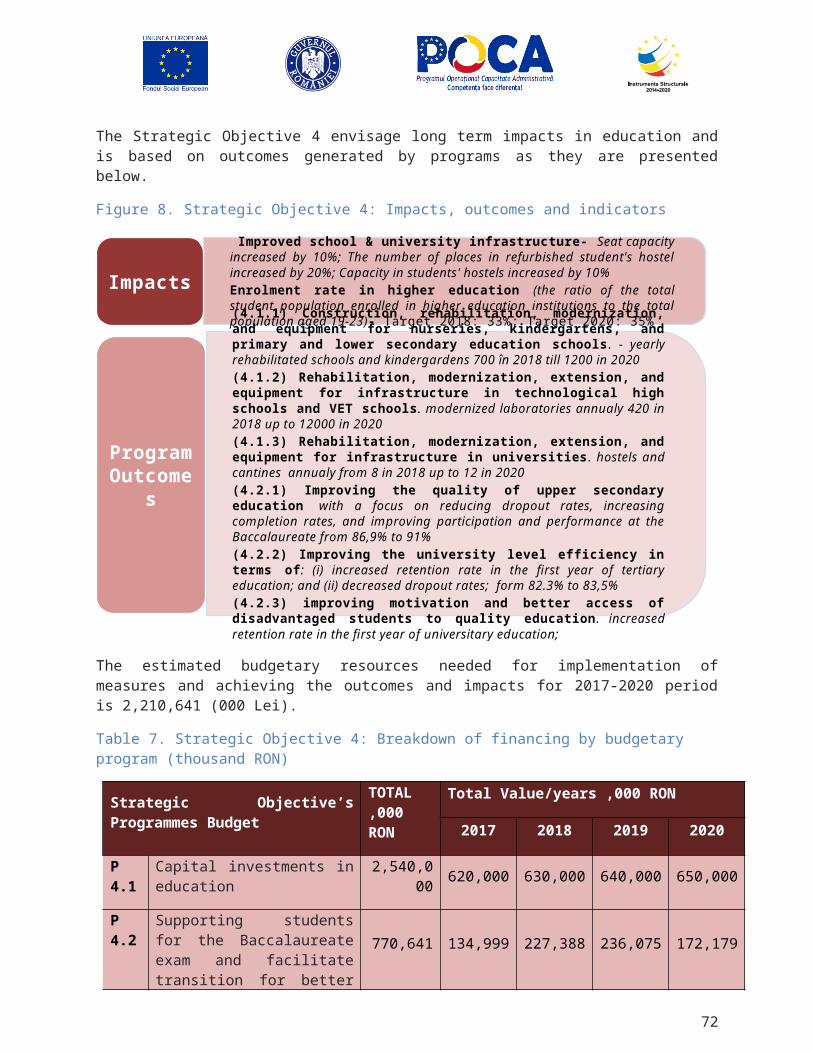
Strategic Objective / Programme / Specific Objective / Measure
Total funds including EU and local budgets State budget
fragmented counseling initiatives for students within and outside of the education system
Program 1.3: Evaluation and quality assurance in primary and secondary education
43,5120 96,267 99,152 102,128 435,120 96,267 99,152 102,128
National evaluation of all schools 15,000 15,000 0 0 15,000 15,000
School inspection and mentoring services
342,000 352 363 374 342,000 352 363 374
Establish a system of professional initial training:
3,000 3,090 3,183 3,278 3,000 3,090 3,183 3,278
Establish a system of professional in-service training
5,000 5,150 5,305 5,464 5,000 5,150 5,305 5,464
Revision of school curriculum. 0 0 0 0
Provision of school textbooks 120 125 125 130 120 125 125 130
Participation of pupils in the national evaluations and exams
70,000 72,550 90,177 92,882 70,000 72,550 90,177 92,882
Participation of pupils in the PISA international evaluation
0 0 0 0
Support excellence through supplementary financing of accredited school education institutions (performance awards)
0 0 0 0
Strategic Objective No. 2 2,552,300 3,701,785 3,773,485 3,854,442 2,543,675 2,619,986 2,698,586 2,779,543
72
Strategic Objective / Programme / Specific Objective / Measure
Total funds including EU and local budgets State budget
Program 2.1: Committing the Sector to Diversity, Access and improved Attainment in all Areas
1,776,344 2,830,463 2,882,981 2,939,444 1,774,044 1,827,266 1,882,084 1,938,547
Promotion of institutional diversity. Classification of higher education institutions according to their mission and social roles. Provision of different financial incentives and earmarked budgets for each class (type) of university
2,300 2,300 0 0
Provision of different financial incentives and earmarked budgets for each class (type) of university
0 0 0 0
Support merit-based access based on fee waiver for performing students; stipends for best performing students and complement the merit-based fee-waiver with a program of need-based grants program - social stipends - mostly at institutional level
1,632,544 1,681,521 1,731,967 1,783,926 1,632,544 1,681,521 1,731,967 1,783,926
Accommodation and board subsidies - complementary financing
141,500 145,745 150,117 154,621 141,500 145,745 150,117 154,621
Implement a student loan program (assuring financing as well as national regulation)
0 0 0 0
Encourage outreach to students from 0 992,039 992,039 992,039
73
Strategic Objective / Programme / Specific Objective / Measure
Total funds including EU and local budgets State budget
underrepresented groups and to nontraditional learners, including adults and Romanian ethnics from abroad
Increase the transparency of information and provide guidance on educational opportunities and outcomes to inform study choices and reduce drop-out.
0 8,858 8,858 8,858
Program 2.2: Promoting the Establishment of High Quality, Adaptive Academic Programs
752,909 841,615 862,509 886,398 750,609 773,127 796,321 820,210
Revision of Ministry and ARACIS Rules Governing Accreditation of Programs
2,300 2,300 0 0
Ranking of study programs and supplementary funding based on excellence
504,106 519,229 534,806 550,850 504,106 519,229 534,806 550,850
Supporting excellence through doctoral study grants
246,503 253,898 261,515 269,360 246,503 253,898 261,515 269,360
Development of financial incentives to institutions judged to have developed new programs of exceptional promise in terms of developing transversal and entrepreneurial skills.
0 66,188 66,188 66,188
Program 2.3: Promoting Strategic Engagement with Economy 23,047 29,707 27,995 28,600 19,022 19,593 20,181 20,786
Development of a national research 0 1,484 1,484 1,484
74
Strategic Objective / Programme / Specific Objective / Measure
Total funds including EU and local budgets State budget
agenda for innovation and entrepreneurship program, to encourage dialogue between the education and business sectors
Curriculum redesign in order to focus on skills and competences that are required by the labor market
19,022 19,593 20,181 20,786 19,022 19,593 20,181 20,786
Establishment of Industry Liaison specialists at each institution; universities and other post-secondary institutions develop plans for outreach to community businesses
0 0 0 0
Development of a national labor market data framework
2,300 2,300 0 0
Involvement of industry/employers in the design and delivery of programs, supporting staff exchanges and including practical experience in courses
0 4,606 4,606 4,606
Financial Support to ICT Programs 1,725 1,725 1,725 1,725
Strategic Objective No. 3 82,241 765,217 767,755 770,374 82,241 84,710 87,248 89,867
Program 3.1: Increase participation and facilitate access to initial and in-service education and training programs
82,241 627,828 630,366 632,985 82,241 84,710 87,248 89,867
Develop and implement a strategy to promote and raise awareness of the
0 14,975 14,975 14,975
75
Strategic Objective / Programme / Specific Objective / Measure
Total funds including EU and local budgets State budget
benefits of career development, participation in initial and continuing vocational training, and recognition of non-formal and informal learning
Campaigns to promote vocational training among students in the eighth grade of lower secondary education
0 89,852 89,852 89,852
Financing to Enhance Lifelong Learning Demand
0 97,827 97,827 97,827
Develop coordination and cooperation between various national, regional and local stakeholders
0 0 0 0
Provide training programmes for professionals with responsibilities in providing information, career counselling and guidance
0 44,926 44,926 44,926
Provide financial incentives/subsidies for integrated counseling services for unemployed and inactive persons (these will cover screening services and career guidance) LLL
0 160,233 160,233 160,233
Provide financial incentives/subsidies to employers to recruit unemployed and inactive persons into apprenticeships, traineeships, or other forms of job placement LLL
0 30,360 30,360 30,360
76
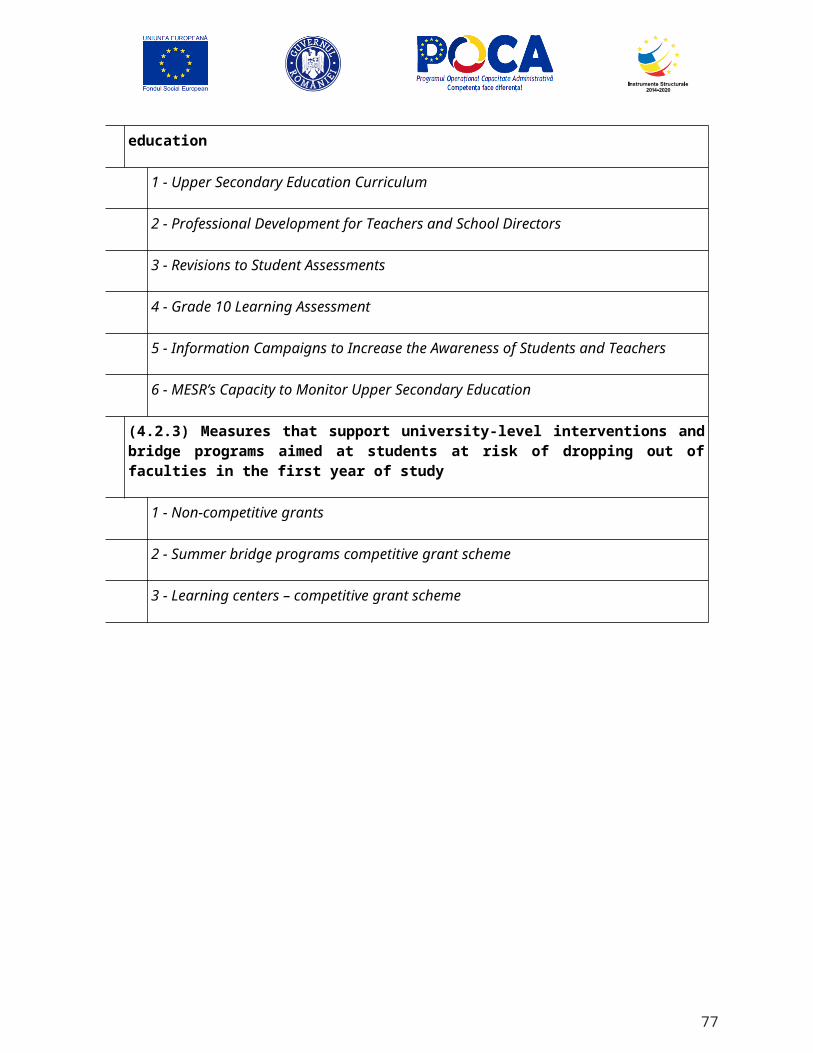
Strategic Objective / Programme / Specific Objective / Measure
Total funds including EU and local budgets State budget
Revise the methodology for recognizing and certifying non-formal and informal learning
0 57,347 57,347 57,347
Develop a network of centers for evaluation and certification of prior learning outcomes
0 44,275 44,275 44,275
Training staff responsible for recognizing and validating non-formal and informal learning
0 3,323 3,323 3,323
Support the participation to initial professional education and training by paying stipends to all students enrolled in this type of training (Bursa profesională - Professional scholarship)
82,121 84,585 87,123 89,737 82,121 84,585 87,123 89,737
Support accommodation and food for young persons from rural and disadvantaged areas, the Roma and disabled persons enrolled in vocational training in school campuses / vocational and technical schools
120 125 125 130 120 125 125 130
Program 3.2: Improve the relevance of the vocational education and training systems for the labour market
0 132,482 132,482 132,482 0 0 0 0
Development of occupational standards 0 5,329 5,329 5,329
Development of training curricula and 0 5,329 5,329 5,329
77
Strategic Objective / Programme / Specific Objective / Measure
Total funds including EU and local budgets State budget
materials
Carry out regular studies and research 0 1,332 1,332 1,332
Create a national mechanism for monitoring the professional insertion of the VET system graduates
0 3,997 3,997 3,997
Develop a mechanism for systematically monitoring, evaluating and revising the quality of vocational training system
0 0 0 0
Develop a mechanism for quality assurance of continuous VET
0 5,329 5,329 5,329
Develop a mechanism for the certification of learning outcomes in initial and continuing vocational education and training (VET)
0 5,329 5,329 5,329
Develop mechanisms for quality assurance in the recognition and validation of non-formal and informal learning
0 2,530 2,530 2,530
Establish and develop a national center for continuous training of teachers, trainers, external evaluators and tutors
0 29,517 29,517 29,517
Develop and provide continuous training programmes for trainers and teachers
0 29,517 29,517 29,517
Establishing of Community Permanent 0 44,275 44,275 44,275
78
Strategic Objective / Programme / Specific Objective / Measure
Total funds including EU and local budgets State budget
Learning Centers (CPLC) to implement LLL initiatives at the community level
Develop a mechanism for quality assurance in work-based-learning
0 0 0 0
Program 3.3: Develop national and international cooperation in vocational education and training
0 4,906 4,906 4,906 0 0 0 0
Extending the learning methods that develop entrepreneurial competences
0 1,635 1,635 1,635
Extending mutual learning and best practice exchanges
0 1,635 1,635 1,635
Supporting participation in European mobility programs
0 1,635 1,635 1,635
Strategic Objective No. 4 134,999 227,388 236,075 172,179 134,999 227,388 236,075 172,179
Program 4.1: Capital investments in education 0 0 0 0
Program 4.2: Supporting students for the Baccalaureate exam and facilitate transition for better access in higher education
134,999 227,388 236,075 172,179 134,999 227,388 236,075 172,179
Measure that addresses bottom up approach through School-based Interventions (estimated cost: EUR 127.3 million)
79,821 156,148 144,811 117,776 79,821 156,148 144,811 117,776
79
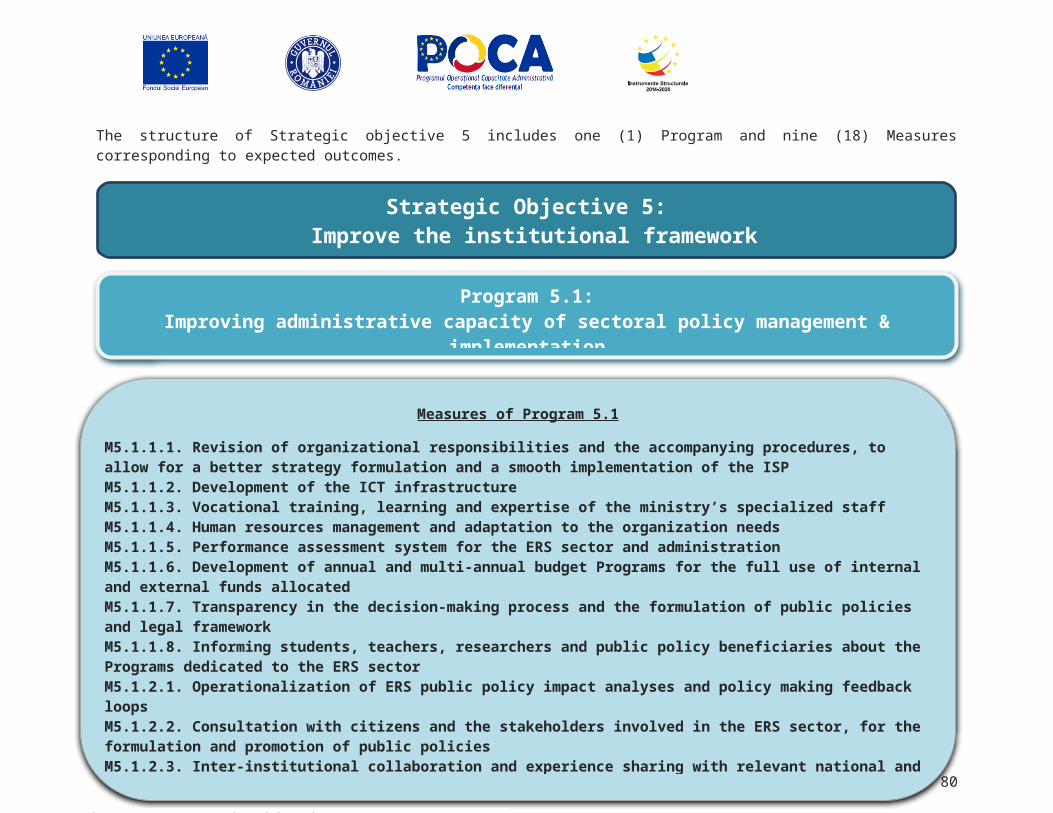
Strategic Objective / Programme / Specific Objective / Measure
Total funds including EU and local budgets State budget
Measures that address systemic challenges faced by all high schools in facilitating the transition into tertiary education (estimated cost: EUR 17.2 million):
16,641 13,857 21,590 9,309 16,641 13,857 21,590 9,309
Measures that support university-level interventions and bridge programs aimed at students at risk of dropping out of faculties in the first year of study (estimated cost: EUR 49.1 million)
38,537 57,383 69,674 45,094 38,537 57,383 69,674 45,094
Strategic Objective No. 5: Improve the institutional framework of educational, research and science sector
372,708 391,343 399,183 403,259 372,305 390,921 398,739 402,726
Program 5.1: Improving the administrative capacity of sectoral policy management and implementation
372,708 391,343 399,183 403,259 372,305 390,921 398,739 402,726
Measures dedicated to institutional modernization; increase in effectiveness; improvement of institutional processes and procedures
20,402 21,422 21,851 22,069 20,402 21,422 21,851 22,069
Measures targeting the specialized staff of the ES administration
601 631 644 650 601 631 644 650
Measures targeting performance assessment and financial management
450 473 482 487 450 473 482 487
80
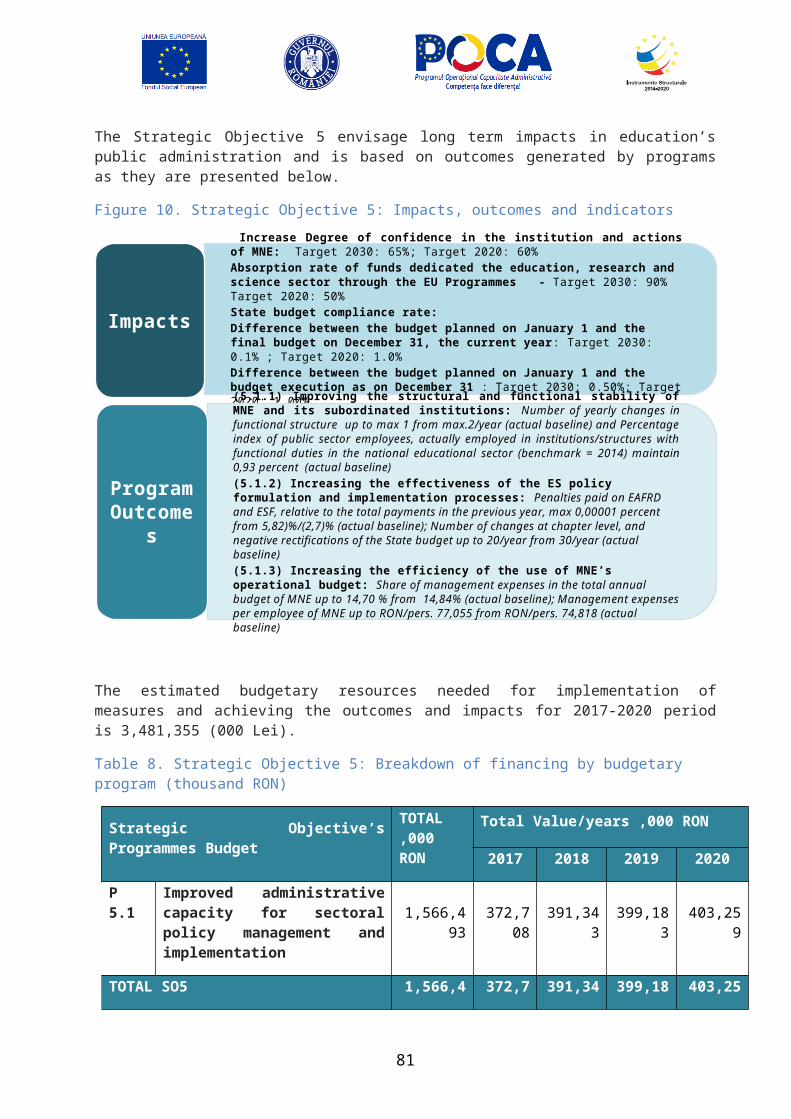
Strategic Objective / Programme / Specific Objective / Measure
Total funds including EU and local budgets State budget
Measures targeting transparency and free access to public interest information, and communication/coordination with sector policy stakeholders
89 93 95 96 89 93 95 96
Measures targeting public policy formulation and communications with stakeholders
618 648 674 765 215 226 230 233
Increasing the efficiency of the use of MNE’s administrative budget
135 142 145 146 135 142 145 146
Effective and efficient functioning of MNE’s departments from organizational structure
163,170 171,329 174,755 176,503 163,170 171,329 174,755 176,503
Effective and efficient functioning of MNE’s subordinated and coordinated institutions (inspectorates, libraries, others)
187,243 196,605 200,537 202,543 187,243 196,605 200,537 202,543
81
Annex 2: Institutional Strategic Plan (summary table)
Description of objectives and indicators Unit Reference value Target 2018 Target 2020
Strategic Objective No. 1: The reduction and prevention of early school leaving by promoting equal access to quality education at all school levels
Impact indicator No. 1.1: Early leavers from education and training (% of the population aged 18-24 with at most lower secondary education and who were not in further education or training during the last four weeks preceding the survey)
% 19.1 15 11.3
Impact indicator No. 1.2: Share of low reading literacy performance in pupilsImpact indicator No. 1.3: Upper secondary education graduation rate (the ratio of the population who graduates high school with or without the baccalaureate exam in a given year to the total population aged 18)
%
%
39
8138
35
85
30
90
Program 1.1: Increased access to early education and care
Outcome indicator 1.1.1: Participation in early childhood education (the share of the population aged 4-5 who is participating in early education)39
Outcome indicator 1.1.2: Share of low achievers in reading literacy amongst students who had participated in pre-primary education for more than one year
%
%
85.5
-
87
35
92
30
Program 1.2: Enhance the participation in primary and secondary education and attainment in compulsory education for all
Outcome indicator 1.2.1: Gross enrolment rate in primary and lower secondary
38 Reference from school year 2013/201439 Eurostat Code: tps00179
82
Description of objectives and indicators Unit Reference value Target 2018 Target 2020
education (6-14 years)40 % 89.9 92 95
Outcome indicator 1.2.2: Gross enrolment rate of pupils 15-18 years-old41
Outcome indicator 1.2.3: The baccalaureate pass rate42 %%
8044
8553
9065
Program 1.3: Evaluation and quality assurance in primary and secondary education
Outcome indicator 1.3.1: The graduation rate of lower secondary (8th grade)43
Outcome indicator 1.3.2: The rate of participation of high school graduates in the baccalaureate exam44
%%
83.779.3
8684
9087
Strategic Objective No. 2: In 2020 Romania will have a tertiary education sector that can energize economic growth, contribute to increased productivity and promote social cohesion, thus serving as the foundation of a knowledge-based economy
Impact indicator No. 2.1: Tertiary educational attainment (share of 30–34 year-olds should have completed tertiary education)45
% 25.6 26 26.7
Impact indicator No. 2.2: Employability of recent graduates with tertiary education attainment (employment rates of recent graduates, within 3 years, with tertiary level attainment (ISCED 5-8), in the age group 20-34, that are not in education and training)46
% 77 80 85
Program 2.1: Committing the Sector to Diversity, Access and improved Attainment in all Areas
Outcome indicator 2.1.1: Percentage of 25-34 year olds who have completed a tertiary degree47
% 25.5 27 30
40 Calculated on National Statistics Institute data by the Institute of Educational Sciences in the the annual report on the state of education41 National Statistics Institute42 Calculated by the Institute of Educational Sciences on data provided by the National Statistics Institute43 Calculated on National Statistics Institute data by the Institute of Educational Sciences in the the annual report on the state of education44 Calculated by the Institute of Educational Sciences on data provided by the National Statistics Institute45 Agenda 2020 headline indicator46 Eurostat indicator code tps00053
83
Description of objectives and indicators Unit Reference value Target 2018 Target 2020
Outcome indicator 2.1.2: Percentage of 30 -34 year olds residing in rural areas who have completed tertiary degrees48
Outcome indicator 2.1.3: Percentage of females graduating in science, mathematics and computing tertiary educational programs49
%
%
7.8
3.1
8.1
4
8.5
5
Program 2.2: Promoting the Establishment of High Quality, Adaptive Academic Programs
Outcome indicator 2.2.1: Improved research impact of higher education institutions (average Hirsch index of academic staff employed by HEIs)
No. 2 3 4
Outcome indicator 2.2.2: Number of Romanian higher education programs (subjects) ranked amongst the first 200 in international rankings (e.g. QS World University Rankings by Subject
No.- 50 65
Program 2.3: Promoting Strategic Engagement with Economy
Outcome indicator: employment rate of recent graduates from tertiary education (people aged 15 – 24) who are employed and hold a tertiary level degree) %
No.50.4
052-
551 / year
Strategic Objective No. 3: To develop an initial and continuous vocational education and training system adapted to the needs of the labour market and direct beneficiaries
Impact indicator No. 3.1: Adults’ participation in life-long learning (share of 25–64 year-olds participating in education and training)50 % 1,3 4 10
Impact indicator No. 3.2: Gross enrolment rate in vocational education and training (share of 15-17 year-olds participating in professional education and training)51
% 7,8 10 15
47 Eurostat indicator code edat_lfse_0348 Eurostat indicator code edat_lfs_991349 Eurostat indicator code educ_uoe_grad0350 Agenda 2020 headline indicator51 Calculated on National Statistics Institute data by the Institute of Educational Sciences in the the annual report on the state of education
84
Description of objectives and indicators Unit Reference value Target 2018 Target 2020
Impact indicator No. 3.3: Employment rate of recent graduates with professional education attainment (employment rates of graduates professional education level (ISCED 3-4), within 3 years, in the age group 20-34, that are not in education and training)52
% 59,8 63 67
Program 3.1: Increase participation and facilitate access to initial and in-service education and training programs
Outcome indicator 3.1.1: Transition rate to professional education53
Outcome indicator 3.1.2: Gross enrolment in vocational and foremen postsecondary education (ratio of students enrolled to total population aged 19-21)54
%
%
14,9
16,2
16
19.5
22
25
Program 3.2: Improve the relevance of the vocational education and training systems for the labour market
Outcome indicator: Drop-out rate in vocational education and training 55 % 4,3 3 2,5
Outcome indicator: Rate of technological secondary education graduates passing baccalaureate examinations56
% 48,6 55 60
Program 3.3: Develop national and international cooperation in vocational education and training
Outcome indicator: Total number of students participating in entrepreneurship innovation and development programs yearly Outcome indicator: Total number of students participating in international mobility programmes yearly
No. 40.000 45.000 50.000
52 Eurostat indicator code tps0005353 Calculated on National Statistics Institute data by the Institute of Educational Sciences in the annual report on the state of education54 Calculated on National Statistics Institute data by the Institute of Educational Sciences in the annual report on the state of education55 Calculated on National Statistics Institute data by the Institute of Educational Sciences in the annual report on the state of education56 Calculated on National Statistics Institute data by the Institute of Educational Sciences in the annual report on the state of education
85
Description of objectives and indicators Unit Reference value Target 2018 Target 2020
No. 2.800 3.700 4.600
Strategic Objective No. 4: In 2020 Romania will have an educational and training system that is able to fully valorize human capital for the objective of smart and sustainable growth.
Impact indicator 4.1: Improved school & university infrastructure Impact indicator 4.2: Baccalaureate passing rate (the share of students who pass the baccalaureate exam in a given year to the participants at examImpact indicator 4.3: Enrolment rate in higher education (the ratio of the total student population enrolled in higher education institutions to the total population aged 19-23)
No.%
%
-67.8%
31
+5%70%
33
+10%73%
35
Program 4.1: Capital investments in education
Outcome indicator: Number of schools/kindergartens rehabilitated annuallyOutcome indicator: Number of laboratories modernized annuallyOutcome indicator: Number of hostels/canteens built annually
Nr
Nr
Nr
-
-
-
700
420
8
1200
600
12
Program 4.2: Supporting students for the Baccalaureate exam and facilitate transition for better access in higher education
Outcome indicator: Average graduation rate in project-supported high schoolsOutcome indicator: Average Baccalaureate passing rate in project-supported high schoolsOutcome indicator: Average retention rate in the first year of tertiary education in project-supported faculties
%%%
86.949.682.3
8952
82.5
9156
83.5
Strategic Objective No. 5: Strengthened institutional framework
Impact indicator 5.1: Internal and external trust in the institution and actions of MNEImpact indicator 5.2: Degree of absorption of funds available for the national education and science sector through the EU Programmes Impact indicator 5.3: Degree of state budget compliance:
%%
%
n.a.31%
0.27%
60%40%
0.20%
60%50%
0.01%
86
Description of objectives and indicators Unit Reference value Target 2018 Target 2020
difference between the budget planned on January 1 and the budget planned and rectified on December 31, current year difference between the budget planned on January 1 and the budget execution as on December 31
% 2.57% 2.00% 1.00%
Program 5.1: Improved administrative capacity for sectoral policy management and implementation
Outcome indicator: Number of yearly changes in functional structure57
Outcome indicator: Percentage index of public sector employees, actually employed in institutions/structures with functional duties in the educational sector (benchmark = 2014)
No/year%
max.20.93%
max.10.93%
max.10.93%
Outcome indicator: Penalties paid on:EAFRD, relative to the total payments made in the previous yearEAS, relative to the total payments made in the previous yearOutcome indicator: Number of changes at chapter level, and negative rectifications of the State budget
%%
No./year
5.82%2.7%
30/year
0.0001%0.0001%
25/year
0.00010.0001
20/year
Outcome indicator: Share of management expenses in the total annual budget of MNE Outcome indicator: Management expenses per employee of MNE
%
RON/pers.
14.84%
74,818
14.80%
75,500
14.70%
77,055
57Change shall mean any amendment to Decision no. 725/2010 on the reorganization and functioning of MADR and certain subordinated structures, or to any regulation that annuls and replaces this Decision (including the act itself).
87
Annex 3: Programs, related Measures and Outputs (summary table)
MeasuresOutput indicator
UnitBaseline
Target 2017
Target 2018
Target 2019
Target 2020
Program 1.1: Increased access to early education and care
Kindergarten vouchers. The measure is meant to support the attendance of kindergarten services by pupils from disadvantaged (low-income) families. It has been introduced by the Law 248/2015 and it is a financial allowance, paid to the family, a fixed amount in value of 0,1 ISR (social indicator of reference) for every child that attends the kindergarten (3-6 years old). It is a financial incentive for the families to send their children to kindergarten. The measure is implemented by the local authorities, but the money comes from the national budget.
BeneficiariesNo.
60.000110.000 125.000 125.000 125.000
Support access by direct baseline financing of preschool educational institutions. The measure is meant to provide public educational services at preschool level through baseline funding of all schools, including pre-primary, according to art. 104 of the Law on National Education 1/2011. The baseline funding is a per-student allowance, supported by the state budget through VAT incomes, and covers the personnel costs as well as operating costs of school institutions. The local authorities can contribute with additional funds to baseline funding.
No of schools with legal entity
No.8588
8601 8653 8685 8715
No of pupilsNo.
536000550.000 570.000 575.000 583.000
Stimulation of participation in early-childhood education and care by providing counseling services to parents, parental education programs and other support measures. It aims to increase the awareness of parents, especially from Roma population and rural areas, regarding the benefits of early childhood education and the support services available. This measure will be funded from priority axis 6, 6.2 specific objective of the Human Capital Operational Program
No of parents/beneficiarie
sNo.
0
7850 11500 11500 11500
Provide financial incentives for preschool teachers and puericultors placements in rural/ disadvantaged No of teachers 350 850 850 850
88
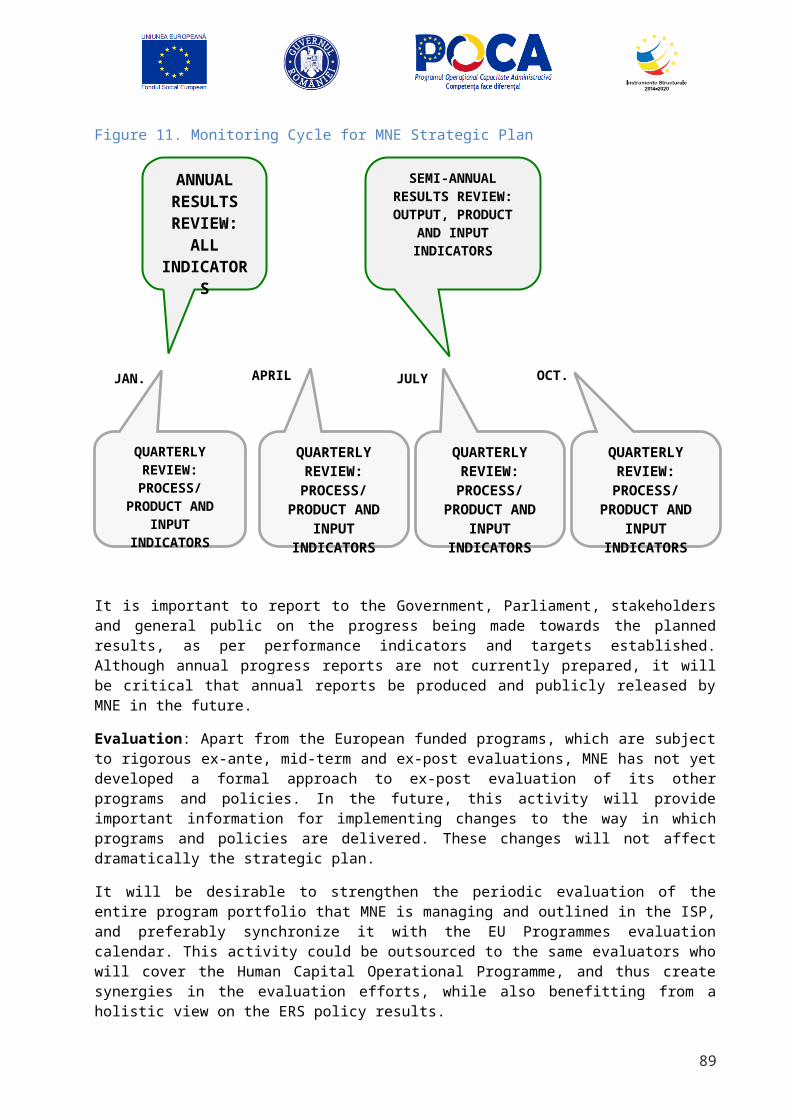
MeasuresOutput indicator
UnitBaseline
Target 2017
Target 2018
Target 2019
Target 2020
areas. Financially support for preschool teachers and carers to base themselves in rural areas in order to increase the quality of the professional staff and thus the quality of the public service in these areas.
No.0
Provision of qualified early childhood education teachers and caregivers. The measure is meant to provide qualified teachers for early childhood education, through pre-service and in-service training, in order to be able to deliver high quality public education services to the community. This measure includes stimulating the mobility of teachers through professional mobility schemes as well as mentoring programs. The measure is partly supported by the state budget, only for the training component, while the mobility schemes will be funded through the Human Capital Operational Program priority axis 6.6 and 6.2.
Number of teachers trained/ Number of
programsNo.
0
1200 1800 1800 1800
Development of quality assurance framework for early-childhood education. The measure is meant to revise and extend the legal framework for early educational service provisions, to further develop the system of quality assurance for this educational level in order to support quality provision at the national level, funded through the Human Capital Operational Program priority axis 6, specific objective 6.2.
Quality assurance framework adopted
No.0
0 1 1 1
Develop the curricular framework for early childhood education. The measure is meant to further develop the existing curricular framework for 3-6 years old and to extend the curricular framework for 0-3 years old in order to set the learning objectives and ensure common baseline learning acquisitions at the national level; funded through the Human Capital Operational Program priority axis 6, specific objective 6.2.
Curricular framework adopted/
Methodology for the organization of
nursery and other ECD services revised
and adoptedNo.
0
0 1 1 1
Program 1.2: Enhance the participation in primary and secondary education and attainment in compulsory education for all
Direct baseline funding of public schools. The measure is meant to provide public educational services at primary and secondary school levels through baseline funding, according to art. 104 of the Law on National
No of schools with legal entity 11078 11100 11135 11175
89
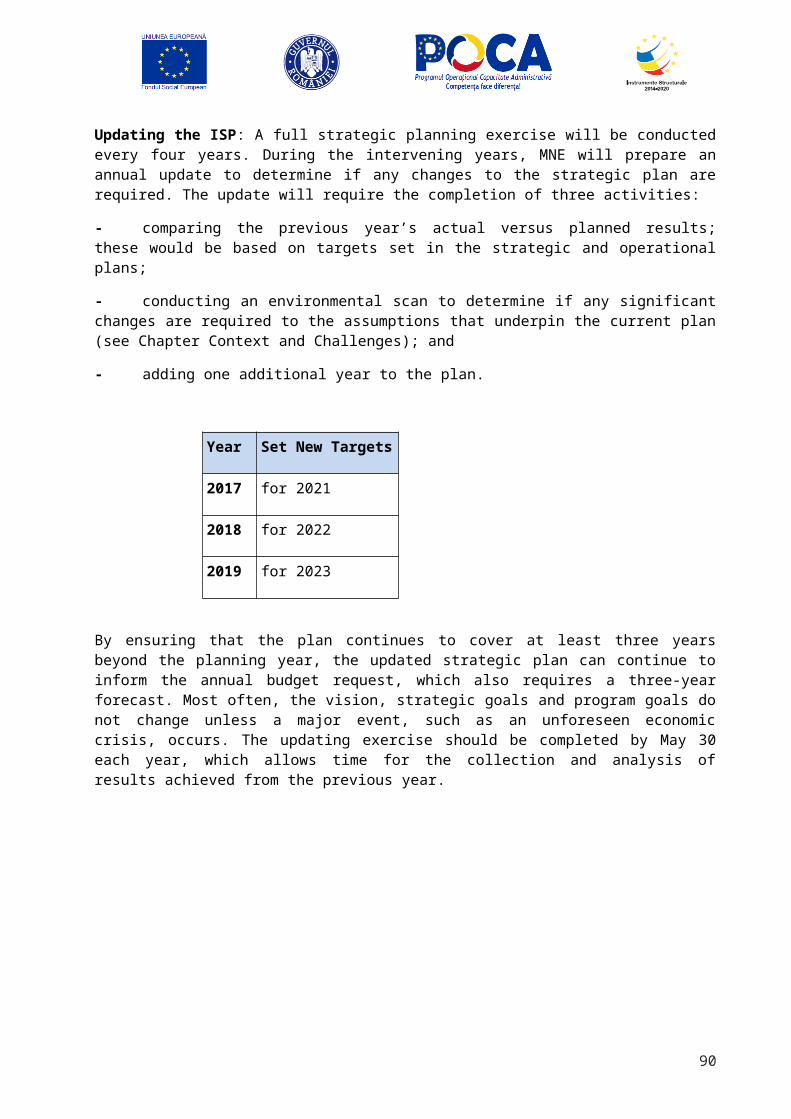
MeasuresOutput indicator
UnitBaseline
Target 2017
Target 2018
Target 2019
Target 2020
Education 1/2011. The baseline funding is a per-capita allowance, supported by the state budget through VAT incomes, and covers the personnel costs as well as operating costs of school institutions. The local authorities can contribute with additional funds to baseline funding.
No.11078
No of pupilsNo.
2.487.7392.487.739 2.500.000 2.530.000 2.550.000
Board subsidies for pupils with disabilities in mainstream education: the measure supports the participation of children with disabilities enrolled in mainstream education through direct cash payments to the families for subsidizing the pupils' meal. Pupils enrolled in special education institutions already receive a hot meal, whereas pupils with special needs in mainstream education did not benefit from the same measure. This measure is meant to allow special needs children in mainstream education the same rights as those in special education institutions.
No of pupilsNo.
100.000100.000 130.000 150.000 175.000
Social protection measures: the social protection measures are targeted at supporting the participation in education of low-income disadvantaged children by offsetting part of the private costs associated with school attendance. These measures include Money for high school program (stipends for low-income pupils attending high-school), Euro200 (a financial incentive to support the acquisition of a new personal computer), School supplies program (providing a minimal pack with school supplies at the start of the school year), reimbursement of the commuting pupils' travel expenses, Milk and croissant program and Fruits in school program (both financed by the local authorities, with financial support from state budget)
No of beneficiariesmoney for high
schoolEuro 200
School suppliesNo.
6065917086
700000
44792 45000 45000 45000
12041 13000 13000 13000
555234 550000 550000 550000
Scholarships for Moldavian pupils as well as other Romanian ethnics living abroad. The measure is targeted at encouraging the participation in the Romanian educational system of Romanian ethnics leaving abroad by granting them a Romanian State scholarship.
No of scholarshipsNo.
50005000 5200 5400 5550
Provide teacher training in the area of early warning, prevention and intervention systems to detect children at risk of repetition and dropout: The measure is aimed at developing teachers’ competences in
No of beneficiariesNo. 4000 6000 6000 6000
90
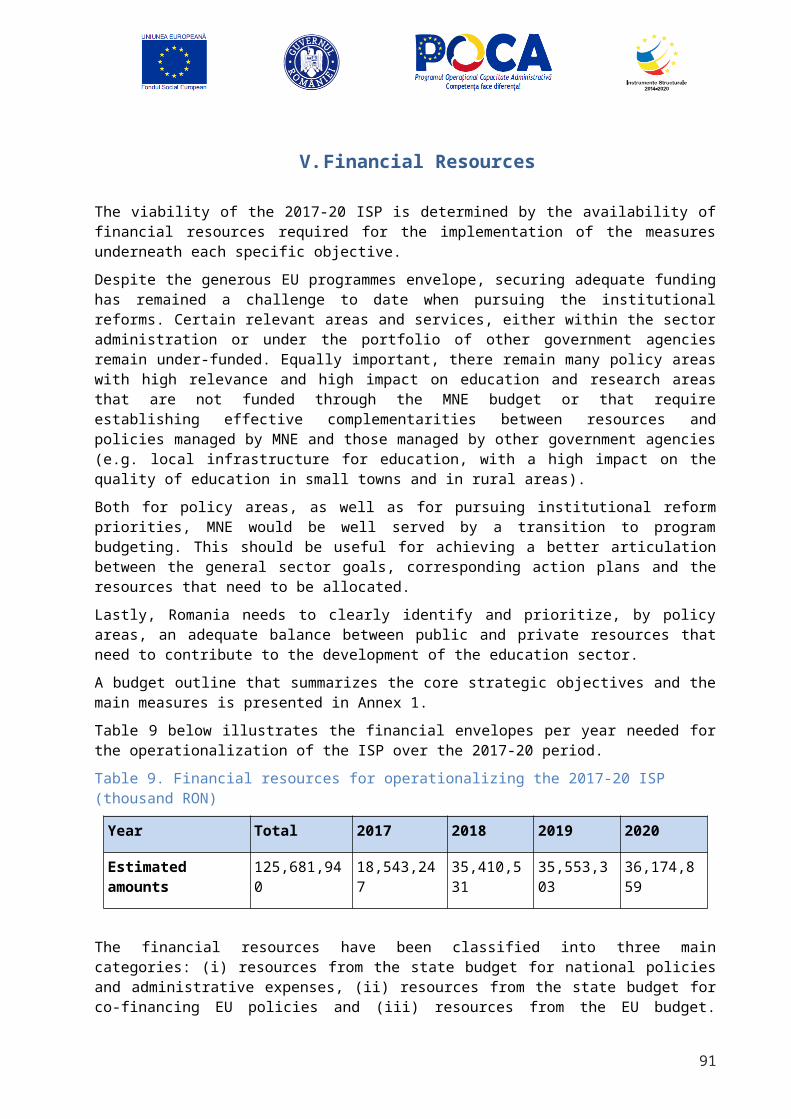
MeasuresOutput indicator
UnitBaseline
Target 2017
Target 2018
Target 2019
Target 2020
the area of early warning and addressing pupils at risk of repetition and school failure and will be funded from the Human Capital Program, axis 6, specific objective 6.2. 0
Provision of methodology, ex-ante impact studies and legal framework for school after school programs. The measure is meant to gather evidence and analyze the premises for effective delivery of after school programs. It addresses policy makers at the level of the ministry and it is financed from the state budget
Methodology adopted
No.0
1 0 0 0
Supply of adequate school after school programs. The measure is meant to facilitate school attainment for pupils at risk of school failure by provision of remedial and extra-curricular activities in order to acquire key competences. It will be funded from the state budget as well as from the Human Capital Program, axis 6, specific objective 6.2.
Number of pupilsNo0
8000 10000 10000 10000
Developing the prevention and monitoring capacity of segregation in schools. The measure is meant to support schools to become inclusive and directly addresses the provision of art. 107 of the Law on National Education No. 1/2011. It will be funded from the Human Capital Program, axis 6, specific objective 6.2.
No. of projectsNo0
400 670 670 670
Complete and support existing fragmented counseling initiatives for students within and outside of the education system. The measure is aimed at developing counseling support and school mediation services, professional and school orientation services, especially for pupils at risk. It will include the funding for the County Centers for Educational Resources and Assistance through the County Councils as well as dedicated funding from the Human Capital Program, axis 6, specific objective 6.2.
No of beneficiariesNo0
15000 25000 25000 25000
Program 1.3. Evaluation and quality assurance in primary and secondary education
National evaluation of all schools. External evaluation conducted by the Romanian Agency for Quality Assurance in School Education, contracted by the Ministry of Education to evaluate 3000 schools in the period 2017 - 2018
Number of schools-
1200 2500 3000 3500
Number of schools with maximum
rating
50 60 65 70
91
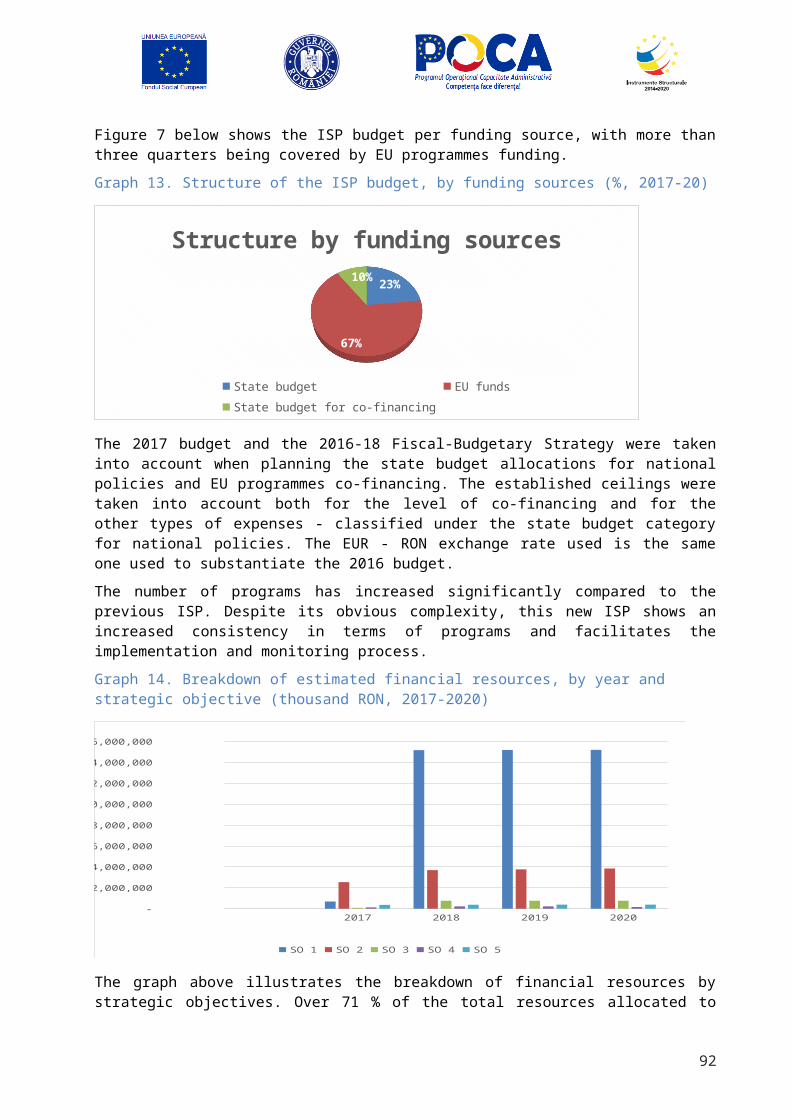
MeasuresOutput indicator
UnitBaseline
Target 2017
Target 2018
Target 2019
Target 2020
-
School inspection and mentoring services: the measure aims to support the schools through the School Inspectorates to improve the quality of teaching and school management. The measured is funded through the budgets of School Inspectorates from the state budget.
Number of visitsNumber of
mentoring initiatives-
12.000 12500 12750 12800
Establish a system of professional initial training: the measure aims at financing Didactic Master Programs in order to supply highly qualified teaching staff, including financial incentives to students enrolled in these programs. Financially supported through the state budget as well as the Human Capital program, specific objective 6.2 within the priority axis 6.
No of programs-
10 15 17 20
No of teachers-
200 450 700 1000
Establish a system of professional in-service training: the measure aims at professionalizing the teaching career by continuous development through the network of Casa Corpului Didactic as well as the network of Palatele Copiilor (for extracurricular activities) of the Ministry of Education. The state budget allowances to these institutions will constitute the financial support from the state budget, in addition to funds form the Human Capital program, specific objective 6.2 within the priority axis 6.
No of programs-
5000 6000 7000 8000
Revision of curriculum. This measure aims to elaborate the new school curriculum for grades V - VIII, by setting working groups for each thematic area, making proposals, public consultation of the proposals, legal adoption. No separate financial allocation; staff cost is ensured through a share of their paid time.
No of working groups set
No of curricula revised
25 35 40 45
Provision of school textbooks. This measure aims to set quality standards as well as the procurement procedures for the acquisition and distribution of school textbooks. It is financed through the state budget.
No of textbooks-
50 55 60 62
Support excellence through supplementary financing of accredited school education institutions: the measure aims to support teaching excellency, the organization of school contests and rewards for pupils with high achievements in national and international contests.
No of school contests
-
12 15 17 19
Participation of pupils in the national evaluations and exams: in order to assess the efficiency of school No of pupils/ 143000 133000 133000 133000
92
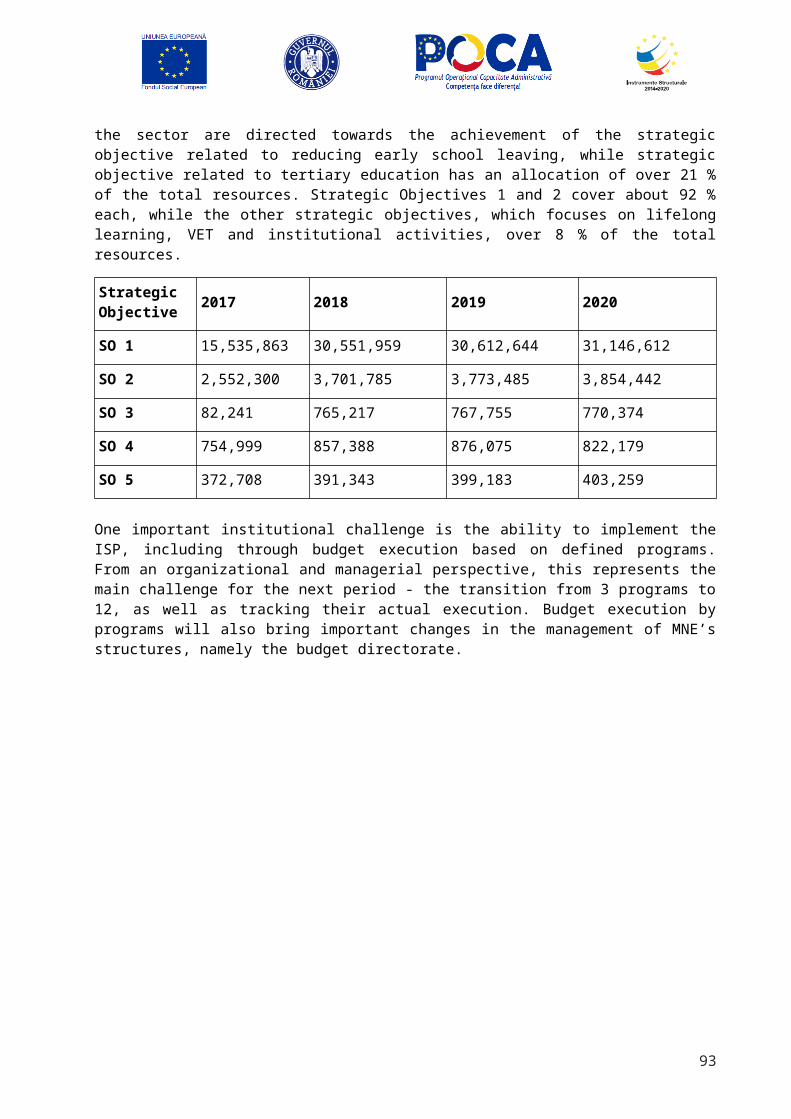
MeasuresOutput indicator
UnitBaseline
Target 2017
Target 2018
Target 2019
Target 2020
education at various levels, comprehensive national evaluations take place in the second, fourth and sixth grade, as well as national exams in the eighth grade and baccalaureate at the end of secondary education. The participation of pupils in these national tests and exams is covered from the state budget
Participation rateno
153000
Participation of pupils in the PISA international evaluation. A sample of 15 years old pupils participate in PISA survey in order to assesses the extent to which students have acquired key knowledge and skills that are essential for full participation in modern societies. The assessment focuses on reading, mathematics, science and problem-solving and the results are internationally comparable in order to benchmark the efficiency of various national educational systems. The participation of Romania in the PISA survey will be supported from the state budget.
No of pupils/no-
1500 1500 1500 1500
MeasuresOutput indicator
UnitBaseline
Target 2017
Target 2018
Target 2019
Target 2020
Program 2.1: Committing the Sector to Diversity, Access and improved Attainment in all Areas
Promotion of institutional diversity. Classification of higher education institutions according to their mission and social roles. Provision of different financial incentives and earmarked budgets for each class (type) of university. Institutional and organizational diversity are important for ensuring a diverse range of educational services are offered. Universities should be supported in developing and pursuing a clear mission and addressing specific (and multiple) target groups in their regional area. Classification of higher education institutions, as stated in the Law of Education (no. 1/2011) art. 216, is an important function of the Ministry of Education which could be used as a lever for educational policies in the field. This measure could be funded under the Human Capital Operational Program Priority Axis 6, Thematic Objective 10.
ClassificationNo.
-1 - - -
Provision of different financial incentives and earmarked budgets for each class (type) of university Methodological framework for public
- 1 1 1
93
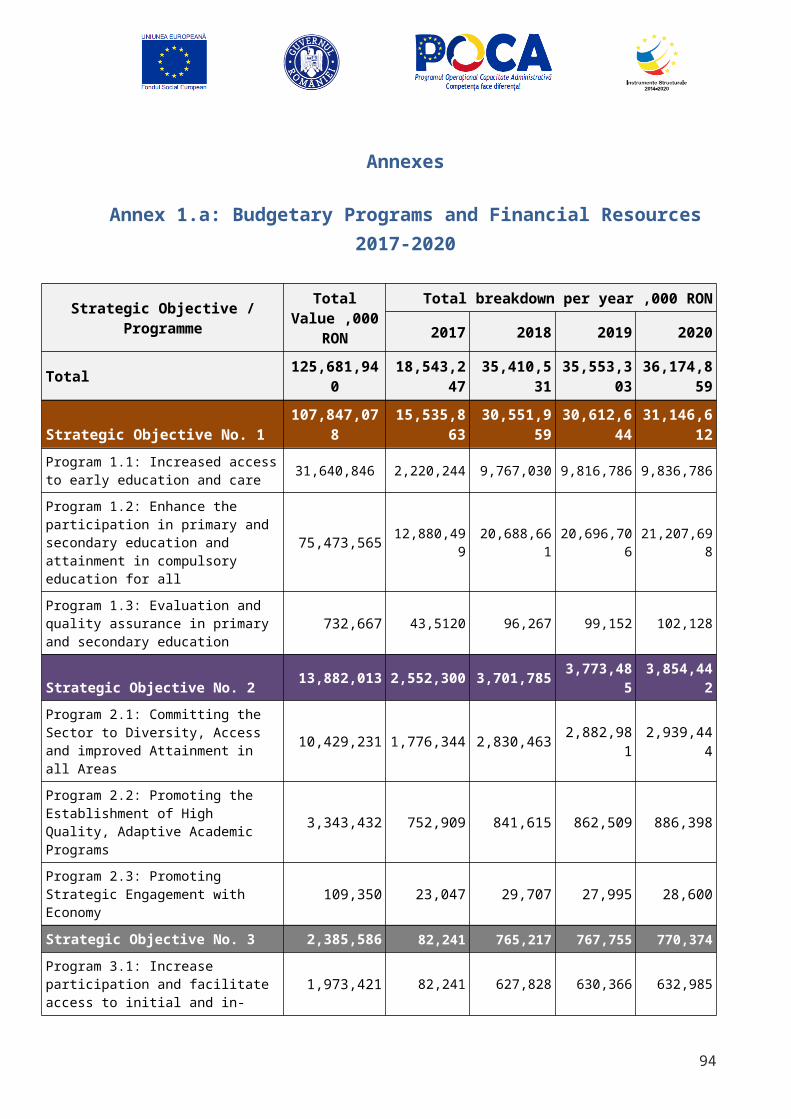
financing of universitiesNo.
-
Extend dual training at the level of technical tertiary education.This measure is intended to contribute to the development of a dual training and educational system, which could become an alternative educational route for persons who fail the baccalaureate exam and should have a chance at furthering their educational careers. As educational programs co-exist at the tertiary level in both university and non-university organizations, these could provide a strong basis for furthering access to education, especially in areas where educational attainment is low. This measure could be funded under the Human Capital Operational Program Priority Axis 6, Thematic Objective 10.
No of programsNo.tbd
10 12 15 20
Support merit-based access based on fee waiver for performing students; stipends for best performing students and complement the merit-based fee-waiver with a program of need-based grants program - social stipends - mostly at institutional level. This measure is aimed at providing financial support for wide access to higher education based on merit (according to different types of admissions set by the higher education institutions). On average, for the last years the state provided approximately 62.000 funded places for first year enrollments at Bachelor cycle and 35.000 for Masters programs This measure is financed thorough the state budget, namely the baseline funding for tertiary education, for both bachelor and masters programs.
Number of budgeted places each year
No.62.000
60.000 55.000 55.000 55.000
Complement the merit-based fee-waiver with a program of need-based grants program - social stipends - mostly at the institutional levelResearch shows that persons originating in disadvantaged social environments have significantly lower educational achievements then others, therefore, a merit-based stipend system for students has to be complemented through a need-based grant program to ensure constant participation in educational programs, even for those need-based persons who do not constantly achieve a high level of academic performance. This measure is funded through the base funding for tertiary education, as well as social assistance measures - social stipends. Affirmative actions through establishing a number of places in higher education institutions for Roma students should become more prominent. Also, the stipends should be awarded on need-basis, especially to low-income or disadvantaged students, rather than on merit basis.
New stipend award methodology
No.-
1 - - -
94
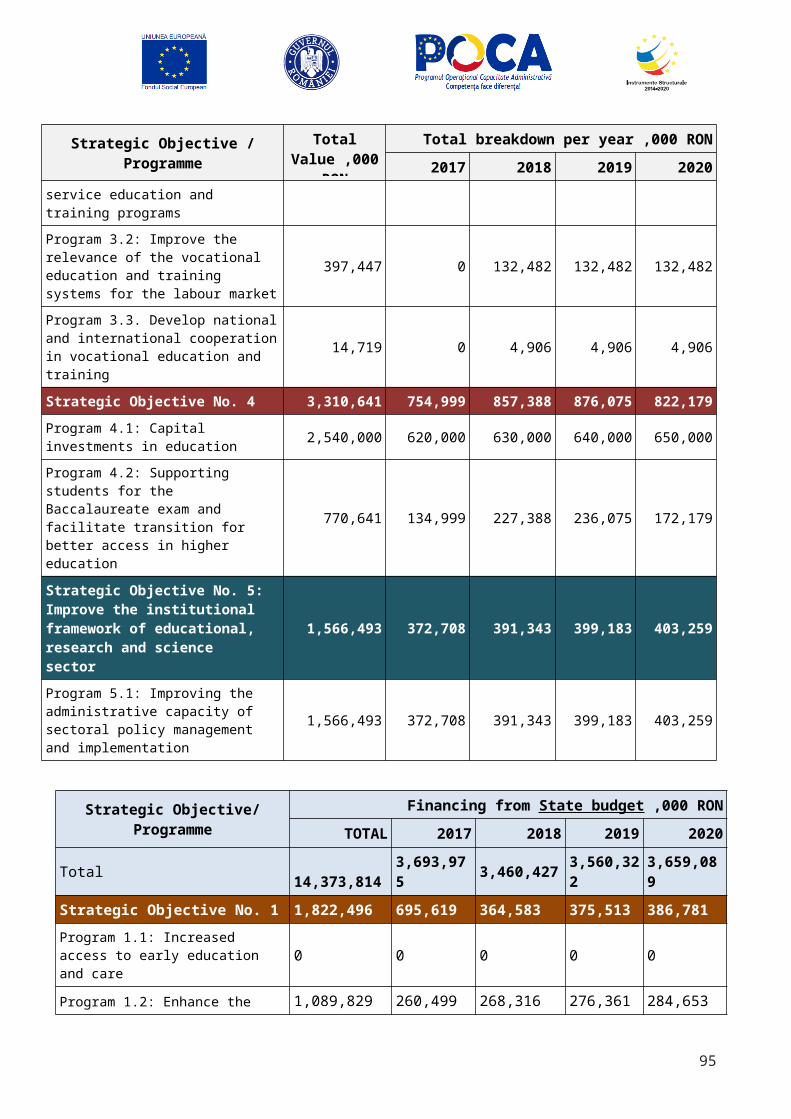
Wide social support measures - accommodation and board subsidies - complementary financing. This measure is intended to provide universities with enough resources to further develop their student services, namely accommodation and board, and thus support the participation in higher education as well as the national mobility of students and access for students coming from rural areas or cities that do not host higher education institutions. This measure is funded through the complementary financing of higher education, from the state budget.
Methodological framework for public financing of universities
No.-
1 - - -
No. of supported students
No.150000
150000 200000 220000 230000
Implement a student loan program (assuring financing as well as national regulation). Student loans have long been on the policy agenda, even before enactment of the Law on Education of 2011. However this program has not been operationalized due to banks’ reluctance to provide such financial support, mainly due to the state’s lack of official support of such loan schemes. As state sponsored loans are currently being used in other areas, such as the housing market, with success, a student loan with state guarantee – scheme could be implemented to support financial loans to students. Loans could also provide a binding legal contract for students who contract them to graduate in a reasonable time from the study program they are being enrolled in. Furthermore, parameters governing repayment of such loans, aimed at furthering particular social objectives; e.g., monthly payment levels capped at a % of income; partial loan forgiveness for students who choose careers within a pre-identified set of socially important but under-subscribed careers (such as rural teaching, rural health care, etc.) will be considered.
Government strategy on subsidizing student loan program
No.-
- 1 1 1
Encourage outreach to students from underrepresented groups and to nontraditional learners, including adults and Romanian ethnics from abroad. This measure is aimed at providing incentives through the basic funding methodology for universities to attract and enroll students coming from disadvantaged environments, nontraditional students and other underrepresented groups. The current methodology for allocating institutional funding to universities already uses one indicator pertaining to this measure, thus this measure could be developed further. This can be founded thorough the Baseline per capita institutional financing
participation rate for non-traditional students to tertiary education (corresponding to 25-29 age cohort that will become 30-34 cohort in 2020)
%
3.91 4.53 4.53 4.53
95
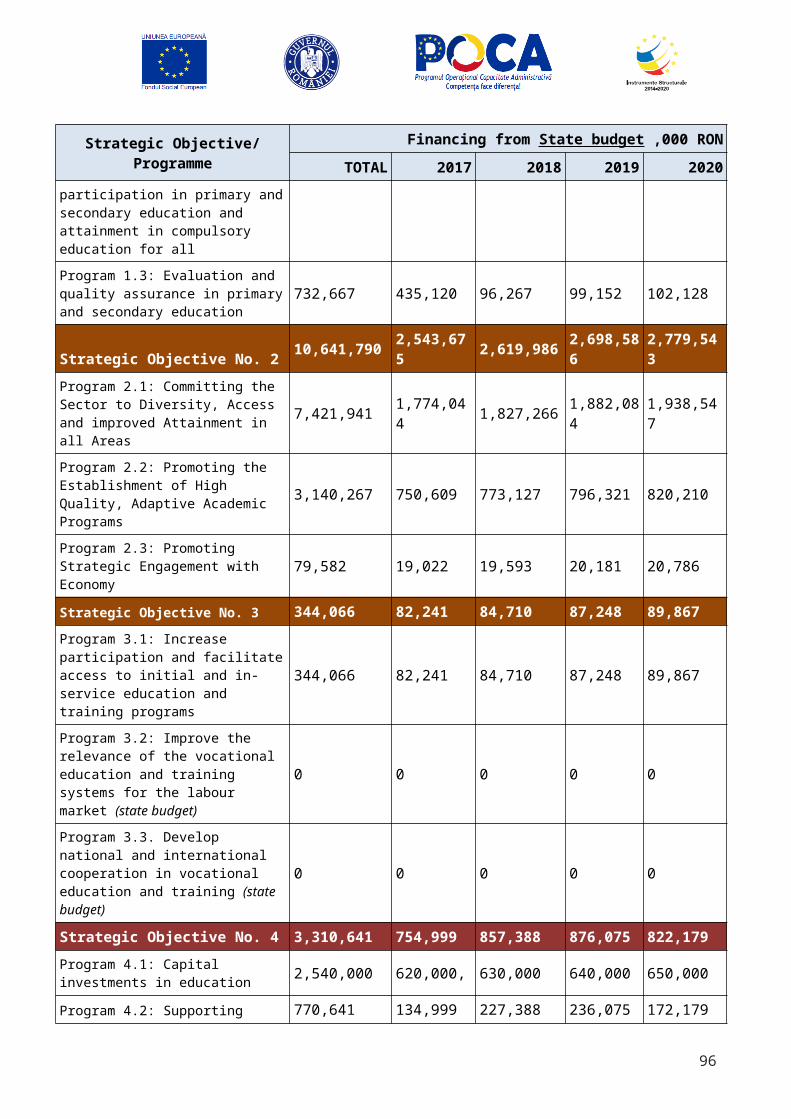
0
increased number for 1st year students from under-represented groups (from rural area, Roma students, with disabilities etc.
No0
3000 4500 4500 4500
Increase the transparency of information and provide guidance on educational opportunities and outcomes to inform study choices and reduce drop-out. This measure is intended to support current efforts of the ministry to provide open data access and information for the public, policy makers, potential beneficiaries of the educational system. This measure will include Quality Barometers, student tracer studies, Eurostudent and Eurograduate studies and will be financed through the Human Capital program, axis 6.
Public information platforms and access data to those based on independent audience audits
No.0
0 1 1 1
Program 2.2: Promoting the Establishment of High Quality, Adaptive Academic Programs
Revision of Ministry and ARACIS Rules Governing Accreditation of Programs. The methodology will be prepared according to the Yerevan Communication (2015, p. 2-3), and integrated with at least four objectives: a) strengthening the quality and relevance of learning and teaching; b) strengthening the employability of graduates throughout their entire work life; c) increasing the degree of inclusion of the national higher education systems; d) implementing the structural reforms agreed upon.The regulation and standardization of national higher education competencies and qualifications exists to promote the examination of the learning outcomes across comparable curricula, as delivered by different providers, for the purpose of increasing the predictability and the convergence of expectations between providers, beneficiaries, employers, with regard to the competences and the learning results achieved. Therefore, the aim of this activity will be to focus on mechanisms to increase the relevance of the curricula, respectively increasing the employability and the professional integration of university graduates, thus responding, to the expectations of citizens, graduates and their families, as well as the business environment.
Methodological frameworks for accreditation and quality external evaluation
No.0
1 0 0 0
96
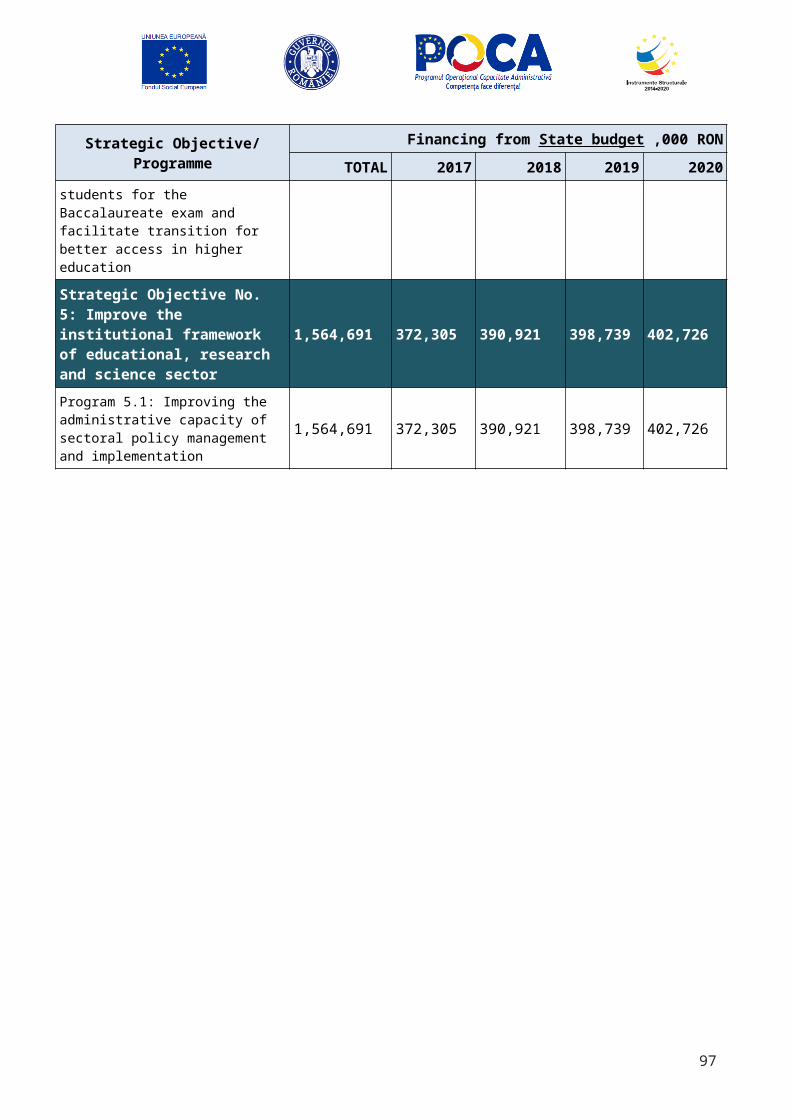
Ranking of study programs and supplementary funding based on excellenceAs the Law on National Education mentions in art. 216, the role of the state is to rank the study programs and to use the financial incentives in order to encourage and support quality. Therefore, it is important to invest public resources in the yearly evaluation of study programs and using the supplementary financing mechanism in order to orient resources where the highest levels of quality are present. The national evaluation for ranking purposes will be funded through the state budget and the Operational Programs on Human Capital and Administrative Capacity.
No of study programs ranked/
No.-
480 480 500 520
Supporting excellence through doctoral study grantsExcellence in higher education research is promoted through financing the third cycle of Bologna by priority in those fields and universities that are performing best. The doctoral studies should be financed primarily on a merit-basis, and they have the most impact when coordinated by the most respected institutions. The issue of plagiarism is even more serious as most of the cases of plagiarized university degrees that have been revealed by the media had been funded from public money. It is thus important to fund the doctoral studies at a level that would allow the most impact but at the same time it is crucial to grant the funding only to institutions that have the capacity to carry genuine doctoral programs.
No of doctoral grantsNo.
9.7669741 9700 9700 9700
Development of financial incentives to institutions judged to have developed new programs of exceptional promise in terms of developing transversal and entrepreneurial skills. Financial incentives will be provided to institutions to improve the integration of transversal and entrepreneurial skills into the curriculum. This measure has to be part of the national classification of universities and ranking of study programs, but it also must be adapted to each university’s particular mission (be it educationally focused or research focused). It will be funded through the Human capital Operational Program, through funds that can be accessed directly by the higher education institutions.
Methodological framework for public financing of universities
No.0
0 1 1 1
Program 2.3. Promoting Strategic Engagement with Economy
Development of a national research for innovation and entrepreneurship program, to encourage dialogue between the education and business sectors. The research agenda in Romania, while substantial, remains largely driven by academic curiosity rather than commercial considerations. Collectively, stakeholders in Romania’s economic development (e.g., education, research, business, etc.) must collaborate more effectively to align within a coordinated research and development agenda that builds upon existing strengths and addresses areas for improvement, especially as related to the coordinated development of the new Research
National strategy / subsequent policy initiatives
No.0
0 1 1 1
97
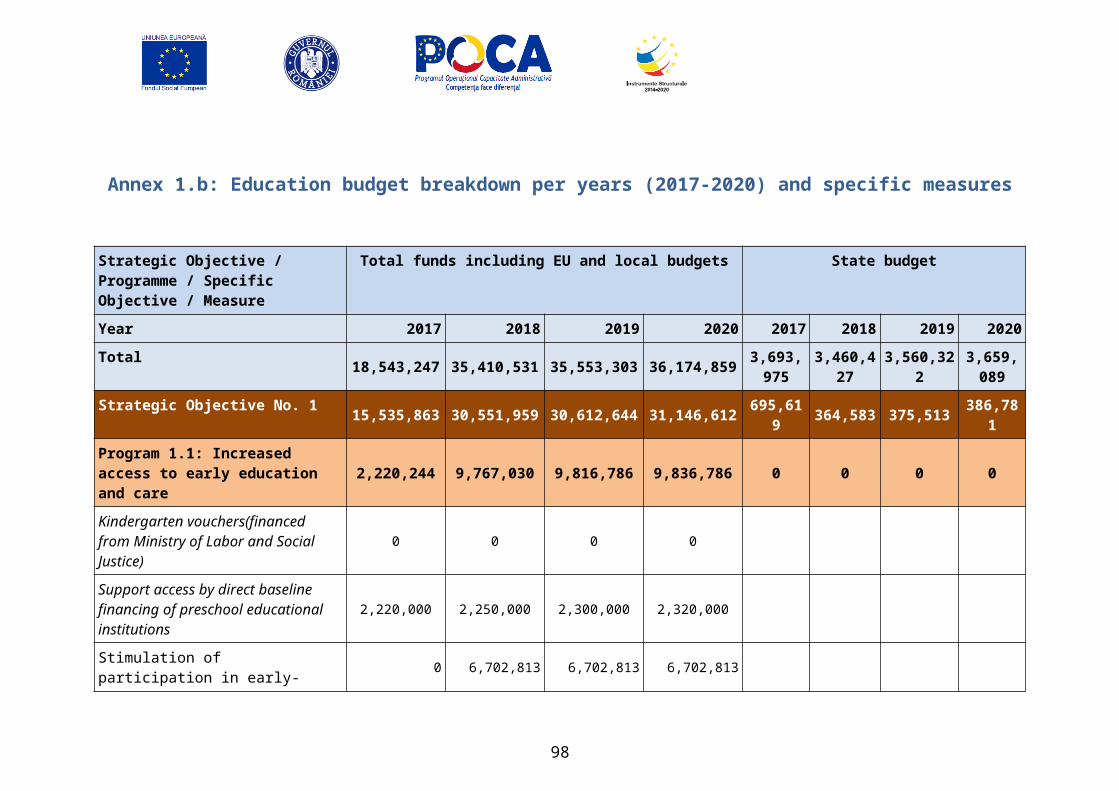
and Innovation Strategy (e.g., including for a framework of intellectual property ownership, commercialization process, etc.).
Curriculum redesign in order to focus on skills and competences that are required by the labor market. The Institutional Development Fund will be channeled to institutions and programs that demonstrate liaison with employers and employer associations in order to offer programs that include more relevant and better organized internships. The Institutional Development Fund, part of the institutional state financing of the universities, will be awarded to institutions based on a methodology that will reward curriculum redesign and adaption of the programs to the requirements of the labor market. It will be supported through the state institutional funding of higher education institutions.
No of revised study programs / newly introduced study programs
No.-
50 100 150 200
Establishment of Industry Liaison specialists at each institution; universities and other post-secondary institutions develop plans for outreach to community businesses. Most institutions already have an office with some kind of technology transfer or industry liaison function; however, in too many cases these are offices which spend time processing contracts rather than actually performing outreach. This measure will be funded through the Human capital operational program, axis 6.
No of position occupied within educational organizations
No.0
5 10 10 10
Development of a national labor market data framework. A survey of employers and tracer studies are to be developed and put into the field as soon as possible to better gauge performance in terms of providing students with employability skills and technology transfer. Ultimately, the goal will be to utilize this and related instruments within a fully realized labor market observatory, which will provide constant and up-to-date assessments and data on the employment environment and labor market.
No. of independent reports and quotes from data available.
No.0
0 1 1 1
Financial Support to ICT Programs. Another key strategic contribution on the part of the government of Romania will be improving the IT infrastructure behind the existing distance and blended learning efforts—in particular to permit greater and faster delivery of audio and video. This will make the programs significantly more attractive to learners but this should not occur prior to the revision of rules regarding distance education. As it currently stands, there is little point in improving infrastructure when there are so many regulations inhibiting the exploitation of e-learning resources at scale. This measure should also be coordinated with the efforts to change existing methodologies for accreditation and public financing of higher education. This measure will be funded through the Human capital operational program, axis 6.
Methodological framework for public financing of universities
No.0
0 1 1 1
98
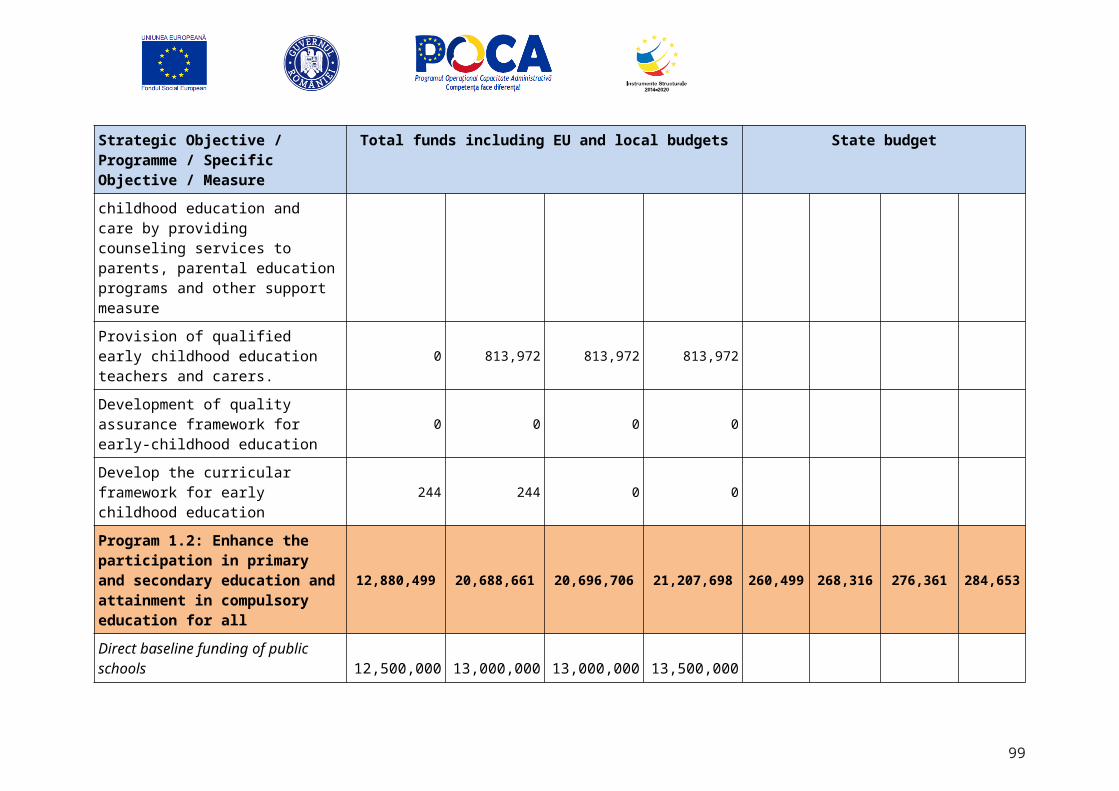
Program 3.1: Increase participation and facilitate access to initial and in-service education and training programs
99
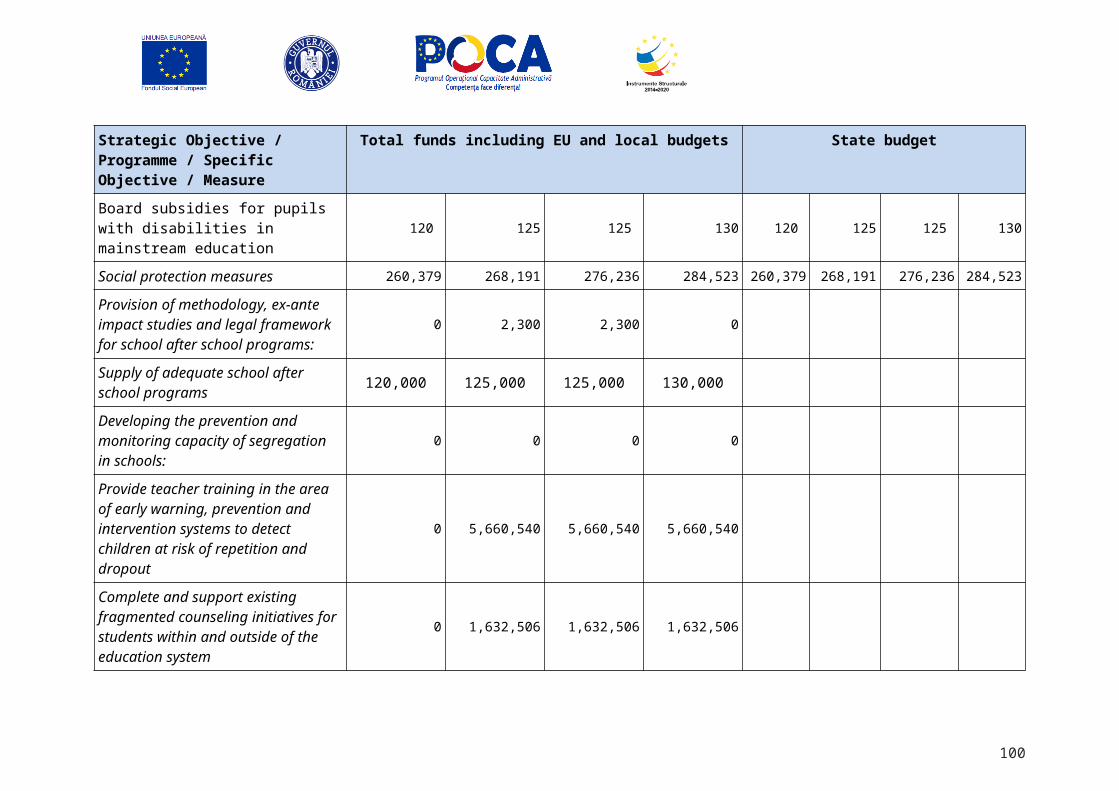
Develop and implement a strategy to promote and raise awareness of the benefits of career development, participation in initial and continuing vocational training, and recognition of non-formal and informal learning. Developing of a strategy to promote and raise awareness of the benefits of career development should be accompanied by a strategy and infrastructure to recognize the non-formal and informal learning acquirements. This measure will thus support the elaboration of a strategy that will present the benefits of career development and the opportunities for recognition of prior learning. Additionally, some measures should be designed to inform potential beneficiaries about the advantages of the evaluation and certification process, especially for those with a poorer qualification level, for whom skills evaluation and certification could become a real opportunity for improving their situation on the labour market.
No. of strategiesNo.
00 1 1 1
Campaigns to promote vocational training among students in the eighth grade of lower secondary education. This measure is intended to:a) develop and distribute information and promotion materials;
b) disseminate best practice and present career success examples of graduates from vocational training system.
Number of eigth grade students
No.-
25.000 30.000 30.000 30.000
Financing to Enhance Lifelong Learning Demand. This measure aims at supporting the participation in education and training of approximately 45,000 adults, early school leavers with low levels of qualifications to acquire basic or transversal skills; supporting the participation, in order to conclude 125,000 apprenticeship contracts for persons with low levels of qualifications providing financial incentives/subsidies for 100,000 employees with low levels of qualifications to acquire transversal skills
Number of low skilled employees and other adults participating in training for transversal skills with support of vouchers, subsidies
No / 0
100000 150000 150000 150000
Number of persons receiving subsidized apprenticeships contracts
No / 0
85000 125000 125000 125000
Develop coordination and cooperation between various national, regional and local stakeholders. This measure is coordinating various actors that provide career counselling and guidance in secondary and tertiary, non-university education. It will include institutions such as the County Educational Resource Centers /
Number of partnerships
no15 25 25 25
100
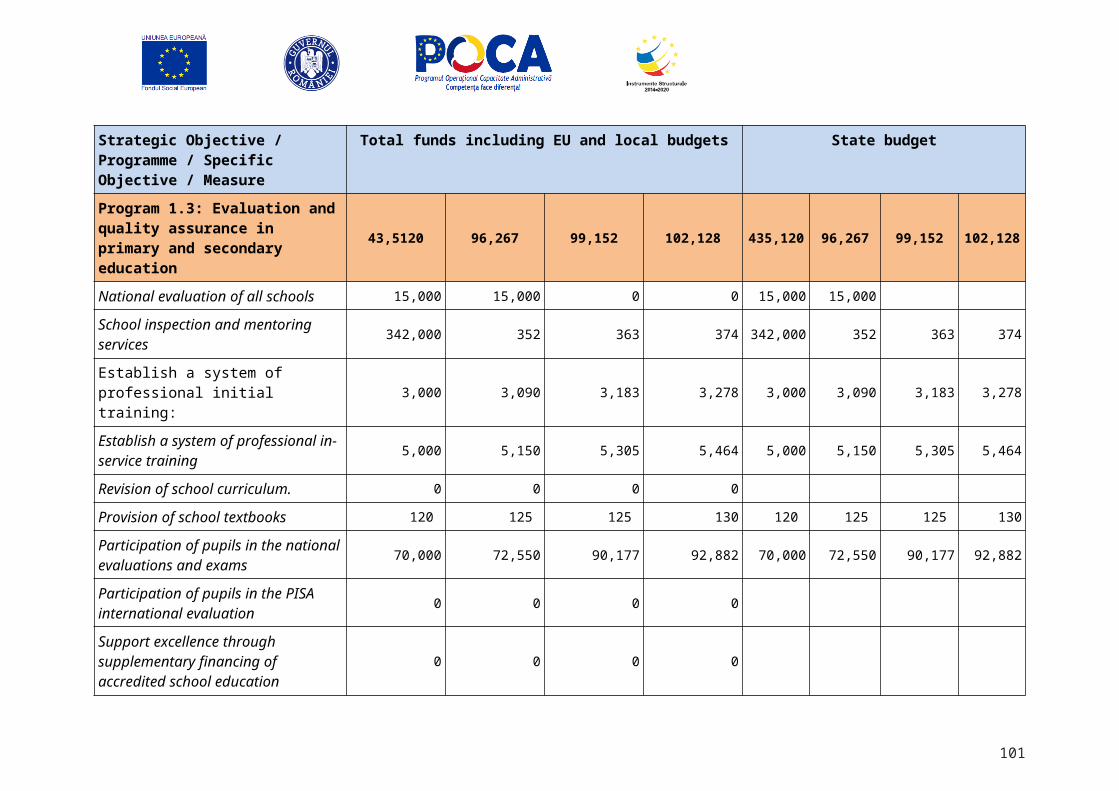
Bucharest Municipal Educational Resource Centers. Furthermore, the measure will aim at developing and extending the network of career information, counselling and guidance centers in urban and rural areas, in order to increase participation in initial and continuing vocational training, with a focus on disadvantaged groups
0
Provide training programmes for professionals with responsibilities in providing information, career counselling and guidance. Under this measure, professional training programs will be developed in order to train and professionalize a number of persons with responsibilities in providing career planning information, career counselling, as well as for the staff of the counselling centers, school counselors and class masters.
Number of participantsNo.
0750 1000 1000 1000
Provide financial incentives/subsidies for integrated counseling services for unemployed and inactive persons (these will cover screening services and career guidance) This measure is intended to direct counseling services for approximately 250,000 unemployed and inactive persons in order to determine the learning needs as well as to orient them professionally and become active in the labor market. This measure will be funded through Priority Axis 1, 2 and 3 of the Human capital Operational Program.
Number of unemployed or inactive people counseled
No.36.000
150.000 250.000 250.000 250.000
Provide financial incentives/subsidies to employers to recruit unemployed and inactive persons into apprenticeships, traineeships, or other forms of job placement. This measure is meant to facilitate the direct involvement of employers into offering professional training to persons that need to develop their competences in order to integrate on the labor market. It is meant to encourage the employers to provide training services in the mutual interest of the employer and the society and it constitutes of a financial incentive meant to pay the social benefits resulting from the employers' initiatives. This measure will be funded through Priority Axis 1, 2 and 3 of the Human capital Operational Program.
Number of employersNo.
-2000 2200 2300 2500
Revise the methodology for recognizing and certifying non-formal and informal learning. The recognition of non-formal and informal learning outcomes cannot be done unless there is a clear legal framework, mostly an operational methodology to provide the mechanisms and means to lead to the recognition and certification of learning outcomes. The development of the methodology, public consultation and refinement and adoption will be pursued by this measure.
Number of methodologies
No.0
0 1 1 1
Develop a network of centers for evaluation and certification of prior learning outcomesA well-established system for the recognition of prior learning is critical for the effective use of the National Qualifications' Framework (NQF). Romania needs to improve its model for recognition of prior learning. This measure intends to set of a network of centers for testing and certifying learning outcomes acquired in non-
Number of fully functional accredited centers assessing recognition of prior
35 35 35 35
101
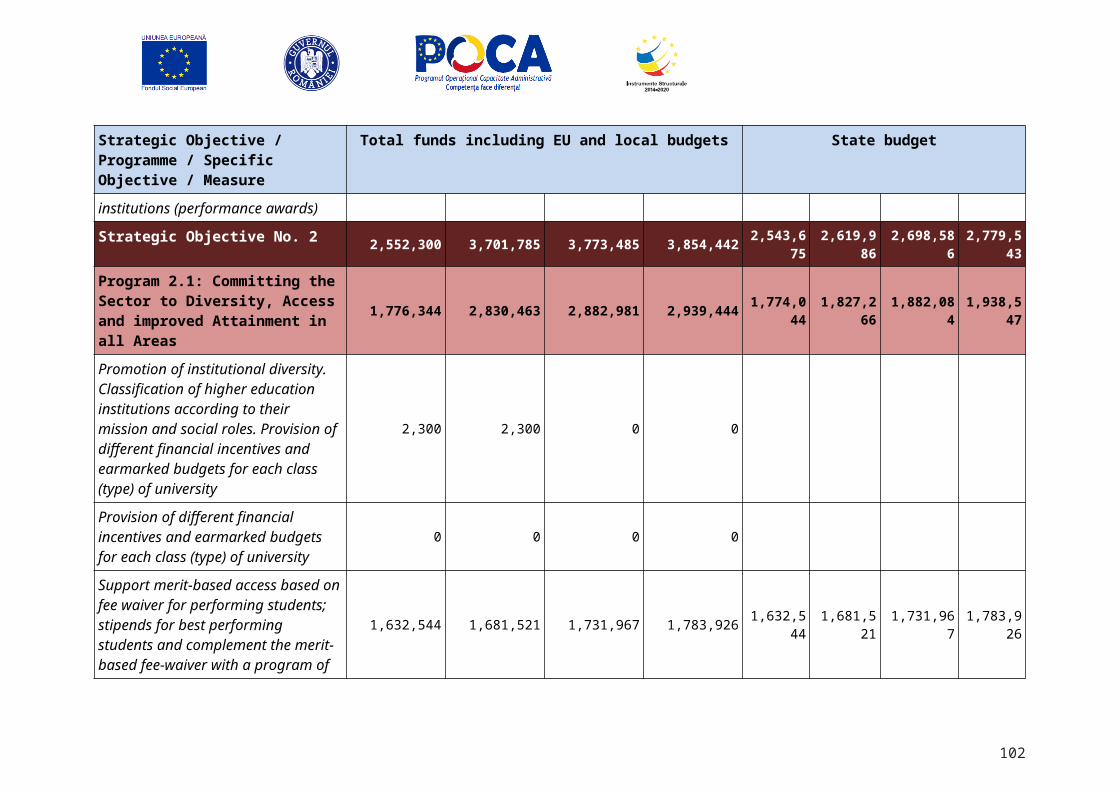
formal and informal settings. The administrative capacity of the existing evaluation centers must be improved for them to be able to recognize learning acquired in non-formal and informal contexts. The limited geographical coverage of these centers is a key barrier to an improved learning recognition structure. This measure intends to support approximately 210 evaluation centers and provide technical assistance to the National Agency for Qualifications (NAQ) to develop the mechanism for recognition, validation and certification of prior learning (3 stages: design, piloting, and implementation).
learning or competencies acquired
no62
Training staff responsible for recognizing and validating non-formal and informal learning. This measure will be applied following the adoption of the legal framework, in order to provide the human resources and thus the institutional capacity for the actual recognition process.
Number of staff trainedNo.
-750 1000 1000 1000
Support the participation to initial professional education and training by paying stipends to all students enrolled in this type of training (Bursa profesională - Professional scholarship). The measure has already been financed from the state budget as an incentive for youngsters' participation in professional education and training. The stipend (Bursa profesională) is paid on an universal basis, to all students, irrespective of their parents' incomes, but on the condition that the students do not miss a certain number of classes each month. It is a measure to directly foster the participation by increasing the opportunity cost of not attending the school.
Number of scholarshipsNo.
48.00055.000 61.000 61.000 61.000
Support accommodation and food for young persons from rural and disadvantaged areas, the Roma and disabled persons enrolled in vocational training in school campuses / vocational and technical schools. This measure is meant to offset the costs associated with school attendance for disadvantaged pupils in order to encourage them to participate on a wider basis and enhance access. The measure will be covered from the state budget by extending the actual provision of such services.
No of young personsNo.
-38.000 42.000 42.000 42.000
Program 3.2: Improve the relevance of the vocational education and training systems for the labour market
Development of occupational standards. This measure aims at regularly reviewing of the methodology for developing tools used for describing occupations and qualifications, irrespective of the training route, in terms of initial and continuing vocational training learning outcomes. It also aims at making the national Qualifications Register operational and at developing a mechanism for correlating qualifications received in the country and abroad. Number of revised standards will be the main output indicator.
Number of Romanian occupations correlated with EQF
No.0
250 350 350 350
Development of training curricula and materials . This measure aims to develop/revise the fundamentals of Number of curricula 1500 2000 2000 2000
102
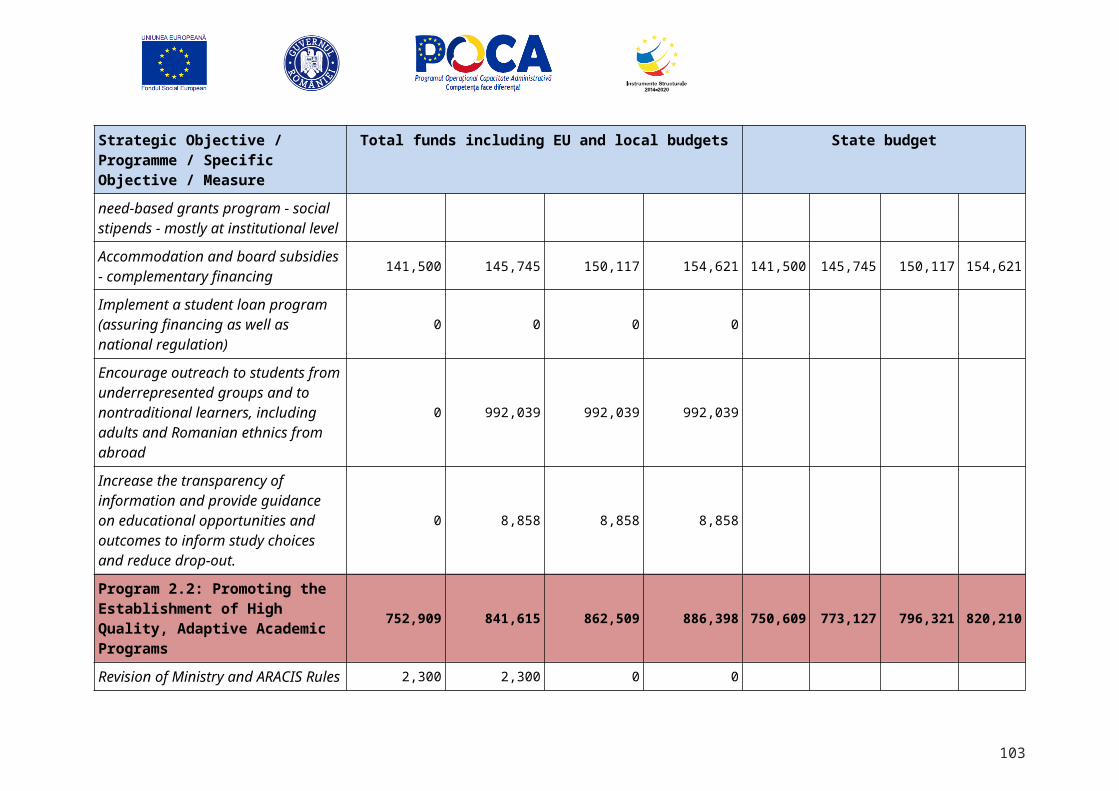
the current vocational education and training curriculum: qualifications, vocational training standards, schooling plans, syllabuses, curriculum auxiliaries, in terms of their relevance for the labour market, primarily for the green economy and develop national priority sectors. It will be measured in number of vocational training standards, curriculum documents, as well as teaching/learning materials.
No.-
Carry out regular studies and research. A number of forecast/predictive studies and research will be carried out for an early assessment of the labour market needs for qualification and competence, and determine short and medium term trends. This is required in order to plan and develop educational offerings that address the competences required by the labor market. Additionally, documents for planning vocational education and training needs at national, regional and local levels will be developed, revised and implemented.
Number of studiesNo.
-
1 2 2 2
Create a national mechanism for monitoring the professional insertion of the VET system graduates. Create and make operational online tools for a large scale national survey, built up of several modules and with the possibilities of recording large numbers of answers, in order to monitor effectively at a national level and be able to draw-up a national database with large enough data to allow for comparisons and benchmarks.
Number of mechanismsNo.
-
- 1 1 1
Develop a mechanism for quality assurance in work-based-learning. Work-based-learning value in facilitating youth employment is strongly acknowledged. The number of learners in VET programs with a significant component of WBL is constantly increasing. Quality assurance of WBL is crucial for the success of these programs. This implies a clear regulatory framework, defined and assumed quality standards with roles and responsibilities for the different players.
Number of mechanismsNo.
-
- 1 1 1
Develop a mechanism for quality assurance of continuous VET. Development and implementation of sound mechanisms for quality assuring the VET provisions are essential for consolidating trust in qualifications at national and European levels. Aiming to address this challenge, a Quality Assurance Framework for initial VET has been developed and is fully implemented at the national level, in all IVET schools, starting with the 2006-2007 school year. However, in continuous VET, the different initiatives in the area of quality assurance have not led to the elaboration of a coherent approach at a system level. Therefore, it is important to develop a mechanism for quality assurance of continuous VET, including a combination of self-assessment and external evaluation that would make CVET relevant and effective.
Number of mechanismsNo.
-
- 1 1 1
Develop a mechanism for the certification of learning outcomes in initial and continuing vocational education and training (VET). In order to develop trust in the qualifications provided in the VET system, validity, reliability and impartiality of the certification processes have to be ensured. This measure intends to
Number of mechanismsNo.
-
- 1 1 1
103
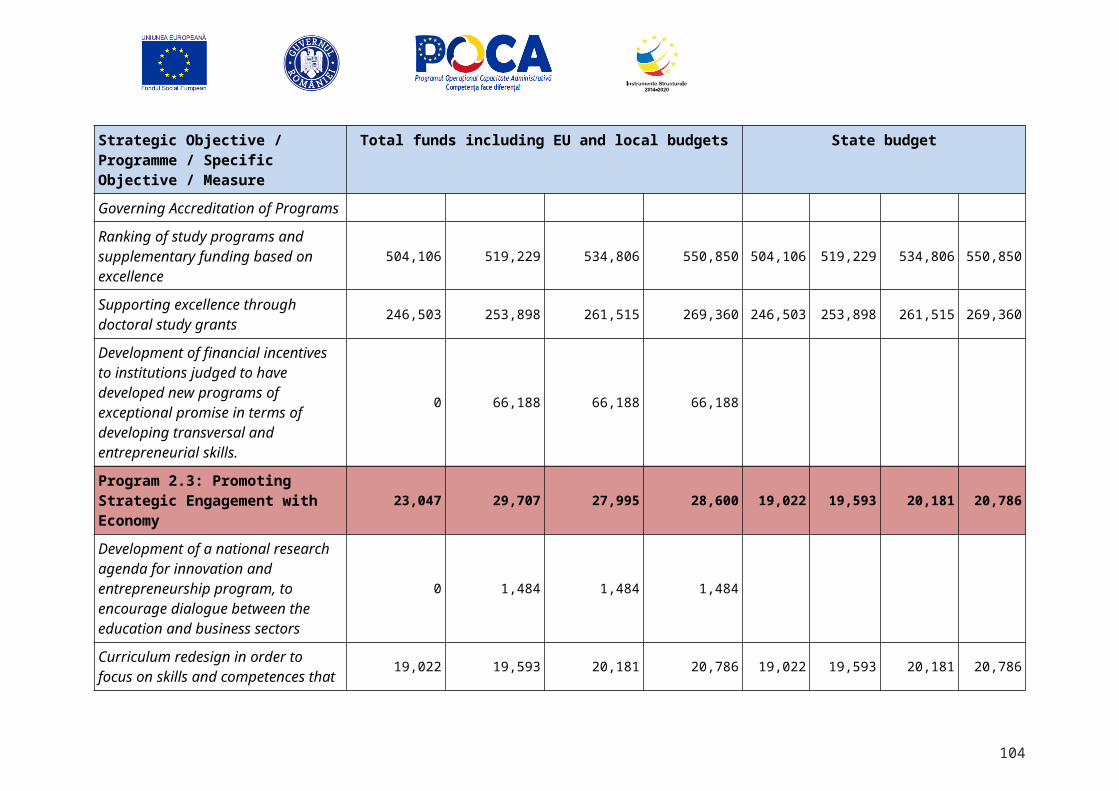
develop and implement a mechanism for the certification of learning outcomes in initial and continuing vocational education and training (VET), with a wide and active participation of employers.
Develop mechanisms for quality assurance in the recognition and validation of non-formal and informal learning. The current legal framework for quality assurance in education and training should be revised in order to include mechanisms for quality assurance in the recognition and validation of non-formal and informal learning and thus make the recognition effective.
Number of mechanismsNo.
-
- 1 1 1
Establish and develop a national center for continuous training of teachers, trainers, external evaluators and tutors. This measure is intended to build the capacity for teacher training in vocational education and training (VET) and lifelong learning (LLL) by establishing a national center for continuous professional development of teachers and trainers delivering VET and LLL programs. The center will also address tutors from employers providing initial vocational training, capable to ensure coherent and consistent development of the competences of individuals with responsibilities in the provision of vocational training. The center will establish standards and curricula for teacher training.
Number of centersNo.
-
-1 1 1 1
Develop and provide continuous training programmes for trainers and teachers. The measure is intended to develop a number of training programs for trainers and teachers aiming at: (1) correlating occupational standards / vocational training standards / curriculum, (2) developing vocational competences through on-the-job training, (3) enhancing inter-institutional cooperation between vocational training providers and partnerships with employers, especially for evaluation of learning outcomes acquired in non-formal and informal learning contexts. A number of programs will be developed and a number of trainers and teachers will be trained.
Number of teachers, trainers and external evaluators included in training programmes
No.-
3500 5000 5000 5000
Establishing of Community Permanent Learning Centers (CPLC) to implement LLL initiatives at the community level. The existing legal framework also includes requirements for the establishment of Community Permanent Learning Centers to implement LLL initiatives at the community level. These centers should be established by the local authorities in partnership with education and training providers, and should be key LLL providers for local communities. This measure intends to create 36 CPLCs in a pilot phase (provide grants to cover provisions of personnel and operating costs, campaigns to promote services, local partners, training activities for personnel and local community beneficiaries). Furthermore, starting from 2018, following the pilot phase, the aims is to create 219 CPLCs in the national phase. The measure will be supported from the Human Capital Operational program, axis 6.
Number of CPLCNo0
20 30 30 30
104
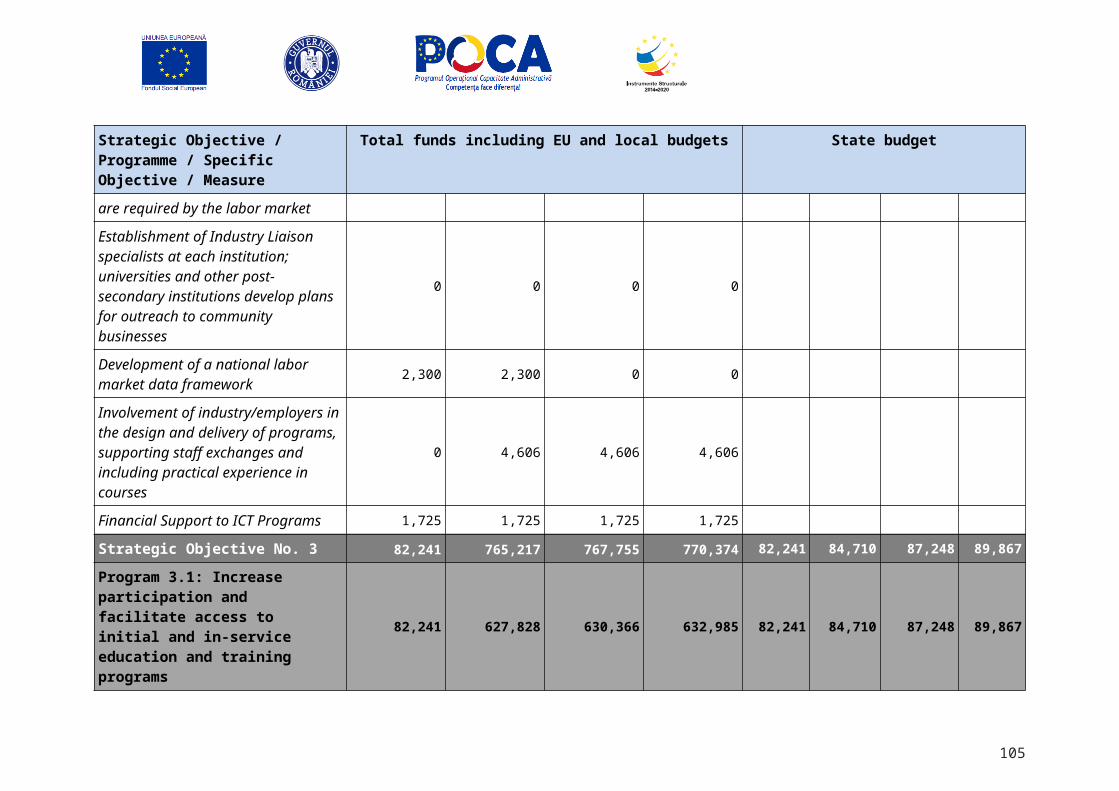
Develop mechanisms for financing public-private and sector cooperation/partnership structures in vocational training. Mechanisms, including legal framework, procedures and facilities for financing public-private sector cooperation in delivering vocational training programs will be elaborated, including, but not limited to Sector Committees, Regional Consortia, Local Committees for Development of Social Partnership. This will create the legal framework and conditions for financing VET and LLL, including provisions for the dual training system.
Number of legal framework
No.-
- 1 1 1
Program 3.3. Develop national and international cooperation in vocational education and training
Extending the learning methods that develop entrepreneurial competences. This measure aims at financing the organization of business plans contests within the training programs, also the organization and participation in national and international fairs for pilot/mock firms in order to test the competitiveness of the solutions/plans developed.
Number of mock companies
No.-
700 1000 1000 1000
Extending mutual learning and best practice exchanges. This measure aims at setting a regional cooperation network in order to exchange good practices in vocational education and training; it will be addressed to program developers, trainers, teachers and tutors and will be supported by an online platform and by assistance for trainers' mobilities.
Number of cooperation networks
No.-
23 23 25 28
Supporting participation in European mobility programs. This measure aims at providing access, by facilitating information, to ERASMUS+ mobility programs, financed through EU-Erasmus+ program, for 25,000 adults (university and pre-university staff, principals, counselors, trainers, inspectors, youth workers etc.). Also, the measure intends to provide access to other mobility programs to acquire practical/technical skills for 38,000 students
Number of students participating in mobility programs
No2800
3800 4600 4600 4600
Program 4.1: Capital investments in education
Program 4.2: Supporting students for the Baccalaureate exam and facilitate transition for better access in higher education
School-based Interventions supporting the transition of students from upper secondary into tertiary education using a decentralized approach based on non-competitive grants to low performing public high schools. This would allow approximately 80 percent of Romanian public high schools (1,154) to benefit from
Percentage of high schools benefiting from
0 20 20 20
105
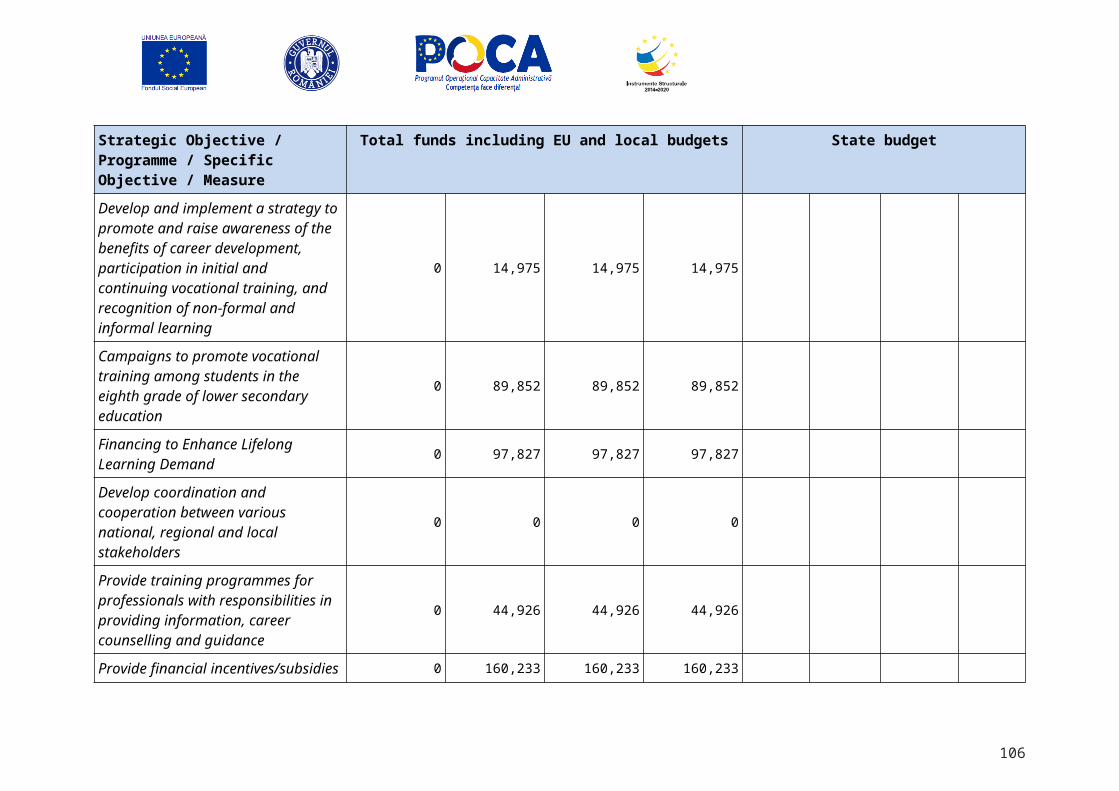
this measure. The estimated average size of the grant to be allocated to each public high school is EUR 100,000, with larger grants going to public high schools in greater need. The Grants will be awarded for 4 years to enable the implementation of activities that are aimed at supporting 9th to 12th grade students (or other final years, respectively).
the project grants%0
Systemic interventions. Upper Secondary Education Curriculum. This measure will finance technical assistance for the Institute of Education Sciences (IES) to revise the curriculum for upper secondary education from a subject-based to a competence-based model, including the revision of more than 350 study programs of grades 9 to 12 in all three tracks. This process will be conducted in alignment with ongoing curricular revisions for grades 1-8, which are financed separately using the State budget and ESIF. The curriculum revision under the Project would start in the first year of the project implementation, with revision of one grade per year in a way that by the end of the 4th year, the activity would be completed.
No of curricula revisedNo-
250 350 350 350
Professional Development for Teachers and School Directors. This measure will support training and professional development programs for teachers and public school directors throughout all high schools in Romania. These programs will focus on two areas: (i) pedagogical techniques aligned with the revised curricula, and (ii) inclusive education. Teachers and school directors will be trained on the revised curriculum in addition to pedagogical practices that are aligned with a competence-based approach.
No. of teachers Houses equipped with training facilities
No.0
0 42 42 42
Revisions to Student Assessments. This measure will support the revision and modernization of these two assessments as well as training for relevant MESR staff on item response theory and testing methodology. It would also finance the purchase of hardware and software to improve the capacity of the National Center for Assessment and Examination, which is responsible for students’ assessment in Romania.
No of exam softwareNo-
5 7 7 8
Grade 10 Learning Assessment. This measure will also support the development and two administrations of a nationwide, sample-based, low stakes learning assessment of students in Grade 10, following the completion of compulsory education. The only national test available for students after Grade 8 is the Baccalaureate, which is not mandatory and is an entry exam to tertiary education. This non-exam assessment in Grade 10 would allow the MESR to monitor learning progress at the system level. The tests financed by the Project would be conducted in the 2019 and 2021, as a pilot initiative.
No of students evaluated
No-
10.000 11.000 12.000 13.000
106
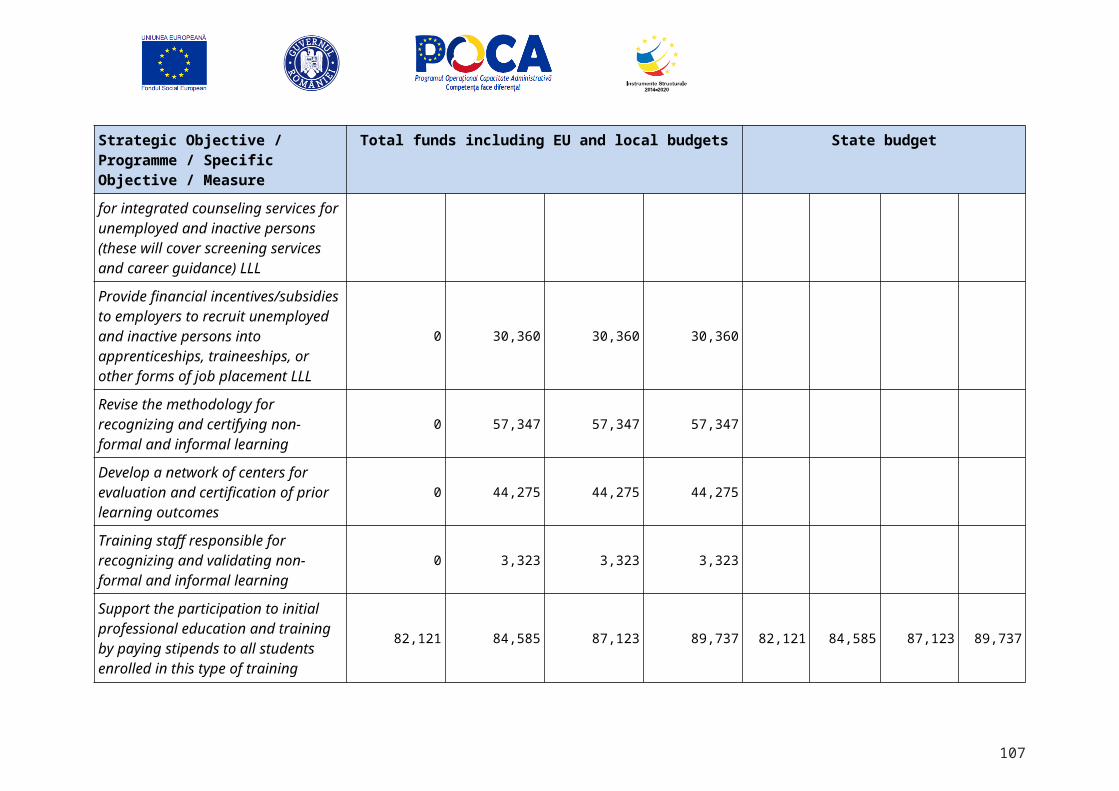
Information Campaigns to Increase the Awareness of Students and Teachers. Low motivation among both students and teachers has been identified as a major constraint to education quality and student achievement, especially in low-performing high schools. This measure will support large-scale information campaigns aimed at raising the awareness of students and teachers for schooling at the upper secondary level.
No of campaignsNo-
50 65 75 85
MESR’s Capacity to Monitor Upper Secondary Education. The MESR has taken action to improve its Education Management Information System (EMIS), as well as on fostering the timely provision of data. This measure will support technical assistance on the utilization of information produced by the EMIS with a focus on monitoring the transition of students from disadvantaged groups from upper secondary into tertiary education.
No of tools (EMIS)No-
1 - - -
University-level interventions and bridge programs aims at students at risk of dropping out of faculties in the first year of study Non-competitive grants aim at encouraging eligible public faculties to implement remedial programs, tutoring, counseling, guidance and support services, coaching services, workshops in specific areas, and awareness raising campaigns targeted to at-risk student to achieve the above-mentioned objectives
Number of faculties benefiting of grants for students at risk
No. / No.00
00
7524
7524
7524
Summer bridge programs competitive grant scheme aim at supporting tertiary-level summer activities, such as, but not limited to campus-based courses, for public high school students, with a special focus on students at-risk/coming from disadvantaged groups.
No of programsNo0
120 320 320 320
Learning centers –competitive grant scheme aim at increasing the academic and social support mechanisms available to at-risk students. Each learning center would be designed based on the main factors contributing to student under-achievement and dropout from the earliest years of university, including under-preparation in upper secondary education, underdeveloped study skills, limited exposure to new academic subjects, and lack of familiarity with pedagogical norms (class size, duration, homework levels, and the like) at the university level.
Number of universities benefiting of learning centers
No0
0 24 24 24
Program 5.1. Improved administrative capacity for sectoral policy management and implementation in education, research and science
Outcome 5.1.1. Improving the structural and functional stability of MNE and its subordinated institutions
107
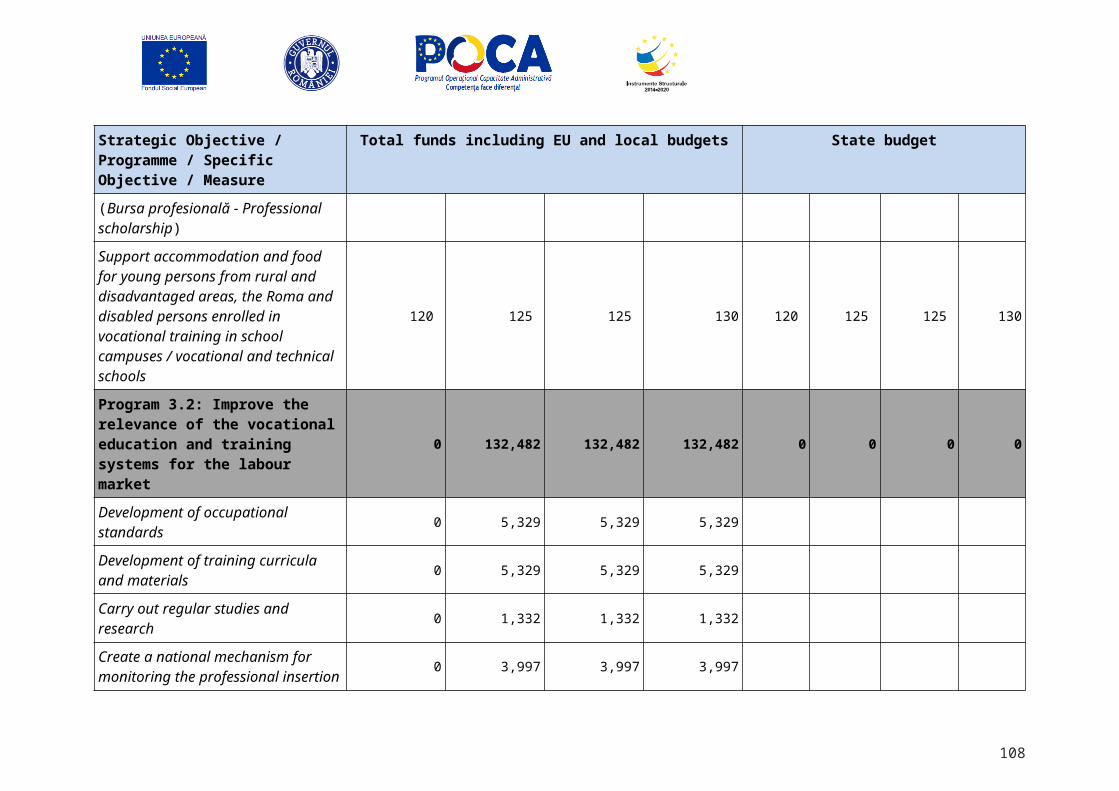
... Institutional modernization; Increase in effectiveness; Improvement of institutional processes and procedures
Revision of organizational responsibilities and the accompanying procedures, to allow for a better strategy formulation and a smooth implementation of the ISP: the measure aims to ensure that clear leadership in ES policy formulation is established (with contributions from technical departments) and that all the supporting planning, budgeting, monitoring and evaluation processes and procedures are in place. For this, the structure, functions and responsibilities within MNE will be consolidated, and adequately reflected in the Regulation for Organization and Functioning (ROF). The intention is that all the planning and budgetary procedures, as well as the monitoring and evaluation procedures, are implemented according to the approved methodology (100% implemented at a proper quality level), during the strategic plan implementation period. The measure is financed from the State budget, through the administrative budget of MNE, continuously, for the entire 2017-20 period and has no specific resource allocation (it is a support measure).
Organizational chart and ROF amendedD /NN
- Y Y Y
Developing ICT infrastructure. The measure is meant to ensure the automation (computerization) of institutional processes and procedures for the integrated management of MNE resources, for the integrated management of documents, workflows, information and relations with the public policy beneficiaries, with citizens and collaborating institutions, for the integrated management of statistical information and reports and maintenance of National Education Database and for de development of Human Resources Management Information System (HRMIS). The measure targets the ministry, its subordinated institutions and their staff, who will use informational technologies in their day-to-day activities.
computerized processes and procedures at the ministry level
% /1%employees using IT systems
%/ 5%allocated funds paid via the integrated IT system
% / 90%
2%
10%
95%
10%
50%
99%
10%
50%
99%
10%
50%
99%
... Strategic planning and financial management
Performance assessment system for the ES and administration: such a platform will be aligned with the strategic goals for the sector and fully embedded in the MNE’s strategic planning and monitoring process. Furthermore, it will be integrated into the holistic ES information system. The performance assessment framework will be introduced to accommodate the need to effectively monitor the ISP implementation and to inform future policy making. It will be seamlessly integrated with the mandatory Common Monitoring and
No of user hitsNo.-
5000 5000 5000 5000
108
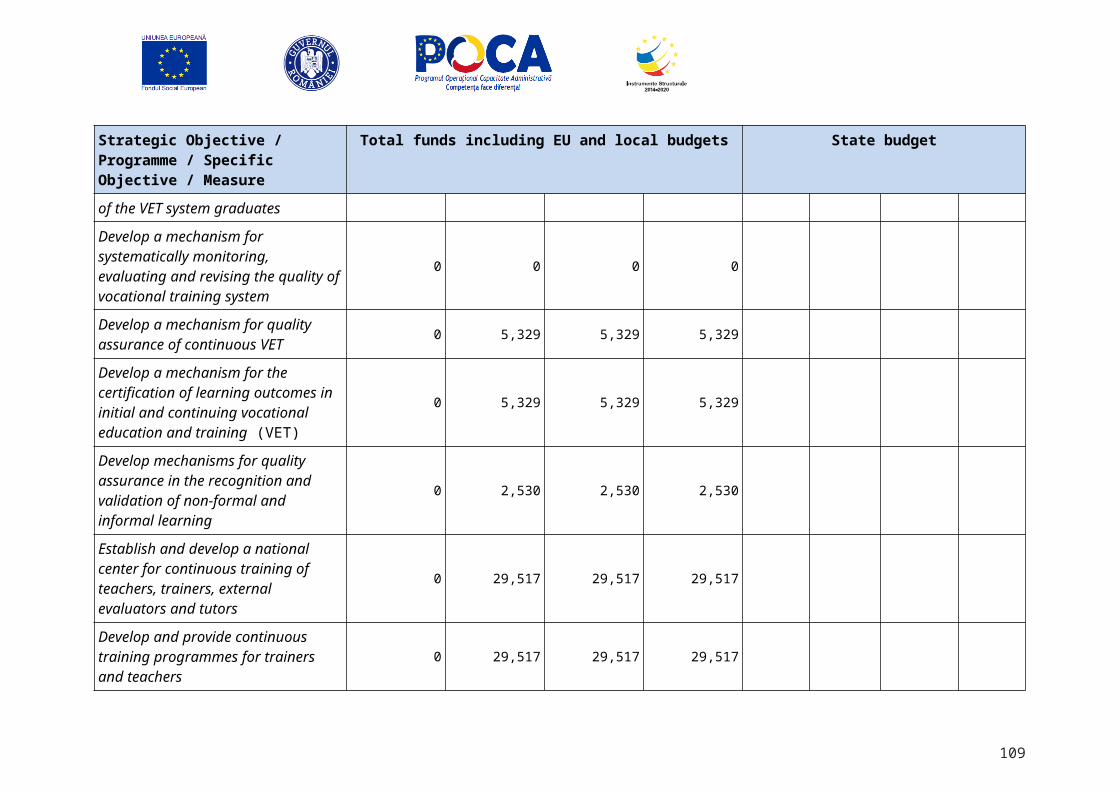
Evaluation Framework (CMEF) for EU Programmes. Operationalization will be pursued throughout the ISP period (and beyond) and will be financed from national budget resources. Given integration with the CMEF, (some of) the evaluation activities can be funded from the EAFRD, ESF the Technical assistance component
Development of annual and multi-annual budget Programs for the full use of internal and external funds allocated: the measure is meant to strengthen budgetary discipline, especially as regards the identification of the ES administration needs, the programming of internal (national) and external (EU) budgetary resources and the budgetary execution by Program. The ministry will improve its Program budgeting process during the 2017-20 period, in order to be able to monitor, in this manner, the internal and subordinated structures’ performance relative to the degree of complying with the annual budgetary programming. The measure is financed from the State budget, through the administrative budget of MNE, continuously, for the entire period and has no specific resource allocation (it is a support measure).
%(degree of) compliance with the annual budgetary programming%100%
100% 100% 100% 100%
... Human resources management
Improvement of the human resources management and adaptation to the organization; specialized staff selected, employed and maintained in the organization, according to the real needs of the ministry: the measure targets a critical component of the public administration in general, i.e. the specialized staff, who have to be selected, employed and maintained within the organization according to the ministry’s actual needs. In this context, it will be critical to close existing staff specialization needs, such as educational managers, economists and ICT specialists in MNE. This measure is meant to improve staff structure, as well as processes such as staff recruitment and employment, task assignment to specialized staff, staff motivation, in order to reduce staff turnover within the ES administration to (15) % in 2020 and to determine a (90) % employment degree relative to the list of posts, within the same period of time. The measure is financed from the State budget, through the administrative budget of MNE, continuously, for the entire 2017-20 period, and has no specific resource allocation (it is a support measure).
staff turnover within the ministry% / 30%of employment relative to the list of posts% / 70%
25%
80%
15%
90%
15%
90%
15%
90%
Vocational training, learning and expertise of the ministry’s specialized staff: the measure targets the qualitative development and the improvement of the professional and technical skills of the ES administration staff. The measure beneficiaries are the ES administration staff, who, by their participation and certification in training and specialization Programs, according to the identified needs and the recommendations established in the annual evaluation process and included in the Annual Training Plan at the organization level, will determine the training degree through specialized courses. The measure is financed from the State budget and
achieving the annual training plan at the organization level% / 100%
staff certified by
100%
16%
100%
22%
100%
22%
100%
22%
109
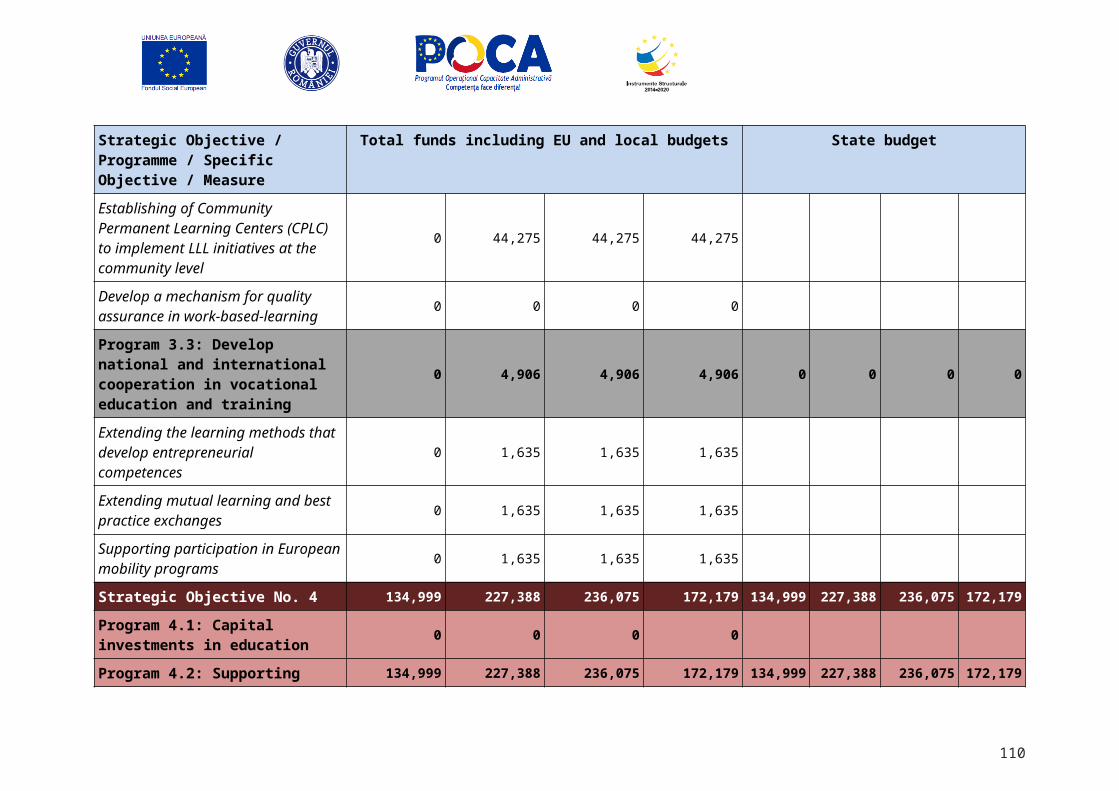
budgetary funds amounting to RON (3,236,000) are provided for the entire 2017-20 period.
training and specialization programs of the total specialized staff% / 12%
... Transparency and free access to public information
Transparency in the decision-making process and the formulation of public policies and legal framework: the measure targets the implementation and reporting compliant with the legal procedures of the ES administration’s activity, with regard to the free access to information of public interest – Law 544/2001, as updated and Law 52/2003 on the decisional transparency. Transparency is one of the declared values of MNE, that supports its activity within the public policies development and implementation and that will be applied and ensured unconditionally within the implementation of the ISP, so as to obtain the maximum degree of compliance (100% compliance for all the actions that require the implementation of Law 544/2001 and Law 52/2003) with legal procedures, as well as public information, through the complete publication of the reports required by law. The measure is financed from the State budget, through the operational budget of MNE, continuously, for the entire 2017-20 period and has no specific resource allocation (it is a support measure).
consistency with legal procedures (number of inconsistencies)% / 100%
Reports published according to Law 544/2001 No / 1
Reports published on Law 52/2003No / 1
Average turnaround time to respond to Days / tbd
Freedom of Information requestsNo / year / tbd
Visits to MNE sector and policy evaluation
100%
1
1
10
50
500
100%
1
1
10
50
500
100%
1
1
8
50
500
100%
1
1
5
50
500
110
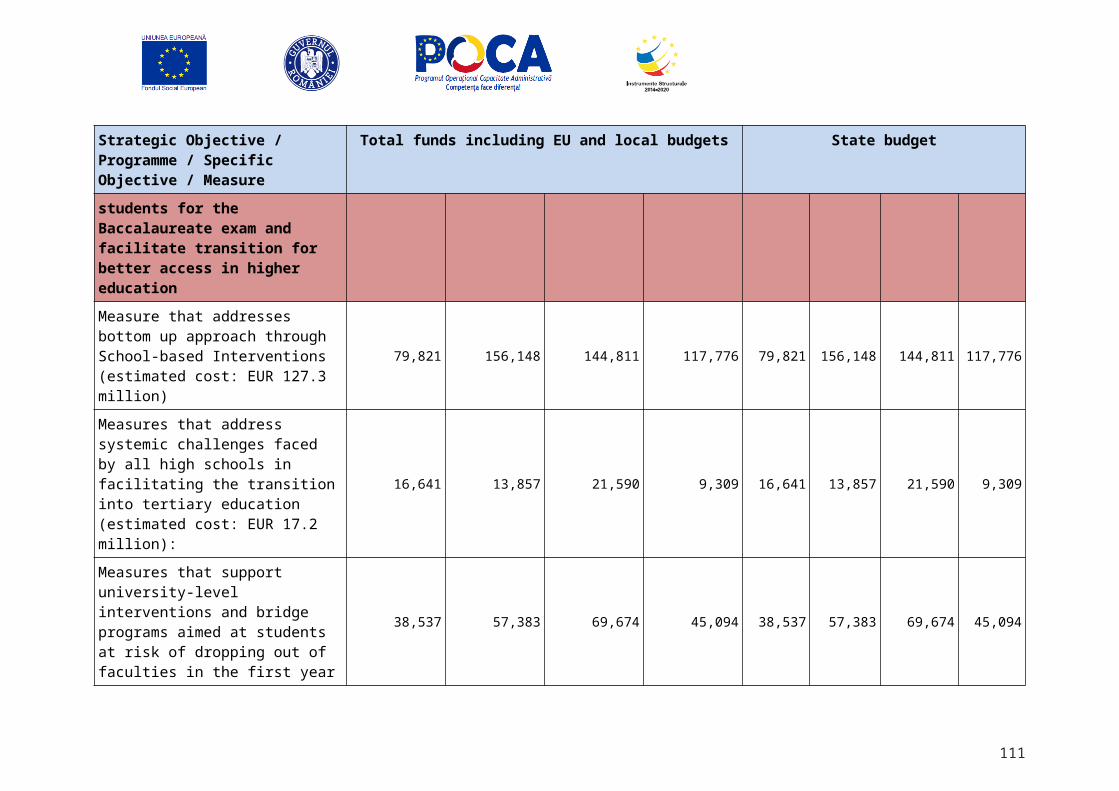
reports (online)Tbd
Informing students, teachers, researchers and public policy beneficiaries about the Programs dedicated to the ES: the measure supports the ISP implementation process and the fulfillment of its indicators, as well as the success of ES Programs which depend on the transfer of accurate information, without any limitations and regularly, to farmers and public policy beneficiaries. The ministry and its subordinate structures will prepare the information in accordance with the educational, research and science sector Programs and will provide it to the public through communication instruments and methods, on a scheduled basis. The measure is financed from the State budget, through the administrative budget of MNE, continuously, for the entire 2017-20 period and has no specific resource allocation (it is a support measure).
Number of events and information campaigns conducted No.10
12 12 12 12
Outcome 5.1.2. Increased effectiveness of ES policy formulation and implementation
... Public policies development and communication with interested parties
Operationalization of ES public policy impact analyses and policy making feedback loops: the measure targets the qualitative content of the drafting of public policy documents and their impact analyses in the ES. Impact analysis will expand to the non-ESF funded measures and include all programs and measures presented in the ISP. The measure regards the specialized staff of MNE and all the stakeholders involved in the formulation of public policy documents and impact analyses in ES (other public institutions, professional associations, non-governmental organizations, teachers, students, researchers), so as to ensure that the formulation of public policy documents and impact analyses totally comply (100% in terms of quality) with the ministry’s approved procedure and international good evaluation practice, throughout the ISP implementation period 2017-20. The measure is financed from the State budget, through the administrative budget of MNE, continuously, and has no specific resource allocation (it is a support measure).
% public policies documents in line with the ministry’s approved procedure%100%
100% 100% 100% 100%
Consultation with citizens and the stakeholders involved in the ES, for the formulation and promotion of public policies: the measure targets the support of consultative processes in administration, in general, and particularly of those with regard to the public policies in the ES. The beneficiaries of public policy documents are students and teachers, researchers, parents and the impact of public policies should be disclosed to the public, for consultation and promotion purposes. MNE will continue (2017-20) to support the public policy consultation and promotion process between the ministry’s specialists and the stakeholders, so that all consultations (100%) comply with the ministry’s approved procedure. The measure is financed from the State
No of policies consulted according with ministry’s procedure (100% comply)No-
100% 100% 100% 100%
111
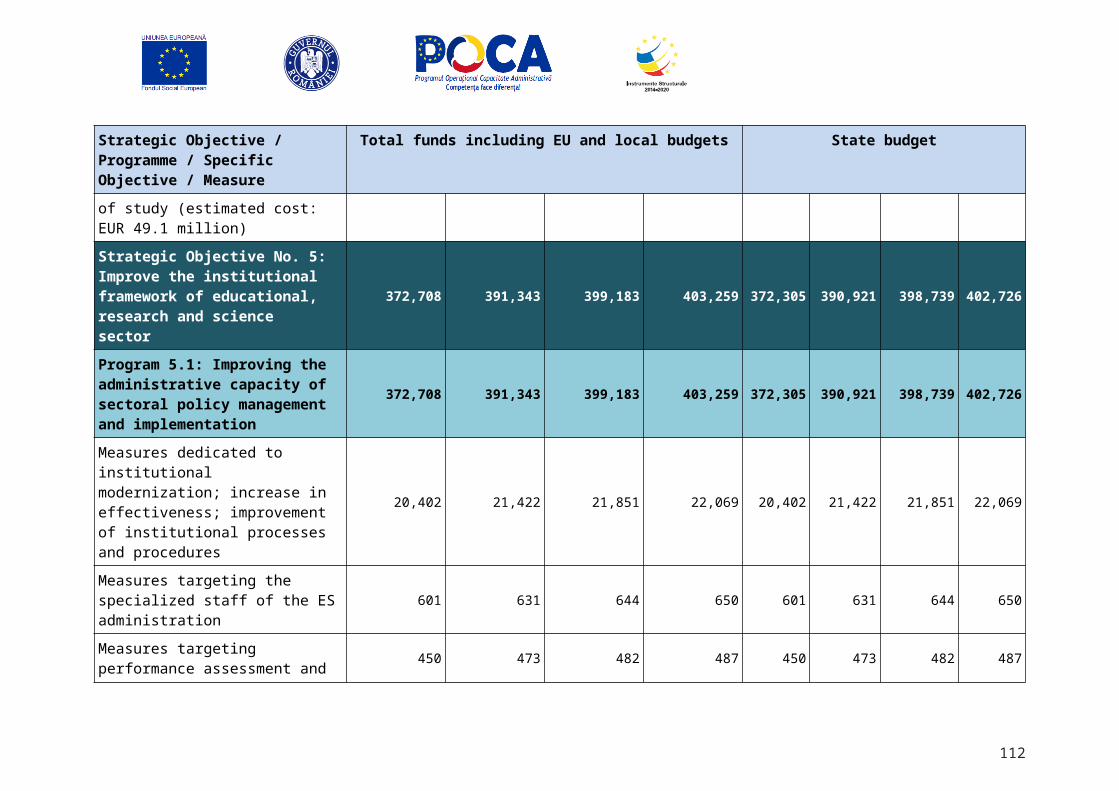
budget, through the administrative budget of MNE, continuously, and has no specific resource allocation (it is a support measure).
Inter-institutional collaboration and experience sharing with relevant national and international organizations: the measure targets the development of MNE’s institutional capacity, especially in terms of national and international collaboration; it equally aims at strengthening inter-agency partnership, at the national level, which is critical for the success and effectiveness of the ES policies. The direct beneficiary of the measure is the ES administration, who intends to establish, between 2017 and 2020, (19) partnerships and collaborations with international institutions (e.g.: European Commission), as well as an active presence at the EU level (drafting Romania’s positions for all the actions of the European Council, the Special Education Committee and the working meetings within the Working Groups). Additional partnerships will be sought with the Ministry of Labor, Family and Social Protection (MMFPS), the Ministry of Health (MH), and the Ministry of Public Finance (MFP), Ministry of Internal Affairs (MAI). The measure is financed from the State budget, through the administrative budget of MNE, continuously, for the entire 2017-20 period and has no specific resource allocation (it is a support measure).
No of Partnerships
No -
5 5 5 5
Technical assistance: a support measure whereby projects and major actions are carried out to increase the managing capacity of the managing authorities – general directorates within MNE, within the implementation of the Programs financed from European funds, results of the public policies in the educational, research and science sector. The technical assistance is supported throughout the ISP period and will be carried on until 2020. The measure is financed from European funds, envisages financed projects whose direct beneficiaries are MNE.
Financed contracts No.-
5 5 5 5
Outcome 5.1.4. Increased efficiency in using MNE’s administrative budget
Developing the analysis, audit, control, and risk management capacity: the measure covers a very important component of MNE activity (audit, control and risk management) and supports the development of the operational capacity in the field. The beneficiaries are directorates, agencies, units, inspectorates which carry out activities that require a risk management strategy consistent with international procedures and standards, and instruments and means to control the implementing process. By applying the measure, the ES administration aims to increase the compliance of controlled entities’ actions with risk avoidance standards, on the one hand, and to ensure that the monitoring plans specific to each control, audit and inspection unit are totally fulfilled. The measure is financed from the State budget, through the administrative budget of MNE,
% of compliant specific monitoring plans%100%
100% 100% 100% 100%
112
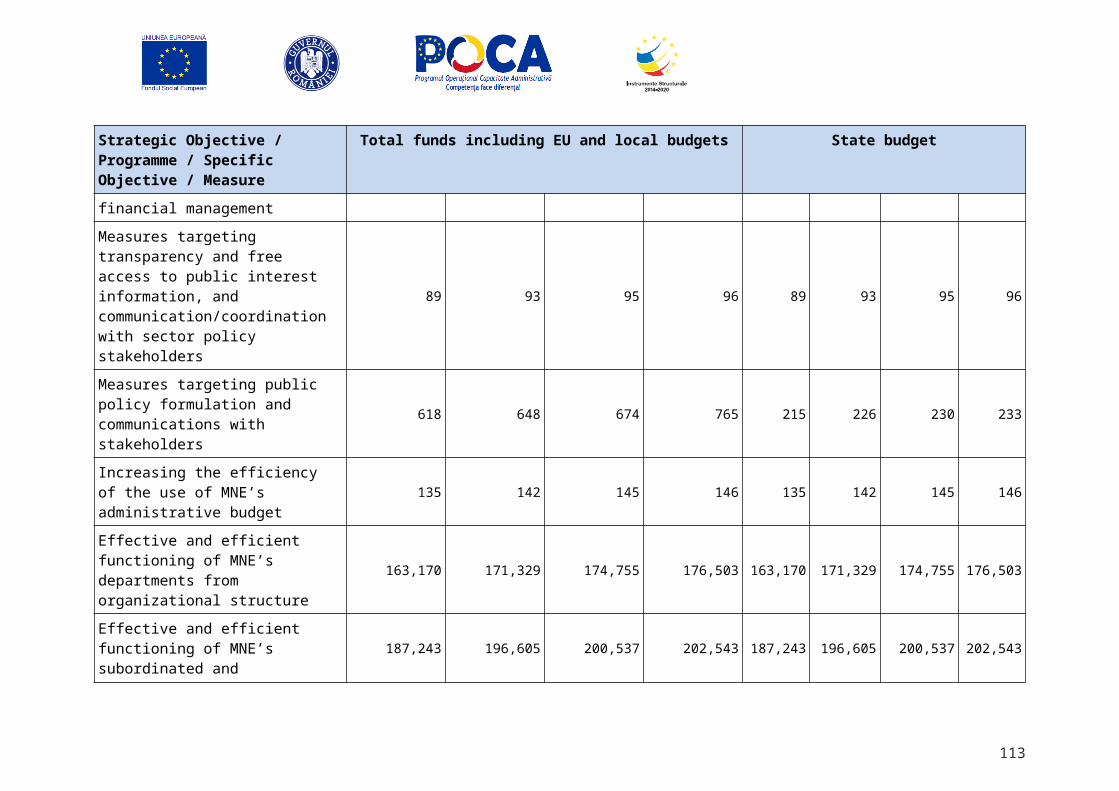
continuously, for the entire 2017-20 period and has no specific resource allocation (it is a support measure).
Securing and using external and extra-budgetary funds for the development of the administrative and institutional capacity: the measure targets the use of financing opportunities from external and extra-budgetary resources (Operational Program – Administrative Capacity, Sectoral Operational Program – Economic Competitiveness Increase, Sectoral Operational Program – Human Capacity) to develop the ES administration and its capacity to draft and implement public policies and sector development Programs. MNE aims to develop the internal capacity of drafting applications for funding and implementing the projects financed from extra-budgetary and external (mostly European) funds. MNE aims to apply for the funding of projects that also result in the support of at least some of the measures of Program 5.1, and the reduction of the administrative budget burden. The measure is financed from the State budget, through the administrative budget of MNE, continuously, for the entire 2017-20 period and has no specific resource allocation (it is a support measure).
used /annually allocated funds % / 92%
funds used for institutional capacity development from funds (financing sources) external to the ministry (vs. administrative budget)% / 0.62%
95%
0.70%
95%
0.75%
95%
0.75%
95%
0.75%
Effective and efficient operation of the services provided by the ministry through its own structures: the measure is meant to ensure that each entity fulfils its annual objectives established under its own activity plan, so that the activity plan is 100% achieved in accordance with the responsibilities included in the ROF of each structure (planned vs. achieved). The target group of the measure consists of the organizational structures within the ministry and its subordinate agencies, provided from the State budget (the operational budget of MNE and its subordinated agencies), which is distributed according to the number of employees/structure (see Annex 1). By fulfilling the activity plan (annual operational plan as part of the Internal Managerial Control System) of each agency, directorate, unit or department and by relating the plan to the allocated budget, the degree of achieving the structure’s (organization’s) performance indicators, as well as the performance indicators of each specialist within the ES administration will be determined. The measure is continuous and will apply throughout the ISP implementing period, i.e. 2017-20.
% of Annual operational plan implementation%-
100% 100% 100% 100%
Effective and efficient operation of the services provided by coordinated entities of the ministry the measure is meant to ensure that each entity fulfils its annual objectives established under its own activity plan, so that the activity plan is 100% achieved in accordance with the responsibilities included in the ROF of each structure (planned vs. achieved). The target group of the measure consists of the organizational structures within the ministry and its subordinate agencies, and the funds for the measure amount to RON , provided from the State budget (the operational budget of MNE and its subordinated agencies), which is distributed according to the
% of Annual operational plan implementation%-
100% 100% 100% 100%
113
number of employees/structure (see Annex 1). By fulfilling the activity plan (annual operational plan as part of the Internal Managerial Control System) of each agency, directorate, unit or department and by relating the plan to the allocated budget, the degree of achieving the structure’s (organization’s) performance indicators, as well as the performance indicators of each specialist within the ES administration will be determined. The measure is continuous and will apply throughout the ISP implementing period, i.e. 2017-20.
Total number of occupied positions in public administration is 1.185.000, as mentioned in Budget report 2016; total number of positions paid from state budget and subsidies in education sector is positions financed from state budget and positions financed from subsidies and own revenues)/http://discutii.mfinante.ro/static/10/Mfp/proiect_buget2014/RAPORTBUGET2014.pdf Total number of occupied positions in public administration is 1.185.000, as mentioned in Budget report 2014; total number of positions paid from state budget and subsidies in education sector
114
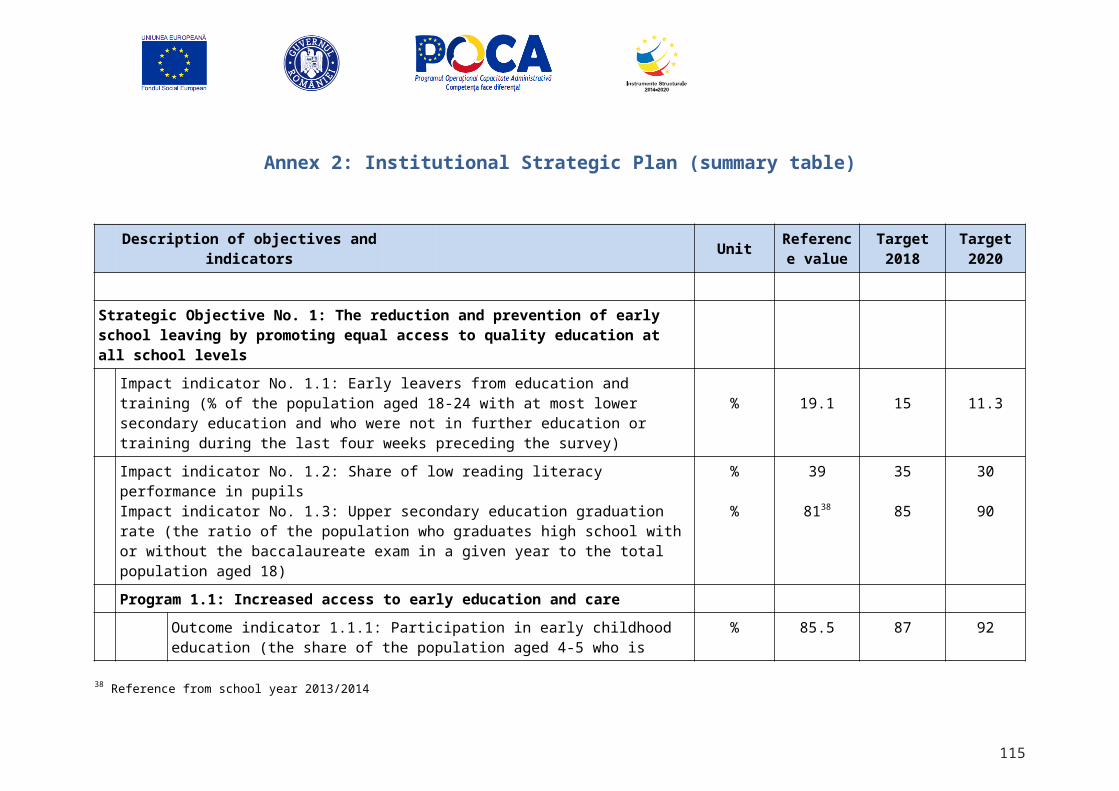
Annex 4: Institutional Profile
External and Internal environment analysis
A. European policy priorities and targets in Education and Training
A.1. Education and Training 2020 targets and statistics
European policies focusing on Education and Training are based on the priorities set by the European Commissions’ Council conclusions of 12 May 2009 on a strategic framework for European cooperation in education and training (‘ET 2020’)58. Four strategic objectives have been set for education and training policies to focus upon in the timeframe of 2020: making lifelong learning and mobility a reality; improving the quality and efficiency of education and training; promoting equity, social cohesion and active citizenship; enhancing creativity and innovation, including entrepreneurship, at all levels of education and training. The fulfillment of those strategic objectives has been annually evaluated against several statistical benchmarks and the results are published in the „Education and Training Monitors”.
Romania’s progress towards the objectives set out in 2009 has been a slow, albeit positive one in regard to several benchmarks. However, a number of targets have been missed or are unreachable in the timeframe of the year 2020. The most worrisome of those is the number of Early School Leavers which has been rising recently (see the Error: Reference source not foundbelow).
Graph 15. Early leavers from education and training (%)
Source: Eurostat, indicator t2020_40, 2016
The Education and Training Monitor 201559 (ETM) states Romania’s poor record with regard to the ESL indicator. As the European average target stands at below 10% and Romania’s set target is at 11.3% the current value of the indicator (19.1%) makes those targets hard to achieve by 2020. There is even more reason for concern as data provided shows that Romania is, along with three other countries, in the group of states for which “the situation is worst […] combining early school leaving rates above 10% with a lack of progress between 2011 and 2014.”60. Moreover, ESL in the case of Romania records huge differences between regions of the country, with the Center, North-Eastern and South-Eastern regions
58 Document no. 2009/C 119/0259 Full text is available here: http://ec.europa.eu/education/library/publications/monitor15_en.pdf (latest access 19.09.2016)60 ET Monitor 2015, p.34
115
2009 2010 2011 2012 2013 2014 20150
5
10
15
20
25
16.6
19.3
18.1 17.8 17.3 18.1
19.1
EU 28 average Romania
year
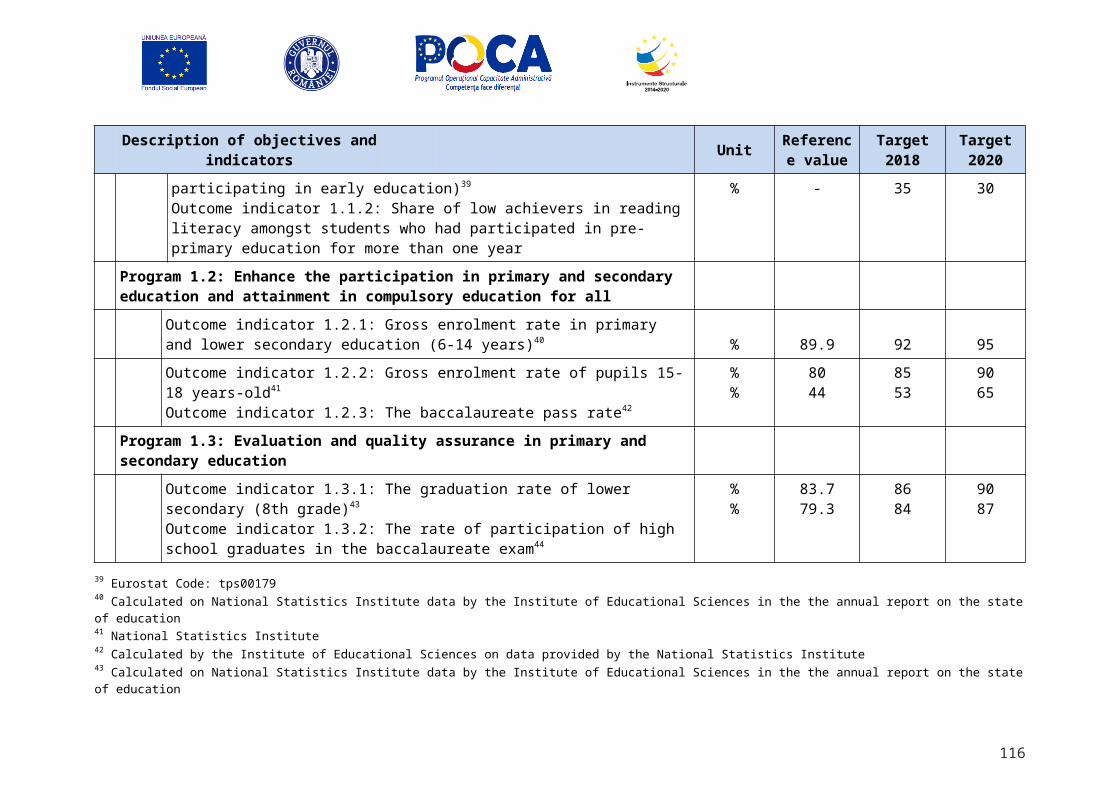
recording ESL rates above 20%, while Bucharest region records a value of just 10% of children in this situation.
The Government of Romania has adopted a “Strategic Framework to Reduce Early School Leaving” since June 2015. However, implementation and monitoring results and actions have been lagging. As the country report for Romania61 and country recommendations adopted by the European Council62
emphasize, several strategies to tackle such issues are in place but not operational due to administrative and financial reasons.
ESL is closely linked to another indicator set out by the Europe 2020 Agenda: Low achievers in basic skills. This has been defined as the proportion of low-achievers in reading, maths and sciences in international comparable testing, such as PISA. The target set out in 2009 is to reduce the proportion of low-achievers in the 15 years age group below 15%.
Even Romania has made significant progress improving learning outcomes for 15 year-old students, as measured in the OECD PISA study, a large percentage still do not achieve minimum proficiency. Between 2006 and 2015, the proportion of students who achieved PISA level 2 or higher in all three subjects increased substantially. For example, in 2006 only 46 percent of students attained this basic level of proficiency in reading but by 2015 61 percent attained this level. Similar improvements occurred in mathematics and science as well. However, still more than one third of Romania’s 15 year-olds do not achieve minimum proficiency.
Graph 16. Percent of 15 year-old students achieving minimum proficiency in PISA by domain (level 2 or above)
Low achievement of Romanian pupils is also documented by referring to results from TIMSS and PIRLS 63, which test fourth and eighth grade students’ abilities in reading, mathematics and sciences. Results 64
from the latest wave of testing show that approximately 27% of fourth graders in Romania fail to reach the lowest benchmark for all three subjects in international comparisons, among participating countries.
61 Country Report Romania 2016; Brussels, 26.2.2016, SWD(2016) 91 final62 Brussels, 13 June 2016 (OR. en) 9226/1663 TIMSS and PIRLS are international comparable testing procedures similar to PISA. They are carried out on a comparable methodology by the International Evaluation Agency (IEA) of the Boston College’s Lynch School of Education. 64 Timss and PIRLS 2011: Relationships Among Reading, Mathematics, and Science Achievement at the Fourth Grade—Implications for Early Learning (2013), available online: http://timss.bc.edu/timsspirls2011/downloads/TP11_Relationship_Report.pdf
116
Math Reading Science0
25
50
75
47 465353 60 59
5963 6360 61 61
2006 2009 2012 2015 Series5
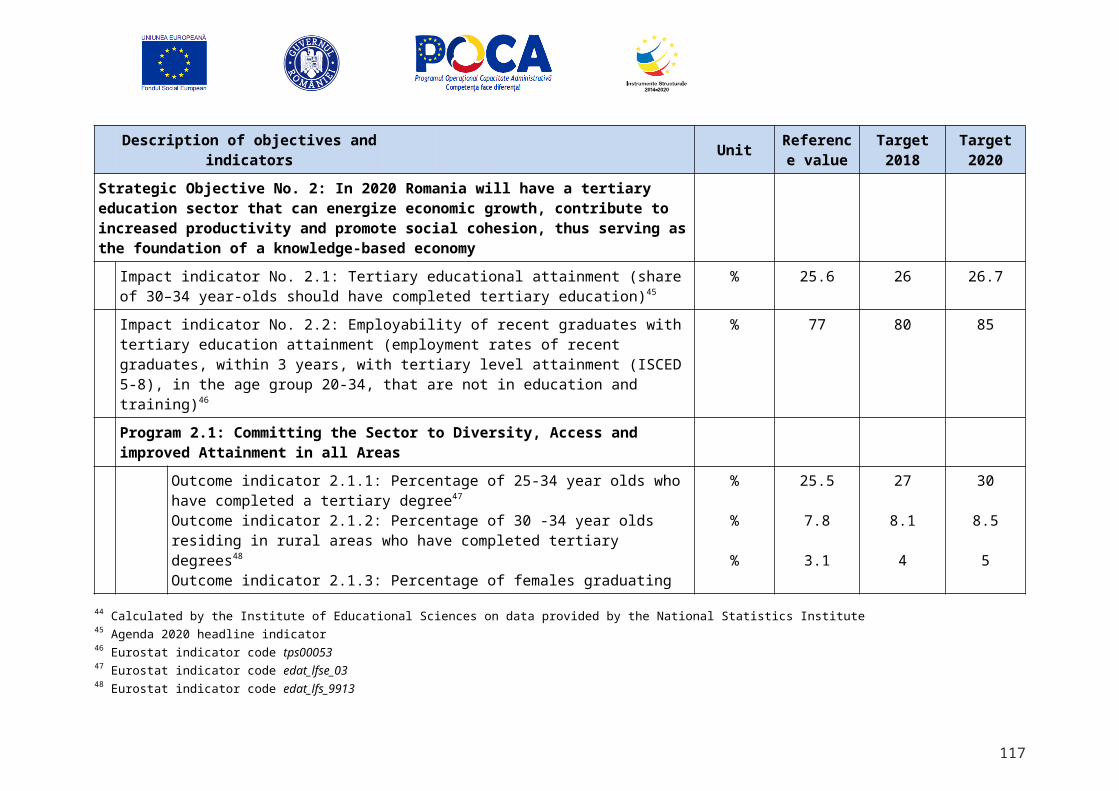
ESL and low achievement are two of the most important issues facing the Romanian education system at school level. They are both linked with the SES of families and its influence upon education participation and achievement of children. They also have a bearing on other strategic indicators, such as tertiary education attainment, employment and even adult participation in lifelong learning, since they influence the way future adults relate to education in their life-time.
Vulnerable groups, such as children coming from Roma families, poor and rural areas, face a worse situation. According to the Country Report for Romania (2016), 27% of Roma pupils still attend de facto segregated schools. Also rural areas record almost twice as many early leavers from education as urban areas.
Graph 17. Participation rate in education and training (% of 18-64 age group), selected countries (2009-2015)
2009 2010 2011 2012 2013 2014 20150.0
2.0
4.0
6.0
8.0
10.0
12.0
14.0
16.0
Romania Bulgaria EU 28 (average) Hungary
%
Source: Eurostat, indicator trng_lfs_05, 2016
Although there are some concerns over the way it is measured that may not fully reflect the actual situation, adult education participation rates in Romania are dismal. Participation of adults in formal education, in continuing training programs or other formal programs is among the lowest in the EU, comparable only to Bulgaria. With a rate of participation below 2% of the population aged 25 – 64 over the past 6 years, Romania shows no signs of improvement and the 10% target set by the ET 2020 European strategy is probably unachievable. While adult education is a serious concern for EU wide education policies, as pointed out in the ET monitor 201565, Romania still has to close an ever widening gap with neighbor countries and the EU average participation in adult education.
Tertiary education attainment is the indicator where Romania fares best in the context of the ET 2020 strategy, relative to its own set targets. It is close to achieving the target of 26.7% of the 30 – 34 age group with tertiary level educational attainment, with a value of 25.6% for 2015, according to Eurostat data. However, it must be acknowledged that this is among the lowest rates in the EU member states, with only Italy, Slovakia, and the Czech Republic recording similar rates. It is also rather low compared to the 40% target set as an average for all EU member countries. Therefore, improving participation in higher education and other tertiary non-university educational programs should remain a priority for the longer term.
Higher education is a key strategic objective of various EU level analyses and reports. As detailed in the following policies section, further development of higher education is a key point in achieving the targets set in ET 2020. Key areas of intervention aimed at addressing the high ESL rates, low
65 See pages 77 – 81 ET Monitor 2015.
117
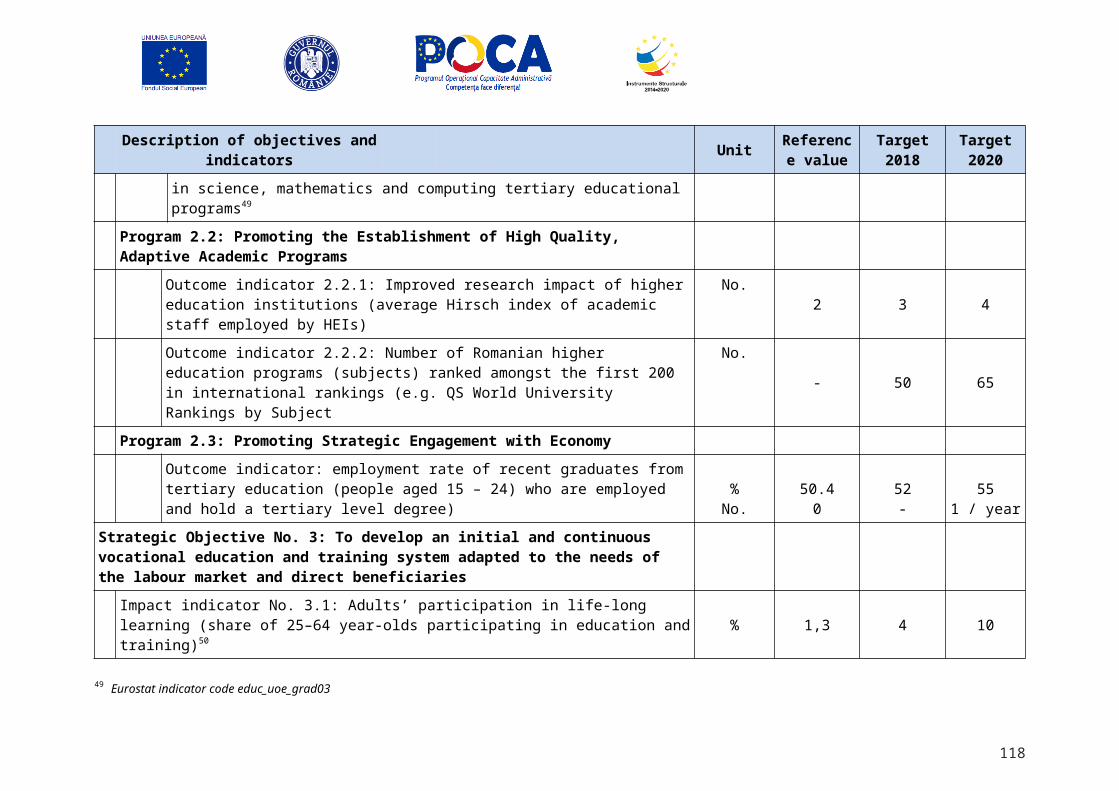
achievement levels and low tertiary enrollments include reforming the financing systems, the quality assurance procedures a well as a further development of the use of ICT. At the same time, Romania faces a particular challenge residing in its linear and narrow educational system which allows little place, if any, for alternative routes in reaching a certain degree. A further challenge to be addressed are tertiary non-university study programs, which have been mostly closed down in the early 2000’s and are now slowly being reorganized.
In 2015, following a series of stock taking reports, the European Commission restated the priorities set out in 2009 for European cooperation in education and training66. It also resized from 13 to just 6 the priority areas and has linked them to concrete issues identified through evidence based tools. The 6 priority areas which are recommended for guiding policies in education throughout member states are: 1. Relevant and high-quality skills and competences, focusing on learning outcomes, for employability, innovation and active citizenship; 2. Inclusive education, equality, non-discrimination and promotion of civic competences; 3. Open and innovative education and training, including by fully embracing the digital era; 4. Strong support for educators; 5. Transparency and recognition of skills and qualifications to facilitate learning and labor mobility; 6. Sustainable investment, performance and efficiency of education and training systems.
Educational poverty is the central topic on the agenda in European educational policy studies and recommendations, as proven by the analysis provided in the ETM 2015. The concept of educational poverty is currently being used to cover a range of challenges which include both the socio-economic status of families and issues pertaining to education (participation, access, achievement). It also may be understood as a transversal topic in the 6 priority policy areas recommended by the EC.
B. The Romanian educational system and educational policy context
The Romanian education system consists of more than 19,200 education units and institutions offering educational services ranging from early childhood to tertiary education. More than 3.4 million students are currently enrolled in these education institutions,
Participation in education has followed a downward trend over the past 6 years, however participation rates are showing signs of improvement recently. The situation is worsening for boys, as participation rates of male pupils are lower and decreasing by comparison to those of girls. The indicator is calculated for the entire educational system as the share of pupils and students aged up to 23 years old in the total population from the 6 – 23 age group. The latest figures show that 75% of persons from the relevant age group were enrolled in the formal educational system in the 2014 / 2015 school year.
66 Joint Report of the Council and the Commission on the implementation of the strategic framework for European cooperation in education and training (ET 2020) New priorities for European cooperation in education and training (2015/C 417/04)
118
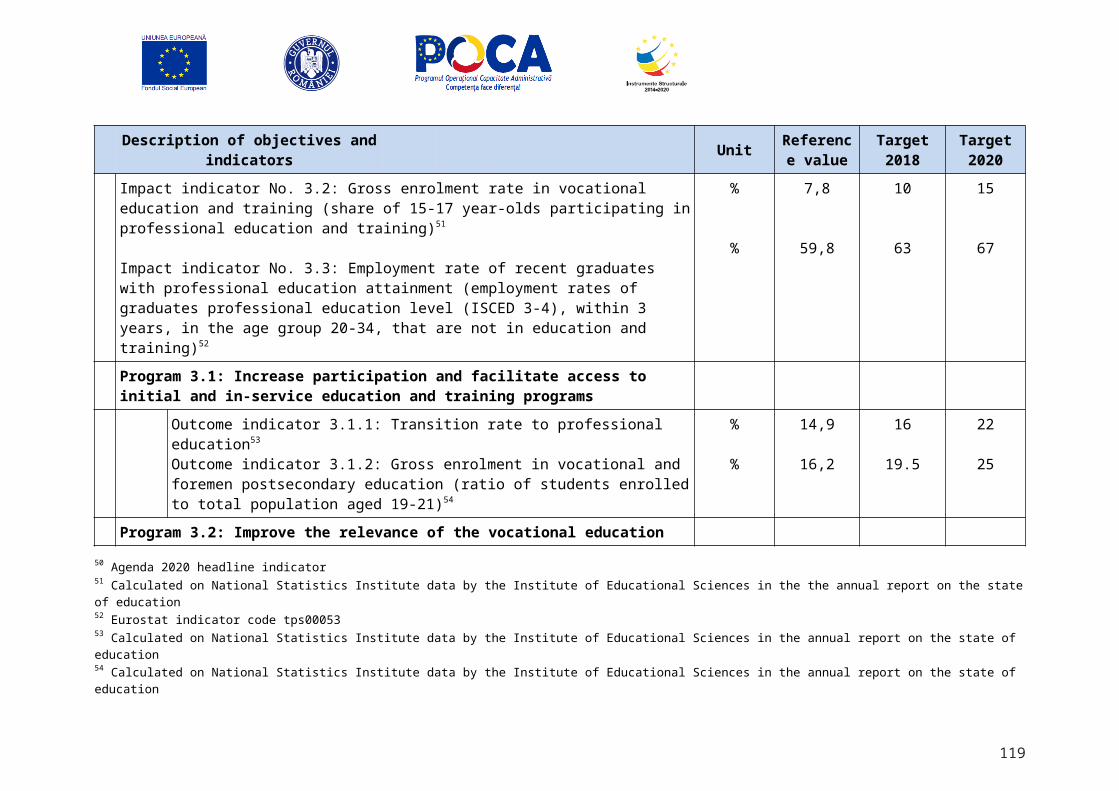
Graph 18. Participation rates in the (share of participants 6 -23) age group %
2009/2010 2010/2011 2011/2012 2012/2013 2013/2014 2014/201566
68
70
72
74
76
78
80
82
84
Total Female Male
%
Female students not only have higher participation rates, but as an effect, they also spend more time in the educational system then boys. The average lifetime school participation expectancy is 16.5 years for girls compared to 15.4 years for boys. The one year average difference between girls and boys in school participation is mainly due to girls having a much better participation rate in higher education.
Graph 19. Participation rates by level of education and place of residence (2014 / 2015 school year)
pre-primary primary secondary0
20
40
60
80
100
Urban Rural
level of education
%
Participation rates differ dramatically when compared by level of education and residence type for pupils. Participation in primary and secondary (gymnasium) levels of education is higher for persons living in urban areas as compared to rural areas. Figures also show that, for the secondary level of education (from the 5-th up to the 8-th grade), a migratory pattern from rural to urban areas is taking shape, as participation rates for this level of education surpass 100% in urban areas. The change is striking in the case of the upper secondary level: while the number of upper-secondary enrolled students residing in urban areas is over 142% of the recorded population in the 15 – 19 age group, the share of upper-secondary enrolled persons is only 11% of the relevant age group residing in rural areas67.
67Values computed on the basis of data provided by the NIS, Tempo-online data base, indicators POP106A (resident population at 1-st July) and SCL103I (enrolled pupils by level of education and place of residence). In absolute terms a total number of 503,468 persons aged 15 – 19 resided in urban areas, in 2014, while a total number of 715,367 of persons were enrolled in upper-secondary education. At the same time, a number of 581,107 persons were living in rural areas but only 62,493 persons were enrolled in rural upper-secondary education institutions.
119
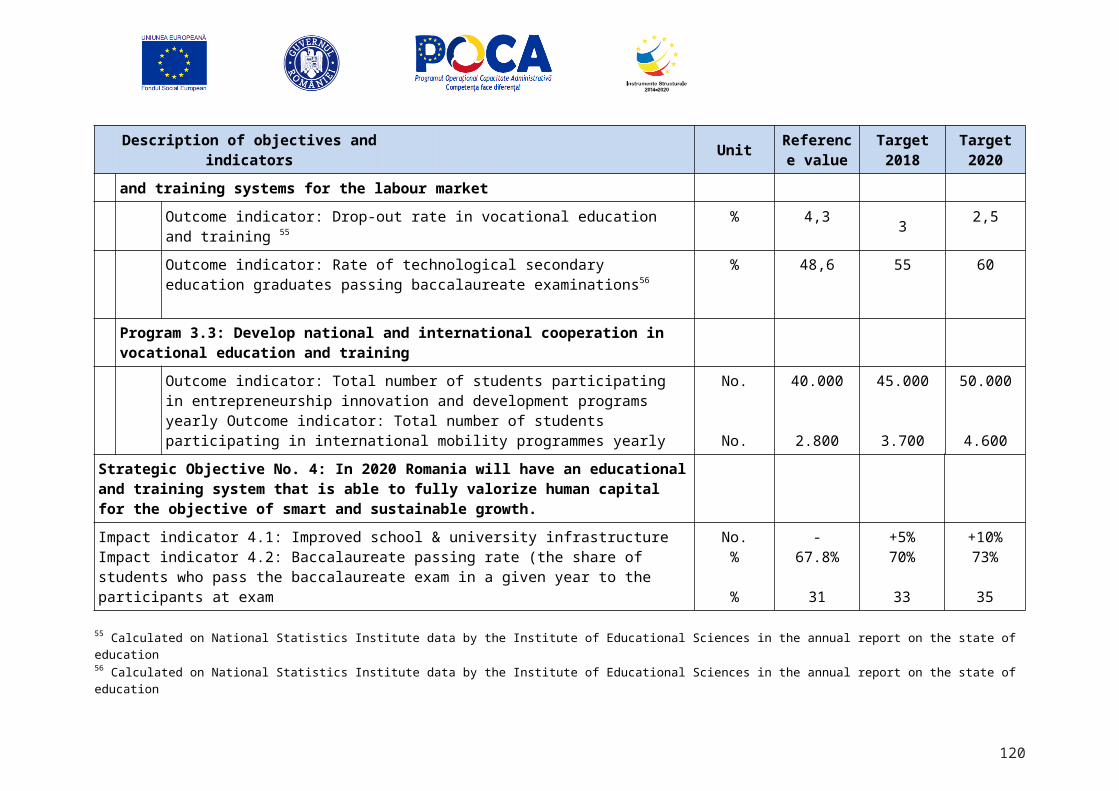
Statistical indicators point towards major sources of inequalities in the education system. One is the gap in participation between residents in urban and rural areas, which remains constant from pre-primary education onwards. Another major challenge is migration from rural towards urban based schools, which is only available for a minority of rural residents having resources (family networks, financial resources etc.) for supporting children to access education away from their homes. Migration of rural residents towards urban schools becomes visible during the secondary level of education (after the 5-th grade) and is mostly visible at upper secondary (high school) level. Participation in high school is 142% of the urban population and a mere 11% for the rural based population.
While schools offering primary and secondary level education are predominant in rural areas (70% of this type of schools at national level are in rural areas), kindergartens and upper-secondary schools (high schools) are almost exclusive to urban areas. The Law of National Education (no. 1/ 2011) stipulates that a school has legal entity if enroll at least 150 children for kindergartens or 300 children for primary and secondary level onwards, with some exceptions. As kindergartens in rural areas enroll less than 150 children they usually are functioning as satellite schools included in larger schools. Therefore, participation rates interpreted in conjunction with the number of school units available show that the large majority of children born in rural areas are enrolled in schools which also provide kindergarten services (participation rates are around 80% for rural areas for both levels of education). Some of those manage to graduate the grade 8, gymnasium level, but have no real opportunity to continue their studies to high school or VET due to the absence in their proximity of an upper-secondary level educational organization. Those who do continue their studies have to migrate towards urban areas, if their families have the adequate resources for such a move (some children do migrate earlier during secondary education, as shown by participation rates in secondary education in urban areas).
Table 10. Number and educational units by level of education and area type (2014)
Educational units with legal entity No. of units in 2014 Percentage in total
Kindergartens Urban 1111 92%
Rural 94 8%
Primary and secondary schools Urban 1215 30%
Rural 2835 70%
Upper secondary schools (including high-schools and VET schools)
Urban 1313 83%
Rural 263 17%
Source: NIS data, indicator SCL101D, 2016
Table 11. Number of Education Institutions (legal entities and satellites)
Level of EducationNumber of Education Institutions
Total Urban Rural
Preschool (except nurseries) 8,685 2,184 6,501
120
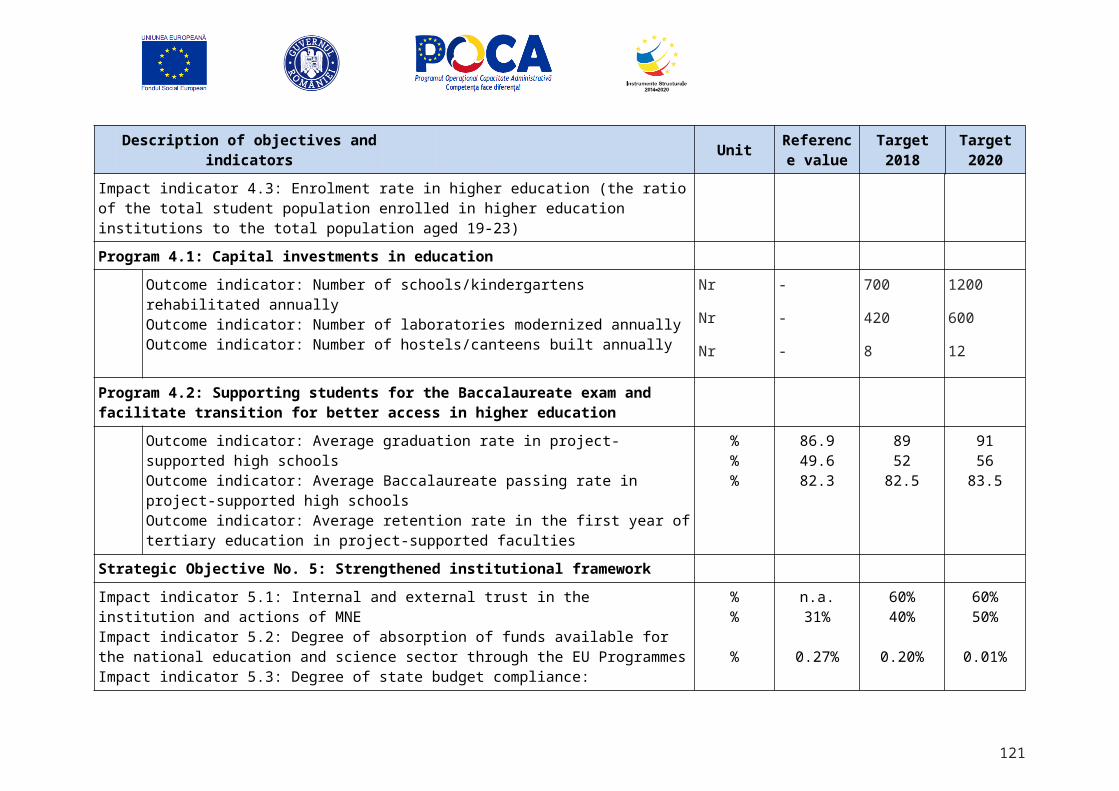
Primary Schools 3,302 75 3,227
Lower Secondary Schools 5,565 1,203 4,362
Upper Secondary Education Schools 1,487 1,203 284
High Schools 1,474 1,196 278
Professional Schools 13 7 6
Schools for Special Needs Education 164 142 22
Tertiary Education Institutions 83 83 0
Post-secondary Vocational Schools 28 28 0
Public Universities 55 55 0
Total 19,286 4,890 14,396
Source: MNE (school year 2014-2015)
School drop-out also plays a role in education participation at all levels of education. Data shows that school dropout is a system wide phenomenon, affecting all levels of education. However, some key points do stand out and point towards critical moments in the educational career of children which are risk prone towards early leaving from the educational system. A methodological note is required since school dropout is calculated in national reports on the basis of an “entrance – exit” methodology for each school year. According to this method dropout is calculated as the difference between the number of children being enrolled at the beginning of the school year (in September) and the number of children still being recorded in school registries at the end of the school year (in September of the next year).
Dropout rates are around 1.5% of the pupils starting the school year for primary and secondary education in each grade (from preparatory grade which marks the entry to compulsory education until the end of the eighth grade). A spike in dropout rates is recorded with 2.5% for the 2014 / 2015 school year, during the fifth grade, which marks the transition between primary and secondary education. At upper-secondary level dropout averages 2.8% of the cohort for each grade and is significantly higher for male students, which constantly record higher values than female students (e.g. at the end of the 2014 school year 3.2% of the boys left upper-secondary education compared to 2.4% of girls).
As shown in the Error: Reference source not foundon dropout, it is high at system level in Romania compared to the EU28 average and is far from the set target for the year 2020. This is due to the fact that each school year each grade loses between 1% and 3% of enrolled students at the beginning of the school year. This amounts to between 20.000 – 30.000 persons leaving the formal educational system each year for each level of education.
An example for the 2014 / 2015 graduates from secondary education shows that after testing at national level at the end of the 8-th grade the efficiency and inclusiveness of the Romanian educational system should be seriously questioned. Approximately 87% of the cohort manages to reach the end of the 8-th grade; only 79% of those pass the national exam upon graduating, as data for 2014 / 2015 school year shows. By using as reference the population of pupils which were first enrolled at the beginning of the
121
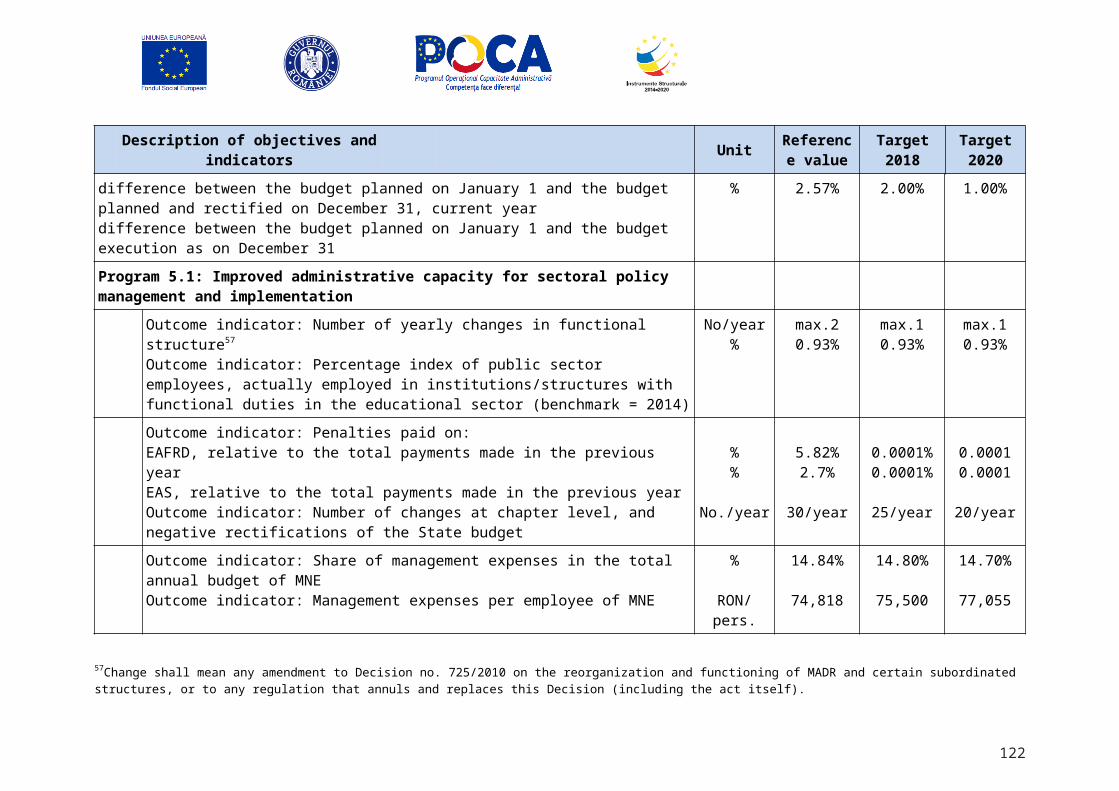
2006 school year (219,968 children) a mere 57% of those (equivalent of 125,852 children) have in fact been successful graduates of secondary education from their cohort.
Transition rates from secondary to upper-secondary education provide further insight into this efficiency matter. Looking at the 2009 – 2015 evolution of transition rates into high school and VET it is noticeable that variations occur from one school year to another. It is also worrying that, although VET seems to have started to be an attractive educational route, overall transition seems to show signs of declining.
Table 12. Transition rates into upper - secondary education (2009 - 2015) by educational route and gender
Transition rates into upper-secondary education
2009/
2010*
2010/
2011*
2011/
2012*
2012/
2013
2013/
2014
2014/
2015
Upper – secondary total (high school and VET)
Total 92,6 - - 96,7 96,7 94,4
Female 94,2 - - 94,4 94,6 93,4
Male 90,9 - - 98,8 98,7 95,4
High school only Total 92,8 93,0 92,2 92,2 91,9 79,6
Female 93,0 93,2 92,6 92,3 92,4 84,9
Male 92,6 92,8 91,8 92,0 91,5 74,4
VET only Total 2,2 - - 4,5 4,8 14,9
Female 3,8 - - 2,1 2,2 8,5
Male 0,8 - - 6,9 7,2 20,9
*Starting with the 2009 / 2010 school year the alternative VET route was eliminated, beginning with 2014 / 2015 the route was reactivated.
The table shows that there is a relatively large variation of this indicator over the short time span presented. This is mainly caused by institutional and political instability of the educational environment. Closing and then reopening of the VET route in upper-secondary education in just 4 years has caused uncertainty regarding the way this level of education works and what kind of finality it will have. As the baccalaureate exam remains unique at national level, it is not clear what the difference between those educational routes may be. Also gender differences may be observed as female students are more likely to go to high school and follow an “academic” or “theoretical” educational route, while a rising fraction of male students choose the “VET” or “professional” one. This gender segregation has to be under monitoring since it could lead towards further inequalities in the labor market further on.
Graduation rates from upper-secondary education complete a rather bleak statistical picture of the efficiency of the Romanian pre-university system. In the 2014 – 2015 school year only 44% of those enrolled in the last year of upper-secondary education graduated and passed the baccalaureate exam, which marks the completion of upper-secondary education. The gap between male and female
122
graduates is worrying with 53% of girls and just 35% of boys graduating and passing the baccalaureate exam.
Graph 20. Graduation rates from upper secondary education (2009 - 2014) by sex
2010 2011 2012 2013 20140
10
20
30
40
50
60
70
80
Male Female
End of school year
% o
f gro
up
Passing the baccalaureate exam and graduation rates have dropped between 2010 and 2011 due to a introducing camera at the baccalaureate exam and restricting the exam to three major fields. This means that access to higher education in universities is drastically restricted to a large group of upper-secondary students. As access to higher education is limited to a type of “academic” track only and, on the other hand, the non-university tertiary educational system is a rather small sized one, access to tertiary education as a whole is hampered. A dual track type of system could be drafted, starting from different baccalaureate requirements and with different level qualifications and degrees, to integrate a route for VET graduates in universities.
Data shows that 2 in 10 high school graduates do not even register for the baccalaureate exam. Out of those 80% of graduates registering for the baccalaureate exam, only around half will eventually pass the exam, gaining formal access to tertiary university level education. Also graduates from past years rarely register in consequent years for the exam in an attempt to gain the diploma required for higher education admission. In the context of high school leaving rates between secondary and upper secondary levels, graduation rates hovering around 55% on average over the past 5 years, it is no surprise that just around a third of the relevant age cohort is enrolled in university level study programs, leaving the rest without a real option for gaining access to tertiary education, except for a minority who will access the non-university tertiary education VET programs.
Tertiary education attainment at population level seems to be on target in view of completing the ET 2020 objective. However, participation rates in tertiary education are slowly trending downwards and this poses a threat to maintaining the positive trend recorded until today.
123
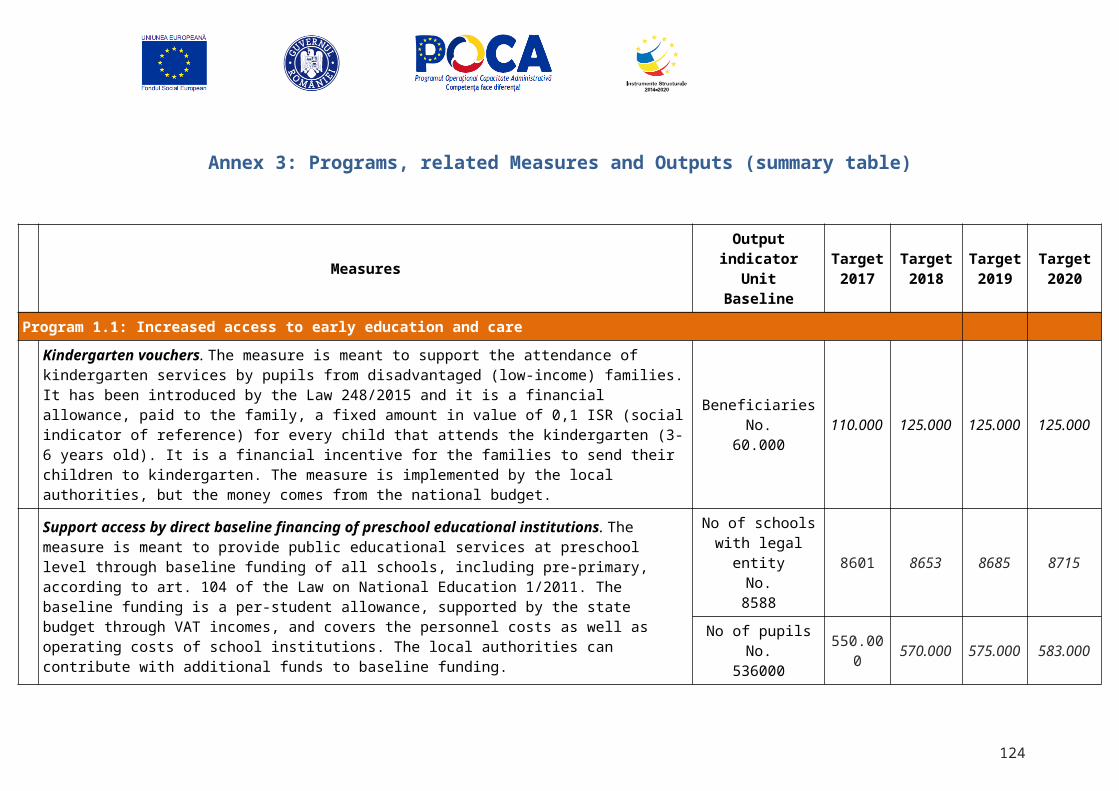
Graph 21. Enrolments in tertiary education between 2009-2015 (absolute numbers)
2009 2010 2011 2012 2013 2014 20150
100000
200000
300000
400000
500000
600000
700000
800000
900000
Tertiary non - university Tertiary university first cycle (BA)
Source: Tempo Online NIS database, indicators SCL103K and SCL103L
Total enrolments in tertiary education (university first cycle study programs and non-university VET programs) have been constantly dropping in absolute numbers, however the evolution of tertiary non-university enrolments has been improving over the past 6 years. In absolute terms, according to NIS data, the number of persons enrolled in tertiary non-university education rose from 62,575 to almost over 99,000 between 2009 and 2015, with a peak of 105,557 in 2014. At the same time the absolute number of enrolments in higher education dropped dramatically from 775,319 persons to just 410,697 in 2015. This reduction in higher education enrolment rate has been mostly due to private universities losing almost 81% of the enrolment figure for 2009 by the year 2015.
Participation rates in tertiary education have dropped from 63% of the 19 – 23 age group in 2009 to 47% in 2015 (calculation based on NIS data). While university enrolments are the primary source of this steep reduction in participation it is also important to note that participation in tertiary non-university programs has almost doubled from 5% of the population aged 19 – 23 in 2009 rising to 9% in 2015. This clearly shows that, over the past few years as graduation rates of the baccalaureate exam have been falling, tertiary non-university education has become an alternative for continuing education for a significant number of young people. This increase in non-university enrollment is, however, only partly compensating the reduction in university enrollments.
Employment rates have increased over the past five years from 57.4% of the 15 – 64 aged population in 2009 to 60.8% in 2014, reflecting rather the improvement of the economic sector after the financial crisis of the 2009 – 2010’s. With the exception of persons with an educational attainment of only the primary level, employment rates have been increasing irrespective of the level of educational attainment.
Employment rates for young people however show a rather worrisome picture of the relevance of education and its relationship to the labor market. Employment rates for young people (aged 15 – 24) have decreased for young people holding a university degree, from 53.7% in 2009 to 35.8% in 2014, while those of persons with VET educational attainment have risen from 52.3% to 70.4%. This again may in fact show a change in the structure of the labor market, with low-skill, professionally oriented jobs being on a wider offer then those requiring higher competences. Alternatively, this may reveal that the relevance of higher education programs is rather low.
124
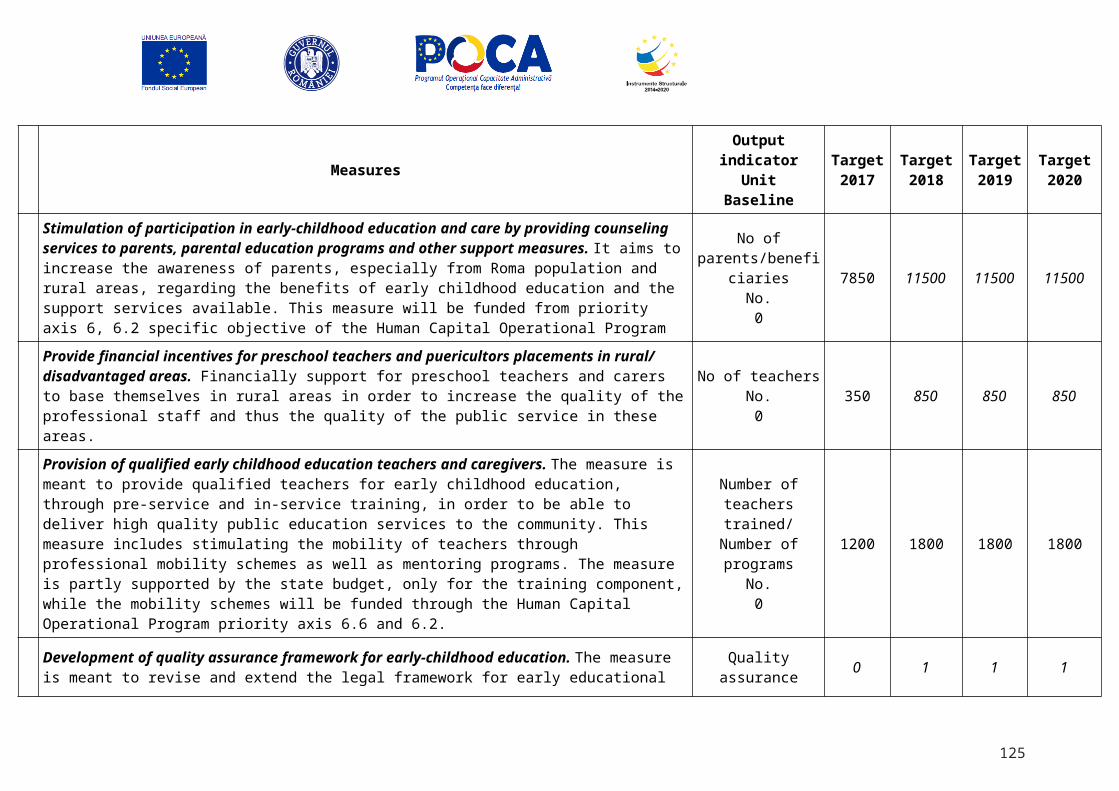
Unemployment rates provide even further evidence that there is little connection in fact between outputs of the educational system in terms of graduates and competences and the labor market needs. Unemployment rates for young people (aged 15 – 24) have been rising over the past five years from 20% in 2009 to 24% in 2014. This rise may be observed for almost all educational attainment levels, even if, in all fairness, it seems to have affected more people with primary educational attainment than those with tertiary – university attainment. Again persons who graduated from professional, VET, programs seem to be better off, since unemployment rates in their case have decreased.
The analysis of the Romanian education system shows that ever widening gaps exists along the lines of gender and area of residence in terms of key objectives from the point of view of European and global concerns in education. Female students participate more in education then male students, while rural areas are at a constant disadvantage compared to urban ones in terms of participation, school infrastructure and human resources engaged in the system. The link between education and the labor market seems to be less and less visible since unemployment for young people is not related to their level of educational attainment. VET education, after a process of dismantling between 2009 – 2014 shows that it is an increasingly preferred educational route in the context of rather low performance rates at national exams at the end of the eighth grade and the national baccalaureate exam. Education as a whole is still massively underfunded, with around 3.70% of GDP allocated towards education through various sources. Fragmentation of financing of education, especially at the pre-university level, is a major challenge, since a unitary strategy and policies are difficult to implement at this stage, due to the large number of administrative organizational actors involved in financing education. While the largest share of educational spending goes to finance salaries of teaching personnel, salaries are still among the lowest by comparison with other EU member states and huge salary differences exist between entry level and senior employees. Thus, the teaching profession is still an unattractive career for young professionals, which leads to an increasing share of unqualified personnel being hired in the educational system on a temporary basis.
The ministry follows a series of priorities and actions as established by the National Reform Plan as well as the Sectoral Strategies approved by Government Decision:
The Strategy for Reducing Early School Leaving, approved by Government Decision no. 417/2015;
The National Strategy for Tertiary Education 2015 – 2020, approved by Government Decision no. 565/2015;
The Strategy for Lifelong Learning 2015 – 2020, approved by Government Decision no. 418/2015;
The Strategy for Vocational Education and Training in Romania for 2016-2020, approved by Government Decision no. 317/2016;
Following the implementation of the Government Decision 148/2008 regarding budgetary planning, in order to ensure the consistency of government policies, and to correlate the identified priorities with the strategic budgeting process, in the past four years, the Ministry implemented a number of budgetary programs as follows: the school supplies program; money for high-school; Euro 200 for stimulating the acquisition of a new PC for young students from disadvantaged families; assuring the quality of human resources; Tertiary education program; strengthening of the Ministry's institutional capacity. A synopsis of the Ministry's education budget and respectively the program coverage shows:
125
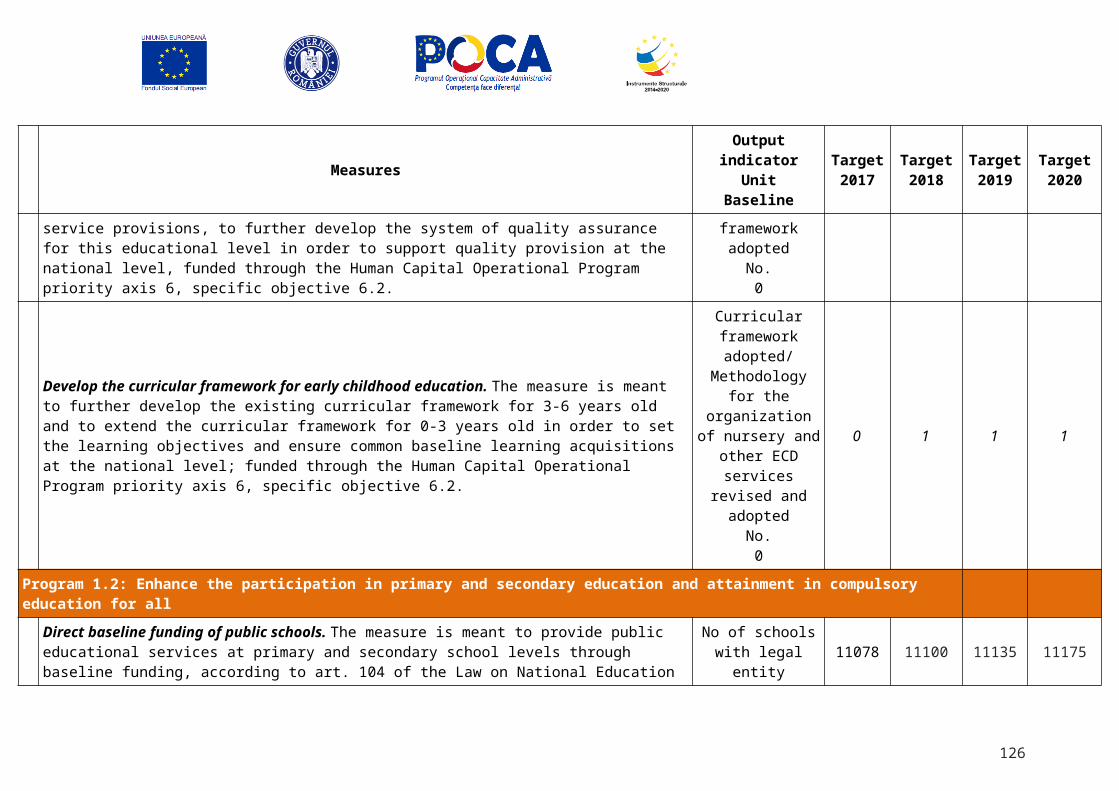
Table 13. Multi-annual program-based budget of the Ministry of Education
Type of Programs Budget (thousands lei)
2013 2014 2015 2016 2017(estimation)
Total budget education 3.430.219 3.990.244 4.291.792 4.381.094 4.216.540
School supplies program 18.514 13.369 20.000 20.000 20.530
Money for high-school 157.000 126.808 115.406 90.387 103.921
Euro200 20.610 13.642 16.001 16.000 15.928
Assuring the quality of human resources
54.200
Tertiary education program 2.128.049 2.570.883 2.222.593 2.691.120 2.677.931
Strengthening the Ministry's institutional capacity
3.012
Total programs 2.381.385 2.724.702 2.374.000 2.817.507 2.818.310
% program coverage in the state budget
70% 69% 56% 65% 67%
Analysis based on data from the Ministry of Public Finance
Following a content analysis of these measures, using the Atlas.ti software and counting the number of initiatives/measures in each of these programs, the distribution is the following:
Table 14. Main chapters of the Ministry's priorities in negotiating the budget (% of measures)
Strategic Programs 2014 2015 2016 Quotations
European dimension in education 2% 8% 6% 6%
School (Pre-university) education 67% 59% 61% 62%
Tertiary education 31% 37% 36% 35%
Analysis on data from the Ministry of Public Finance
On the other hand, the strategic directions mentioned by the Ministry in the budgetary strategic documents, over the four years under scrutiny, 2013 - 2016 were grouped into three main directions: School education; Tertiary education; The European dimension of education and training.
126
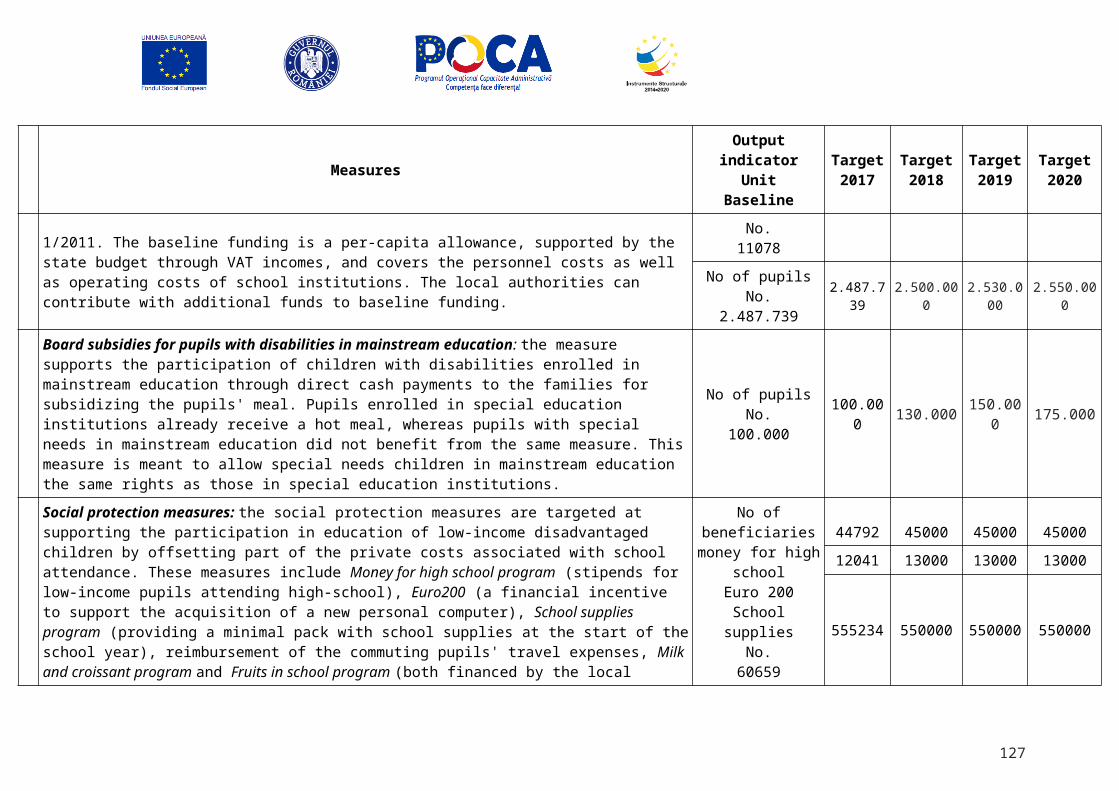
The highest number of measures / initiatives are under school education program, and, on the other hand, the highest percentage of budget allocation goes to higher education program. It is equally true that the main stream for financing the school education is at local authorities’ level, and the ministry shall not assume policies implementation but support and orientation. The Ministry needs to analyses resources at his disposal and relation with their impact in results in order to adjust implementation and guide future interventions for education sector as a whole.
Under the school education program, across the four strategic documents studied (for 2013, 2014, 2015 and respectively 2016 budgets), there are various sub-programs, as presented in the figure below.
Figure 12. Sub-programs (sets of measures) within the school education program
Source: data from the Education Ministry's strategic priorities documents
In the access to school education, by far the most frequently mentioned are the social policies meant to support disadvantaged families to access education. Preschool education comes on the second place regarding the frequency of its mention in the official policy documents. Professionalizing school management appears more mentioned in the more recent documents.
Table 15. % of mention of measures fostering access in the school education program (% in total measures)
Measures / Frequency of mention 2014 2015 2016 %Enhance the quality of school counselling 0,00% 0,00% 1,52% 0,64%
Preschool education 2,38% 2,04% 3,03% 2,55%
Prevention and elimination of corruption 2,38% 0,00% 0,00% 0,64%
Reducing school violence 2,38% 0,00% 0,00% 0,64%
Roma children 2,38% 0,00% 0,00% 0,64%
127
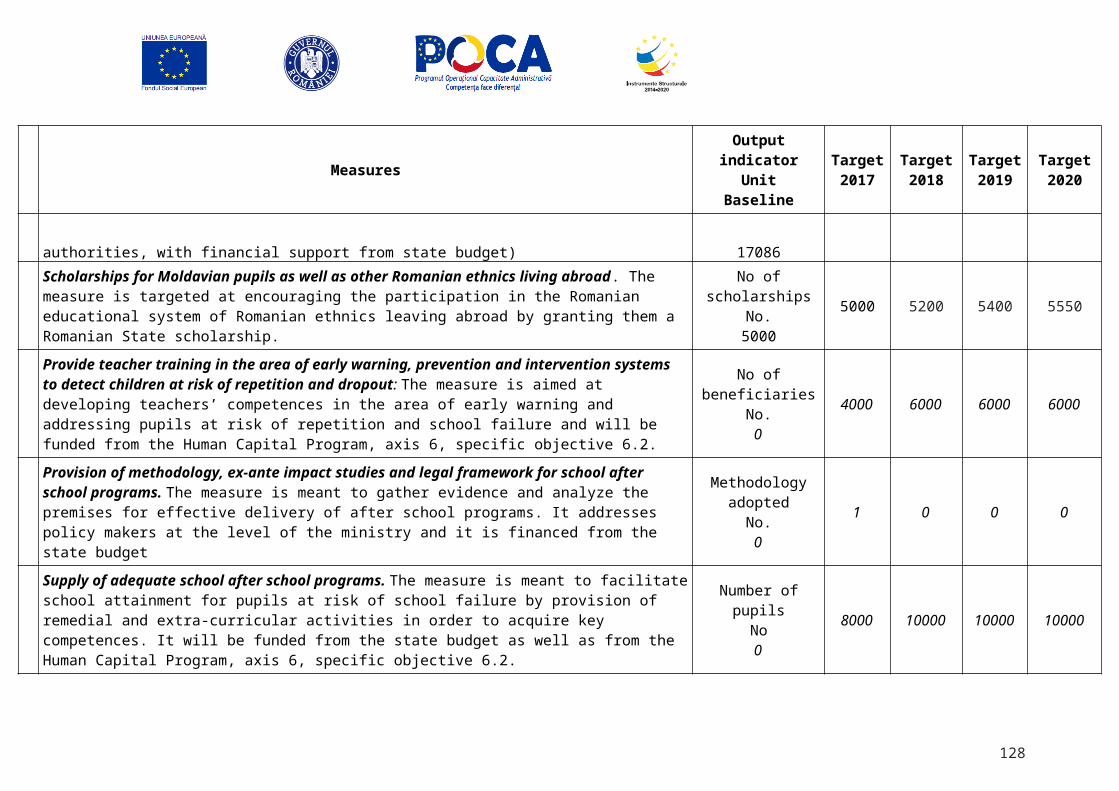
School after school initiative 2,38% 2,04% 1,52% 1,91%
School buses 0,00% 0,00% 1,52% 0,64%
Second chance educational initiative 2,38% 2,04% 1,52% 1,91%
Sub-program on access to school education 2,38% 2,04% 1,52% 1,91%
Support for children at risk 0,00% 2,04% 1,52% 1,27%
Support for disadvantaged families 7,14% 4,08% 4,55% 5,10%
Support for early leavers 0,00% 0,00% 0,00% 0,00%Author's analysis on data from the Ministry of Public Finance
Professionalizing school management, together with school inspection, teacher mentoring and teacher counseling are the most mentioned amongst the measures fostering quality in school education in the two most recent documents. These measures are aiming at raising the human resource quality.
Figure 13. Sub-program on fostering access to school education
Source: data from the Education Ministry's strategic priorities documents
128
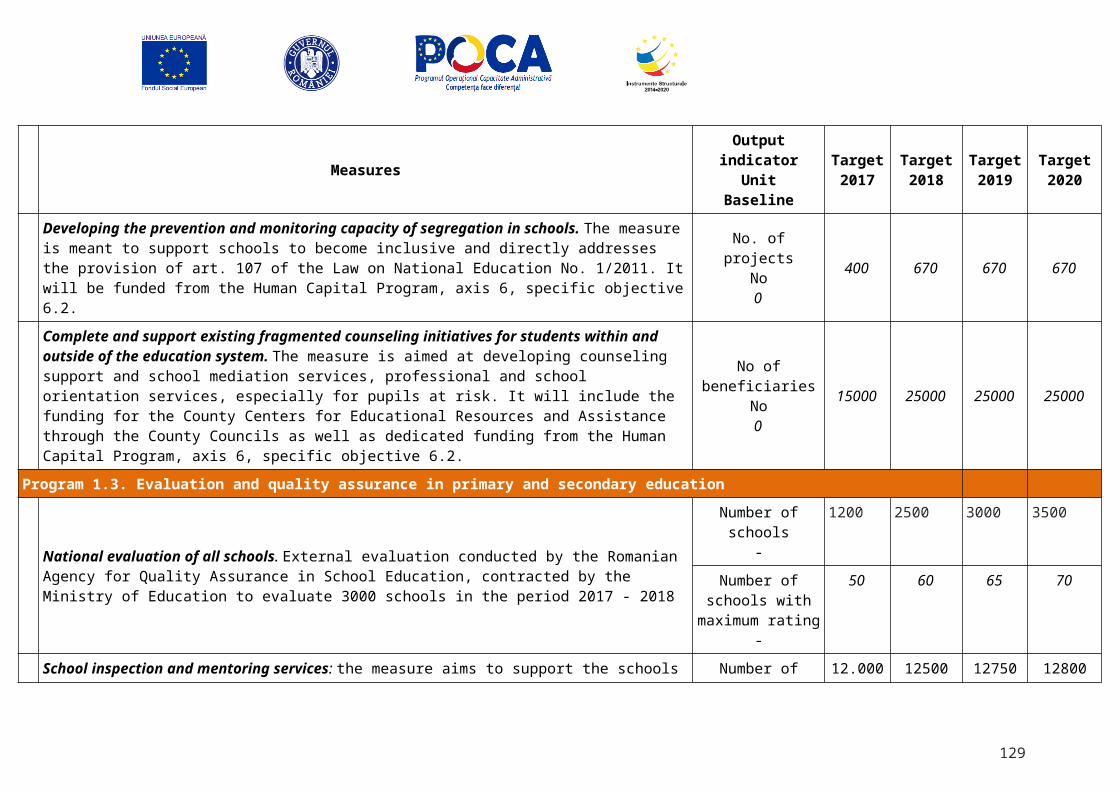
Figure 14. Sub-program on provision of quality school education
Source: data from the Education Ministry's strategic priorities documents
Table 16. % of mention of measures aiming at quality in the school education program (% in total measures)Measures / Frequency of mention 2014 2015 2016 Quotations
Fostering private initiative in school education 0,00% 0,00% 1,52% 0,64%
Innovation and creativity 2,38% 2,04% 0,00% 1,27%
National contest for school inspectors 0,00% 2,04% 0,00% 0,64%
National contest for school managers 0,00% 2,04% 0,00% 0,64%
National evaluation of schools 0,00% 0,00% 1,52% 0,64%
National exams 0,00% 2,04% 1,52% 1,27%
New curriculum 0,00% 2,04% 1,52% 1,27%
Professionalizing school management 0,00% 2,04% 1,52% 1,27%
129
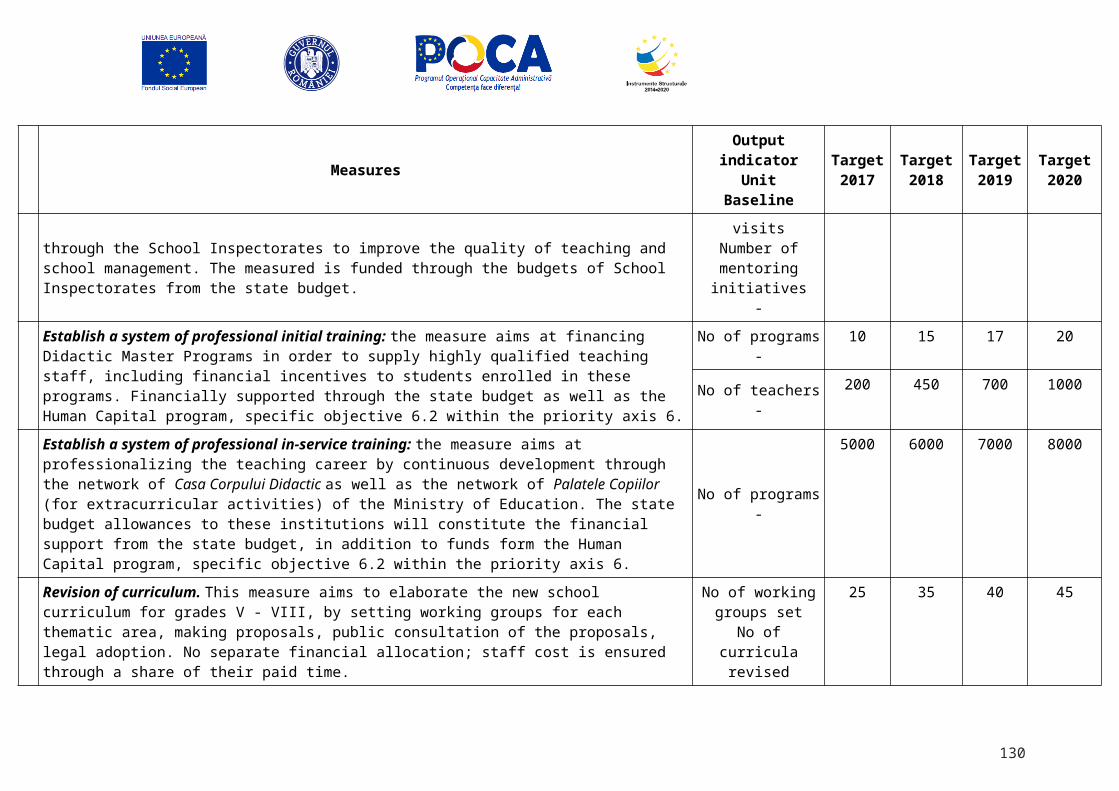
Quality human resources 0,00% 0,00% 1,52% 0,64%
Raise baccalaureate pass rate 0,00% 0,00% 1,52% 0,64%
School inspection 0,00% 2,04% 1,52% 1,27%
Teacher counselling 0,00% 2,04% 1,52% 1,27%
Teacher mentoring 0,00% 2,04% 1,52% 1,27%
Author's analysis on data from the Ministry of Public Finance
Under the tertiary education program, five sub-programs are included as in the figure below.
Figure 15. Sub-programs of the tertiary education program
Source: data from the Education Ministry's strategic priorities documents
130
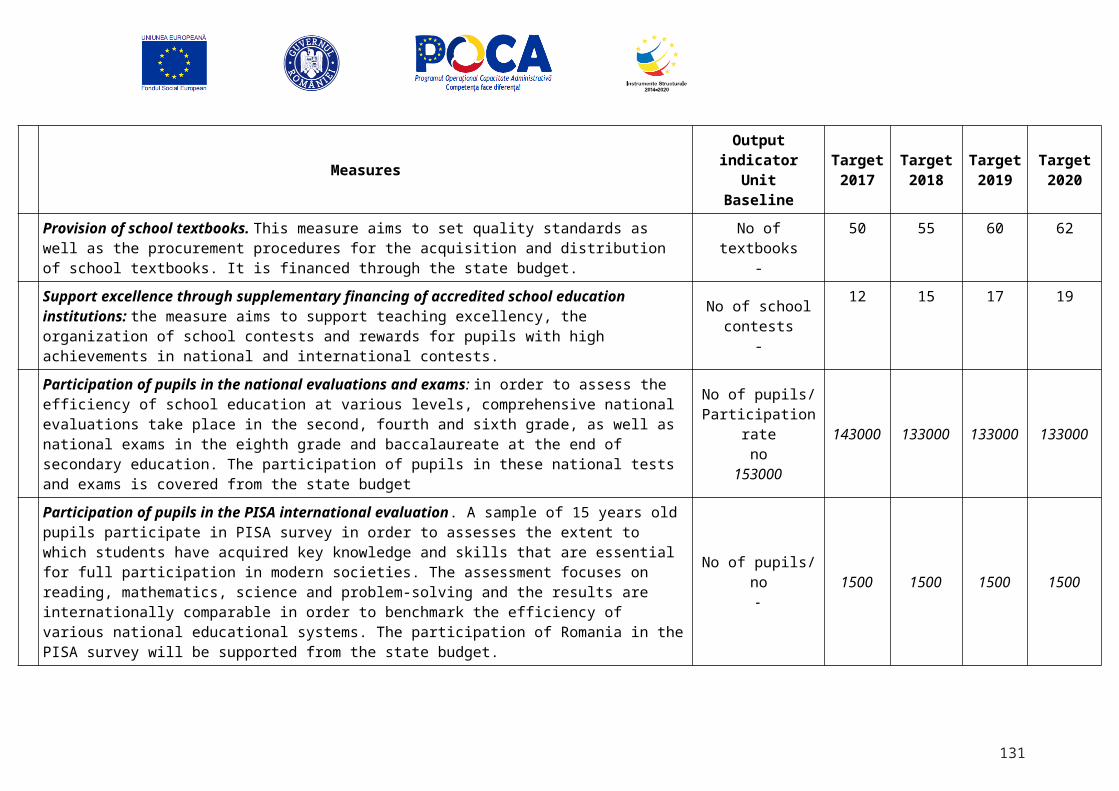
Figure 16. Measures for enhancing competitiveness /quality of higher education institutions
Source: data from the Education Ministry's strategic priorities documents
Table 17. % of measures aiming at quality/competitiveness of higher education (% of total measures)
Measures / Frequency of mention 2014 2015 2016 Quotations
Capacity for policy elaboration and implementation 0,00% 2,04% 1,52% 1,27%
Capital investments in higher education 0,00% 0,00% 1,52% 0,64%
Classification of universities 2,38% 0,00% 1,52% 1,27%
Evaluation of masteral study domains 2,38% 0,00% 0,00% 0,64%
Evidence based policy making 2,38% 2,04% 3,03% 2,55%
Fostering institutional cooperation 0,00% 2,04% 0,00% 0,64%
Funding of HE on performance criteria 2,38% 2,04% 0,00% 1,27%
Human resource management autonomy 2,38% 0,00% 0,00% 0,64%
131
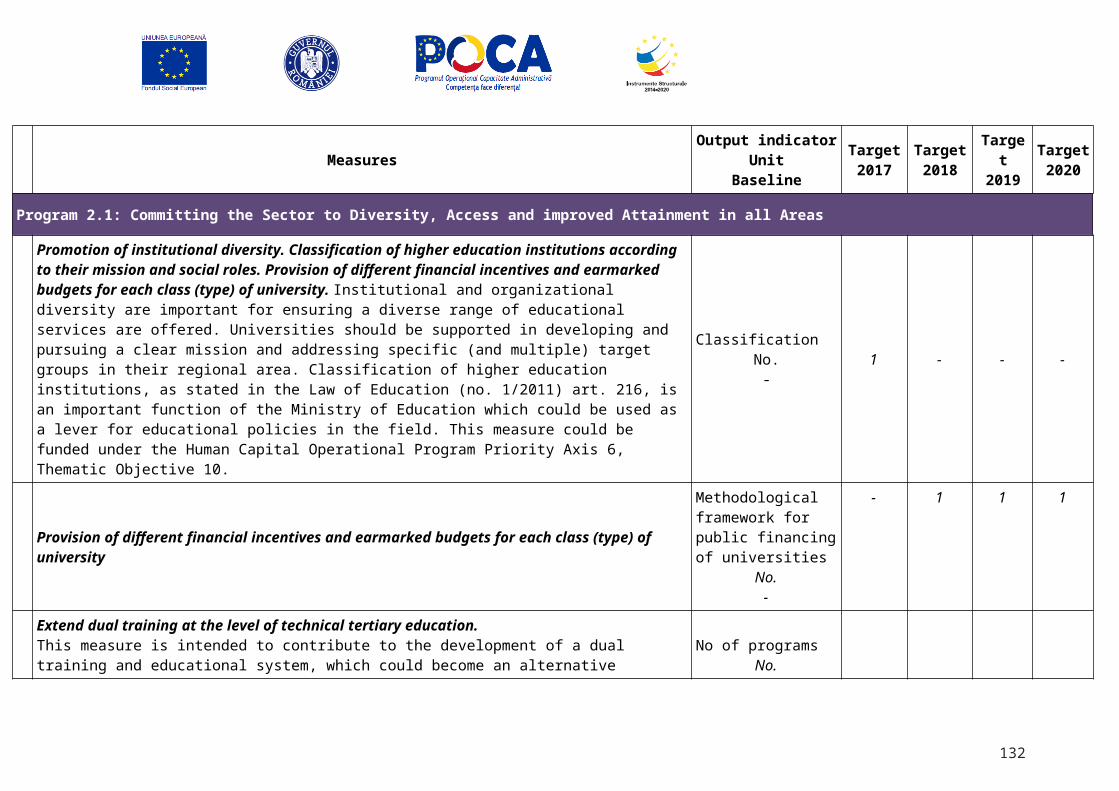
Modernizing university management 0,00% 2,04% 1,52% 1,27%
Multiannual funding 0,00% 0,00% 0,00% 0,00%
Performance based funding 0,00% 2,04% 0,00% 0,64%
Public responsibility of universities 0,00% 0,00% 0,00% 0,00%
Quality assurance criteria 2,38% 2,04% 3,03% 2,55%
Ranking of study programs 2,38% 0,00% 1,52% 1,27%
Research grants on competitive basis 2,38% 2,04% 0,00% 1,27%
Supplementary funding for excellence 0,00% 0,00% 1,52% 0,64%
Amongst the measures to enhance competitiveness/quality of higher education institutions and programs, elaborating new quality assurance criteria and indicators ranks first, also together with the development of monitoring and evaluation capacity in order to acquire reliable data for evidence-based policy making both at institutional and national levels. Classification of universities, ranking of study programs and modernizing university management are also often mentioned in the strategic documents of the Education Ministry.
Turning to budgetary programs, these include:
School supplies initiative;
Money for high-school;
Euro200 - support for disadvantaged pupils for the acquisition of computers;
Tertiary education in Romania;
Enhancing the ministry's capacity to manage the European funds;
Assuring quality human resources.
The objectives of the budgetary programs are mostly focused on social policies for ensuring equal opportunity by providing access facilities and incentives to low income families. These are meant to support the strategy for reducing the early school leaving by supporting school participation and bearing part of the costs associated with it.
The objectives for the higher education program are very complex and wide ranging, being rather unfocused and quite difficult to make operational. The objective of raising the ministry's institutional capacity is more focused, but the indicators are vague and not directly related to the actions/measures proposed: number of project proposals received by the Management Authority.
132
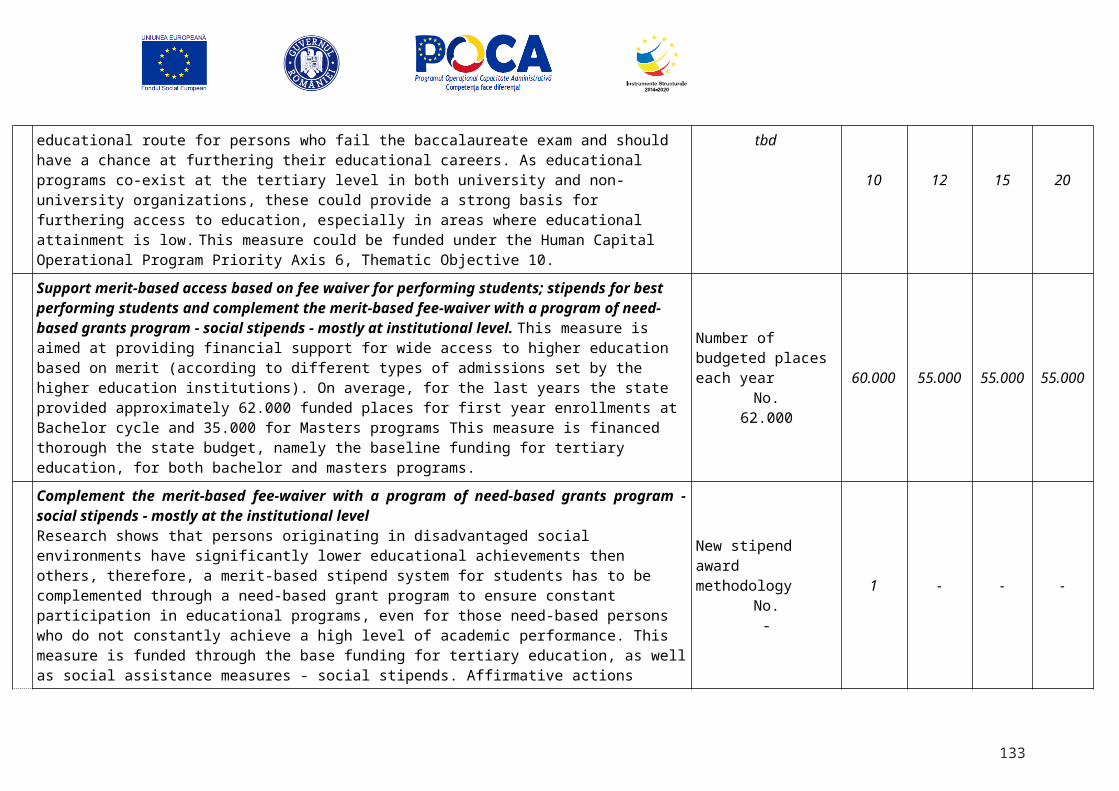
The results indicators are expressed only as output indicators: number of beneficiaries of social programs, expenditure/beneficiary is the efficiency indicator. There are no outcome or impact indicators, nor any relation with the strategic objectives mentioned.
The Ministry’s strategic priorities documents associated with the sample of the last budget four years proposals (for 2013, 2014, 2015 and 2016) include three main directions of actions that would correspond to three major programs: school education, tertiary education, and, respectively, European dimension in education and training. There are various sub-programs and measures within these sub-programs. Most of these are mentioned across all four annual documents, sometimes the specific sub-program they are included in varies from one year to another. The measures are comprehensive for the educational sector spanning from access and participation in education at various levels/cycles, to enhancing the quality, decentralization, professionalizing the management, involving stakeholders in managing educational institutions etc. The measures are mostly phrased in desirable terms, as general objectives, but actually lack a plan of action and more operational initiatives. The budgetary programs only address a relatively small, albeit important, part of school education, that are the social policies meant to support pupils from disadvantaged families. Also, the tertiary education sub-program is included in a single budgetary program, mostly made up of the institutional funding of universities, but without detailing the budget for each sub-program, without any clear plan of action or specific indicators. The results indicators only include the number of higher education graduates, which is an outcome of the higher education as a whole, yet without measuring the effectiveness of the sub-programs or the attainment of the more complex objectives stated in the policy document.
Currently, there is thus a considerable gap between the broadly stated and generous set of aims and objectives in the policy document and a plan for actions and also the financial means associated with them. The budgetary programs, although covering around 60% of the ministry's education budget, address just a fraction of the objectives and measures stated. This fraction is smaller for school education, whereas the tertiary education program corresponds to synonymous budgetary program, but yet without actually budgeting the measures detailed in the policy document.
There is thus a clear need for restructuring the currently broadly stated programs and measures, in accordance with the available budget, having in mind the strategies adopted through Government Decisions. Additionally, there need to be clear impact and outcome indicators, as well as SMART output indicators for the measures proposed; the sources of funding shall be clearly mentioned as well.
133
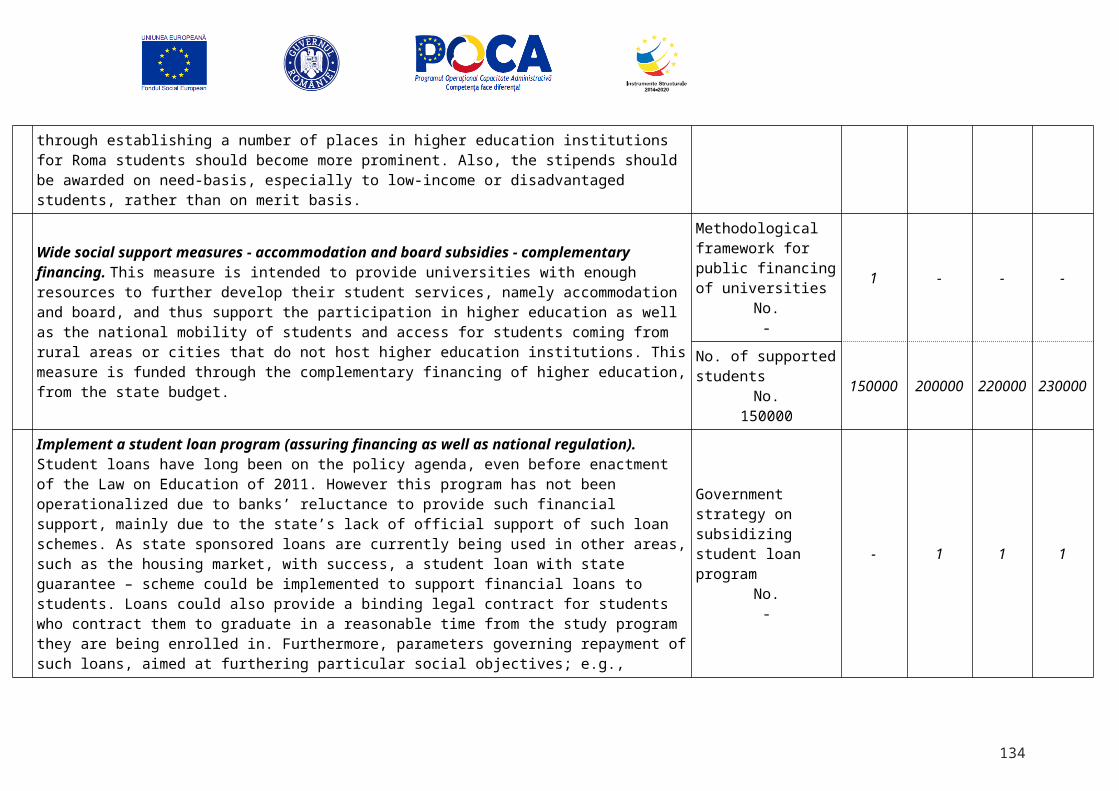
Competența face diferența!Proiect selectat în cadrul Programului Operațional Capacitate Administrativă cofinanțat de Uniunea
Europeană, din Fondul Social European
Competence makes a difference!Project selected under the Administrative Capacity Operational Program, co-financed by European Union
from the European Social Fund
134