Embed Size (px)
Citation preview
SG Cowen Technology ConferenceWednesday, September 3, 2003
Safe Harbor Statement
Under the Private Securities Litigation Reform Act of 1995:
Except for historical information, the matters discussed in this presentationthat may be considered forward-looking statements may be subject to
certain risks and uncertainties that could cause the actual results to differmaterially from those projected, including uncertainties in the market,
pricing, competition, procurement and manufacturing efficiencies,and other risks detailed from time to time in the Company’s SEC reports.
The Company assumes no obligation to update the information in this presentation.

Corporate Overview
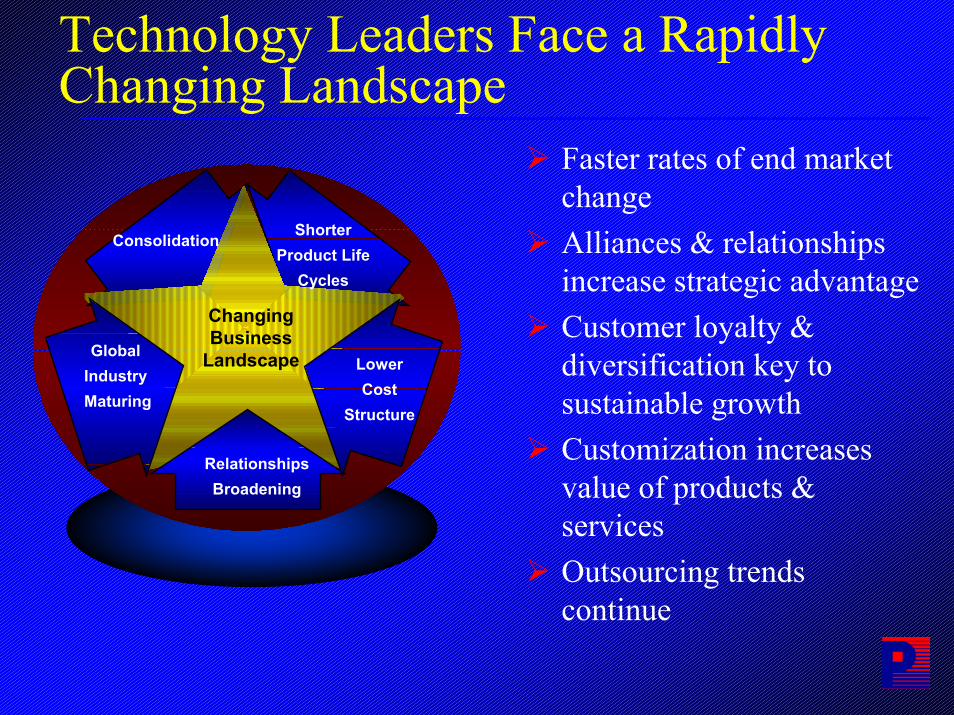
Technology Leaders Face a Rapidly Changing Landscape
Faster rates of end market changeAlliances & relationships increase strategic advantageCustomer loyalty & diversification key to sustainable growthCustomization increases value of products & servicesOutsourcing trends continue
Shorter Product Life
Cycles
Relationships Broadening
Consolidation
Global IndustryMaturing
Lower Cost
Structure
ChangingBusiness
Landscape
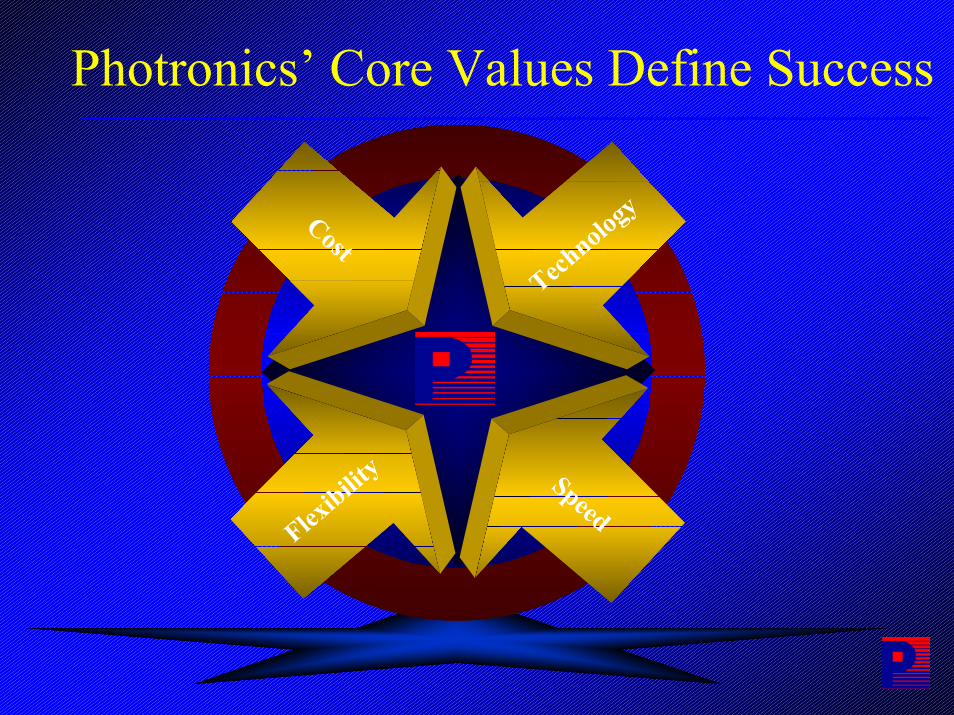
Photronics’ Core Values Define Success
Flexibilit
y
Technology
Speed
Cost
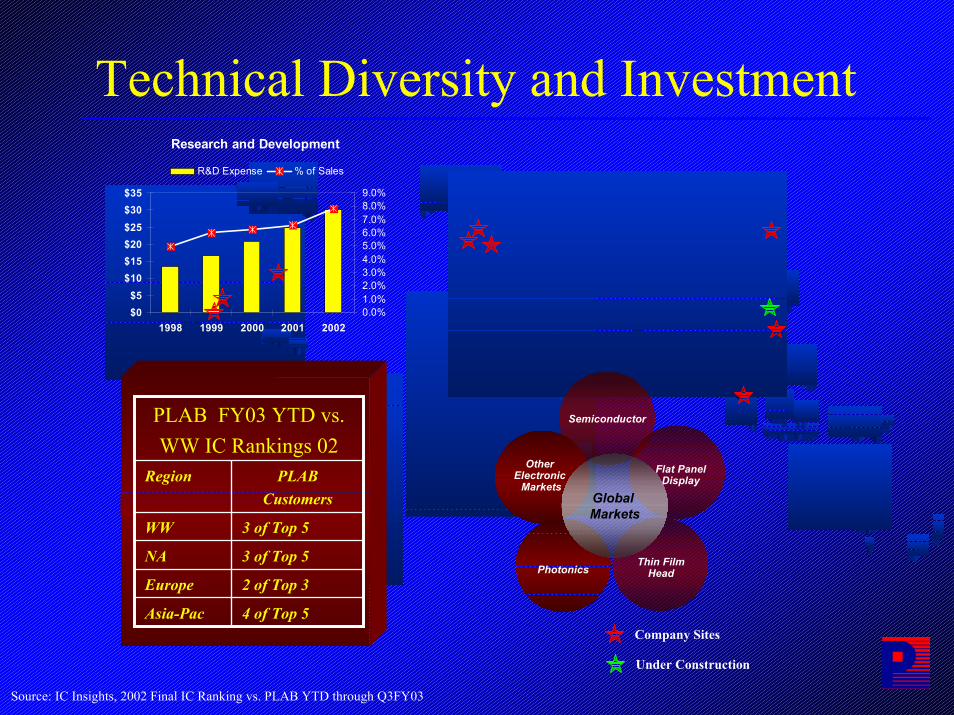
Technical Diversity and Investment
PLAB FY03 YTD vs. WW IC Rankings 02
4 of Top 5Asia-Pac
2 of Top 3Europe
3 of Top 5NA
3 of Top 5WW
PLABCustomers
Region
Thin FilmHead
Semiconductor
Photonics
Other Electronic
MarketsFlat Panel
DisplayGlobal Markets
Research and Development
$0$5
$10$15$20$25$30$35
1998 1999 2000 2001 20020.0%1.0%2.0%3.0%4.0%5.0%6.0%7.0%8.0%9.0%
R&D Expense % of Sales
Company Sites
Under Construction
Source: IC Insights, 2002 Final IC Ranking vs. PLAB YTD through Q3FY03
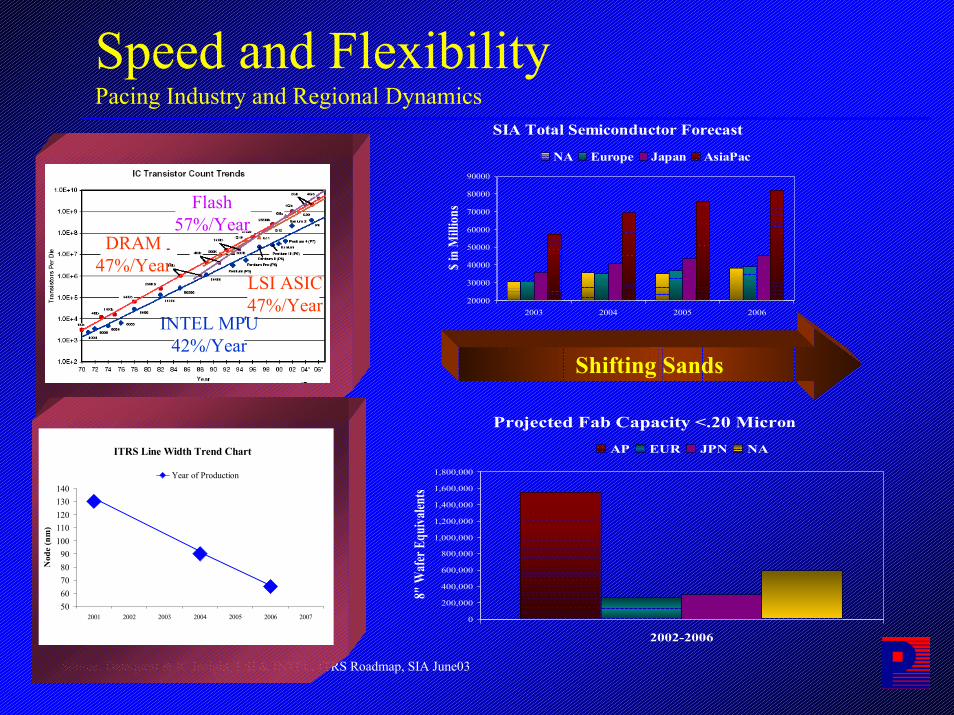
Speed and Flexibility Pacing Industry and Regional Dynamics
Source: Dataquest & IC Insight, LSI & INTEL, ITRS Roadmap, SIA June03
DRAM47%/Year
INTEL MPU42%/Year
Flash57%/Year
LSI ASIC47%/Year
SIA Total Semiconductor Forecast
20000
30000
40000
50000
60000
70000
80000
90000
2003 2004 2005 2006
$ in
Mill
ions
NA Europe Japan AsiaPac
Projected Fab Capacity <.20 Micron
0
200,000
400,000
600,000
800,000
1,000,000
1,200,000
1,400,000
1,600,000
1,800,000
2002-2006
8" W
afer
Equ
ivalen
ts
AP EUR JPN NAITRS Line Width Trend Chart
5060708090
100110120130140
2001 2002 2003 2004 2005 2006 2007
Nod
e (n
m)
Year of Production
Shifting Sands
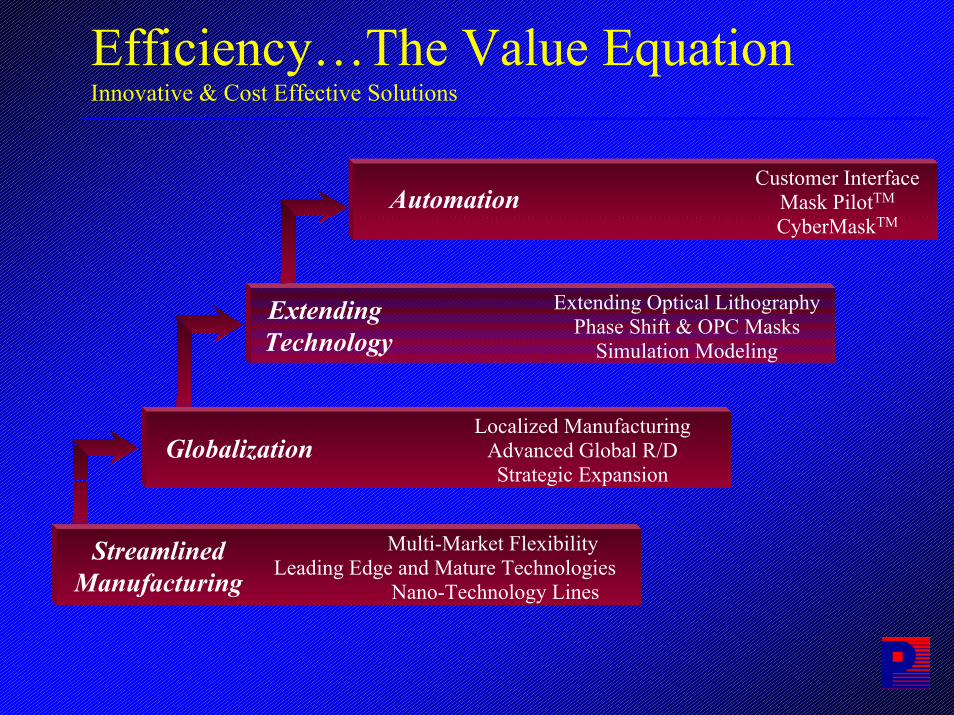
Efficiency…The Value EquationInnovative & Cost Effective Solutions
Extending Optical LithographyPhase Shift & OPC Masks
Simulation Modeling
Extending Technology
Multi-Market FlexibilityLeading Edge and Mature Technologies
Nano-Technology Lines
StreamlinedManufacturing
Customer InterfaceMask PilotTM
CyberMaskTMAutomation
Localized ManufacturingAdvanced Global R/DStrategic Expansion
Globalization

Global OverviewRegional Highlights
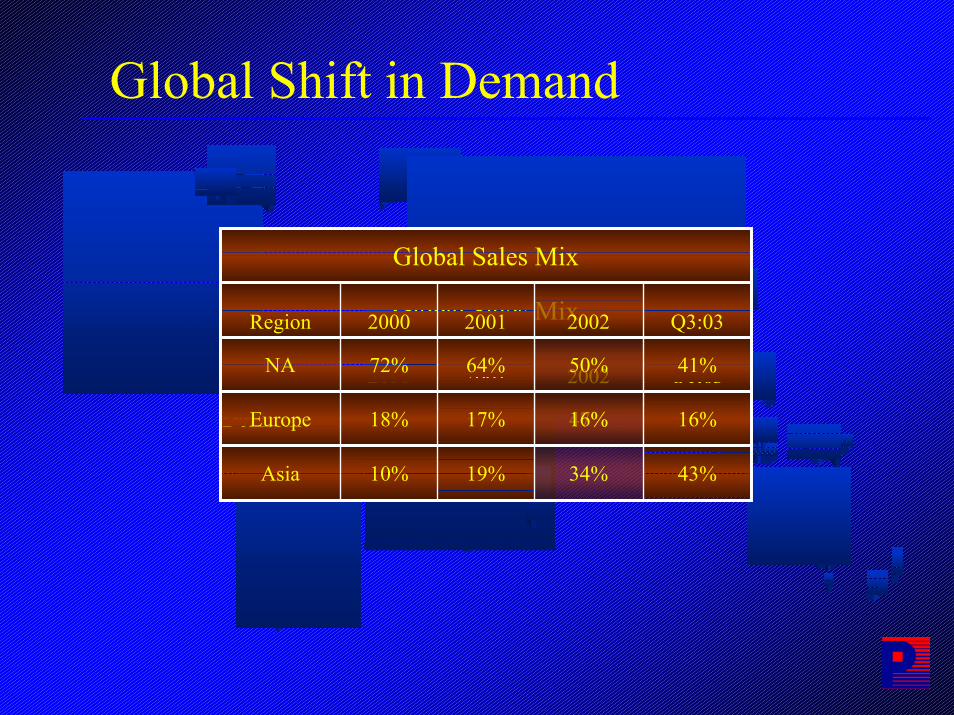
Global Shift in Demand
10%
70%
2000 Q1:0320022001Region
40%47%69% Domestic
43%34%19%Asia
Global Sales Mix
18%
72%
2000 Q3:0320022001Region
41%50%64% NA
16%16%17%Europe
Global Sales Mix
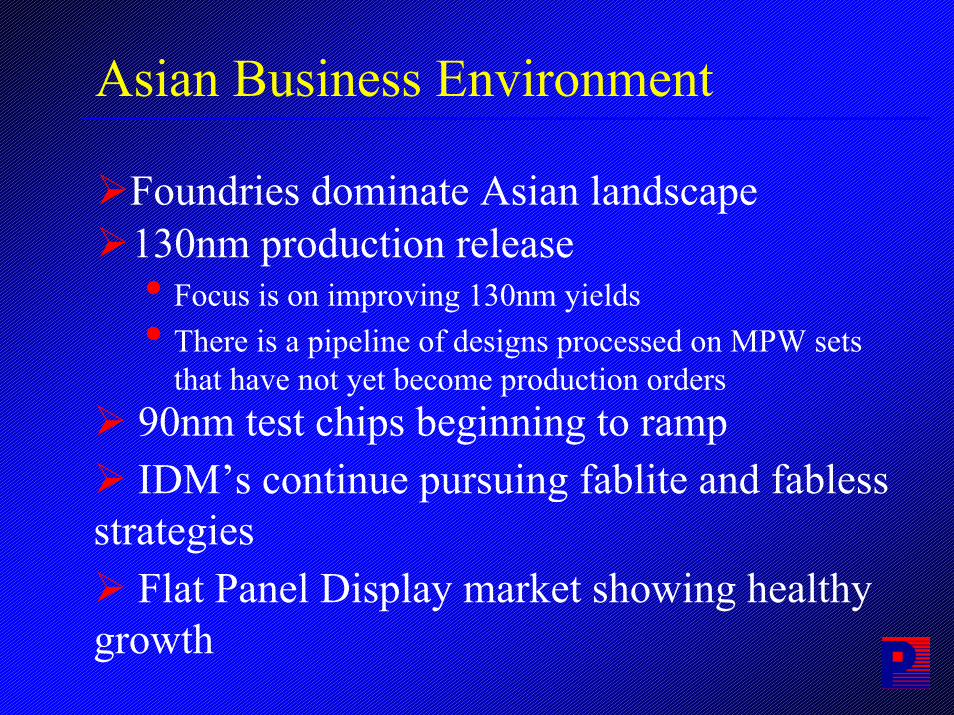
Asian Business Environment
Foundries dominate Asian landscape130nm production release• Focus is on improving 130nm yields• There is a pipeline of designs processed on MPW sets
that have not yet become production orders90nm test chips beginning to rampIDM’s continue pursuing fablite and fabless
strategiesFlat Panel Display market showing healthy
growth
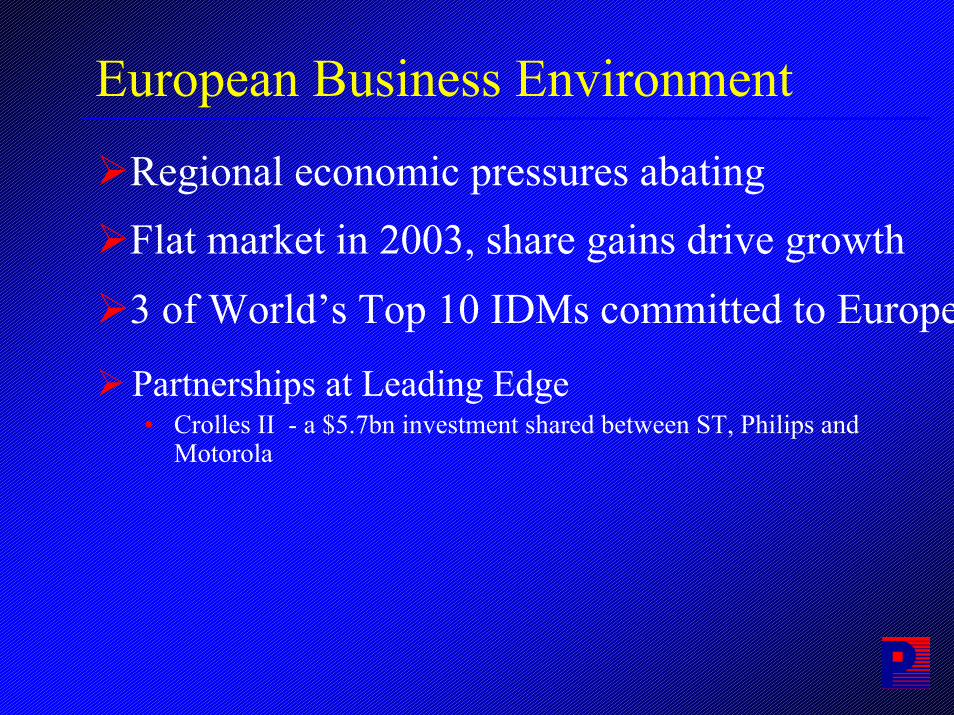
European Business Environment
Regional economic pressures abatingFlat market in 2003, share gains drive growth
Partnerships at Leading Edge• Crolles II - a $5.7bn investment shared between ST, Philips and
Motorola
3 of World’s Top 10 IDMs committed to Europe
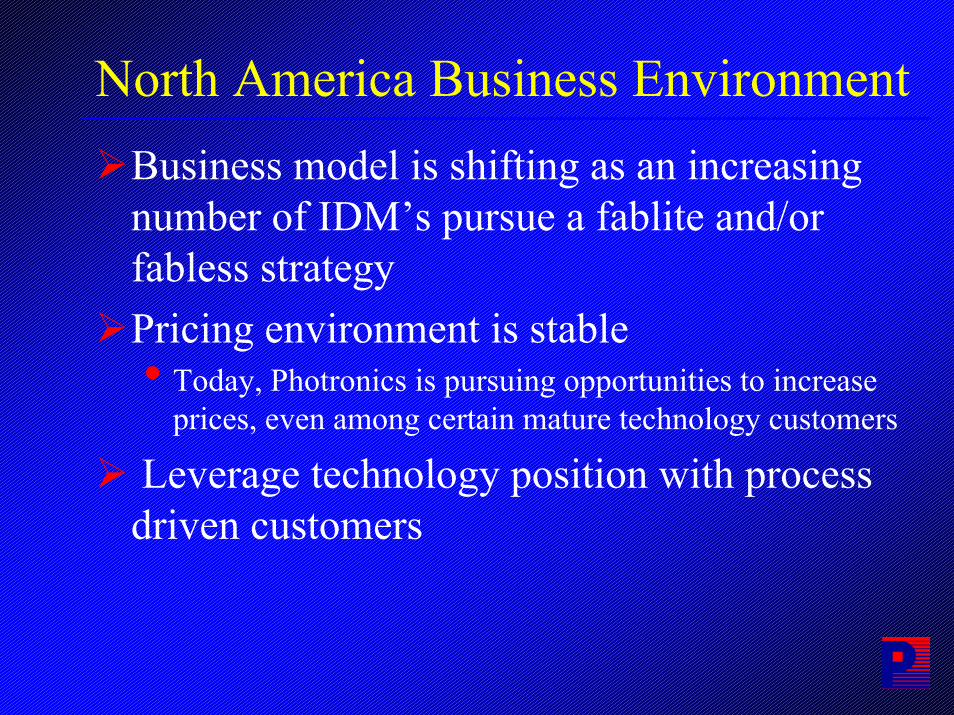
North America Business EnvironmentBusiness model is shifting as an increasing number of IDM’s pursue a fablite and/or fabless strategy Pricing environment is stable• Today, Photronics is pursuing opportunities to increase
prices, even among certain mature technology customers
Leverage technology position with process driven customers

Technology Update
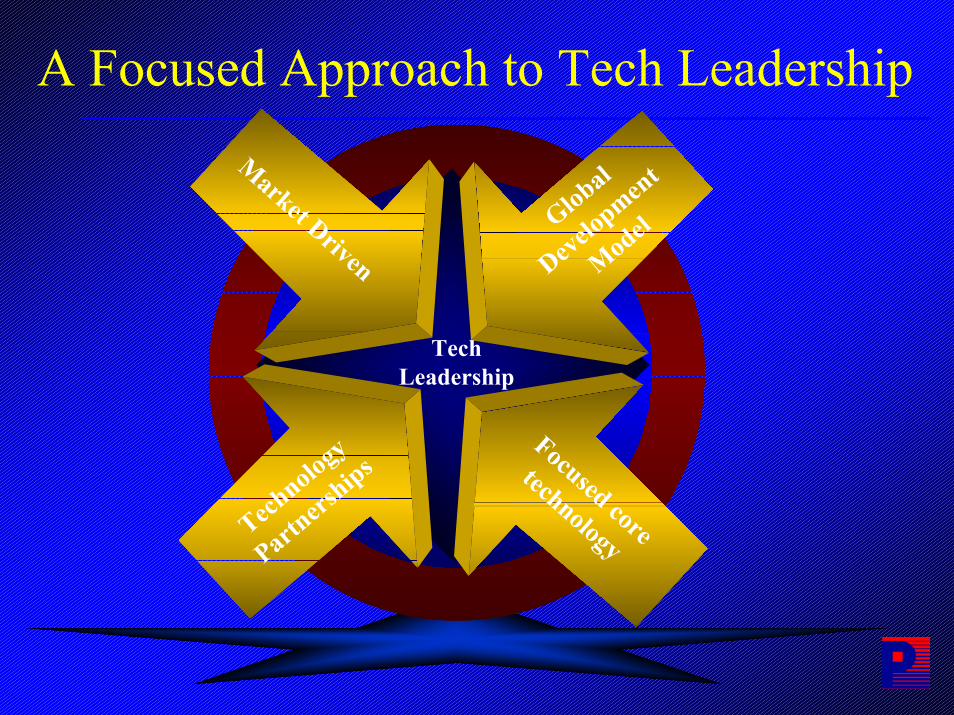
A Focused Approach to Tech Leadership
Technology
Partners
hips
Global
Development
Model
Focused core
technology
Market Driven
Tech Leadership
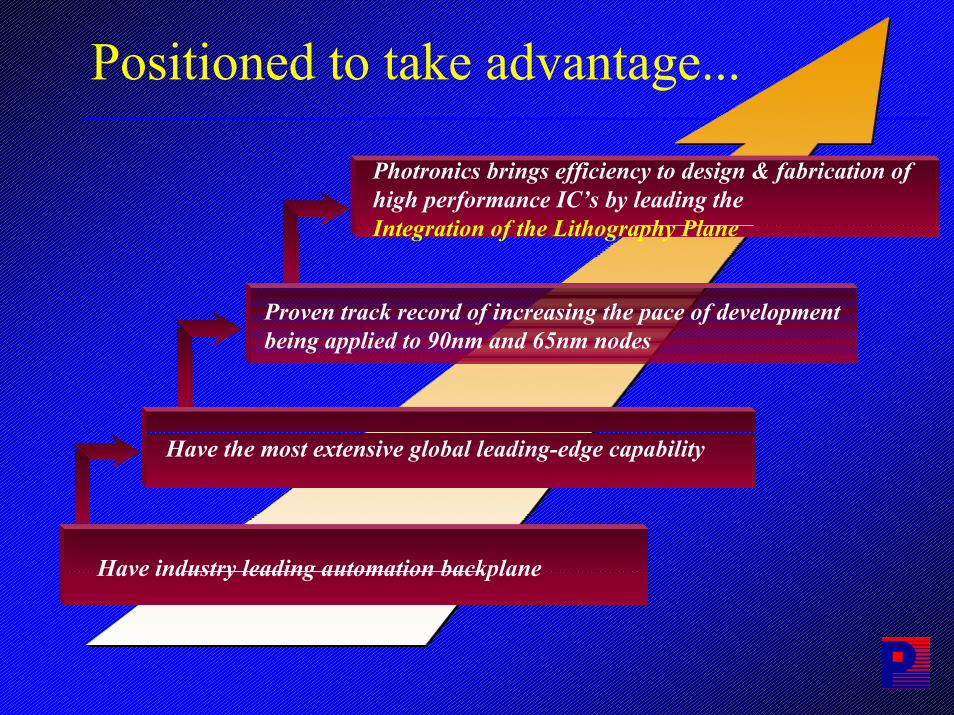
Positioned to take advantage...
Photronics brings efficiency to design & fabrication ofhigh performance IC’s by leading theIntegration of the Lithography Plane
Proven track record of increasing the pace of developmentbeing applied to 90nm and 65nm nodes
Have the most extensive global leading-edge capability
Have industry leading automation backplane

Financial Highlights
Photronics Financial HighlightsBenefit from technology driven demandMultiple sources of margin leverage• Improving mix shift & stable pricing• Global presence
Increased global market shareImproved liquidityStrategically scaled infrastructure
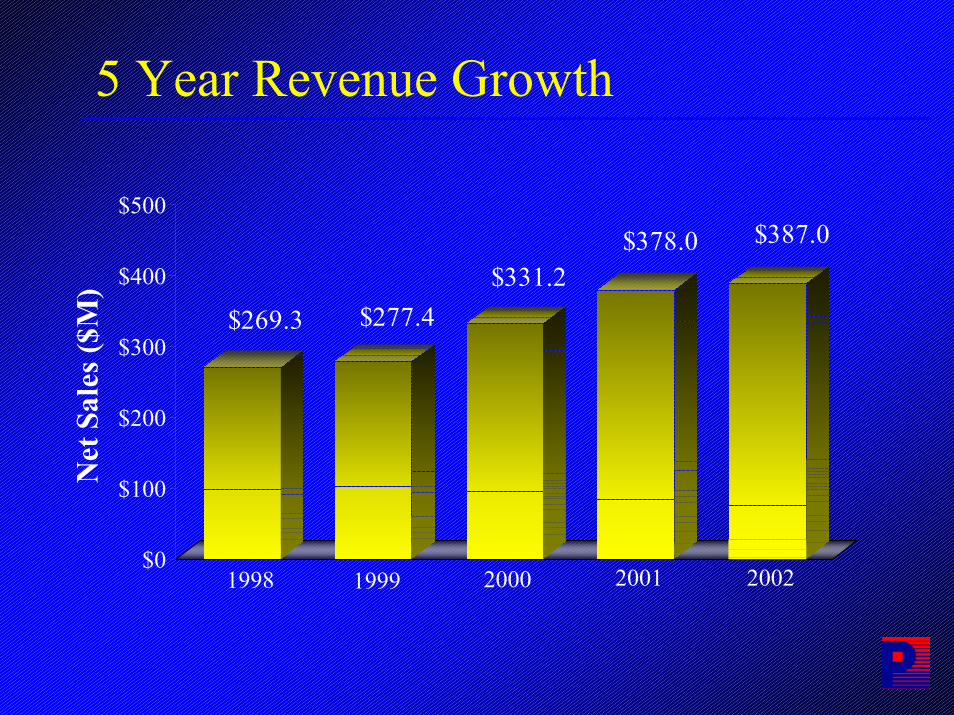
5 Year Revenue Growth
$269.3 $277.4$331.2
$378.0 $387.0
$0
$100
$200
$300
$400
$500
Net
Sal
es ($
M)
1998 1999 2000 2001 2002
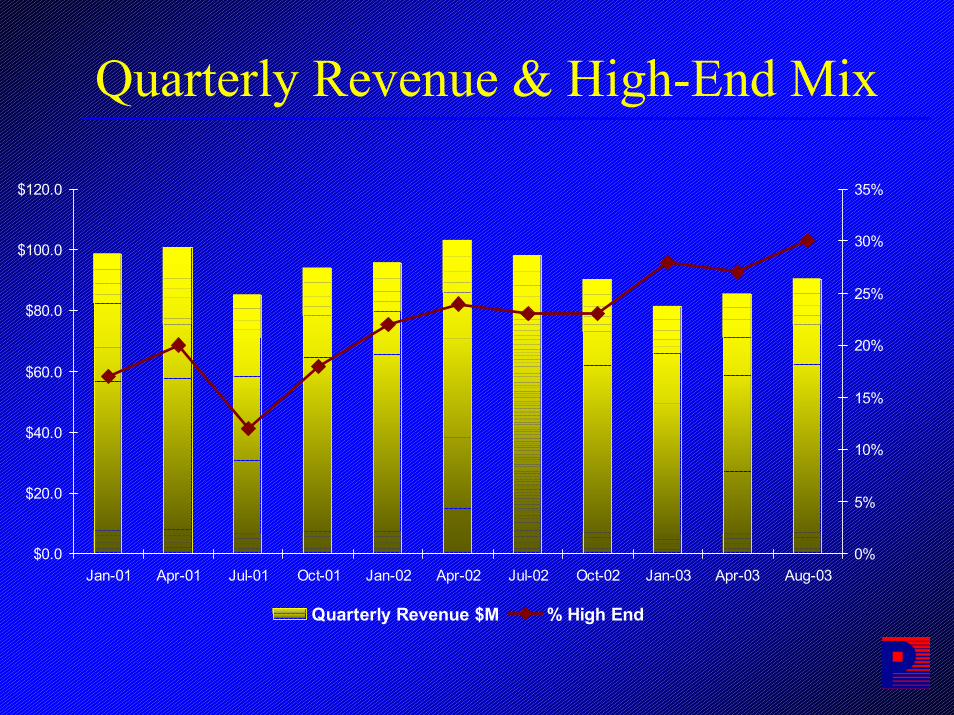
Quarterly Revenue & High-End Mix
$0.0
$20.0
$40.0
$60.0
$80.0
$100.0
$120.0
Jan-01 Apr-01 Jul-01 Oct-01 Jan-02 Apr-02 Jul-02 Oct-02 Jan-03 Apr-03 Aug-030%
5%
10%
15%
20%
25%
30%
35%
Quarterly Revenue $M % High End
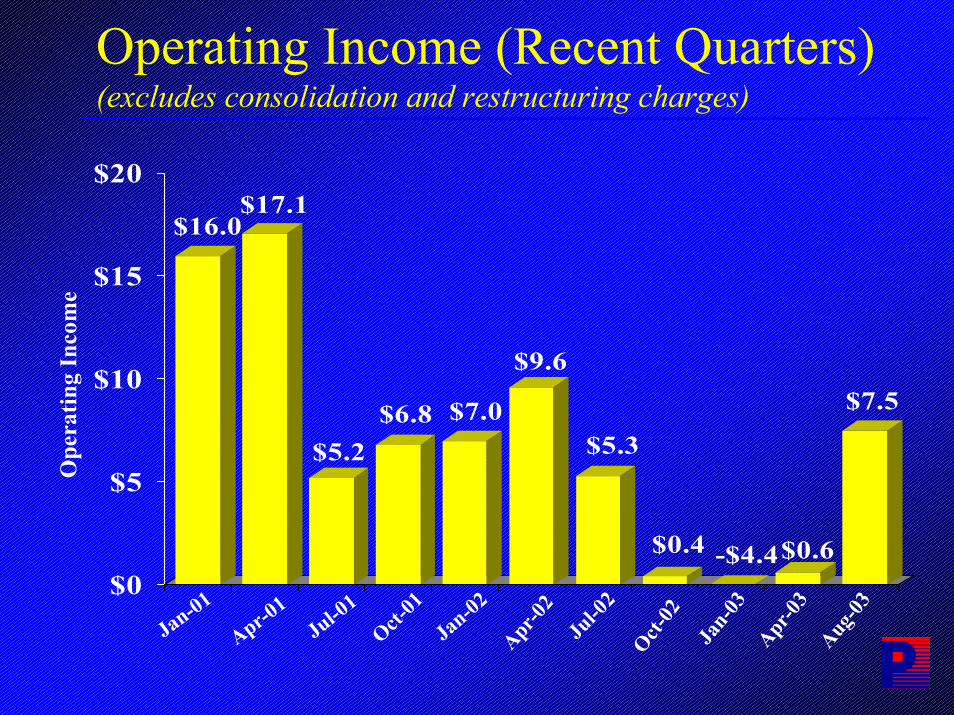
Operating Income (Recent Quarters)(excludes consolidation and restructuring charges)
$16.0 $17.1
$5.2 $6.8 $7.0
$9.6
$5.3
$0.4 -$4.4$0.6
$7.5
$0
$5
$10
$15
$20
Jan-01
Apr-01
Jul-01
Jan-02
Jan-
03
Oct-01
Jul-0
2
Apr-02
Oct-02
Ope
ratin
g In
com
e
Apr-03
Aug-03
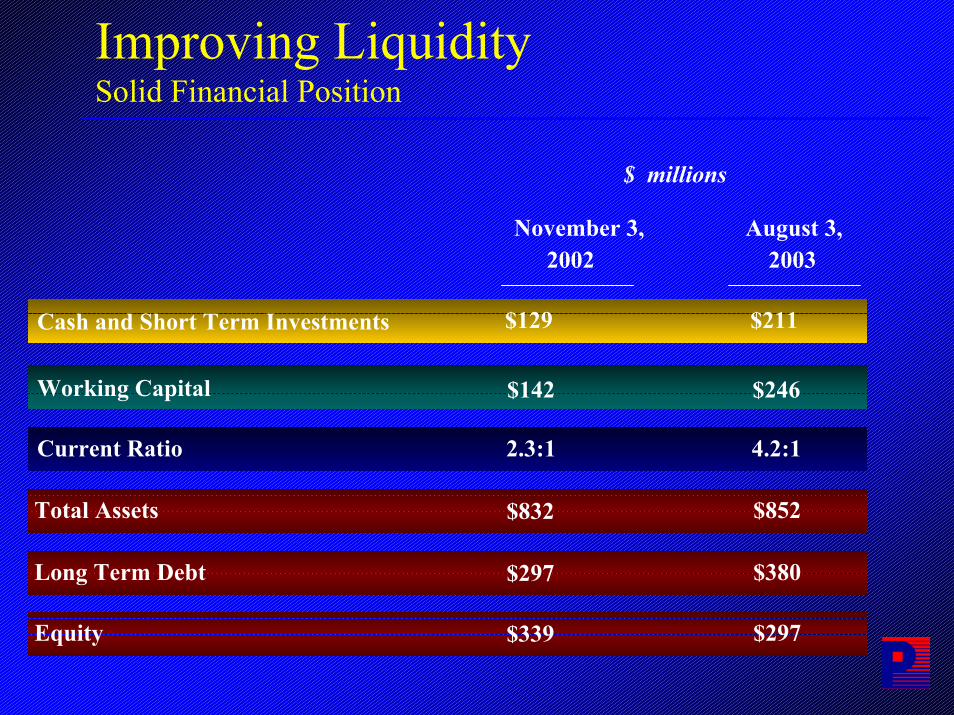
Improving Liquidity Solid Financial Position
$ millions
November 3, August 3,2002 2003
Cash and Short Term Investments $129 $211
Working Capital $142 $246
Current Ratio 2.3:1 4.2:1
Total Assets $852$832
Long Term Debt $380$297
Equity $297$339
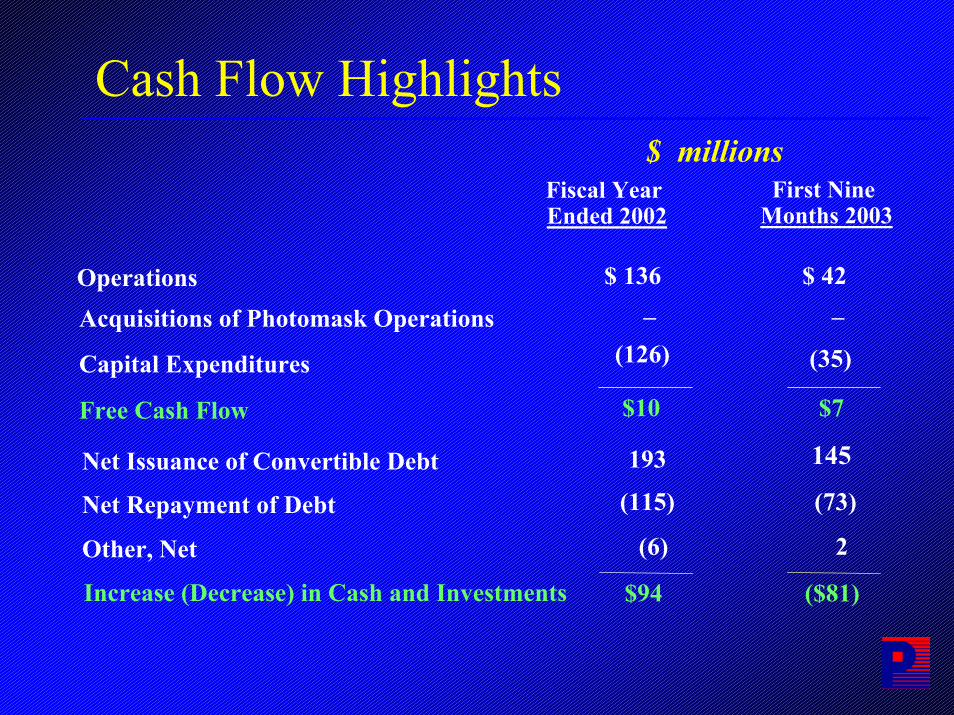
Cash Flow Highlights$ millions
Fiscal YearEnded 2002
Capital Expenditures
Free Cash Flow
(35)
$7
Operations $ 42$ 136
(126)Acquisitions of Photomask Operations ––
$10
Net Issuance of Convertible Debt
Net Repayment of Debt
Other, Net
Increase (Decrease) in Cash and Investments
(73)
2
($81)
193
(115)
(6)
$94
145
First Nine Months 2003
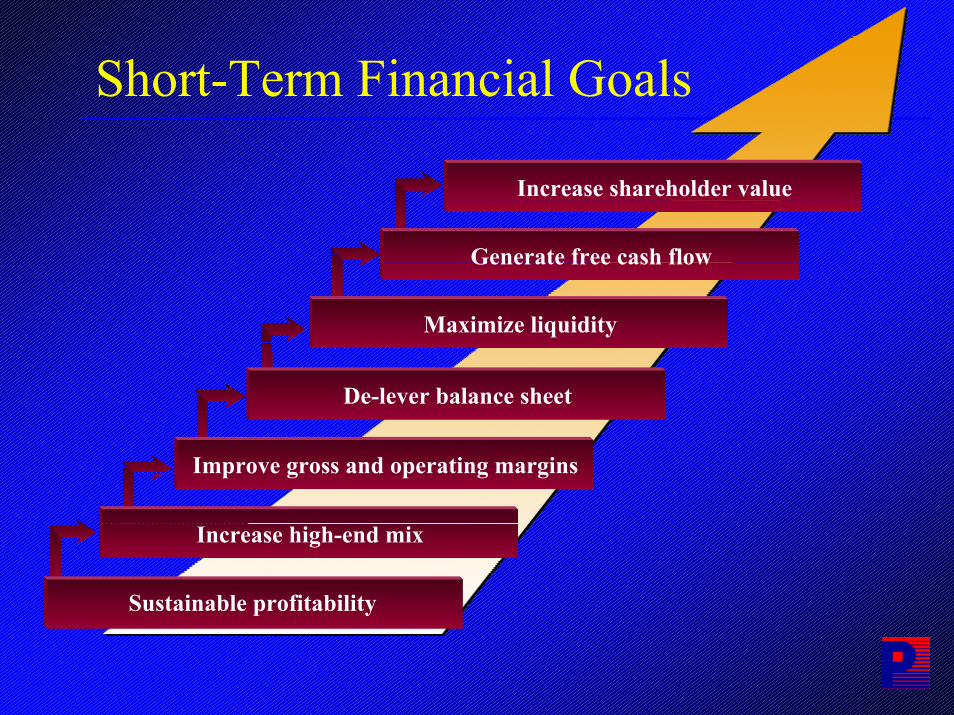
Short-Term Financial Goals
Increase shareholder value
Maximize liquidity
Generate free cash flow
De-lever balance sheet
Improve gross and operating margins
Increase high-end mix
Sustainable profitability

Long-Term Financial Goals
Gross Margin 40%+
Operating Margin 20%+
Annual Revenue Growth 10%-15%
Return on Assets 10%
Debt-to-Equity 25%
Free Cash flow 25mn

Summary
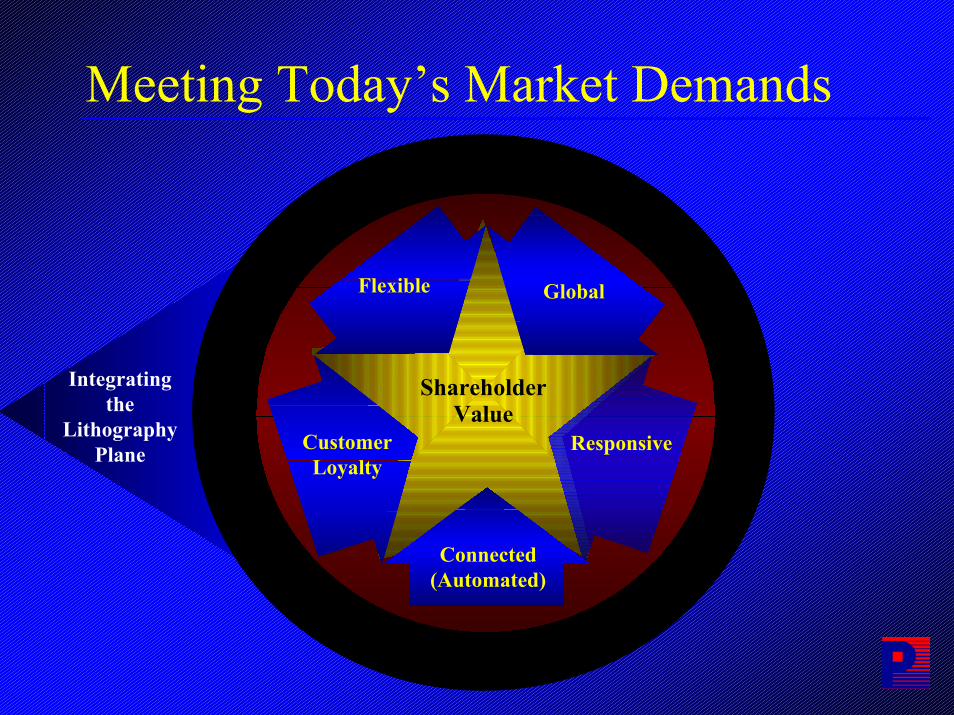
Meeting Today’s Market Demands
ShareholderValue
Global
CustomerLoyalty
Responsive
Connected(Automated)
Flexible
Integrating the
Lithography Plane

SG Cowen Technology ConferenceWednesday, September 3, 2003