Embed Size (px)
Citation preview
Catalogue Number: SIPI.2015/August Released: 30th September 2015
SEYCHELLES INDUSTRIAL PRODUCTION INDEX (SIPI) August 2015
CONTENTS
1. Introduction
2. Results and Highlights
3. Tables and Charts
4. Concepts, Sources and Methods
5. Future Improvements
6. Next Release
7. Contact Us
TABLES
Table 1 Seychelles Industrial Production Index (SIPI) - Index numbers and percentage changes
Table 2 Seychelles Industrial Production Index (SIPI) - by Manufacturing Sector
CHARTS
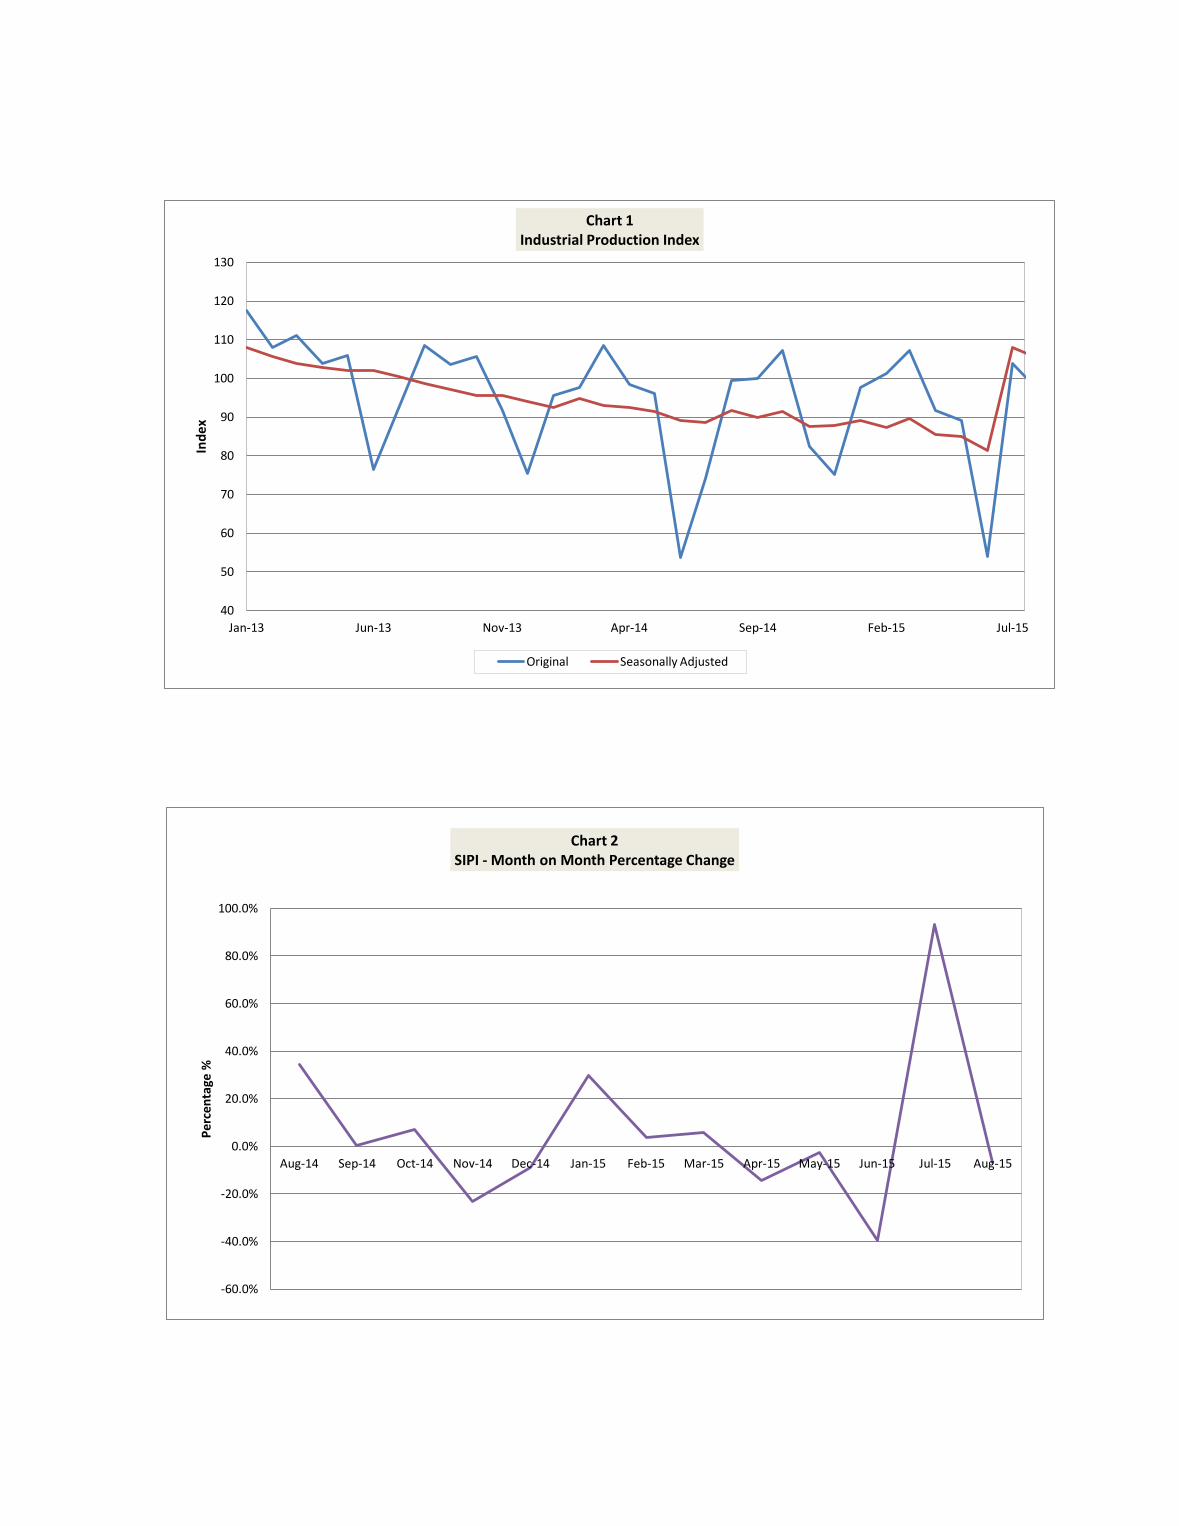
Chart 1 Seychelles Industrial Production Index (SIPI) - Index numbers
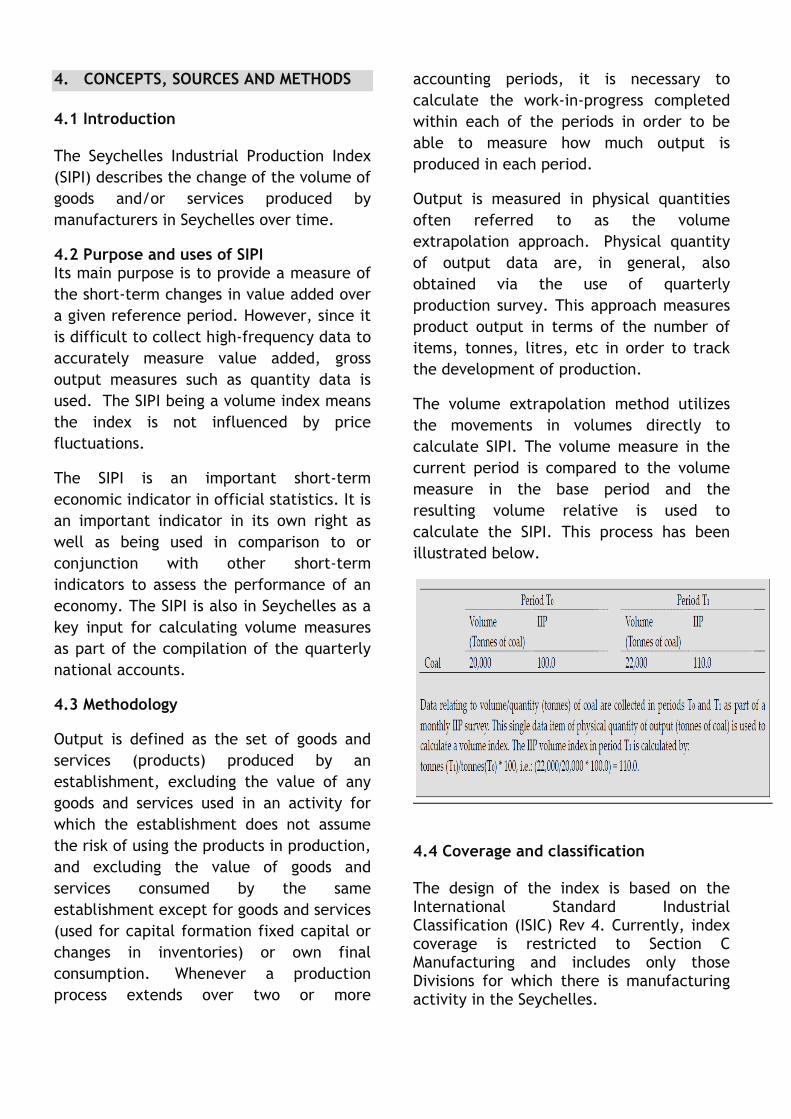
Chart 2 Seychelles Industrial Production Index (SIPI) - Month on month percentage changes
The Seychelles Industrial Production Index (SIPI) decreased by 6.8% in August 2015 compared to July
2015. On a year on year comparison, the index decreased by -2.8% from August 2014.

1. INTRODUCTION
This bulletin presents a monthly measure of
production from the perspective of the
producer in the manufacturing industry.
Concepts, sources and methods are given in
Part 4.
Figures for January 2013 to August 2015 with
2013 as the reference period are presented
in this bulletin.
Table 1 presents the monthly SIPI index
numbers and percentage changes for the
total SIPI. Table 2 present the index number
by manufacturing sector under the ISIC
classification.
Charts 1 and 2 present index numbers and
month on month percentage changes
respectively. Chart 1 now includes a
seasonally adjusted series. Seasonal
adjustment removes any seasonal effects
from the original time series data.
2. RESULTS AND HIGHLIGHTS
The total Seychelles Industrial Production
Index in August 2015 stood at 96.8 compared
to 103.9 in July 2015. This represents an
decrease of -6.8%. The largest increase over
this period was recorded in Electric Power
Generation, Transmission and Distribution
(8.6%).
The largest fall over this period was in the
Manufacture of Tobacco Products (-24.5%).
The year on year movement from August
2014 to August 2015 represents an increase
of (-39.5%).
The largest fall over this period was in the
Manufacture of Tobacco Products (-22.1%).
3. TABLES CHARTS
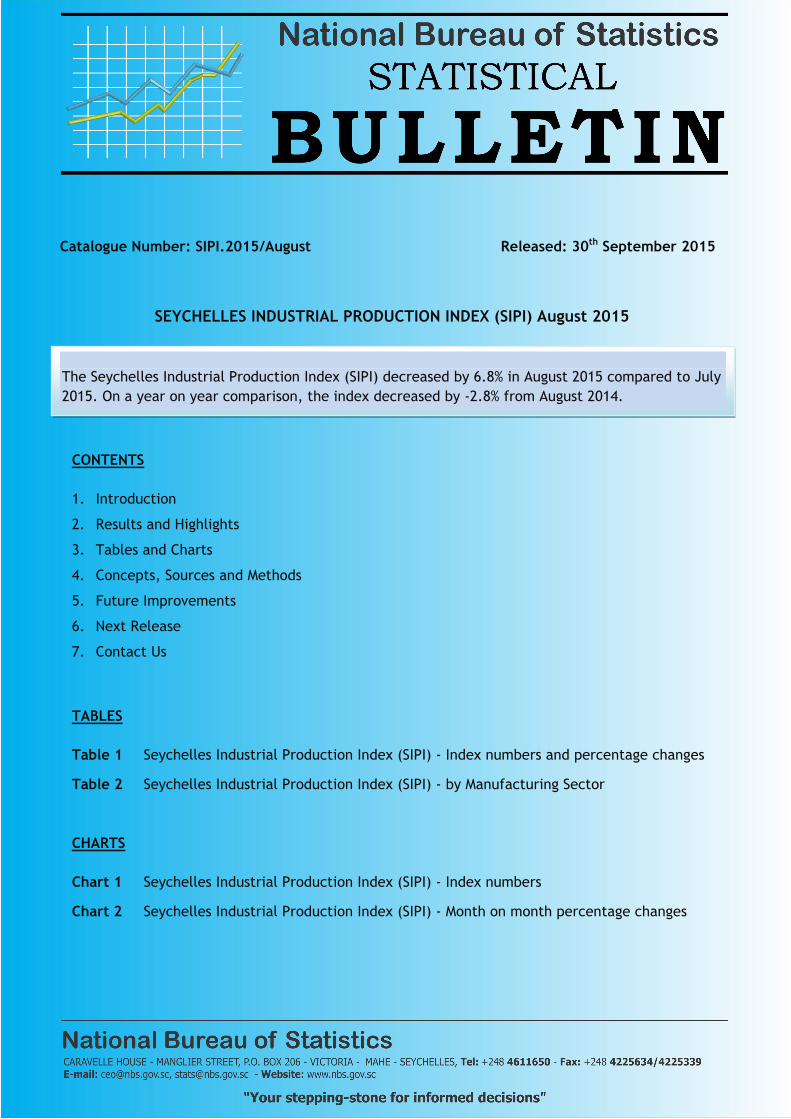
Table 1: Seychelles Industrial Production Index
Year /
Month
Monthly
index
Month on month
% change
Year on year %
change
Quarterly
Index
Quarterly %
change
2014
Jan 95.7 27.0% -18.5%
Feb 97.7 2.1% -9.5%
Mar 108.5 11.1% -2.3% 100.6 10.7%
Apr 98.3 -9.4% -5.2%
May 96.2 -2.2% -9.3%
Jun 53.6 -44.3% -29.9% 82.7 -17.8%
Jul 74.1 38.3% -19.5%
Aug 99.6 34.3% -8.3%
Sep 100.0 0.4% -3.6% 91.2 10.3%
Oct 107.3 7.3% 1.4%
Nov 82.4 -23.1% -10.0%
Dec 75.2 -8.8% -0.3% 88.3 -3.2%
2015
Jan 97.7 29.9% 2.1%
Feb 101.2 3.6% 3.6%
Mar 107.1 5.9% -1.3% 102.0 15.5%
Apr 91.7 -14.4% -6.7%
May 89.2 -2.7% -7.3%
Jun 53.8 -39.6% 0.4% 78.2 -23.3%
Jul 103.9 93.1% 40.2%
Aug 96.8 -6.8% -2.8%
(1) Year on year % change is calculated as the percentage change from the same month of the previous year
(2) Quarterly index is calculated as the average of the monthly indexes for that quarter
(3) Reference base is 2013 = 100
Source: National Bureau of Statistics
Notes:
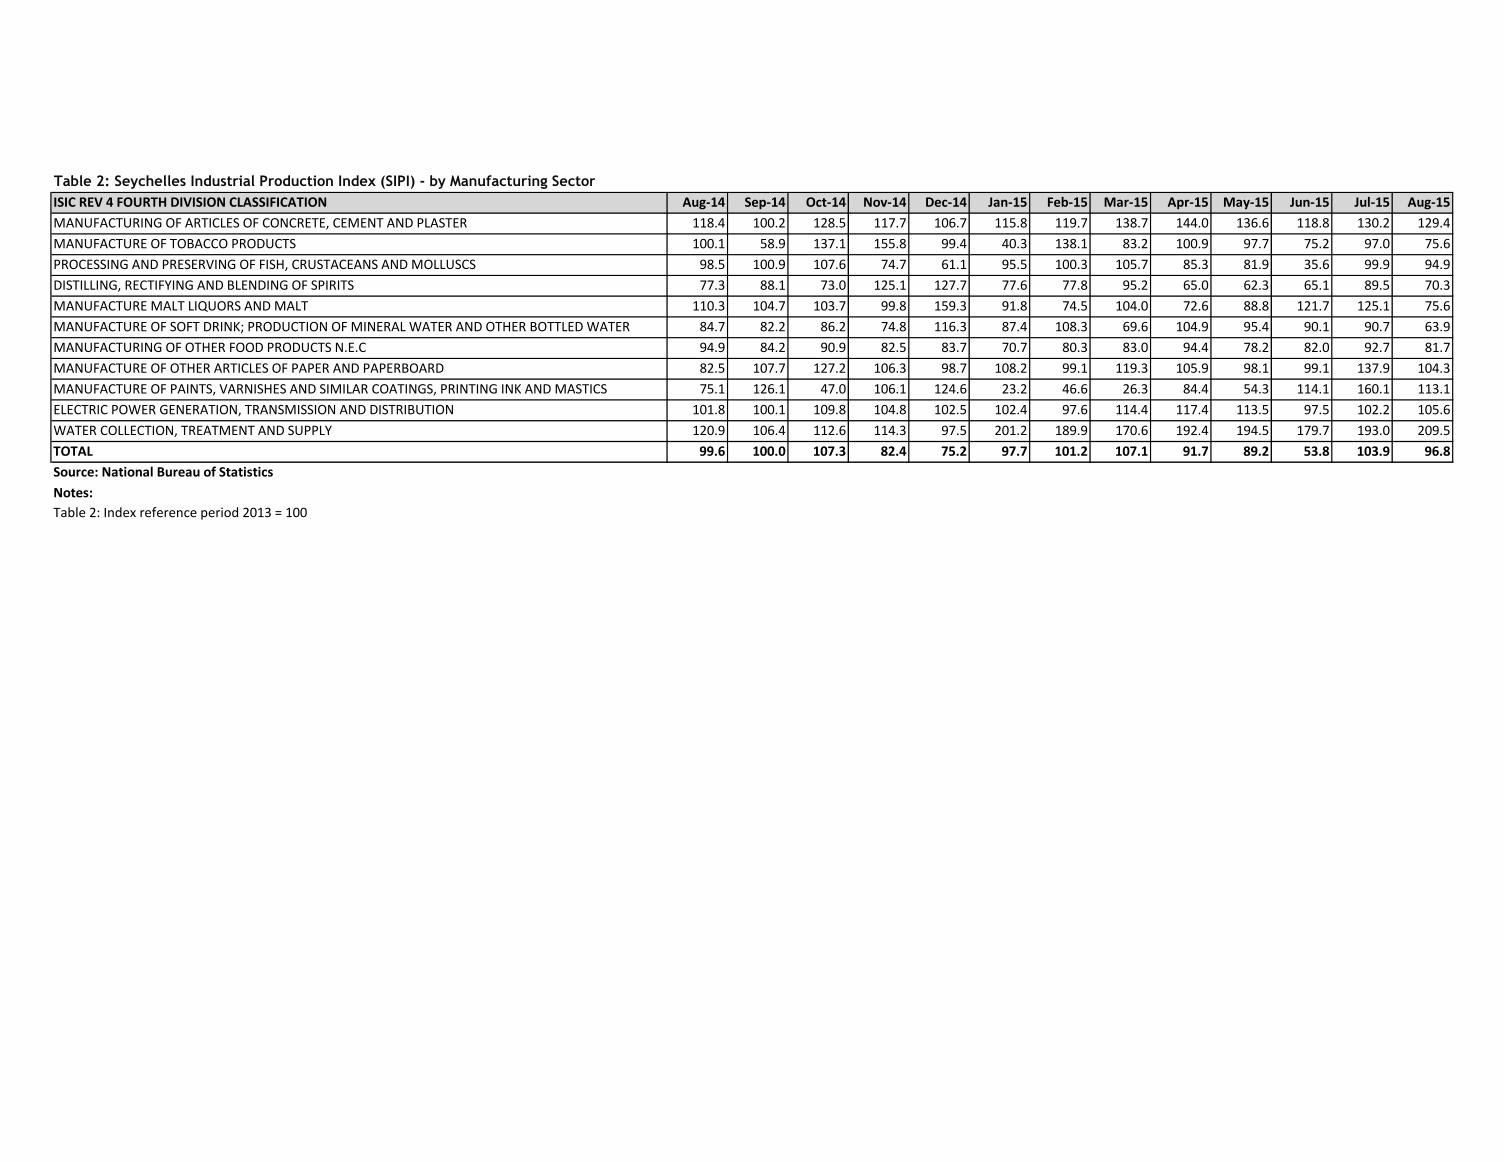
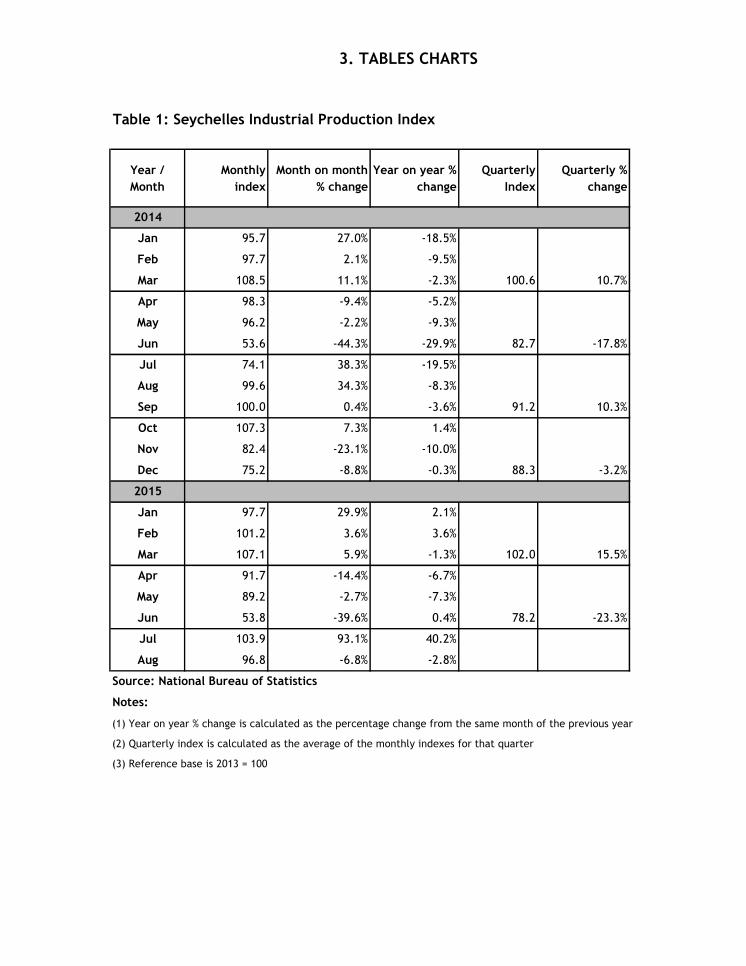
Table 2: Seychelles Industrial Production Index (SIPI) - by Manufacturing Sector
ISIC REV 4 FOURTH DIVISION CLASSIFICATION Aug-14 Sep-14 Oct-14 Nov-14 Dec-14 Jan-15 Feb-15 Mar-15 Apr-15 May-15 Jun-15 Jul-15 Aug-15
MANUFACTURING OF ARTICLES OF CONCRETE, CEMENT AND PLASTER 118.4 100.2 128.5 117.7 106.7 115.8 119.7 138.7 144.0 136.6 118.8 130.2 129.4
MANUFACTURE OF TOBACCO PRODUCTS 100.1 58.9 137.1 155.8 99.4 40.3 138.1 83.2 100.9 97.7 75.2 97.0 75.6
PROCESSING AND PRESERVING OF FISH, CRUSTACEANS AND MOLLUSCS 98.5 100.9 107.6 74.7 61.1 95.5 100.3 105.7 85.3 81.9 35.6 99.9 94.9
DISTILLING, RECTIFYING AND BLENDING OF SPIRITS 77.3 88.1 73.0 125.1 127.7 77.6 77.8 95.2 65.0 62.3 65.1 89.5 70.3
MANUFACTURE MALT LIQUORS AND MALT 110.3 104.7 103.7 99.8 159.3 91.8 74.5 104.0 72.6 88.8 121.7 125.1 75.6
MANUFACTURE OF SOFT DRINK; PRODUCTION OF MINERAL WATER AND OTHER BOTTLED WATER 84.7 82.2 86.2 74.8 116.3 87.4 108.3 69.6 104.9 95.4 90.1 90.7 63.9
MANUFACTURING OF OTHER FOOD PRODUCTS N.E.C 94.9 84.2 90.9 82.5 83.7 70.7 80.3 83.0 94.4 78.2 82.0 92.7 81.7
MANUFACTURE OF OTHER ARTICLES OF PAPER AND PAPERBOARD 82.5 107.7 127.2 106.3 98.7 108.2 99.1 119.3 105.9 98.1 99.1 137.9 104.3
MANUFACTURE OF PAINTS, VARNISHES AND SIMILAR COATINGS, PRINTING INK AND MASTICS 75.1 126.1 47.0 106.1 124.6 23.2 46.6 26.3 84.4 54.3 114.1 160.1 113.1
ELECTRIC POWER GENERATION, TRANSMISSION AND DISTRIBUTION 101.8 100.1 109.8 104.8 102.5 102.4 97.6 114.4 117.4 113.5 97.5 102.2 105.6
WATER COLLECTION, TREATMENT AND SUPPLY 120.9 106.4 112.6 114.3 97.5 201.2 189.9 170.6 192.4 194.5 179.7 193.0 209.5
TOTAL 99.6 100.0 107.3 82.4 75.2 97.7 101.2 107.1 91.7 89.2 53.8 103.9 96.8
Source: National Bureau of Statistics
Notes:
Table 2: Index reference period 2013 = 100
-60.0%
-40.0%
-20.0%
0.0%
20.0%
40.0%
60.0%
80.0%
100.0%
Aug-14 Sep-14 Oct-14 Nov-14 Dec-14 Jan-15 Feb-15 Mar-15 Apr-15 May-15 Jun-15 Jul-15 Aug-15
Pe
rcen
tage
%
Chart 2 SIPI - Month on Month Percentage Change
40
50
60
70
80
90
100
110
120
130
Jan-13 Jun-13 Nov-13 Apr-14 Sep-14 Feb-15 Jul-15
Ind
ex
Chart 1 Industrial Production Index
Original Seasonally Adjusted
4. CONCEPTS, SOURCES AND METHODS
4.1 Introduction The Seychelles Industrial Production Index
(SIPI) describes the change of the volume of
goods and/or services produced by
manufacturers in Seychelles over time.
4.2 Purpose and uses of SIPI Its main purpose is to provide a measure of
the short-term changes in value added over
a given reference period. However, since it
is difficult to collect high-frequency data to
accurately measure value added, gross
output measures such as quantity data is
used. The SIPI being a volume index means
the index is not influenced by price
fluctuations.
The SIPI is an important short-term
economic indicator in official statistics. It is
an important indicator in its own right as
well as being used in comparison to or
conjunction with other short-term
indicators to assess the performance of an
economy. The SIPI is also in Seychelles as a
key input for calculating volume measures
as part of the compilation of the quarterly
national accounts.
4.3 Methodology
Output is defined as the set of goods and
services (products) produced by an
establishment, excluding the value of any
goods and services used in an activity for
which the establishment does not assume
the risk of using the products in production,
and excluding the value of goods and
services consumed by the same
establishment except for goods and services
(used for capital formation fixed capital or
changes in inventories) or own final
consumption. Whenever a production
process extends over two or more
accounting periods, it is necessary to
calculate the work-in-progress completed
within each of the periods in order to be
able to measure how much output is
produced in each period.
Output is measured in physical quantities
often referred to as the volume
extrapolation approach. Physical quantity
of output data are, in general, also
obtained via the use of quarterly
production survey. This approach measures
product output in terms of the number of
items, tonnes, litres, etc in order to track
the development of production.
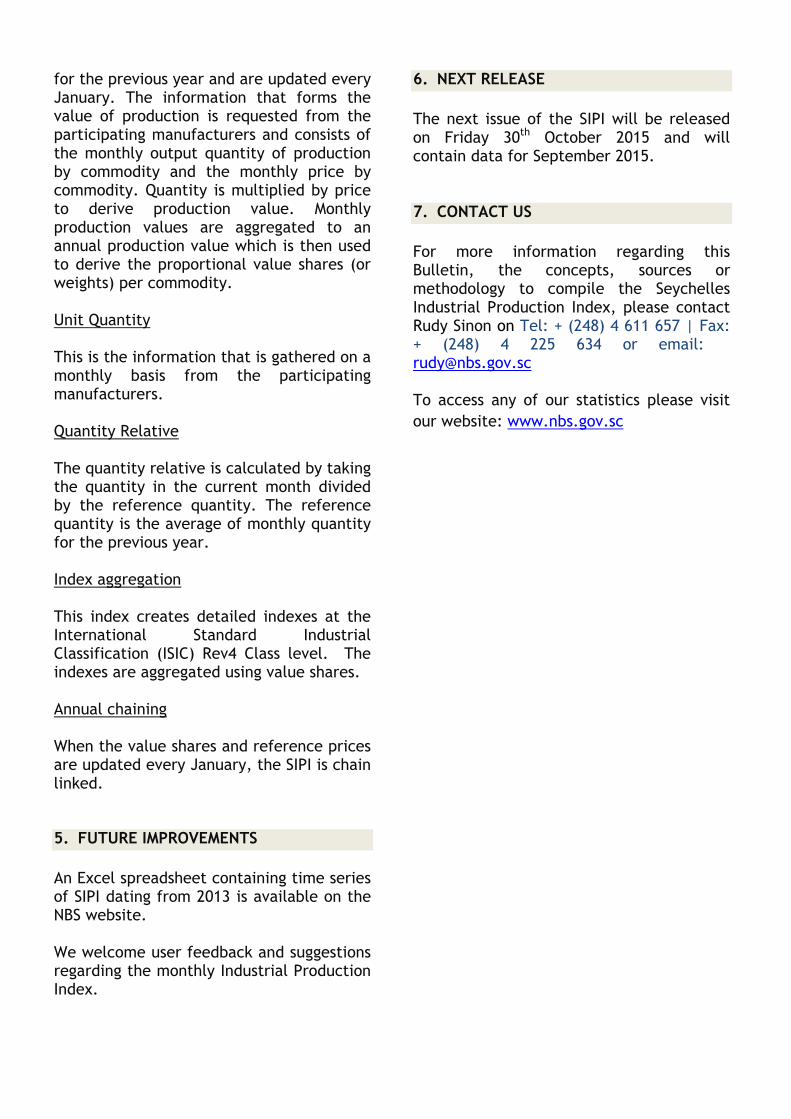
The volume extrapolation method utilizes
the movements in volumes directly to
calculate SIPI. The volume measure in the
current period is compared to the volume
measure in the base period and the
resulting volume relative is used to
calculate the SIPI. This process has been
illustrated below.
4.4 Coverage and classification The design of the index is based on the International Standard Industrial Classification (ISIC) Rev 4. Currently, index coverage is restricted to Section C Manufacturing and includes only those Divisions for which there is manufacturing activity in the Seychelles.

These are:
Manufacture of food products;
Manufacture of beverages;
Manufacture of tobacco products;
Manufacture of paper and paper products;
Manufacture of chemicals and chemical products;
Manufacture of other non-metallic mineral products.
4.5. Data source
The information used in the compilation of
the index is gathered from a monthly
survey of selected large businesses in the
manufacturing industry and data from
Production Indicators.
4.6 Production indexes Production index numbers are compiled from collected quantity observations through time; their significance lies in a series of index numbers which compare volumes between a particular period and a reference base. For an index to provide information on production changes, at least two index numbers from the same series need to be available, and these index numbers must relate to the same basket of goods. Movements in indexes from one period to any other period can be expressed as either changes in index points or percentage changes. The following example illustrates these calculations for SIPI Total between June 2013 and December 2013. The same procedure is applicable for any two periods. Index numbers
December 2013 70.5
Less June 2013 73.7
Equals change in index points
-3.2
Percentage change = -3.2/ 73.7x 100 = -4.3%
The SIPI attempts to measure the actual level of change in quantities but is limited to the manufacturer from one period to another. 4.7 Calculation of the SIPI
Concept There are a number of different formulas which can be used to calculate indexes. The SIPI is calculated using the Laspeyres formula, which is considered acceptable by international standards. The Laspeyres method measures percentage change in the production value of a set of products whose quantities are fixed in an earlier period. The Laspeyres formula is represented as follows:
Value shares (weights) Weights are a key element in the construction of any index as they provide a measure of the relative importance of each index component. In the case of the SIPI, weights reflect the relative importance of a product, product group or industry within the overall scope of industrial production. In practice, when compiling the SIPI, the first process is to derive a set of value shares or weights which will be used to combine quantity movements. Value shares are derived from the value of production
for the previous year and are updated every January. The information that forms the value of production is requested from the participating manufacturers and consists of the monthly output quantity of production by commodity and the monthly price by commodity. Quantity is multiplied by price to derive production value. Monthly production values are aggregated to an annual production value which is then used to derive the proportional value shares (or weights) per commodity. Unit Quantity This is the information that is gathered on a monthly basis from the participating manufacturers. Quantity Relative The quantity relative is calculated by taking the quantity in the current month divided by the reference quantity. The reference quantity is the average of monthly quantity for the previous year. Index aggregation This index creates detailed indexes at the International Standard Industrial Classification (ISIC) Rev4 Class level. The indexes are aggregated using value shares. Annual chaining When the value shares and reference prices are updated every January, the SIPI is chain linked.
5. FUTURE IMPROVEMENTS
An Excel spreadsheet containing time series of SIPI dating from 2013 is available on the NBS website.
We welcome user feedback and suggestions regarding the monthly Industrial Production Index.
6. NEXT RELEASE
The next issue of the SIPI will be released on Friday 30th October 2015 and will contain data for September 2015.
7. CONTACT US
For more information regarding this Bulletin, the concepts, sources or methodology to compile the Seychelles Industrial Production Index, please contact Rudy Sinon on Tel: + (248) 4 611 657 | Fax: + (248) 4 225 634 or email: [email protected]
To access any of our statistics please visit
our website: www.nbs.gov.sc