Embed Size (px)
Citation preview
National Center for HIV/AIDS, Viral Hepatitis, STD, and TB Prevention Division of STD Prevention
Sexually Transmitted Disease Surveillance
2015 STDs
Sexually Transmitted
Disease Surveillance
2015
Division of STD PreventionOctober 2016
U.S Department of Health and Human ServicesCenters for Disease Control and Prevention
National Center for HIV/AIDS, Viral Hepatitis, STD, and TB PreventionDivision of STD Prevention
Atlanta, Georgia, 30329-4027
ii STD Surveillance 2015
This report was prepared by
Surveillance and Data Management BranchDivision of STD Prevention
National Center for HIV/AIDS, Viral Hepatitis, STD, and TB Prevention Centers for Disease Control and Prevention
Jerusha BartonJim Braxton
Darlene DavisAlex de VouxElaine FlaggLaZetta GrierAlesia Harvey
Sarah KiddRobert KirkcaldyKristen Kreisel
Eloisa LlataRodney PresleyViani Ramirez
Fred RiversMichelle Rose
Charnetta SmithMark StengerTimothy Tilert
Elizabeth TorroneHillard Weinstock
Emily Weston
Others contributing to the production and dissemination of this publication
Office of the DirectorDivision of STD Prevention
Gail BolanKeith Davis
Suzanne HaeckerRachel Powell
Raul RomagueraJo Valentine
Publication of this report would not have been possible without the contributions of the state and territorial health departments, sexually transmitted disease control programs, and public health laboratories that provided
surveillance data to CDC.
iiiSTD Surveillance 2015
Copyright InformationAll material contained in this report is in the public domain and may be used and reprinted without special permission; however, citation as to source is appreciated.
Suggested CitationCenters for Disease Control and Prevention. Sexually Transmitted Disease Surveillance 2015. Atlanta: U.S. Department of Health and Human Services; 2016.
Web SiteThe online version of this report is available at https://www.cdc.gov/std/stats.
Selected STD Surveillance and Prevention References and Web SitesSTD Surveillance Reports 1993–2014https://www.cdc.gov/std/stats/
STD Data in the NCHHSTP Atlashttps://www.cdc.gov/nchhstp/atlas/
STD Data on Wonderhttps://wonder.cdc.gov/std.html
STD Data Management & Information Technologyhttps://www.cdc.gov/std/Program/data-mgmt.htm
STD Fact Sheetshttps://www.cdc.gov/std/healthcomm/fact_sheets.htm
STD Treatment Guidelineshttps://www.cdc.gov/STD/treatment/
STD Program Evaluation Guidelineshttps://www.cdc.gov/std/program/pupestd.htm
STD Program Operation Guidelineshttps://www.cdc.gov/std/program/GL-2001.htm
Recommendations for Public Health Surveillance of Syphilis in the United Stateshttps://www.cdc.gov/std/SyphSurvReco.pdf
Behavioral SurveillanceYouth Risk Behavior Surveillance System: https://www.cdc.gov/healthyyouth/data/yrbs/index.htm
National Survey of Family Growthhttps://www.cdc.gov/nchs/nsfg.htm

iv STD Surveillance 2015
vSTD Surveillance 2015
Sexually transmitted diseases (STDs) have long been an underestimated opponent in the public health battle. A 1997 Institute of Medicine (IOM) report described STDs as, “hidden epidemics of tremendous health and economic consequence in the United States,” and stated that the “scope, impact, and consequences of STDs are under-recognized by the public and healthcare professionals.”1 Since well before this report was published, and nearly two decades later, those facts remain unchanged.
It is estimated that there are 20 million new STDs in the U.S. each year, and half of these are among young people ages 15 to 24 years. Across the nation, at any given time, there are more than 110 million total (new and existing) infections.2 These infections can lead to long-term health consequences, such as infertility; they can facilitate HIV transmission; and they have stigmatized entire subgroups of Americans.
Yet not that long ago, gonorrhea rates were at historic lows, syphilis was close to elimination, and we were able to point to advances in STD prevention, such as better chlamydia diagnostic tests and more screening, contributing to increases in detection and treatment of chlamydial infections. That progress has since unraveled. The number of reported syphilis cases is climbing after being largely on the decline since 1941, and gonorrhea rates are now increasing. This is especially concerning given that we are slowly running out of treatment options to cure Neisseria gonorrhoeae. Many young women continue to have undiagnosed chlamydial infections, putting them at risk for infertility.
Beyond the impact on an individual’s health, STDs are also an economic drain on the U.S. healthcare system. Data suggest the direct cost of treating STDs in the U.S. is nearly $16 billion annually.3 STD public health programs are increasingly facing challenges and barriers in achieving their mission. In 2012, 52% of state and local STD programs experienced budget cuts. This amounts to reductions in clinic hours, contact tracing, and screening for common STDs. CDC estimates that 21 local health department STD clinics closed that year.
It is imperative that federal, state, and local programs employ strategies that maximize long-term population impact by reducing STD incidence and promoting sexual, reproductive, maternal, and infant health. The resurgence of syphilis, and particularly congenital syphilis, is not an arbitrary event, but rather a symptom of a deteriorating public health infrastructure and lack of access to health care. It is exposing hidden, fragile populations in need that are not getting the health care and preventive services
they deserve. This points to our need for public health and health care action for each of the cases in this report, as they represent real people, not just numbers.
We also need to modernize surveillance to move beyond counting only those cases in persons who have access to diagnosis and treatment, to develop innovative strategies to understand the burden of disease in those who may not access care, and to improve our surveillance systems to collect the information needed to target prevention activities. Further, it will be important for us to measure and monitor the adverse health consequences of STDs, such as ocular and neurosyphilis, pelvic inflammatory disease, ectopic pregnancy, infertility, HIV, congenital syphilis, and neonatal herpes.
It is my hope that a decade from now, we will be reporting on progress, instead of more health inequity in our society. This is our challenge and our call to effectively respond to the information shared in this report.
Gail Bolan, M.D.Director, Division of STD PreventionNational Center for HIV/AIDS, Viral Hepatitis, STD, and TB PreventionU.S. Centers for Disease Control and Prevention
Foreword
1 Eng TR, Butler WT, editors; Institute of Medicine (US). Summary: The hidden epidemic: confronting sexually transmitted diseases. Washington (DC): National Academy Press; 1997. p. 43.
2 Satterwhite CL, Torrone E, Meites E, et al. Sexually transmitted infections among US women and men: prevalence and incidence estimates, 2008. Sex Transm Dis. 2013 Mar;40(3):187–93. doi: 10.1097/OLQ.0b013e318286bb53. Review.
3 Owusu-Edusei K Jr, Chesson HW, Gift TL, et al. The estimated direct medical cost of selected sexually transmitted infections in the United States, 2008. Sex Transm Dis. 2013 Mar;40(3):197–201. doi: 10.1097/OLQ.0b013e318285c6d2.
vi STD Surveillance 2015
Sexually Transmitted Disease Surveillance 2015 presents statistics and trends for sexually transmitted diseases (STDs) in the United States through 2015. This annual publication is intended as a reference document for policy makers, program managers, health planners, researchers, and others who are concerned with the public health implications of these diseases. The figures and tables in this edition supersede those in earlier publications of these data.
The surveillance information in this report is based on the following sources of data: (1) notifiable disease reporting from state and local STD programs; (2) projects that monitor STD positivity and prevalence in various settings, including the National Job Training Program, the STD Surveillance Network, and the Gonococcal Isolate Surveillance Project; and (3) other national surveys implemented by federal and private organizations.
The STD surveillance systems operated by state and local STD control programs, which provide the case report data for chlamydia, gonorrhea, syphilis, and chancroid, are the data sources of many of the figures and most of the statistical tables in this publication. These systems are an integral part of program management at all levels of STD prevention and control in the United States. Because of incomplete diagnosis and reporting, the number of STD cases reported to the Centers for Disease Control and Prevention is less than the actual number of cases occurring in the U.S. population. National summary data of case reports for other STDs are not available because they are not nationally notifiable diseases.
The collection of information on race/ethnicity has been standardized since 1997 in the United States from the Office of Management and Budget (OMB). Following a revision in the National Electronic Telecommunication System for Surveillance (NETSS) implementation guide in April 2008, jurisdictions reporting STD data were to collect race according to the OMB standard categories: American Indian or Alaska Native, Asian, Black or African American, Hispanic or Latino, Native Hawaiian or Other Pacific Islander, White and Multirace. While 49 states collect and report data for all STDs in formats compliant with these standards as of 2015, some jurisdictions only recently adopted this standard and used previous standards to report their case data to CDC in past years. Consequently, historical trend and rate data by race/ethnicity displayed in figures and interpreted in this report for 2011–2015 include only those jurisdictions reporting in the current standard consistently for 2011 through 2015.
Sexually Transmitted Disease Surveillance 2015 consists of four sections: the National Profile, the Special Focus Profiles, the Tables, and the Appendix. The National Profile section contains figures that provide an overview of STD morbidity in the United States. The accompanying text identifies major findings and trends for selected STDs. The Special Focus Profiles section contains figures and text that describe STDs in selected populations that are a focus of national and state prevention efforts. The Tables section provides statistical information about STDs at county, metropolitan statistical area, regional, state, and national levels. The Appendix includes information on how to interpret the STD surveillance data used to produce this report, as well as information about Healthy People 2020 STD objectives and progress toward meeting these objectives, Government Performance and Results Act goals and progress toward meeting these goals, and STD surveillance case definitions.
Any comments and suggestions that would improve future publications are appreciated and should be sent to:
Director, Division of STD PreventionNational Center for HIV/AIDS, Viral Hepatitis, STD, and TB PreventionCenters for Disease Control and Prevention1600 Clifton Road NE, Mailstop E-02Atlanta, Georgia 30329-4027
Preface
viiSTD Surveillance 2015
Guide to AcronymsACA Patient Protection and Affordable Care ActAI/AN American Indians/Alaska NativesCDC Centers for Disease Control and Prevention CI confidence intervalCIA chemiluminescence immunoassayCSF cerebrospinal fluidCSTE Council of State and Territorial EpidemiologistsEIA enzyme immunoassayEP ectopic pregnancyFTA-ABS fluorescent treponemal antibody absorbedGISP Gonococcal Isolate Surveillance ProjectHEDIS Healthcare Effectiveness Data and Information SetHMOs health maintenance organizationsHIV human immunodeficiency virusHP2020 Healthy People 2020HPV human papillomavirusHSV herpes simplex virusIHC immunohistochemistryMHA-TP microhemagglutination assay for antibody to Treponema pallidum MICs minimum inhibitory concentrationsMPC mucopurulent cervicitis MSAs metropolitan statistical areasMSM gay, bisexual, and other men who have sex with men MSW men who have sex with women onlyNAATs nucleic acid amplification testsNCHHSTP National Center for HIV/AIDS, Viral Hepatitis, STD, and TB PreventionNCHS National Center for Health StatisticsNHOPI Native Hawaiians/Other Pacific IslandersNDTI National Disease and Therapeutic IndexNGU nongonococcal urethritisNHANES National Health and Nutrition Examination SurveyNJTP National Job Training Program NNDSS National Notifiable Diseases Surveillance SystemOMB Office of Management and Budget P&S primary and secondaryPCR polymerase chain reactionPID pelvic inflammatory diseaseRPR rapid plasma reaginSSuN STD Surveillance NetworkSTD sexually transmitted diseaseTP-PA T. pallidum particle agglutinationVDRL Venereal Disease Research LaboratoryWBC white blood cell

viii STD Surveillance 2015
ixSTD Surveillance 2015
ContentsAcknowledgements ......................................................................................................................................................................... ii Foreword ...........................................................................................................................................................................................v Preface ............................................................................................................................................................................................ vi Guide to Acronyms ....................................................................................................................................................................... vii Figures in the National Profile .........................................................................................................................................................x Figures in the Special Focus Profiles ............................................................................................................................................ xii Tables in the National Profile ....................................................................................................................................................... xiv Census Regions of the United States .......................................................................................................................................... xvii National Overview of Sexually Transmitted Diseases (STDs), 2015.............................................................................................1
National Profile ...............................................................................................................................................................5 Chlamydia ..................................................................................................................................................................................6 Gonorrhea ................................................................................................................................................................................17 Syphilis ....................................................................................................................................................................................31 Other Sexually Transmitted Diseases .....................................................................................................................................43
Special Focus Profiles ............................................................................................................................................53 STDs in Women and Infants ...................................................................................................................................................54 STDs in Adolescents and Young Adults .................................................................................................................................62 STDs in Racial and Ethnic Minorities ....................................................................................................................................69 STDs in Men Who Have Sex with Men .................................................................................................................................76
Tables National Summary ...................................................................................................................................................................85 Chlamydia ................................................................................................................................................................................87 Gonorrhea ................................................................................................................................................................................99 Syphilis ..................................................................................................................................................................................111 Chancroid ............................................................................................................................................................................. 131 Selected STDs ...................................................................................................................................................................... 132
Appendix A. Interpreting STD Surveillance Data ................................................................................................................................ 135 Table A1. Selected STDs — Percentage of Unknown, Missing, or Invalid Values for Selected Variables by State and by Nationally Notifiable STD, 2015 ....................................................................................... 141 Table A2. Reported Cases of STDs by Reporting Source and Sex, United States, 2015 ........................................... 142 B. National Objectives and Goals ........................................................................................................................................ 143 Table B1. Healthy People 2020 (HP2020) Sexually Transmitted Diseases Objectives ............................................. 144 Table B2. Government Performance and Results Act (GPRA) Sexually Transmitted Diseases Goals, Measures, and Target .................................................................................................................................... 145 C. STD Surveillance Case Definitions ................................................................................................................................. 146 Contributors .......................................................................................................................................................................... 155
x STD Surveillance 2015
Chlamydia Figure 1. Chlamydia — Rates of Reported Cases by Sex, United States, 2000–2015 .................................................10 Figure 2. Chlamydia — Rates of Reported Cases by Region, United States, 2006–2015 ...........................................10 Figure 3. Chlamydia — Rates of Reported Cases by State, United States and Outlying Areas, 2015 ........................11 Figure 4. Chlamydia — Rates of Reported Cases by County, United States, 2015 .....................................................11 Figure 5. Chlamydia — Rates of Reported Cases by Age Group and Sex, United States, 2015 .................................12 Figure 6. Chlamydia — Rates of Reported Cases by Race/Ethnicity, United States, 2011–2015 ...............................12 Figure 7. Chlamydia — Reported Cases Among Men by Reporting Source, United States, 2006–2015 ...................13 Figure 8. Chlamydia — Reported Cases Among Women by Reporting Source, United States, 2006–2015 ..............13 Figure 9. Chlamydia — Proportion of STD Clinic Patients Testing Positive by Age Group, Sex, and Sexual Behavior, STD Surveillance Network (SSuN), 2015 .....................................................................................14 Figure 10. Chlamydia — Prevalence Among Persons Aged 14–39 Years by Sex, Race/Ethnicity, or Age Group, National Health and Nutrition Examination Survey, 2007–2012 ..................................................................14 Figure 11. Chlamydia — Prevalence Among Sexually-Active Women Aged 14–39 Years by Race/Ethnicity and Age Group, National Health and Nutrition Examination Survey, 2007–2012 .......................................15
Gonorrhea Figure 12. Gonorrhea — Rates of Reported Cases by Year, United States, 1941–2015 ................................................21 Figure 13. Gonorrhea — Rates of Reported Cases by Sex, United States, 2006–2015 .................................................21 Figure 14. Gonorrhea — Rates of Reported Cases by Region, United States, 2006–2015 ............................................22 Figure 15. Gonorrhea — Rates of Reported Cases by State, United States and Outlying Areas, 2015 .........................22 Figure 16. Gonorrhea — Rates of Reported Cases by County, United States, 2015 ......................................................23 Figure 17. Gonorrhea — Rates of Reported Cases by Age Group and Sex, United States, 2015 ..................................23 Figure 18. Gonorrhea — Rates of Reported Cases Among Women Aged 15–44 Years by Age Group, United States, 2006–2015 ...............................................................................................................................24 Figure 19. Gonorrhea — Rates of Reported Cases Among Men Aged 15–44 Years by Age Group, United States, 2006–2015 ...............................................................................................................................24 Figure 20. Gonorrhea — Rates of Reported Cases by Race/Ethnicity, United States, 2011–2015 ................................25 Figure 21. Gonorrhea — Reported Cases Among Men by Reporting Source, United States, 2006–2015 ....................25 Figure 22. Gonorrhea — Reported Cases Among Women by Reporting Source, United States, 2006–2015 ..............26 Figure 23. Estimated Proportion of MSM, MSW, and Women Among Gonorrhea Cases by Jurisdiction, STD Surveillance Network (SSuN), 2015 ......................................................................................................26 Figure 24. Gonorrhea — Proportion of STD Clinic Patients Testing Positive by Age Group, Sex, and Sexual Behavior, STD Surveillance Network (SSuN), 2015 .........................................................................27 Figure 25. Location of Participating Sentinel Sites and Regional Laboratories, Gonococcal Isolate Surveillance Project (GISP), United States, 2015 ...............................................................................................................27 Figure 26. Neisseria gonorrhoeae — Percentage of Isolates with Elevated Ceftriaxone Minimum Inhibitory Concentrations (MICs) (≥0.125 µg/ml) and Elevated Cefixime MICs (≥0.25 µg/ml), Gonococcal Isolate Surveillance Project (GISP), 2006–2015 ............................................................................................28 Figure 27. Neisseria gonorrhoeae — Distribution of Azithromycin Minimum Inhibitory Concentrations (MICs) by Year, Gonococcal Isolate Surveillance Project (GISP), 2011–2015 .........................................................28 Figure 28. Neisseria gonorrhoeae — Distribution of Isolates with Penicillin, Tetracycline, and/or Ciprofloxacin Resistance, Gonococcal Isolate Surveillance Project (GISP), 2015 ..............................................................29 Figure 29. Distribution of Primary Antimicrobial Drugs Used to Treat Gonorrhea Among Participants, Gonococcal Isolate Surveillance Project (GISP), 1988–2015 .......................................................................29
Syphilis Figure 30. Syphilis — Rates of Reported Cases by Stage of Infection, United States, 1941–2015 ..............................35 Figure 31. Primary and Secondary Syphilis — Reported Cases by Sex and Sexual Behavior, 37 states, 2011–2015 .......................................................................................................................................................35
Figures in the National Profile
xiSTD Surveillance 2015
Figure 32. Primary and Secondary Syphilis — Rates of Reported Cases by Sex and Male-to-Female Rate Ratios, United States, 1990–2015 ...............................................................................................................................36 Figure 33. Primary and Secondary Syphilis — Rates of Reported Cases by Region, United States, 2006–2015 ........36 Figure 34. Primary and Secondary Syphilis — Rates of Reported Cases by State, United States and Outlying Areas, 2015 ......................................................................................................................................................37 Figure 35. Primary and Secondary Syphilis — Rates of Reported Cases by County, United States, 2015 ...................37 Figure 36. Primary and Secondary Syphilis — Rates of Reported Cases by Age Group and Sex, United States, 2015..........................................................................................................................................38 Figure 37. Primary and Secondary Syphilis — Rates of Reported Cases Among Women Aged 15–44 Years by Age Group, United States, 2006–2015 ......................................................................................................38 Figure 38. Primary and Secondary Syphilis — Rates of Reported Cases Among Men Aged 15–44 Years by Age Group, United States, 2006–2015 ......................................................................................................39 Figure 39. Primary and Secondary Syphilis — Rates of Reported Cases by Race/Ethnicity, United States, 2011–2015 .......................................................................................................................................................39 Figure 40. Primary and Secondary Syphilis — Distribution of Cases by Sex and Sexual Behavior, 2015 ...................40 Figure 41. Primary and Secondary Syphilis — Reported Cases by Sex, Sexual Behavior, and HIV Status, 31 States, 2015 .................................................................................................................................................40 Figure 42. Primary and Secondary Syphilis — Reported Cases by Reporting Source and Sex, United States, 2006–2015 .......................................................................................................................................................41 Figure 43. Primary and Secondary Syphilis — Percentage of Reported Cases by Sex, Sexual Behavior, and Selected Reporting Sources, 2015 ..................................................................................................................41 Figure 44. Congenital Syphilis — Reported Cases by Year of Birth and Rates of Primary and Secondary Syphilis Among Women, United States, 2006–2015 ...................................................................................................42
Other Sexually Transmitted Diseases Figure 45. Chancroid — Reported Cases by Year, United States, 1941–2015 ...............................................................47 Figure 46. Human Papillomavirus — Cervicovaginal Prevalence of Types 6, 11, 16, and 18 Among Women Aged 14–34 Years by Age Group and Time Period, National Health and Nutrition Examination Survey, 2003–2006 and 2009–2012 ...............................................................................................................47 Figure 47. Genital Warts — Initial Visits to Physicians’ Offices, United States, 1966–2014 ........................................48 Figure 48. Genital Warts — Prevalence per 1000 Person-Years Among Participants in Private Health Plans Aged 10–39 Years by Sex, Age Group, and Year, 2003–2010 .......................................................................48 Figure 49. Genital Warts — Prevalence Among STD Clinic Patients by Sex, Sex of Partners, and Jurisdiction, STD Surveillance Network (SSuN), 2015 ......................................................................................................49 Figure 50. Genital Herpes Simplex Virus (HSV) Infections — Initial Visits to Physicians’ Offices, United States, 1966–2014 ...............................................................................................................................49 Figure 51. Herpes Simplex Virus (HSV) Type 2 — Seroprevalence Among Non-Hispanic Whites and Non-Hispanic Blacks by Sex and Age Group, National Health and Nutrition Examination Survey, 1988–1994, 1999–2002, 2003–2006, and 2007–2010 ...................................................................................50 Figure 52. Trichomonas vaginalis and Other Vaginal Infections Among Women — Initial Visits to Physicians’ Offices, United States, 1966–2014 .................................................................................................................50
xii STD Surveillance 2015
STDs in Women and Infants Figure A. Chlamydia — Rates of Reported Cases Among Women by State, United States and Outlying Areas, 2015 .......................................................................................................................................58 Figure B. Gonorrhea — Rates of Reported Cases Among Women by State, United States and Outlying Areas, 2015 .......................................................................................................................................58 Figure C. Primary and Secondary Syphilis — Rates of Reported Cases Among Women by State, United States and Outlying Areas, 2015 ................................................................................................................................59 Figure D. Congenital Syphilis — Rates of Reported Cases Among Infants by Year of Birth and State, United States and Outlying Areas, 2015 .........................................................................................................59 Figure E. Pelvic Inflammatory Disease — Initial Visits to Physicians’ Offices Among Women Aged 15–44 Years, United States, 2006–2014 ....................................................................................................................60 Figure F. Pelvic Inflammatory Disease — Lifetime Prevalence of Treatment Among Sexually Experienced Women Aged 15–44 Years by Race/Ethnicity and Time Period, National Survey of Family Growth, 1995, 2002, 2006–2010, 2011–2013 ..............................................................................................................60 Figure G. Ectopic Pregnancy — Rates Among Commercially Insured Pregnant Women Aged 15–44 Years by Age Group, 2003–2014 ..............................................................................................................................61
STDs in Adolescents and Young Adults Figure H. Chlamydia — Rates of Reported Cases Among Women Aged 15–24 Years by State, United States and Outlying Areas, 2015 ................................................................................................................................65 Figure I. Chlamydia — Rates of Reported Cases Among Men Aged 15–24 Years by State, United States and Outlying Areas, 2015 ................................................................................................................................65 Figure J. Gonorrhea — Rates of Reported Cases Among Women Aged 15–24 Years by State, United States and Outlying Areas, 2015 ................................................................................................................................66 Figure K. Gonorrhea — Rates of Reported Cases Among Men Aged 15–24 Years by State, United States and Outlying Areas, 2015 ................................................................................................................................66 Figure L. Chlamydia — Prevalence Among Women Aged 16–24 Years Entering the National Job Training Program (NJTP) by State of Residence, United States and Outlying Areas, 2015 .......................................67 Figure M. Chlamydia — Prevalence Among Men Aged 16–24 Years Entering the National Job Training Program (NJTP) by State of Residence, United States and Outlying Areas, 2015 .......................................67 Figure N. Gonorrhea — Prevalence Among Women Aged 16–24 Years Entering the National Job Training Program (NJTP) by State of Residence, United States and Outlying Areas, 2015 .......................................68 Figure O. Gonorrhea — Prevalence Among Men Aged 16–24 Years Entering the National Job Training Program (NJTP) by State of Residence, United States and Outlying Areas, 2015 .......................................68
STDs in Racial and Ethnic Minorities Figure P. Chlamydia — Rates of Reported Cases by Race/Ethnicity and Sex, United States, 2015 ...........................73 Figure Q. Gonorrhea — Rate Ratios by Race/Ethnicity, United States, 2011–2015 .....................................................73 Figure R. Gonorrhea — Rates of Reported Cases by Race/Ethnicity and Sex, United States, 2015 ...........................74 Figure S. Gonorrhea — Rate Ratios by Race/Ethnicity and Region, United States, 2015 ...........................................74 Figure T. Primary and Secondary Syphilis — Rates of Reported Cases by Race/Ethnicity and Sex, United States, 2015..........................................................................................................................................75 Figure U. Congenital Syphilis — Rates of Reported Cases Among Infants, by Year of Birth and Mother’s Race/Ethnicity, United States, 2006–2015 .....................................................................................................75
STDs in Men Who Have Sex with Men Figure V. Primary and Secondary Syphilis — Reported Cases by Sex, Sexual Behavior, and Race/Ethnicity, United States, 2015..........................................................................................................................................79 Figure W. Gonorrhea and Chlamydia — Proportion of MSM Attending STD Clinics Testing Positive for Gonorrhea and Chlamydia by Jurisdiction, STD Surveillance Network (SSuN), 2015 ...............................79
Figures in the Special Focus Profiles
xiiiSTD Surveillance 2015
Figure X. Primary and Secondary Syphilis and HIV — Proportion of MSM Attending STD Clinics with Primary and Secondary Syphilis Co-infected with HIV by Jurisdiction, STD Surveillance Network (SSuN), 2015 ....................................................................................................................................80 Figure Y. Proportion of MSM Attending STD Clinics with Primary and Secondary Syphilis, Gonorrhea (GC) or Chlamydia (CT) by HIV Status, STD Surveillance Network (SSuN), 2015 ............................................80 Figure Z. Neisseria gonorrhoeae — Percentage of Urethral Isolates Obtained from MSM Attending STD Clinics, Gonococcal Isolate Surveillance Project (GISP), 1989–2015 ..........................................................81 Figure AA. Neisseria gonorrhoeae — Percentage of Urethral Isolates with Elevated Ceftriaxone Minimum Inhibitory Concentrations (MICs) (≥0.125 µg/ml) by Reported Sex of Sex Partner, Gonococcal Isolate Surveillance Project (GISP), 2006–2015 ............................................................................................81
xiv STD Surveillance 2015
National Summary Table 1. Sexually Transmitted Diseases — Reported Cases and Rates of Reported Cases per 100,000 Population, United States, 1941–2015 ...............................................................................................................................85
Chlamydia Table 2. Chlamydia — Reported Cases and Rates of Reported Cases by State, Ranked by Rates, United States, 2015..........................................................................................................................................87 Table 3. Chlamydia — Reported Cases and Rates of Reported Cases by State/Area and Region in Alphabetical Order, United States and Outlying Areas, 2011–2015 .............................................................88 Table 4. Chlamydia Among Women — Reported Cases and Rates of Reported Cases by State/Area and Region in Alphabetical Order, United States and Outlying Areas, 2011–2015 .............................................89 Table 5. Chlamydia Among Men — Reported Cases and Rates of Reported Cases by State/Area and Region in Alphabetical Order, United States and Outlying Areas, 2011–2015 .............................................90 Table 6. Chlamydia — Reported Cases and Rates of Reported Cases in Selected Metropolitan Statistical Areas (MSAs) in Alphabetical Order, United States, 2011–2015 .................................................................91 Table 7. Chlamydia Among Women — Reported Cases and Rates of Reported Cases in Selected Metropolitan Statistical Areas (MSAs) in Alphabetical Order, United States, 2011–2015 ..........................92 Table 8. Chlamydia Among Men — Reported Cases and Rates of Reported Cases in Selected Metropolitan Statistical Areas (MSAs) in Alphabetical Order, United States, 2011–2015 ..........................93 Table 9. Chlamydia — Reported Cases and Rates of Reported Cases in Counties and Independent Cities Ranked by Number of Reported Cases, United States, 2015 ........................................................................94 Table 10. Chlamydia — Reported Cases and Rates of Reported Cases by Age Group and Sex, United States, 2011–2015 .......................................................................................................................................................95 Table 11A. Chlamydia — Reported Cases by Race/Ethnicity, Age Group, and Sex, United States, 2015 .....................96 Table 11B. Chlamydia — Rates of Reported Cases per 100,000 Population by Race/Ethnicity, Age Group, and Sex, United States, 2015 ..........................................................................................................................97 Table 12. Chlamydia Among Women Aged 15–24 Years — Reported Cases and Rates of Reported Cases by Age, United States, 2011–2015 ..................................................................................................................98
Gonorrhea Table 13. Gonorrhea — Reported Cases and Rates of Reported Cases by State, Ranked by Rates, United States, 2015..........................................................................................................................................99 Table 14. Gonorrhea — Reported Cases and Rates of Reported Cases by State/Area and Region in Alphabetical Order, United States and Outlying Areas, 2011–2015 .......................................................... 100 Table 15. Gonorrhea Among Women — Reported Cases and Rates of Reported Cases by State/Area and Region in Alphabetical Order, United States and Outlying Areas, 2011–2015 ................................... 101 Table 16. Gonorrhea Among Men — Reported Cases and Rates of Reported Cases by State/Area and Region in Alphabetical Order, United States and Outlying Areas, 2011–2015 ................................... 102 Table 17. Gonorrhea — Reported Cases and Rates of Reported Cases in Selected Metropolitan Statistical Areas (MSAs) in Alphabetical Order, United States, 2011–2015 .............................................. 103 Table 18. Gonorrhea Among Women — Reported Cases and Rates of Reported Cases in Selected Metropolitan Statistical Areas (MSAs) in Alphabetical Order, United States, 2011–2015 ....................... 104 Table 19. Gonorrhea Among Men — Reported Cases and Rates of Reported Cases in Selected Metropolitan Statistical Areas (MSAs) in Alphabetical Order, United States, 2011–2015 ....................... 105 Table 20. Gonorrhea — Reported Cases and Rates of Reported Cases in Counties and Independent Cities, Ranked by Number of Reported Cases, United States, 2015 .......................................................... 106 Table 21. Gonorrhea — Reported Cases and Rates of Reported Cases by Age Group and Sex, United States, 2011–2015 ............................................................................................................................ 107 Table 22A. Gonorrhea — Reported Cases by Race/Ethnicity, Age Group, and Sex, United States, 2015 .................. 108 Table 22B. Gonorrhea — Rates of Reported Cases per 100,000 Population by Race/Ethnicity, Age Group, and Sex, United States, 2015 ....................................................................................................................... 109
Tables in the National Profile
xvSTD Surveillance 2015
Table 23. Gonorrhea Among Women Aged 15–24 Years — Reported Cases and Rates of Reported Cases by Age, United States, 2011–2015 ................................................................................................................110
Syphilis Table 24. All Stages of Syphilis — Reported Cases and Rates of Reported Cases by State/Area and Region in Alphabetical Order, United States and Outlying Areas, 2011–2015 .......................................................111 Table 25. All Stages of Syphilis — Reported Cases and Rates of Reported Cases in Selected Metropolitan Statistical Areas (MSAs) in Alphabetical Order, United States, 2011–2015 ...............................................112 Table 26. Primary and Secondary Syphilis — Reported Cases and Rates of Reported Cases by State, Ranked by Rates, United States, 2015 .......................................................................................................................113 Table 27. Primary and Secondary Syphilis — Reported Cases and Rates of Reported Cases by State/Area and Region in Alphabetical Order, United States and Outlying Areas, 2011–2015 ....................................114 Table 28. Primary and Secondary Syphilis Among Women — Reported Cases and Rates of Reported Cases by State/Area and Region in Alphabetical Order, United States and Outlying Areas, 2011–2015 ............115 Table 29. Primary and Secondary Syphilis Among Men — Reported Cases and Rates of Reported Cases by State/Area and Region in Alphabetical Order, United States and Outlying Areas, 2011–2015 ............116 Table 30. Primary and Secondary Syphilis — Reported Cases and Rates of Reported Cases in Selected Metropolitan Statistical Areas (MSAs) in Alphabetical Order, United States, 2011–2015 ........................117 Table 31. Primary and Secondary Syphilis Among Women — Reported Cases and Rates of Reported Cases in Selected Metropolitan Statistical Areas (MSAs) in Alphabetical Order, United States, 2011–2015 .....................................................................................................................................................118 Table 32. Primary and Secondary Syphilis Among Men — Reported Cases and Rates of Reported Cases in Selected Metropolitan Statistical Areas (MSAs) in Alphabetical Order, United States, 2011–2015 .....................................................................................................................................................119 Table 33. Primary and Secondary Syphilis — Reported Cases and Rates of Reported Cases in Counties and Independent Cities Ranked by Number of Reported Cases, United States, 2015 ...................................... 120 Table 34. Primary and Secondary Syphilis — Reported Cases and Rates of Reported Cases by Age Group and Sex, United States, 2011–2015 ............................................................................................................. 121 Table 35A. Primary and Secondary Syphilis — Reported Cases by Race/Ethnicity, Age Group, and Sex, United States, 2015....................................................................................................................................... 122 Table 35B. Primary and Secondary Syphilis — Rates of Reported Cases per 100,000 Population by Race/Ethnicity, Age Group, and Sex, United States, 2015 ......................................................................... 123 Table 36. Early Latent Syphilis — Reported Cases and Rates of Reported Cases by State/Area and Region in Alphabetical Order, United States and Outlying Areas, 2011–2015 ...................................................... 124 Table 37. Early Latent Syphilis — Reported Cases and Rates of Reported Cases in Selected Metropolitan Statistical Areas (MSAs) in Alphabetical Order, United States, 2011–2015 .............................................. 125 Table 38. Late and Late Latent Syphilis — Reported Cases and Rates of Reported Cases by State/Area and Region in Alphabetical Order, United States and Outlying Areas, 2011–2015 .......................................... 126 Table 39. Late and Late Latent Syphilis — Reported Cases and Rates of Reported Cases in Selected Metropolitan Statistical Areas (MSAs) in Alphabetical Order, United States, 2011–2015 ....................... 127 Table 40. Congenital Syphilis — Reported Cases and Rates of Reported Cases by State, Ranked by Rates, United States, 2015....................................................................................................................................... 128 Table 41. Congenital Syphilis — Reported Cases and Rates of Reported Cases by Year of Birth, by State/Area and Region in Alphabetical Order, United States and Outlying Areas, 2011–2015 ................................... 129 Table 42. Congenital Syphilis — Reported Cases and Rates of Reported Cases per 100,000 Live Births by Year of Birth and Race/Ethnicity of Mother, United States, 2011–2015 .................................................... 130
Chancroid Table 43. Chancroid — Reported Cases and Rates of Reported Cases by State/Area in Alphabetical Order, United States and Outlying Areas, 2011–2015 ................................................................................ 131
Selected STDs Table 44. Selected STDs and Complications — Initial Visits to Physicians’ Offices, National Disease and Therapeutic Index, United States, 1966–2014 ...................................................................................... 132
xvi STD Surveillance 2015
Appendix Table A1. Selected STDs — Percentage of Unknown, Missing, or Invalid Values for Selected Variables by State and by Nationally Notifiable STD, 2015 ....................................................................................... 141 Table A2. Reported Cases of STDs by Reporting Source and Sex, United States, 2015 ........................................... 142 Table B1. Healthy People 2020 (HP2020) Sexually Transmitted Diseases Objectives ............................................. 144 Table B2. Government Performance and Results Act (GPRA) Sexually Transmitted Diseases Goals, Measures, and Target .................................................................................................................................... 145
xviiSTD Surveillance 2015
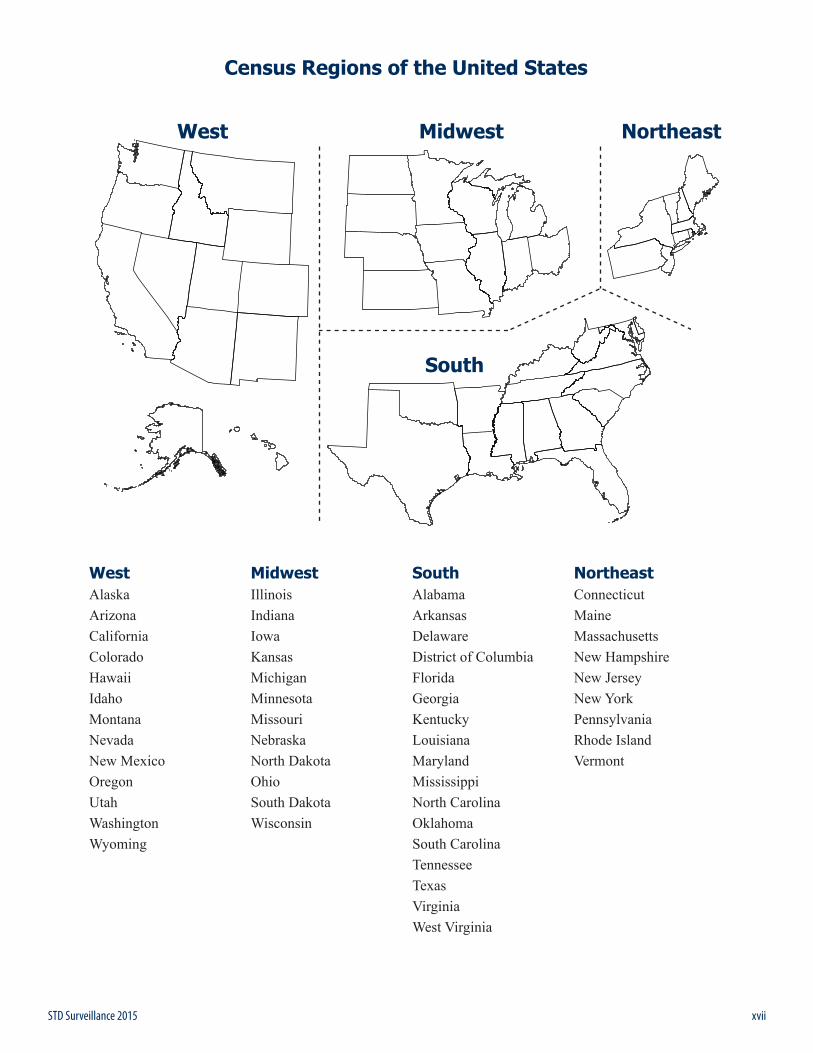
Census Regions of the United States
West Midwest South NortheastAlaska Illinois Alabama ConnecticutArizona Indiana Arkansas MaineCalifornia Iowa Delaware MassachusettsColorado Kansas District of Columbia New HampshireHawaii Michigan Florida New JerseyIdaho Minnesota Georgia New YorkMontana Missouri Kentucky PennsylvaniaNevada Nebraska Louisiana Rhode IslandNew Mexico North Dakota Maryland VermontOregon Ohio MississippiUtah South Dakota North CarolinaWashington Wisconsin OklahomaWyoming South Carolina
TennesseeTexasVirginiaWest Virginia
South
NortheastMidwestWest

xviii STD Surveillance 2015
1STD Surveillance 2015 Overview
All Americans should have the opportunity to make choices that lead to health and wellness. Working together, interested, committed public and private organizations, communities, and individuals can take action to prevent sexually transmitted diseases (STDs) and their related health consequences. In addition to federal, state, and local public support for STD prevention activities, local community leaders can promote STD prevention education. Health care providers can assess their patients’ risks and talk to them about testing. Parents can better educate their children about STDs and sexual health. Individuals can use condoms consistently and correctly, and openly discuss ways to protect their health with partners and providers. As noted in the Institute of Medicine report, The Hidden Epidemic: Confronting Sexually Transmitted Diseases, surveillance is a key component of all our efforts to prevent and control these diseases.1
This overview summarizes national surveillance data for 2015 on the three notifiable diseases for which there are federally funded control programs: chlamydia, gonorrhea, and syphilis.
ChlamydiaIn 2015, a total of 1,526,658 cases of Chlamydia trachomatis infection were reported to the CDC. This case count corresponds to a rate of 478.8 cases per 100,000 population, an increase of 5.9% compared with the rate in 2014. During 2014–2015, the rate of reported chlamydia cases among women increased 3.8% and the rate among men increased 10.5%. Following three years of decreases in rates during 2011–2014, the rate among women aged 15–19 years increased 1.5% during 2014–2015.
In 2015, the overall rate of chlamydial infection in the United States among women (645.5 cases per 100,000 females) based on reported cases was over two times the rate among men (305.2 cases per 100,000 males), reflecting the larger number of women screened for this infection. However, with the increased availability of urine testing and extragenital testing, men, including gay, bisexual, and other men who have sex with men (collectively referred to as MSM) are increasingly being tested for chlamydial infection. During 2011–2015, the chlamydia rate in men increased 20.0%, compared with a 0.3% increase in women during this period.
The facilities reporting chlamydial infections have changed over the last 10 years. In 2015, over 75% of chlamydia cases were reported from venues outside of STD clinics. Among women, only 4.5% of chlamydia cases were reported through an STD clinic and about a third of cases were reported from private physicians/health maintenance organizations.
Rates of reported chlamydia varied among different racial and ethnic minority populations. In 2015, the rate of chlamydia among Blacks was 5.9 times the rate among Whites, and the rate among American Indians/Alaska Natives was 3.8 times the rate among Whites.
GonorrheaIn 2009, the national rate of reported gonorrhea cases reached an historic low of 98.1 cases per 100,000 population. However, during 2009–2012, the rate increased slightly each year to 106.7 cases per 100,000 population in 2012 and then increased again during 2013–2015. In 2015, 395,216 gonorrhea cases were reported for a rate of 123.9 cases per 100,000 population, an increase of 12.8% from 2014.
During 2014–2015 the rate of reported gonorrhea increased 18.3% among men and 6.8% among women. Gonorrhea rates among both men and women increased in every region of the United States, with largest increases in the West and the South. The magnitude of the increase among males suggest either increased transmission or increased case ascertainment (e.g., through increased extra-genital screening) among MSM or both.
In 2015, the rate of reported gonorrhea cases remained highest among Blacks (424.9 cases per 100,000 population) and among American Indians/Alaska Natives (192.8 cases per 100,000 population). While rates of gonorrhea declined 4.0% among Blacks during 2011–2015, rates increased among all other racial and ethnic groups, including a 71.3% increase among American Indians/Alaska Natives.
Antimicrobial resistance remains an important consideration in the treatment of gonorrhea. With increased resistance to the fluoroquinolones and declining susceptibility to cefixime, dual therapy with ceftriaxone and azithromycin is now the only CDC recommended treatment for gonorrhea.2 In 2015, the percentage of isolates with elevated minimum inhibitory concentrations
National Overview of Sexually Transmitted Diseases (STDs), 2015
2 STD Surveillance 2015Overview
(MICs) of cefixime and ceftriaxone remained low (0.5% and 0.3%, respectively). During 2013–2015, the percentage of isolates with reduced azithromycin susceptibility increased from 0.6% to 2.6%. Continued monitoring of susceptibility patterns to these antibiotics is critical.
SyphilisIn 2000 and 2001, the national rate of reported primary and secondary (P&S) syphilis cases was 2.1 cases per 100,000 population, the lowest rate since reporting began in 1941. However, the P&S syphilis rate has increased almost every year since 2001. In 2015, a total of 23,872 P&S syphilis cases were reported, and the national P&S syphilis rate increased to 7.5 cases per 100,000 population, a 19.0% increase from 2014.
During 2014–2015, the P&S syphilis rate increased both among men (18.1%) and women (27.3%) and rates increased among both sexes in every region of the country. Nationally, P&S syphilis rates increased in every 5-year age group among those aged 15–64 years and in every racial and ethnic group except for American Indians/Alaska Natives during 2014–2015.
During 2000–2015, the rise in the P&S syphilis rate was primarily attributable to increased cases among men and, specifically, among MSM. In 2015, men accounted for over 90% of all cases of P&S syphilis. Of those male cases for whom sex of sex partner was known, 81.7% were MSM. Reported cases of P&S syphilis continued to be characterized by a high rate of HIV co-infection, particularly among MSM. In the 31 states able to classify at least 70.0% of reported P&S syphilis cases as MSM, men who have sex with women (MSW), or women and at least 70.0% of reported cases as HIV-positive or HIV-negative, 49.8% of MSM with P&S syphilis were also reported as HIV-positive compared with 10.0% of cases among MSW and 3.9% of cases among women.
The 2013 rate of congenital syphilis (9.2 cases per 100,000 live births) marked the first increase in congenital syphilis since 2008. During 2013–2014, the rate increased 27.2% and during 2014–2015 increased 6.0%, primarily attributable to an increase in the West. There were 487 cases of congenital syphilis reported in 2015 compared with 461 in 2014. Rates of congenital syphilis were highest among Blacks (35.2 cases per 100,000 live births), followed by Hispanics (15.5 cases per 100,000 live births) and American Indians/Alaska Natives (10.3 cases per 100,000 live births).
1 Eng TR, Butler WT, editors; Institute of Medicine (US). The hidden epidemic: confronting sexually transmitted diseases. Washington (DC): National Academy Press; 1997. p 43.
2 Centers for Disease Control and Prevention. Sexually transmitted diseases treatment guidelines, 2015. MMWR Morb Mortal Wkly Rep 2015; 64(No. RR-3): 1–137

3STD Surveillance 2015
NA
TIO
NA
L P
RO
FILE

4 STD Surveillance 2015
NA
TIO
NA
L P
RO
FILE
5STD Surveillance 2015 National Profile
The National Profile section contains figures that show trends and the distribution of nationally reportable STDs (chlamydia, gonorrhea, syphilis, and chancroid) by age, sex, race/ethnicity, and location for the United States.
National Profile
6 STD Surveillance 2015National Profile: Chlamydia
BackgroundChlamydia, caused by infection with Chlamydia trachomatis, is the most common notifiable disease in the United States. It is among the most prevalent of all STDs, and since 1994, has comprised the largest proportion of all STDs reported to CDC (Table 1). Studies also demonstrate the high prevalence of chlamydial infections in the general U.S. population, particularly among young women.1
Chlamydial infections in women are usually asymptomatic.2 Untreated infection can result in pelvic inflammatory disease (PID), which is a major cause of infertility, ectopic pregnancy, and chronic pelvic pain. Data from randomized controlled trials of chlamydia screening suggested that screening programs can lead to a reduction in the incidence of PID.3,4 As with other inflammatory STDs, chlamydial infection could facilitate the transmission of HIV infection.5 In addition, pregnant women infected with chlamydia can pass the infection to their infants during delivery, potentially resulting in ophthalmia neonatorum, which can lead to blindness, and pneumonia. Because of the large burden of disease and risks associated with infection, CDC recommends annual chlamydia screening for all sexually active women younger than age 25 years and women ≥25 years at increased risk for infection (e.g., women with new or multiple sex partners).6
The Healthcare Effectiveness Data and Information Set (HEDIS) contains a measure which assesses chlamydia screening coverage of sexually active young women who receive medical care through commercial or Medicaid managed care organizations. Among sexually-active women aged 16–24 years in commercial health maintenance organization (HMO) plans, chlamydia screening increased from 23.1% in 2001 to 47.0% in 2014. Among sexually-active women aged 16–24 years covered by Medicaid, screening rates increased from 40.4% in 2001 to 58.0% in 2011, then decreased to 54.6% in 2014.7 Although chlamydia screening has expanded over the past two decades, many women who are at risk are still not being tested—reflecting, in part, the lack of awareness among some health care providers and the limited resources available to support these screenings.
Interpreting Rates of Reported Cases of ChlamydiaTrends in rates of reported cases of chlamydia are influenced by changes in incidence of infection, as well as changes in diagnostic, screening, and reporting practices. As chlamydial infections are usually asymptomatic, the
number of infections identified and reported can increase as more people are screened even when incidence is flat or decreasing. Expanded use of more sensitive diagnostic tests (e.g., nucleic acid amplification tests [NAATs]) can also increase the number of infections identified and reported independently of increases in incidence. Although chlamydia has been a nationally notifiable condition since 1994, it was not until 2000 that all 50 states and the District of Columbia required reporting of chlamydia cases. National case rates prior to 2000 reflect incomplete reporting. Additionally, increasing use of electronic laboratory reporting has likely increased the proportion of diagnosed cases that are reported. Consequently, an increasing chlamydia case rate may reflect increases in incidence of infection, screening coverage, and use of more sensitive tests, as well as more complete reporting. Likewise, decreases in chlamydia case rates may suggest decreases in incidence of infection or screening coverage.
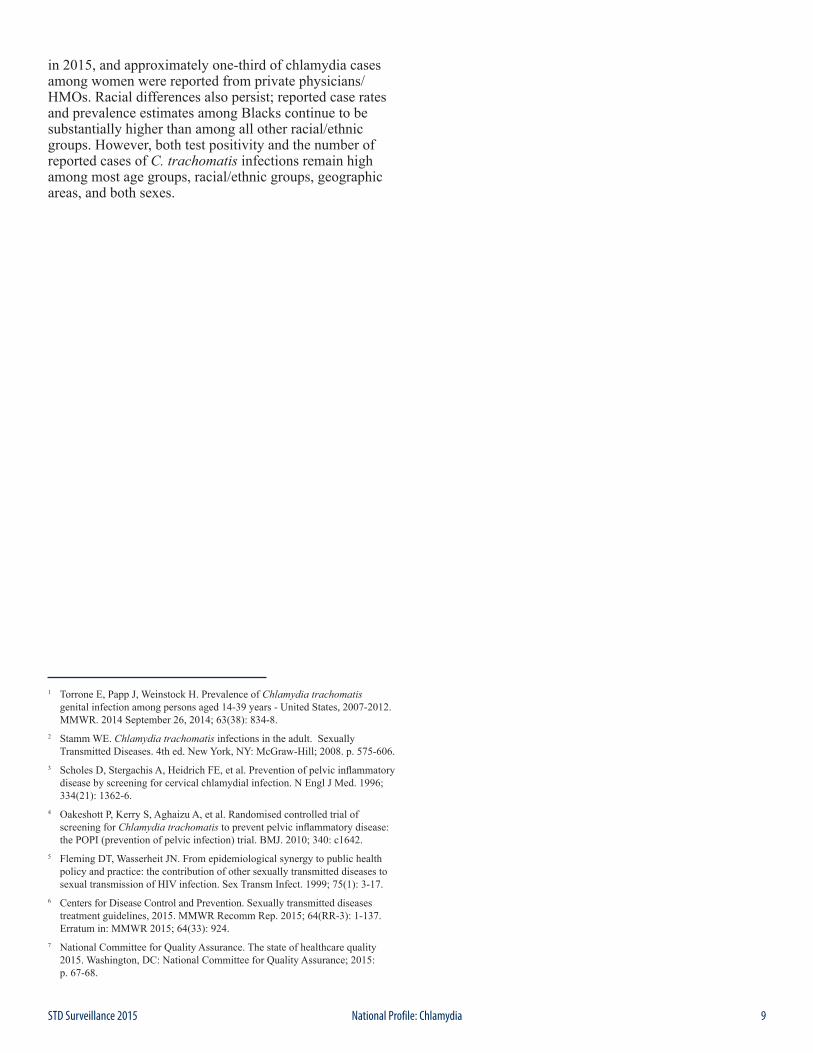
Chlamydia — United StatesIn 2015, a total of 1,526,658 chlamydial infections were reported to CDC in 50 states and the District of Columbia (Table 1). This case count corresponds to a rate of 478.8 cases per 100,000 population. During 2000–2011, the rate of reported chlamydial infection increased from 251.4 to 453.4 cases per 100,000 population (Figure 1, Table 1). During 2011–2013, the rate of reported cases decreased to 443.5 cases per 100,000 population. The rate of reported cases then increased in 2014 and again in 2015. During 2014–2015, the rate increased 5.9%, from 452.2 to 478.8 cases per 100,000 population (Figure 1, Table 1).
Chlamydia by RegionIn 2015, rates of reported cases of chlamydia were highest in the South (520.5 cases per 100,000 population, 7.0% increase from 2014), followed by the Midwest (464.8, 3.8% increase from 2014), West (464.4, 6.4% increase from 2014), and Northeast (425.9, 5.1% increase from 2014) (Table 3). During 2006–2012, rates of reported cases of chlamydia increased in all regions (Figure 2). During 2012–2013, rates decreased in the Northeast, Midwest, and South and remained stable in the West. During 2013–2015, rates increased in all regions, with the largest increase occurring in the West (421.1 to 464.4 cases per 100,000 population, 10.3% increase) (Table 3).
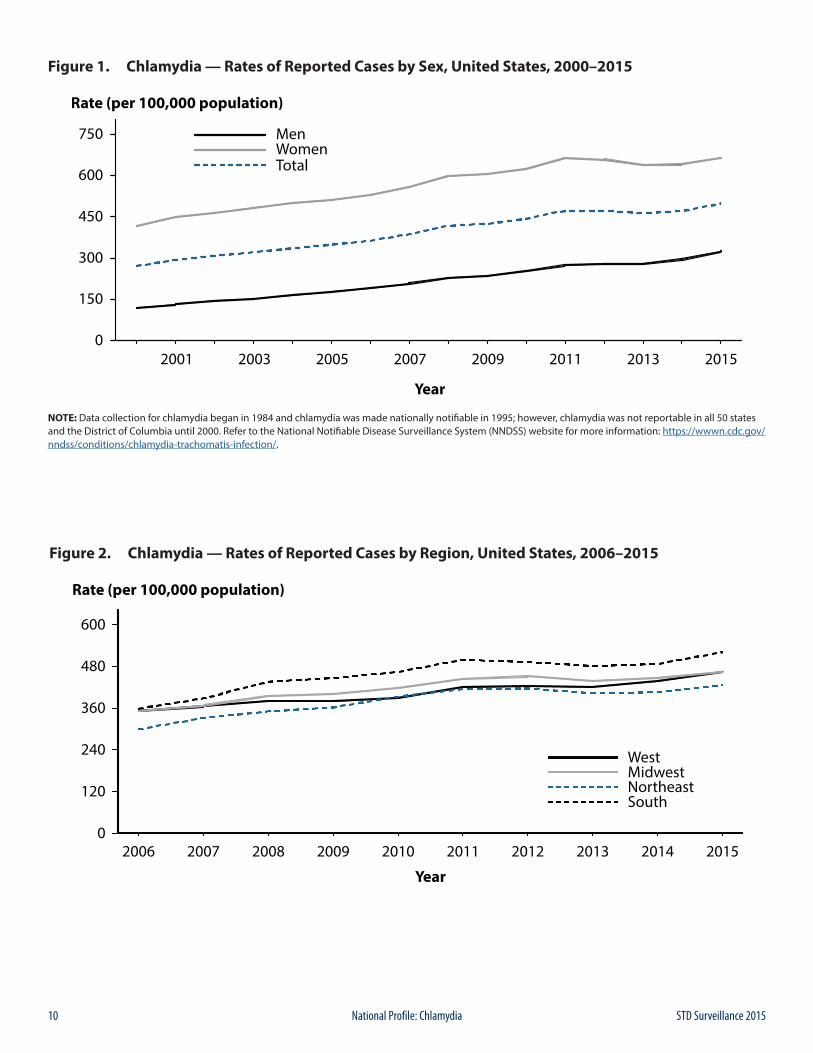
Chlamydia by StateIn 2015, rates of reported cases of chlamydia by state ranged from 233.3 cases per 100,000 population in New Hampshire to 768.3 cases in Alaska (Figure 3, Table 2);
Chlamydia
7STD Surveillance 2015 National Profile: Chlamydia
the rate in the District of Columbia was 1,198.1 cases per 100,000 population (Table 3). During 2014–2015, rates of reported chlamydia increased in 37 states and the District of Columbia. The rate of reported chlamydia cases in 2015 was above the U.S. total in 18 states.
Chlamydia by Metropolitan Statistical AreaThe rate of reported cases of chlamydia per 100,000 population in the 50 most populous metropolitan statistical areas (MSAs) increased 5.5% during 2014–2015 (469.1 to 494.8 cases per 100,000 population, respectively) (Table 6). In 2015, 56.7% of chlamydia cases were reported by these MSAs. During 2014–2015, the rate of reported cases of chlamydia in these MSAs increased 3.1% among women (626.7 to 646.4 cases per 100,000 females) and 10.5% among men (303.4 to 335.4 cases per 100,000 males) (Tables 7 and 8).
Chlamydia by CountyIn 2015, 784 (25.0%) of 3,141 counties had rates of reported chlamydia higher than 444 cases per 100,000 population (Figure 4). Seventy counties and independent cities reported 43.0% of all chlamydia cases in 2015 (Table 9). Of the 70 counties and independent cities reporting the highest number of chlamydia cases, 49 (70.0%) were located in the South and West (Table 9).
Chlamydia by SexIn 2015, 1,045,143 cases of chlamydia were reported among females for a rate of 645.5 cases per 100,000 females (Table 4). After increasing each year during 2000–2011, the rate among females decreased during 2011–2013 from 643.4 to 619.0 cases per 100,000 females (Figure 1). The rate among females increased 0.4% during 2013–2014 and increased 3.8% during 2014–2015, for a total increase of 4.3% since 2013.
After remaining stable during 2012–2013, the rate of reported cases of chlamydia among males increased each year during 2013–2015 (for a total increase of 17.1%). During 2014–2015, the rate among men increased 10.5%, from 276.1 to 305.2 per 100,000 males. As in previous years, the rate of reported chlamydia cases among females was about two times the rate among males in 2015, likely reflecting a larger number of women screened for this infection (Figure 1, Tables 4 and 5). The lower rate among men also suggests that many of the sex partners of women with chlamydia are not receiving a diagnosis of chlamydia or being reported as having chlamydia.
However, with the advent of highly sensitive NAATs that can be performed on urine, chlamydial infection is increasingly being diagnosed in symptomatic and
asymptomatic men. During 2011–2015, rates of reported cases among men increased 20.0% (from 254.4 to 305.2 cases per 100,000 males) compared with a 0.3% increase among women during the same time period (from 643.4 to 645.5 cases per 100,000 females) (Tables 4 and 5).
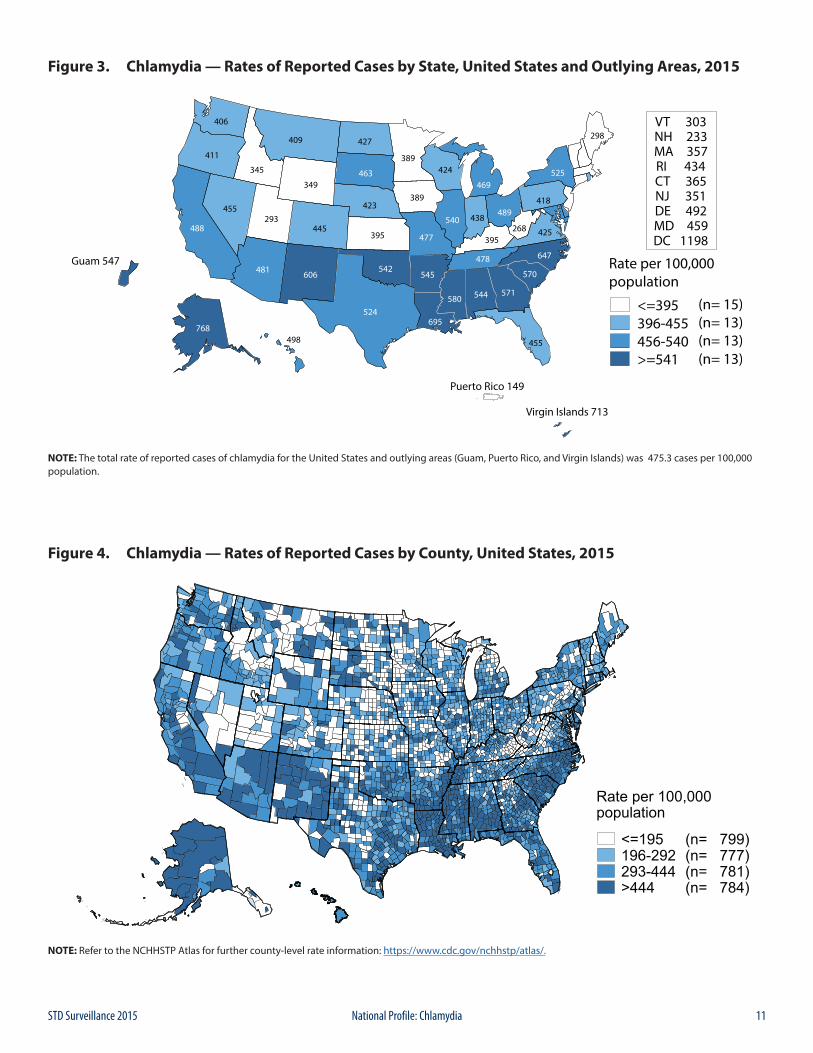
Chlamydia by AgeThe rates of reported cases of chlamydia are highest among adolescents and young adults aged 15–24 years (Table 10). In 2015, the rate of reported cases of chlamydia among 15–19 year olds was 1,857.8 cases per 100,000 population and the rate among 20–24 year olds was 2,574.9 cases per 100,000 population (Table 10).
Among females, the highest age-specific rates of reported cases of chlamydia in 2015 were among those aged 15–19 years (2,994.4 cases per 100,000 females) and 20–24 years (3,730.3 cases per 100,000 females) (Figure 5, Table 10). Within these age groups, rates were highest among women aged 19 years (4,790.9 cases per 100,000 females) and 20 years (4,646.2 cases per 100,000 females) (Table 12). After increasing steadily during 2000–2011, the rate among women aged 15–19 years decreased each year during 2011–2014 (for a total decrease of 15.4%), but increased 1.5% during 2014–2015. The rate increased 2.7% among women aged 20–24 years during 2014–2015 (3,632.7 to 3730.3 per 100,000 females) (Table 10).
In 2015, the age-specific rates of reported cases of chlamydia among men, although substantially lower than rates among women, were highest in those aged 20–24 years (1,467.8 cases per 100,000 males) (Figure 5, Table 10). Similar to trends in women, after increasing for the last decade, rates among men aged 15–19 years decreased each year during 2011–2014 (for a total decrease of 11.5%), but increased 6.3% during 2014–2015 (722.4 to 767.6 per 100,000 males). Among men aged 20–24 years, the rate increased 7.8% during 2014–2015 (1,361.3 to 1,467.8 cases per 100,000 males).
Chlamydia by Race/EthnicityAmong the 50 states that submitted race and ethnicity data in 2015 according to Office of Management and Budget (OMB) standards (see Section A1.5 in the Appendix), rates of reported cases of chlamydia were highest among Black men and women (Figure P, Table 11B). The rate of reported cases of chlamydia among Blacks was 5.9 times the rate among Whites (1,097.6 and 187.2 cases per 100,000 population, respectively). The rate among American Indians/Alaska Natives (709.1 cases per 100,000 population) was 3.8 times the rate among Whites. The rate among Hispanics (372.7 cases per 100,000 population) was 2.0 times the rate among Whites. The rate among Native Hawaiians/Other Pacific Islanders (622.1 cases per 100,000 population) was 3.3 times the rate among Whites.
8 STD Surveillance 2015National Profile: Chlamydia
The rate among Asians was lower than the rate among Whites (114.1 cases per 100,000 population).
During 2011–2015, 45 states submitted race and ethnicity data according to the OMB standards (see Section A1.5 in the Appendix). During 2011–2015, rates of reported chlamydia cases increased among Asians (7.8%), Native Hawaiians/Other Pacific Islanders (8.9%), Whites (14.6%), and Multirace (43.1%), and decreased in Blacks (11.2%) (Figure 6). Rates were stable among American Indians/Alaska Natives and Hispanics during 2011–2015. During 2014–2015, rates increased among Whites (2.6%), Asians (7.2%), Multirace (5.2%), and Hispanics (2.0%), and decreased among American Indians/Alaska Natives (3.5%). Rates were stable among Blacks and Native Hawaiians/Other Pacific Islanders during 2014–2015 (Figure 6).
More information on chlamydia rates among race/ethnicity groups can be found in the Special Focus Profiles.
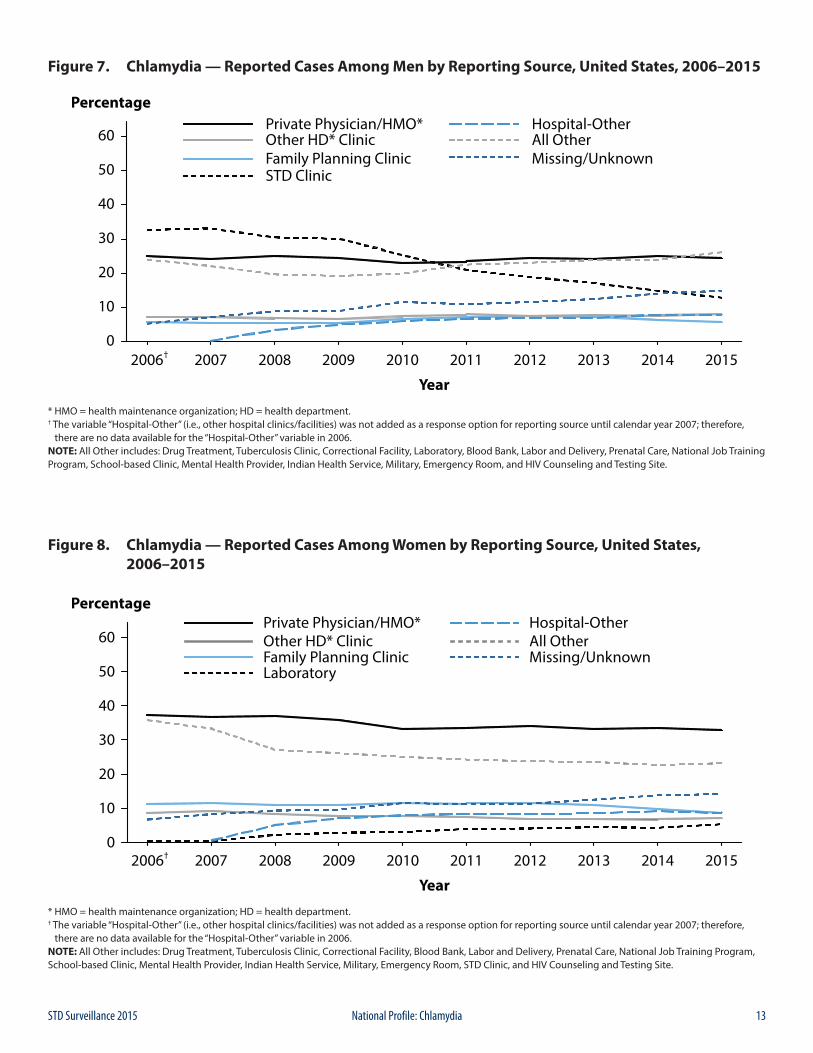
Chlamydia by Reporting SourceIn 2015, 7.2% of chlamydia cases were reported from STD clinics, 78.4% were reported from venues outside of STD clinics, and 14.4% had an unknown source of report (Table A2). Over time, the proportion of male cases reported from STD clinic sites has decreased substantially, from 32.7% in 2006 to 12.9% in 2015 (Figure 7). In 2015, among women, only 4.5% of chlamydia cases were reported through an STD clinic (Table A2). A large proportion of cases among women (32.8%) were reported from private physicians/HMOs (Figure 8). Among men, 12.9% of chlamydia cases were reported from an STD clinic in 2015 and 24.4% were reported from private physicians/HMOs (Table A2, Figure 7).
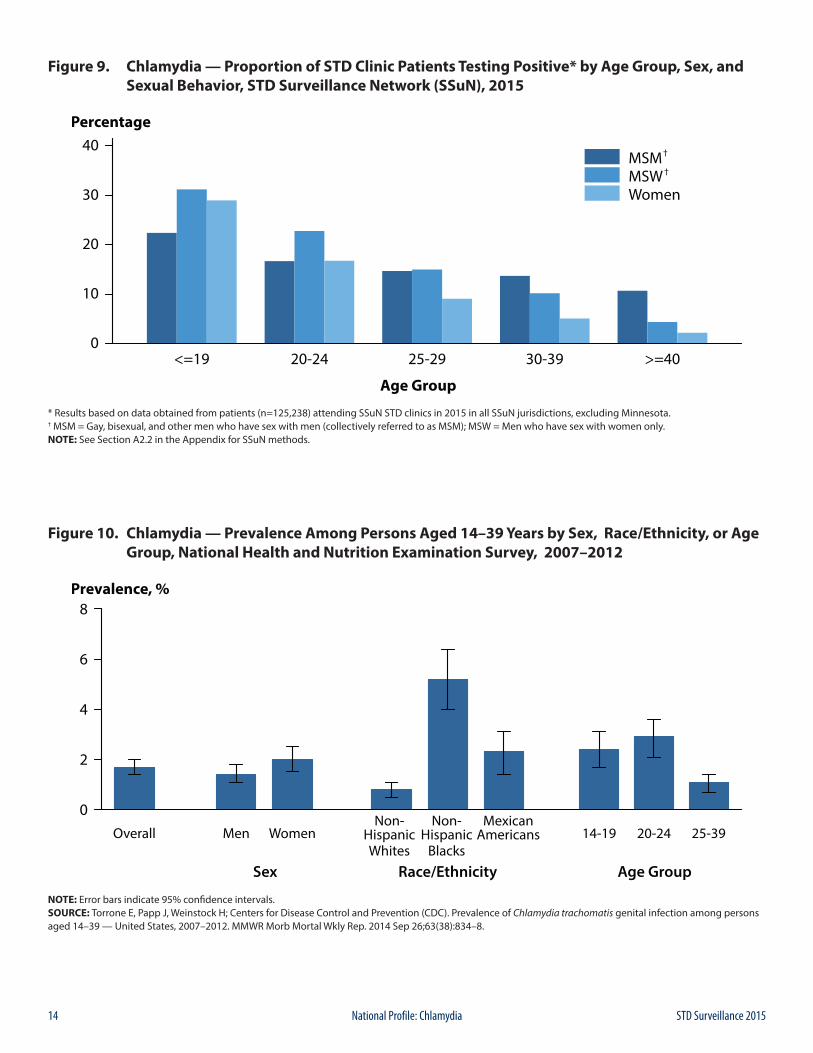
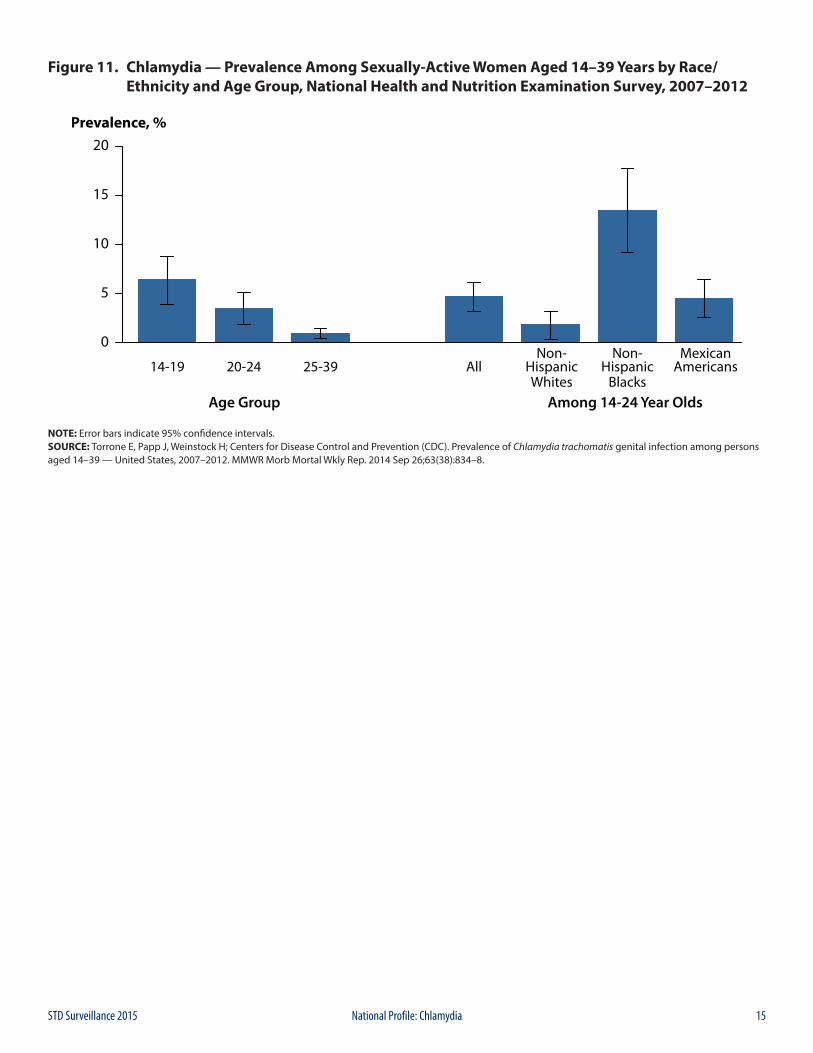
Chlamydia Prevalence in the PopulationThe National Health and Nutrition Examination Survey (NHANES; see Section A2.4 in the Appendix) is a nationally representative survey of the U.S. civilian, non-institutionalized population that provides an important measure of chlamydia disease burden in respondents aged 14–39 years. During 2007–2012, the overall prevalence of chlamydia among persons aged 14–39 years was 1.7% (95% Confidence Interval [CI]: 1.4–2.0) (Figure 10). Among sexually active females aged 14–24 years, the population targeted for screening, prevalence was 4.7% (95% CI: 3.2–6.1), with the highest prevalence among non-Hispanic Black females (13.5%, 95% CI: 9.2–17.7) (Figure 11).1
Chlamydia Positivity in Selected PopulationsThe STD Surveillance Network (SSuN) is an ongoing collaboration of 10 state, county, and city health departments collecting enhanced clinical and behavioral information among patients attending 30 STD clinics in the SSuN jurisdictions (See Section A2.2 of the Appendix).
In 2015, the proportion of STD clinic patients testing positive for chlamydia varied by age, sex, and sexual behavior. Adolescent men who have sex with women only (MSW) had the highest prevalence (31.2%), either reflecting disproportionate testing of men with urethritis or targeted testing of partners of women diagnosed with chlamydia. Prevalence among all those tested decreased with age, though the variation in prevalence by age was not as pronounced for gay, bisexual, and other men who have sex with men (collectively referred to as MSM) (Figure 9).
Chlamydia Among Special PopulationsMore information on chlamydia among women of reproductive age, adolescents and young adults, MSM, and minority populations is presented in the Special Focus Profiles.
Chlamydia SummaryChlamydia continues to be the most commonly reported nationally notifiable disease, with 1,526,658 cases reported in 2015 and increasing rates of reported cases over each of the last two years. Rates of reported chlamydia cases increased 5.9% during 2014–2015. The Southern region of the U.S. reported the highest rate of chlamydial infection in 2015, as well as the largest rate increase during 2014–2015, at 7.0%. However, the Western region experienced the largest rate increase in reported chlamydia cases during 2011–2015, at 10.7%. In 2015, the rate of reported cases of chlamydia in women was 2.1 times the rate in men; however, the rate in men increased 20.0% during 2011–2015, whereas, the rate in women increased only 0.3% during the same time frame. After decreasing during 2011–2014, the rate among women aged 15–19 years increased 1.5% during 2014–2015.
The facilities reporting chlamydial infections have changed over the last 10 years, with most (78.4%) chlamydia cases in 2015 reported from venues outside of STD clinics. The proportion of men being diagnosed with chlamydia in STD clinics decreased 60.6% from 32.7% in 2006 to 12.9%
9STD Surveillance 2015 National Profile: Chlamydia
in 2015, and approximately one-third of chlamydia cases among women were reported from private physicians/HMOs. Racial differences also persist; reported case rates and prevalence estimates among Blacks continue to be substantially higher than among all other racial/ethnic groups. However, both test positivity and the number of reported cases of C. trachomatis infections remain high among most age groups, racial/ethnic groups, geographic areas, and both sexes.
1 Torrone E, Papp J, Weinstock H. Prevalence of Chlamydia trachomatis genital infection among persons aged 14-39 years - United States, 2007-2012. MMWR. 2014 September 26, 2014; 63(38): 834-8.
2 Stamm WE. Chlamydia trachomatis infections in the adult. Sexually Transmitted Diseases. 4th ed. New York, NY: McGraw-Hill; 2008. p. 575-606.
3 Scholes D, Stergachis A, Heidrich FE, et al. Prevention of pelvic inflammatory disease by screening for cervical chlamydial infection. N Engl J Med. 1996; 334(21): 1362-6.
4 Oakeshott P, Kerry S, Aghaizu A, et al. Randomised controlled trial of screening for Chlamydia trachomatis to prevent pelvic inflammatory disease: the POPI (prevention of pelvic infection) trial. BMJ. 2010; 340: c1642.
5 Fleming DT, Wasserheit JN. From epidemiological synergy to public health policy and practice: the contribution of other sexually transmitted diseases to sexual transmission of HIV infection. Sex Transm Infect. 1999; 75(1): 3-17.
6 Centers for Disease Control and Prevention. Sexually transmitted diseases treatment guidelines, 2015. MMWR Recomm Rep. 2015; 64(RR-3): 1-137. Erratum in: MMWR 2015; 64(33): 924.
7 National Committee for Quality Assurance. The state of healthcare quality 2015. Washington, DC: National Committee for Quality Assurance; 2015: p. 67-68.
10 STD Surveillance 2015National Profile: Chlamydia
Figure 1. Chlamydia — Rates of Reported Cases by Sex, United States, 2000–2015
NOTE: Data collection for chlamydia began in 1984 and chlamydia was made nationally notifiable in 1995; however, chlamydia was not reportable in all 50 states and the District of Columbia until 2000. Refer to the National Notifiable Disease Surveillance System (NNDSS) website for more information: https://wwwn.cdc.gov/nndss/conditions/chlamydia-trachomatis-infection/.
Figure 2. Chlamydia — Rates of Reported Cases by Region, United States, 2006–2015
11STD Surveillance 2015 National Profile: Chlamydia
Figure 3. Chlamydia — Rates of Reported Cases by State, United States and Outlying Areas, 2015
NOTE: The total rate of reported cases of chlamydia for the United States and outlying areas (Guam, Puerto Rico, and Virgin Islands) was 475.3 cases per 100,000 population.
Figure 4. Chlamydia — Rates of Reported Cases by County, United States, 2015
NOTE: Refer to the NCHHSTP Atlas for further county-level rate information: https://www.cdc.gov/nchhstp/atlas/.
12 STD Surveillance 2015National Profile: Chlamydia
Figure 5. Chlamydia — Rates of Reported Cases by Age Group and Sex, United States, 2015
Figure 6. Chlamydia — Rates of Reported Cases by Race/Ethnicity, United States, 2011–2015
* AI/AN = American Indians/Alaska Natives; NHOPI = Native Hawaiians/Other Pacific Islanders.NOTE: Includes 45 states reporting race/ethnicity data in Office of Management and Budget compliant formats during 2011–2015 (see Section A1.5 in the Appendix).
13STD Surveillance 2015 National Profile: Chlamydia
Figure 7. Chlamydia — Reported Cases Among Men by Reporting Source, United States, 2006–2015
* HMO = health maintenance organization; HD = health department.† The variable “Hospital-Other” (i.e., other hospital clinics/facilities) was not added as a response option for reporting source until calendar year 2007; therefore, there are no data available for the “Hospital-Other” variable in 2006.NOTE: All Other includes: Drug Treatment, Tuberculosis Clinic, Correctional Facility, Laboratory, Blood Bank, Labor and Delivery, Prenatal Care, National Job Training Program, School-based Clinic, Mental Health Provider, Indian Health Service, Military, Emergency Room, and HIV Counseling and Testing Site.
Figure 8. Chlamydia — Reported Cases Among Women by Reporting Source, United States, 2006–2015
* HMO = health maintenance organization; HD = health department.† The variable “Hospital-Other” (i.e., other hospital clinics/facilities) was not added as a response option for reporting source until calendar year 2007; therefore, there are no data available for the “Hospital-Other” variable in 2006.NOTE: All Other includes: Drug Treatment, Tuberculosis Clinic, Correctional Facility, Blood Bank, Labor and Delivery, Prenatal Care, National Job Training Program, School-based Clinic, Mental Health Provider, Indian Health Service, Military, Emergency Room, STD Clinic, and HIV Counseling and Testing Site.
14 STD Surveillance 2015National Profile: Chlamydia
Figure 9. Chlamydia — Proportion of STD Clinic Patients Testing Positive* by Age Group, Sex, and Sexual Behavior, STD Surveillance Network (SSuN), 2015
* Results based on data obtained from patients (n=125,238) attending SSuN STD clinics in 2015 in all SSuN jurisdictions, excluding Minnesota.† MSM = Gay, bisexual, and other men who have sex with men (collectively referred to as MSM); MSW = Men who have sex with women only.NOTE: See Section A2.2 in the Appendix for SSuN methods.
Figure 10. Chlamydia — Prevalence Among Persons Aged 14–39 Years by Sex, Race/Ethnicity, or Age Group, National Health and Nutrition Examination Survey, 2007–2012
NOTE: Error bars indicate 95% confidence intervals.SOURCE: Torrone E, Papp J, Weinstock H; Centers for Disease Control and Prevention (CDC). Prevalence of Chlamydia trachomatis genital infection among persons aged 14–39 — United States, 2007–2012. MMWR Morb Mortal Wkly Rep. 2014 Sep 26;63(38):834–8.
15STD Surveillance 2015 National Profile: Chlamydia
Figure 11. Chlamydia — Prevalence Among Sexually-Active Women Aged 14–39 Years by Race/ Ethnicity and Age Group, National Health and Nutrition Examination Survey, 2007–2012
NOTE: Error bars indicate 95% confidence intervals.SOURCE: Torrone E, Papp J, Weinstock H; Centers for Disease Control and Prevention (CDC). Prevalence of Chlamydia trachomatis genital infection among persons aged 14–39 — United States, 2007–2012. MMWR Morb Mortal Wkly Rep. 2014 Sep 26;63(38):834–8.

16 STD Surveillance 2015National Profile: Chlamydia
17STD Surveillance 2015 National Profile: Gonorrhea
BackgroundGonorrhea is the second most commonly reported notifiable disease in the United States. Infections due to Neisseria gonorrhoeae, like those resulting from Chlamydia trachomatis, are a major cause of pelvic inflammatory disease (PID) in the United States. PID can lead to serious outcomes in women, such as tubal infertility, ectopic pregnancy, and chronic pelvic pain. In addition, epidemiologic and biologic studies provide evidence that gonococcal infections facilitate the transmission of HIV infection.1 Together, sexual behavior and community prevalence can increase the risk of acquiring gonorrhea. Social determinants of health, such as socioeconomic status, discrimination, and access to quality health care, may contribute to the burden of gonorrhea in a community.2
In 2009, the national rate of reported gonorrhea cases reached an historic low of 98.1 cases per 100,000 population (Figure 12, Table 1). However, during 2009–2012, the rate increased slightly each year to 106.7 cases per 100,000 population in 2012. In 2013, the rate decreased slightly to 105.3 cases per 100,000 population and then during 2013–2015, the rate increased each year. In 2015, a total of 395,216 cases were reported for a rate of 123.9 gonorrhea cases per 100,000 population (Figure 12, Table 1).
The increase in the gonorrhea rate during 2014–2015 was observed among both males and females; however, the increase was larger among males (Figure 13). During 2014–2015, the gonorrhea rate increased in all regions and during 2011–2015, with the largest increase in the West (92.2%; 61.4 to 118.0 cases per 100,000 population) (Figure 14, Table 14). The rate of gonorrhea continued to increase among persons in every age group among those aged 15 years and older during 2014–2015 (Table 21).
N. gonorrhoeae has progressively developed resistance to each of the antimicrobials used for treatment of gonorrhea. Most recently, declining susceptibility to cefixime (an oral cephalosporin antibiotic) resulted in a change to the CDC treatment guidelines, so that dual therapy with ceftriaxone (an injectable cephalosporin) and azithromycin is now the only CDC-recommended treatment regimen for gonorrhea.3 The emerging threat of cephalosporin resistance highlights the need for continued surveillance of N. gonorrhoeae antimicrobial susceptibility.
The combination of persistently high gonorrhea morbidity in some populations and the threat of cephalosporin-resistant gonorrhea reinforces the need to better understand the epidemiology of gonorrhea.
Interpreting Rates of Reported Cases of GonorrheaAlthough gonorrhea case reporting is useful for monitoring disease trends, the number of gonorrhea cases reported to CDC is affected by many factors in addition to the actual occurrence of the infection within the population. Changes in the burden of gonorrhea may be masked by changes in screening practices (e.g., screening for chlamydia with tests that also detect N. gonorrhoeae infections or increased screening at extra-genital anatomic sites), the use of diagnostic tests with different test performance (e.g., the broader use of nucleic acid amplification tests [NAATs]), and changes in reporting practices. As with other STDs, the reporting of gonorrhea cases to CDC is incomplete.4 For these reasons, supplemental data on gonorrhea prevalence in persons screened in a variety of settings are useful in assessing the burden of disease in selected populations.
Gonorrhea — United StatesIn 2015, a total of 395,216 cases of gonorrhea were reported in the United States, yielding a rate of 123.9 gonorrhea cases per 100,000 population (Table 1). Since 2014, the rate of reported gonorrhea cases increased 12.8% since 2014, and increased 19.9% since 2011.
Gonorrhea by RegionIn 2015, as in previous years, the South had the highest rate of reported gonorrhea cases (146.3 cases per 100,000 population) among the four regions of the United States, followed by the West (118.0 cases per 100,000 population), the Midwest (115.7 cases per 100,000 population), and the Northeast (94.2 cases per 100,000 population) (Figure 14, Table 14). This is the first year that the West has had a higher rate than both the Midwest and Northeast. During 2014–2015, the gonorrhea rate increased in all four regions: 18.1% in the West, 12.6% in the South, 11.6% in the Northeast, and 8.9% in the Midwest (Figure 14, Table 14). During 2011–2015, the rate of gonorrhea in the West increased by 92.2% (61.4 to 118.0 cases per 100,000 population) while other regions had smaller overall increases during this time period (i.e., 10.3% in the Northeast, 9.3% in the South, and 4.4% in the Midwest).
Gonorrhea by StateIn 2015, rates of reported gonorrhea cases per 100,000 population ranged by state from 18.5 in New Hampshire to 221.1 in Louisiana; the gonorrhea rate in the District of
Gonorrhea
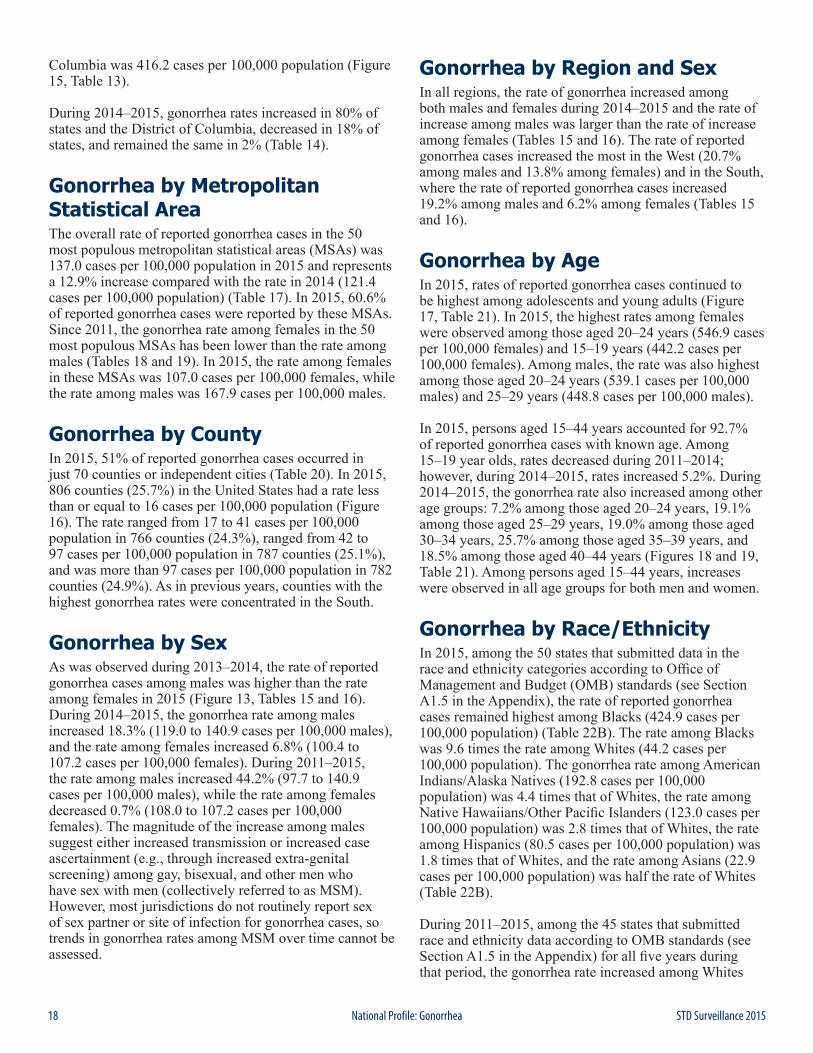
18 STD Surveillance 2015National Profile: Gonorrhea
Columbia was 416.2 cases per 100,000 population (Figure 15, Table 13).
During 2014–2015, gonorrhea rates increased in 80% of states and the District of Columbia, decreased in 18% of states, and remained the same in 2% (Table 14).
Gonorrhea by Metropolitan Statistical Area The overall rate of reported gonorrhea cases in the 50 most populous metropolitan statistical areas (MSAs) was 137.0 cases per 100,000 population in 2015 and represents a 12.9% increase compared with the rate in 2014 (121.4 cases per 100,000 population) (Table 17). In 2015, 60.6% of reported gonorrhea cases were reported by these MSAs. Since 2011, the gonorrhea rate among females in the 50 most populous MSAs has been lower than the rate among males (Tables 18 and 19). In 2015, the rate among females in these MSAs was 107.0 cases per 100,000 females, while the rate among males was 167.9 cases per 100,000 males.
Gonorrhea by CountyIn 2015, 51% of reported gonorrhea cases occurred in just 70 counties or independent cities (Table 20). In 2015, 806 counties (25.7%) in the United States had a rate less than or equal to 16 cases per 100,000 population (Figure 16). The rate ranged from 17 to 41 cases per 100,000 population in 766 counties (24.3%), ranged from 42 to 97 cases per 100,000 population in 787 counties (25.1%), and was more than 97 cases per 100,000 population in 782 counties (24.9%). As in previous years, counties with the highest gonorrhea rates were concentrated in the South.
Gonorrhea by SexAs was observed during 2013–2014, the rate of reported gonorrhea cases among males was higher than the rate among females in 2015 (Figure 13, Tables 15 and 16). During 2014–2015, the gonorrhea rate among males increased 18.3% (119.0 to 140.9 cases per 100,000 males), and the rate among females increased 6.8% (100.4 to 107.2 cases per 100,000 females). During 2011–2015, the rate among males increased 44.2% (97.7 to 140.9 cases per 100,000 males), while the rate among females decreased 0.7% (108.0 to 107.2 cases per 100,000 females). The magnitude of the increase among males suggest either increased transmission or increased case ascertainment (e.g., through increased extra-genital screening) among gay, bisexual, and other men who have sex with men (collectively referred to as MSM). However, most jurisdictions do not routinely report sex of sex partner or site of infection for gonorrhea cases, so trends in gonorrhea rates among MSM over time cannot be assessed.
Gonorrhea by Region and SexIn all regions, the rate of gonorrhea increased among both males and females during 2014–2015 and the rate of increase among males was larger than the rate of increase among females (Tables 15 and 16). The rate of reported gonorrhea cases increased the most in the West (20.7% among males and 13.8% among females) and in the South, where the rate of reported gonorrhea cases increased 19.2% among males and 6.2% among females (Tables 15 and 16).
Gonorrhea by AgeIn 2015, rates of reported gonorrhea cases continued to be highest among adolescents and young adults (Figure 17, Table 21). In 2015, the highest rates among females were observed among those aged 20–24 years (546.9 cases per 100,000 females) and 15–19 years (442.2 cases per 100,000 females). Among males, the rate was also highest among those aged 20–24 years (539.1 cases per 100,000 males) and 25–29 years (448.8 cases per 100,000 males).
In 2015, persons aged 15–44 years accounted for 92.7% of reported gonorrhea cases with known age. Among 15–19 year olds, rates decreased during 2011–2014; however, during 2014–2015, rates increased 5.2%. During 2014–2015, the gonorrhea rate also increased among other age groups: 7.2% among those aged 20–24 years, 19.1% among those aged 25–29 years, 19.0% among those aged 30–34 years, 25.7% among those aged 35–39 years, and 18.5% among those aged 40–44 years (Figures 18 and 19, Table 21). Among persons aged 15–44 years, increases were observed in all age groups for both men and women.
Gonorrhea by Race/EthnicityIn 2015, among the 50 states that submitted data in the race and ethnicity categories according to Office of Management and Budget (OMB) standards (see Section A1.5 in the Appendix), the rate of reported gonorrhea cases remained highest among Blacks (424.9 cases per 100,000 population) (Table 22B). The rate among Blacks was 9.6 times the rate among Whites (44.2 cases per 100,000 population). The gonorrhea rate among American Indians/Alaska Natives (192.8 cases per 100,000 population) was 4.4 times that of Whites, the rate among Native Hawaiians/Other Pacific Islanders (123.0 cases per 100,000 population) was 2.8 times that of Whites, the rate among Hispanics (80.5 cases per 100,000 population) was 1.8 times that of Whites, and the rate among Asians (22.9 cases per 100,000 population) was half the rate of Whites (Table 22B).
During 2011–2015, among the 45 states that submitted race and ethnicity data according to OMB standards (see Section A1.5 in the Appendix) for all five years during that period, the gonorrhea rate increased among Whites
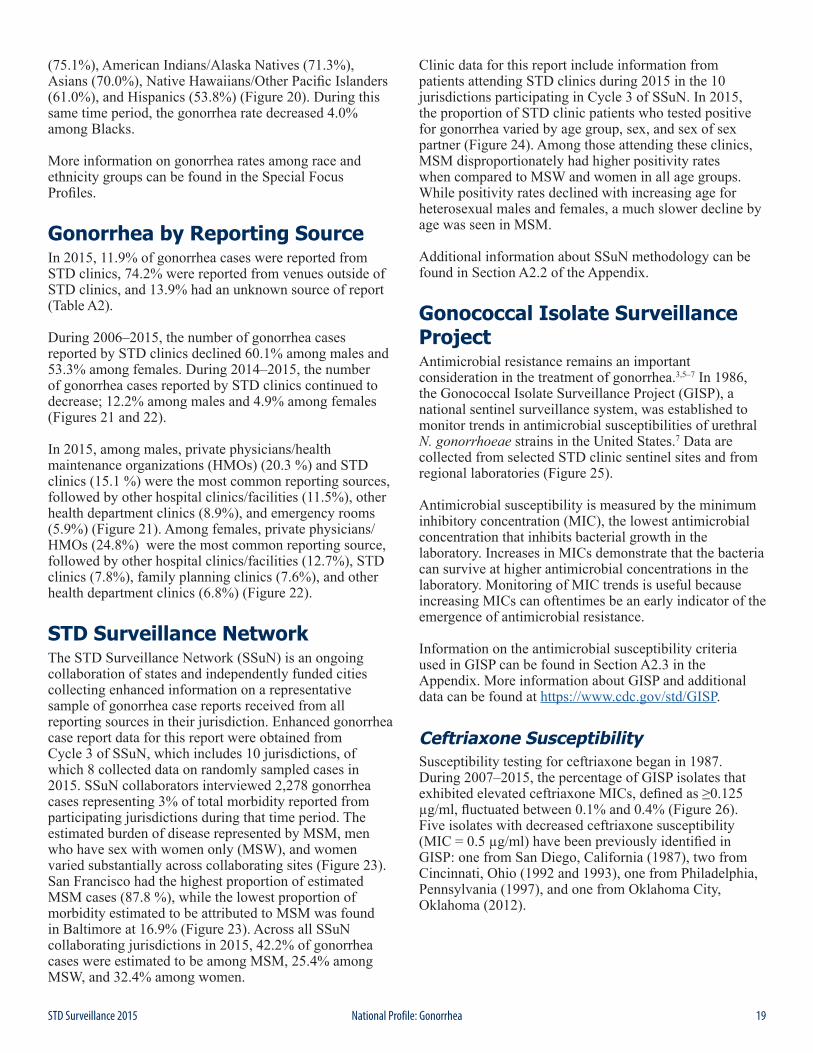
19STD Surveillance 2015 National Profile: Gonorrhea
(75.1%), American Indians/Alaska Natives (71.3%), Asians (70.0%), Native Hawaiians/Other Pacific Islanders (61.0%), and Hispanics (53.8%) (Figure 20). During this same time period, the gonorrhea rate decreased 4.0% among Blacks.
More information on gonorrhea rates among race and ethnicity groups can be found in the Special Focus Profiles.
Gonorrhea by Reporting SourceIn 2015, 11.9% of gonorrhea cases were reported from STD clinics, 74.2% were reported from venues outside of STD clinics, and 13.9% had an unknown source of report (Table A2).
During 2006–2015, the number of gonorrhea cases reported by STD clinics declined 60.1% among males and 53.3% among females. During 2014–2015, the number of gonorrhea cases reported by STD clinics continued to decrease; 12.2% among males and 4.9% among females (Figures 21 and 22).
In 2015, among males, private physicians/health maintenance organizations (HMOs) (20.3 %) and STD clinics (15.1 %) were the most common reporting sources, followed by other hospital clinics/facilities (11.5%), other health department clinics (8.9%), and emergency rooms (5.9%) (Figure 21). Among females, private physicians/HMOs (24.8%) were the most common reporting source, followed by other hospital clinics/facilities (12.7%), STD clinics (7.8%), family planning clinics (7.6%), and other health department clinics (6.8%) (Figure 22).
STD Surveillance NetworkThe STD Surveillance Network (SSuN) is an ongoing collaboration of states and independently funded cities collecting enhanced information on a representative sample of gonorrhea case reports received from all reporting sources in their jurisdiction. Enhanced gonorrhea case report data for this report were obtained from Cycle 3 of SSuN, which includes 10 jurisdictions, of which 8 collected data on randomly sampled cases in 2015. SSuN collaborators interviewed 2,278 gonorrhea cases representing 3% of total morbidity reported from participating jurisdictions during that time period. The estimated burden of disease represented by MSM, men who have sex with women only (MSW), and women varied substantially across collaborating sites (Figure 23). San Francisco had the highest proportion of estimated MSM cases (87.8 %), while the lowest proportion of morbidity estimated to be attributed to MSM was found in Baltimore at 16.9% (Figure 23). Across all SSuN collaborating jurisdictions in 2015, 42.2% of gonorrhea cases were estimated to be among MSM, 25.4% among MSW, and 32.4% among women.
Clinic data for this report include information from patients attending STD clinics during 2015 in the 10 jurisdictions participating in Cycle 3 of SSuN. In 2015, the proportion of STD clinic patients who tested positive for gonorrhea varied by age group, sex, and sex of sex partner (Figure 24). Among those attending these clinics, MSM disproportionately had higher positivity rates when compared to MSW and women in all age groups. While positivity rates declined with increasing age for heterosexual males and females, a much slower decline by age was seen in MSM.
Additional information about SSuN methodology can be found in Section A2.2 of the Appendix.
Gonococcal Isolate Surveillance ProjectAntimicrobial resistance remains an important consideration in the treatment of gonorrhea.3,5–7 In 1986, the Gonococcal Isolate Surveillance Project (GISP), a national sentinel surveillance system, was established to monitor trends in antimicrobial susceptibilities of urethral N. gonorrhoeae strains in the United States.7 Data are collected from selected STD clinic sentinel sites and from regional laboratories (Figure 25).
Antimicrobial susceptibility is measured by the minimum inhibitory concentration (MIC), the lowest antimicrobial concentration that inhibits bacterial growth in the laboratory. Increases in MICs demonstrate that the bacteria can survive at higher antimicrobial concentrations in the laboratory. Monitoring of MIC trends is useful because increasing MICs can oftentimes be an early indicator of the emergence of antimicrobial resistance.
Information on the antimicrobial susceptibility criteria used in GISP can be found in Section A2.3 in the Appendix. More information about GISP and additional data can be found at https://www.cdc.gov/std/GISP.
Ceftriaxone SusceptibilitySusceptibility testing for ceftriaxone began in 1987. During 2007–2015, the percentage of GISP isolates that exhibited elevated ceftriaxone MICs, defined as ≥0.125 µg/ml, fluctuated between 0.1% and 0.4% (Figure 26). Five isolates with decreased ceftriaxone susceptibility (MIC = 0.5 µg/ml) have been previously identified in GISP: one from San Diego, California (1987), two from Cincinnati, Ohio (1992 and 1993), one from Philadelphia, Pennsylvania (1997), and one from Oklahoma City, Oklahoma (2012).
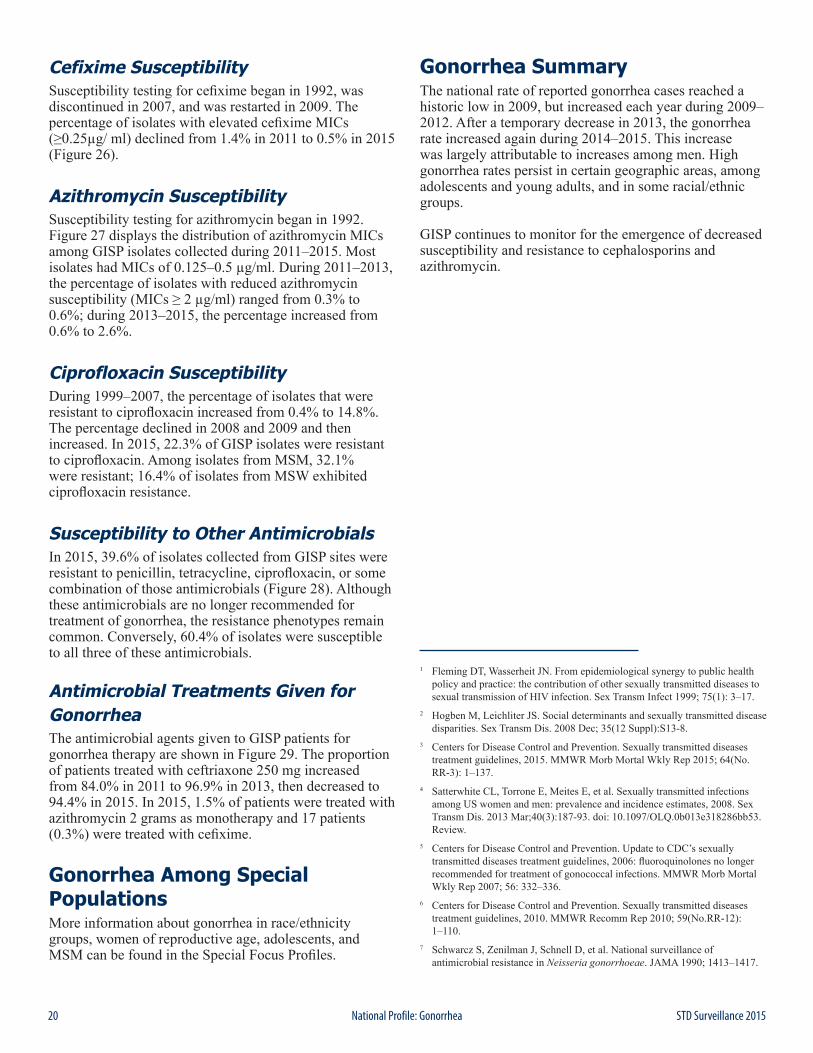
20 STD Surveillance 2015National Profile: Gonorrhea
Cefixime SusceptibilitySusceptibility testing for cefixime began in 1992, was discontinued in 2007, and was restarted in 2009. The percentage of isolates with elevated cefixime MICs (≥0.25µg/ ml) declined from 1.4% in 2011 to 0.5% in 2015 (Figure 26).
Azithromycin SusceptibilitySusceptibility testing for azithromycin began in 1992. Figure 27 displays the distribution of azithromycin MICs among GISP isolates collected during 2011–2015. Most isolates had MICs of 0.125–0.5 µg/ml. During 2011–2013, the percentage of isolates with reduced azithromycin susceptibility (MICs ≥ 2 µg/ml) ranged from 0.3% to 0.6%; during 2013–2015, the percentage increased from 0.6% to 2.6%.
Ciprofloxacin SusceptibilityDuring 1999–2007, the percentage of isolates that were resistant to ciprofloxacin increased from 0.4% to 14.8%. The percentage declined in 2008 and 2009 and then increased. In 2015, 22.3% of GISP isolates were resistant to ciprofloxacin. Among isolates from MSM, 32.1% were resistant; 16.4% of isolates from MSW exhibited ciprofloxacin resistance.
Susceptibility to Other AntimicrobialsIn 2015, 39.6% of isolates collected from GISP sites were resistant to penicillin, tetracycline, ciprofloxacin, or some combination of those antimicrobials (Figure 28). Although these antimicrobials are no longer recommended for treatment of gonorrhea, the resistance phenotypes remain common. Conversely, 60.4% of isolates were susceptible to all three of these antimicrobials.
Antimicrobial Treatments Given for GonorrheaThe antimicrobial agents given to GISP patients for gonorrhea therapy are shown in Figure 29. The proportion of patients treated with ceftriaxone 250 mg increased from 84.0% in 2011 to 96.9% in 2013, then decreased to 94.4% in 2015. In 2015, 1.5% of patients were treated with azithromycin 2 grams as monotherapy and 17 patients (0.3%) were treated with cefixime.
Gonorrhea Among Special PopulationsMore information about gonorrhea in race/ethnicity groups, women of reproductive age, adolescents, and MSM can be found in the Special Focus Profiles.
Gonorrhea SummaryThe national rate of reported gonorrhea cases reached a historic low in 2009, but increased each year during 2009– 2012. After a temporary decrease in 2013, the gonorrhea rate increased again during 2014–2015. This increase was largely attributable to increases among men. High gonorrhea rates persist in certain geographic areas, among adolescents and young adults, and in some racial/ethnic groups.
GISP continues to monitor for the emergence of decreased susceptibility and resistance to cephalosporins and azithromycin.
1 Fleming DT, Wasserheit JN. From epidemiological synergy to public health policy and practice: the contribution of other sexually transmitted diseases to sexual transmission of HIV infection. Sex Transm Infect 1999; 75(1): 3–17.
2 Hogben M, Leichliter JS. Social determinants and sexually transmitted disease disparities. Sex Transm Dis. 2008 Dec; 35(12 Suppl):S13-8.
3 Centers for Disease Control and Prevention. Sexually transmitted diseases treatment guidelines, 2015. MMWR Morb Mortal Wkly Rep 2015; 64(No. RR-3): 1–137.
4 Satterwhite CL, Torrone E, Meites E, et al. Sexually transmitted infections among US women and men: prevalence and incidence estimates, 2008. Sex Transm Dis. 2013 Mar;40(3):187-93. doi: 10.1097/OLQ.0b013e318286bb53. Review.
5 Centers for Disease Control and Prevention. Update to CDC’s sexually transmitted diseases treatment guidelines, 2006: fluoroquinolones no longer recommended for treatment of gonococcal infections. MMWR Morb Mortal Wkly Rep 2007; 56: 332–336.
6 Centers for Disease Control and Prevention. Sexually transmitted diseases treatment guidelines, 2010. MMWR Recomm Rep 2010; 59(No.RR-12): 1–110.
7 Schwarcz S, Zenilman J, Schnell D, et al. National surveillance of antimicrobial resistance in Neisseria gonorrhoeae. JAMA 1990; 1413–1417.
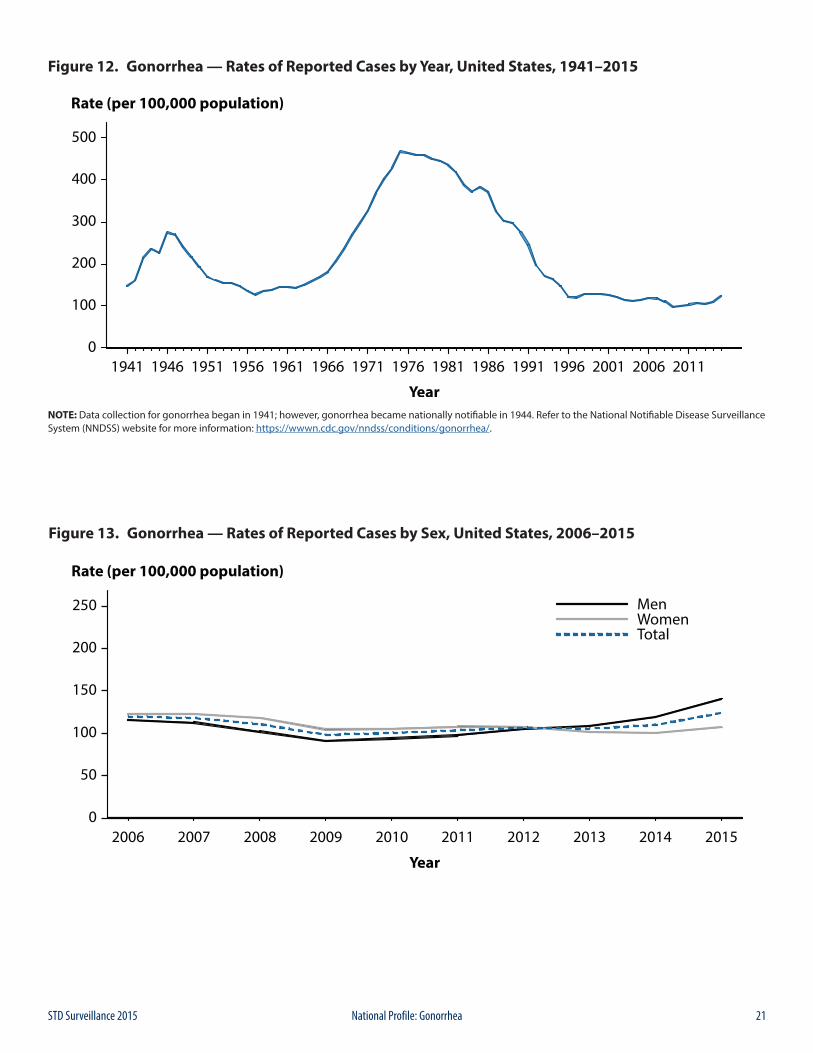
21STD Surveillance 2015 National Profile: Gonorrhea
Figure 12. Gonorrhea — Rates of Reported Cases by Year, United States, 1941–2015
NOTE: Data collection for gonorrhea began in 1941; however, gonorrhea became nationally notifiable in 1944. Refer to the National Notifiable Disease Surveillance System (NNDSS) website for more information: https://wwwn.cdc.gov/nndss/conditions/gonorrhea/.
Figure 13. Gonorrhea — Rates of Reported Cases by Sex, United States, 2006–2015
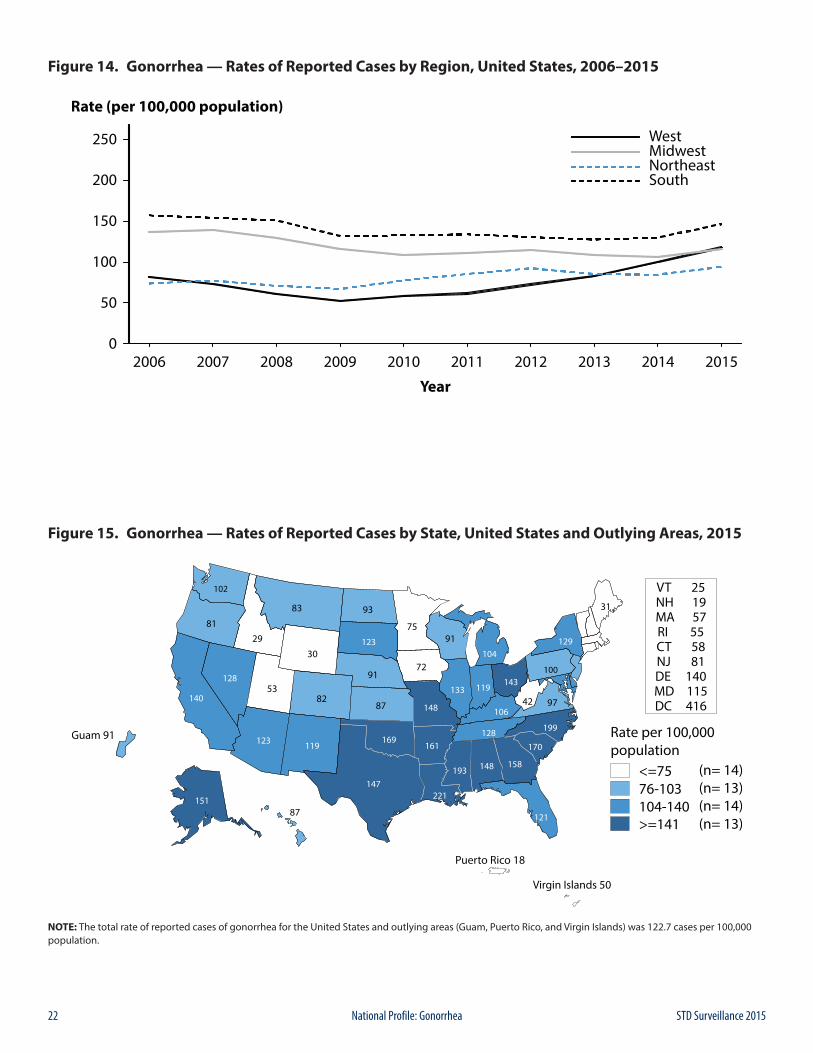
22 STD Surveillance 2015National Profile: Gonorrhea
Figure 14. Gonorrhea — Rates of Reported Cases by Region, United States, 2006–2015
Figure 15. Gonorrhea — Rates of Reported Cases by State, United States and Outlying Areas, 2015
NOTE: The total rate of reported cases of gonorrhea for the United States and outlying areas (Guam, Puerto Rico, and Virgin Islands) was 122.7 cases per 100,000 population.
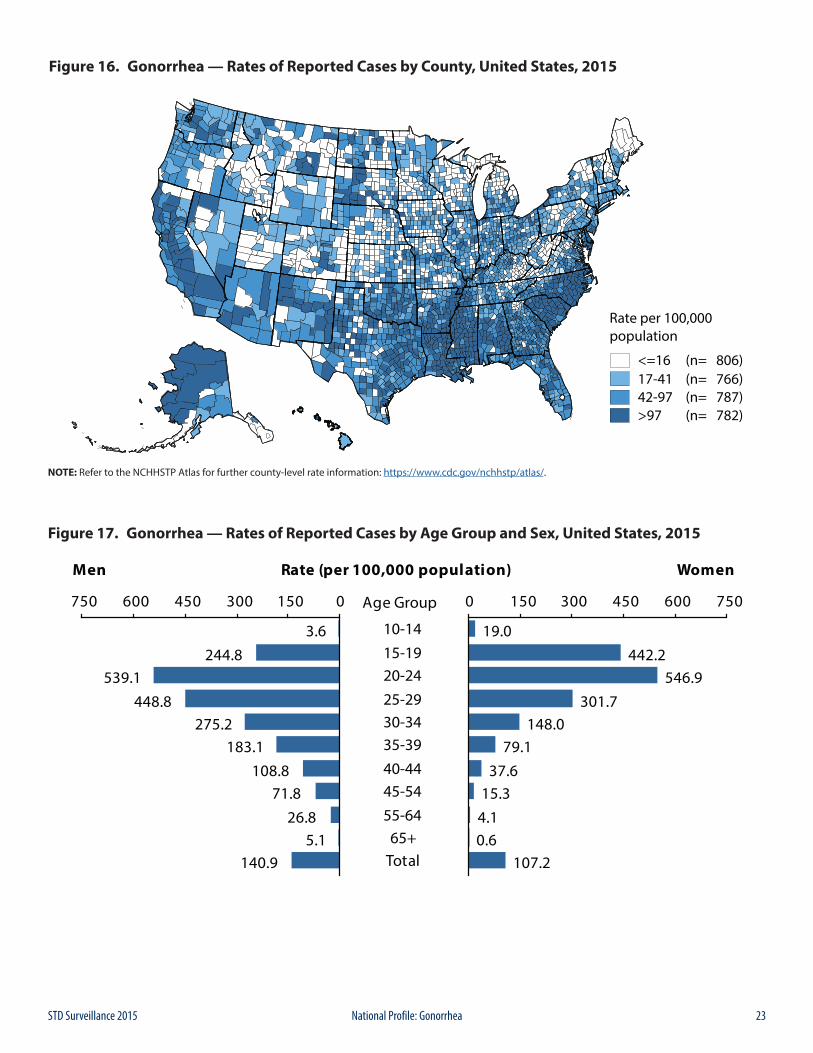
23STD Surveillance 2015 National Profile: Gonorrhea
Figure 16. Gonorrhea — Rates of Reported Cases by County, United States, 2015
NOTE: Refer to the NCHHSTP Atlas for further county-level rate information: https://www.cdc.gov/nchhstp/atlas/.
Figure 17. Gonorrhea — Rates of Reported Cases by Age Group and Sex, United States, 2015
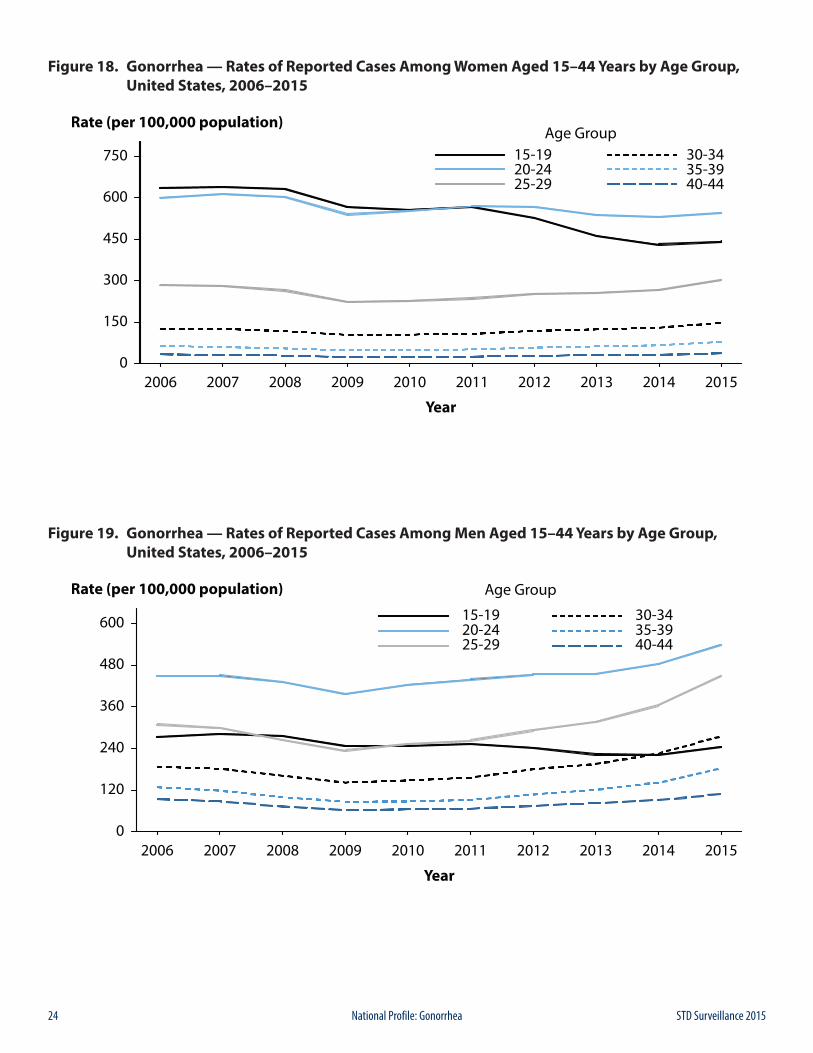
24 STD Surveillance 2015National Profile: Gonorrhea
Figure 18. Gonorrhea — Rates of Reported Cases Among Women Aged 15–44 Years by Age Group, United States, 2006–2015
Figure 19. Gonorrhea — Rates of Reported Cases Among Men Aged 15–44 Years by Age Group, United States, 2006–2015
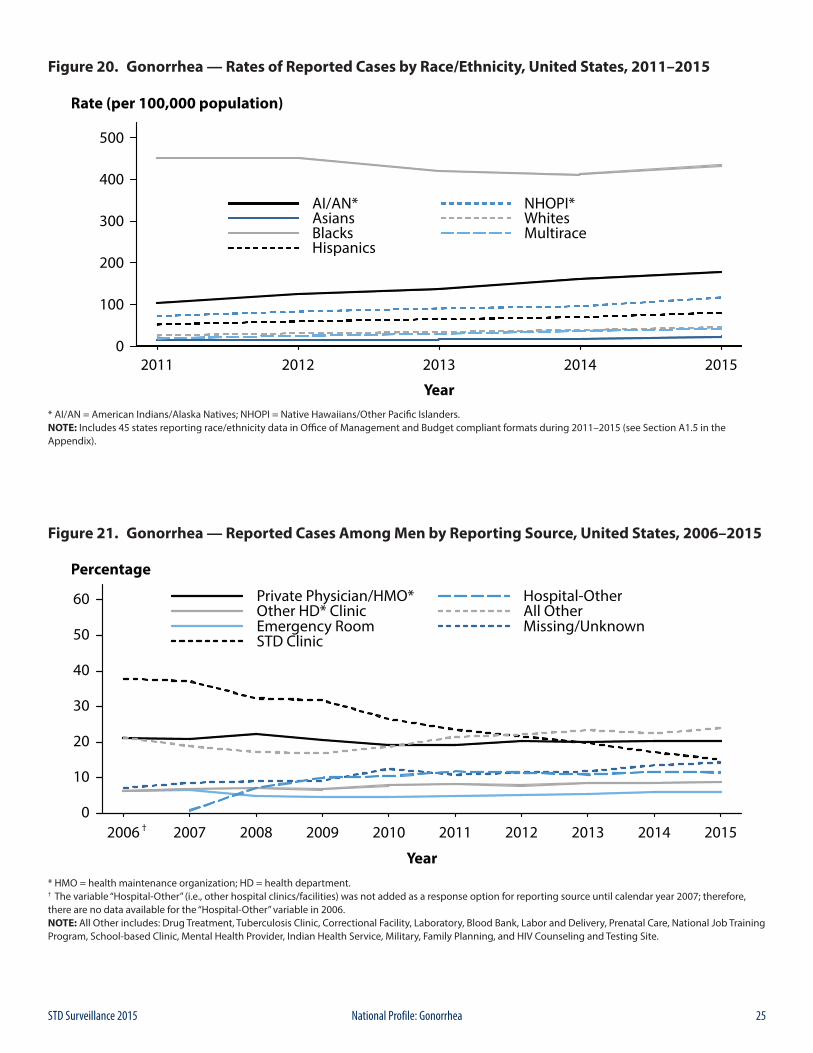
25STD Surveillance 2015 National Profile: Gonorrhea
Figure 20. Gonorrhea — Rates of Reported Cases by Race/Ethnicity, United States, 2011–2015
* AI/AN = American Indians/Alaska Natives; NHOPI = Native Hawaiians/Other Pacific Islanders.NOTE: Includes 45 states reporting race/ethnicity data in Office of Management and Budget compliant formats during 2011–2015 (see Section A1.5 in the Appendix).
Figure 21. Gonorrhea — Reported Cases Among Men by Reporting Source, United States, 2006–2015
* HMO = health maintenance organization; HD = health department.† The variable “Hospital-Other” (i.e., other hospital clinics/facilities) was not added as a response option for reporting source until calendar year 2007; therefore, there are no data available for the “Hospital-Other” variable in 2006.NOTE: All Other includes: Drug Treatment, Tuberculosis Clinic, Correctional Facility, Laboratory, Blood Bank, Labor and Delivery, Prenatal Care, National Job Training Program, School-based Clinic, Mental Health Provider, Indian Health Service, Military, Family Planning, and HIV Counseling and Testing Site.
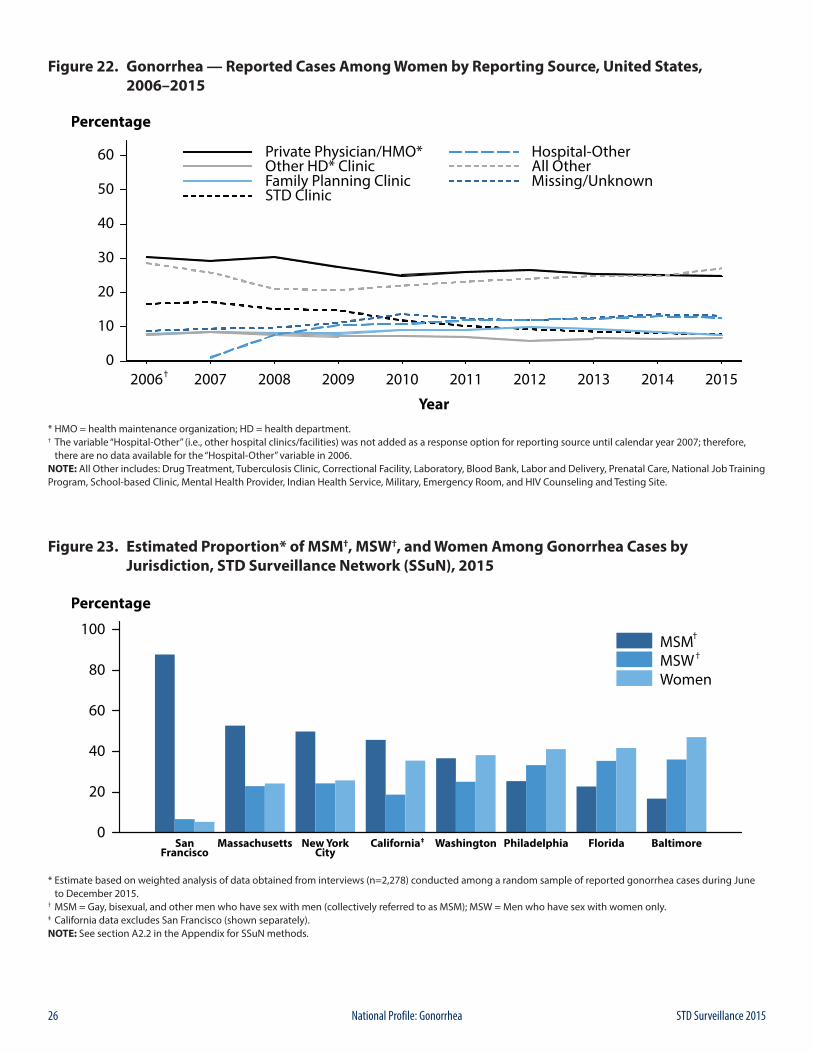
26 STD Surveillance 2015National Profile: Gonorrhea
Figure 22. Gonorrhea — Reported Cases Among Women by Reporting Source, United States, 2006–2015
* HMO = health maintenance organization; HD = health department.† The variable “Hospital-Other” (i.e., other hospital clinics/facilities) was not added as a response option for reporting source until calendar year 2007; therefore, there are no data available for the “Hospital-Other” variable in 2006.NOTE: All Other includes: Drug Treatment, Tuberculosis Clinic, Correctional Facility, Laboratory, Blood Bank, Labor and Delivery, Prenatal Care, National Job Training Program, School-based Clinic, Mental Health Provider, Indian Health Service, Military, Emergency Room, and HIV Counseling and Testing Site.
Figure 23. Estimated Proportion* of MSM†, MSW†, and Women Among Gonorrhea Cases by Jurisdiction, STD Surveillance Network (SSuN), 2015
* Estimate based on weighted analysis of data obtained from interviews (n=2,278) conducted among a random sample of reported gonorrhea cases during June to December 2015.† MSM = Gay, bisexual, and other men who have sex with men (collectively referred to as MSM); MSW = Men who have sex with women only.‡ California data excludes San Francisco (shown separately).NOTE: See section A2.2 in the Appendix for SSuN methods.
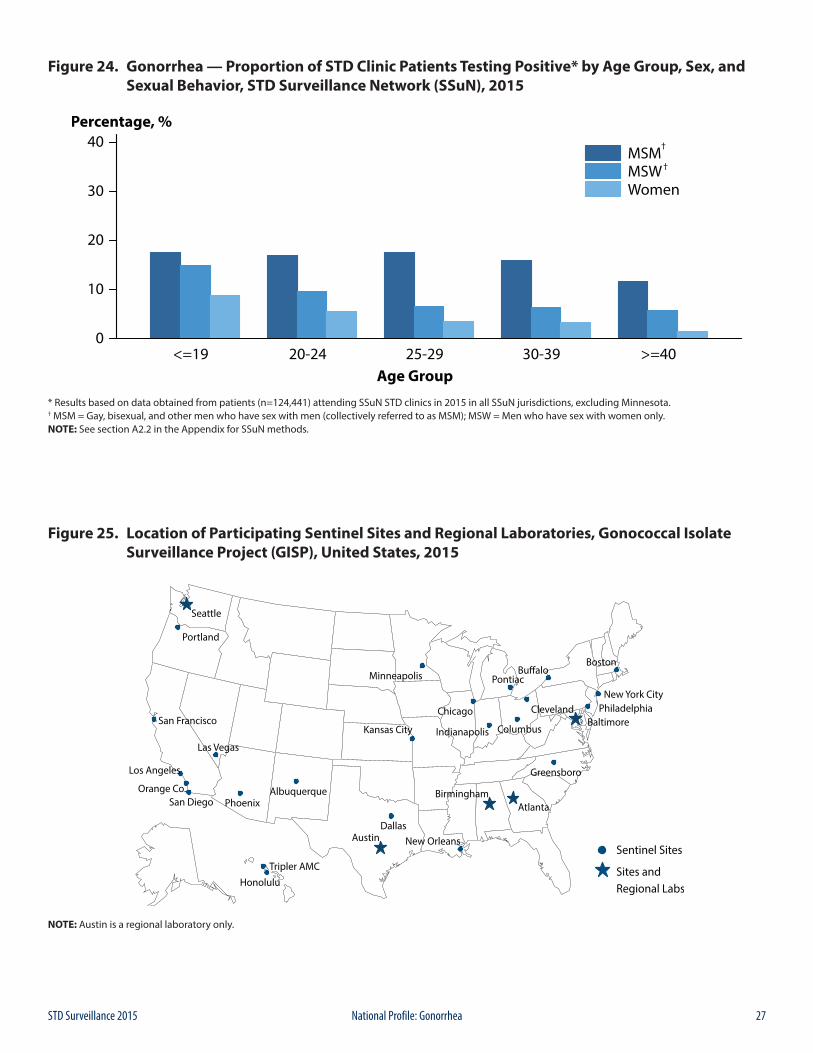
27STD Surveillance 2015 National Profile: Gonorrhea
Figure 24. Gonorrhea — Proportion of STD Clinic Patients Testing Positive* by Age Group, Sex, and Sexual Behavior, STD Surveillance Network (SSuN), 2015
* Results based on data obtained from patients (n=124,441) attending SSuN STD clinics in 2015 in all SSuN jurisdictions, excluding Minnesota.† MSM = Gay, bisexual, and other men who have sex with men (collectively referred to as MSM); MSW = Men who have sex with women only.NOTE: See section A2.2 in the Appendix for SSuN methods.
Figure 25. Location of Participating Sentinel Sites and Regional Laboratories, Gonococcal Isolate Surveillance Project (GISP), United States, 2015
NOTE: Austin is a regional laboratory only.
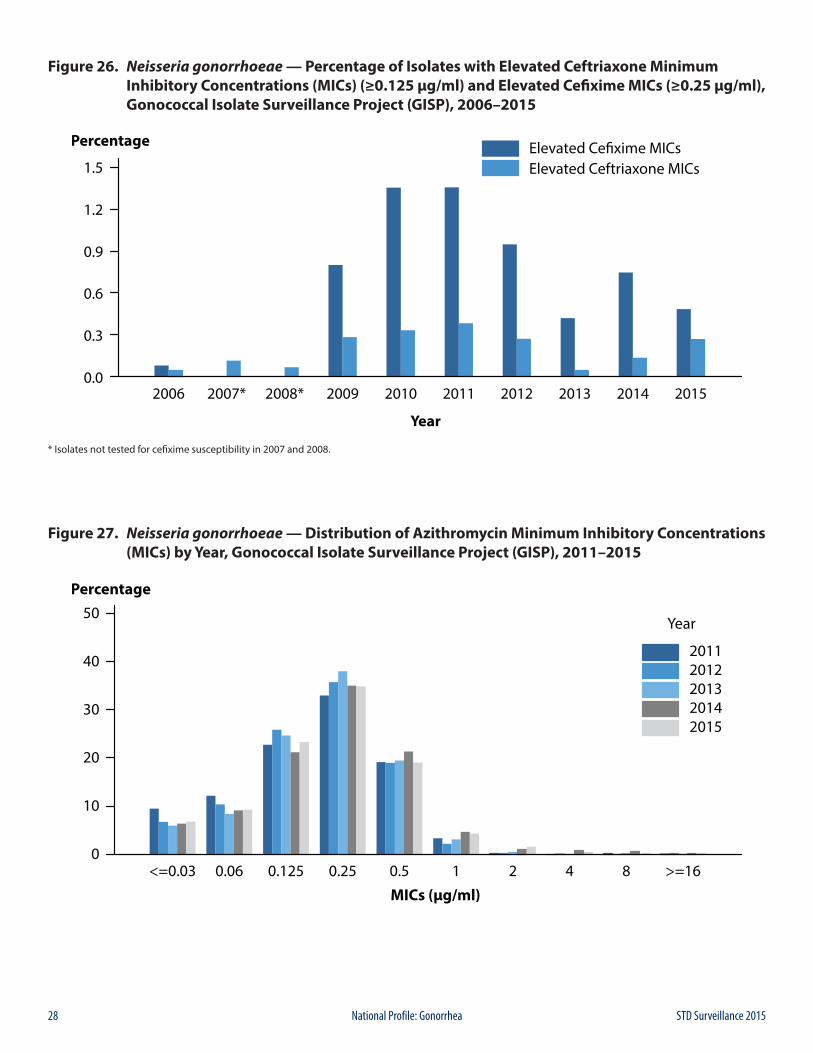
28 STD Surveillance 2015National Profile: Gonorrhea
Figure 26. Neisseria gonorrhoeae — Percentage of Isolates with Elevated Ceftriaxone Minimum Inhibitory Concentrations (MICs) (≥0.125 µg/ml) and Elevated Cefixime MICs (≥0.25 µg/ml), Gonococcal Isolate Surveillance Project (GISP), 2006–2015
* Isolates not tested for cefixime susceptibility in 2007 and 2008.
Figure 27. Neisseria gonorrhoeae — Distribution of Azithromycin Minimum Inhibitory Concentrations (MICs) by Year, Gonococcal Isolate Surveillance Project (GISP), 2011–2015
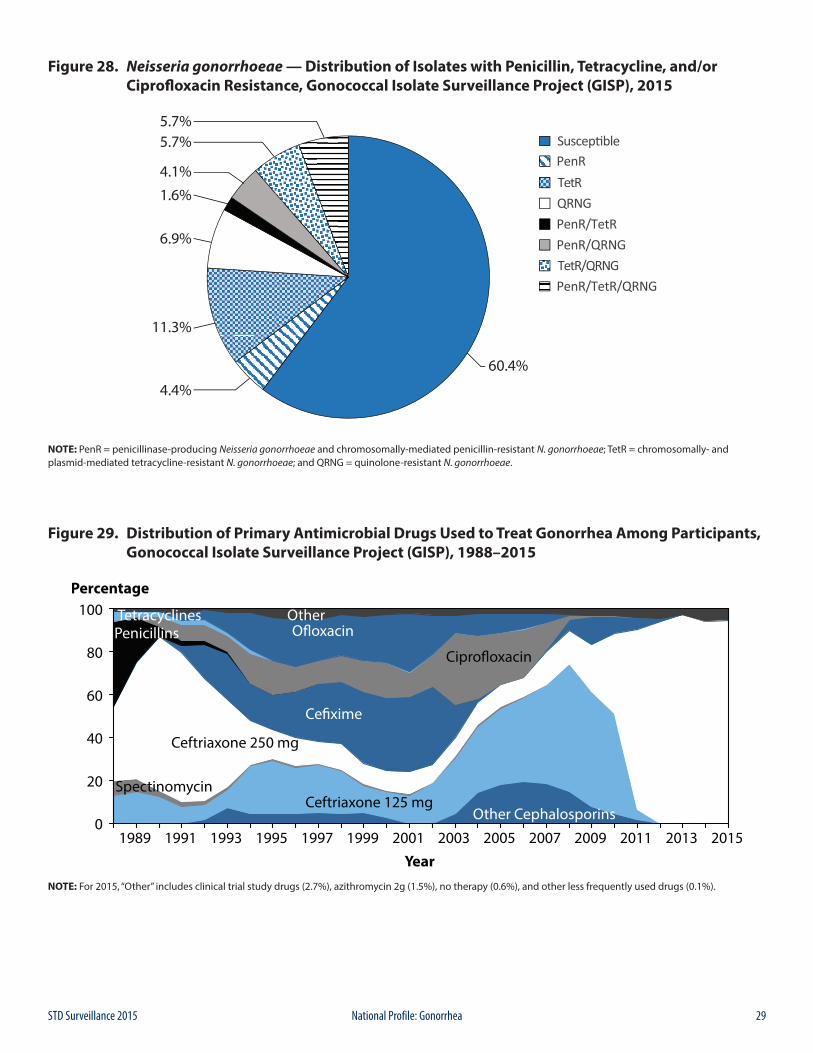
29STD Surveillance 2015 National Profile: Gonorrhea
Figure 28. Neisseria gonorrhoeae — Distribution of Isolates with Penicillin, Tetracycline, and/or Ciprofloxacin Resistance, Gonococcal Isolate Surveillance Project (GISP), 2015
NOTE: PenR = penicillinase-producing Neisseria gonorrhoeae and chromosomally-mediated penicillin-resistant N. gonorrhoeae; TetR = chromosomally- and plasmid-mediated tetracycline-resistant N. gonorrhoeae; and QRNG = quinolone-resistant N. gonorrhoeae.
Figure 29. Distribution of Primary Antimicrobial Drugs Used to Treat Gonorrhea Among Participants, Gonococcal Isolate Surveillance Project (GISP), 1988–2015
NOTE: For 2015, “Other” includes clinical trial study drugs (2.7%), azithromycin 2g (1.5%), no therapy (0.6%), and other less frequently used drugs (0.1%).

30 STD Surveillance 2015National Profile: Gonorrhea
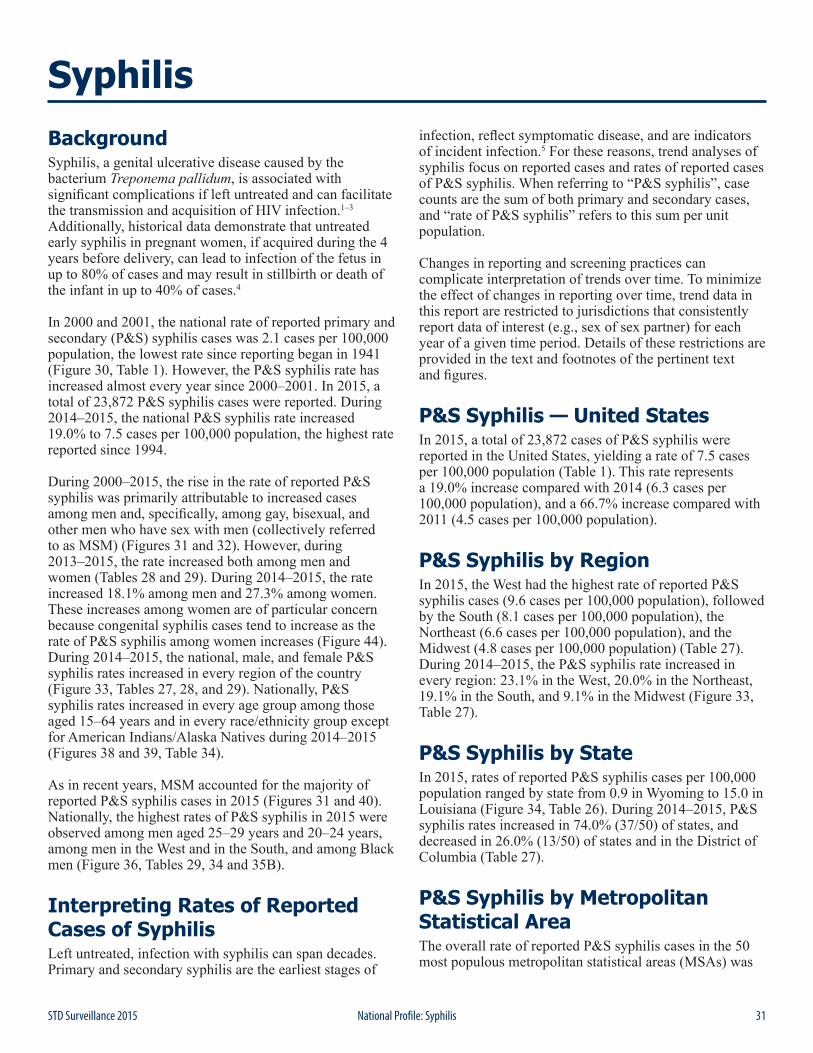
31STD Surveillance 2015 National Profile: Syphilis
BackgroundSyphilis, a genital ulcerative disease caused by the bacterium Treponema pallidum, is associated with significant complications if left untreated and can facilitate the transmission and acquisition of HIV infection.1–3 Additionally, historical data demonstrate that untreated early syphilis in pregnant women, if acquired during the 4 years before delivery, can lead to infection of the fetus in up to 80% of cases and may result in stillbirth or death of the infant in up to 40% of cases.4
In 2000 and 2001, the national rate of reported primary and secondary (P&S) syphilis cases was 2.1 cases per 100,000 population, the lowest rate since reporting began in 1941 (Figure 30, Table 1). However, the P&S syphilis rate has increased almost every year since 2000–2001. In 2015, a total of 23,872 P&S syphilis cases were reported. During 2014–2015, the national P&S syphilis rate increased 19.0% to 7.5 cases per 100,000 population, the highest rate reported since 1994.
During 2000–2015, the rise in the rate of reported P&S syphilis was primarily attributable to increased cases among men and, specifically, among gay, bisexual, and other men who have sex with men (collectively referred to as MSM) (Figures 31 and 32). However, during 2013–2015, the rate increased both among men and women (Tables 28 and 29). During 2014–2015, the rate increased 18.1% among men and 27.3% among women. These increases among women are of particular concern because congenital syphilis cases tend to increase as the rate of P&S syphilis among women increases (Figure 44). During 2014–2015, the national, male, and female P&S syphilis rates increased in every region of the country (Figure 33, Tables 27, 28, and 29). Nationally, P&S syphilis rates increased in every age group among those aged 15–64 years and in every race/ethnicity group except for American Indians/Alaska Natives during 2014–2015 (Figures 38 and 39, Table 34).
As in recent years, MSM accounted for the majority of reported P&S syphilis cases in 2015 (Figures 31 and 40). Nationally, the highest rates of P&S syphilis in 2015 were observed among men aged 25–29 years and 20–24 years, among men in the West and in the South, and among Black men (Figure 36, Tables 29, 34 and 35B).
Interpreting Rates of Reported Cases of SyphilisLeft untreated, infection with syphilis can span decades. Primary and secondary syphilis are the earliest stages of
infection, reflect symptomatic disease, and are indicators of incident infection.5 For these reasons, trend analyses of syphilis focus on reported cases and rates of reported cases of P&S syphilis. When referring to “P&S syphilis”, case counts are the sum of both primary and secondary cases, and “rate of P&S syphilis” refers to this sum per unit population.
Changes in reporting and screening practices can complicate interpretation of trends over time. To minimize the effect of changes in reporting over time, trend data in this report are restricted to jurisdictions that consistently report data of interest (e.g., sex of sex partner) for each year of a given time period. Details of these restrictions are provided in the text and footnotes of the pertinent text and figures.
P&S Syphilis — United StatesIn 2015, a total of 23,872 cases of P&S syphilis were reported in the United States, yielding a rate of 7.5 cases per 100,000 population (Table 1). This rate represents a 19.0% increase compared with 2014 (6.3 cases per 100,000 population), and a 66.7% increase compared with 2011 (4.5 cases per 100,000 population).
P&S Syphilis by RegionIn 2015, the West had the highest rate of reported P&S syphilis cases (9.6 cases per 100,000 population), followed by the South (8.1 cases per 100,000 population), the Northeast (6.6 cases per 100,000 population), and the Midwest (4.8 cases per 100,000 population) (Table 27). During 2014–2015, the P&S syphilis rate increased in every region: 23.1% in the West, 20.0% in the Northeast, 19.1% in the South, and 9.1% in the Midwest (Figure 33, Table 27).
P&S Syphilis by StateIn 2015, rates of reported P&S syphilis cases per 100,000 population ranged by state from 0.9 in Wyoming to 15.0 in Louisiana (Figure 34, Table 26). During 2014–2015, P&S syphilis rates increased in 74.0% (37/50) of states, and decreased in 26.0% (13/50) of states and in the District of Columbia (Table 27).
P&S Syphilis by Metropolitan Statistical AreaThe overall rate of reported P&S syphilis cases in the 50 most populous metropolitan statistical areas (MSAs) was
Syphilis
32 STD Surveillance 2015National Profile: Syphilis
9.9 cases per 100,000 population in 2015, which represents a 15.1% increase since 2014 (8.6 cases per 100,000 population) (Table 30). In 2015, 72.3% of reported P&S syphilis cases (74.0% of male cases and 55.7% of female cases) were reported by these 50 MSAs. In 2015, the rate among women in these MSAs was 1.4 cases per 100,000 females, while the rate among men was 18.6 cases per 100,000 males (Tables 31 and 32).
P&S Syphilis by CountyIn 2015, 65.3% of reported P&S syphilis cases occurred in 70 counties or independent cities (Table 33). Of 3,141 counties in the United States, 445 (14.2%) had a rate greater than 6.4 cases per 100,000 population, 451 (14.4%) reported a rate from 2.9 to 6.4 cases per 100,000 population, 434 (13.8%) reported a rate from 0.3 to 2.8 cases per 100,000 population, and 1,811 (57.7%) counties reported no cases of P&S syphilis in 2015 (Figure 35).
P&S Syphilis by Sex and Sexual BehaviorAs has been observed in previous years, in 2015 the rate of reported P&S syphilis cases among men (13.7 cases per 100,000 males) was much higher than the rate among women (1.4 cases per 100,000 females), and men account for a large majority (90.3%) of P&S syphilis cases (Figure 40, Tables 28 and 29). Among men, the rate of P&S syphilis has increased every year since 2000, and during 2014–2015, the rate among men increased 18.1% (Figure 32, Table 29). In contrast, the P&S syphilis rate among women has fluctuated between 0.8 and 1.7 cases per 100,000 females since 2000 (Figure 32, Table 28). During 2014–2015, the P&S syphilis rate among women increased 27.3%.
These increases in male and female P&S syphilis rates were observed in every region of the country during 2014–2015. Among men, the rate increased 22.2% in the West, 19.6% in the Northeast, 18.6% in the South, and 8.9% in the Midwest (Table 29). Among women, the largest increases were observed in the West (41.7%) and Northeast (40.0%), followed by the South (20.0%) and the Midwest (11.1%) (Table 28).
MSM continued to account for the majority of P&S syphilis cases in 2015 (Figures 31 and 40). Of 23,872reported P&S syphilis cases in 2015, 14,229 (59.6%) were among MSM, including 12,891 (54.0%) cases among men who had sex with men only and 1,338 (5.6%) cases among men who had sex with both men and women (Figure 40). Overall, 3,178 (13.3%) cases were among men who had sex with women only (MSW), 2,298 (9.6%) were among women, 4,140 (17.3%) were among men without information about sex of sex partner, and 27 (0.1%) were cases reported with unknown sex (Figure 40). Among the
17,407 male cases with information on sex of sex partner, 81.7% occurred among MSM.
A total of 37 states were able to classify at least 70.0% of reported P&S syphilis cases as MSM, MSW, or women each year during 2011–2015 (Figure 31). In these states during 2014–2015, the number of cases increased 12.8% among MSM, 22.5% among MSW, and 27.1% among women.
P&S Syphilis by AgeAs in previous years, in 2015, rates of reported P&S syphilis cases were highest among persons aged 24–29 years and 20–24 years (Figure 36, Table 34). In 2015, the highest rates were observed among men aged 25–29 years (41.8 cases per 100,000 males) and 20–24 years (35.7 cases per 100,000 males). Similarly, the highest rates among women were among those aged 20–24 years (5.1 cases per 100,000 females) and those aged 25–29 years (4.5 cases per 100,000 females).
During 2014–2015, the P&S syphilis rate increased in all age groups among those aged 15–64 years (Table 34). Rates increased 10.2% among those aged 15–19 years, 14.9% among those aged 20–24 years, 26.3% among those aged 25–29 years, 23.1% among those aged 30–34 years, 21.4% among those aged 35–39 years, 8.2% among those aged 40–44 years, 17.6% among those aged 45–54 years, and 31.8% among those aged 55–64 years (Table 34).
In 2015, persons aged 15–44 years accounted for 79.6% of reported P&S syphilis cases with known age. Among both men and women, the P&S syphilis rate increased during 2014–2015 in all age groups among those aged 15–44 years (Figures 37 and 38).
P&S Syphilis by Race/EthnicityIn 2015, among the 49 states that submitted data in the race and ethnicity categories according to Office of Management and Budget (OMB) standards (see Section A1.5 in the Appendix), the rate of reported P&S syphilis cases remained highest among Blacks (21.4 cases per 100,000 population) (Table 35B). The rate among Blacks was 5.2 times the rate among Whites (4.1 cases per 100,000 population). The P&S syphilis rates among Native Hawaiians/Other Pacific Islanders (10.4 cases per 100,000 population) was 2.5 times the rate among Whites, the rate among Hispanics (9.1 cases per 100,000 population) was 2.2 times the rate among Whites, the rate among American Indians/Alaska Natives (5.6 cases per 100,000 population) was 1.4 times the rate among Whites, and the rate among Asians (3.0 cases per 100,000 population) was 0.7 times the rate among Whites (Table 35B).
During 2011–2015, among the 45 states that submitted race and ethnicity data according to OMB standards (see
33STD Surveillance 2015 National Profile: Syphilis
Section A1.5 in the Appendix) for all five years during that period, the P&S syphilis rate increased among all race/ethnicity groups (Figure 39). During 2014–2015, rates increased in every race/ethnicity group except for American Indians/Alaska Natives. The greatest increases during 2014–2015 were observed among Native Hawaiians/Other Pacific Islanders (63.1%) and those who identified as Multiracial (45.5%), followed by Hispanics (25.4%), Whites (17.6%), Asians (15.4%), and Blacks (13.1%).
More information on P&S syphilis rates among racial/ethnic groups can be found in the Special Focus Profiles.
P&S Syphilis and HIV Co-infectionReported cases of P&S syphilis continue to be characterized by a high rate of HIV co-infection, particularly among MSM. In 2015, 31 states were able to classify at least 70.0% of reported P&S syphilis cases as MSM, MSW, or women and at least 70.0% of reported cases as HIV-positive or HIV-negative (Figure 41). Among P&S syphilis cases with known HIV-status in these states, 49.8% of cases among MSM were HIV-positive, compared with 10.0% of cases among MSW, and 3.9% of cases among women.
P&S Syphilis by Reporting SourceIn 2015, 20.1% of cases were reported from STD clinics, 72.5% were reported from venues outside of STD clinics, and 7.4% of cases had an unknown source of report (Table A2). During 2014–2015, the number of P&S syphilis cases reported by STD clinics and by non-STD clinic settings increased (Figure 42). However, the proportion of P&S syphilis cases that were reported by STD clinics has declined over the last decade from 34.2% of cases in 2006 to 20.1% of cases in 2015. In 2015, private physicians/health maintenance organizations (HMOs) and STD clinics were the most common reporting sources among MSM (27.7% and 25.4%, respectively), MSW (21.8% and 23.9%, respectively), and women (25.4% and 16.7%, respectively) (Figure 43).
Congenital SyphilisAfter decreasing from 10.5 to 8.4 reported congenital syphilis cases per 100,000 live births during 2008–2012, the rate of reported congenital syphilis has subsequently increased each year during 2012–2015 (Table 1). In 2015, there were a total of 487 reported cases of congenital syphilis, for a national rate of 12.4 cases per 100,000 live births. This rate represents a 6.0% increase relative to 2014 (11.7 cases per 100,000 live births) and a 36.3% increase relative to 2011 (9.1 cases per 100,000 live births). As has been observed historically, these increases paralleled increases in P&S syphilis among women during 2014–
2015 (27.3%) and during 2011–2015 (55.6%) (Figure 44, Table 28).
During 2014–2015, the increase in reported congenital syphilis cases was primarily attributable to an increase in the West. During this time period, the congenital syphilis rate increased 42.3% in the West, but decreased 3.5% in the Midwest, 7.7% in the South, and 17.4% in the Northeast (Table 41). In 2015, the highest congenital syphilis rates were reported from the West (18.5 cases per 100,000 live births), followed by the South (14.4 cases per 100,000 live births), Midwest (8.2 cases per 100,000 live births), and the Northeast (3.8 cases per 100,000 live births). In addition, rates were highest among Blacks (35.2 cases per 100,000 live births), followed by Hispanics (15.5 cases per 100,000 live births), American Indians/Alaska Natives (10.3 cases per 100,000 live births), Asians/Pacific Islanders (5.9 cases per 100,000 live births), and Whites (4.4 cases per 100,000 live births) (Table 42).
Syphilis — All Stages (P&S, Early Latent, Late, Late Latent, and Congenital)In 2015, total case counts and rates for reported syphilis were the highest recorded since 1994. The total number of cases of syphilis (P&S, early latent, late, late latent, and congenital) reported to CDC increased 17.7% during 2014–2015 (from 63,453 cases to 74,702 cases) (Table 1). The number of cases of early latent syphilis reported to CDC increased 24.3% (from 19,452 cases to 24,173 cases), and the number of cases of late and late latent syphilis increased 11.2% (from 23,541 cases to 26,170 cases) (Tables 1, 36, and 38).
Syphilis among Special PopulationsMore information about syphilis and congenital syphilis in racial/ethnic groups, women of reproductive age, adolescents, and MSM can be found in the Special Focus Profiles.
Syphilis SummaryThe national rate of reported P&S syphilis cases reached an historic low in 2000 and 2001, but has increased almost every year since then. This increase was largely attributable to an increase among men, and in particular among MSM. However, during 2014–2015, rates increased among both men and women in every region of the country. Rates of reported congenital syphilis cases also increased during 2014–2015, although this increase was primarily attributable to an increase in the West.
34 STD Surveillance 2015National Profile: Syphilis
MSM continued to account for the majority of reported P&S syphilis cases in 2015. Nationally, the highest rates of P&S syphilis in 2015 were observed among men aged 25–29 years and 20–24 years, among men in the West and in the South, and among Black men.
1 Jarzebowski W, Caumes E, Dupin N, et al. Effect of early syphilis infection on plasma viral load and CD4 cell count in human immunodeficiency virus-infected men: results from the FHDH- ANRS CO4 cohort. Arch Intern Med 2012; 172: 1237–1243.
2 Buchacz K, Patel P, Taylor M, et al. Syphilis increases HIV viral load and decreases CD4 cell counts in HIV-infected patients with new syphilis infections. AIDS 2004; 18:2075–2079.
3 Fleming DT, Wasserheit JN. From epidemiological synergy to public health policy and practice: the contribution of other sexually transmitted diseases to sexual transmission of HIV infection. Sex Trans Infect 1999; 75: 3–17.
4 Ingraham NR. The value of penicillin alone in the prevention and treatment of congenital syphilis. Acta Derm Venereol 1951; 31(Suppl 24): 60–88.
5 Peterman TA, Kahn RH, Ciesielski CA, et al. Misclassification of the stages of syphilis: implications for surveillance. Sex Transm Dis. 2005;32(3):144-9.
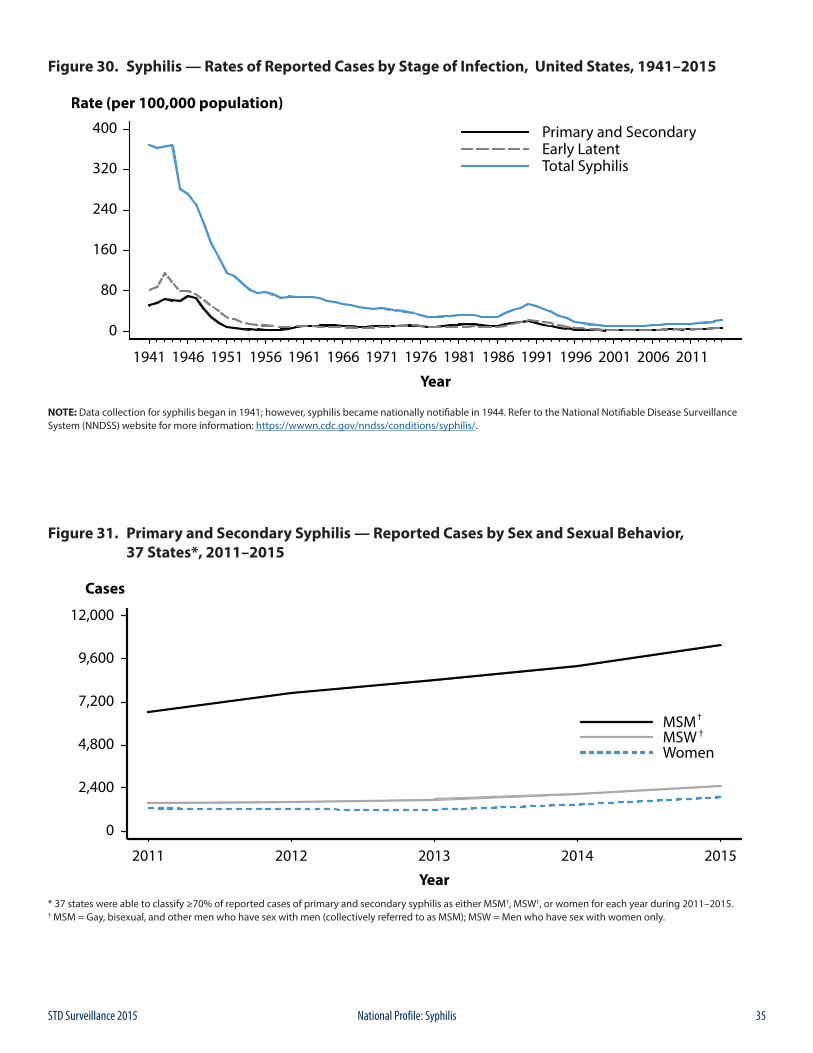
35STD Surveillance 2015 National Profile: Syphilis
Figure 30. Syphilis — Rates of Reported Cases by Stage of Infection, United States, 1941–2015
NOTE: Data collection for syphilis began in 1941; however, syphilis became nationally notifiable in 1944. Refer to the National Notifiable Disease Surveillance System (NNDSS) website for more information: https://wwwn.cdc.gov/nndss/conditions/syphilis/.
Figure 31. Primary and Secondary Syphilis — Reported Cases by Sex and Sexual Behavior, 37 States*, 2011–2015
* 37 states were able to classify ≥70% of reported cases of primary and secondary syphilis as either MSM†, MSW†, or women for each year during 2011–2015.† MSM = Gay, bisexual, and other men who have sex with men (collectively referred to as MSM); MSW = Men who have sex with women only.
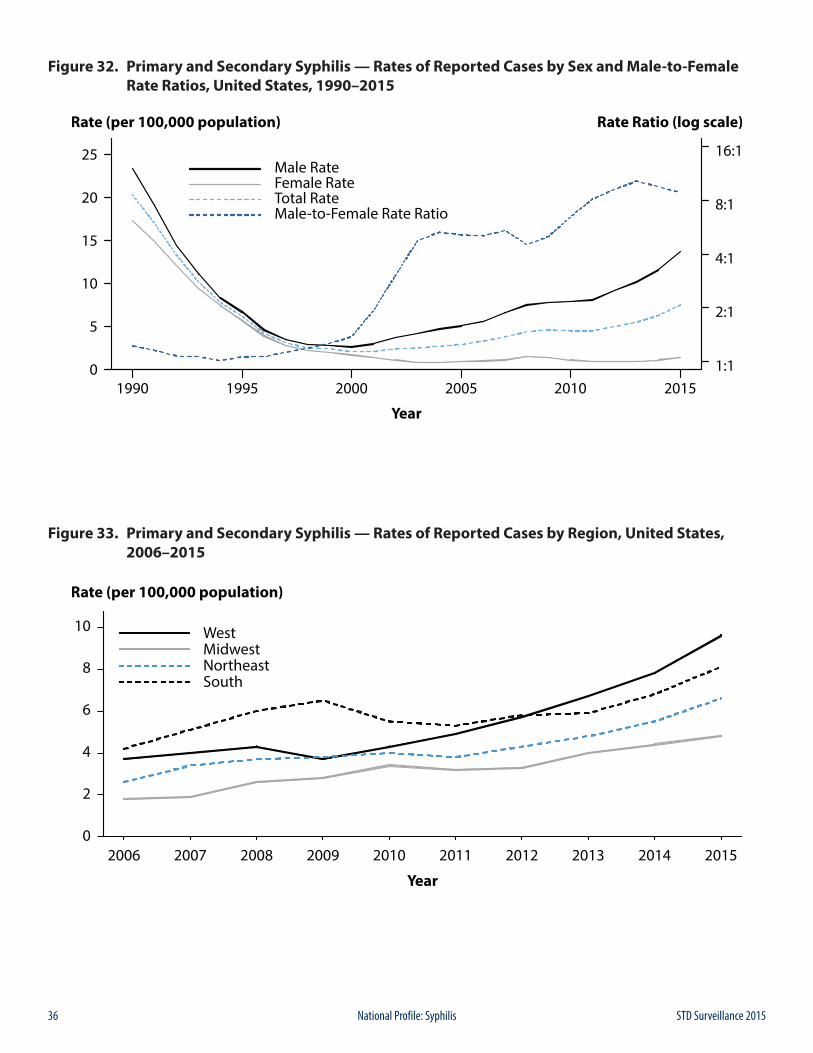
36 STD Surveillance 2015National Profile: Syphilis
Figure 32. Primary and Secondary Syphilis — Rates of Reported Cases by Sex and Male-to-Female Rate Ratios, United States, 1990–2015
Figure 33. Primary and Secondary Syphilis — Rates of Reported Cases by Region, United States, 2006–2015
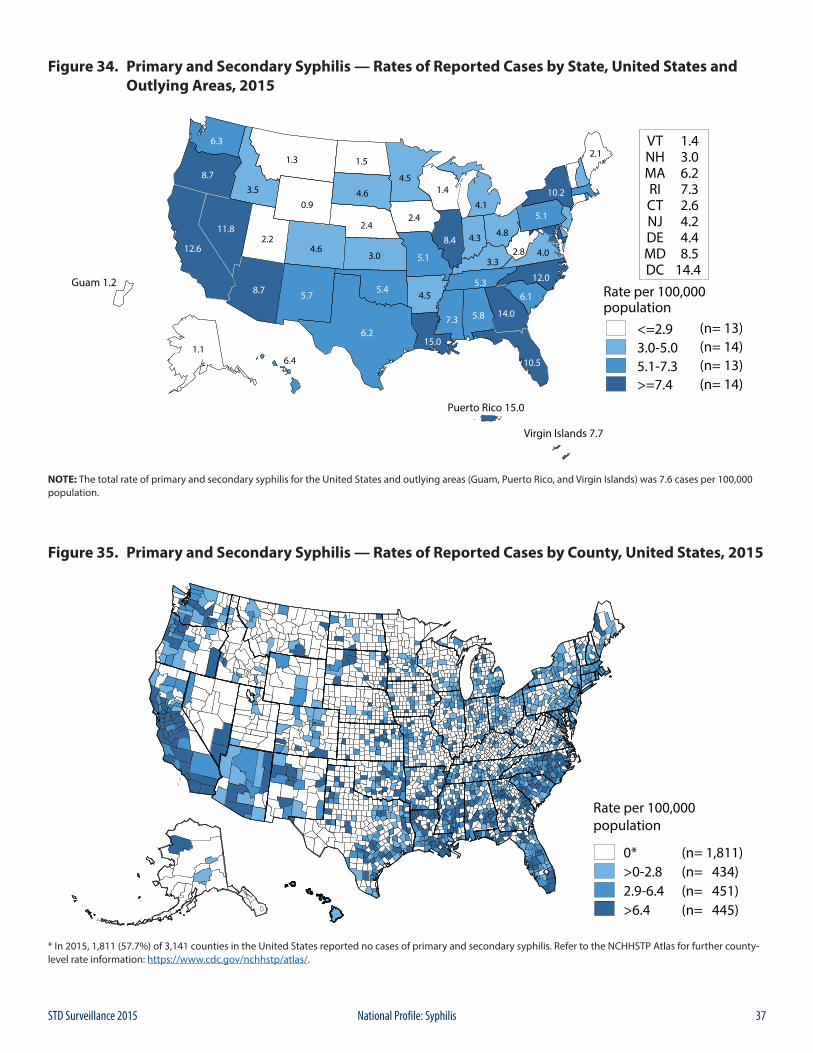
37STD Surveillance 2015 National Profile: Syphilis
Figure 34. Primary and Secondary Syphilis — Rates of Reported Cases by State, United States and Outlying Areas, 2015
NOTE: The total rate of primary and secondary syphilis for the United States and outlying areas (Guam, Puerto Rico, and Virgin Islands) was 7.6 cases per 100,000 population.
Figure 35. Primary and Secondary Syphilis — Rates of Reported Cases by County, United States, 2015
* In 2015, 1,811 (57.7%) of 3,141 counties in the United States reported no cases of primary and secondary syphilis. Refer to the NCHHSTP Atlas for further county-level rate information: https://www.cdc.gov/nchhstp/atlas/.
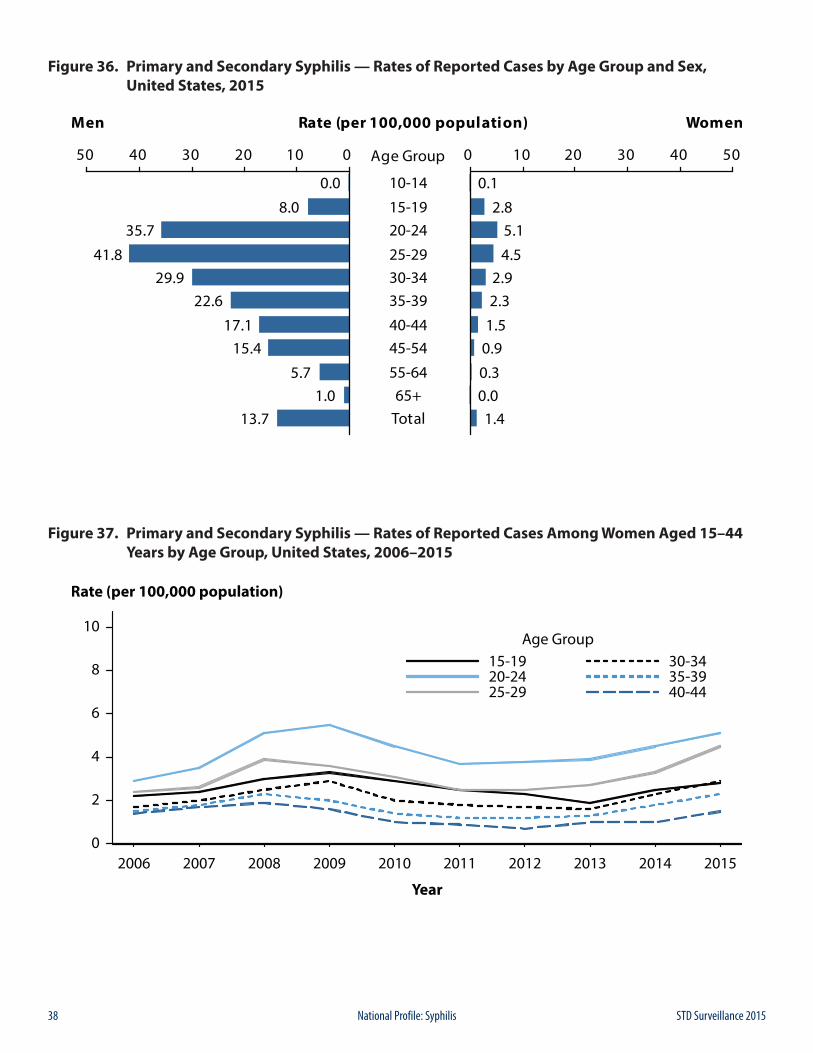
38 STD Surveillance 2015National Profile: Syphilis
Figure 36. Primary and Secondary Syphilis — Rates of Reported Cases by Age Group and Sex, United States, 2015
Figure 37. Primary and Secondary Syphilis — Rates of Reported Cases Among Women Aged 15–44 Years by Age Group, United States, 2006–2015
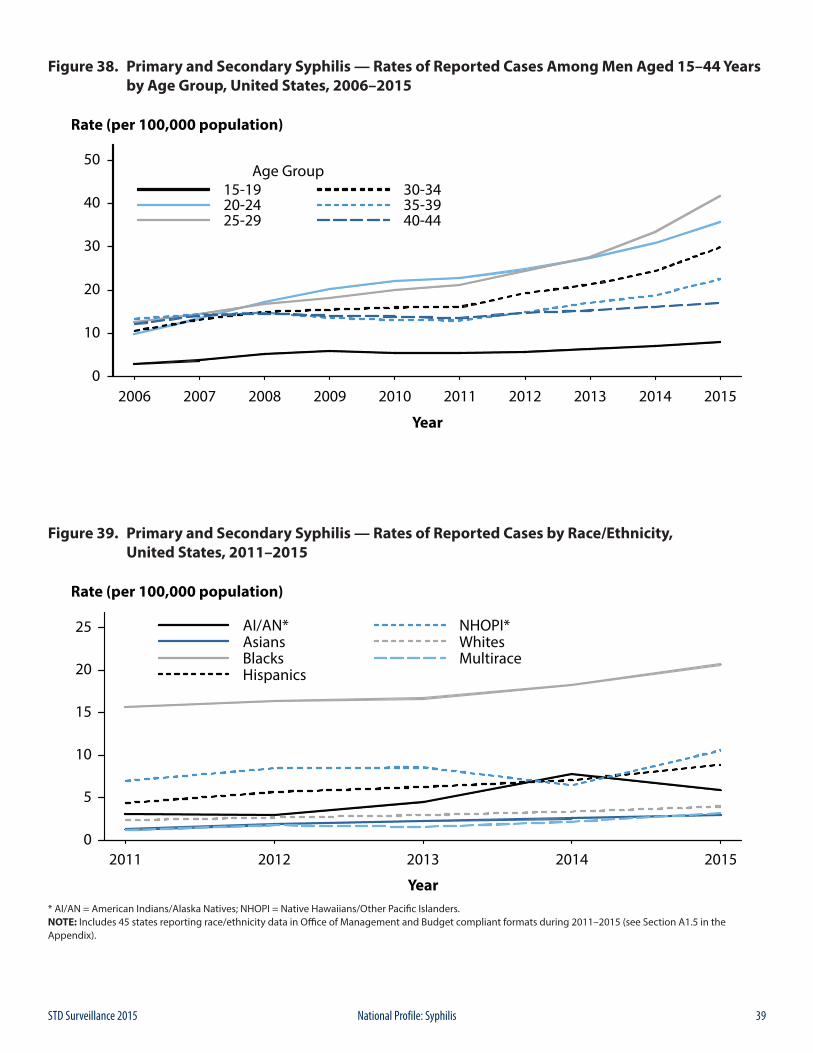
39STD Surveillance 2015 National Profile: Syphilis
Figure 38. Primary and Secondary Syphilis — Rates of Reported Cases Among Men Aged 15–44 Years by Age Group, United States, 2006–2015
Figure 39. Primary and Secondary Syphilis — Rates of Reported Cases by Race/Ethnicity, United States, 2011–2015
* AI/AN = American Indians/Alaska Natives; NHOPI = Native Hawaiians/Other Pacific Islanders.NOTE: Includes 45 states reporting race/ethnicity data in Office of Management and Budget compliant formats during 2011–2015 (see Section A1.5 in the Appendix).
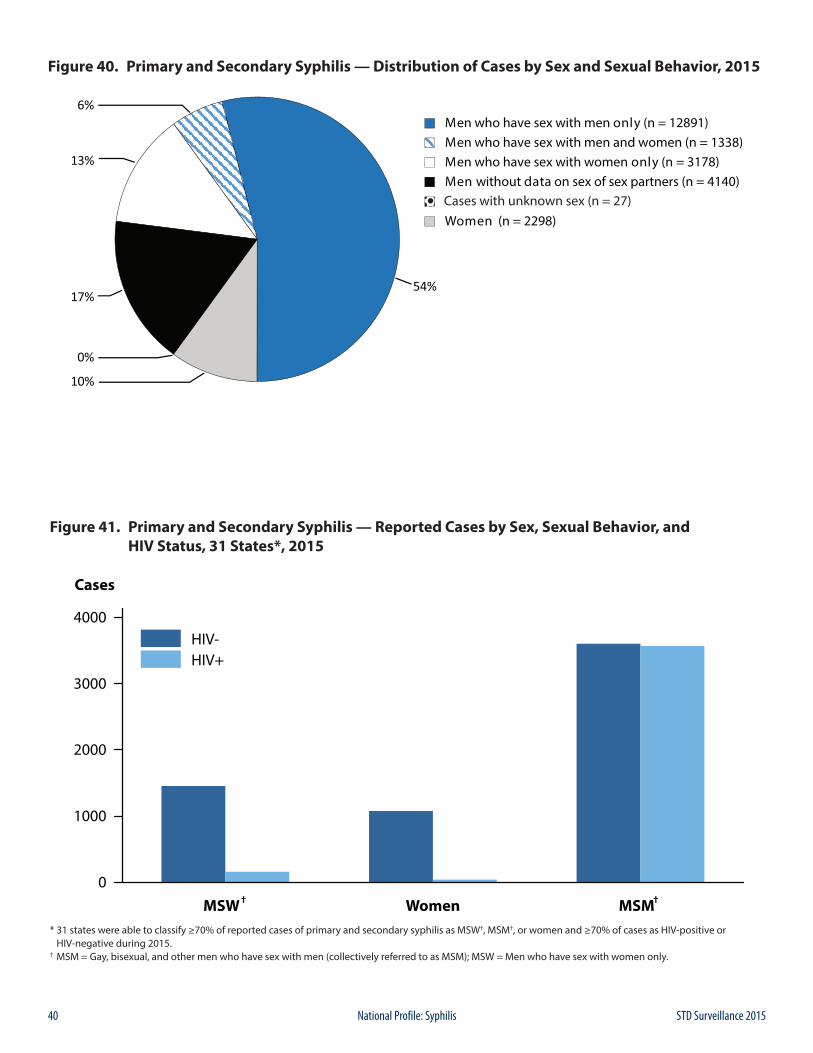
40 STD Surveillance 2015National Profile: Syphilis
Figure 40. Primary and Secondary Syphilis — Distribution of Cases by Sex and Sexual Behavior, 2015
Figure 41. Primary and Secondary Syphilis — Reported Cases by Sex, Sexual Behavior, and HIV Status, 31 States*, 2015
* 31 states were able to classify ≥70% of reported cases of primary and secondary syphilis as MSW†, MSM†, or women and ≥70% of cases as HIV-positive or HIV-negative during 2015.† MSM = Gay, bisexual, and other men who have sex with men (collectively referred to as MSM); MSW = Men who have sex with women only.
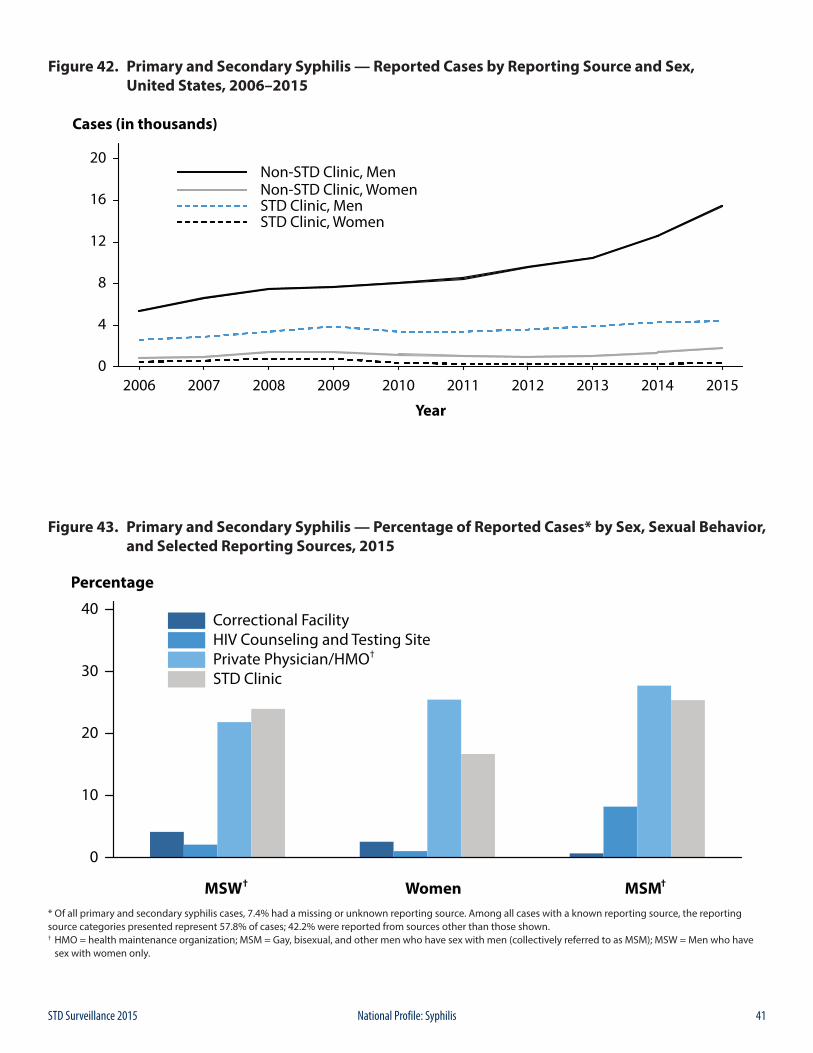
41STD Surveillance 2015 National Profile: Syphilis
Figure 42. Primary and Secondary Syphilis — Reported Cases by Reporting Source and Sex, United States, 2006–2015
Figure 43. Primary and Secondary Syphilis — Percentage of Reported Cases* by Sex, Sexual Behavior, and Selected Reporting Sources, 2015
* Of all primary and secondary syphilis cases, 7.4% had a missing or unknown reporting source. Among all cases with a known reporting source, the reporting source categories presented represent 57.8% of cases; 42.2% were reported from sources other than those shown. † HMO = health maintenance organization; MSM = Gay, bisexual, and other men who have sex with men (collectively referred to as MSM); MSW = Men who have sex with women only.
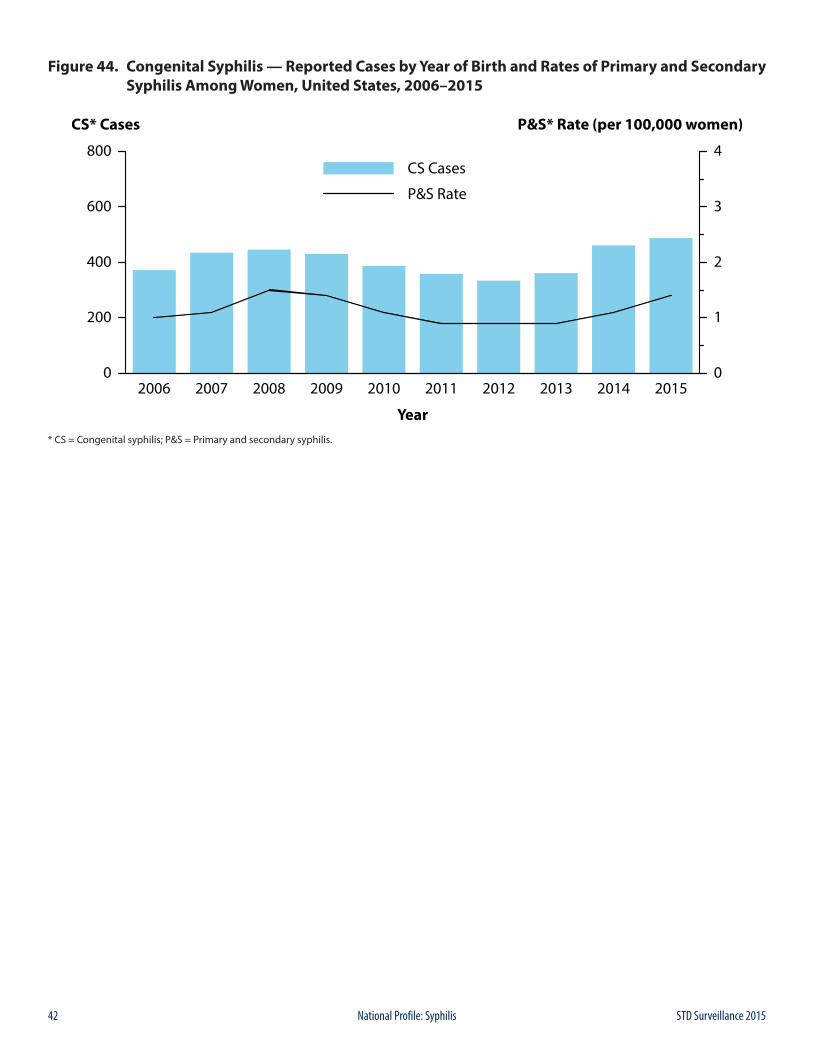
42 STD Surveillance 2015National Profile: Syphilis
Figure 44. Congenital Syphilis — Reported Cases by Year of Birth and Rates of Primary and Secondary Syphilis Among Women, United States, 2006–2015
* CS = Congenital syphilis; P&S = Primary and secondary syphilis.
43STD Surveillance 2015 National Profile: Other Sexually Transmitted Diseases
ChancroidChancroid is caused by infection with the bacterium Haemophilus ducreyi. Clinical manifestations include genital ulcers and inguinal lymphadenopathy or buboes.1 Reported cases of chancroid declined steadily between 1987 and 2001 (Figure 45, Table 1). Since then, the number of reported cases has fluctuated somewhat, while still appearing to decline overall. In 2015, a total of 11 cases of chancroid were reported in the United States. Seven states reported one or more cases of chancroid in 2015 (Table 43).
Although the overall decline in reported chancroid cases most likely reflects a decline in the incidence of this disease, these data should be interpreted with caution because Haemophilus ducreyi is difficult to culture; as a result, this condition may be substantially underdiagnosed.2,3
Human PapillomavirusHuman papillomavirus (HPV) is the most common sexually transmitted infection in the United States.4 Over 40 distinct types can infect the genital tract;5 about 90% of infections are asymptomatic and resolve spontaneously within two years.6 However, persistent infection with some HPV types can cause cancer and genital warts. HPV types 16 and 18 account for approximately 70% of cervical cancers worldwide,7,8 while HPV types 6 and 11 are responsible for approximately 90% of genital warts.9,10
A quadrivalent HPV vaccine that protects against infection by HPV types 6, 11, 16 and 18 has been licensed in the United States for use in females since June 2006,11 and in males since October 2009.12 In October 2009, a bivalent HPV vaccine that protects against infection by HPV types 16 and 18 was licensed for use in females.13 In December 2014, a 9-valent vaccine that protects against infection by the HPV types included in the quadrivalent vaccine, as well as five additional cancer causing types (HPV types 31, 33, 45, 52, and 58), was licensed for use in the United States.14 For females, all three vaccines have been recommended for routine use in those aged 11 or 12 years, and through age 26 in those who have not been vaccinated previously.14 For males, the quadrivalent and 9-valent vaccines have been recommended for routine use in those aged 11 or 12 years, and through age 21 in those who have not been vaccinated previously.14 Vaccination of gay, bisexual, and other men who have sex with men (collectively referred to as MSM) through age 26 is also recommended; other males aged 22–26 years may be vaccinated.14 Vaccination is also recommended through
age 26 years for immunocompromised persons (including those infected with HIV) who have not been vaccinated previously.14
HPV vaccine uptake in the United States remains lower than the Healthy People 2020 goal of 80% coverage.15 In 2015, a national survey found that 63% of girls aged 13–17 years had received at least 1 dose of the HPV vaccine, and 42% had received all 3 doses in the series.16 HPV vaccine uptake is lower among boys; 50% aged 13–17 years received at least 1 dose, but only 28% received all 3 doses.16
HPV infection is not a nationally reportable condition. Cervicovaginal prevalence of quadrivalent HPV vaccine types 6, 11, 16, and/or 18 was estimated using data for females aged 14-34 years from the National Health and Nutrition Examination Survey (NHANES; see Section A2.4 in the Appendix). Prevalence decreased significantly from the pre-vaccine era (2003–2006) to the early post-vaccine era (2009–2012) in specimens from females aged 14–19 and 20–24 years, the age groups most likely to benefit from HPV vaccination (Figure 46).17 Among those aged 25–34 years, vaccine-type HPV prevalence did not differ significantly between the two time periods, and no differences were observed in the prevalence of non-quadrivalent HPV vaccine types by time period for any age group. In a population-based study of female residents of four geographic catchment areas (Alameda County, California; New Haven County, Connecticut; Monroe County, New York; Washington and Multnomah Counties, Oregon), incidence of high-grade cervical intraepithelial neoplasia in 18–20 year olds, based on laboratory reports and medical record review, decreased during 2008–2012. However, cervical cancer screening, which was estimated using age-group-specific screening rates derived from a variety of data sources in three catchment areas, also declined in this age group during the same period.18 The larger observed decrease in cervical neoplasia, relative to the estimated decline in screening, suggests that HPV vaccination may be impacting the true burden of cervical neoplasia in young women.
Data from the National Disease and Therapeutic Index (NDTI; see Section A2.5 in the Appendix) suggest that cases of genital warts, as measured by initial visits to physicians’ offices, may have increased during the late 1990s through 2014 (Figure 47, Table 44). Although the number of visits appears to have decreased in 2012 and 2013, visits in 2014 (465,000) slightly exceeded those in 2011; more years of data are needed to better elucidate recent trends in initial genital wart visits from these data. The 2015 NDTI data were not obtained in time to
Other Sexually Transmitted Diseases
44 STD Surveillance 2015National Profile: Other Sexually Transmitted Diseases
include them in this report. NHANES data for 1999–2004 indicated that 5.6% of sexually active adults aged 18–59 years self-reported a history of a genital wart diagnosis.19
Prevalence of genital warts during 2003–2010 was examined using health-care claims records from a large United States cohort of individuals with employer-provided private health insurance (Figure 48).20 Prevalence among females aged 15–19 years was stable during 2003–2007, but then significantly declined during 2007–2010. Among females aged 20–24 years, genital wart prevalence significantly increased during 2003–2007, then was stable during 2007–2010; although prevalence in this age group appeared to decrease during 2009–2010, more years of data are needed to interpret this observation. Prevalence in females aged 25–39 years significantly increased throughout the time period, but among those aged 25–29 years a potential inflection in trend was observed in 2009, for which additional years of data are needed to appropriately assess. Genital wart prevalence significantly increased in males of all age groups during 2003–2010, although for those aged 20–24 years a potential inflection in trend again was observed in 2009.
For data reported in Figure 49, enhanced behavioral and demographic information on patients who presented for care in 2015 in 7 jurisdictions of the STD Surveillance Network (SSuN) was used (See Section A2.2 in the Appendix). Only jurisdictions that contributed data for all of 2015 were included in the figure. Genital warts were identified by provider diagnosis or by documentation from the physical examination. MSM and men who have sex with women only (MSW) were defined by self-report or by sex of reported sex partners. The prevalence of genital warts in 2015 is presented separately for MSM, MSW, and women by SSuN jurisdiction in the figure. Among women, the median prevalence of genital warts was 0.9% (range 0.7 to 2.2) across all sites, compared to 3.3% (range 1.9 to 4.6) for MSM and 4.3% (range 1.7 to 8.1) for MSW.
Pelvic Inflammatory DiseaseFor information on pelvic inflammatory disease, see Special Focus Profiles, STDs in Women and Infants.
Herpes Simplex Virus Herpes simplex virus (HSV) is among the most prevalent of sexually transmitted infections.4,21 Although most infections are subclinical,22 clinical manifestations are characterized by recurrent, painful genital and/or anal lesions.23 Most genital HSV infections in the United States are caused by HSV type 2 (HSV-2), while HSV type 1 (HSV-1) infections are typically orolabial and acquired during childhood.22,24
HSV infection is not a nationally reportable condition. Data on initial visits to physicians’ offices for genital HSV
infection are available from the NDTI; however the 2015 NDTI data were not obtained in time to include them in this report (Figure 50, Table 44). Visits have generally increased over time; the maximum number of initial visits (371,000) occurred in 2006, while 299,000 visits took place in 2014.
Most persons with genital HSV infection have not received a diagnosis. The overall percentage of HSV-2 seropositive NHANES participants aged 14–49 years who reported never being told by a doctor or health care professional that they had genital herpes did not change significantly between 1988–1994 and 2007–2010, and remained high (90.7% and 87.4%, respectively).25 However, an overall increase in the number of physician visits for genital HSV infection over time, as suggested by the NDTI data, may indicate increased recognition of infection.
NHANES data on the gender- and race/ethnicity-specific seroprevalence of HSV-2 among those aged 14–49 years were compared across survey years 1988–1994, 1999–2002, 2003–2006, and 2007–2010 (Figure 51). Overall, HSV-2 seroprevalence decreased between 1988–1994 and 2007–2010, from 21.2% to 15.5%.25 Among non-Hispanic White females, HSV-2 seroprevalence significantly decreased from 19.5% in 1988–1994 to 15.3% in 2007–2010; HSV-2 seroprevalence remained stable among non-Hispanic Black females, from 52.5% in 1988–1994 to 49.9% in 2007–2010. Similar race/ethnicity differences were observed for males. These data, along with data from NHANES survey years 1976–1980,26 indicate that non-Hispanic Blacks had higher overall seroprevalence than non-Hispanic Whites in each survey period.
NHANES data also show that among adolescents aged 14–19 years HSV-1 seroprevalence has significantly decreased by almost 23%, from 39.0% in 1999–2004 to 30.1% in 2005–2010, indicating declining orolabial infection in this age group.24 HSV-2 seroprevalence in this age group was much lower, less than 2% in both time periods.24 Other studies have found that genital HSV-1 infections are increasing among young adults.27,28 This has been attributed, in part, to the decline in orolabial HSV-1 infections, because those who lack HSV-1 antibodies at sexual debut are more susceptible to genital HSV-1 infection;24,29 increasingly common oral sex behavior among adolescents and young adults also has been suggested as a contributing factor.24,30 The absence of HSV-1 antibodies also increases the likelihood of developing symptomatic disease from newly-acquired (i.e., primary) genital HSV-2 infection.31 Young women may therefore be increasingly likely to first acquire HSV-1 infection genitally, or acquire a primary genital HSV-2 infection, during their child-bearing years,29,32 and first-episode primary HSV infection during pregnancy increases the risk of neonatal HSV transmission.29,33
45STD Surveillance 2015 National Profile: Other Sexually Transmitted Diseases
For information on neonatal HSV infections, see Special Focus Profiles, STDs in Women and Infants.
Trichomonas vaginalis Trichomonas vaginalis is a common sexually transmitted protozoal infection associated with adverse health outcomes such as preterm birth and symptomatic vaginitis.4,34,35 It is not a nationally reportable condition, and trend data are limited to estimates of initial physician office visits from the NDTI (Figure 52, Table 44). Visits appear to be fairly stable since the 1990’s; the number of initial visits for Trichomonas vaginalis infection in 2014 was 155,000. The 2015 NDTI data were not obtained in time to include them in this report. NHANES data from 2001–2004 indicated an overall Trichomonas vaginalis infection prevalence of 3.1%, with the highest prevalence of 13.3% observed among non-Hispanic Blacks.35
1 Lewis DA. Chancroid: clinical manifestations, diagnosis, and management.
Sex Transm Infect 2003;79:68–71.2 Schulte JM, Martich FA, Schmid GP. Chancroid in the United States,
1981–1990: evidence for underreporting of cases. MMWR Morb Mortal Wkly Rep 1992;41(SS-3):57–61.
3 Mertz KJ, Trees D, Levine WC, et al. Etiology of genital ulcers and prevalence of human immunodeficiency virus coinfection in 10 US cities. J Infect Dis 1998;178(6):1795–8.
4 Satterwhite CL, Torrone E, Meites E, et al. Sexually transmitted infections among US women and men: prevalence and incidence estimates, 2008. Sex Transm Dis 2013;40(3):187–93.
5 de Villiers E-M, Fauquet C, Broker TR, et al. Classification of papillomaviruses. Virol 2004;324:17–27.
6 Ho GYF, Bierman R, Beardsley L, et al. Natural history of cervicovaginal papillomavirus infection in young women. N Engl J Med 1998;338(7);423–8.
7 Clifford GM, Smith JS, Plummer M, et al. Human papillomavirus types in invasive cervical cancer worldwide: a meta-analysis. Br J Cancer 2003;88(1):63–73.
8 Bosch FX, Manos MM, Munoz N, et al. Prevalence of human papillomavirus in cervical cancer: a worldwide perspective. J Natl Cancer Inst 1995;87(11):796–802.
9 Garland SM, Steben M, Sings HL, et al. Natural history of genital warts: analysis of the placebo arm of 2 randomized phase III trials of a quadrivalent human papillomavirus (types 6, 11, 16, and 18) vaccine. J Infect Dis 2009;199(6):805–14.
10 Gissmann L, Wolnik L, Ikenberg H, et al. Human papillomavirus types 6 and 11 DNA sequences in genital and laryngeal papillomas and in some cervical cancers. Proc Natl Acad Sci USA. 1983;80(2):560–3.
11 Markowitz LE, Dunne EF, Saraiya M, et al. Quadrivalent human papillomavirus vaccine. Recommendations of the Advisory Committee on Immunization Practices (ACIP). MMWR Morb Mortal Wkly Rep 2007;56(RR02):1–24.
12 Centers for Disease Control and Prevention. FDA licensure of quadrivalent human papillomavirus vaccine (HPV4, Gardasil) for use in males and guidance from the Advisory Committee on Immunization Practices (ACIP). MMWR Morb Mortal Wkly Rep 2010;59(20):630–2.
13 Centers for Disease Control and Prevention. FDA licensure of bivalent human papillomavirus vaccine (HPV2, Cervarix) for use in females and updated HPV vaccination recommendations from the Advisory Committeee on Immunization Practices (ACIP). MMWR Morb Mortal Wkly Rep 2010;59(20):626–9.
14 Petrosky E, Bocchini JA, Hariri S, et al. Use of 9-valent human papillomavirus (HPV) vaccine: updated HPV vaccination recommendations of the Advisory Committee on Immunization Practices. MMWR Morb Mortal Wkly Rep 2015;64(11):300–4.
15 HealthyPeople.gov. Healthy People 2020 Topics & Objectives. Immunization and Infectious Diseases. Objectives IID-11.4 and IID-11.5. https://www.healthypeople.gov/2020/topics-objectives/topic/immunization-and-infectious-diseases/objectives Accessed July 20, 2016.
16 Reagan-Steiner S, Yankey D, Jeyarajah J, et al. National, regional, state, and selected local area vaccination coverage among adolescents aged 13–17 years — United States, 2015. MMWR Morb Mortal Wkly Rep 2016; 65(33):850-8.
17 Markowitz LE, Gui L, Hariri S, et al. Prevalence of HPV after introduction of the vaccination program in the United States. Pediatrics 2016;137(3):e20151968.
18 Hariri S, Johnson ML, Bennett NM, et al. Population-based trends in high-grade cervical lesions in the early human papillomavirus vaccine era in the United States. Cancer 2015;121:2775–81.
19 Dinh T-H, Sternberg M, Dunne EF, et al. Genital warts among 18- to 59-year-olds in the United States, National Health and Nutrition Examination Survey, 1999–2004. Sex Transm Dis 2008;35(4):357–60.
20 Flagg EW, Schwartz R, Weinstock H. Prevalence of anogenital warts among participants in private health plans in the United States, 2003–2010: potential impact of human papillomavirus vaccination. Am J Public Health 2013;103(8):1428–35.
21 Smith JS, Robinson NJ. Age-specific prevalence of infection with herpes simplex virus types 2 and 1: a global review. J Infect Dis 2002;186(Suppl 1):S3–28.
22 Corey L, Wald A. Genital herpes. In: Holmes KK, Sparling FP, Stamm WE, et al., eds. Sexually Transmitted Diseases, 4th ed. New York, NY: McGraw-Hill; 2008:399–437.
23 Kimberlin DW, Rouse DJ. Genital herpes. N Engl J Med 2004;350(19): 1970–7.
24 Bradley H, Markowitz LE, Gibson T, et al. Seroprevalence of herpes simplex virus types 1 and 2 — United States, 1999–2010. J Infect Dis 2014;209(3):325–33.
25 Fanfair RN, Zaidi A, Taylor LD, et al. Trends in seroprevalence of herpes simplex virus type 2 among non-Hispanic blacks and non-Hispanic whites aged 14 to 49 years — United States, 1988 to 2010. Sex Transm Dis 2013;40(11):860–4.
26 Xu F, Sternberg MR, Kottiri BJ, et al. Trends in herpes simplex virus type 1 and type 2 seroprevalence in the United States. JAMA 2006;296(8):964–73.
27 Bernstein DI, Bellamy AR, Hook EW III, et. al., Epidemiology, clinical presentation, and antibody response to primary infection with herpes simplex virus type 1 and type 2 in young women. Clin Infect Dis 2013;56:344–51.
28 Roberts CM, Pfister JR, Spear SJ. Increasing proportion of herpes simplex virus type 1 as a cause of genital herpes infection in college students. Sex Transm Dis 2003;30(10):797–800.
29 Kimberlin DW. The scarlet H. J Infect Dis 2014;209(3):315–7.30 Copen CE, Chandra A, Martinez G. Prevalence and timing of oral sex with
opposite-sex partners among females and males aged 15–24 years: United States, 2007–2010. National Health Statistics Reports; no. 56. Hyattsville, MD: National Center for Health Statistics, 2012.
31 Langenberg AGM, Corey L, Ashley RL, et al. A prospective study of new infections with herpes simplex virus type 1 and type 2. N Engl J Med 1999;341:1432–8.
32 Sampath A, Maduro G, Schillinger JA. Infant deaths due to herpes simplex virus, congenital syphilis, and HIV in New York City. Pediatrics 2016;137(4):e20152387.
33 Brown ZA, Wald A, Morrow RA, et al. Effect of serologic status and cesarean delivery on transmission rates of herpes simplex virus from mother to infant. JAMA 2003;289(2):203–9.
46 STD Surveillance 2015National Profile: Other Sexually Transmitted Diseases
34 French JI, McGregor JA, Parker R. Readily treatable reproductive tract infections and preterm birth among black women. Am J Obstet Gynecol 2006;194:1717–27.
35 Sutton M, Sternberg M, Koumans EH, et al. The prevalence of Trichomonas vaginalis infection among reproductive-age women in the United States, 2001–2004. Clin Infect Dis 2007;45(10):1319–26.
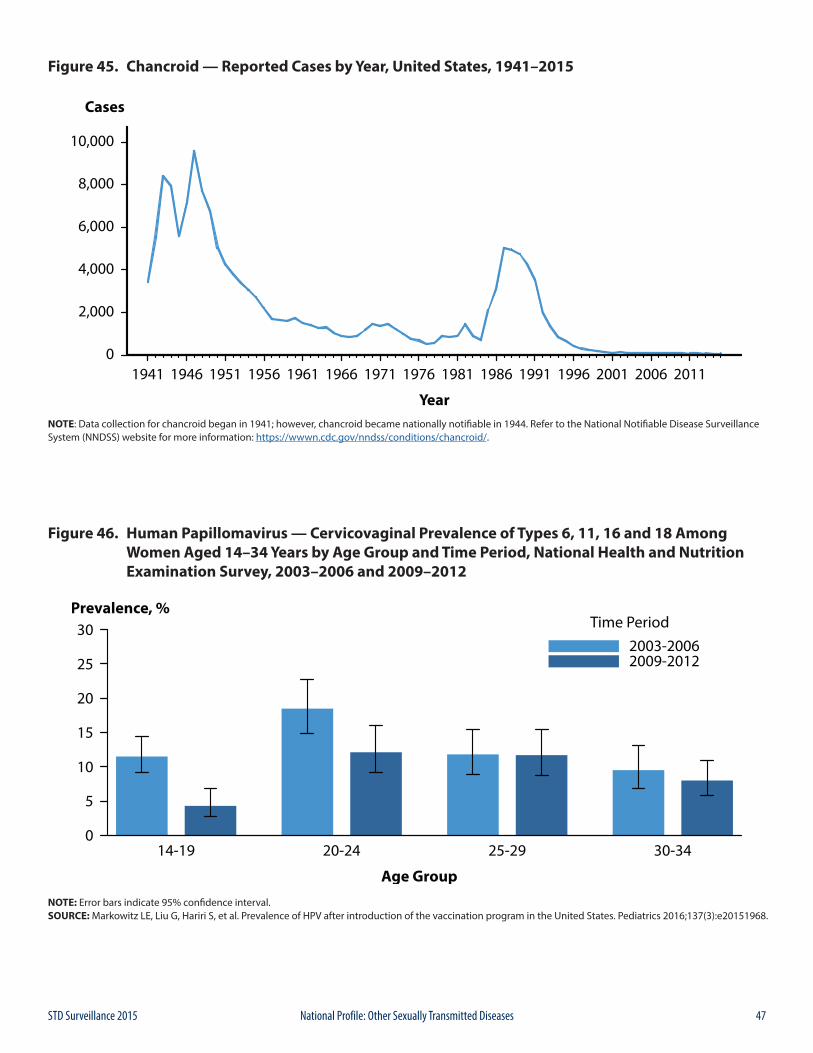
47STD Surveillance 2015 National Profile: Other Sexually Transmitted Diseases
Figure 45. Chancroid — Reported Cases by Year, United States, 1941–2015
NOTE: Data collection for chancroid began in 1941; however, chancroid became nationally notifiable in 1944. Refer to the National Notifiable Disease Surveillance System (NNDSS) website for more information: https://wwwn.cdc.gov/nndss/conditions/chancroid/.
Figure 46. Human Papillomavirus — Cervicovaginal Prevalence of Types 6, 11, 16 and 18 Among Women Aged 14–34 Years by Age Group and Time Period, National Health and Nutrition Examination Survey, 2003–2006 and 2009–2012
NOTE: Error bars indicate 95% confidence interval. SOURCE: Markowitz LE, Liu G, Hariri S, et al. Prevalence of HPV after introduction of the vaccination program in the United States. Pediatrics 2016;137(3):e20151968.
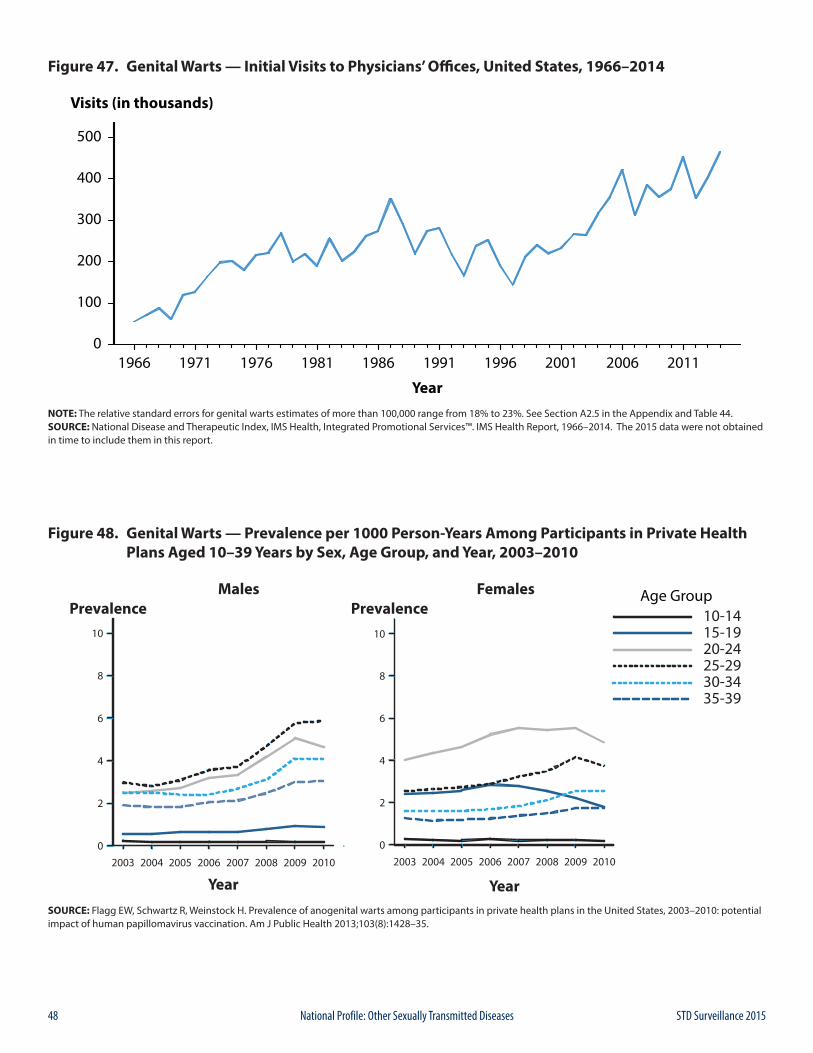
48 STD Surveillance 2015National Profile: Other Sexually Transmitted Diseases
Figure 47. Genital Warts — Initial Visits to Physicians’ Offices, United States, 1966–2014
NOTE: The relative standard errors for genital warts estimates of more than 100,000 range from 18% to 23%. See Section A2.5 in the Appendix and Table 44.SOURCE: National Disease and Therapeutic Index, IMS Health, Integrated Promotional Services™. IMS Health Report, 1966–2014. The 2015 data were not obtained in time to include them in this report.
Figure 48. Genital Warts — Prevalence per 1000 Person-Years Among Participants in Private Health Plans Aged 10–39 Years by Sex, Age Group, and Year, 2003–2010
SOURCE: Flagg EW, Schwartz R, Weinstock H. Prevalence of anogenital warts among participants in private health plans in the United States, 2003–2010: potential impact of human papillomavirus vaccination. Am J Public Health 2013;103(8):1428–35.
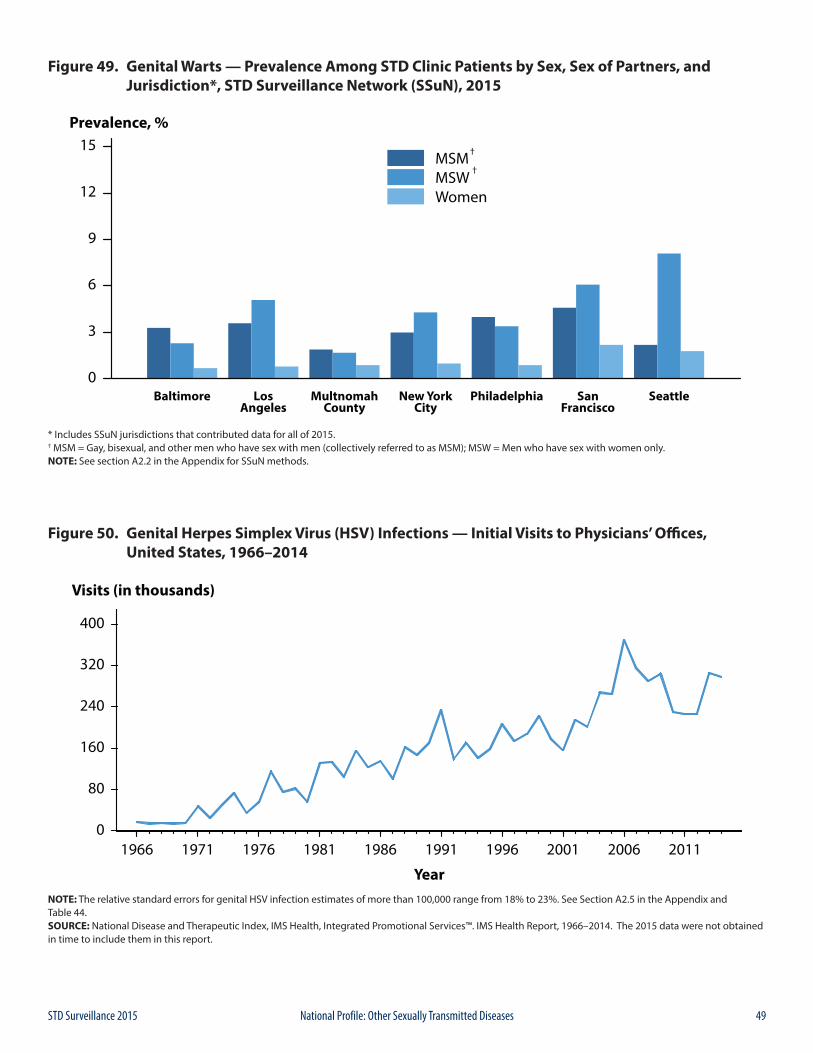
49STD Surveillance 2015 National Profile: Other Sexually Transmitted Diseases
Figure 49. Genital Warts — Prevalence Among STD Clinic Patients by Sex, Sex of Partners, and Jurisdiction*, STD Surveillance Network (SSuN), 2015
* Includes SSuN jurisdictions that contributed data for all of 2015.† MSM = Gay, bisexual, and other men who have sex with men (collectively referred to as MSM); MSW = Men who have sex with women only. NOTE: See section A2.2 in the Appendix for SSuN methods.
Figure 50. Genital Herpes Simplex Virus (HSV) Infections — Initial Visits to Physicians’ Offices, United States, 1966–2014
NOTE: The relative standard errors for genital HSV infection estimates of more than 100,000 range from 18% to 23%. See Section A2.5 in the Appendix and Table 44.SOURCE: National Disease and Therapeutic Index, IMS Health, Integrated Promotional Services™. IMS Health Report, 1966–2014. The 2015 data were not obtained in time to include them in this report.
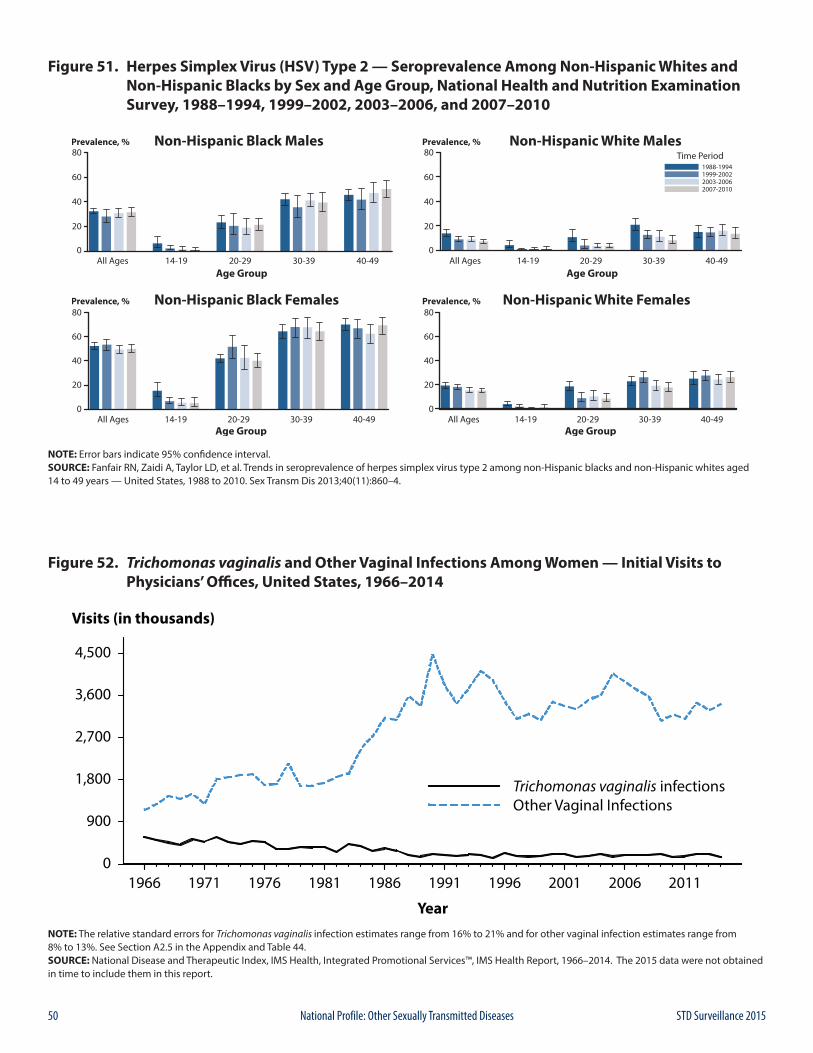
50 STD Surveillance 2015National Profile: Other Sexually Transmitted Diseases
Figure 51. Herpes Simplex Virus (HSV) Type 2 — Seroprevalence Among Non-Hispanic Whites and Non-Hispanic Blacks by Sex and Age Group, National Health and Nutrition Examination Survey, 1988–1994, 1999–2002, 2003–2006, and 2007–2010
NOTE: Error bars indicate 95% confidence interval.SOURCE: Fanfair RN, Zaidi A, Taylor LD, et al. Trends in seroprevalence of herpes simplex virus type 2 among non-Hispanic blacks and non-Hispanic whites aged 14 to 49 years — United States, 1988 to 2010. Sex Transm Dis 2013;40(11):860–4.
Figure 52. Trichomonas vaginalis and Other Vaginal Infections Among Women — Initial Visits to Physicians’ Offices, United States, 1966–2014
NOTE: The relative standard errors for Trichomonas vaginalis infection estimates range from 16% to 21% and for other vaginal infection estimates range from 8% to 13%. See Section A2.5 in the Appendix and Table 44.SOURCE: National Disease and Therapeutic Index, IMS Health, Integrated Promotional Services™, IMS Health Report, 1966–2014. The 2015 data were not obtained in time to include them in this report.

51STD Surveillance 2015
SPEC
IAL
FOC
US
PR
OFI
LES

52 STD Surveillance 2015
SPEC
IAL
FOC
US
PR
OFI
LES
53STD Surveillance 2015 Special Focus Profiles
The Special Focus Profiles highlight trends and distribution of STDs in populations of particular interest to STD and HIV prevention programs in state and local health departments: women and infants, adolescents and young adults, racial and ethnic minority groups, and gay, bisexual, and other men who have sex with men (collectively referred to as MSM). These populations are most vulnerable to STDs and their consequences and often lack adequate access to healthcare services. In 2014, in the U.S., age was strongly associated with having health insurance. Older adults (65 years and older) and children (19 years and under) were most likely to have health insurance. Working-age adults (19 years to 64 years) had higher uninsured rates. The rates of non-insured for non-Hispanic Whites, non-Hispanic Blacks, and Hispanics were: 7.6%, 11.8%, and 19.9%, respectively.1 The Patient Protection and Affordable Care Act (ACA) aims to increase access to sexual and reproductive health services through reforms based on the U.S. Preventive Services Task Force recommendations that include: chlamydia and gonorrhea screening (for sexually active women under 25 years and all women at increased risk), HIV screening (everyone 15–65 years old, pregnant, and higher risk), STD counseling (for all sexually active adolescents and higher-risk adults), and syphilis screening (for pregnant women and adults at higher risk).2 However, although health insurance coverage has been expanded for most groups, including both men and women, and for most race and ethnic groups, evidence suggests that disparities in health insurance coverage and access to STD services remain.3,4
Special Focus Profiles
1 Smith, J and Medalia, C. U.S. Census Bureau, Current Population Reports, P60-250, Health Insurance Coverage in the United States: 2014, U.S. Government Printing Office, Washington, DC, 2015.
2 Oglesby, WH. Perceptions of and preferences for federally-funded family planning clinics. Reproductive Health 2014; 11(50)1-9. http://www.reproductive-health-journal.com/content/11/1/50
3 O’Hara, B and Brault, MW. The disparate impact of the ACA-dependent expansion across population subgroups. Health Serv Res. 2013 Oct;48(5):1581-92.4 Drainoni, M, Sullivan, M, Sequeira, et al. Health reform and shifts in funding for sexually transmitted infection services. Sexually Transmitted Diseases 41(7), July
2014, p 455–460.
54 STD Surveillance 2015Special Focus Profiles: STDs in Women and Infants
Public Health ImpactWomen and infants are at significant risk for long-term consequences of STDs. A woman’s relationship status with her male partner, such as the concurrency of the relationship, has been identified as an important predictor of her sexual health.1-3 In addition to social factors such as poverty and lack of access to quality STD services, homelessness or unstable housing may increase a woman’s risk for acquiring a sexually transmitted infection.4 For some women maintaining the relationship with her partner may take a higher priority than STD risk reduction5, thereby affecting her sexual and reproductive health, as well as the health of her unborn baby.6, 7
Because it may be her male partner’s risk, rather than the woman’s that increases a woman’s risk for STDs, even a woman who has only one partner may be obliged to practice safer sex, such as using condoms.8 A number of studies have found significant associations between condom use and socio-demographic characteristics, including age, income, education, and acculturation.9
Women infected with Chlamydia trachomatis or Neisseria gonorrhoeae can develop pelvic inflammatory disease (PID), which, in turn, can lead to reproductive morbidity such as ectopic pregnancy and tubal factor infertility. An estimated 10–20% of women with chlamydial and gonococcal infections may develop PID if they do not receive adequate treatment.10, 11 Among women with PID, tubal scarring can cause infertility in 8% of women, ectopic pregnancy in 9%, and chronic pelvic pain in 18%.12
The majority of chlamydial and gonococcal infections in women are asymptomatic, and hence are detected primarily through screening. Because the symptoms associated with PID can be nonspecific, up to 85% of women with PID delay seeking medical care, thereby increasing the risk for infertility and ectopic pregnancy.13 Data from two randomized controlled trials of chlamydia screening suggest that such screening programs reduce PID incidence.14, 15
Human papillomavirus (HPV) infections are highly prevalent in the United States, especially among young sexually active adults. Although most HPV infections in women are cleared within several years, high-risk HPV-type infections can be accompanied by abnormal changes in the uterine cervical epithelium, which are detected by cytological examination of Papanicolaou (Pap) smears. Persistent high-risk HPV-type infections may lead to cervical cancer precursors, which if undetected can result in cancer. Other low-risk HPV types cause genital warts,
low-grade Pap smear abnormalities, and, rarely, recurrent respiratory papillomatosis in infants born to infected mothers.16 For more information on adolescent and adult HPV infections, see Other STDs.
Impact on Maternal and Fetal OutcomesAs with non-pregnant women, a high proportion of pregnant women with chlamydial and gonococcal infections are asymptomatic. Documented sequelae of untreated infections in pregnancy include stillbirth, premature delivery, premature rupture of the membranes, and low birth weight. Maternal infection can also affect the neonate, leading to neonatal ophthalmia, and, in the case of C. trachomatis, neonatal pneumonia. Although topical prophylaxis of infants at delivery is effective for prevention of gonococcal ophthalmia neonatorum, prevention of neonatal pneumonia requires prenatal detection and treatment.
Genital infections with herpes simplex virus (HSV) are extremely common, can cause painful outbreaks, and can have serious consequences for pregnant women and their infants.17 Neonatal herpes can be a severe illness presenting with pulmonary disease, seizures, fever, and a high case fatality rate following contact with infected genital secretions during delivery. Risk of transmission to the infant is greatest when the mother has primary genital lesions during delivery, especially if she acquires infection towards the end of her pregnancy.18
Syphilis has long been known to be an important risk factor for adverse pregnancy outcomes. The consequences of untreated maternal infection include fetal death, preterm birth, and also congenital infection in a proportion of surviving infants resulting in both physical and mental developmental disabilities. Most cases of congenital syphilis are easily preventable if women are screened for syphilis and treated early during prenatal care.19
Observations
Chlamydia Chlamydial infections in women are usually asymptomatic and screening is necessary to identify most infections.20 Routine chlamydia screening of sexually-active young women has been recommended by the CDC since 1993.21 Rates of reported cases of chlamydia among women increased steadily from the early 1990s, likely reflecting expanded screening coverage and use of more sensitive
STDs in Women and Infants
55STD Surveillance 2015 Special Focus Profiles: STDs in Women and Infants
diagnostic tests (Figure 1). During 2011–2013, rates decreased from 643.4 to 619.0 cases per 100,000 females and then increased a total of 4.3% over the next 2 years, resulting in a rate of 645.5 cases per 100,000 females in 2015 (Table 4).
Chlamydia rates are highest among young women, the population targeted for screening (Figure 5, Table 10). During 2014–2015, rates of reported chlamydia cases increased 1.5% and 2.7% among females aged 15–19 and 20–24 years, respectively. Regionally, chlamydia case rates were highest among women in the South, with a rate of 720.2 cases per 100,000 females in 2015 (Table 4). Rates of reported chlamydia cases exceeded gonorrhea rates among women in all regions (Figures A and B, Tables 4 and 15).
Gonorrhea Like chlamydia, gonorrhea is often asymptomatic in women. Thus, gonorrhea screening is an important strategy for the identification of gonorrhea among women. Large-scale screening programs for gonorrhea in women began in the 1970s. After an initial increase in cases detected through screening, rates of reported gonorrhea cases for both women and men declined steadily throughout the 1980s and early 1990s, and then declined more gradually in the late 1990s and the 2000s. However, more recently, there have been increases in cases since 2009 (Figure 12).
After reaching a 40-year low in 2009 (104.5 cases per 100,000 females), the rate of reported cases of gonorrhea for women increased slightly each year during 2009–2011, and then decreased each year during 2012–2014 (Figure 13). In 2015, the gonorrhea rate among women increased 6.8% to 107.2 cases per 100,000 females (Figure 13, Table 15).
The gonorrhea rate among women was slightly higher than the rate among men during 2006–2012; however, the rate among men was higher than the rate among women during 2013–2015 (Figure 13, Tables 15 and 16). During 2011–2015, gonorrhea rates were highest among young women and adolescents aged 15–24 years (Figure 17, Table 21). For women in this age group, rates were highest among 19-year olds in 2015 (666.0 cases per 100,000 females) (Table 23).
Congenital SyphilisTrends in congenital syphilis usually follow trends in primary and secondary (P&S) syphilis among women, with a lag of 1–2 years (Figure 44). After plateauing at a relatively low rate (0.9 cases per 100,000 females) during 2011–2013, the rate of reported P&S syphilis cases among women increased to 1.1 cases per 100,000 females in
2014, and then increased 27.3%, to 1.4 cases per 100,000 females during 2014–2015 (Figure 32, Table 28).
Similarly, the rate of reported congenital syphilis cases has increased each year since 2012 (Figure 44, Table 1). In 2015, there were 487 reported cases of congenital syphilis and the national congenital syphilis rate was 12.4 cases per 100,000 live births. This increase in 2015 represents a 6.0% increase relative to 2014 and a 36.3% increase relative to 2011 (Table 41).
In 2015, the highest rates of P&S syphilis among women and the highest rates of congenital syphilis were observed in the South and in the West (Figures C and D, Tables 28 and 41). The P&S syphilis rates among women increased in every region during 2014–2015. However, only the West experienced an increase in the congenital syphilis rate during this time period. During 2014–2015, the largest increases in the P&S syphilis rates among women were seen in the West (41.7%), followed by the Northeast (40.0%), South (20.0%), and Midwest (11.1%). The congenital syphilis rate increased 42.3% in the West and decreased 17.4% in the Northeast, 7.7% in the South, and 3.5% in the Midwest (Table 44).
Although most cases of congenital syphilis occur among infants whose mothers have had some prenatal care, late or limited prenatal care has been associated with congenital syphilis. Failure of health care providers to adhere to maternal syphilis screening recommendations also contributes to the occurrence of congenital syphilis.19
Neonatal Herpes Simplex Virus Neonatal herpes simplex virus (HSV) infections, although relatively rare, cause significant morbidity and mortality.17
Most neonatal HSV infections result from perinatal transmission from mother to neonate,22 but postnatal infection can occur.23 Although reporting of neonatal HSV infection is required in a few jurisdictions,24,25 it is not a nationally reportable disease.
An examination of inpatient records of infants aged 60 days or younger at admission using the Healthcare Cost and Utilization Project Kid’s Inpatient Database showed an overall incidence of 9.6 cases per 100,000 live births in 2006.26 Rates did not vary significantly by region or race/ethnicity; however prevalence was significantly higher among cases for which the expected primary payer was Medicaid (15.1 cases per 100,000) compared with private insurance or managed health care (5.4 cases per 100,000).
In New York City, 76 cases of neonatal HSV infection were identified through population-based surveillance during a 4.5 year period (April 2006–September 2010), for an average annual incidence of 13.3 cases per 100,000 live births.25 Forty-one percent of the confirmed cases were
56 STD Surveillance 2015Special Focus Profiles: STDs in Women and Infants
infected with HSV type 1. A review of certificates of death or stillbirth issued in New York City during 1981–2013 identified 34 deaths due to neonatal HSV infection, or 0.82 deaths per 100,000 live births.27
For information on adolescent and adult HSV infections, see Other STDs.
Pelvic Inflammatory DiseaseAccurate estimates of PID and tubal factor infertility resulting from chlamydial and gonococcal infections are difficult to obtain, in part because definitive diagnoses of these conditions can be complex. Published data suggest overall declining U.S. rates of women diagnosed with PID in both hospital and ambulatory settings.28-30 The National Disease and Therapeutic Index (NDTI; see Section A2.5 in the Appendix) provides estimates of initial visits to office-based, private physicians for PID. NDTI estimated that from 2005–2014 the number of initial visits to such physicians for PID among women aged 15–44 years have decreased by 71.0% from 176,000 to 51,000 visits (Figure E). The 2015 NDTI data were not obtained in time to include them in this report.
Differences in PID diagnoses or treatment by race/ethnicity have been observed in earlier research.30 Data from the National Survey of Family Growth indicates that the overall proportion of sexually experienced women who have been treated for PID declined from 8.6% in 1995 to 4.1% during 2011–2013 (Figure F).31 While this pattern was observed across all racial/ethnic groups, the proportion who had received PID treatment was higher in non-Hispanic Blacks than in Hispanics or non-Hispanic Whites. These disparities are consistent with the marked racial disparities observed for chlamydia and gonorrhea. However, because of the subjective methods by which PID is diagnosed, racial disparity data should be interpreted with caution.
Several factors may be contributing to declining PID rates, including increases in chlamydia and gonorrhea screening coverage, more sensitive diagnostic technologies, and availability of single-dose therapies that increase adherence to treatment.29-30,32 While PID is declining nationally, it still causes an enormous amount of unnecessary and expensive morbidity.
Ectopic PregnancyEctopic pregnancy (EP) is a potentially life-threatening condition that requires prompt evaluation and treatment. In 1992, CDC estimated the U.S. ectopic rate at 2% of all pregnancies.33 Since then, reliable estimates using national healthcare surveys has been challenging because medical and surgical treatment of EP is currently provided in both inpatient and outpatient settings. More recent attempts
to estimate EP incidence use data from administrative databases of public and private insurance and managed care systems.34,35 Using data from a large administrative claims database of U.S. commercial health plans, trends in the rate of ectopic pregnancy among pregnancies in females aged 15–44 years during the period of 2003–2014 have remained relatively stable across all 5 year age groups (Figure G). Rates of ectopic pregnancy increased with age, with the greatest rate concentrated in the 35–39 and 40–44 year age groups.
1 Jolly DH, Mueller MP, Chen M, et al. Concurrency and Other Sexual Risk Behaviors Among Black Young Adults in a Southeastern City. AIDS Educ Prev. 2016 Feb;28(1):59-76.
2 Dolwick Grieb SM, Davey-Rothwell M, and Latkin CA. Concurrent sexual partnerships among Urban African American High Risk Women with Main Sex partners. AIDS Behav. 2012 Feb;16(2):323-33. doi: 10.1007/s10461-011-9954-6.
3 Hogben M, Leichliter JS. Social determinants and sexually transmitted disease disparities. Sex Transm Dis. 2008;35(12):S13 S18.
4 Kelly J, Cohen J, Grimes B, et al. High Rates of Herpes Simplex Virus Type 2 Infection in Homeless Women: Informing Public Health Strategies. J Womens Health (Larchmt). 2016 May 31.
5 Tschann JM, Flores E, de Groat CL, et al. Condom negotiation strategies and actual condom use among Latino youth. J Adolesc Health. 2010 Sep;47(3):254-62. doi: 10.1016/j.jadohealth.2010.01.018. Epub 2010 Apr 10.
6 Pulerwitz J, Amaro H, De Jong W, et al. Relationship power, condom use and HIV risk among women in the USA. AIDS Care. 2002;14(6):789-800.
7 McCree DH, Rompalo A. Biological and behavioral risk factors associated with STDs/HIV in women: implications for behavioral interventions, In: Aral SO, Douglas JM,Lipshutz JA (editors). Behavioral Interventions for Prevention and Control of Sexually Transmitted Diseases (p. 310-324). New York, NY: Springer.
8 O’Leary A. A woman’s risk for HIV from a primary partner: balancing risk and intimacy. Annu Rev Sex Res. 2000; 11:191-234.
9 Manderson L, Chang T, Tye LC, et al. Condom use in heterosexual sex: a review of research, 1985–1994. In: Catalan J, Sherr L, Hedge B (editors). The impact of AIDS: psychological and social aspects of HIV Infection. p. 1-26. The Netherlands: Harwood Academic Publishers.
10 Paavonen J, Westrom L, Eschenbach. Pelvic Inflammatory Disease. In: Holmes KK, Sparling PF, Stamm WE, Piot P, Wasserheit JN, Corey L, Cohen, MS, Watts DH, (editors). Sex Transm Dis. 4th ed. New York: McGraw-Hill; 2008:1017-1050.
11 Hook EW III, Handsfield HH. Gonococcal infections in the adult. In: Holmes KK, Sparling PF, Stamm WE, Piot P, Wasserheit JN, Corey L, et al, (editors). Sex Transm Dis. 4th ed. New York: McGraw-Hill; 2008:627-45.
12 Westrom L, Joesoef R, Reynolds G, et al. Pelvic inflammatory disease and fertility: a cohort study of 1,844 women with laparoscopically verified disease and 657 control women with normal laparoscopy. Sex Transm Dis. 1992;9:185-92.
13 Hillis SD, Joesoef R, Marchbanks PA, et al. Delayed care of pelvic inflammatory disease as a risk factor for impaired fertility. Am J Obstet Gynecol.1993;168:1503-9.
14 Scholes D, Stergachis A, Heidrich FE, et al. Prevention of pelvic inflammatory disease by screening for cervical chlamydial infection. N Engl J Med. 1996;34(21):1362-6.
15 Oakeschott, P, Kerry S, Aghaizu A, et al. Randomised controlled trial of screening for Chlamydia trachomatis to prevent pelvic inflammatory disease: the POPI (prevention of pelvic infection) trial. BMJ. 2010;340:c1642.
57STD Surveillance 2015 Special Focus Profiles: STDs in Women and Infants
16 Markowitz LE, Dunne EF, Saraiya M, et al. Human papillomavirus vaccination. Recommendations of the Advisory Committee on Immunization Practices (ACIP). MMWR Morb Mortal Wkly Rep 2014;63(RR05):1-30.
17 Kimberlin DW. Herpes simplex virus infections of the newborn. Semin Perinatol. 2007;31(1):19-25.
18 Mindel A, Taylor J, Tideman RL, et al. Neonatal herpes prevention: a minor public health problem in some communities. Sex Transm Infect 2000;76: 287–91.
19 Centers for Disease Control and Prevention. Congenital syphilis — United States, 2003–2008. MMWR Morb Mortal Wkly Rep. 2010;59:413-17.
20 Farley TA, Cohen DA, Elkins W. Asymptomatic sexually transmitted diseases: the case for screening. Preventive Medicine. 2003;36:502-9.
21 Centers for Disease Control and Prevention. Recommendations for the Prevention and Management of Chlamydia trachomatis Infections, 1993. MMWR Morb Mortal Wkly Rep. August 6, 1993 / Vol. 42 / No. RR-12
22 Corey L, Wald A. Maternal and neonatal herpes simplex virus infections. N Engl J Med 2009;361(14):1376–85.
23 Centers for Disease Control and Prevention. Neonatal herpes simplex virus infection following Jewish ritual circumcisions that included direct orogenital suction — New York City, 2000–2011. MMWR Morb Mortal Wkly Rep 2012;61(22):405–9
24 Dinh T-H, Dunne EF, Markowitz LE, et al. Assessing neonatal herpes reporting in the United States, 2000–2005. Sex Transm Dis 2008;35(1):19–21.
25 Handel S, Klingler EJ, Washburn K, et al. Population-based surveillance for neonatal herpes in New York City, April 2006–September 2010. Sex Transm Dis 2011;38(8):705–11.
26 Flagg EW, Weinstock H. Incidence of neonatal herpes simplex virus infections in the United States, 2006. Pediatrics 2011;127(1):e1–8.
27 Sampath A, Maduro G, Schillinger JA. Infant deaths due to herpes simplex virus, congenital syphilis, and HIV in New York City. Pediatrics 2016;137(4):e20152387.
28 Sutton MY, Sternberg M, Zaidi A, et al. Trends in pelvic inflammatory disease hospital discharges and ambulatory visits, United States, 1985–2001. Sex Transm Dis. 2005;32(12):778-84.
29 Bohm MK, Newman L, Satterwhite CL, et al. Pelvic inflammatory disease among privately insured women, United States, 2001–2005. Sex Transm Dis 2010;37:131–136.
30 Whiteman MK, Kuklina E, Jamieson DJ, et al. Inpatient hospitalization for gynecologic disorders in the United States. Am J Obstet Gynecol 2010;202:541 e1–6.
31 Leichliter JS. Chandra A. Aral SO. Correlates of self-reported pelvic inflammatory disease treatment in sexually experienced reproductive-aged women in the United States, 1995 and 2006-2010. Sex Transm Dis. 2013;40(5):413-8.
32 Owusu-Edusei K Jr, Bohm MK, Chesson HW, et al. Chlamydia screening and pelvic inflammatory disease: Insights from exploratory time-series analyses. Am J Prev Med. 2010 Jun;38(6):652-7.
33 Centers for Disease Control and Prevention. Ectopic pregnancy–United States, 1990–1992. MMWR Morb Mortal Wkly Rep 1995;44:46–8.
34 Zane SB, Kieke BA Jr, Kendrick JS, et al. Surveillance in a time of changing health care practices: estimating ectopic pregnancy incidence in the United States. Matern Child Health J 2002;6:227–36.
35 Hoover KW, Tao G, Kent CK. Trends in the diagnosis and treatment of ectopic pregnancy in the United States. Obstet Gynecol. 2010;3(115):49519
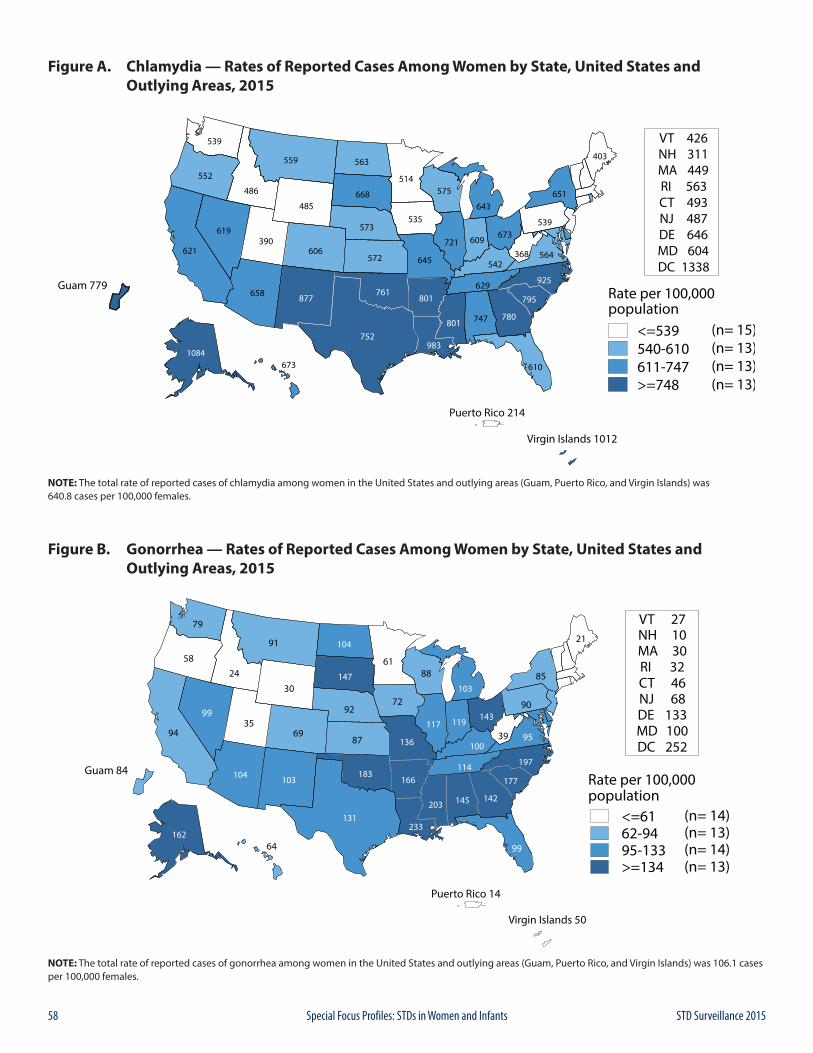
58 STD Surveillance 2015Special Focus Profiles: STDs in Women and Infants
Figure A. Chlamydia — Rates of Reported Cases Among Women by State, United States and Outlying Areas, 2015
NOTE: The total rate of reported cases of chlamydia among women in the United States and outlying areas (Guam, Puerto Rico, and Virgin Islands) was 640.8 cases per 100,000 females.
Figure B. Gonorrhea — Rates of Reported Cases Among Women by State, United States and Outlying Areas, 2015
NOTE: The total rate of reported cases of gonorrhea among women in the United States and outlying areas (Guam, Puerto Rico, and Virgin Islands) was 106.1 cases per 100,000 females.
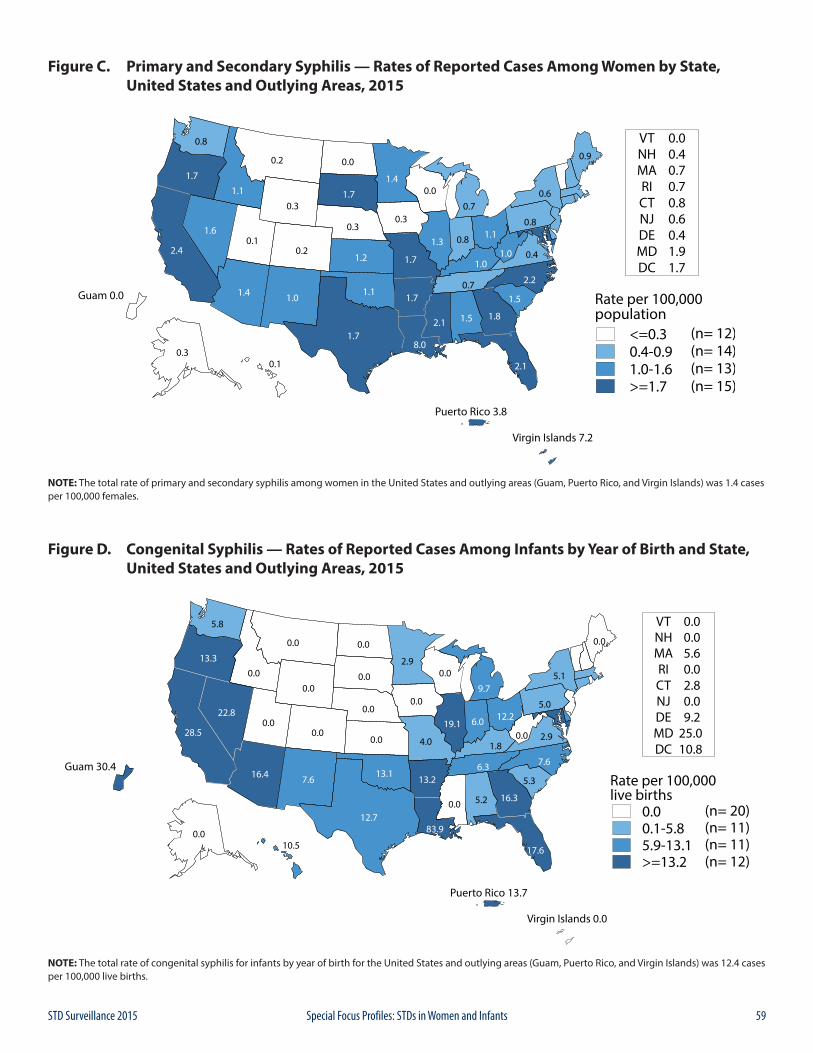
59STD Surveillance 2015 Special Focus Profiles: STDs in Women and Infants
Figure C. Primary and Secondary Syphilis — Rates of Reported Cases Among Women by State, United States and Outlying Areas, 2015
NOTE: The total rate of primary and secondary syphilis among women in the United States and outlying areas (Guam, Puerto Rico, and Virgin Islands) was 1.4 cases per 100,000 females.
Figure D. Congenital Syphilis — Rates of Reported Cases Among Infants by Year of Birth and State, United States and Outlying Areas, 2015
NOTE: The total rate of congenital syphilis for infants by year of birth for the United States and outlying areas (Guam, Puerto Rico, and Virgin Islands) was 12.4 cases per 100,000 live births.
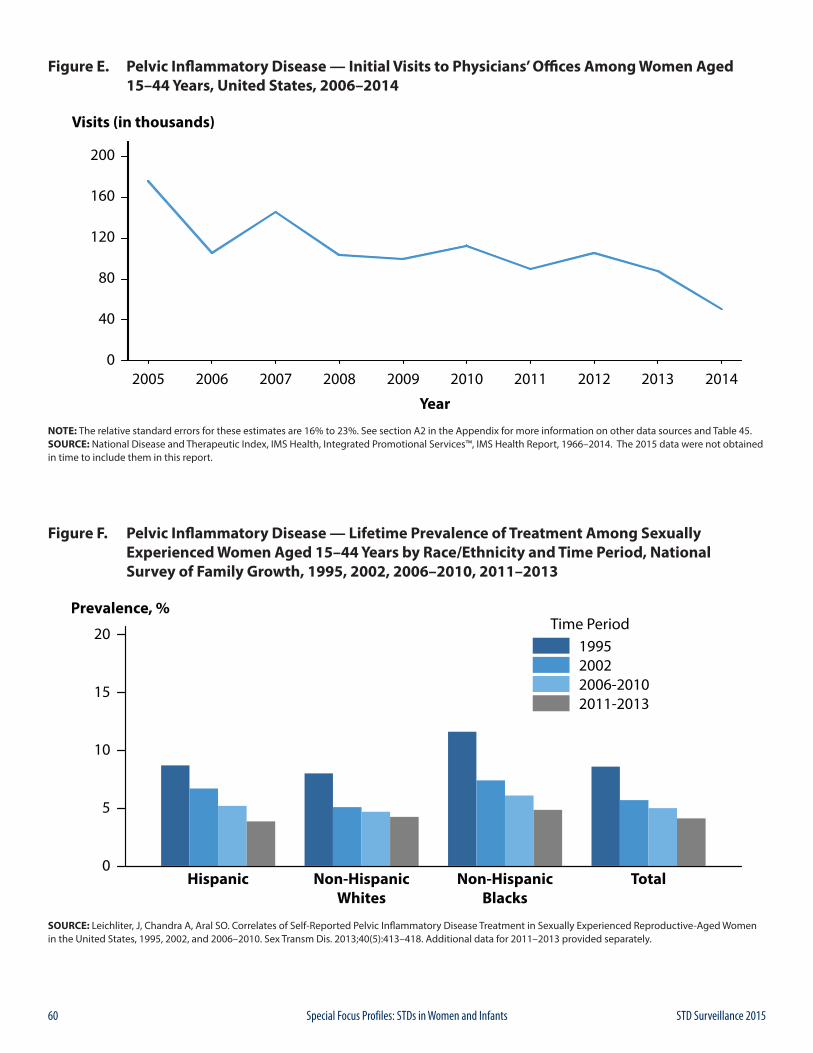
60 STD Surveillance 2015Special Focus Profiles: STDs in Women and Infants
Figure E. Pelvic Inflammatory Disease — Initial Visits to Physicians’ Offices Among Women Aged 15–44 Years, United States, 2006–2014
NOTE: The relative standard errors for these estimates are 16% to 23%. See section A2 in the Appendix for more information on other data sources and Table 45.SOURCE: National Disease and Therapeutic Index, IMS Health, Integrated Promotional Services™, IMS Health Report, 1966–2014. The 2015 data were not obtained in time to include them in this report.
Figure F. Pelvic Inflammatory Disease — Lifetime Prevalence of Treatment Among Sexually Experienced Women Aged 15–44 Years by Race/Ethnicity and Time Period, National Survey of Family Growth, 1995, 2002, 2006–2010, 2011–2013
SOURCE: Leichliter, J, Chandra A, Aral SO. Correlates of Self-Reported Pelvic Inflammatory Disease Treatment in Sexually Experienced Reproductive-Aged Women in the United States, 1995, 2002, and 2006–2010. Sex Transm Dis. 2013;40(5):413–418. Additional data for 2011–2013 provided separately.
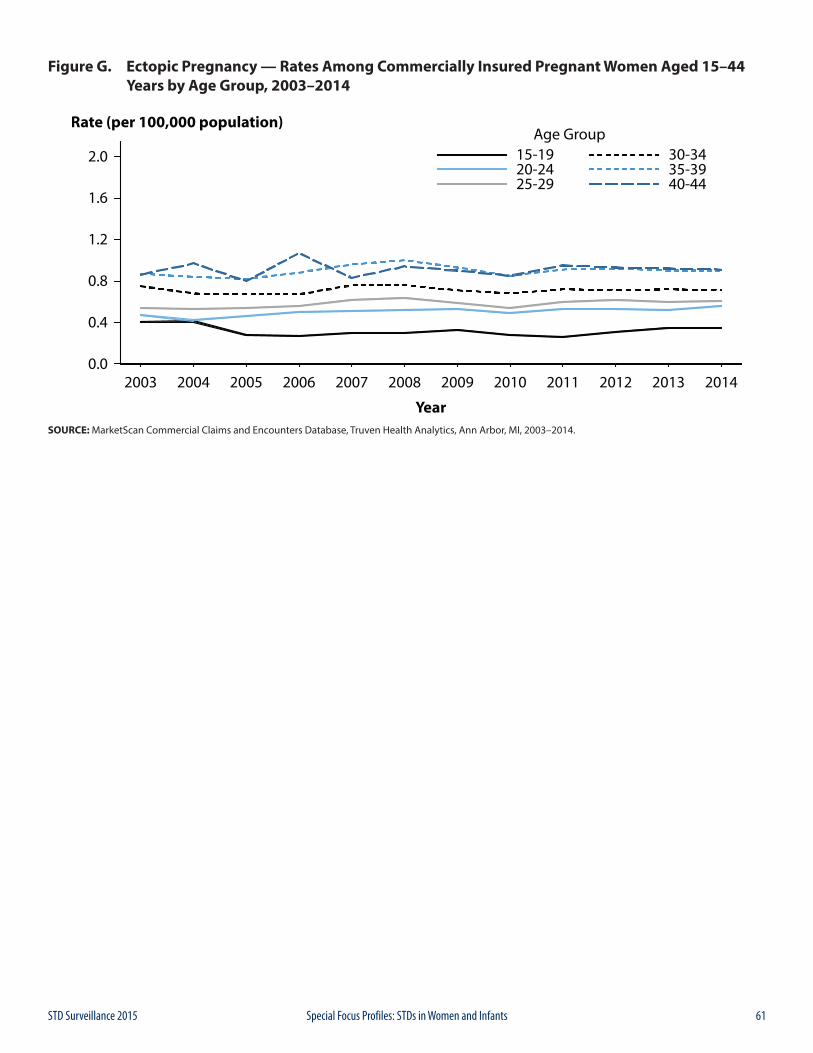
61STD Surveillance 2015 Special Focus Profiles: STDs in Women and Infants
Figure G. Ectopic Pregnancy — Rates Among Commercially Insured Pregnant Women Aged 15–44 Years by Age Group, 2003–2014
SOURCE: MarketScan Commercial Claims and Encounters Database, Truven Health Analytics, Ann Arbor, MI, 2003–2014.
62 STD Surveillance 2015Special Focus Profiles: STDs in Adolescents and Young Adults
Public Health ImpactIncidence and prevalence estimates suggest that young people aged 15–24 years acquire half of all new STDs1 and that 1 in 4 sexually active adolescent females has an STD, such as chlamydia or human papillomavirus (HPV).2 Compared with older adults, sexually active adolescents aged 15–19 years and young adults aged 20–24 years are at higher risk of acquiring STDs for a combination of behavioral, biological, and cultural reasons. For some STDs, such as chlamydia, adolescent females may have increased susceptibility to infection because of increased cervical ectopy. Cervical ectopy refers to columnar cells, which are typically located within the cervical canal, being located on the outer surface of the cervix. Although this is a normal finding in adolescent and young women, these cells are more susceptible to infection. The higher prevalence of STDs among adolescents may also reflect multiple barriers to accessing quality STD prevention and management services, including inability to pay, lack of transportation, long waiting times, conflict between clinic hours and work and school schedules, embarrassment attached to seeking STD services, method of specimen collection, and concerns about confidentiality (e.g., Explanation of Benefits for services received mailed to parents or guardians).3
Traditionally, intervention efforts have targeted individual level factors associated with STD risk which do not address higher-level factors (e.g., peer norms and media influences) that may also influence behaviors.4 Interventions for at-risk adolescents and young adults that address underlying aspects of the social and cultural conditions affecting sexual risk-taking behaviors are needed, as are strategies designed to improve the underlying social conditions themselves.5,6 In addition, in designing STD programs, consideration should be given to the needs of adolescent and young adult populations including extended hours, optimizing privacy in waiting rooms, and urine based specimen collection.3
Observations
ChlamydiaIn 2015, there were 981,359 reported cases of chlamydial infection among persons aged 15–24 years, representing 64.3% of all reported chlamydia cases. Among those aged 15–19 years, the rate of reported cases of chlamydia increased 2.5% during 2014–2015 (1,811.9 to 1,857.8 cases per 100,000 population) (Table 10). Among those
aged 20–24 years, the rate increased 4.2% during 2014–2015 (2,472.0 to 2,574.9 cases per 100,000 population) (Table 10).
Among women aged 15–24 years, the population targeted for chlamydia screening, the overall rate of reported cases of chlamydia was 3,377.6 cases per 100,000 females. Among men aged 15–24 years, the overall rate of reported cases of chlamydia was 1,132.5 cases per 100,000 males. Rates varied by state for both males and females, with the majority of states having the highest reported case rates in the South (Figures H and I).
15–19 Year Old Females — In 2015, the rate of reported chlamydia cases among women aged 15–19 years was 2,994.4 cases per 100,000 females, a 1.5% increase from the 2014 rate of 2949.3 cases per 100,000 females (Table 10). Increases in rates of reported cases of chlamydia were largest among 17–, 18–, and 19–year old women (2.1%, 2.8%, and 2.2% increases, respectively) (Table 12). However, during 2011–2015, the rate for women in this age group decreased 14.1% (Table 10).
20–24 Year Old Females — In 2015, women aged 20–24 years had the highest rate of reported chlamydia cases (3,730.3 cases per 100,000 females) compared with any other age group for either sex (Figure 5, Table 10). The overall rate of reported chlamydia cases among women in this age group increased 2.7% during 2014–2015 (Table 10). However, increases in rates of reported cases of chlamydia were largest among 23– and 24–year old women (3.0% and 5.9% increases, respectively) (Table 12). Similarly, during 2011–2015, the rate for women in this age group increased 2.8% (Table 10).
15–19 Year Old Males — In 2015, the rate of reported chlamydia cases among men aged 15–19 years was 767.6 cases per 100,000 males. During 2014–2015, the rate of reported chlamydia cases for men in this age group increased 6.3% (Table 10). However, during 2011–2015, the rate for men aged 15–19 years decreased 6.0% (Table 10).
20–24 Year Old Males — In 2015, as in previous years, men aged 20–24 years had the highest rate of reported chlamydia cases among all men (1,467.8 cases per 100,000 males). The rate for men in this age group increased 7.8% during 2014–2015 (Table 10). Similarly, during 2011–2015, the rate for men aged 20–24 years increased 12.2% (Table 10).
STDs in Adolescents and Young Adults
63STD Surveillance 2015 Special Focus Profiles: STDs in Adolescents and Young Adults
GonorrheaDuring 2014–2015, the rate of reported gonorrhea cases increased 5.2% for persons aged 15–19 years and 7.2% for persons aged 20–24 years (Table 21). Among women aged 15–24 years, the rate was 496.7 cases per 100,000 females. Rates varied by state, with the majority of states with the highest reported case rates in the South (Figure J). Among men aged 15–24 years, the overall rate was 398.2 cases per 100,000 males. Rates varied by state, with the majority of states having the highest reported case rates in the South (Figure K).
15–19 Year Old Females — In 2015, women aged 15–19 years had the second highest rate of reported gonorrhea cases (442.2 cases per 100,000 females) compared with other women (Figure 17, Table 21). During 2014–2015, the rate of reported gonorrhea for women in this age group increased 2.4%. However, during 2011–2015, the rate for women in this age group decreased 22.1% (Table 21).
20–24 Year Old Females — In 2015, women aged 20–24 years had the highest rate of reported gonorrhea cases (546.9 cases per 100,000 females) compared with any other age group for either sex (Figure 17, Table 21). During 2014–2015, the rate of reported gonorrhea for women in this age group increased 3.0%. However, during 2011–2015, the rate for women in this age group decreased 4.0% (Table 21).
15–19 Year Old Males — In 2015, the rate of reported gonorrhea cases among men aged 15–19 years was 244.8 cases per 100,000 males (Figure 17, Table 21). During 2014–2015, the rate of reported gonorrhea for men in this age group increased 10.1%. However, during 2011–2015, the rate for men in this age group decreased 3.1% (Table 21).
20–24 Year Old Males — In 2015, as in previous years, men aged 20–24 years had the highest rate of reported gonorrhea cases (539.1 cases per 100,000 males) compared with other men (Figure 17, Table 21). During 2014–2015, the rate of reported gonorrhea for men in this age group increased 11.6%. Similarly, during 2011–2015, the rate for men in this age group increased 22.9% (Table 21).
Primary and Secondary SyphilisDuring 2014–2015, the rate of reported primary and secondary (P&S) syphilis cases increased 10.2% among persons aged 15–19 years and 14.9% among persons aged 20–24 years (Table 34).
15–19 Year Old Females — The rate of reported P&S syphilis cases among women aged 15–19 years decreased each year during 2009–2013 (from 3.3 to 1.9 cases per 100,000 females) (Figure 37, Table 34). However, the rate increased in 2014 and again in 2015. During 2014–2015,
the rate increased 12.0%, from 2.5 to 2.8 cases per 100,000 females (Figure 37, Table 34).
20–24 Year Old Females — In 2015, women aged 20–24 years had the highest rate of P&S syphilis (5.1 cases per 100,000 females) compared with other women (Figure 36, Table 34). The P&S syphilis rate among women in this age group has increased each year since 2011 (Figure 37, Table 34). During 2014–2015, the rate increased 13.3%.
15–19 Year Old Males — In 2015, the rate of reported P&S syphilis among men aged 15–19 years was 8.0 cases per 100,000 males (Figure 36, Table 34). The P&S syphilis rate among men in this age group has increased each year since 2011 (Figure 38, Table 34). During 2014–2015, the rate increased 12.7%.
20–24 Year Old Males — In 2015, men aged 20–24 years had the second highest rate of reported P&S syphilis cases compared with any other age group for either sex (Figure 36). The P&S syphilis rate among men in this age group has increased each year since 2006 (Figure 38, Table 34). During 2014–2015, the rate increased 15.5%, from 30.9 to 35.7 cases per 100,000 males.
National Job Training ProgramThe National Job Training Program (NJTP) is an educational program for socioeconomically disadvantaged youth aged 16–24 years and is administered at more than 100 sites throughout the country. The NJTP screens participants for chlamydia and gonorrhea within two days of entry to the program. All of NJTP’s chlamydia screening tests and the majority of gonorrhea screening tests are conducted by a single national contract laboratory*. To increase the stability of the estimates, chlamydia or gonorrhea prevalence data are presented when valid test results for 100 or more students per year are available for the population subgroup and state. Additional information about NJTP can be found in Section A2.1 in the Appendix.
Among women entering the program in 43 states and Puerto Rico, the median state-specific chlamydia prevalence in 2015 was 12.7% (range: 5.4% to 20.5%) (Figure L). Among men entering the program in 48 states, the District of Columbia and Puerto Rico, the median state-specific chlamydia prevalence was 7.5% (range: 2.6% to 12.3%) (Figure M).
Among women entering the program in 43 states and Puerto Rico, the median state-specific gonorrhea prevalence in 2015 was 1.9% (range: 0.0% to 6.8%) (Figure N). Among men entering the program in 39 states and Puerto Rico, the median state-specific gonorrhea prevalence was 0.7% (range: 0.0% to 2.9%) (Figure O).
* Laboratory tests are conducted by the Center for Disease Detection, LLC San Antonio, Texas.
64 STD Surveillance 2015Special Focus Profiles: STDs in Adolescents and Young Adults
1 Satterwhite CL, Torrone E, Meites E, et al. Sexually transmitted infections among US women and men: prevalence and incidence estimates, 2008. Sex Trans Dis. 2013;40(3)187-93.
2 Forhan SE, Gottlieb SL, Sternberg MR, et al. Prevalence of sexually transmitted infections among female adolescents aged 14 to 19 in the United States. Pediatrics. 2009;124(6):1505-12.
3 Tilson EC, Sanchez V, Ford CL, et al. Barriers to asymptomatic screening and other STD services for adolescents and young adults: focus group discussions. BMC Public Health. 2004;4:21.
4 DiClemente RJ, Salazar LF, Crosby RA. A review of STD/HIV preventive interventions for adolescents: sustaining effects using an ecological approach. J Pediatr Psychol. 2007;32(8):888-906.
5 Sieving RE, Bernat DH, Resnick MD, et al. A clinic-based youth development program to reduce sexual risk behaviors among adolescent girls: prime time pilot study. Health Promot Pract. 2012;13(4):462-71.
6 Upchurch DM, Mason WM, Kusunoki Y, et al. Social and behavioral determinants of self-reported STD among adolescents. Perspect Sex Reprod Health. 2004;36(6):276-87.
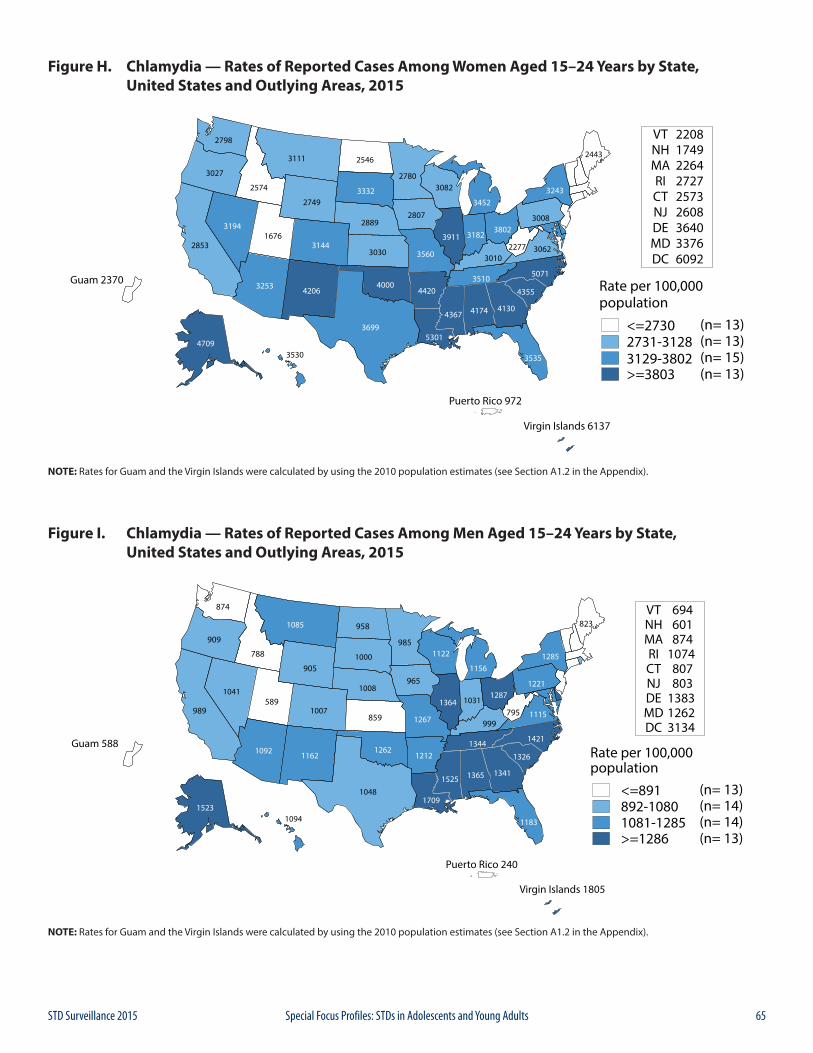
65STD Surveillance 2015 Special Focus Profiles: STDs in Adolescents and Young Adults
Figure H. Chlamydia — Rates of Reported Cases Among Women Aged 15–24 Years by State, United States and Outlying Areas, 2015
NOTE: Rates for Guam and the Virgin Islands were calculated by using the 2010 population estimates (see Section A1.2 in the Appendix).
Figure I. Chlamydia — Rates of Reported Cases Among Men Aged 15–24 Years by State, United States and Outlying Areas, 2015
NOTE: Rates for Guam and the Virgin Islands were calculated by using the 2010 population estimates (see Section A1.2 in the Appendix).
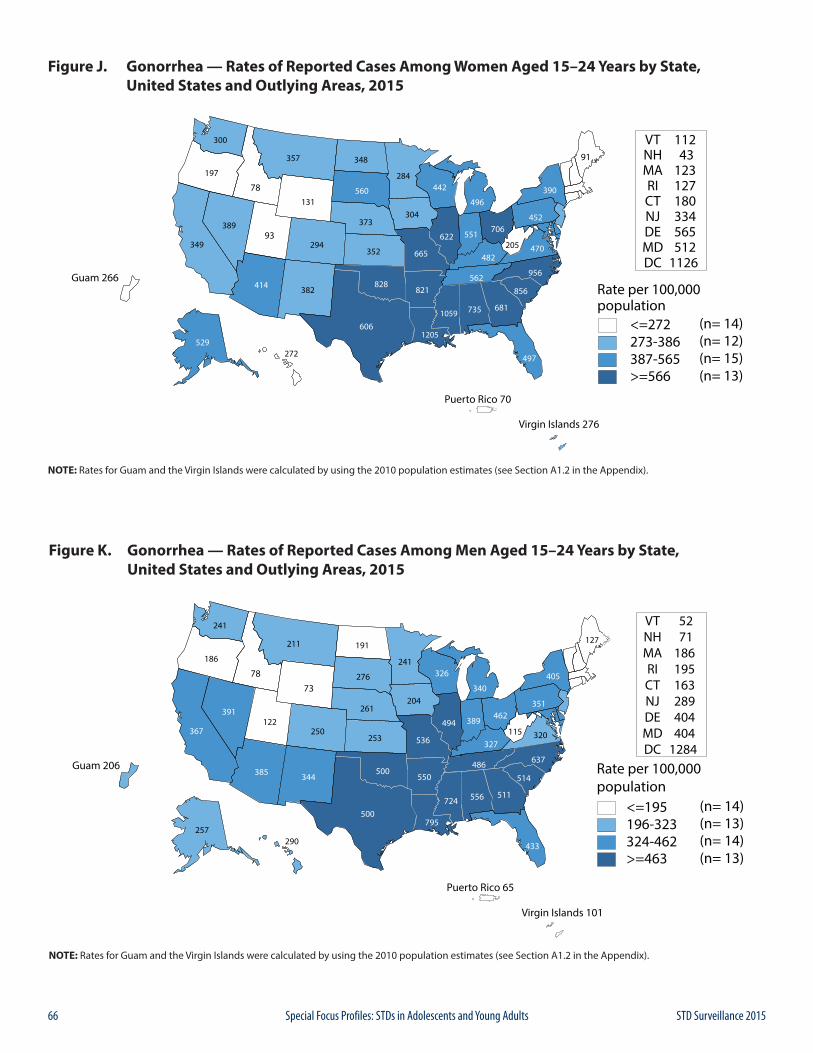
66 STD Surveillance 2015Special Focus Profiles: STDs in Adolescents and Young Adults
Figure J. Gonorrhea — Rates of Reported Cases Among Women Aged 15–24 Years by State, United States and Outlying Areas, 2015
NOTE: Rates for Guam and the Virgin Islands were calculated by using the 2010 population estimates (see Section A1.2 in the Appendix).
Figure K. Gonorrhea — Rates of Reported Cases Among Men Aged 15–24 Years by State, United States and Outlying Areas, 2015
NOTE: Rates for Guam and the Virgin Islands were calculated by using the 2010 population estimates (see Section A1.2 in the Appendix).
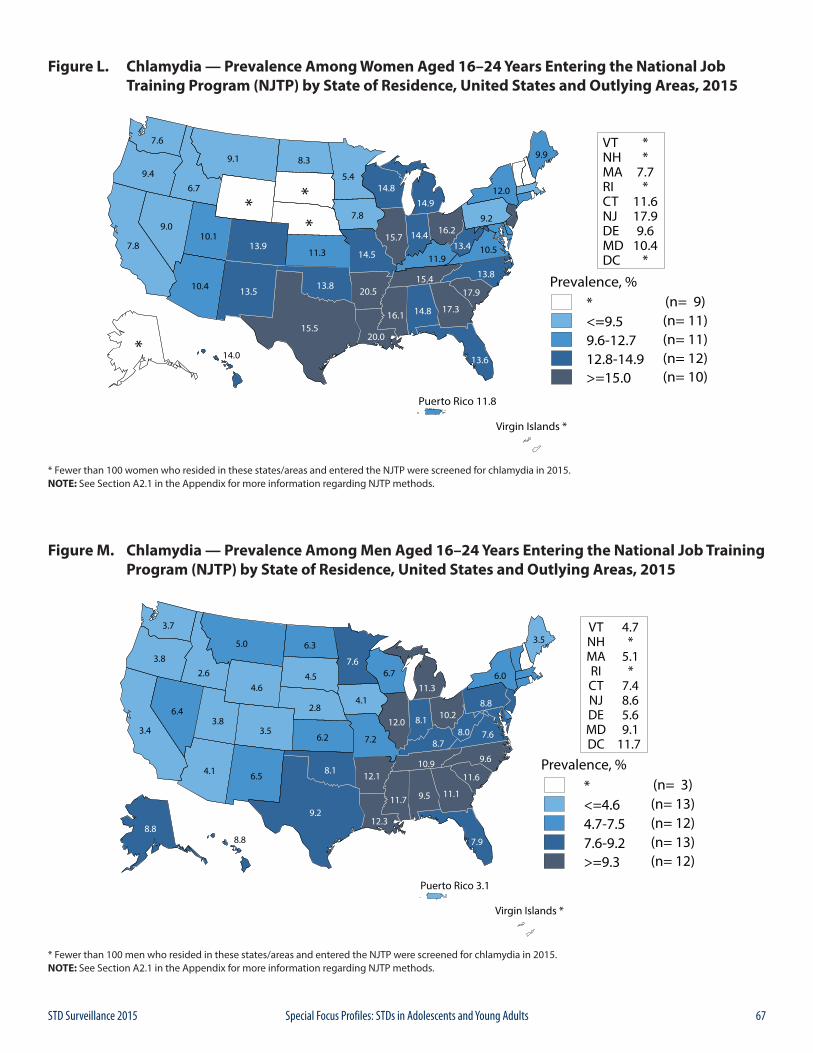
67STD Surveillance 2015 Special Focus Profiles: STDs in Adolescents and Young Adults
Figure L. Chlamydia — Prevalence Among Women Aged 16–24 Years Entering the National Job Training Program (NJTP) by State of Residence, United States and Outlying Areas, 2015
* Fewer than 100 women who resided in these states/areas and entered the NJTP were screened for chlamydia in 2015.NOTE: See Section A2.1 in the Appendix for more information regarding NJTP methods.
Figure M. Chlamydia — Prevalence Among Men Aged 16–24 Years Entering the National Job Training Program (NJTP) by State of Residence, United States and Outlying Areas, 2015
* Fewer than 100 men who resided in these states/areas and entered the NJTP were screened for chlamydia in 2015.NOTE: See Section A2.1 in the Appendix for more information regarding NJTP methods.
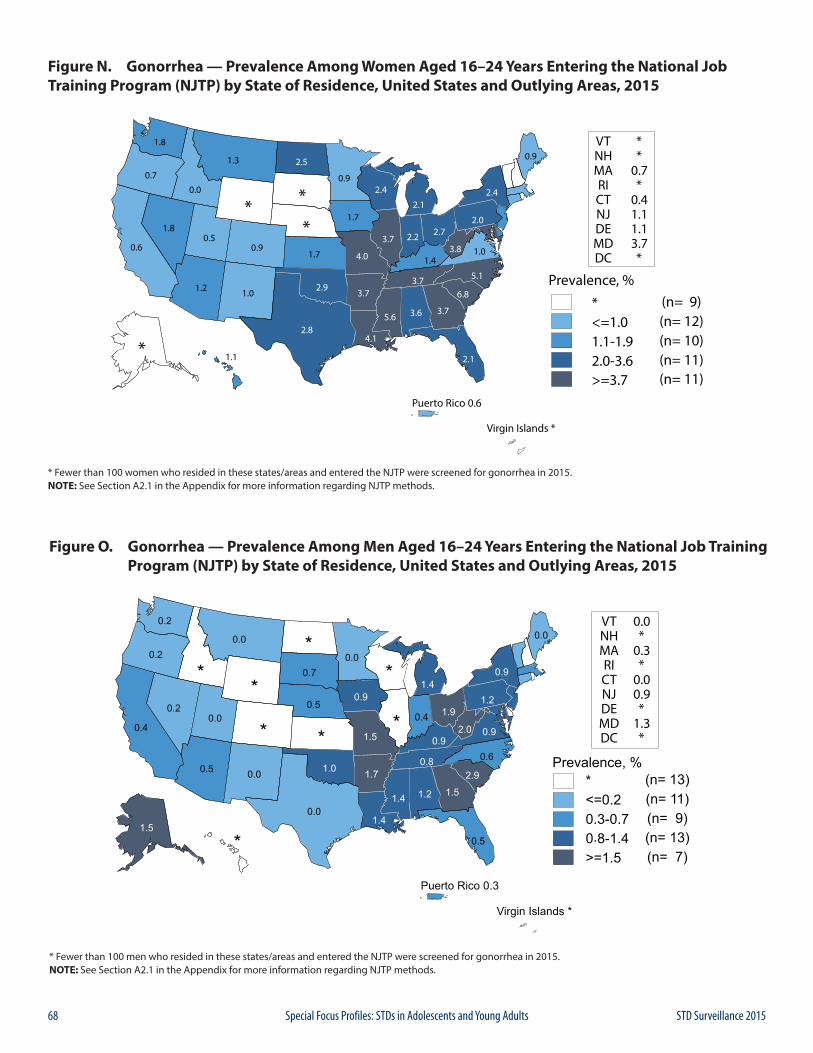
68 STD Surveillance 2015Special Focus Profiles: STDs in Adolescents and Young Adults
Figure N. Gonorrhea — Prevalence Among Women Aged 16–24 Years Entering the National Job Training Program (NJTP) by State of Residence, United States and Outlying Areas, 2015
* Fewer than 100 women who resided in these states/areas and entered the NJTP were screened for gonorrhea in 2015.NOTE: See Section A2.1 in the Appendix for more information regarding NJTP methods.
Figure O. Gonorrhea — Prevalence Among Men Aged 16–24 Years Entering the National Job Training Program (NJTP) by State of Residence, United States and Outlying Areas, 2015
* Fewer than 100 men who resided in these states/areas and entered the NJTP were screened for gonorrhea in 2015.NOTE: See Section A2.1 in the Appendix for more information regarding NJTP methods.
69STD Surveillance 2015 Special Focus Profiles: STDs in Racial and Ethnic Minorities
Public Health ImpactSurveillance data show higher rates of reported STDs among some racial or ethnic minority groups when compared with rates among Whites.1,2 Race and Hispanic ethnicity in the United States are population characteristics that are correlated with other fundamental determinants of health status such as high rates of poverty, income inequality, unemployment and low educational attainment.3-5 Those who cannot afford basic necessities may have trouble accessing and affording quality sexual health services.6 The overall proportion of the U.S. population living in poverty in 2014, the most recent year for which poverty statistics are available, was 14.8% (or 46.7 million) and remained statistically unchanged from the previous year. Although the overall poverty rate is currently stable, many Americans continue to face challenges overcoming inequalities in economic opportunity. The poverty rate for Whites was 10.1% (19.7 million), for Blacks it was 26.2% (or 10.8 million), and for Hispanics it was 23.6% (or 13.1 million).3 People who struggle financially are often experiencing life circumstances that potentially increase their risk for STDs.6
Access to quality STD prevention and treatment services is key to reducing STD disparities in the United States. In March 2010 the Patient Protection and Affordable Care Act (ACA) was signed into law significantly increasing the availability of insurance coverage for all Americans, particularly for young adults aged 19–26 years – an important demographic for STD prevention.7 Of the estimated 19 million new cases of sexually transmitted infections that occur each year, approximately half of the cases occur among people aged 15–24 years.8 Although the overall proportion of adults without health insurance decreased from 13.3% in 2013 to 10.4% (or 316 million) in 2014, many people in the U.S. may still not have access to health care.9 For example many of the states with the highest burden of STDs and disparities in STD incidence did not expand Medicaid coverage as the ACA allowed.10
Among all races and ethnicities in the U.S., Hispanics had the lowest rate of health insurance coverage in 2014 at 80.1%.9,12,14
Non-U.S. citizens (i.e., immigrants or undocumented persons) may face additional barriers in accessing care. In 2014, 31.2% (or 7 million) of non-U.S. citizens did not have health insurance coverage. Even when health care is available, fear and distrust of health care institutions can negatively affect the health care-seeking experience for many racial/ethnic minorities when there is social discrimination, provider bias, or the perception that these may exist.14 Moreover, the quality of care may differ
substantially for minority patients.15 Inequities in social and economic conditions are reflected in the profound disparities observed in the incidence of STDs among some racial and ethnic minorities.
In communities where STD prevalence is higher because of these inequalities, individuals may have a more difficult time reducing their risk for infection. With each sexual encounter, they face a greater chance of encountering an infected partner than those in lower prevalence settings.2 Acknowledging inequities in STD rates by race or ethnicity is one of the first steps in empowering affected communities to organize and focus on this problem.
STD Reporting PracticesSurveillance data are based on cases of STDs reported to state and local health departments (see Section A.1 in the Appendix). In many state and local health departments, electronic laboratory reporting is increasingly a primary source of initial case notification. The reports are often missing race and ethnicity of the patient; ascertainment of information on race and Hispanic ethnicity is therefore a function of active follow-up, or dependent on previous information available about the patient in existing health department surveillance databases. Prevalence data from population-based surveys, such as the National Health and Nutrition Examination Survey (NHANES) and the National Longitudinal Study of Adolescent Health, confirm the existence of marked STD disparities in some minority populations.16, 17
Method of Classifying Race & Hispanic EthnicityInterpretation of racial and ethnic disparities among persons with STDs is influenced by data collection methods and by the categories by which these data are displayed. Race/ethnicity data are presented in Office of Management and Budget (OMB) race and ethnic categories, according to the 1997 revised OMB standards. However, the National Center for Health Statistics (NCHS) bridged-race categories are used where OMB categories are not available (i.e., congenital syphilis).18 As of 2015, fifty states and/or reporting jurisdictions now collect and report data in OMB-compliant formats for chlamydia and gonorrhea and 49 states and/or reporting jurisdictions report syphilis cases in OMB-compliant formats. Historical trend and rate data by race and Hispanic ethnicity displayed in figures and interpreted in this report for 2011–2015 include only those states and/or reporting jurisdictions (45 jurisdictions for chlamydia, gonorrhea and syphilis) reporting in the current standard
STDs in Racial and Ethnic Minorities
70 STD Surveillance 2015Special Focus Profiles: STDs in Racial and Ethnic Minorities
consistently for all years from 2011 through 2015 (See Section A1.5 of the Appendix for additional information on reporting of race and Hispanic ethnicity).
Completeness of Race/Ethnicity Data in 2015Chlamydia — 29.3% of chlamydia case reports were missing race or ethnicity data, ranging by jurisdiction from 0.9% to 100% (Table A1).
Gonorrhea — 19.8% of gonorrhea case reports were missing information on race or ethnicity, ranging by jurisdiction from 0.0% to 100% (Table A1).
Syphilis — 4.4% of P&S syphilis case reports were missing information on race or ethnicity, ranging from 0.0% to 100% among jurisdiction with 10 or more cases of P&S syphilis (Table A1).
Observations
ChlamydiaAmong the 45 states that submitted data on race and ethnicity for each year during 2011–2015 according to the OMB standards, rates of reported chlamydia cases increased during that time frame among Asians (7.8%), Native Hawaiians/Other Pacific Islanders (8.9%), Whites (14.6%), and Multirace persons (43.1%), and decreased among Blacks (11.2%) (Figure 6). Rates were stable among American Indians/Alaska Natives and Hispanics during 2011–2015.
In 2015, 50 states submitted data on race and ethnicity according to the OMB standards. The following data pertain to those states:
Blacks — In 2015, the overall rate of reported chlamydia cases among Blacks in the United States was 1,097.6 cases per 100,000 population (Table 11B). The rate among Black women was 5.4 times the rate among White women (1,384.8 and 256.7 cases per 100,000 females, respectively) (Figure P and Table 11B). The rate among Black men was 6.8 times the rate among White men (782.0 and 115.4 cases per 100,000 males, respectively). Rates of reported cases of chlamydia were highest for Blacks aged 15–19 and 20–24 years in 2015 (Table 11B). The rate of reported chlamydia cases among Black women aged 15–19 years was 6,340.3 cases per 100,000 females, which was 4.7 times the rate among White women in the same age group (1,339.1 cases per 100,000 females). The rate among Black women aged 20–24 years was 3.9 times the rate among White women in the same age group (6,782.5 and 1,737.8 cases per 100,000 females, respectively) (Table 11B).
Similar racial disparities in reported chlamydia rates exist among men. Among males aged 15–19 years, the rate of reported chlamydia cases among Blacks was 8.8 times the rate among Whites (2,119.6 and 240.3 cases per 100,000 males, respectively) (Table 11B). The rate among Black men aged 20–24 years was 4.9 times the rate among White men of the same age group (3128.8 and 637.2 cases per 100,000 males, respectively).
American Indians/Alaska Natives — In 2015, the rate of reported chlamydia cases among American Indians/Alaska Natives was 709.1 cases per 100,000 population (Table 11B). Overall, the rate of chlamydia among American Indians/Alaska Natives in the United States was 3.8 times the rate among Whites.
Native Hawaiians/Other Pacific Islanders — In 2015, the rate of reported chlamydia cases among Native Hawaiians/Other Pacific Islanders was 622.1 cases per 100,000 population (Table 11B). The overall rate among Native Hawaiians/Other Pacific Islanders was 3.3 times the rate among Whites and 5.5 times the rate among Asians.
Hispanics — In 2015, the rate of reported chlamydia cases among Hispanics was 372.7 cases per 100,000 population, which is 2.0 times the rate among Whites (Table 11B).
Asians — In 2015, the rate of reported chlamydia cases among Asians was 114.1 cases per 100,000 population (Table 11B). The overall rate among Whites is 1.6 times the rate among Asians.
GonorrheaAmong 45 states submitting race and ethnicity data consistently according to OMB standards for all years from 2011–2015, rates of reported gonorrhea cases increased 75.1% among Whites (26.1 to 45.7 cases per 100,00 population), 71.3% among American Indians/Alaska Natives (104.5 to 179.0 cases per 100,000 population), 70.0% among Asians (14.0 to 23.8 cases per 100,000 population), 61.0% among Native Hawaiians/Other Pacific Islanders (72.6 to 116.9 cases per 100,000 population), and 53.8% among Hispanics (52.4 to 80.6 cases per 100,000 population) (Figure 20). The gonorrhea rate decreased 4.0% among Blacks (451.3 to 433.3 cases per 100,000 population).
In 2015, 50 states submitted data on race and ethnicity according to the OMB standards. The following data pertain to those states:
Blacks — In 2015, 42.2% of reported gonorrhea cases with known race and ethnicity occurred among Blacks (excluding cases with missing information on race or ethnicity, and cases whose reported race or ethnicity was Other) (Table 22A). The rate of gonorrhea among Blacks
71STD Surveillance 2015 Special Focus Profiles: STDs in Racial and Ethnic Minorities
in 2015 was 424.9 cases per 100,000 population, which was 9.6 times the rate among Whites (44.2 cases per 100,000 population) (Table 22B). Although the calculated rate ratio for 2015 differs when considering only the 45 jurisdictions that submitted data in race and ethnic categories according to the OMB standards for each year during 2011–2015, this disparity has decreased slightly in recent years (Figure Q). In 2015, this disparity was similar for Black men (9.6 times the rate among White men) and Black women (9.7 times the rate among White women) (Figure R, Table 22B). As in previous years, the disparity in gonorrhea rates for Blacks in 2015 was larger in the Midwest and Northeast than in the West or the South (Figure S).
Considering all racial/ethnic and age categories, rates of gonorrhea were highest for Blacks aged 20–24, 15–19, and 25–29 years in 2015 (Table 22B). Black women aged 20–24 years had a gonorrhea rate of 1,760.5 cases per 100,000 females, which was 9.0 times the rate among White women in the same age group (195.8 cases per 100,000 females). Black women aged 15–19 years had a gonorrhea rate of 1,547.3 cases per 100,000 females, which was 11.3 times the rate among White women in the same age group (136.4 cases per 100,000 females). Black men aged 20–24 years had a gonorrhea rate of 1,681.5 cases per 100,000 males, which was 9.5 times the rate among White men in the same age group (176.1 cases per 100,000 males). Black men aged 25–29 years had a gonorrhea rate of 1,415.0 cases per 100,000 males, which was 8.2 times the rate among White men in the same age group (173.6 cases per 100,000 males).
American Indians/Alaska Natives — In 2015, the gonorrhea rate among American Indians/Alaska Natives was 192.8 cases per 100,000 population, which was 4.4 times the rate among Whites (Table 22B). The disparity between gonorrhea rates for American Indians/Alaska Natives and Whites was larger for American Indian/Alaska Native women (6.1 times the rate among White women) than for American Indian/Alaska Native men (3.0 times the rate among White men) (Figure R, Table 22B). The disparity in gonorrhea rates for American Indians/Alaska Natives in 2015 was larger in the Midwest than in the West, Northeast, and South (Figure S).
Native Hawaiians/Other Pacific Islanders — In 2015, the gonorrhea rate among Native Hawaiians/Other Pacific Islanders was 123.0 cases per 100,000 population, which was 2.8 times the rate among Whites (Table 22B). The disparity between gonorrhea rates for Native Hawaiians/Other Pacific Islanders and Whites was the same for Native Hawaiian/Other Pacific Islander women (2.8 times the rate among White women) and Native Hawaiian/Other Pacific Islander men (2.8 times the rate among White men) (Figure R, Table 22B). The disparity in gonorrhea rates for Native Hawaiians/Other Pacific Islanders in 2015 was
lower in the West than in the Midwest, Northeast, and South (Figure S).
Hispanics — In 2015, the gonorrhea rate among Hispanics was 80.5 cases per 100,000 population, which was 1.8 times the rate among Whites (Table 22B). This disparity was similar for Hispanic women (1.7 times the rate among White women) and Hispanic men (1.9 times the rate among White men) (Figure R, Table 22B). The disparity in gonorrhea rates for Hispanics in 2015 was higher in the Northeast than in the Midwest, South, and West (Figure S).
Asians — In 2015, the gonorrhea rate among Asians was 22.9 cases per 100,000 population, which was 0.5 times the rate among Whites (Table 22B). This difference is larger for Asian women than for Asian men (Figure R, Table 22B). In 2015, rates among Asians were lower than rates among Whites in all four regions of the United States (Figure S).
Primary and Secondary SyphilisDuring 2011–2015, 45 states submitted race and Hispanic ethnicity data for syphilis for each year according to the OMB standards. In these states, rates of reported primary and secondary (P&S) syphilis cases increased 130.8% among Asians (1.3 to 3.0 cases per 100,000 population), 102.3% among Hispanics (4.4 to 8.9 cases per 100,000 population), 90.3% among American Indians/Alaska Natives (3.1 to 5.9 cases per 100,000 population), 66.7% among Whites (2.4 to 4.0 cases per 100,000 population), 51.4% among Native Hawaiians/Other Pacific Islanders (7.0 to 10.6 cases per 100,000 population), and 31.8% among Blacks (15.7 to 20.7 cases per 100,000 population) (Figure 39).
In 2015, 49 states submitted syphilis data by race and ethnicity according to the OMB standards. The following data pertain to those states:
Blacks — In 2015, 37.6% of reported P&S syphilis cases with known race/ethnicity occurred among Blacks (excluding cases with missing information on race or ethnicity, and cases whose reported race or ethnicity was Other) (Table 35A). The P&S syphilis rate among Blacks in 2015 was 21.4 cases per 100,000 population, which was 5.2 times the rate among Whites (4.1 cases per 100,000 population) (Table 35B). The disparity was higher for Black women (8.8 times the rate among White women) than for Black men (5.1 times the rate among White men) (Figure T, Table 35B).
Considering all race/ethnicity, sex, and age categories, P&S syphilis rates were highest among Black men aged 20–24 years and 25–29 years in 2015 (Table 35B). Black men aged 20–24 years had a P&S syphilis rate of 110.1 cases per 100,000 males. This rate was 7.6 times the rate
72 STD Surveillance 2015Special Focus Profiles: STDs in Racial and Ethnic Minorities
among White men in the same age group (14.5 cases per 100,000 males). Black men aged 25–29 years had a P&S syphilis rate of 133.2 cases per 100,000 males, which was 6.9 times the rate among White men in the same age group (19.4 cases per 100,000 males).
Native Hawaiians/Other Pacific Islanders — In 2015, the P&S syphilis rate among Native Hawaiians/Other Pacific Islanders was 10.4 cases per 100,000 population, which was 2.5 times the rate among Whites (Table 35B). This disparity was similar for Native Hawaiian/Other Pacific Islander women (2.7 times the rate among White women) and Native Hawaiian/Other Pacific Islander men (2.5 times the rate among White men).
Hispanics — In 2015, the P&S syphilis rate among Hispanics was 9.1 cases per 100,000 population, which was 2.2 times the rate among Whites (Table 35B). This disparity was similar for Hispanic women (2.3 times the rate among White women) and Hispanic men (2.2 times the rate among White men).
American Indians/Alaska Natives — In 2015, the P&S syphilis rate among American Indians/Alaska Natives was 5.6 cases per 100,000 population, 1.4 times the rate among Whites (Table 35B). This disparity was larger for American Indian/Alaska Native women (3.5 times the rate among White women) than for American Indian/Alaska Native men (1.2 times the rate among White men).
Asians — In 2015, the P&S syphilis rate among Asians was 3.0 cases per 100,000 population, which was 0.7 times the rate among Whites (Table 35B). This difference was larger for Asian women (0.5 times the rate among White women) than for Asian men (0.8 times the rate among White men).
Congenital SyphilisRace/ethnicity for cases of congenital syphilis is based on the mother’s race/ethnicity. During 2014–2015, rates of reported congenital syphilis cases increased 25.0% among Hispanics and 18.9% among Whites (Figure U, Table 42). However, rates decreased 19.5% among American Indians/Alaska Natives, 15.7% among Asians/Pacific Islanders, and 8.8% among Blacks.
In 2015, 44.9% of congenital syphilis cases with known race/ethnicity occurred among Blacks (excluding cases with missing information on race or ethnicity, and cases whose reported race or ethnicity was ‘Other’) (Table 42). The rate of congenital syphilis among Blacks in 2015 was 35.2 cases per 100,000 live births, which was 8.0 times the rate among Whites (4.4 cases per 100,000 live births). The rate of congenital syphilis was 15.5 cases per 100,000 live births among Hispanics (3.5 times the rate among Whites), 10.3 cases per 100,000 live births among American
Indians/Alaska Natives (2.3 times the rate among Whites), and 5.9 cases per 100,000 live births among Asians/Pacific Islanders (1.3 times the rate among Whites).
1 Newman LM, Berman SM. Epidemiology of STD Disparities in African American Communities. Sex Transm Dis. 2008;35(12):S4- S12.
2 Hogben M, Leichliter JS. Social determinants and sexually transmitted disease disparities. Sex Transm Dis. 2008;35(12 Suppl):S13-8.
3 DeNavas-Walt, Carmen and Bernadette D. Proctor, U.S. Census bureau, Current Population Reports, P60-252, Income and Poverty in the United States: 2014, U. S. Government Printing Office, Washington, DC, 2015.
4 Harling G, Subramanian SV, Barnighausen T, et al. Socioeconomic disparities in sexually transmitted infections among young adults in the United States: Examining the interaction between Income and race/ethnicity. Sex Transm Dis. 2013;40(7):575-581.
5 Centers for Disease Control and Prevention. CDC Health Disparities and Inequalities Report - United States 2013 MMWR Morb Mortal Wkly. Rep. 2013;62(Suppl 3).
6 Institute of Medicine. The Hidden Epidemic: Confronting Sexually Transmitted Diseases. Washington, DC: National Academy Press; 1997.
7 Sommers BD, Baicker K, Epstein AM. Mortality and Access to Care among Adults after State Medicaid Expansions. N Engl J Med 2012; 367:1025-1034 September 13, 2012 DOI: 10.1056/NEJMsa1202099
8 Satterwhite CL, Torrone E, Meites E, et al. Sexually transmitted infections among US women and men: prevalence and incidence estimates, 2008. Sex Transm Dis 2013;40(3):187–93.
9 Frerich EA, Garcia CM, Long SK, Lechner KE, Lust K, Eisenberg ME. Health care reform and young adults’ access to sexual health care: an exploration of potential confidentiality implications of the affordable care act. Am J Public Health. 2012 Oct;102(10):1818-21. doi: 10.2105/AJPH.2012.300857. Epub 2012 Aug 16.
10 Smith, Jessica C and Carla Medalia, U.S. Census Bureau, Current Population Reports, P60-253, Health Insurance Coverage in the United States: 2014, U.S. Government Printing Office, Washington, DC, 2015.
11 Cramer R, Leichliter JS, Gift TL. Are safety net sexually transmitted disease clinical and preventive services still needed in a changing health care system? Sex Transm Dis. 2014 Oct;41(10):628-30. doi: 10.1097/OLQ.0000000000000187.
12 Pérez-Escamilla R. Health care access among Latinos: Implications for social and health care reform. J Hispanic High Educ. 2010:9(1):43-60.
13 Garcia Mosqueira A, Hua LM, Sommers BD. Racial Differences in Awareness of the Affordable Care Act and Application Assistance Among Low-Income Adults in Three Southern States. Inquiry. 2015 Oct 8;52. pii: 0046958015609607. doi: 10.1177/0046958015609607. Print
14 Berk ML, Schur CL. The effect of fear on access to care among undocumented Latino immigrants. J Immigr Health. 2001;3(3):151-156.
15 Institute of Medicine. Unequal Treatment: Confronting Racial and Ethnic Disparities in Health Care. Washington, DC: National Academies Press; 2002.
16 Datta SD, Sternberg M, Johnson RE, et al. Gonorrhea and chlamydia in the United States among persons 14 to 39 years of age, 1999 to 2002. Ann Intern Med. 2007;147(2):89-96.
17 Miller WC, Ford CA, Morris M, et al. Prevalence of chlamydial and gonococcal infections among young adults in the United States. JAMA. 2004;291(18):2229-36.
18 Office of Management and Budget. Provisional guidance on the implementation of the 1997 standards for federal data on race and ethnicity. 1999. [Accessed July 29, 2013]. Available at: https://www.whitehouse.gov/omb/fedreg_1997standards.
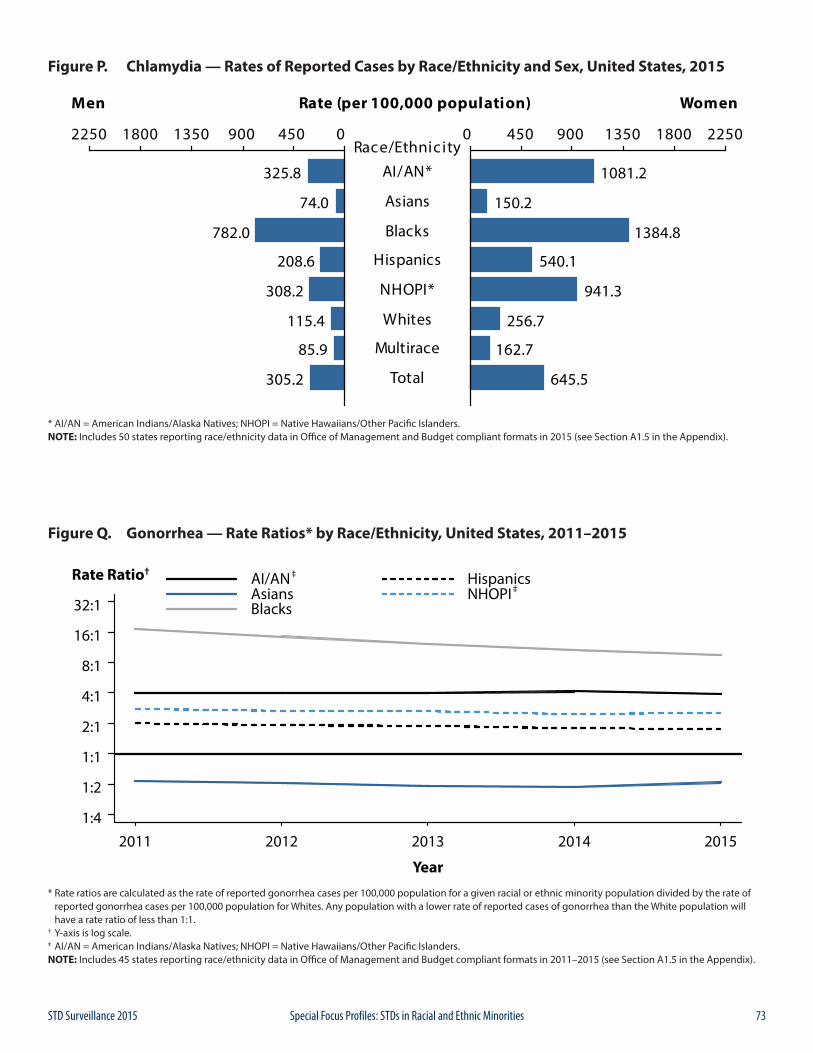
73STD Surveillance 2015 Special Focus Profiles: STDs in Racial and Ethnic Minorities
Figure P. Chlamydia — Rates of Reported Cases by Race/Ethnicity and Sex, United States, 2015
* AI/AN = American Indians/Alaska Natives; NHOPI = Native Hawaiians/Other Pacific Islanders.NOTE: Includes 50 states reporting race/ethnicity data in Office of Management and Budget compliant formats in 2015 (see Section A1.5 in the Appendix).
1:4
1:2
1:1
2:1
4:1
8:1
16:1
32:1
Year
2011 2012 2013 2014 2015
Rate Ratio† ‡
‡AI/ANAsiansBlacks
HispanicsNHOPI
Figure Q. Gonorrhea — Rate Ratios* by Race/Ethnicity, United States, 2011–2015
* Rate ratios are calculated as the rate of reported gonorrhea cases per 100,000 population for a given racial or ethnic minority population divided by the rate of reported gonorrhea cases per 100,000 population for Whites. Any population with a lower rate of reported cases of gonorrhea than the White population will have a rate ratio of less than 1:1.† Y-axis is log scale.‡ AI/AN = American Indians/Alaska Natives; NHOPI = Native Hawaiians/Other Pacific Islanders.NOTE: Includes 45 states reporting race/ethnicity data in Office of Management and Budget compliant formats in 2011–2015 (see Section A1.5 in the Appendix).
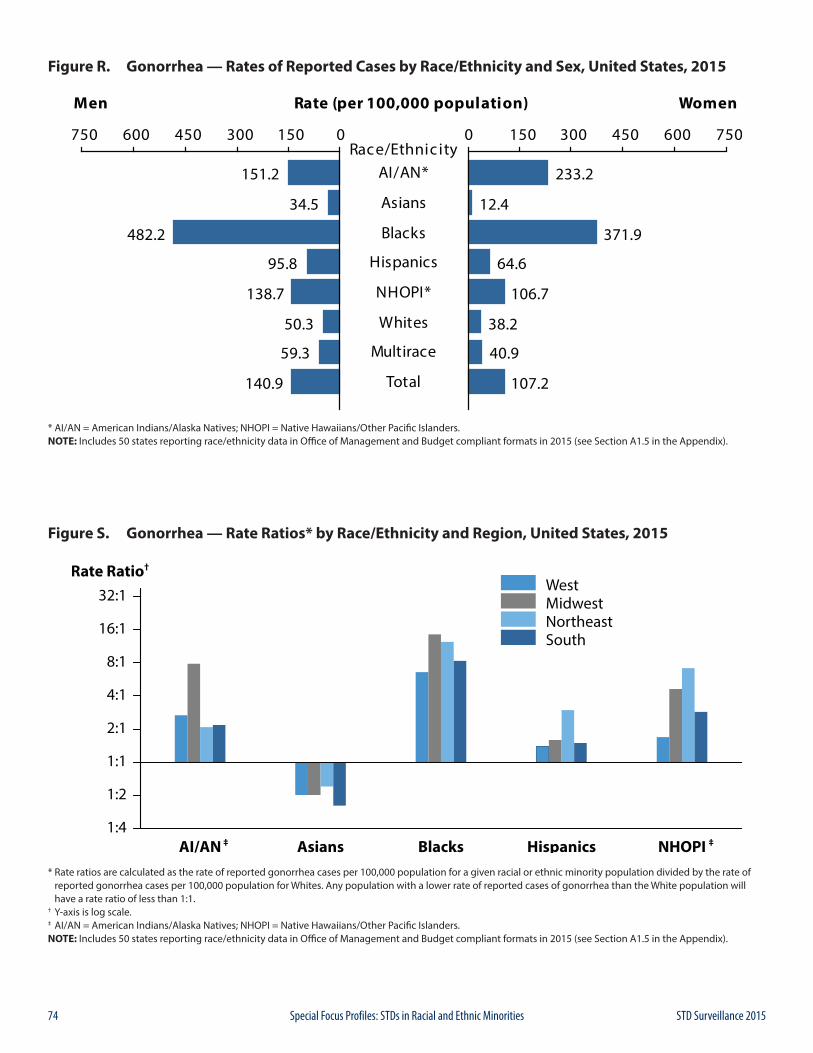
74 STD Surveillance 2015Special Focus Profiles: STDs in Racial and Ethnic Minorities
Figure R. Gonorrhea — Rates of Reported Cases by Race/Ethnicity and Sex, United States, 2015
* AI/AN = American Indians/Alaska Natives; NHOPI = Native Hawaiians/Other Pacific Islanders.NOTE: Includes 50 states reporting race/ethnicity data in Office of Management and Budget compliant formats in 2015 (see Section A1.5 in the Appendix).
Figure S. Gonorrhea — Rate Ratios* by Race/Ethnicity and Region, United States, 2015
* Rate ratios are calculated as the rate of reported gonorrhea cases per 100,000 population for a given racial or ethnic minority population divided by the rate of reported gonorrhea cases per 100,000 population for Whites. Any population with a lower rate of reported cases of gonorrhea than the White population will have a rate ratio of less than 1:1.† Y-axis is log scale.‡ AI/AN = American Indians/Alaska Natives; NHOPI = Native Hawaiians/Other Pacific Islanders.NOTE: Includes 50 states reporting race/ethnicity data in Office of Management and Budget compliant formats in 2015 (see Section A1.5 in the Appendix).
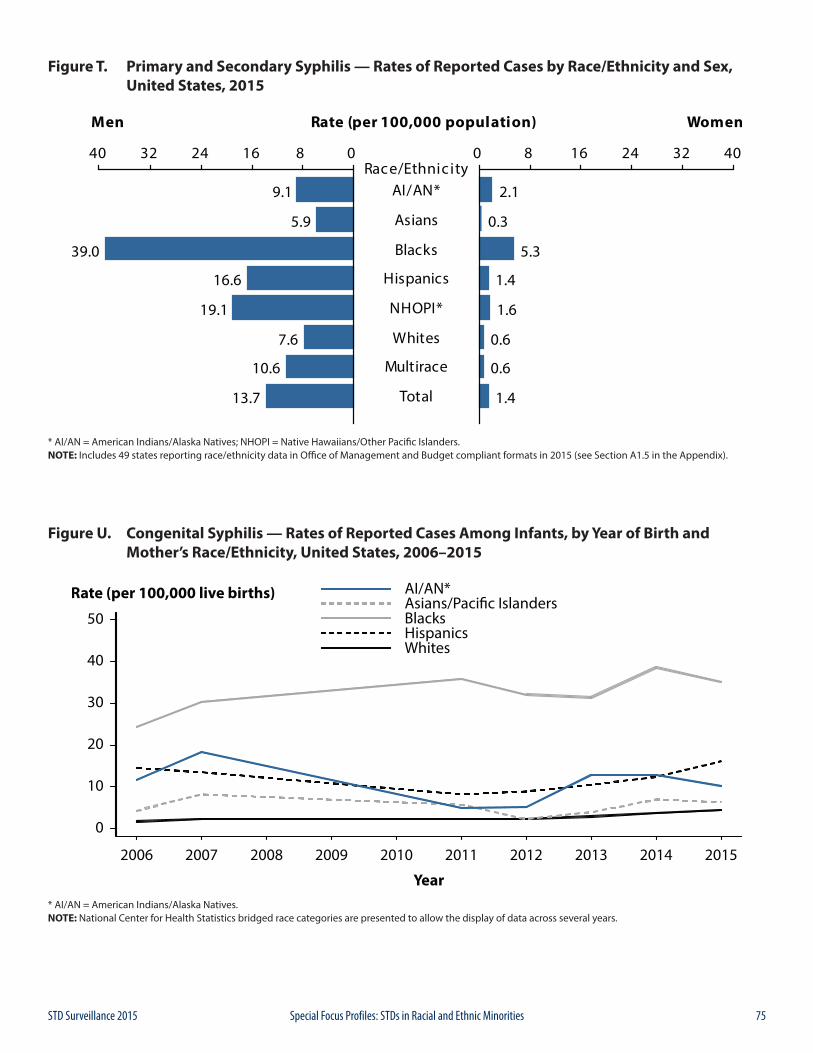
75STD Surveillance 2015 Special Focus Profiles: STDs in Racial and Ethnic Minorities
Figure T. Primary and Secondary Syphilis — Rates of Reported Cases by Race/Ethnicity and Sex, United States, 2015
* AI/AN = American Indians/Alaska Natives; NHOPI = Native Hawaiians/Other Pacific Islanders.NOTE: Includes 49 states reporting race/ethnicity data in Office of Management and Budget compliant formats in 2015 (see Section A1.5 in the Appendix).
Figure U. Congenital Syphilis — Rates of Reported Cases Among Infants, by Year of Birth and Mother’s Race/Ethnicity, United States, 2006–2015
* AI/AN = American Indians/Alaska Natives.NOTE: National Center for Health Statistics bridged race categories are presented to allow the display of data across several years.
76 STD Surveillance 2015Special Focus Profiles: STDs in Men Who Have Sex With Men
Public Health Impact Gay, bisexual, and other men who have sex with men (collectively referred to as MSM) are at increased risk for STDs, including antimicrobial resistant gonorrhea, when compared to women and exclusively heterosexual men.1–4 Because STDs, and the behaviors associated with acquiring them, increase the likelihood of acquiring and transmitting HIV infection, STD incidence among MSM may also be an indicator of higher risk for subsequent HIV infection.5, 6
Individual-level risk behaviors, such as number of lifetime sex partners, rate of partner exchange and frequency of unprotected sex, may contribute to disparities observed in the sexual health of MSM. However, population-level factors such as limited or overlapping social and sexual networks are also associated with higher rates of STDs, including HIV among MSM.7
MSM of lower economic status may be particularly vulnerable to poor health outcomes, especially if they belong to racial and ethnic minority populations.8, 9 Among Black MSM, factors such as community isolation and limited social support may drive sexual risk-taking. Similarly, for Hispanic MSM, the relationship between individual experiences of oppression (e.g., social discrimination and financial hardship) and risk for sexually transmitted infections in the United States has also been documented.10
With the exception of reported syphilis cases, most nationally notifiable STD surveillance data do not include information on sexual behaviors; therefore, trends in STDs among MSM in the United States are based on findings from sentinel and enhanced surveillance systems. Testing strategies are also evolving to include more extragenital STD screening, which may increase detection of asymptomatic infections. Until recently, testing for gonorrhea and chlamydia in MSM largely focused on detecting urethral infections, which are more likely to be symptomatic than pharyngeal or rectal infections.11
Data from the STD Surveillance Network (SSuN), a sentinel and enhanced surveillance project established in 2005, are presented in this section to provide supplemental information on STDs in MSM. SSuN is an ongoing collaboration of state, county and city health departments collecting enhanced provider and patient-based information among a random sample of reported gonorrhea cases, as well as clinical and behavioral information among all patients attending STD clinics in collaborating jurisdictions.12 Additional information about SSuN can be found in Section A2.2 of the Appendix.
Incidence of Gonorrhea among MSM, STD Surveillance Network, 2010–2013The proportion of all diagnosed and reported gonorrhea cases attributable to MSM was estimated based on patient interviews conducted among a random sample of cases reported to collaborating health departments between January 2010 and June 2013. Estimates of the size of the MSM population in each area were developed to calculate the incidence of gonorrhea among all MSM. The estimated incidence of gonorrhea among MSM in SSuN sites increased from 1,169.7 cases per 100,000 MSM in 2010 to 1,474.4 cases per 100,000 MSM in 2013.13 The estimated rate-ratio of MSM to female and MSM to heterosexual males during the study period ranged from 10.7 to 13.9 demonstrating a substantial and increasing inequality in the burden of disease between MSM and heterosexuals.13
Prevalence of STDs among MSM Who Visit STD Clinics, STD Surveillance Network, 2015Data for 2015 were obtained from 30 STD clinics in ten SSuN jurisdictions. For data reported in this section, MSM were defined as men who either reported having one or more male sex partners or who self-reported as gay/homosexual or bisexual. Men who have sex with women (MSW) were defined as men who reported having sex with women only or who did not report the sex of their sex partner, but reported that they considered themselves straight/heterosexual.
Gonorrhea and Chlamydial InfectionIn 2015, the proportion of MSM who tested positive for gonorrhea and chlamydia at STD clinics varied by SSuN jurisdiction (Figure W). Among jurisdictions providing sexual behavior data, a larger proportion of MSM who visited STD clinics tested positive for gonorrhea than tested positive for chlamydia (except Massachusetts, Multnomah County, and Philadelphia).
Across the participating STD clinics, 26,878 MSM were tested for gonorrhea and 26,694 MSM were tested for chlamydia. The median site-specific gonorrhea prevalence among those tested was 19.0% (range by site: 10.9%–22.7%). The median site-specific chlamydia prevalence among those tested was 16.0% (range by site: 11.8%–17.6%). For this report, a person who tested positive for gonorrhea or chlamydia at any anatomic site more
STDs in Men Who Have Sex With Men
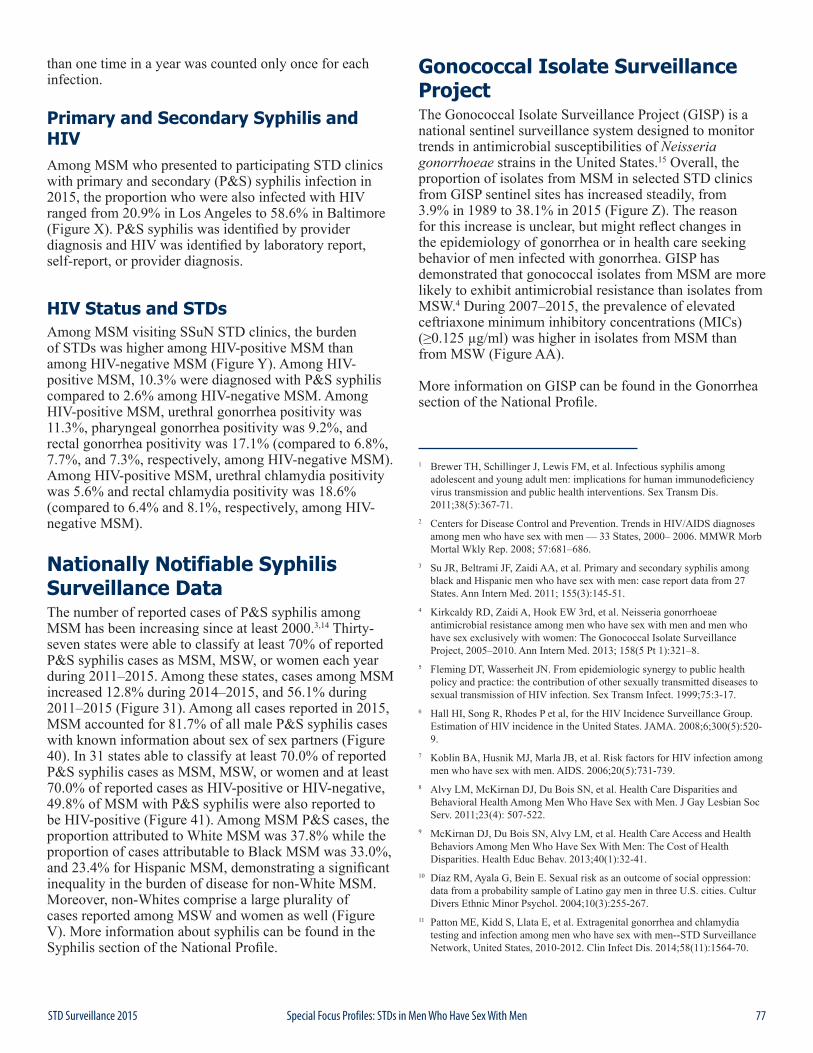
77STD Surveillance 2015 Special Focus Profiles: STDs in Men Who Have Sex With Men
than one time in a year was counted only once for each infection.
Primary and Secondary Syphilis and HIV Among MSM who presented to participating STD clinics with primary and secondary (P&S) syphilis infection in 2015, the proportion who were also infected with HIV ranged from 20.9% in Los Angeles to 58.6% in Baltimore (Figure X). P&S syphilis was identified by provider diagnosis and HIV was identified by laboratory report, self-report, or provider diagnosis.
HIV Status and STDsAmong MSM visiting SSuN STD clinics, the burden of STDs was higher among HIV-positive MSM than among HIV-negative MSM (Figure Y). Among HIV-positive MSM, 10.3% were diagnosed with P&S syphilis compared to 2.6% among HIV-negative MSM. Among HIV-positive MSM, urethral gonorrhea positivity was 11.3%, pharyngeal gonorrhea positivity was 9.2%, and rectal gonorrhea positivity was 17.1% (compared to 6.8%, 7.7%, and 7.3%, respectively, among HIV-negative MSM). Among HIV-positive MSM, urethral chlamydia positivity was 5.6% and rectal chlamydia positivity was 18.6% (compared to 6.4% and 8.1%, respectively, among HIV-negative MSM).
Nationally Notifiable Syphilis Surveillance DataThe number of reported cases of P&S syphilis among MSM has been increasing since at least 2000.3,14 Thirty-seven states were able to classify at least 70% of reported P&S syphilis cases as MSM, MSW, or women each year during 2011–2015. Among these states, cases among MSM increased 12.8% during 2014–2015, and 56.1% during 2011–2015 (Figure 31). Among all cases reported in 2015, MSM accounted for 81.7% of all male P&S syphilis cases with known information about sex of sex partners (Figure 40). In 31 states able to classify at least 70.0% of reported P&S syphilis cases as MSM, MSW, or women and at least 70.0% of reported cases as HIV-positive or HIV-negative, 49.8% of MSM with P&S syphilis were also reported to be HIV-positive (Figure 41). Among MSM P&S cases, the proportion attributed to White MSM was 37.8% while the proportion of cases attributable to Black MSM was 33.0%, and 23.4% for Hispanic MSM, demonstrating a significant inequality in the burden of disease for non-White MSM. Moreover, non-Whites comprise a large plurality of cases reported among MSW and women as well (Figure V). More information about syphilis can be found in the Syphilis section of the National Profile.
Gonococcal Isolate Surveillance ProjectThe Gonococcal Isolate Surveillance Project (GISP) is a national sentinel surveillance system designed to monitor trends in antimicrobial susceptibilities of Neisseria gonorrhoeae strains in the United States.15 Overall, the proportion of isolates from MSM in selected STD clinics from GISP sentinel sites has increased steadily, from 3.9% in 1989 to 38.1% in 2015 (Figure Z). The reason for this increase is unclear, but might reflect changes in the epidemiology of gonorrhea or in health care seeking behavior of men infected with gonorrhea. GISP has demonstrated that gonococcal isolates from MSM are more likely to exhibit antimicrobial resistance than isolates from MSW.4 During 2007–2015, the prevalence of elevated ceftriaxone minimum inhibitory concentrations (MICs) (≥0.125 µg/ml) was higher in isolates from MSM than from MSW (Figure AA).
More information on GISP can be found in the Gonorrhea section of the National Profile.
1 Brewer TH, Schillinger J, Lewis FM, et al. Infectious syphilis among adolescent and young adult men: implications for human immunodeficiency virus transmission and public health interventions. Sex Transm Dis. 2011;38(5):367-71.
2 Centers for Disease Control and Prevention. Trends in HIV/AIDS diagnoses among men who have sex with men — 33 States, 2000– 2006. MMWR Morb Mortal Wkly Rep. 2008; 57:681–686.
3 Su JR, Beltrami JF, Zaidi AA, et al. Primary and secondary syphilis among black and Hispanic men who have sex with men: case report data from 27 States. Ann Intern Med. 2011; 155(3):145-51.
4 Kirkcaldy RD, Zaidi A, Hook EW 3rd, et al. Neisseria gonorrhoeae antimicrobial resistance among men who have sex with men and men who have sex exclusively with women: The Gonococcal Isolate Surveillance Project, 2005–2010. Ann Intern Med. 2013; 158(5 Pt 1):321–8.
5 Fleming DT, Wasserheit JN. From epidemiologic synergy to public health policy and practice: the contribution of other sexually transmitted diseases to sexual transmission of HIV infection. Sex Transm Infect. 1999;75:3-17.
6 Hall HI, Song R, Rhodes P et al, for the HIV Incidence Surveillance Group. Estimation of HIV incidence in the United States. JAMA. 2008;6;300(5):520-9.
7 Koblin BA, Husnik MJ, Marla JB, et al. Risk factors for HIV infection among men who have sex with men. AIDS. 2006;20(5):731-739.
8 Alvy LM, McKirnan DJ, Du Bois SN, et al. Health Care Disparities and Behavioral Health Among Men Who Have Sex with Men. J Gay Lesbian Soc Serv. 2011;23(4): 507-522.
9 McKirnan DJ, Du Bois SN, Alvy LM, et al. Health Care Access and Health Behaviors Among Men Who Have Sex With Men: The Cost of Health Disparities. Health Educ Behav. 2013;40(1):32-41.
10 Díaz RM, Ayala G, Bein E. Sexual risk as an outcome of social oppression: data from a probability sample of Latino gay men in three U.S. cities. Cultur Divers Ethnic Minor Psychol. 2004;10(3):255-267.
11 Patton ME, Kidd S, Llata E, et al. Extragenital gonorrhea and chlamydia testing and infection among men who have sex with men--STD Surveillance Network, United States, 2010-2012. Clin Infect Dis. 2014;58(11):1564-70.
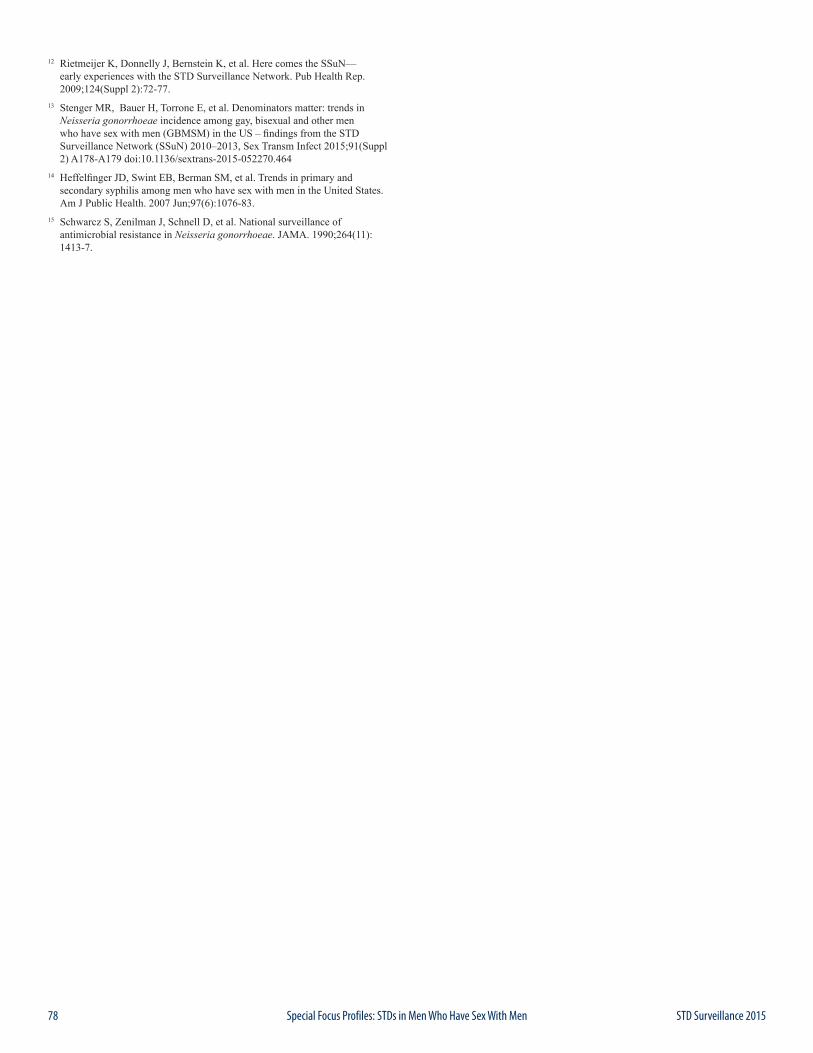
78 STD Surveillance 2015Special Focus Profiles: STDs in Men Who Have Sex With Men
12 Rietmeijer K, Donnelly J, Bernstein K, et al. Here comes the SSuN—early experiences with the STD Surveillance Network. Pub Health Rep. 2009;124(Suppl 2):72-77.
13 Stenger MR, Bauer H, Torrone E, et al. Denominators matter: trends in Neisseria gonorrhoeae incidence among gay, bisexual and other men who have sex with men (GBMSM) in the US – findings from the STD Surveillance Network (SSuN) 2010–2013, Sex Transm Infect 2015;91(Suppl 2) A178-A179 doi:10.1136/sextrans-2015-052270.464
14 Heffelfinger JD, Swint EB, Berman SM, et al. Trends in primary and secondary syphilis among men who have sex with men in the United States. Am J Public Health. 2007 Jun;97(6):1076-83.
15 Schwarcz S, Zenilman J, Schnell D, et al. National surveillance of antimicrobial resistance in Neisseria gonorrhoeae. JAMA. 1990;264(11): 1413-7.
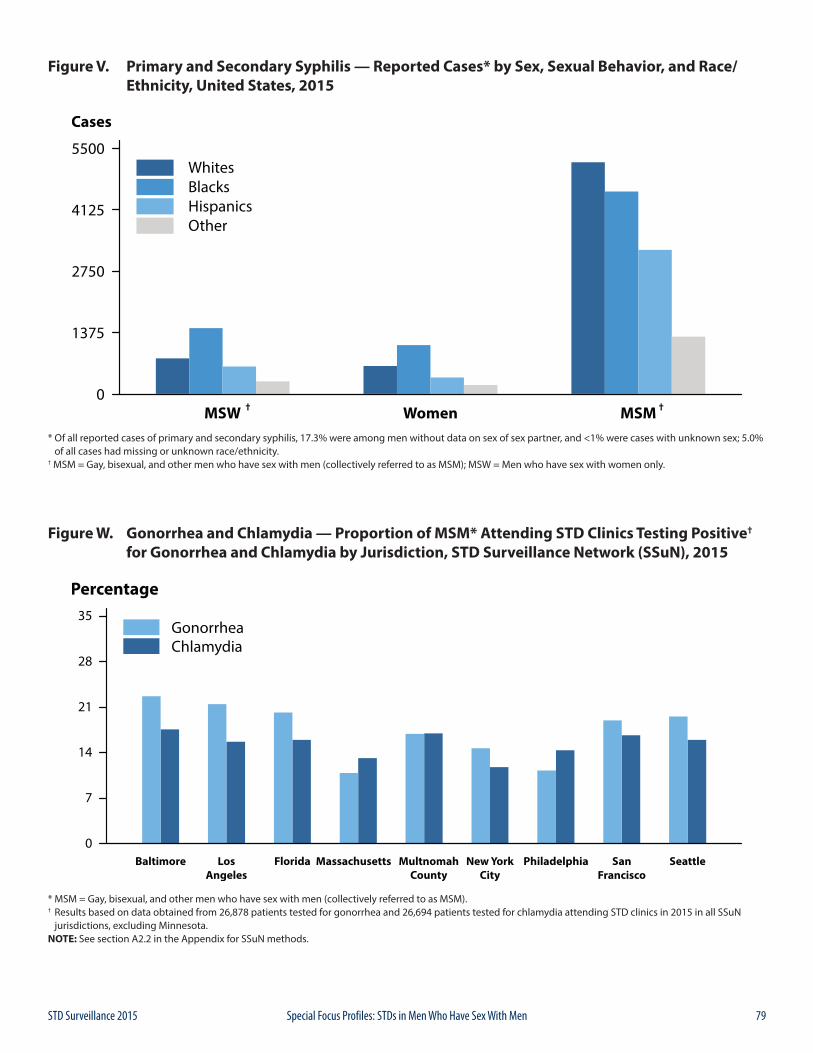
79STD Surveillance 2015 Special Focus Profiles: STDs in Men Who Have Sex With Men
Figure V. Primary and Secondary Syphilis — Reported Cases* by Sex, Sexual Behavior, and Race/ Ethnicity, United States, 2015
* Of all reported cases of primary and secondary syphilis, 17.3% were among men without data on sex of sex partner, and <1% were cases with unknown sex; 5.0% of all cases had missing or unknown race/ethnicity.† MSM = Gay, bisexual, and other men who have sex with men (collectively referred to as MSM); MSW = Men who have sex with women only.
Figure W. Gonorrhea and Chlamydia — Proportion of MSM* Attending STD Clinics Testing Positive† for Gonorrhea and Chlamydia by Jurisdiction, STD Surveillance Network (SSuN), 2015
* MSM = Gay, bisexual, and other men who have sex with men (collectively referred to as MSM).† Results based on data obtained from 26,878 patients tested for gonorrhea and 26,694 patients tested for chlamydia attending STD clinics in 2015 in all SSuN jurisdictions, excluding Minnesota.NOTE: See section A2.2 in the Appendix for SSuN methods.
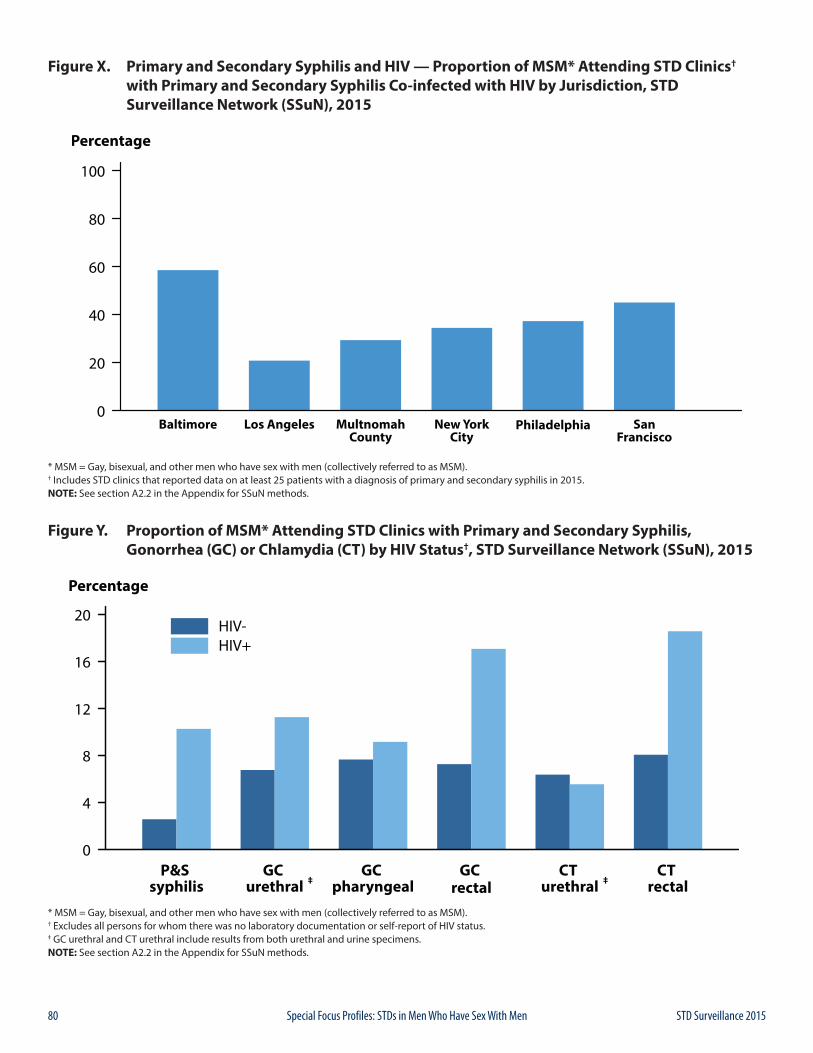
80 STD Surveillance 2015Special Focus Profiles: STDs in Men Who Have Sex With Men
Figure X. Primary and Secondary Syphilis and HIV — Proportion of MSM* Attending STD Clinics† with Primary and Secondary Syphilis Co-infected with HIV by Jurisdiction, STD Surveillance Network (SSuN), 2015
* MSM = Gay, bisexual, and other men who have sex with men (collectively referred to as MSM).† Includes STD clinics that reported data on at least 25 patients with a diagnosis of primary and secondary syphilis in 2015. NOTE: See section A2.2 in the Appendix for SSuN methods.
Figure Y. Proportion of MSM* Attending STD Clinics with Primary and Secondary Syphilis, Gonorrhea (GC) or Chlamydia (CT) by HIV Status†, STD Surveillance Network (SSuN), 2015
* MSM = Gay, bisexual, and other men who have sex with men (collectively referred to as MSM).† Excludes all persons for whom there was no laboratory documentation or self-report of HIV status.‡ GC urethral and CT urethral include results from both urethral and urine specimens.NOTE: See section A2.2 in the Appendix for SSuN methods.
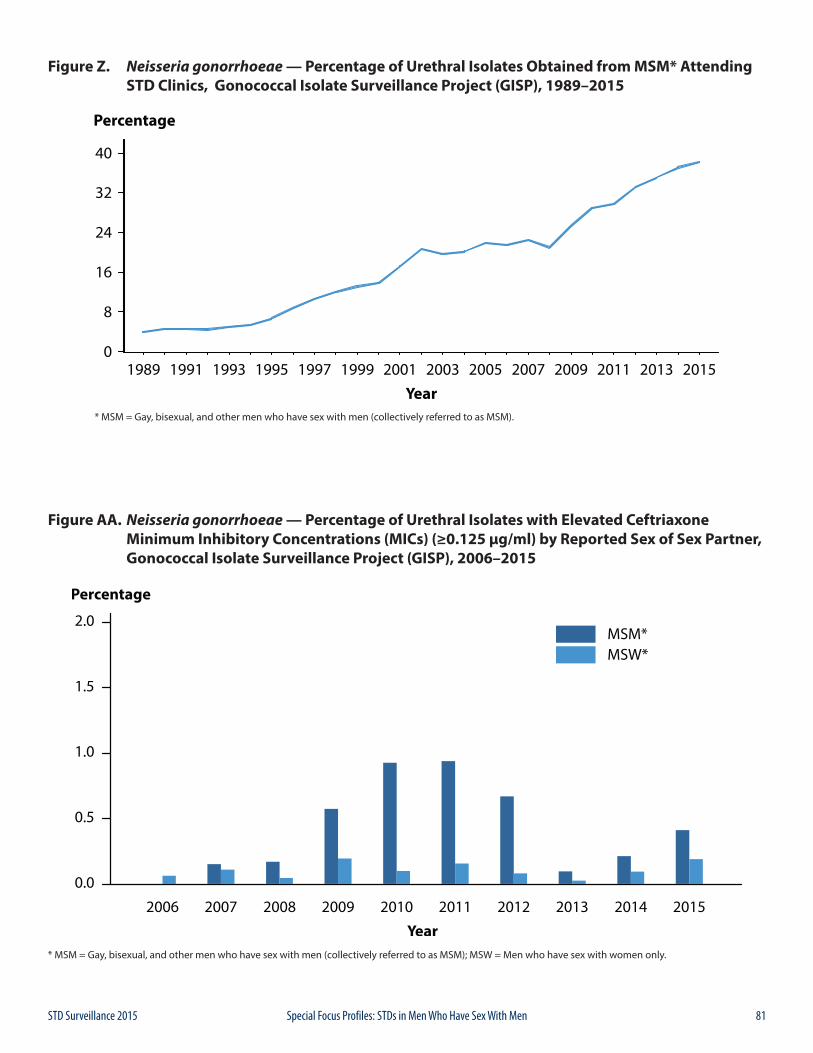
81STD Surveillance 2015 Special Focus Profiles: STDs in Men Who Have Sex With Men
Figure Z. Neisseria gonorrhoeae — Percentage of Urethral Isolates Obtained from MSM* Attending STD Clinics, Gonococcal Isolate Surveillance Project (GISP), 1989–2015
* MSM = Gay, bisexual, and other men who have sex with men (collectively referred to as MSM).
Figure AA. Neisseria gonorrhoeae — Percentage of Urethral Isolates with Elevated Ceftriaxone Minimum Inhibitory Concentrations (MICs) (≥0.125 μg/ml) by Reported Sex of Sex Partner, Gonococcal Isolate Surveillance Project (GISP), 2006–2015
* MSM = Gay, bisexual, and other men who have sex with men (collectively referred to as MSM); MSW = Men who have sex with women only.

82 STD Surveillance 2015Special Focus Profiles: STDs in Men Who Have Sex With Men

83STD Surveillance 2015
TAB
LES

84 STD Surveillance 2015
TAB
LES
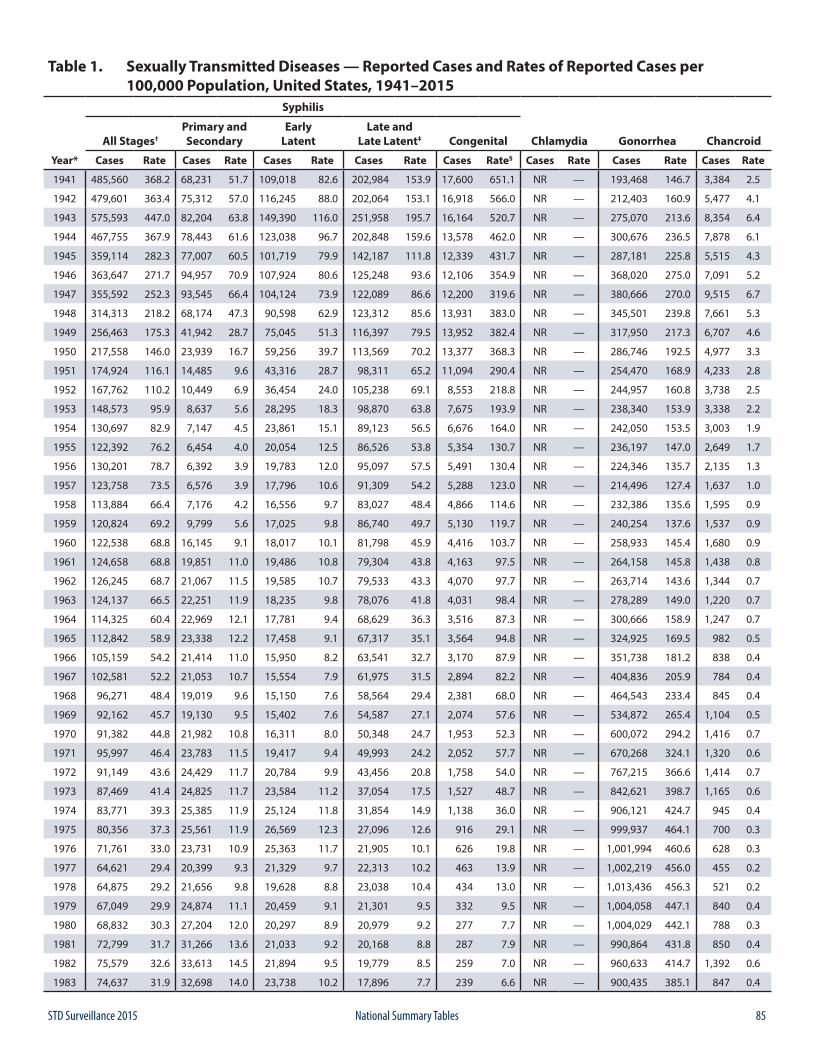
85STD Surveillance 2015 National Summary Tables
Table 1. Sexually Transmitted Diseases — Reported Cases and Rates of Reported Cases per 100,000 Population, United States, 1941–2015
Syphilis
All Stages†Primary andSecondary
EarlyLatent
Late andLate Latent‡ Congenital Chlamydia Gonorrhea Chancroid
Year* Cases Rate Cases Rate Cases Rate Cases Rate Cases Rate§ Cases Rate Cases Rate Cases Rate
1941 485,560 368.2 68,231 51.7 109,018 82.6 202,984 153.9 17,600 651.1 NR — 193,468 146.7 3,384 2.5
1942 479,601 363.4 75,312 57.0 116,245 88.0 202,064 153.1 16,918 566.0 NR — 212,403 160.9 5,477 4.1
1943 575,593 447.0 82,204 63.8 149,390 116.0 251,958 195.7 16,164 520.7 NR — 275,070 213.6 8,354 6.4
1944 467,755 367.9 78,443 61.6 123,038 96.7 202,848 159.6 13,578 462.0 NR — 300,676 236.5 7,878 6.1
1945 359,114 282.3 77,007 60.5 101,719 79.9 142,187 111.8 12,339 431.7 NR — 287,181 225.8 5,515 4.3
1946 363,647 271.7 94,957 70.9 107,924 80.6 125,248 93.6 12,106 354.9 NR — 368,020 275.0 7,091 5.2
1947 355,592 252.3 93,545 66.4 104,124 73.9 122,089 86.6 12,200 319.6 NR — 380,666 270.0 9,515 6.7
1948 314,313 218.2 68,174 47.3 90,598 62.9 123,312 85.6 13,931 383.0 NR — 345,501 239.8 7,661 5.3
1949 256,463 175.3 41,942 28.7 75,045 51.3 116,397 79.5 13,952 382.4 NR — 317,950 217.3 6,707 4.6
1950 217,558 146.0 23,939 16.7 59,256 39.7 113,569 70.2 13,377 368.3 NR — 286,746 192.5 4,977 3.3
1951 174,924 116.1 14,485 9.6 43,316 28.7 98,311 65.2 11,094 290.4 NR — 254,470 168.9 4,233 2.8
1952 167,762 110.2 10,449 6.9 36,454 24.0 105,238 69.1 8,553 218.8 NR — 244,957 160.8 3,738 2.5
1953 148,573 95.9 8,637 5.6 28,295 18.3 98,870 63.8 7,675 193.9 NR — 238,340 153.9 3,338 2.2
1954 130,697 82.9 7,147 4.5 23,861 15.1 89,123 56.5 6,676 164.0 NR — 242,050 153.5 3,003 1.9
1955 122,392 76.2 6,454 4.0 20,054 12.5 86,526 53.8 5,354 130.7 NR — 236,197 147.0 2,649 1.7
1956 130,201 78.7 6,392 3.9 19,783 12.0 95,097 57.5 5,491 130.4 NR — 224,346 135.7 2,135 1.3
1957 123,758 73.5 6,576 3.9 17,796 10.6 91,309 54.2 5,288 123.0 NR — 214,496 127.4 1,637 1.0
1958 113,884 66.4 7,176 4.2 16,556 9.7 83,027 48.4 4,866 114.6 NR — 232,386 135.6 1,595 0.9
1959 120,824 69.2 9,799 5.6 17,025 9.8 86,740 49.7 5,130 119.7 NR — 240,254 137.6 1,537 0.9
1960 122,538 68.8 16,145 9.1 18,017 10.1 81,798 45.9 4,416 103.7 NR — 258,933 145.4 1,680 0.9
1961 124,658 68.8 19,851 11.0 19,486 10.8 79,304 43.8 4,163 97.5 NR — 264,158 145.8 1,438 0.8
1962 126,245 68.7 21,067 11.5 19,585 10.7 79,533 43.3 4,070 97.7 NR — 263,714 143.6 1,344 0.7
1963 124,137 66.5 22,251 11.9 18,235 9.8 78,076 41.8 4,031 98.4 NR — 278,289 149.0 1,220 0.7
1964 114,325 60.4 22,969 12.1 17,781 9.4 68,629 36.3 3,516 87.3 NR — 300,666 158.9 1,247 0.7
1965 112,842 58.9 23,338 12.2 17,458 9.1 67,317 35.1 3,564 94.8 NR — 324,925 169.5 982 0.5
1966 105,159 54.2 21,414 11.0 15,950 8.2 63,541 32.7 3,170 87.9 NR — 351,738 181.2 838 0.4
1967 102,581 52.2 21,053 10.7 15,554 7.9 61,975 31.5 2,894 82.2 NR — 404,836 205.9 784 0.4
1968 96,271 48.4 19,019 9.6 15,150 7.6 58,564 29.4 2,381 68.0 NR — 464,543 233.4 845 0.4
1969 92,162 45.7 19,130 9.5 15,402 7.6 54,587 27.1 2,074 57.6 NR — 534,872 265.4 1,104 0.5
1970 91,382 44.8 21,982 10.8 16,311 8.0 50,348 24.7 1,953 52.3 NR — 600,072 294.2 1,416 0.7
1971 95,997 46.4 23,783 11.5 19,417 9.4 49,993 24.2 2,052 57.7 NR — 670,268 324.1 1,320 0.6
1972 91,149 43.6 24,429 11.7 20,784 9.9 43,456 20.8 1,758 54.0 NR — 767,215 366.6 1,414 0.7
1973 87,469 41.4 24,825 11.7 23,584 11.2 37,054 17.5 1,527 48.7 NR — 842,621 398.7 1,165 0.6
1974 83,771 39.3 25,385 11.9 25,124 11.8 31,854 14.9 1,138 36.0 NR — 906,121 424.7 945 0.4
1975 80,356 37.3 25,561 11.9 26,569 12.3 27,096 12.6 916 29.1 NR — 999,937 464.1 700 0.3
1976 71,761 33.0 23,731 10.9 25,363 11.7 21,905 10.1 626 19.8 NR — 1,001,994 460.6 628 0.3
1977 64,621 29.4 20,399 9.3 21,329 9.7 22,313 10.2 463 13.9 NR — 1,002,219 456.0 455 0.2
1978 64,875 29.2 21,656 9.8 19,628 8.8 23,038 10.4 434 13.0 NR — 1,013,436 456.3 521 0.2
1979 67,049 29.9 24,874 11.1 20,459 9.1 21,301 9.5 332 9.5 NR — 1,004,058 447.1 840 0.4
1980 68,832 30.3 27,204 12.0 20,297 8.9 20,979 9.2 277 7.7 NR — 1,004,029 442.1 788 0.3
1981 72,799 31.7 31,266 13.6 21,033 9.2 20,168 8.8 287 7.9 NR — 990,864 431.8 850 0.4
1982 75,579 32.6 33,613 14.5 21,894 9.5 19,779 8.5 259 7.0 NR — 960,633 414.7 1,392 0.6
1983 74,637 31.9 32,698 14.0 23,738 10.2 17,896 7.7 239 6.6 NR — 900,435 385.1 847 0.4
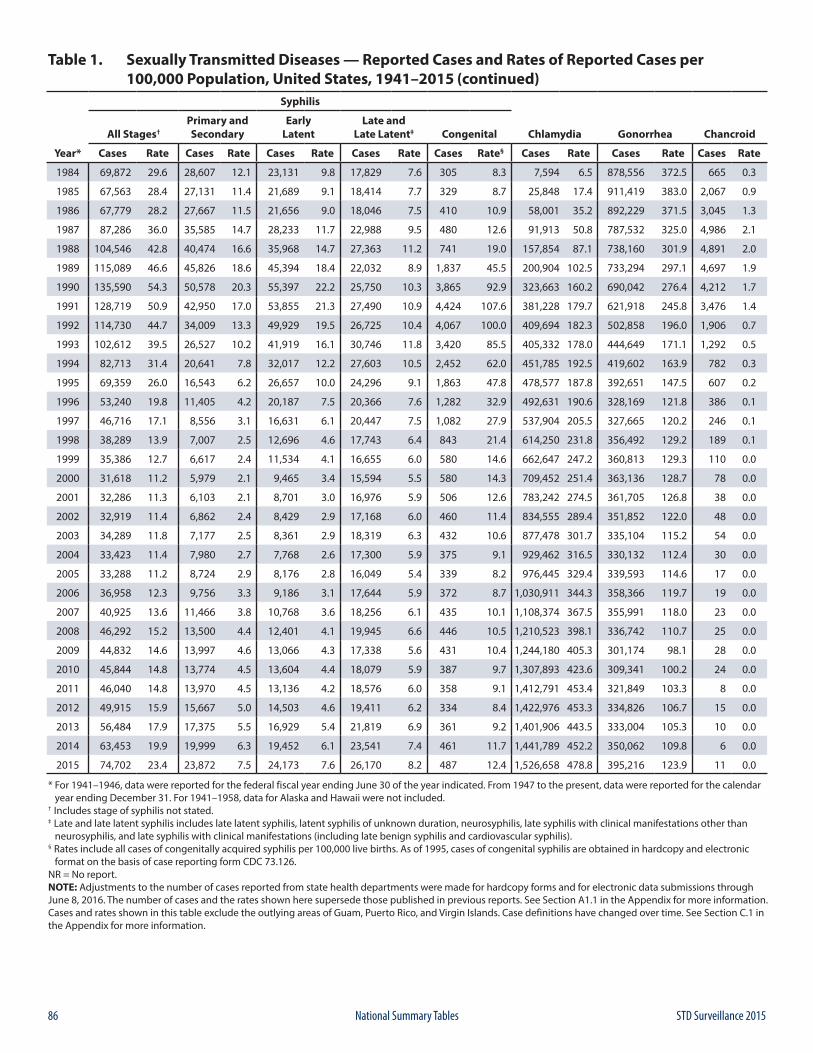
86 STD Surveillance 2015National Summary Tables
Table 1. Sexually Transmitted Diseases — Reported Cases and Rates of Reported Cases per 100,000 Population, United States, 1941–2015 (continued)
Syphilis
All Stages†Primary andSecondary
EarlyLatent
Late andLate Latent‡ Congenital Chlamydia Gonorrhea Chancroid
Year* Cases Rate Cases Rate Cases Rate Cases Rate Cases Rate§ Cases Rate Cases Rate Cases Rate
1984 69,872 29.6 28,607 12.1 23,131 9.8 17,829 7.6 305 8.3 7,594 6.5 878,556 372.5 665 0.3
1985 67,563 28.4 27,131 11.4 21,689 9.1 18,414 7.7 329 8.7 25,848 17.4 911,419 383.0 2,067 0.9
1986 67,779 28.2 27,667 11.5 21,656 9.0 18,046 7.5 410 10.9 58,001 35.2 892,229 371.5 3,045 1.3
1987 87,286 36.0 35,585 14.7 28,233 11.7 22,988 9.5 480 12.6 91,913 50.8 787,532 325.0 4,986 2.1
1988 104,546 42.8 40,474 16.6 35,968 14.7 27,363 11.2 741 19.0 157,854 87.1 738,160 301.9 4,891 2.0
1989 115,089 46.6 45,826 18.6 45,394 18.4 22,032 8.9 1,837 45.5 200,904 102.5 733,294 297.1 4,697 1.9
1990 135,590 54.3 50,578 20.3 55,397 22.2 25,750 10.3 3,865 92.9 323,663 160.2 690,042 276.4 4,212 1.7
1991 128,719 50.9 42,950 17.0 53,855 21.3 27,490 10.9 4,424 107.6 381,228 179.7 621,918 245.8 3,476 1.4
1992 114,730 44.7 34,009 13.3 49,929 19.5 26,725 10.4 4,067 100.0 409,694 182.3 502,858 196.0 1,906 0.7
1993 102,612 39.5 26,527 10.2 41,919 16.1 30,746 11.8 3,420 85.5 405,332 178.0 444,649 171.1 1,292 0.5
1994 82,713 31.4 20,641 7.8 32,017 12.2 27,603 10.5 2,452 62.0 451,785 192.5 419,602 163.9 782 0.3
1995 69,359 26.0 16,543 6.2 26,657 10.0 24,296 9.1 1,863 47.8 478,577 187.8 392,651 147.5 607 0.2
1996 53,240 19.8 11,405 4.2 20,187 7.5 20,366 7.6 1,282 32.9 492,631 190.6 328,169 121.8 386 0.1
1997 46,716 17.1 8,556 3.1 16,631 6.1 20,447 7.5 1,082 27.9 537,904 205.5 327,665 120.2 246 0.1
1998 38,289 13.9 7,007 2.5 12,696 4.6 17,743 6.4 843 21.4 614,250 231.8 356,492 129.2 189 0.1
1999 35,386 12.7 6,617 2.4 11,534 4.1 16,655 6.0 580 14.6 662,647 247.2 360,813 129.3 110 0.0
2000 31,618 11.2 5,979 2.1 9,465 3.4 15,594 5.5 580 14.3 709,452 251.4 363,136 128.7 78 0.0
2001 32,286 11.3 6,103 2.1 8,701 3.0 16,976 5.9 506 12.6 783,242 274.5 361,705 126.8 38 0.0
2002 32,919 11.4 6,862 2.4 8,429 2.9 17,168 6.0 460 11.4 834,555 289.4 351,852 122.0 48 0.0
2003 34,289 11.8 7,177 2.5 8,361 2.9 18,319 6.3 432 10.6 877,478 301.7 335,104 115.2 54 0.0
2004 33,423 11.4 7,980 2.7 7,768 2.6 17,300 5.9 375 9.1 929,462 316.5 330,132 112.4 30 0.0
2005 33,288 11.2 8,724 2.9 8,176 2.8 16,049 5.4 339 8.2 976,445 329.4 339,593 114.6 17 0.0
2006 36,958 12.3 9,756 3.3 9,186 3.1 17,644 5.9 372 8.7 1,030,911 344.3 358,366 119.7 19 0.0
2007 40,925 13.6 11,466 3.8 10,768 3.6 18,256 6.1 435 10.1 1,108,374 367.5 355,991 118.0 23 0.0
2008 46,292 15.2 13,500 4.4 12,401 4.1 19,945 6.6 446 10.5 1,210,523 398.1 336,742 110.7 25 0.0
2009 44,832 14.6 13,997 4.6 13,066 4.3 17,338 5.6 431 10.4 1,244,180 405.3 301,174 98.1 28 0.0
2010 45,844 14.8 13,774 4.5 13,604 4.4 18,079 5.9 387 9.7 1,307,893 423.6 309,341 100.2 24 0.0
2011 46,040 14.8 13,970 4.5 13,136 4.2 18,576 6.0 358 9.1 1,412,791 453.4 321,849 103.3 8 0.0
2012 49,915 15.9 15,667 5.0 14,503 4.6 19,411 6.2 334 8.4 1,422,976 453.3 334,826 106.7 15 0.0
2013 56,484 17.9 17,375 5.5 16,929 5.4 21,819 6.9 361 9.2 1,401,906 443.5 333,004 105.3 10 0.0
2014 63,453 19.9 19,999 6.3 19,452 6.1 23,541 7.4 461 11.7 1,441,789 452.2 350,062 109.8 6 0.0
2015 74,702 23.4 23,872 7.5 24,173 7.6 26,170 8.2 487 12.4 1,526,658 478.8 395,216 123.9 11 0.0
* For 1941–1946, data were reported for the federal fiscal year ending June 30 of the year indicated. From 1947 to the present, data were reported for the calendar year ending December 31. For 1941–1958, data for Alaska and Hawaii were not included.† Includes stage of syphilis not stated.‡ Late and late latent syphilis includes late latent syphilis, latent syphilis of unknown duration, neurosyphilis, late syphilis with clinical manifestations other than neurosyphilis, and late syphilis with clinical manifestations (including late benign syphilis and cardiovascular syphilis).§ Rates include all cases of congenitally acquired syphilis per 100,000 live births. As of 1995, cases of congenital syphilis are obtained in hardcopy and electronic format on the basis of case reporting form CDC 73.126.NR = No report.NOTE: Adjustments to the number of cases reported from state health departments were made for hardcopy forms and for electronic data submissions through June 8, 2016. The number of cases and the rates shown here supersede those published in previous reports. See Section A1.1 in the Appendix for more information. Cases and rates shown in this table exclude the outlying areas of Guam, Puerto Rico, and Virgin Islands. Case definitions have changed over time. See Section C.1 in the Appendix for more information.
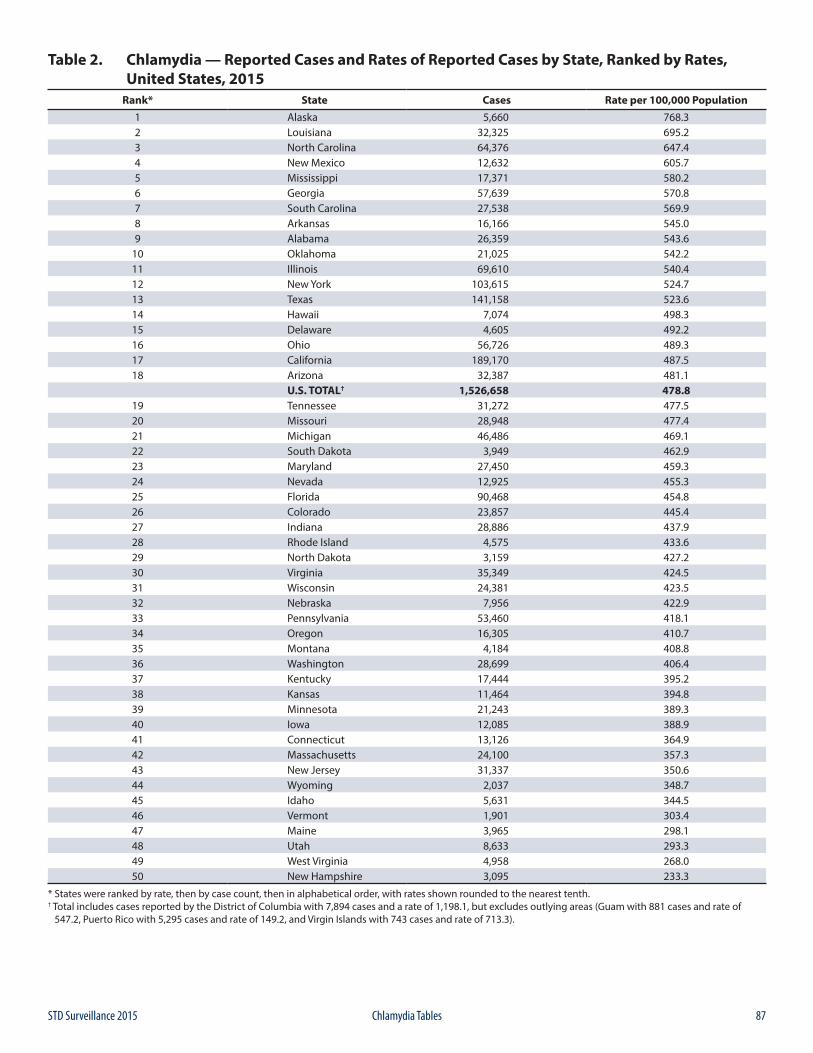
87STD Surveillance 2015 Chlamydia Tables
Table 2. Chlamydia — Reported Cases and Rates of Reported Cases by State, Ranked by Rates, United States, 2015
Rank* State Cases Rate per 100,000 Population1 Alaska 5,660 768.32 Louisiana 32,325 695.23 North Carolina 64,376 647.44 New Mexico 12,632 605.75 Mississippi 17,371 580.26 Georgia 57,639 570.87 South Carolina 27,538 569.98 Arkansas 16,166 545.09 Alabama 26,359 543.6
10 Oklahoma 21,025 542.211 Illinois 69,610 540.412 New York 103,615 524.713 Texas 141,158 523.614 Hawaii 7,074 498.315 Delaware 4,605 492.216 Ohio 56,726 489.317 California 189,170 487.518 Arizona 32,387 481.1
U.S. TOTAL† 1,526,658 478.819 Tennessee 31,272 477.520 Missouri 28,948 477.421 Michigan 46,486 469.122 South Dakota 3,949 462.923 Maryland 27,450 459.324 Nevada 12,925 455.325 Florida 90,468 454.826 Colorado 23,857 445.427 Indiana 28,886 437.928 Rhode Island 4,575 433.629 North Dakota 3,159 427.230 Virginia 35,349 424.531 Wisconsin 24,381 423.532 Nebraska 7,956 422.933 Pennsylvania 53,460 418.134 Oregon 16,305 410.735 Montana 4,184 408.836 Washington 28,699 406.437 Kentucky 17,444 395.238 Kansas 11,464 394.839 Minnesota 21,243 389.340 Iowa 12,085 388.941 Connecticut 13,126 364.942 Massachusetts 24,100 357.343 New Jersey 31,337 350.644 Wyoming 2,037 348.745 Idaho 5,631 344.546 Vermont 1,901 303.447 Maine 3,965 298.148 Utah 8,633 293.349 West Virginia 4,958 268.050 New Hampshire 3,095 233.3
* States were ranked by rate, then by case count, then in alphabetical order, with rates shown rounded to the nearest tenth.† Total includes cases reported by the District of Columbia with 7,894 cases and a rate of 1,198.1, but excludes outlying areas (Guam with 881 cases and rate of 547.2, Puerto Rico with 5,295 cases and rate of 149.2, and Virgin Islands with 743 cases and rate of 713.3).
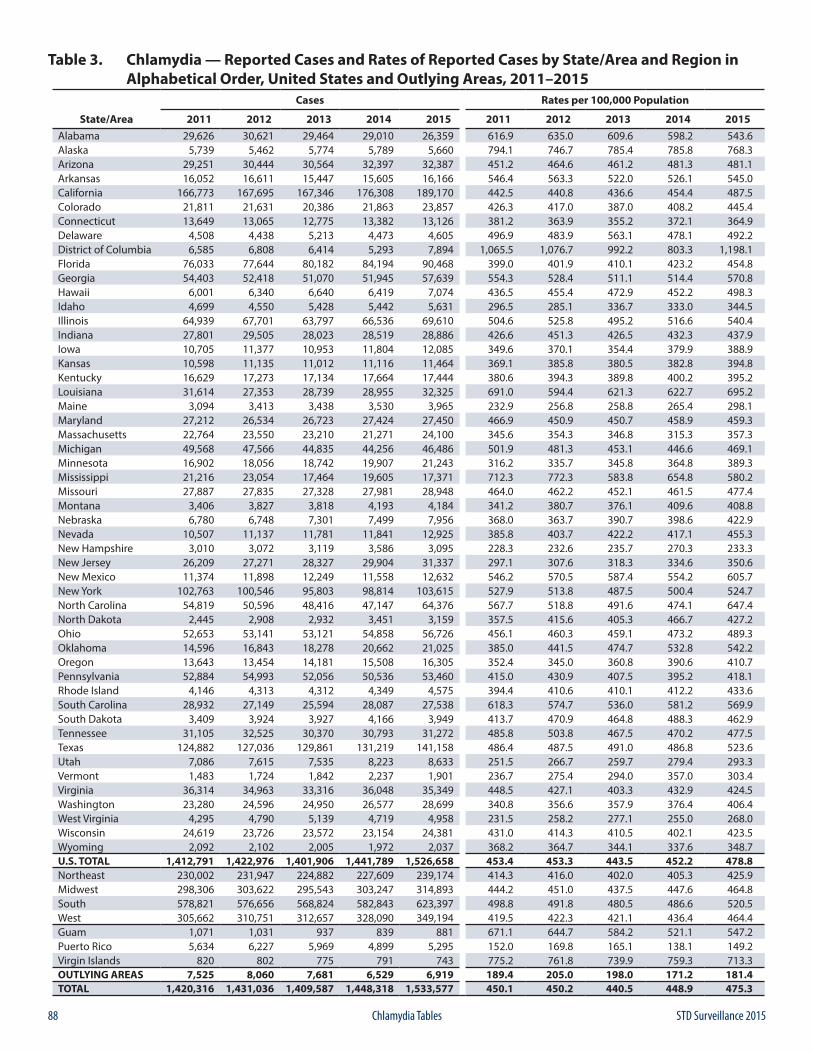
88 STD Surveillance 2015Chlamydia Tables
Table 3. Chlamydia — Reported Cases and Rates of Reported Cases by State/Area and Region in Alphabetical Order, United States and Outlying Areas, 2011–2015
Cases Rates per 100,000 Population
State/Area 2011 2012 2013 2014 2015 2011 2012 2013 2014 2015Alabama 29,626 30,621 29,464 29,010 26,359 616.9 635.0 609.6 598.2 543.6Alaska 5,739 5,462 5,774 5,789 5,660 794.1 746.7 785.4 785.8 768.3Arizona 29,251 30,444 30,564 32,397 32,387 451.2 464.6 461.2 481.3 481.1Arkansas 16,052 16,611 15,447 15,605 16,166 546.4 563.3 522.0 526.1 545.0California 166,773 167,695 167,346 176,308 189,170 442.5 440.8 436.6 454.4 487.5Colorado 21,811 21,631 20,386 21,863 23,857 426.3 417.0 387.0 408.2 445.4Connecticut 13,649 13,065 12,775 13,382 13,126 381.2 363.9 355.2 372.1 364.9Delaware 4,508 4,438 5,213 4,473 4,605 496.9 483.9 563.1 478.1 492.2District of Columbia 6,585 6,808 6,414 5,293 7,894 1,065.5 1,076.7 992.2 803.3 1,198.1Florida 76,033 77,644 80,182 84,194 90,468 399.0 401.9 410.1 423.2 454.8Georgia 54,403 52,418 51,070 51,945 57,639 554.3 528.4 511.1 514.4 570.8Hawaii 6,001 6,340 6,640 6,419 7,074 436.5 455.4 472.9 452.2 498.3Idaho 4,699 4,550 5,428 5,442 5,631 296.5 285.1 336.7 333.0 344.5Illinois 64,939 67,701 63,797 66,536 69,610 504.6 525.8 495.2 516.6 540.4Indiana 27,801 29,505 28,023 28,519 28,886 426.6 451.3 426.5 432.3 437.9Iowa 10,705 11,377 10,953 11,804 12,085 349.6 370.1 354.4 379.9 388.9Kansas 10,598 11,135 11,012 11,116 11,464 369.1 385.8 380.5 382.8 394.8Kentucky 16,629 17,273 17,134 17,664 17,444 380.6 394.3 389.8 400.2 395.2Louisiana 31,614 27,353 28,739 28,955 32,325 691.0 594.4 621.3 622.7 695.2Maine 3,094 3,413 3,438 3,530 3,965 232.9 256.8 258.8 265.4 298.1Maryland 27,212 26,534 26,723 27,424 27,450 466.9 450.9 450.7 458.9 459.3Massachusetts 22,764 23,550 23,210 21,271 24,100 345.6 354.3 346.8 315.3 357.3Michigan 49,568 47,566 44,835 44,256 46,486 501.9 481.3 453.1 446.6 469.1Minnesota 16,902 18,056 18,742 19,907 21,243 316.2 335.7 345.8 364.8 389.3Mississippi 21,216 23,054 17,464 19,605 17,371 712.3 772.3 583.8 654.8 580.2Missouri 27,887 27,835 27,328 27,981 28,948 464.0 462.2 452.1 461.5 477.4Montana 3,406 3,827 3,818 4,193 4,184 341.2 380.7 376.1 409.6 408.8Nebraska 6,780 6,748 7,301 7,499 7,956 368.0 363.7 390.7 398.6 422.9Nevada 10,507 11,137 11,781 11,841 12,925 385.8 403.7 422.2 417.1 455.3New Hampshire 3,010 3,072 3,119 3,586 3,095 228.3 232.6 235.7 270.3 233.3New Jersey 26,209 27,271 28,327 29,904 31,337 297.1 307.6 318.3 334.6 350.6New Mexico 11,374 11,898 12,249 11,558 12,632 546.2 570.5 587.4 554.2 605.7New York 102,763 100,546 95,803 98,814 103,615 527.9 513.8 487.5 500.4 524.7North Carolina 54,819 50,596 48,416 47,147 64,376 567.7 518.8 491.6 474.1 647.4North Dakota 2,445 2,908 2,932 3,451 3,159 357.5 415.6 405.3 466.7 427.2Ohio 52,653 53,141 53,121 54,858 56,726 456.1 460.3 459.1 473.2 489.3Oklahoma 14,596 16,843 18,278 20,662 21,025 385.0 441.5 474.7 532.8 542.2Oregon 13,643 13,454 14,181 15,508 16,305 352.4 345.0 360.8 390.6 410.7Pennsylvania 52,884 54,993 52,056 50,536 53,460 415.0 430.9 407.5 395.2 418.1Rhode Island 4,146 4,313 4,312 4,349 4,575 394.4 410.6 410.1 412.2 433.6South Carolina 28,932 27,149 25,594 28,087 27,538 618.3 574.7 536.0 581.2 569.9South Dakota 3,409 3,924 3,927 4,166 3,949 413.7 470.9 464.8 488.3 462.9Tennessee 31,105 32,525 30,370 30,793 31,272 485.8 503.8 467.5 470.2 477.5Texas 124,882 127,036 129,861 131,219 141,158 486.4 487.5 491.0 486.8 523.6Utah 7,086 7,615 7,535 8,223 8,633 251.5 266.7 259.7 279.4 293.3Vermont 1,483 1,724 1,842 2,237 1,901 236.7 275.4 294.0 357.0 303.4Virginia 36,314 34,963 33,316 36,048 35,349 448.5 427.1 403.3 432.9 424.5Washington 23,280 24,596 24,950 26,577 28,699 340.8 356.6 357.9 376.4 406.4West Virginia 4,295 4,790 5,139 4,719 4,958 231.5 258.2 277.1 255.0 268.0Wisconsin 24,619 23,726 23,572 23,154 24,381 431.0 414.3 410.5 402.1 423.5Wyoming 2,092 2,102 2,005 1,972 2,037 368.2 364.7 344.1 337.6 348.7U.S. TOTAL 1,412,791 1,422,976 1,401,906 1,441,789 1,526,658 453.4 453.3 443.5 452.2 478.8Northeast 230,002 231,947 224,882 227,609 239,174 414.3 416.0 402.0 405.3 425.9Midwest 298,306 303,622 295,543 303,247 314,893 444.2 451.0 437.5 447.6 464.8South 578,821 576,656 568,824 582,843 623,397 498.8 491.8 480.5 486.6 520.5West 305,662 310,751 312,657 328,090 349,194 419.5 422.3 421.1 436.4 464.4Guam 1,071 1,031 937 839 881 671.1 644.7 584.2 521.1 547.2Puerto Rico 5,634 6,227 5,969 4,899 5,295 152.0 169.8 165.1 138.1 149.2Virgin Islands 820 802 775 791 743 775.2 761.8 739.9 759.3 713.3OUTLYING AREAS 7,525 8,060 7,681 6,529 6,919 189.4 205.0 198.0 171.2 181.4TOTAL 1,420,316 1,431,036 1,409,587 1,448,318 1,533,577 450.1 450.2 440.5 448.9 475.3
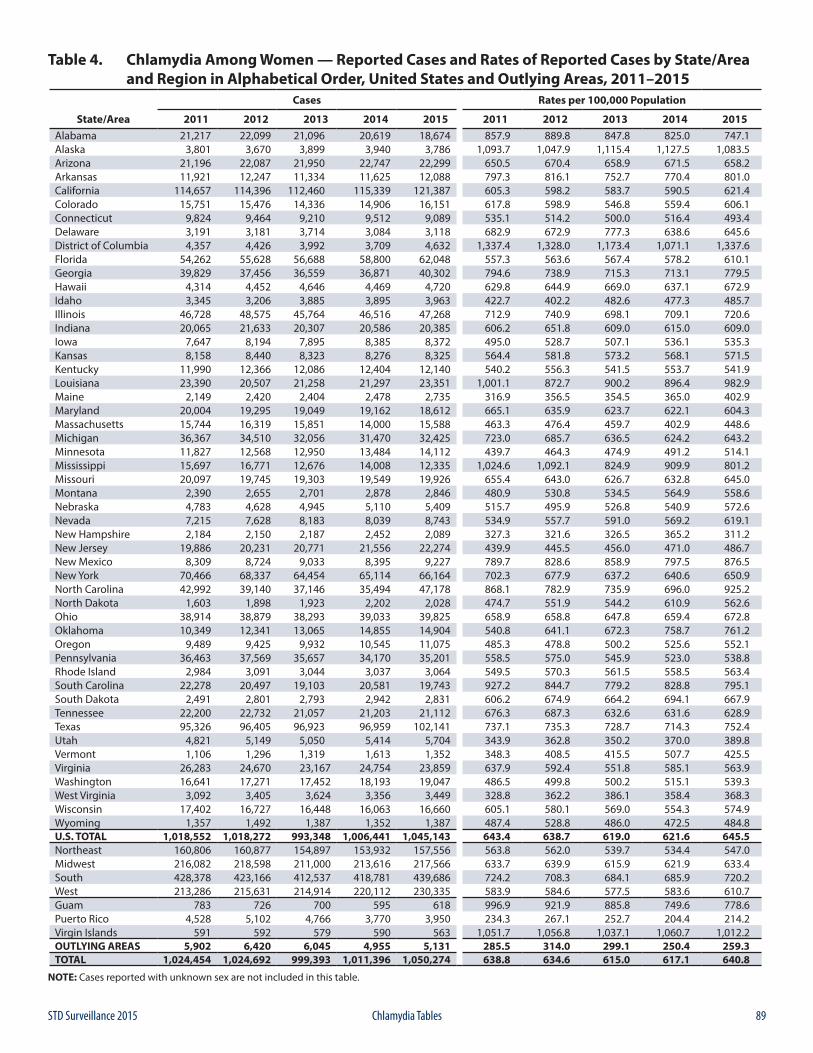
89STD Surveillance 2015 Chlamydia Tables
Table 4. Chlamydia Among Women — Reported Cases and Rates of Reported Cases by State/Area and Region in Alphabetical Order, United States and Outlying Areas, 2011–2015
Cases Rates per 100,000 Population
State/Area 2011 2012 2013 2014 2015 2011 2012 2013 2014 2015Alabama 21,217 22,099 21,096 20,619 18,674 857.9 889.8 847.8 825.0 747.1Alaska 3,801 3,670 3,899 3,940 3,786 1,093.7 1,047.9 1,115.4 1,127.5 1,083.5Arizona 21,196 22,087 21,950 22,747 22,299 650.5 670.4 658.9 671.5 658.2Arkansas 11,921 12,247 11,334 11,625 12,088 797.3 816.1 752.7 770.4 801.0California 114,657 114,396 112,460 115,339 121,387 605.3 598.2 583.7 590.5 621.4Colorado 15,751 15,476 14,336 14,906 16,151 617.8 598.9 546.8 559.4 606.1Connecticut 9,824 9,464 9,210 9,512 9,089 535.1 514.2 500.0 516.4 493.4Delaware 3,191 3,181 3,714 3,084 3,118 682.9 672.9 777.3 638.6 645.6District of Columbia 4,357 4,426 3,992 3,709 4,632 1,337.4 1,328.0 1,173.4 1,071.1 1,337.6Florida 54,262 55,628 56,688 58,800 62,048 557.3 563.6 567.4 578.2 610.1Georgia 39,829 37,456 36,559 36,871 40,302 794.6 738.9 715.3 713.1 779.5Hawaii 4,314 4,452 4,646 4,469 4,720 629.8 644.9 669.0 637.1 672.9Idaho 3,345 3,206 3,885 3,895 3,963 422.7 402.2 482.6 477.3 485.7Illinois 46,728 48,575 45,764 46,516 47,268 712.9 740.9 698.1 709.1 720.6Indiana 20,065 21,633 20,307 20,586 20,385 606.2 651.8 609.0 615.0 609.0Iowa 7,647 8,194 7,895 8,385 8,372 495.0 528.7 507.1 536.1 535.3Kansas 8,158 8,440 8,323 8,276 8,325 564.4 581.8 573.2 568.1 571.5Kentucky 11,990 12,366 12,086 12,404 12,140 540.2 556.3 541.5 553.7 541.9Louisiana 23,390 20,507 21,258 21,297 23,351 1,001.1 872.7 900.2 896.4 982.9Maine 2,149 2,420 2,404 2,478 2,735 316.9 356.5 354.5 365.0 402.9Maryland 20,004 19,295 19,049 19,162 18,612 665.1 635.9 623.7 622.1 604.3Massachusetts 15,744 16,319 15,851 14,000 15,588 463.3 476.4 459.7 402.9 448.6Michigan 36,367 34,510 32,056 31,470 32,425 723.0 685.7 636.5 624.2 643.2Minnesota 11,827 12,568 12,950 13,484 14,112 439.7 464.3 474.9 491.2 514.1Mississippi 15,697 16,771 12,676 14,008 12,335 1,024.6 1,092.1 824.9 909.9 801.2Missouri 20,097 19,745 19,303 19,549 19,926 655.4 643.0 626.7 632.8 645.0Montana 2,390 2,655 2,701 2,878 2,846 480.9 530.8 534.5 564.9 558.6Nebraska 4,783 4,628 4,945 5,110 5,409 515.7 495.9 526.8 540.9 572.6Nevada 7,215 7,628 8,183 8,039 8,743 534.9 557.7 591.0 569.2 619.1New Hampshire 2,184 2,150 2,187 2,452 2,089 327.3 321.6 326.5 365.2 311.2New Jersey 19,886 20,231 20,771 21,556 22,274 439.9 445.5 456.0 471.0 486.7New Mexico 8,309 8,724 9,033 8,395 9,227 789.7 828.6 858.9 797.5 876.5New York 70,466 68,337 64,454 65,114 66,164 702.3 677.9 637.2 640.6 650.9North Carolina 42,992 39,140 37,146 35,494 47,178 868.1 782.9 735.9 696.0 925.2North Dakota 1,603 1,898 1,923 2,202 2,028 474.7 551.9 544.2 610.9 562.6Ohio 38,914 38,879 38,293 39,033 39,825 658.9 658.8 647.8 659.4 672.8Oklahoma 10,349 12,341 13,065 14,855 14,904 540.8 641.1 672.3 758.7 761.2Oregon 9,489 9,425 9,932 10,545 11,075 485.3 478.8 500.2 525.6 552.1Pennsylvania 36,463 37,569 35,657 34,170 35,201 558.5 575.0 545.9 523.0 538.8Rhode Island 2,984 3,091 3,044 3,037 3,064 549.5 570.3 561.5 558.5 563.4South Carolina 22,278 20,497 19,103 20,581 19,743 927.2 844.7 779.2 828.8 795.1South Dakota 2,491 2,801 2,793 2,942 2,831 606.2 674.9 664.2 694.1 667.9Tennessee 22,200 22,732 21,057 21,203 21,112 676.3 687.3 632.6 631.6 628.9Texas 95,326 96,405 96,923 96,959 102,141 737.1 735.3 728.7 714.3 752.4Utah 4,821 5,149 5,050 5,414 5,704 343.9 362.8 350.2 370.0 389.8Vermont 1,106 1,296 1,319 1,613 1,352 348.3 408.5 415.5 507.7 425.5Virginia 26,283 24,670 23,167 24,754 23,859 637.9 592.4 551.8 585.1 563.9Washington 16,641 17,271 17,452 18,193 19,047 486.5 499.8 500.2 515.1 539.3West Virginia 3,092 3,405 3,624 3,356 3,449 328.8 362.2 386.1 358.4 368.3Wisconsin 17,402 16,727 16,448 16,063 16,660 605.1 580.1 569.0 554.3 574.9Wyoming 1,357 1,492 1,387 1,352 1,387 487.4 528.8 486.0 472.5 484.8U.S. TOTAL 1,018,552 1,018,272 993,348 1,006,441 1,045,143 643.4 638.7 619.0 621.6 645.5Northeast 160,806 160,877 154,897 153,932 157,556 563.8 562.0 539.7 534.4 547.0Midwest 216,082 218,598 211,000 213,616 217,566 633.7 639.9 615.9 621.9 633.4South 428,378 423,166 412,537 418,781 439,686 724.2 708.3 684.1 685.9 720.2West 213,286 215,631 214,914 220,112 230,335 583.9 584.6 577.5 583.6 610.7Guam 783 726 700 595 618 996.9 921.9 885.8 749.6 778.6Puerto Rico 4,528 5,102 4,766 3,770 3,950 234.3 267.1 252.7 204.4 214.2Virgin Islands 591 592 579 590 563 1,051.7 1,056.8 1,037.1 1,060.7 1,012.2OUTLYING AREAS 5,902 6,420 6,045 4,955 5,131 285.5 314.0 299.1 250.4 259.3TOTAL 1,024,454 1,024,692 999,393 1,011,396 1,050,274 638.8 634.6 615.0 617.1 640.8
NOTE: Cases reported with unknown sex are not included in this table.
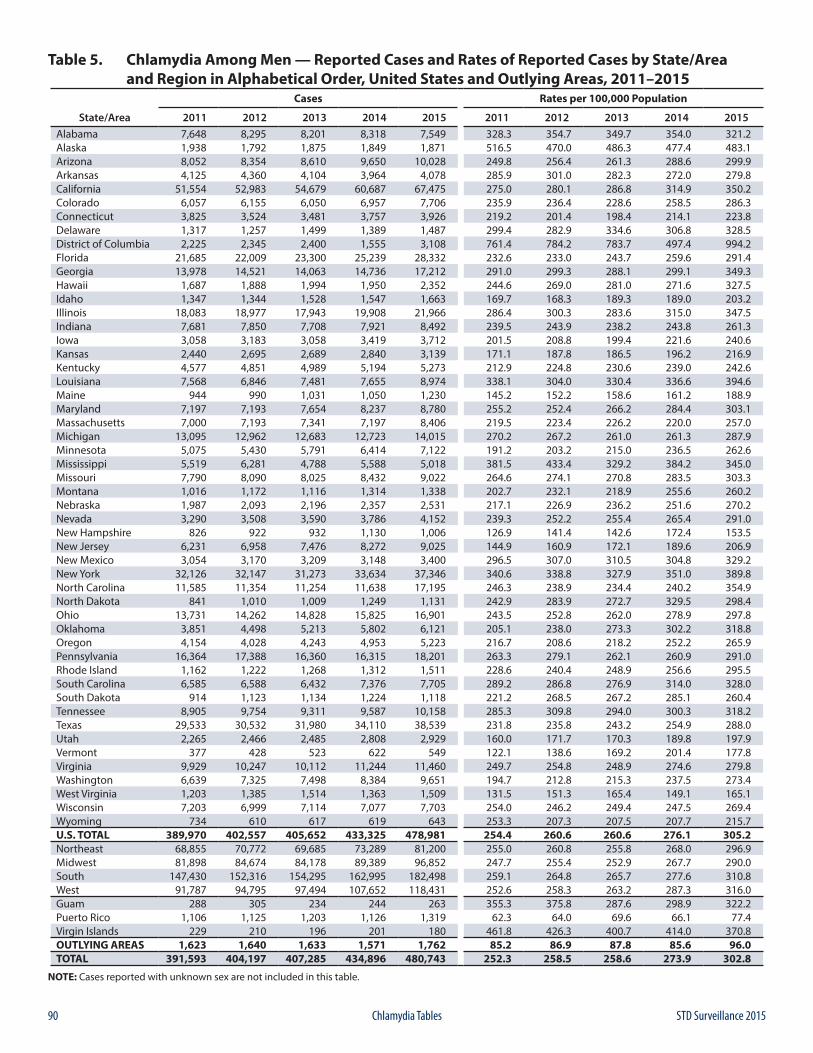
90 STD Surveillance 2015Chlamydia Tables
Table 5. Chlamydia Among Men — Reported Cases and Rates of Reported Cases by State/Area and Region in Alphabetical Order, United States and Outlying Areas, 2011–2015
Cases Rates per 100,000 Population
State/Area 2011 2012 2013 2014 2015 2011 2012 2013 2014 2015Alabama 7,648 8,295 8,201 8,318 7,549 328.3 354.7 349.7 354.0 321.2Alaska 1,938 1,792 1,875 1,849 1,871 516.5 470.0 486.3 477.4 483.1Arizona 8,052 8,354 8,610 9,650 10,028 249.8 256.4 261.3 288.6 299.9Arkansas 4,125 4,360 4,104 3,964 4,078 285.9 301.0 282.3 272.0 279.8California 51,554 52,983 54,679 60,687 67,475 275.0 280.1 286.8 314.9 350.2Colorado 6,057 6,155 6,050 6,957 7,706 235.9 236.4 228.6 258.5 286.3Connecticut 3,825 3,524 3,481 3,757 3,926 219.2 201.4 198.4 214.1 223.8Delaware 1,317 1,257 1,499 1,389 1,487 299.4 282.9 334.6 306.8 328.5District of Columbia 2,225 2,345 2,400 1,555 3,108 761.4 784.2 783.7 497.4 994.2Florida 21,685 22,009 23,300 25,239 28,332 232.6 233.0 243.7 259.6 291.4Georgia 13,978 14,521 14,063 14,736 17,212 291.0 299.3 288.1 299.1 349.3Hawaii 1,687 1,888 1,994 1,950 2,352 244.6 269.0 281.0 271.6 327.5Idaho 1,347 1,344 1,528 1,547 1,663 169.7 168.3 189.3 189.0 203.2Illinois 18,083 18,977 17,943 19,908 21,966 286.4 300.3 283.6 315.0 347.5Indiana 7,681 7,850 7,708 7,921 8,492 239.5 243.9 238.2 243.8 261.3Iowa 3,058 3,183 3,058 3,419 3,712 201.5 208.8 199.4 221.6 240.6Kansas 2,440 2,695 2,689 2,840 3,139 171.1 187.8 186.5 196.2 216.9Kentucky 4,577 4,851 4,989 5,194 5,273 212.9 224.8 230.6 239.0 242.6Louisiana 7,568 6,846 7,481 7,655 8,974 338.1 304.0 330.4 336.6 394.6Maine 944 990 1,031 1,050 1,230 145.2 152.2 158.6 161.2 188.9Maryland 7,197 7,193 7,654 8,237 8,780 255.2 252.4 266.2 284.4 303.1Massachusetts 7,000 7,193 7,341 7,197 8,406 219.5 223.4 226.2 220.0 257.0Michigan 13,095 12,962 12,683 12,723 14,015 270.2 267.2 261.0 261.3 287.9Minnesota 5,075 5,430 5,791 6,414 7,122 191.2 203.2 215.0 236.5 262.6Mississippi 5,519 6,281 4,788 5,588 5,018 381.5 433.4 329.2 384.2 345.0Missouri 7,790 8,090 8,025 8,432 9,022 264.6 274.1 270.8 283.5 303.3Montana 1,016 1,172 1,116 1,314 1,338 202.7 232.1 218.9 255.6 260.2Nebraska 1,987 2,093 2,196 2,357 2,531 217.1 226.9 236.2 251.6 270.2Nevada 3,290 3,508 3,590 3,786 4,152 239.3 252.2 255.4 265.4 291.0New Hampshire 826 922 932 1,130 1,006 126.9 141.4 142.6 172.4 153.5New Jersey 6,231 6,958 7,476 8,272 9,025 144.9 160.9 172.1 189.6 206.9New Mexico 3,054 3,170 3,209 3,148 3,400 296.5 307.0 310.5 304.8 329.2New York 32,126 32,147 31,273 33,634 37,346 340.6 338.8 327.9 351.0 389.8North Carolina 11,585 11,354 11,254 11,638 17,195 246.3 238.9 234.4 240.2 354.9North Dakota 841 1,010 1,009 1,249 1,131 242.9 283.9 272.7 329.5 298.4Ohio 13,731 14,262 14,828 15,825 16,901 243.5 252.8 262.0 278.9 297.8Oklahoma 3,851 4,498 5,213 5,802 6,121 205.1 238.0 273.3 302.2 318.8Oregon 4,154 4,028 4,243 4,953 5,223 216.7 208.6 218.2 252.2 265.9Pennsylvania 16,364 17,388 16,360 16,315 18,201 263.3 279.1 262.1 260.9 291.0Rhode Island 1,162 1,222 1,268 1,312 1,511 228.6 240.4 248.9 256.6 295.5South Carolina 6,585 6,588 6,432 7,376 7,705 289.2 286.8 276.9 314.0 328.0South Dakota 914 1,123 1,134 1,224 1,118 221.2 268.5 267.2 285.1 260.4Tennessee 8,905 9,754 9,311 9,587 10,158 285.3 309.8 294.0 300.3 318.2Texas 29,533 30,532 31,980 34,110 38,539 231.8 235.8 243.2 254.9 288.0Utah 2,265 2,466 2,485 2,808 2,929 160.0 171.7 170.3 189.8 197.9Vermont 377 428 523 622 549 122.1 138.6 169.2 201.4 177.8Virginia 9,929 10,247 10,112 11,244 11,460 249.7 254.8 248.9 274.6 279.8Washington 6,639 7,325 7,498 8,384 9,651 194.7 212.8 215.3 237.5 273.4West Virginia 1,203 1,385 1,514 1,363 1,509 131.5 151.3 165.4 149.1 165.1Wisconsin 7,203 6,999 7,114 7,077 7,703 254.0 246.2 249.4 247.5 269.4Wyoming 734 610 617 619 643 253.3 207.3 207.5 207.7 215.7U.S. TOTAL 389,970 402,557 405,652 433,325 478,981 254.4 260.6 260.6 276.1 305.2Northeast 68,855 70,772 69,685 73,289 81,200 255.0 260.8 255.8 268.0 296.9Midwest 81,898 84,674 84,178 89,389 96,852 247.7 255.4 252.9 267.7 290.0South 147,430 152,316 154,295 162,995 182,498 259.1 264.8 265.7 277.6 310.8West 91,787 94,795 97,494 107,652 118,431 252.6 258.3 263.2 287.3 316.0Guam 288 305 234 244 263 355.3 375.8 287.6 298.9 322.2Puerto Rico 1,106 1,125 1,203 1,126 1,319 62.3 64.0 69.6 66.1 77.4Virgin Islands 229 210 196 201 180 461.8 426.3 400.7 414.0 370.8OUTLYING AREAS 1,623 1,640 1,633 1,571 1,762 85.2 86.9 87.8 85.6 96.0TOTAL 391,593 404,197 407,285 434,896 480,743 252.3 258.5 258.6 273.9 302.8
NOTE: Cases reported with unknown sex are not included in this table.
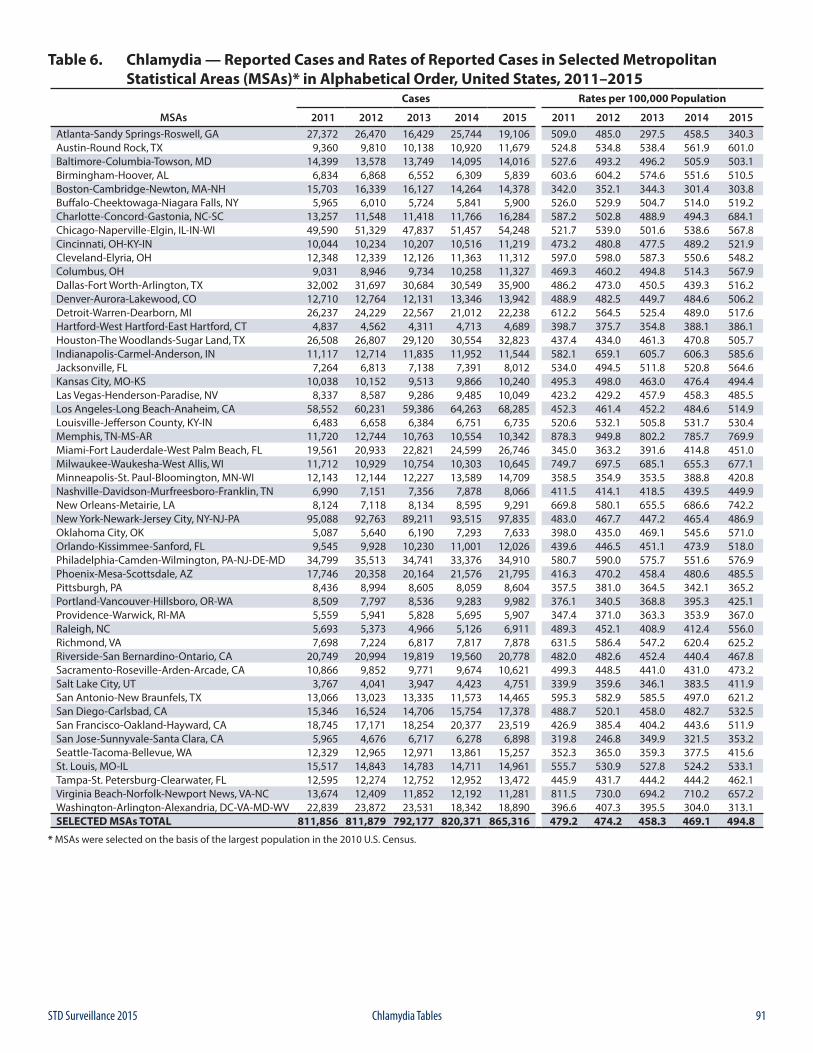
91STD Surveillance 2015 Chlamydia Tables
Table 6. Chlamydia — Reported Cases and Rates of Reported Cases in Selected Metropolitan Statistical Areas (MSAs)* in Alphabetical Order, United States, 2011–2015
Cases Rates per 100,000 Population
MSAs 2011 2012 2013 2014 2015 2011 2012 2013 2014 2015Atlanta-Sandy Springs-Roswell, GA 27,372 26,470 16,429 25,744 19,106 509.0 485.0 297.5 458.5 340.3Austin-Round Rock, TX 9,360 9,810 10,138 10,920 11,679 524.8 534.8 538.4 561.9 601.0Baltimore-Columbia-Towson, MD 14,399 13,578 13,749 14,095 14,016 527.6 493.2 496.2 505.9 503.1Birmingham-Hoover, AL 6,834 6,868 6,552 6,309 5,839 603.6 604.2 574.6 551.6 510.5Boston-Cambridge-Newton, MA-NH 15,703 16,339 16,127 14,264 14,378 342.0 352.1 344.3 301.4 303.8Buffalo-Cheektowaga-Niagara Falls, NY 5,965 6,010 5,724 5,841 5,900 526.0 529.9 504.7 514.0 519.2Charlotte-Concord-Gastonia, NC-SC 13,257 11,548 11,418 11,766 16,284 587.2 502.8 488.9 494.3 684.1Chicago-Naperville-Elgin, IL-IN-WI 49,590 51,329 47,837 51,457 54,248 521.7 539.0 501.6 538.6 567.8Cincinnati, OH-KY-IN 10,044 10,234 10,207 10,516 11,219 473.2 480.8 477.5 489.2 521.9Cleveland-Elyria, OH 12,348 12,339 12,126 11,363 11,312 597.0 598.0 587.3 550.6 548.2Columbus, OH 9,031 8,946 9,734 10,258 11,327 469.3 460.2 494.8 514.3 567.9Dallas-Fort Worth-Arlington, TX 32,002 31,697 30,684 30,549 35,900 486.2 473.0 450.5 439.3 516.2Denver-Aurora-Lakewood, CO 12,710 12,764 12,131 13,346 13,942 488.9 482.5 449.7 484.6 506.2Detroit-Warren-Dearborn, MI 26,237 24,229 22,567 21,012 22,238 612.2 564.5 525.4 489.0 517.6Hartford-West Hartford-East Hartford, CT 4,837 4,562 4,311 4,713 4,689 398.7 375.7 354.8 388.1 386.1Houston-The Woodlands-Sugar Land, TX 26,508 26,807 29,120 30,554 32,823 437.4 434.0 461.3 470.8 505.7Indianapolis-Carmel-Anderson, IN 11,117 12,714 11,835 11,952 11,544 582.1 659.1 605.7 606.3 585.6Jacksonville, FL 7,264 6,813 7,138 7,391 8,012 534.0 494.5 511.8 520.8 564.6Kansas City, MO-KS 10,038 10,152 9,513 9,866 10,240 495.3 498.0 463.0 476.4 494.4Las Vegas-Henderson-Paradise, NV 8,337 8,587 9,286 9,485 10,049 423.2 429.2 457.9 458.3 485.5Los Angeles-Long Beach-Anaheim, CA 58,552 60,231 59,386 64,263 68,285 452.3 461.4 452.2 484.6 514.9Louisville-Jefferson County, KY-IN 6,483 6,658 6,384 6,751 6,735 520.6 532.1 505.8 531.7 530.4Memphis, TN-MS-AR 11,720 12,744 10,763 10,554 10,342 878.3 949.8 802.2 785.7 769.9Miami-Fort Lauderdale-West Palm Beach, FL 19,561 20,933 22,821 24,599 26,746 345.0 363.2 391.6 414.8 451.0Milwaukee-Waukesha-West Allis, WI 11,712 10,929 10,754 10,303 10,645 749.7 697.5 685.1 655.3 677.1Minneapolis-St. Paul-Bloomington, MN-WI 12,143 12,144 12,227 13,589 14,709 358.5 354.9 353.5 388.8 420.8Nashville-Davidson-Murfreesboro-Franklin, TN 6,990 7,151 7,356 7,878 8,066 411.5 414.1 418.5 439.5 449.9New Orleans-Metairie, LA 8,124 7,118 8,134 8,595 9,291 669.8 580.1 655.5 686.6 742.2New York-Newark-Jersey City, NY-NJ-PA 95,088 92,763 89,211 93,515 97,835 483.0 467.7 447.2 465.4 486.9Oklahoma City, OK 5,087 5,640 6,190 7,293 7,633 398.0 435.0 469.1 545.6 571.0Orlando-Kissimmee-Sanford, FL 9,545 9,928 10,230 11,001 12,026 439.6 446.5 451.1 473.9 518.0Philadelphia-Camden-Wilmington, PA-NJ-DE-MD 34,799 35,513 34,741 33,376 34,910 580.7 590.0 575.7 551.6 576.9Phoenix-Mesa-Scottsdale, AZ 17,746 20,358 20,164 21,576 21,795 416.3 470.2 458.4 480.6 485.5Pittsburgh, PA 8,436 8,994 8,605 8,059 8,604 357.5 381.0 364.5 342.1 365.2Portland-Vancouver-Hillsboro, OR-WA 8,509 7,797 8,536 9,283 9,982 376.1 340.5 368.8 395.3 425.1Providence-Warwick, RI-MA 5,559 5,941 5,828 5,695 5,907 347.4 371.0 363.3 353.9 367.0Raleigh, NC 5,693 5,373 4,966 5,126 6,911 489.3 452.1 408.9 412.4 556.0Richmond, VA 7,698 7,224 6,817 7,817 7,878 631.5 586.4 547.2 620.4 625.2Riverside-San Bernardino-Ontario, CA 20,749 20,994 19,819 19,560 20,778 482.0 482.6 452.4 440.4 467.8Sacramento-Roseville-Arden-Arcade, CA 10,866 9,852 9,771 9,674 10,621 499.3 448.5 441.0 431.0 473.2Salt Lake City, UT 3,767 4,041 3,947 4,423 4,751 339.9 359.6 346.1 383.5 411.9San Antonio-New Braunfels, TX 13,066 13,023 13,335 11,573 14,465 595.3 582.9 585.5 497.0 621.2San Diego-Carlsbad, CA 15,346 16,524 14,706 15,754 17,378 488.7 520.1 458.0 482.7 532.5San Francisco-Oakland-Hayward, CA 18,745 17,171 18,254 20,377 23,519 426.9 385.4 404.2 443.6 511.9San Jose-Sunnyvale-Santa Clara, CA 5,965 4,676 6,717 6,278 6,898 319.8 246.8 349.9 321.5 353.2Seattle-Tacoma-Bellevue, WA 12,329 12,965 12,971 13,861 15,257 352.3 365.0 359.3 377.5 415.6St. Louis, MO-IL 15,517 14,843 14,783 14,711 14,961 555.7 530.9 527.8 524.2 533.1Tampa-St. Petersburg-Clearwater, FL 12,595 12,274 12,752 12,952 13,472 445.9 431.7 444.2 444.2 462.1Virginia Beach-Norfolk-Newport News, VA-NC 13,674 12,409 11,852 12,192 11,281 811.5 730.0 694.2 710.2 657.2Washington-Arlington-Alexandria, DC-VA-MD-WV 22,839 23,872 23,531 18,342 18,890 396.6 407.3 395.5 304.0 313.1SELECTED MSAs TOTAL 811,856 811,879 792,177 820,371 865,316 479.2 474.2 458.3 469.1 494.8
* MSAs were selected on the basis of the largest population in the 2010 U.S. Census.
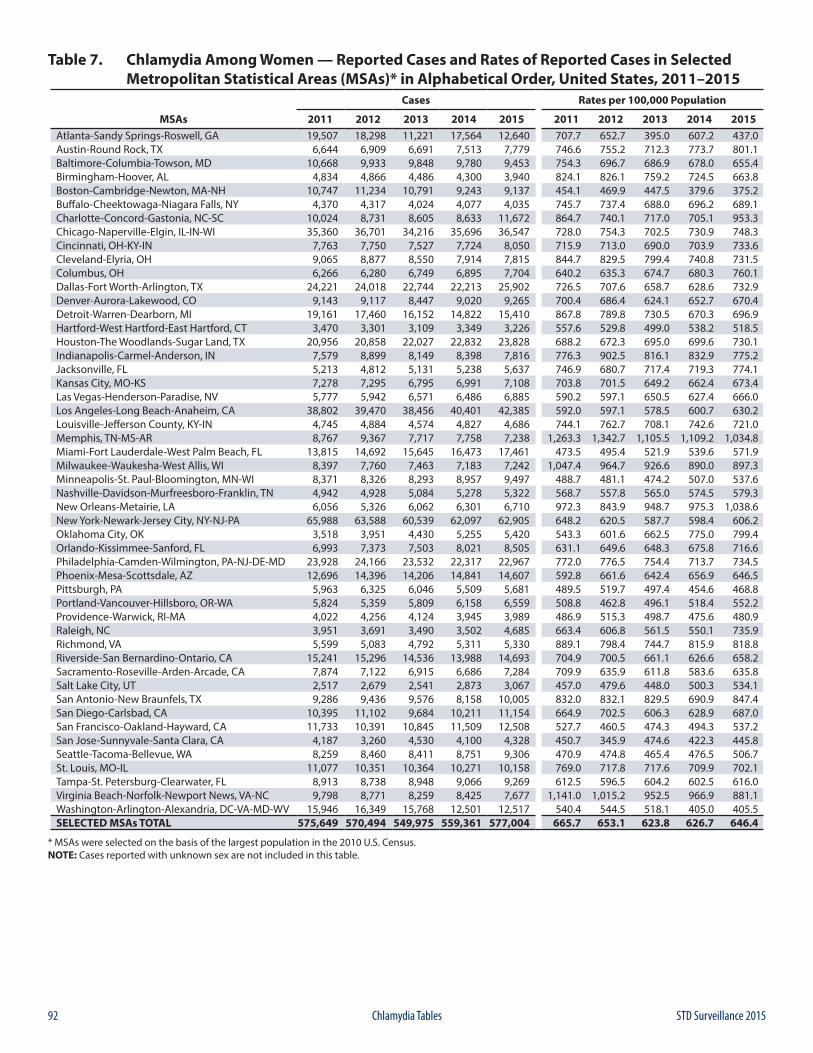
92 STD Surveillance 2015Chlamydia Tables
Table 7. Chlamydia Among Women — Reported Cases and Rates of Reported Cases in Selected Metropolitan Statistical Areas (MSAs)* in Alphabetical Order, United States, 2011–2015
Cases Rates per 100,000 Population
MSAs 2011 2012 2013 2014 2015 2011 2012 2013 2014 2015Atlanta-Sandy Springs-Roswell, GA 19,507 18,298 11,221 17,564 12,640 707.7 652.7 395.0 607.2 437.0Austin-Round Rock, TX 6,644 6,909 6,691 7,513 7,779 746.6 755.2 712.3 773.7 801.1Baltimore-Columbia-Towson, MD 10,668 9,933 9,848 9,780 9,453 754.3 696.7 686.9 678.0 655.4Birmingham-Hoover, AL 4,834 4,866 4,486 4,300 3,940 824.1 826.1 759.2 724.5 663.8Boston-Cambridge-Newton, MA-NH 10,747 11,234 10,791 9,243 9,137 454.1 469.9 447.5 379.6 375.2Buffalo-Cheektowaga-Niagara Falls, NY 4,370 4,317 4,024 4,077 4,035 745.7 737.4 688.0 696.2 689.1Charlotte-Concord-Gastonia, NC-SC 10,024 8,731 8,605 8,633 11,672 864.7 740.1 717.0 705.1 953.3Chicago-Naperville-Elgin, IL-IN-WI 35,360 36,701 34,216 35,696 36,547 728.0 754.3 702.5 730.9 748.3Cincinnati, OH-KY-IN 7,763 7,750 7,527 7,724 8,050 715.9 713.0 690.0 703.9 733.6Cleveland-Elyria, OH 9,065 8,877 8,550 7,914 7,815 844.7 829.5 799.4 740.8 731.5Columbus, OH 6,266 6,280 6,749 6,895 7,704 640.2 635.3 674.7 680.3 760.1Dallas-Fort Worth-Arlington, TX 24,221 24,018 22,744 22,213 25,902 726.5 707.6 658.7 628.6 732.9Denver-Aurora-Lakewood, CO 9,143 9,117 8,447 9,020 9,265 700.4 686.4 624.1 652.7 670.4Detroit-Warren-Dearborn, MI 19,161 17,460 16,152 14,822 15,410 867.8 789.8 730.5 670.3 696.9Hartford-West Hartford-East Hartford, CT 3,470 3,301 3,109 3,349 3,226 557.6 529.8 499.0 538.2 518.5Houston-The Woodlands-Sugar Land, TX 20,956 20,858 22,027 22,832 23,828 688.2 672.3 695.0 699.6 730.1Indianapolis-Carmel-Anderson, IN 7,579 8,899 8,149 8,398 7,816 776.3 902.5 816.1 832.9 775.2Jacksonville, FL 5,213 4,812 5,131 5,238 5,637 746.9 680.7 717.4 719.3 774.1Kansas City, MO-KS 7,278 7,295 6,795 6,991 7,108 703.8 701.5 649.2 662.4 673.4Las Vegas-Henderson-Paradise, NV 5,777 5,942 6,571 6,486 6,885 590.2 597.1 650.5 627.4 666.0Los Angeles-Long Beach-Anaheim, CA 38,802 39,470 38,456 40,401 42,385 592.0 597.1 578.5 600.7 630.2Louisville-Jefferson County, KY-IN 4,745 4,884 4,574 4,827 4,686 744.1 762.7 708.1 742.6 721.0Memphis, TN-MS-AR 8,767 9,367 7,717 7,758 7,238 1,263.3 1,342.7 1,105.5 1,109.2 1,034.8Miami-Fort Lauderdale-West Palm Beach, FL 13,815 14,692 15,645 16,473 17,461 473.5 495.4 521.9 539.6 571.9Milwaukee-Waukesha-West Allis, WI 8,397 7,760 7,463 7,183 7,242 1,047.4 964.7 926.6 890.0 897.3Minneapolis-St. Paul-Bloomington, MN-WI 8,371 8,326 8,293 8,957 9,497 488.7 481.1 474.2 507.0 537.6Nashville-Davidson-Murfreesboro-Franklin, TN 4,942 4,928 5,084 5,278 5,322 568.7 557.8 565.0 574.5 579.3New Orleans-Metairie, LA 6,056 5,326 6,062 6,301 6,710 972.3 843.9 948.7 975.3 1,038.6New York-Newark-Jersey City, NY-NJ-PA 65,988 63,588 60,539 62,097 62,905 648.2 620.5 587.7 598.4 606.2Oklahoma City, OK 3,518 3,951 4,430 5,255 5,420 543.3 601.6 662.5 775.0 799.4Orlando-Kissimmee-Sanford, FL 6,993 7,373 7,503 8,021 8,505 631.1 649.6 648.3 675.8 716.6Philadelphia-Camden-Wilmington, PA-NJ-DE-MD 23,928 24,166 23,532 22,317 22,967 772.0 776.5 754.4 713.7 734.5Phoenix-Mesa-Scottsdale, AZ 12,696 14,396 14,206 14,841 14,607 592.8 661.6 642.4 656.9 646.5Pittsburgh, PA 5,963 6,325 6,046 5,509 5,681 489.5 519.7 497.4 454.6 468.8Portland-Vancouver-Hillsboro, OR-WA 5,824 5,359 5,809 6,158 6,559 508.8 462.8 496.1 518.4 552.2Providence-Warwick, RI-MA 4,022 4,256 4,124 3,945 3,989 486.9 515.3 498.7 475.6 480.9Raleigh, NC 3,951 3,691 3,490 3,502 4,685 663.4 606.8 561.5 550.1 735.9Richmond, VA 5,599 5,083 4,792 5,311 5,330 889.1 798.4 744.7 815.9 818.8Riverside-San Bernardino-Ontario, CA 15,241 15,296 14,536 13,988 14,693 704.9 700.5 661.1 626.6 658.2Sacramento-Roseville-Arden-Arcade, CA 7,874 7,122 6,915 6,686 7,284 709.9 635.9 611.8 583.6 635.8Salt Lake City, UT 2,517 2,679 2,541 2,873 3,067 457.0 479.6 448.0 500.3 534.1San Antonio-New Braunfels, TX 9,286 9,436 9,576 8,158 10,005 832.0 832.1 829.5 690.9 847.4San Diego-Carlsbad, CA 10,395 11,102 9,684 10,211 11,154 664.9 702.5 606.3 628.9 687.0San Francisco-Oakland-Hayward, CA 11,733 10,391 10,845 11,509 12,508 527.7 460.5 474.3 494.3 537.2San Jose-Sunnyvale-Santa Clara, CA 4,187 3,260 4,530 4,100 4,328 450.7 345.9 474.6 422.3 445.8Seattle-Tacoma-Bellevue, WA 8,259 8,460 8,411 8,751 9,306 470.9 474.8 465.4 476.5 506.7St. Louis, MO-IL 11,077 10,351 10,364 10,271 10,158 769.0 717.8 717.6 709.9 702.1Tampa-St. Petersburg-Clearwater, FL 8,913 8,738 8,948 9,066 9,269 612.5 596.5 604.2 602.5 616.0Virginia Beach-Norfolk-Newport News, VA-NC 9,798 8,771 8,259 8,425 7,677 1,141.0 1,015.2 952.5 966.9 881.1Washington-Arlington-Alexandria, DC-VA-MD-WV 15,946 16,349 15,768 12,501 12,517 540.4 544.5 518.1 405.0 405.5SELECTED MSAs TOTAL 575,649 570,494 549,975 559,361 577,004 665.7 653.1 623.8 626.7 646.4
* MSAs were selected on the basis of the largest population in the 2010 U.S. Census.NOTE: Cases reported with unknown sex are not included in this table.
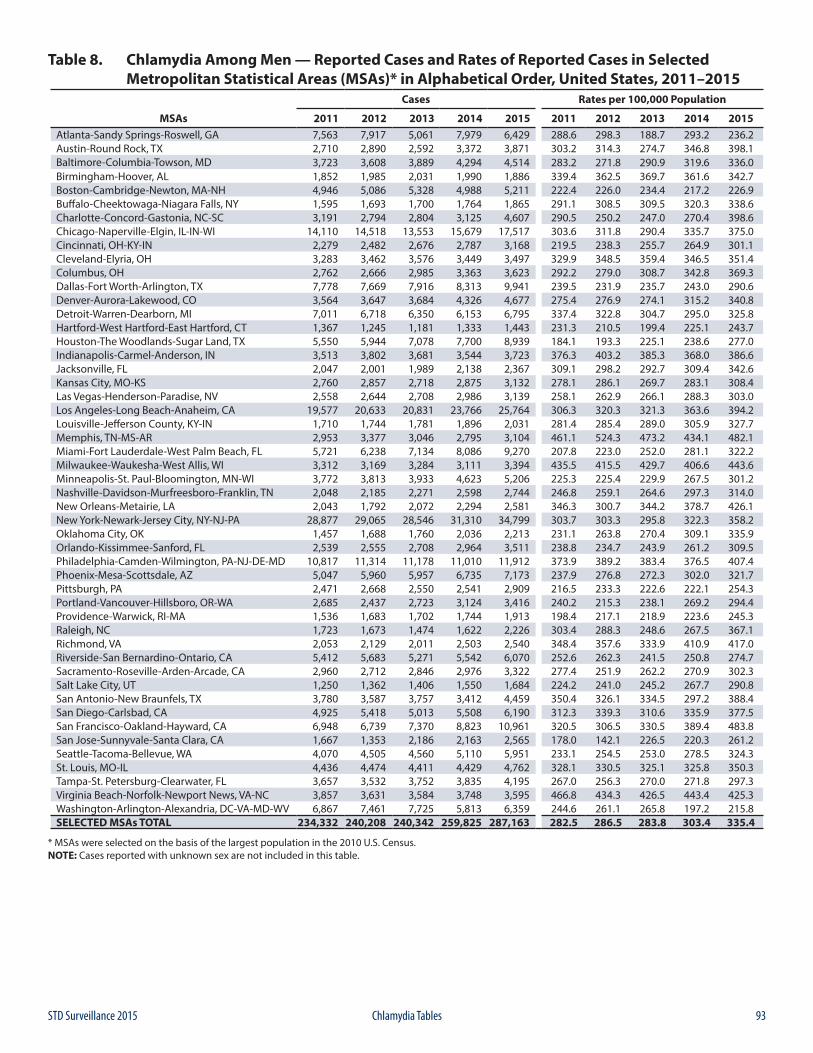
93STD Surveillance 2015 Chlamydia Tables
Table 8. Chlamydia Among Men — Reported Cases and Rates of Reported Cases in Selected Metropolitan Statistical Areas (MSAs)* in Alphabetical Order, United States, 2011–2015
Cases Rates per 100,000 Population
MSAs 2011 2012 2013 2014 2015 2011 2012 2013 2014 2015Atlanta-Sandy Springs-Roswell, GA 7,563 7,917 5,061 7,979 6,429 288.6 298.3 188.7 293.2 236.2Austin-Round Rock, TX 2,710 2,890 2,592 3,372 3,871 303.2 314.3 274.7 346.8 398.1Baltimore-Columbia-Towson, MD 3,723 3,608 3,889 4,294 4,514 283.2 271.8 290.9 319.6 336.0Birmingham-Hoover, AL 1,852 1,985 2,031 1,990 1,886 339.4 362.5 369.7 361.6 342.7Boston-Cambridge-Newton, MA-NH 4,946 5,086 5,328 4,988 5,211 222.4 226.0 234.4 217.2 226.9Buffalo-Cheektowaga-Niagara Falls, NY 1,595 1,693 1,700 1,764 1,865 291.1 308.5 309.5 320.3 338.6Charlotte-Concord-Gastonia, NC-SC 3,191 2,794 2,804 3,125 4,607 290.5 250.2 247.0 270.4 398.6Chicago-Naperville-Elgin, IL-IN-WI 14,110 14,518 13,553 15,679 17,517 303.6 311.8 290.4 335.7 375.0Cincinnati, OH-KY-IN 2,279 2,482 2,676 2,787 3,168 219.5 238.3 255.7 264.9 301.1Cleveland-Elyria, OH 3,283 3,462 3,576 3,449 3,497 329.9 348.5 359.4 346.5 351.4Columbus, OH 2,762 2,666 2,985 3,363 3,623 292.2 279.0 308.7 342.8 369.3Dallas-Fort Worth-Arlington, TX 7,778 7,669 7,916 8,313 9,941 239.5 231.9 235.7 243.0 290.6Denver-Aurora-Lakewood, CO 3,564 3,647 3,684 4,326 4,677 275.4 276.9 274.1 315.2 340.8Detroit-Warren-Dearborn, MI 7,011 6,718 6,350 6,153 6,795 337.4 322.8 304.7 295.0 325.8Hartford-West Hartford-East Hartford, CT 1,367 1,245 1,181 1,333 1,443 231.3 210.5 199.4 225.1 243.7Houston-The Woodlands-Sugar Land, TX 5,550 5,944 7,078 7,700 8,939 184.1 193.3 225.1 238.6 277.0Indianapolis-Carmel-Anderson, IN 3,513 3,802 3,681 3,544 3,723 376.3 403.2 385.3 368.0 386.6Jacksonville, FL 2,047 2,001 1,989 2,138 2,367 309.1 298.2 292.7 309.4 342.6Kansas City, MO-KS 2,760 2,857 2,718 2,875 3,132 278.1 286.1 269.7 283.1 308.4Las Vegas-Henderson-Paradise, NV 2,558 2,644 2,708 2,986 3,139 258.1 262.9 266.1 288.3 303.0Los Angeles-Long Beach-Anaheim, CA 19,577 20,633 20,831 23,766 25,764 306.3 320.3 321.3 363.6 394.2Louisville-Jefferson County, KY-IN 1,710 1,744 1,781 1,896 2,031 281.4 285.4 289.0 305.9 327.7Memphis, TN-MS-AR 2,953 3,377 3,046 2,795 3,104 461.1 524.3 473.2 434.1 482.1Miami-Fort Lauderdale-West Palm Beach, FL 5,721 6,238 7,134 8,086 9,270 207.8 223.0 252.0 281.1 322.2Milwaukee-Waukesha-West Allis, WI 3,312 3,169 3,284 3,111 3,394 435.5 415.5 429.7 406.6 443.6Minneapolis-St. Paul-Bloomington, MN-WI 3,772 3,813 3,933 4,623 5,206 225.3 225.4 229.9 267.5 301.2Nashville-Davidson-Murfreesboro-Franklin, TN 2,048 2,185 2,271 2,598 2,744 246.8 259.1 264.6 297.3 314.0New Orleans-Metairie, LA 2,043 1,792 2,072 2,294 2,581 346.3 300.7 344.2 378.7 426.1New York-Newark-Jersey City, NY-NJ-PA 28,877 29,065 28,546 31,310 34,799 303.7 303.3 295.8 322.3 358.2Oklahoma City, OK 1,457 1,688 1,760 2,036 2,213 231.1 263.8 270.4 309.1 335.9Orlando-Kissimmee-Sanford, FL 2,539 2,555 2,708 2,964 3,511 238.8 234.7 243.9 261.2 309.5Philadelphia-Camden-Wilmington, PA-NJ-DE-MD 10,817 11,314 11,178 11,010 11,912 373.9 389.2 383.4 376.5 407.4Phoenix-Mesa-Scottsdale, AZ 5,047 5,960 5,957 6,735 7,173 237.9 276.8 272.3 302.0 321.7Pittsburgh, PA 2,471 2,668 2,550 2,541 2,909 216.5 233.3 222.6 222.1 254.3Portland-Vancouver-Hillsboro, OR-WA 2,685 2,437 2,723 3,124 3,416 240.2 215.3 238.1 269.2 294.4Providence-Warwick, RI-MA 1,536 1,683 1,702 1,744 1,913 198.4 217.1 218.9 223.6 245.3Raleigh, NC 1,723 1,673 1,474 1,622 2,226 303.4 288.3 248.6 267.5 367.1Richmond, VA 2,053 2,129 2,011 2,503 2,540 348.4 357.6 333.9 410.9 417.0Riverside-San Bernardino-Ontario, CA 5,412 5,683 5,271 5,542 6,070 252.6 262.3 241.5 250.8 274.7Sacramento-Roseville-Arden-Arcade, CA 2,960 2,712 2,846 2,976 3,322 277.4 251.9 262.2 270.9 302.3Salt Lake City, UT 1,250 1,362 1,406 1,550 1,684 224.2 241.0 245.2 267.7 290.8San Antonio-New Braunfels, TX 3,780 3,587 3,757 3,412 4,459 350.4 326.1 334.5 297.2 388.4San Diego-Carlsbad, CA 4,925 5,418 5,013 5,508 6,190 312.3 339.3 310.6 335.9 377.5San Francisco-Oakland-Hayward, CA 6,948 6,739 7,370 8,823 10,961 320.5 306.5 330.5 389.4 483.8San Jose-Sunnyvale-Santa Clara, CA 1,667 1,353 2,186 2,163 2,565 178.0 142.1 226.5 220.3 261.2Seattle-Tacoma-Bellevue, WA 4,070 4,505 4,560 5,110 5,951 233.1 254.5 253.0 278.5 324.3St. Louis, MO-IL 4,436 4,474 4,411 4,429 4,762 328.1 330.5 325.1 325.8 350.3Tampa-St. Petersburg-Clearwater, FL 3,657 3,532 3,752 3,835 4,195 267.0 256.3 270.0 271.8 297.3Virginia Beach-Norfolk-Newport News, VA-NC 3,857 3,631 3,584 3,748 3,595 466.8 434.3 426.5 443.4 425.3Washington-Arlington-Alexandria, DC-VA-MD-WV 6,867 7,461 7,725 5,813 6,359 244.6 261.1 265.8 197.2 215.8SELECTED MSAs TOTAL 234,332 240,208 240,342 259,825 287,163 282.5 286.5 283.8 303.4 335.4
* MSAs were selected on the basis of the largest population in the 2010 U.S. Census.NOTE: Cases reported with unknown sex are not included in this table.
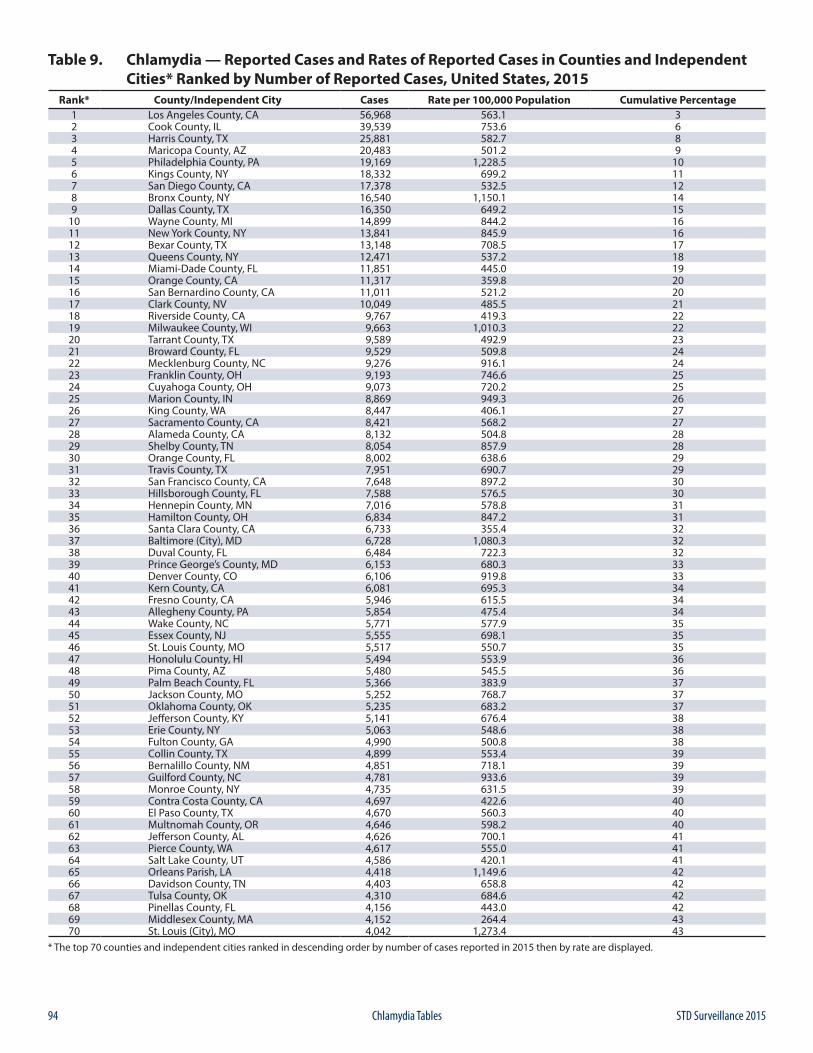
94 STD Surveillance 2015Chlamydia Tables
Table 9. Chlamydia — Reported Cases and Rates of Reported Cases in Counties and Independent Cities* Ranked by Number of Reported Cases, United States, 2015
Rank* County/Independent City Cases Rate per 100,000 Population Cumulative Percentage1 Los Angeles County, CA 56,968 563.1 32 Cook County, IL 39,539 753.6 63 Harris County, TX 25,881 582.7 84 Maricopa County, AZ 20,483 501.2 95 Philadelphia County, PA 19,169 1,228.5 106 Kings County, NY 18,332 699.2 117 San Diego County, CA 17,378 532.5 128 Bronx County, NY 16,540 1,150.1 149 Dallas County, TX 16,350 649.2 15
10 Wayne County, MI 14,899 844.2 1611 New York County, NY 13,841 845.9 1612 Bexar County, TX 13,148 708.5 1713 Queens County, NY 12,471 537.2 1814 Miami-Dade County, FL 11,851 445.0 1915 Orange County, CA 11,317 359.8 2016 San Bernardino County, CA 11,011 521.2 2017 Clark County, NV 10,049 485.5 2118 Riverside County, CA 9,767 419.3 2219 Milwaukee County, WI 9,663 1,010.3 2220 Tarrant County, TX 9,589 492.9 2321 Broward County, FL 9,529 509.8 2422 Mecklenburg County, NC 9,276 916.1 2423 Franklin County, OH 9,193 746.6 2524 Cuyahoga County, OH 9,073 720.2 2525 Marion County, IN 8,869 949.3 2626 King County, WA 8,447 406.1 2727 Sacramento County, CA 8,421 568.2 2728 Alameda County, CA 8,132 504.8 2829 Shelby County, TN 8,054 857.9 2830 Orange County, FL 8,002 638.6 2931 Travis County, TX 7,951 690.7 2932 San Francisco County, CA 7,648 897.2 3033 Hillsborough County, FL 7,588 576.5 3034 Hennepin County, MN 7,016 578.8 3135 Hamilton County, OH 6,834 847.2 3136 Santa Clara County, CA 6,733 355.4 3237 Baltimore (City), MD 6,728 1,080.3 3238 Duval County, FL 6,484 722.3 3239 Prince George’s County, MD 6,153 680.3 3340 Denver County, CO 6,106 919.8 3341 Kern County, CA 6,081 695.3 3442 Fresno County, CA 5,946 615.5 3443 Allegheny County, PA 5,854 475.4 3444 Wake County, NC 5,771 577.9 3545 Essex County, NJ 5,555 698.1 3546 St. Louis County, MO 5,517 550.7 3547 Honolulu County, HI 5,494 553.9 3648 Pima County, AZ 5,480 545.5 3649 Palm Beach County, FL 5,366 383.9 3750 Jackson County, MO 5,252 768.7 3751 Oklahoma County, OK 5,235 683.2 3752 Jefferson County, KY 5,141 676.4 3853 Erie County, NY 5,063 548.6 3854 Fulton County, GA 4,990 500.8 3855 Collin County, TX 4,899 553.4 3956 Bernalillo County, NM 4,851 718.1 3957 Guilford County, NC 4,781 933.6 3958 Monroe County, NY 4,735 631.5 3959 Contra Costa County, CA 4,697 422.6 4060 El Paso County, TX 4,670 560.3 4061 Multnomah County, OR 4,646 598.2 4062 Jefferson County, AL 4,626 700.1 4163 Pierce County, WA 4,617 555.0 4164 Salt Lake County, UT 4,586 420.1 4165 Orleans Parish, LA 4,418 1,149.6 4266 Davidson County, TN 4,403 658.8 4267 Tulsa County, OK 4,310 684.6 4268 Pinellas County, FL 4,156 443.0 4269 Middlesex County, MA 4,152 264.4 4370 St. Louis (City), MO 4,042 1,273.4 43
* The top 70 counties and independent cities ranked in descending order by number of cases reported in 2015 then by rate are displayed.
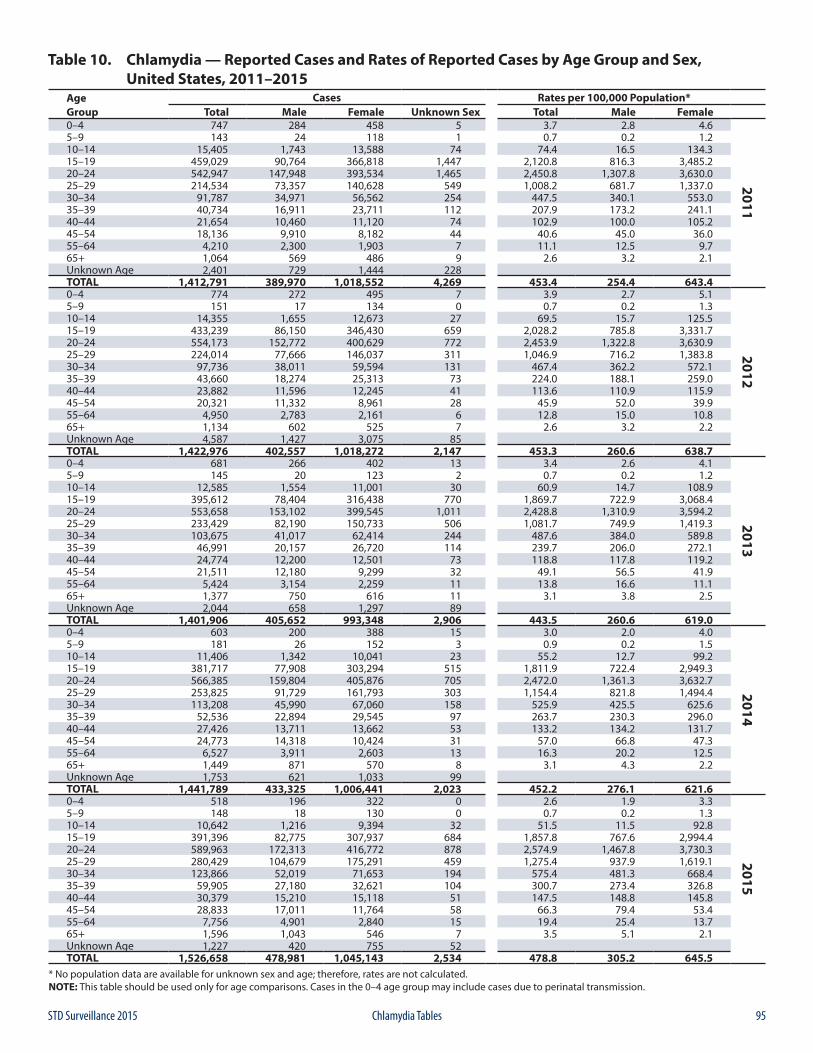
95STD Surveillance 2015 Chlamydia Tables
Table 10. Chlamydia — Reported Cases and Rates of Reported Cases by Age Group and Sex, United States, 2011–2015
Age Cases Rates per 100,000 Population*Group Total Male Female Unknown Sex Total Male Female0–4 747 284 458 5 3.7 2.8 4.6
2011
5–9 143 24 118 1 0.7 0.2 1.210–14 15,405 1,743 13,588 74 74.4 16.5 134.315–19 459,029 90,764 366,818 1,447 2,120.8 816.3 3,485.220–24 542,947 147,948 393,534 1,465 2,450.8 1,307.8 3,630.025–29 214,534 73,357 140,628 549 1,008.2 681.7 1,337.030–34 91,787 34,971 56,562 254 447.5 340.1 553.035–39 40,734 16,911 23,711 112 207.9 173.2 241.140–44 21,654 10,460 11,120 74 102.9 100.0 105.245–54 18,136 9,910 8,182 44 40.6 45.0 36.055–64 4,210 2,300 1,903 7 11.1 12.5 9.765+ 1,064 569 486 9 2.6 3.2 2.1Unknown Age 2,401 729 1,444 228TOTAL 1,412,791 389,970 1,018,552 4,269 453.4 254.4 643.40–4 774 272 495 7 3.9 2.7 5.1
2012
5–9 151 17 134 0 0.7 0.2 1.310–14 14,355 1,655 12,673 27 69.5 15.7 125.515–19 433,239 86,150 346,430 659 2,028.2 785.8 3,331.720–24 554,173 152,772 400,629 772 2,453.9 1,322.8 3,630.925–29 224,014 77,666 146,037 311 1,046.9 716.2 1,383.830–34 97,736 38,011 59,594 131 467.4 362.2 572.135–39 43,660 18,274 25,313 73 224.0 188.1 259.040–44 23,882 11,596 12,245 41 113.6 110.9 115.945–54 20,321 11,332 8,961 28 45.9 52.0 39.955–64 4,950 2,783 2,161 6 12.8 15.0 10.865+ 1,134 602 525 7 2.6 3.2 2.2Unknown Age 4,587 1,427 3,075 85TOTAL 1,422,976 402,557 1,018,272 2,147 453.3 260.6 638.70–4 681 266 402 13 3.4 2.6 4.1
2013
5–9 145 20 123 2 0.7 0.2 1.210–14 12,585 1,554 11,001 30 60.9 14.7 108.915–19 395,612 78,404 316,438 770 1,869.7 722.9 3,068.420–24 553,658 153,102 399,545 1,011 2,428.8 1,310.9 3,594.225–29 233,429 82,190 150,733 506 1,081.7 749.9 1,419.330–34 103,675 41,017 62,414 244 487.6 384.0 589.835–39 46,991 20,157 26,720 114 239.7 206.0 272.140–44 24,774 12,200 12,501 73 118.8 117.8 119.245–54 21,511 12,180 9,299 32 49.1 56.5 41.955–64 5,424 3,154 2,259 11 13.8 16.6 11.165+ 1,377 750 616 11 3.1 3.8 2.5Unknown Age 2,044 658 1,297 89TOTAL 1,401,906 405,652 993,348 2,906 443.5 260.6 619.00–4 603 200 388 15 3.0 2.0 4.0
2014
5–9 181 26 152 3 0.9 0.2 1.510–14 11,406 1,342 10,041 23 55.2 12.7 99.215–19 381,717 77,908 303,294 515 1,811.9 722.4 2,949.320–24 566,385 159,804 405,876 705 2,472.0 1,361.3 3,632.725–29 253,825 91,729 161,793 303 1,154.4 821.8 1,494.430–34 113,208 45,990 67,060 158 525.9 425.5 625.635–39 52,536 22,894 29,545 97 263.7 230.3 296.040–44 27,426 13,711 13,662 53 133.2 134.2 131.745–54 24,773 14,318 10,424 31 57.0 66.8 47.355–64 6,527 3,911 2,603 13 16.3 20.2 12.565+ 1,449 871 570 8 3.1 4.3 2.2Unknown Age 1,753 621 1,033 99TOTAL 1,441,789 433,325 1,006,441 2,023 452.2 276.1 621.60–4 518 196 322 0 2.6 1.9 3.3
2015
5–9 148 18 130 0 0.7 0.2 1.310–14 10,642 1,216 9,394 32 51.5 11.5 92.815–19 391,396 82,775 307,937 684 1,857.8 767.6 2,994.420–24 589,963 172,313 416,772 878 2,574.9 1,467.8 3,730.325–29 280,429 104,679 175,291 459 1,275.4 937.9 1,619.130–34 123,866 52,019 71,653 194 575.4 481.3 668.435–39 59,905 27,180 32,621 104 300.7 273.4 326.840–44 30,379 15,210 15,118 51 147.5 148.8 145.845–54 28,833 17,011 11,764 58 66.3 79.4 53.455–64 7,756 4,901 2,840 15 19.4 25.4 13.765+ 1,596 1,043 546 7 3.5 5.1 2.1Unknown Age 1,227 420 755 52TOTAL 1,526,658 478,981 1,045,143 2,534 478.8 305.2 645.5
* No population data are available for unknown sex and age; therefore, rates are not calculated.NOTE: This table should be used only for age comparisons. Cases in the 0–4 age group may include cases due to perinatal transmission.
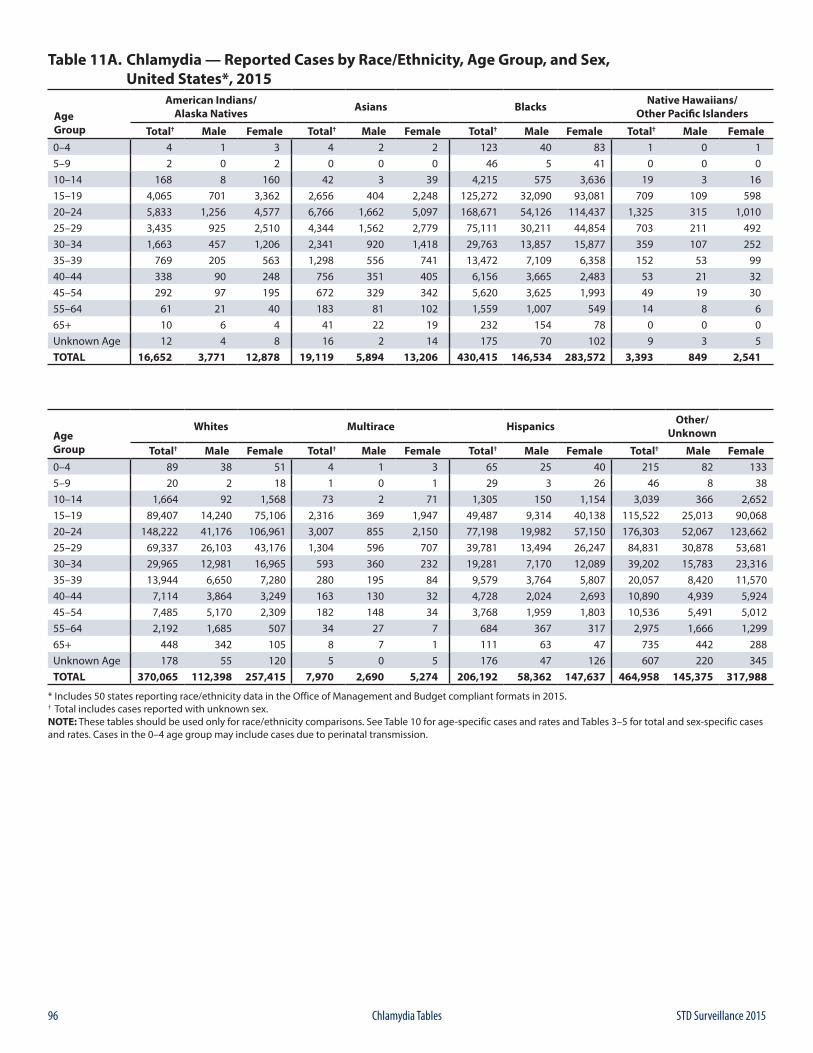
96 STD Surveillance 2015Chlamydia Tables
Table 11A. Chlamydia — Reported Cases by Race/Ethnicity, Age Group, and Sex, United States*, 2015
Age Group
American Indians/Alaska Natives Asians Blacks Native Hawaiians/
Other Pacific Islanders
Total† Male Female Total† Male Female Total† Male Female Total† Male Female0–4 4 1 3 4 2 2 123 40 83 1 0 15–9 2 0 2 0 0 0 46 5 41 0 0 010–14 168 8 160 42 3 39 4,215 575 3,636 19 3 1615–19 4,065 701 3,362 2,656 404 2,248 125,272 32,090 93,081 709 109 59820–24 5,833 1,256 4,577 6,766 1,662 5,097 168,671 54,126 114,437 1,325 315 1,01025–29 3,435 925 2,510 4,344 1,562 2,779 75,111 30,211 44,854 703 211 49230–34 1,663 457 1,206 2,341 920 1,418 29,763 13,857 15,877 359 107 25235–39 769 205 563 1,298 556 741 13,472 7,109 6,358 152 53 9940–44 338 90 248 756 351 405 6,156 3,665 2,483 53 21 3245–54 292 97 195 672 329 342 5,620 3,625 1,993 49 19 3055–64 61 21 40 183 81 102 1,559 1,007 549 14 8 665+ 10 6 4 41 22 19 232 154 78 0 0 0Unknown Age 12 4 8 16 2 14 175 70 102 9 3 5TOTAL 16,652 3,771 12,878 19,119 5,894 13,206 430,415 146,534 283,572 3,393 849 2,541
Age Group
Whites Multirace Hispanics Other/Unknown
Total† Male Female Total† Male Female Total† Male Female Total† Male Female0–4 89 38 51 4 1 3 65 25 40 215 82 1335–9 20 2 18 1 0 1 29 3 26 46 8 3810–14 1,664 92 1,568 73 2 71 1,305 150 1,154 3,039 366 2,65215–19 89,407 14,240 75,106 2,316 369 1,947 49,487 9,314 40,138 115,522 25,013 90,06820–24 148,222 41,176 106,961 3,007 855 2,150 77,198 19,982 57,150 176,303 52,067 123,66225–29 69,337 26,103 43,176 1,304 596 707 39,781 13,494 26,247 84,831 30,878 53,68130–34 29,965 12,981 16,965 593 360 232 19,281 7,170 12,089 39,202 15,783 23,31635–39 13,944 6,650 7,280 280 195 84 9,579 3,764 5,807 20,057 8,420 11,57040–44 7,114 3,864 3,249 163 130 32 4,728 2,024 2,693 10,890 4,939 5,92445–54 7,485 5,170 2,309 182 148 34 3,768 1,959 1,803 10,536 5,491 5,01255–64 2,192 1,685 507 34 27 7 684 367 317 2,975 1,666 1,29965+ 448 342 105 8 7 1 111 63 47 735 442 288Unknown Age 178 55 120 5 0 5 176 47 126 607 220 345TOTAL 370,065 112,398 257,415 7,970 2,690 5,274 206,192 58,362 147,637 464,958 145,375 317,988
* Includes 50 states reporting race/ethnicity data in the Office of Management and Budget compliant formats in 2015.† Total includes cases reported with unknown sex.NOTE: These tables should be used only for race/ethnicity comparisons. See Table 10 for age-specific cases and rates and Tables 3–5 for total and sex-specific cases and rates. Cases in the 0–4 age group may include cases due to perinatal transmission.
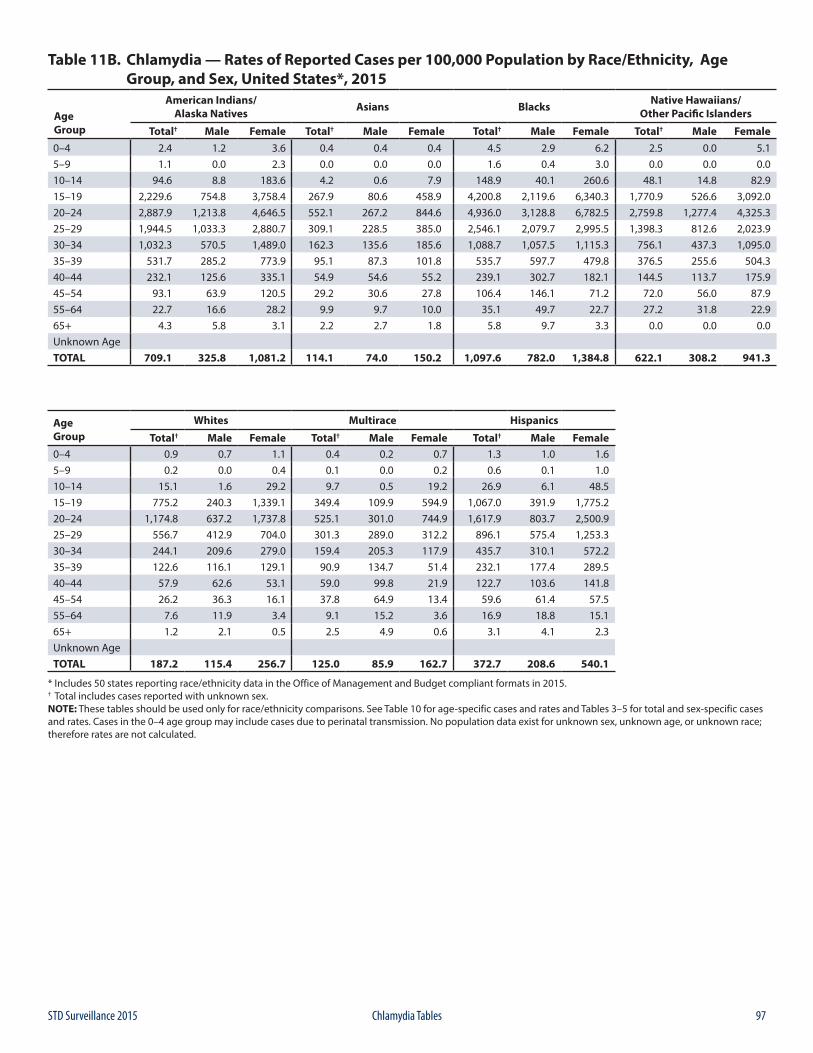
97STD Surveillance 2015 Chlamydia Tables
Table 11B. Chlamydia — Rates of Reported Cases per 100,000 Population by Race/Ethnicity, Age Group, and Sex, United States*, 2015
Age Group
American Indians/Alaska Natives Asians Blacks Native Hawaiians/
Other Pacific Islanders
Total† Male Female Total† Male Female Total† Male Female Total† Male Female0–4 2.4 1.2 3.6 0.4 0.4 0.4 4.5 2.9 6.2 2.5 0.0 5.15–9 1.1 0.0 2.3 0.0 0.0 0.0 1.6 0.4 3.0 0.0 0.0 0.010–14 94.6 8.8 183.6 4.2 0.6 7.9 148.9 40.1 260.6 48.1 14.8 82.915–19 2,229.6 754.8 3,758.4 267.9 80.6 458.9 4,200.8 2,119.6 6,340.3 1,770.9 526.6 3,092.020–24 2,887.9 1,213.8 4,646.5 552.1 267.2 844.6 4,936.0 3,128.8 6,782.5 2,759.8 1,277.4 4,325.325–29 1,944.5 1,033.3 2,880.7 309.1 228.5 385.0 2,546.1 2,079.7 2,995.5 1,398.3 812.6 2,023.930–34 1,032.3 570.5 1,489.0 162.3 135.6 185.6 1,088.7 1,057.5 1,115.3 756.1 437.3 1,095.035–39 531.7 285.2 773.9 95.1 87.3 101.8 535.7 597.7 479.8 376.5 255.6 504.340–44 232.1 125.6 335.1 54.9 54.6 55.2 239.1 302.7 182.1 144.5 113.7 175.945–54 93.1 63.9 120.5 29.2 30.6 27.8 106.4 146.1 71.2 72.0 56.0 87.955–64 22.7 16.6 28.2 9.9 9.7 10.0 35.1 49.7 22.7 27.2 31.8 22.965+ 4.3 5.8 3.1 2.2 2.7 1.8 5.8 9.7 3.3 0.0 0.0 0.0Unknown AgeTOTAL 709.1 325.8 1,081.2 114.1 74.0 150.2 1,097.6 782.0 1,384.8 622.1 308.2 941.3
Age Group
Whites Multirace Hispanics
Total† Male Female Total† Male Female Total† Male Female0–4 0.9 0.7 1.1 0.4 0.2 0.7 1.3 1.0 1.65–9 0.2 0.0 0.4 0.1 0.0 0.2 0.6 0.1 1.010–14 15.1 1.6 29.2 9.7 0.5 19.2 26.9 6.1 48.515–19 775.2 240.3 1,339.1 349.4 109.9 594.9 1,067.0 391.9 1,775.220–24 1,174.8 637.2 1,737.8 525.1 301.0 744.9 1,617.9 803.7 2,500.925–29 556.7 412.9 704.0 301.3 289.0 312.2 896.1 575.4 1,253.330–34 244.1 209.6 279.0 159.4 205.3 117.9 435.7 310.1 572.235–39 122.6 116.1 129.1 90.9 134.7 51.4 232.1 177.4 289.540–44 57.9 62.6 53.1 59.0 99.8 21.9 122.7 103.6 141.845–54 26.2 36.3 16.1 37.8 64.9 13.4 59.6 61.4 57.555–64 7.6 11.9 3.4 9.1 15.2 3.6 16.9 18.8 15.165+ 1.2 2.1 0.5 2.5 4.9 0.6 3.1 4.1 2.3Unknown AgeTOTAL 187.2 115.4 256.7 125.0 85.9 162.7 372.7 208.6 540.1
* Includes 50 states reporting race/ethnicity data in the Office of Management and Budget compliant formats in 2015.† Total includes cases reported with unknown sex.NOTE: These tables should be used only for race/ethnicity comparisons. See Table 10 for age-specific cases and rates and Tables 3–5 for total and sex-specific cases and rates. Cases in the 0–4 age group may include cases due to perinatal transmission. No population data exist for unknown sex, unknown age, or unknown race; therefore rates are not calculated.
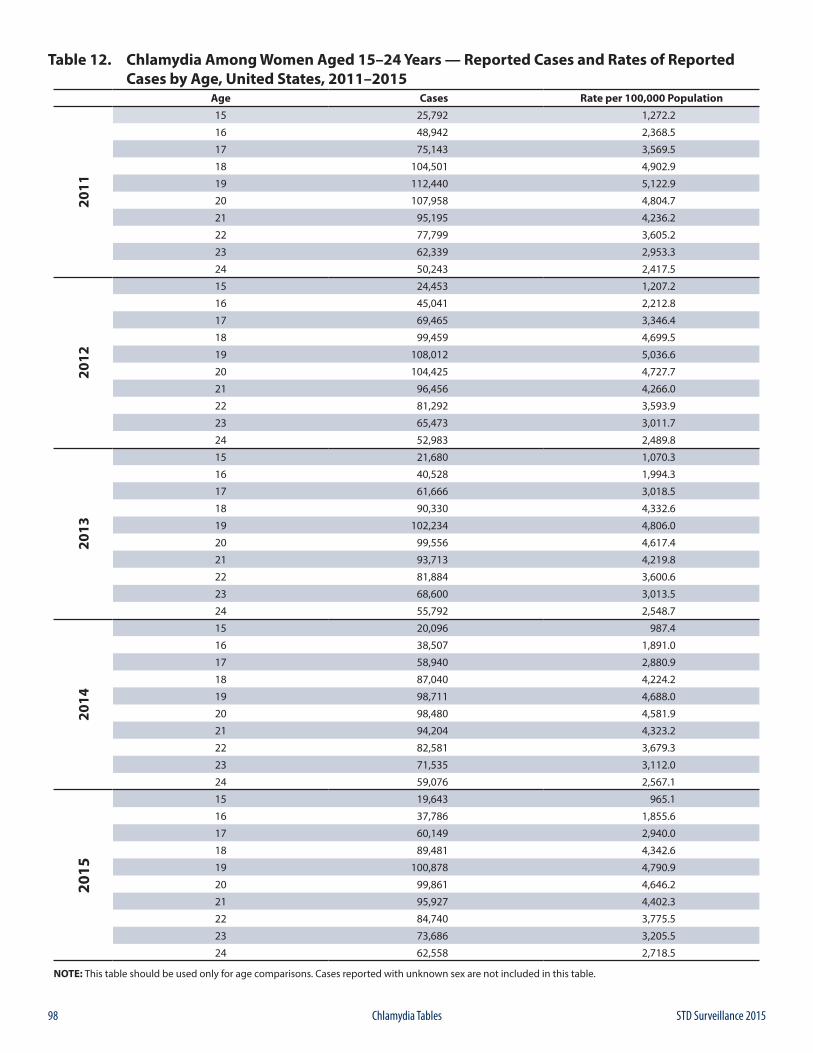
98 STD Surveillance 2015Chlamydia Tables
Table 12. Chlamydia Among Women Aged 15–24 Years — Reported Cases and Rates of Reported Cases by Age, United States, 2011–2015
Age Cases Rate per 100,000 Population20
11
15 25,792 1,272.2
16 48,942 2,368.5
17 75,143 3,569.5
18 104,501 4,902.9
19 112,440 5,122.9
20 107,958 4,804.7
21 95,195 4,236.2
22 77,799 3,605.2
23 62,339 2,953.3
24 50,243 2,417.5
2012
15 24,453 1,207.2
16 45,041 2,212.8
17 69,465 3,346.4
18 99,459 4,699.5
19 108,012 5,036.6
20 104,425 4,727.7
21 96,456 4,266.0
22 81,292 3,593.9
23 65,473 3,011.7
24 52,983 2,489.8
2013
15 21,680 1,070.3
16 40,528 1,994.3
17 61,666 3,018.5
18 90,330 4,332.6
19 102,234 4,806.0
20 99,556 4,617.4
21 93,713 4,219.8
22 81,884 3,600.6
23 68,600 3,013.5
24 55,792 2,548.7
2014
15 20,096 987.4
16 38,507 1,891.0
17 58,940 2,880.9
18 87,040 4,224.2
19 98,711 4,688.0
20 98,480 4,581.9
21 94,204 4,323.2
22 82,581 3,679.3
23 71,535 3,112.0
24 59,076 2,567.1
2015
15 19,643 965.1
16 37,786 1,855.6
17 60,149 2,940.0
18 89,481 4,342.6
19 100,878 4,790.9
20 99,861 4,646.2
21 95,927 4,402.3
22 84,740 3,775.5
23 73,686 3,205.5
24 62,558 2,718.5
NOTE: This table should be used only for age comparisons. Cases reported with unknown sex are not included in this table.
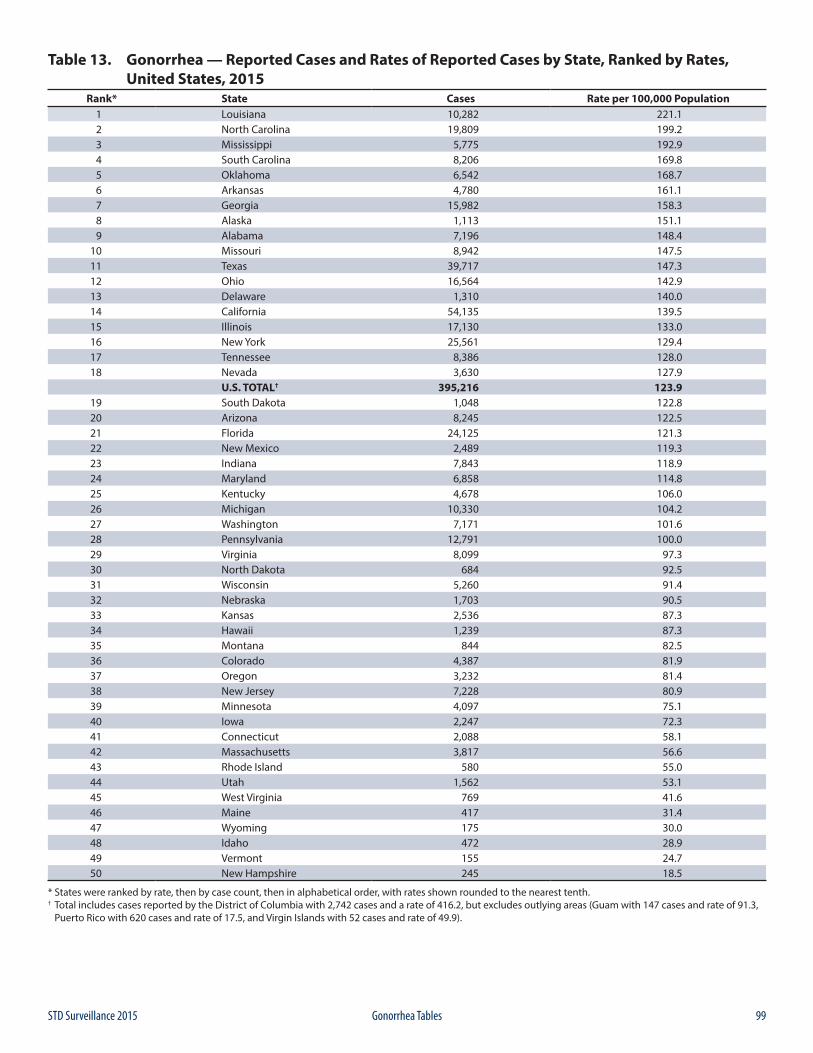
99STD Surveillance 2015 Gonorrhea Tables
Table 13. Gonorrhea — Reported Cases and Rates of Reported Cases by State, Ranked by Rates, United States, 2015
Rank* State Cases Rate per 100,000 Population1 Louisiana 10,282 221.12 North Carolina 19,809 199.23 Mississippi 5,775 192.94 South Carolina 8,206 169.85 Oklahoma 6,542 168.76 Arkansas 4,780 161.17 Georgia 15,982 158.38 Alaska 1,113 151.19 Alabama 7,196 148.4
10 Missouri 8,942 147.511 Texas 39,717 147.312 Ohio 16,564 142.913 Delaware 1,310 140.014 California 54,135 139.515 Illinois 17,130 133.016 New York 25,561 129.417 Tennessee 8,386 128.018 Nevada 3,630 127.9
U.S. TOTAL† 395,216 123.919 South Dakota 1,048 122.820 Arizona 8,245 122.521 Florida 24,125 121.322 New Mexico 2,489 119.323 Indiana 7,843 118.924 Maryland 6,858 114.825 Kentucky 4,678 106.026 Michigan 10,330 104.227 Washington 7,171 101.628 Pennsylvania 12,791 100.029 Virginia 8,099 97.330 North Dakota 684 92.531 Wisconsin 5,260 91.432 Nebraska 1,703 90.533 Kansas 2,536 87.334 Hawaii 1,239 87.335 Montana 844 82.536 Colorado 4,387 81.937 Oregon 3,232 81.438 New Jersey 7,228 80.939 Minnesota 4,097 75.140 Iowa 2,247 72.341 Connecticut 2,088 58.142 Massachusetts 3,817 56.643 Rhode Island 580 55.044 Utah 1,562 53.145 West Virginia 769 41.646 Maine 417 31.447 Wyoming 175 30.048 Idaho 472 28.949 Vermont 155 24.750 New Hampshire 245 18.5
* States were ranked by rate, then by case count, then in alphabetical order, with rates shown rounded to the nearest tenth.† Total includes cases reported by the District of Columbia with 2,742 cases and a rate of 416.2, but excludes outlying areas (Guam with 147 cases and rate of 91.3, Puerto Rico with 620 cases and rate of 17.5, and Virgin Islands with 52 cases and rate of 49.9).
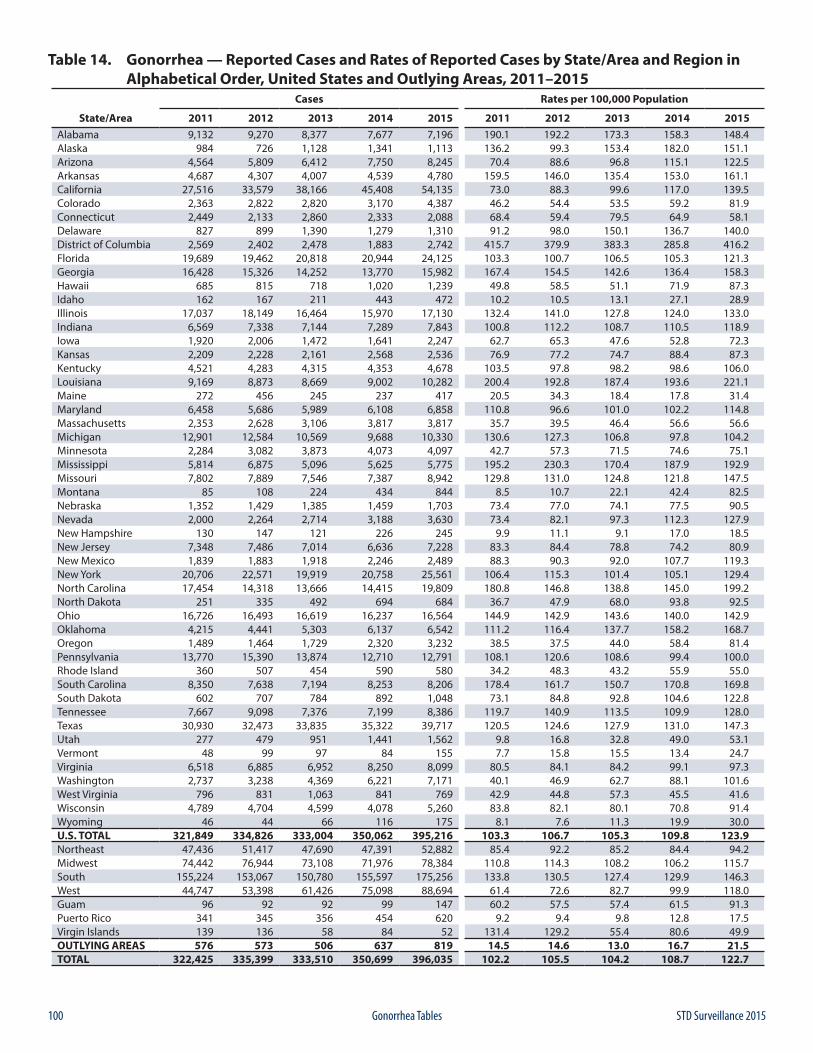
100 STD Surveillance 2015Gonorrhea Tables
Table 14. Gonorrhea — Reported Cases and Rates of Reported Cases by State/Area and Region in Alphabetical Order, United States and Outlying Areas, 2011–2015
Cases Rates per 100,000 Population
State/Area 2011 2012 2013 2014 2015 2011 2012 2013 2014 2015Alabama 9,132 9,270 8,377 7,677 7,196 190.1 192.2 173.3 158.3 148.4Alaska 984 726 1,128 1,341 1,113 136.2 99.3 153.4 182.0 151.1Arizona 4,564 5,809 6,412 7,750 8,245 70.4 88.6 96.8 115.1 122.5Arkansas 4,687 4,307 4,007 4,539 4,780 159.5 146.0 135.4 153.0 161.1California 27,516 33,579 38,166 45,408 54,135 73.0 88.3 99.6 117.0 139.5Colorado 2,363 2,822 2,820 3,170 4,387 46.2 54.4 53.5 59.2 81.9Connecticut 2,449 2,133 2,860 2,333 2,088 68.4 59.4 79.5 64.9 58.1Delaware 827 899 1,390 1,279 1,310 91.2 98.0 150.1 136.7 140.0District of Columbia 2,569 2,402 2,478 1,883 2,742 415.7 379.9 383.3 285.8 416.2Florida 19,689 19,462 20,818 20,944 24,125 103.3 100.7 106.5 105.3 121.3Georgia 16,428 15,326 14,252 13,770 15,982 167.4 154.5 142.6 136.4 158.3Hawaii 685 815 718 1,020 1,239 49.8 58.5 51.1 71.9 87.3Idaho 162 167 211 443 472 10.2 10.5 13.1 27.1 28.9Illinois 17,037 18,149 16,464 15,970 17,130 132.4 141.0 127.8 124.0 133.0Indiana 6,569 7,338 7,144 7,289 7,843 100.8 112.2 108.7 110.5 118.9Iowa 1,920 2,006 1,472 1,641 2,247 62.7 65.3 47.6 52.8 72.3Kansas 2,209 2,228 2,161 2,568 2,536 76.9 77.2 74.7 88.4 87.3Kentucky 4,521 4,283 4,315 4,353 4,678 103.5 97.8 98.2 98.6 106.0Louisiana 9,169 8,873 8,669 9,002 10,282 200.4 192.8 187.4 193.6 221.1Maine 272 456 245 237 417 20.5 34.3 18.4 17.8 31.4Maryland 6,458 5,686 5,989 6,108 6,858 110.8 96.6 101.0 102.2 114.8Massachusetts 2,353 2,628 3,106 3,817 3,817 35.7 39.5 46.4 56.6 56.6Michigan 12,901 12,584 10,569 9,688 10,330 130.6 127.3 106.8 97.8 104.2Minnesota 2,284 3,082 3,873 4,073 4,097 42.7 57.3 71.5 74.6 75.1Mississippi 5,814 6,875 5,096 5,625 5,775 195.2 230.3 170.4 187.9 192.9Missouri 7,802 7,889 7,546 7,387 8,942 129.8 131.0 124.8 121.8 147.5Montana 85 108 224 434 844 8.5 10.7 22.1 42.4 82.5Nebraska 1,352 1,429 1,385 1,459 1,703 73.4 77.0 74.1 77.5 90.5Nevada 2,000 2,264 2,714 3,188 3,630 73.4 82.1 97.3 112.3 127.9New Hampshire 130 147 121 226 245 9.9 11.1 9.1 17.0 18.5New Jersey 7,348 7,486 7,014 6,636 7,228 83.3 84.4 78.8 74.2 80.9New Mexico 1,839 1,883 1,918 2,246 2,489 88.3 90.3 92.0 107.7 119.3New York 20,706 22,571 19,919 20,758 25,561 106.4 115.3 101.4 105.1 129.4North Carolina 17,454 14,318 13,666 14,415 19,809 180.8 146.8 138.8 145.0 199.2North Dakota 251 335 492 694 684 36.7 47.9 68.0 93.8 92.5Ohio 16,726 16,493 16,619 16,237 16,564 144.9 142.9 143.6 140.0 142.9Oklahoma 4,215 4,441 5,303 6,137 6,542 111.2 116.4 137.7 158.2 168.7Oregon 1,489 1,464 1,729 2,320 3,232 38.5 37.5 44.0 58.4 81.4Pennsylvania 13,770 15,390 13,874 12,710 12,791 108.1 120.6 108.6 99.4 100.0Rhode Island 360 507 454 590 580 34.2 48.3 43.2 55.9 55.0South Carolina 8,350 7,638 7,194 8,253 8,206 178.4 161.7 150.7 170.8 169.8South Dakota 602 707 784 892 1,048 73.1 84.8 92.8 104.6 122.8Tennessee 7,667 9,098 7,376 7,199 8,386 119.7 140.9 113.5 109.9 128.0Texas 30,930 32,473 33,835 35,322 39,717 120.5 124.6 127.9 131.0 147.3Utah 277 479 951 1,441 1,562 9.8 16.8 32.8 49.0 53.1Vermont 48 99 97 84 155 7.7 15.8 15.5 13.4 24.7Virginia 6,518 6,885 6,952 8,250 8,099 80.5 84.1 84.2 99.1 97.3Washington 2,737 3,238 4,369 6,221 7,171 40.1 46.9 62.7 88.1 101.6West Virginia 796 831 1,063 841 769 42.9 44.8 57.3 45.5 41.6Wisconsin 4,789 4,704 4,599 4,078 5,260 83.8 82.1 80.1 70.8 91.4Wyoming 46 44 66 116 175 8.1 7.6 11.3 19.9 30.0U.S. TOTAL 321,849 334,826 333,004 350,062 395,216 103.3 106.7 105.3 109.8 123.9Northeast 47,436 51,417 47,690 47,391 52,882 85.4 92.2 85.2 84.4 94.2Midwest 74,442 76,944 73,108 71,976 78,384 110.8 114.3 108.2 106.2 115.7South 155,224 153,067 150,780 155,597 175,256 133.8 130.5 127.4 129.9 146.3West 44,747 53,398 61,426 75,098 88,694 61.4 72.6 82.7 99.9 118.0Guam 96 92 92 99 147 60.2 57.5 57.4 61.5 91.3Puerto Rico 341 345 356 454 620 9.2 9.4 9.8 12.8 17.5Virgin Islands 139 136 58 84 52 131.4 129.2 55.4 80.6 49.9OUTLYING AREAS 576 573 506 637 819 14.5 14.6 13.0 16.7 21.5TOTAL 322,425 335,399 333,510 350,699 396,035 102.2 105.5 104.2 108.7 122.7
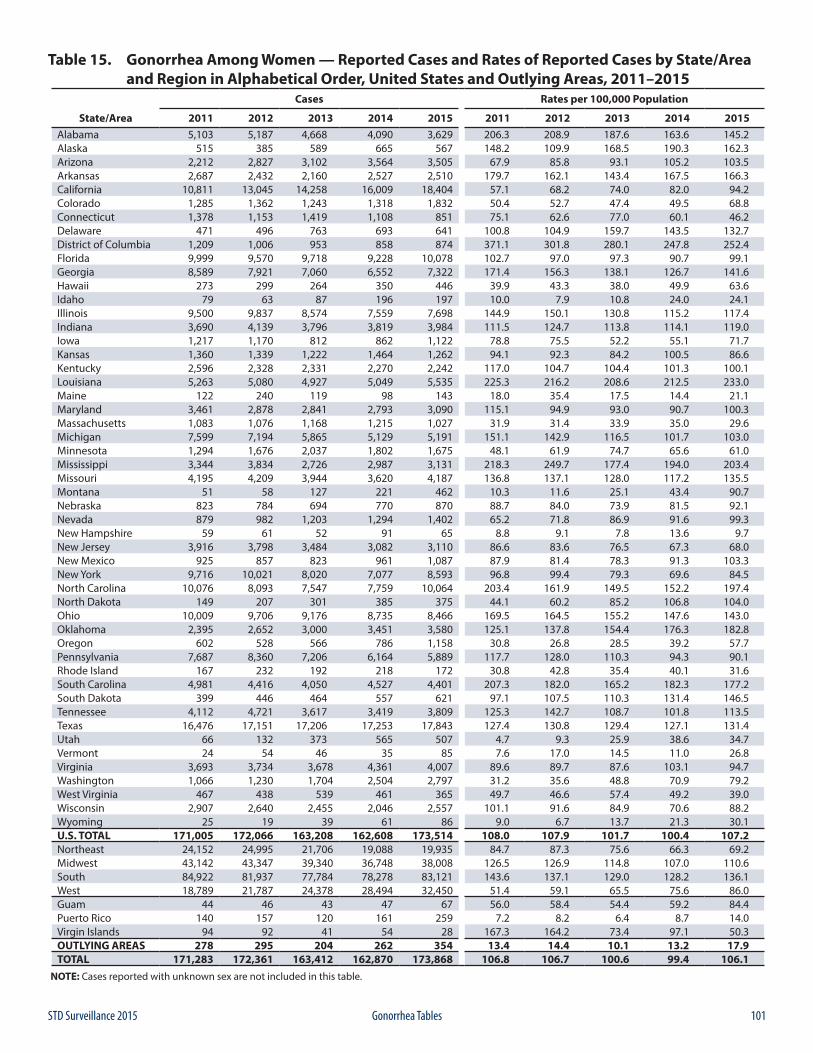
101STD Surveillance 2015 Gonorrhea Tables
Table 15. Gonorrhea Among Women — Reported Cases and Rates of Reported Cases by State/Area and Region in Alphabetical Order, United States and Outlying Areas, 2011–2015
Cases Rates per 100,000 Population
State/Area 2011 2012 2013 2014 2015 2011 2012 2013 2014 2015Alabama 5,103 5,187 4,668 4,090 3,629 206.3 208.9 187.6 163.6 145.2Alaska 515 385 589 665 567 148.2 109.9 168.5 190.3 162.3Arizona 2,212 2,827 3,102 3,564 3,505 67.9 85.8 93.1 105.2 103.5Arkansas 2,687 2,432 2,160 2,527 2,510 179.7 162.1 143.4 167.5 166.3California 10,811 13,045 14,258 16,009 18,404 57.1 68.2 74.0 82.0 94.2Colorado 1,285 1,362 1,243 1,318 1,832 50.4 52.7 47.4 49.5 68.8Connecticut 1,378 1,153 1,419 1,108 851 75.1 62.6 77.0 60.1 46.2Delaware 471 496 763 693 641 100.8 104.9 159.7 143.5 132.7District of Columbia 1,209 1,006 953 858 874 371.1 301.8 280.1 247.8 252.4Florida 9,999 9,570 9,718 9,228 10,078 102.7 97.0 97.3 90.7 99.1Georgia 8,589 7,921 7,060 6,552 7,322 171.4 156.3 138.1 126.7 141.6Hawaii 273 299 264 350 446 39.9 43.3 38.0 49.9 63.6Idaho 79 63 87 196 197 10.0 7.9 10.8 24.0 24.1Illinois 9,500 9,837 8,574 7,559 7,698 144.9 150.1 130.8 115.2 117.4Indiana 3,690 4,139 3,796 3,819 3,984 111.5 124.7 113.8 114.1 119.0Iowa 1,217 1,170 812 862 1,122 78.8 75.5 52.2 55.1 71.7Kansas 1,360 1,339 1,222 1,464 1,262 94.1 92.3 84.2 100.5 86.6Kentucky 2,596 2,328 2,331 2,270 2,242 117.0 104.7 104.4 101.3 100.1Louisiana 5,263 5,080 4,927 5,049 5,535 225.3 216.2 208.6 212.5 233.0Maine 122 240 119 98 143 18.0 35.4 17.5 14.4 21.1Maryland 3,461 2,878 2,841 2,793 3,090 115.1 94.9 93.0 90.7 100.3Massachusetts 1,083 1,076 1,168 1,215 1,027 31.9 31.4 33.9 35.0 29.6Michigan 7,599 7,194 5,865 5,129 5,191 151.1 142.9 116.5 101.7 103.0Minnesota 1,294 1,676 2,037 1,802 1,675 48.1 61.9 74.7 65.6 61.0Mississippi 3,344 3,834 2,726 2,987 3,131 218.3 249.7 177.4 194.0 203.4Missouri 4,195 4,209 3,944 3,620 4,187 136.8 137.1 128.0 117.2 135.5Montana 51 58 127 221 462 10.3 11.6 25.1 43.4 90.7Nebraska 823 784 694 770 870 88.7 84.0 73.9 81.5 92.1Nevada 879 982 1,203 1,294 1,402 65.2 71.8 86.9 91.6 99.3New Hampshire 59 61 52 91 65 8.8 9.1 7.8 13.6 9.7New Jersey 3,916 3,798 3,484 3,082 3,110 86.6 83.6 76.5 67.3 68.0New Mexico 925 857 823 961 1,087 87.9 81.4 78.3 91.3 103.3New York 9,716 10,021 8,020 7,077 8,593 96.8 99.4 79.3 69.6 84.5North Carolina 10,076 8,093 7,547 7,759 10,064 203.4 161.9 149.5 152.2 197.4North Dakota 149 207 301 385 375 44.1 60.2 85.2 106.8 104.0Ohio 10,009 9,706 9,176 8,735 8,466 169.5 164.5 155.2 147.6 143.0Oklahoma 2,395 2,652 3,000 3,451 3,580 125.1 137.8 154.4 176.3 182.8Oregon 602 528 566 786 1,158 30.8 26.8 28.5 39.2 57.7Pennsylvania 7,687 8,360 7,206 6,164 5,889 117.7 128.0 110.3 94.3 90.1Rhode Island 167 232 192 218 172 30.8 42.8 35.4 40.1 31.6South Carolina 4,981 4,416 4,050 4,527 4,401 207.3 182.0 165.2 182.3 177.2South Dakota 399 446 464 557 621 97.1 107.5 110.3 131.4 146.5Tennessee 4,112 4,721 3,617 3,419 3,809 125.3 142.7 108.7 101.8 113.5Texas 16,476 17,151 17,206 17,253 17,843 127.4 130.8 129.4 127.1 131.4Utah 66 132 373 565 507 4.7 9.3 25.9 38.6 34.7Vermont 24 54 46 35 85 7.6 17.0 14.5 11.0 26.8Virginia 3,693 3,734 3,678 4,361 4,007 89.6 89.7 87.6 103.1 94.7Washington 1,066 1,230 1,704 2,504 2,797 31.2 35.6 48.8 70.9 79.2West Virginia 467 438 539 461 365 49.7 46.6 57.4 49.2 39.0Wisconsin 2,907 2,640 2,455 2,046 2,557 101.1 91.6 84.9 70.6 88.2Wyoming 25 19 39 61 86 9.0 6.7 13.7 21.3 30.1U.S. TOTAL 171,005 172,066 163,208 162,608 173,514 108.0 107.9 101.7 100.4 107.2Northeast 24,152 24,995 21,706 19,088 19,935 84.7 87.3 75.6 66.3 69.2Midwest 43,142 43,347 39,340 36,748 38,008 126.5 126.9 114.8 107.0 110.6South 84,922 81,937 77,784 78,278 83,121 143.6 137.1 129.0 128.2 136.1West 18,789 21,787 24,378 28,494 32,450 51.4 59.1 65.5 75.6 86.0Guam 44 46 43 47 67 56.0 58.4 54.4 59.2 84.4Puerto Rico 140 157 120 161 259 7.2 8.2 6.4 8.7 14.0Virgin Islands 94 92 41 54 28 167.3 164.2 73.4 97.1 50.3OUTLYING AREAS 278 295 204 262 354 13.4 14.4 10.1 13.2 17.9TOTAL 171,283 172,361 163,412 162,870 173,868 106.8 106.7 100.6 99.4 106.1
NOTE: Cases reported with unknown sex are not included in this table.
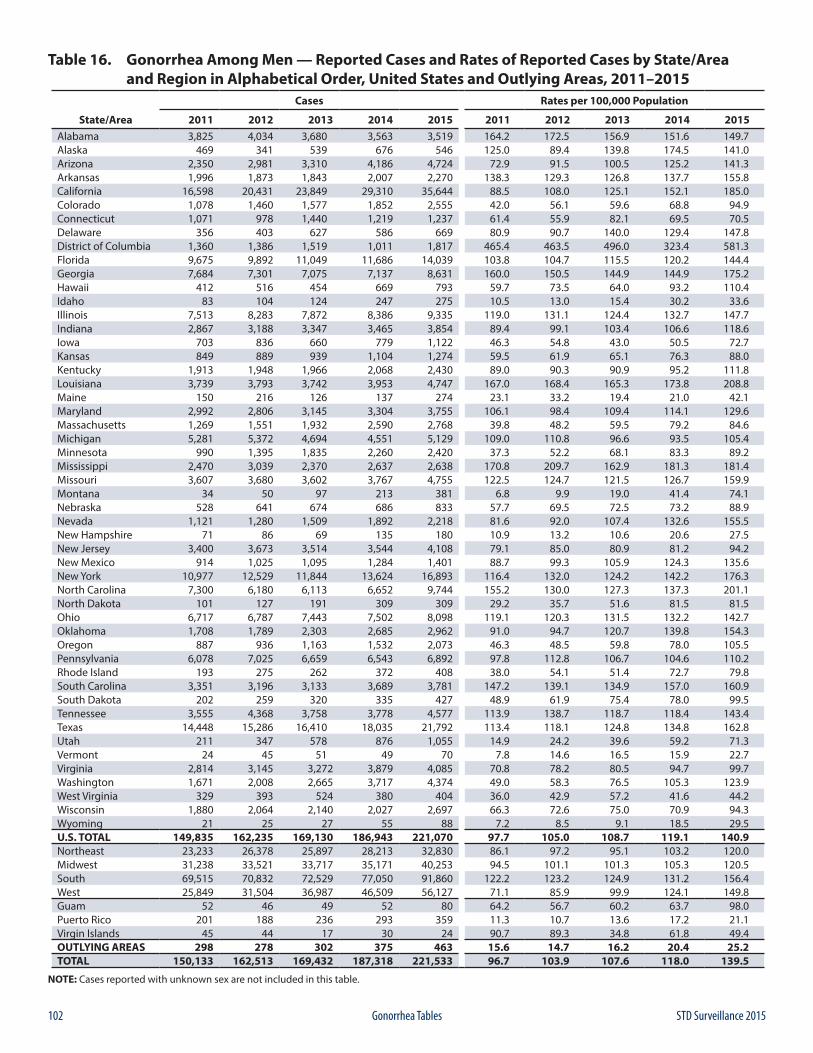
102 STD Surveillance 2015Gonorrhea Tables
Table 16. Gonorrhea Among Men — Reported Cases and Rates of Reported Cases by State/Area and Region in Alphabetical Order, United States and Outlying Areas, 2011–2015
Cases Rates per 100,000 Population
State/Area 2011 2012 2013 2014 2015 2011 2012 2013 2014 2015Alabama 3,825 4,034 3,680 3,563 3,519 164.2 172.5 156.9 151.6 149.7Alaska 469 341 539 676 546 125.0 89.4 139.8 174.5 141.0Arizona 2,350 2,981 3,310 4,186 4,724 72.9 91.5 100.5 125.2 141.3Arkansas 1,996 1,873 1,843 2,007 2,270 138.3 129.3 126.8 137.7 155.8California 16,598 20,431 23,849 29,310 35,644 88.5 108.0 125.1 152.1 185.0Colorado 1,078 1,460 1,577 1,852 2,555 42.0 56.1 59.6 68.8 94.9Connecticut 1,071 978 1,440 1,219 1,237 61.4 55.9 82.1 69.5 70.5Delaware 356 403 627 586 669 80.9 90.7 140.0 129.4 147.8District of Columbia 1,360 1,386 1,519 1,011 1,817 465.4 463.5 496.0 323.4 581.3Florida 9,675 9,892 11,049 11,686 14,039 103.8 104.7 115.5 120.2 144.4Georgia 7,684 7,301 7,075 7,137 8,631 160.0 150.5 144.9 144.9 175.2Hawaii 412 516 454 669 793 59.7 73.5 64.0 93.2 110.4Idaho 83 104 124 247 275 10.5 13.0 15.4 30.2 33.6Illinois 7,513 8,283 7,872 8,386 9,335 119.0 131.1 124.4 132.7 147.7Indiana 2,867 3,188 3,347 3,465 3,854 89.4 99.1 103.4 106.6 118.6Iowa 703 836 660 779 1,122 46.3 54.8 43.0 50.5 72.7Kansas 849 889 939 1,104 1,274 59.5 61.9 65.1 76.3 88.0Kentucky 1,913 1,948 1,966 2,068 2,430 89.0 90.3 90.9 95.2 111.8Louisiana 3,739 3,793 3,742 3,953 4,747 167.0 168.4 165.3 173.8 208.8Maine 150 216 126 137 274 23.1 33.2 19.4 21.0 42.1Maryland 2,992 2,806 3,145 3,304 3,755 106.1 98.4 109.4 114.1 129.6Massachusetts 1,269 1,551 1,932 2,590 2,768 39.8 48.2 59.5 79.2 84.6Michigan 5,281 5,372 4,694 4,551 5,129 109.0 110.8 96.6 93.5 105.4Minnesota 990 1,395 1,835 2,260 2,420 37.3 52.2 68.1 83.3 89.2Mississippi 2,470 3,039 2,370 2,637 2,638 170.8 209.7 162.9 181.3 181.4Missouri 3,607 3,680 3,602 3,767 4,755 122.5 124.7 121.5 126.7 159.9Montana 34 50 97 213 381 6.8 9.9 19.0 41.4 74.1Nebraska 528 641 674 686 833 57.7 69.5 72.5 73.2 88.9Nevada 1,121 1,280 1,509 1,892 2,218 81.6 92.0 107.4 132.6 155.5New Hampshire 71 86 69 135 180 10.9 13.2 10.6 20.6 27.5New Jersey 3,400 3,673 3,514 3,544 4,108 79.1 85.0 80.9 81.2 94.2New Mexico 914 1,025 1,095 1,284 1,401 88.7 99.3 105.9 124.3 135.6New York 10,977 12,529 11,844 13,624 16,893 116.4 132.0 124.2 142.2 176.3North Carolina 7,300 6,180 6,113 6,652 9,744 155.2 130.0 127.3 137.3 201.1North Dakota 101 127 191 309 309 29.2 35.7 51.6 81.5 81.5Ohio 6,717 6,787 7,443 7,502 8,098 119.1 120.3 131.5 132.2 142.7Oklahoma 1,708 1,789 2,303 2,685 2,962 91.0 94.7 120.7 139.8 154.3Oregon 887 936 1,163 1,532 2,073 46.3 48.5 59.8 78.0 105.5Pennsylvania 6,078 7,025 6,659 6,543 6,892 97.8 112.8 106.7 104.6 110.2Rhode Island 193 275 262 372 408 38.0 54.1 51.4 72.7 79.8South Carolina 3,351 3,196 3,133 3,689 3,781 147.2 139.1 134.9 157.0 160.9South Dakota 202 259 320 335 427 48.9 61.9 75.4 78.0 99.5Tennessee 3,555 4,368 3,758 3,778 4,577 113.9 138.7 118.7 118.4 143.4Texas 14,448 15,286 16,410 18,035 21,792 113.4 118.1 124.8 134.8 162.8Utah 211 347 578 876 1,055 14.9 24.2 39.6 59.2 71.3Vermont 24 45 51 49 70 7.8 14.6 16.5 15.9 22.7Virginia 2,814 3,145 3,272 3,879 4,085 70.8 78.2 80.5 94.7 99.7Washington 1,671 2,008 2,665 3,717 4,374 49.0 58.3 76.5 105.3 123.9West Virginia 329 393 524 380 404 36.0 42.9 57.2 41.6 44.2Wisconsin 1,880 2,064 2,140 2,027 2,697 66.3 72.6 75.0 70.9 94.3Wyoming 21 25 27 55 88 7.2 8.5 9.1 18.5 29.5U.S. TOTAL 149,835 162,235 169,130 186,943 221,070 97.7 105.0 108.7 119.1 140.9Northeast 23,233 26,378 25,897 28,213 32,830 86.1 97.2 95.1 103.2 120.0Midwest 31,238 33,521 33,717 35,171 40,253 94.5 101.1 101.3 105.3 120.5South 69,515 70,832 72,529 77,050 91,860 122.2 123.2 124.9 131.2 156.4West 25,849 31,504 36,987 46,509 56,127 71.1 85.9 99.9 124.1 149.8Guam 52 46 49 52 80 64.2 56.7 60.2 63.7 98.0Puerto Rico 201 188 236 293 359 11.3 10.7 13.6 17.2 21.1Virgin Islands 45 44 17 30 24 90.7 89.3 34.8 61.8 49.4OUTLYING AREAS 298 278 302 375 463 15.6 14.7 16.2 20.4 25.2TOTAL 150,133 162,513 169,432 187,318 221,533 96.7 103.9 107.6 118.0 139.5
NOTE: Cases reported with unknown sex are not included in this table.
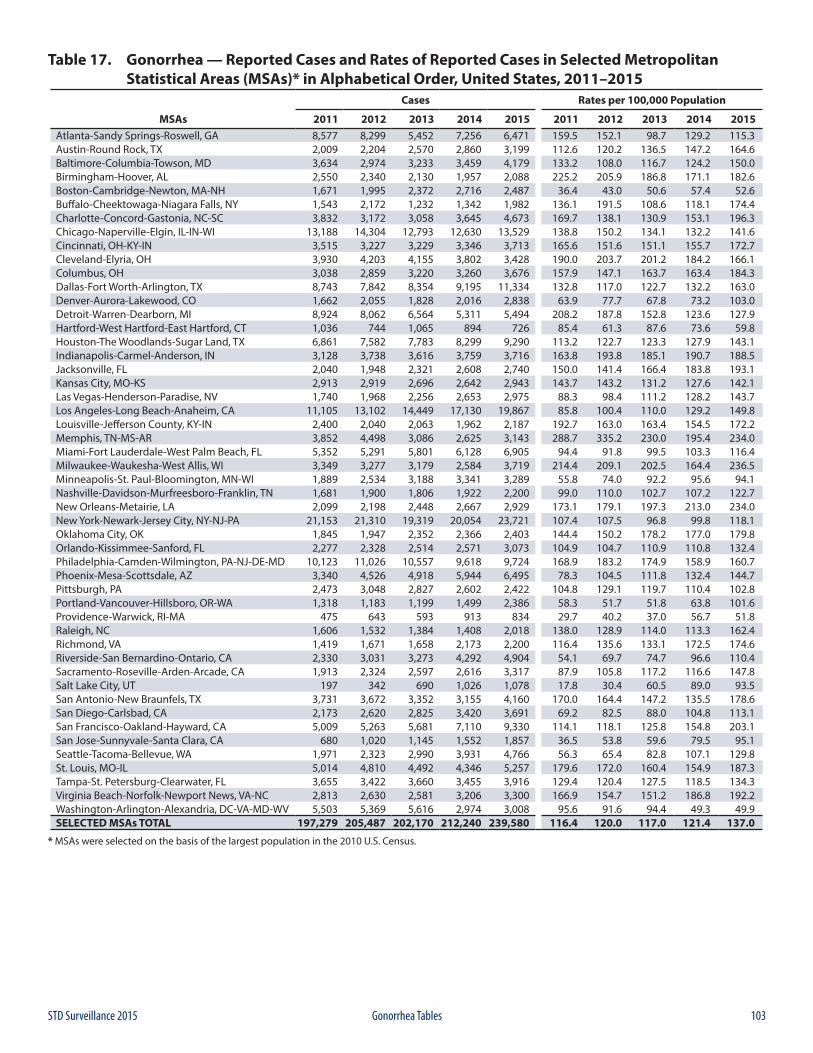
103STD Surveillance 2015 Gonorrhea Tables
Table 17. Gonorrhea — Reported Cases and Rates of Reported Cases in Selected Metropolitan Statistical Areas (MSAs)* in Alphabetical Order, United States, 2011–2015
Cases Rates per 100,000 Population
MSAs 2011 2012 2013 2014 2015 2011 2012 2013 2014 2015Atlanta-Sandy Springs-Roswell, GA 8,577 8,299 5,452 7,256 6,471 159.5 152.1 98.7 129.2 115.3Austin-Round Rock, TX 2,009 2,204 2,570 2,860 3,199 112.6 120.2 136.5 147.2 164.6Baltimore-Columbia-Towson, MD 3,634 2,974 3,233 3,459 4,179 133.2 108.0 116.7 124.2 150.0Birmingham-Hoover, AL 2,550 2,340 2,130 1,957 2,088 225.2 205.9 186.8 171.1 182.6Boston-Cambridge-Newton, MA-NH 1,671 1,995 2,372 2,716 2,487 36.4 43.0 50.6 57.4 52.6Buffalo-Cheektowaga-Niagara Falls, NY 1,543 2,172 1,232 1,342 1,982 136.1 191.5 108.6 118.1 174.4Charlotte-Concord-Gastonia, NC-SC 3,832 3,172 3,058 3,645 4,673 169.7 138.1 130.9 153.1 196.3Chicago-Naperville-Elgin, IL-IN-WI 13,188 14,304 12,793 12,630 13,529 138.8 150.2 134.1 132.2 141.6Cincinnati, OH-KY-IN 3,515 3,227 3,229 3,346 3,713 165.6 151.6 151.1 155.7 172.7Cleveland-Elyria, OH 3,930 4,203 4,155 3,802 3,428 190.0 203.7 201.2 184.2 166.1Columbus, OH 3,038 2,859 3,220 3,260 3,676 157.9 147.1 163.7 163.4 184.3Dallas-Fort Worth-Arlington, TX 8,743 7,842 8,354 9,195 11,334 132.8 117.0 122.7 132.2 163.0Denver-Aurora-Lakewood, CO 1,662 2,055 1,828 2,016 2,838 63.9 77.7 67.8 73.2 103.0Detroit-Warren-Dearborn, MI 8,924 8,062 6,564 5,311 5,494 208.2 187.8 152.8 123.6 127.9Hartford-West Hartford-East Hartford, CT 1,036 744 1,065 894 726 85.4 61.3 87.6 73.6 59.8Houston-The Woodlands-Sugar Land, TX 6,861 7,582 7,783 8,299 9,290 113.2 122.7 123.3 127.9 143.1Indianapolis-Carmel-Anderson, IN 3,128 3,738 3,616 3,759 3,716 163.8 193.8 185.1 190.7 188.5Jacksonville, FL 2,040 1,948 2,321 2,608 2,740 150.0 141.4 166.4 183.8 193.1Kansas City, MO-KS 2,913 2,919 2,696 2,642 2,943 143.7 143.2 131.2 127.6 142.1Las Vegas-Henderson-Paradise, NV 1,740 1,968 2,256 2,653 2,975 88.3 98.4 111.2 128.2 143.7Los Angeles-Long Beach-Anaheim, CA 11,105 13,102 14,449 17,130 19,867 85.8 100.4 110.0 129.2 149.8Louisville-Jefferson County, KY-IN 2,400 2,040 2,063 1,962 2,187 192.7 163.0 163.4 154.5 172.2Memphis, TN-MS-AR 3,852 4,498 3,086 2,625 3,143 288.7 335.2 230.0 195.4 234.0Miami-Fort Lauderdale-West Palm Beach, FL 5,352 5,291 5,801 6,128 6,905 94.4 91.8 99.5 103.3 116.4Milwaukee-Waukesha-West Allis, WI 3,349 3,277 3,179 2,584 3,719 214.4 209.1 202.5 164.4 236.5Minneapolis-St. Paul-Bloomington, MN-WI 1,889 2,534 3,188 3,341 3,289 55.8 74.0 92.2 95.6 94.1Nashville-Davidson-Murfreesboro-Franklin, TN 1,681 1,900 1,806 1,922 2,200 99.0 110.0 102.7 107.2 122.7New Orleans-Metairie, LA 2,099 2,198 2,448 2,667 2,929 173.1 179.1 197.3 213.0 234.0New York-Newark-Jersey City, NY-NJ-PA 21,153 21,310 19,319 20,054 23,721 107.4 107.5 96.8 99.8 118.1Oklahoma City, OK 1,845 1,947 2,352 2,366 2,403 144.4 150.2 178.2 177.0 179.8Orlando-Kissimmee-Sanford, FL 2,277 2,328 2,514 2,571 3,073 104.9 104.7 110.9 110.8 132.4Philadelphia-Camden-Wilmington, PA-NJ-DE-MD 10,123 11,026 10,557 9,618 9,724 168.9 183.2 174.9 158.9 160.7Phoenix-Mesa-Scottsdale, AZ 3,340 4,526 4,918 5,944 6,495 78.3 104.5 111.8 132.4 144.7Pittsburgh, PA 2,473 3,048 2,827 2,602 2,422 104.8 129.1 119.7 110.4 102.8Portland-Vancouver-Hillsboro, OR-WA 1,318 1,183 1,199 1,499 2,386 58.3 51.7 51.8 63.8 101.6Providence-Warwick, RI-MA 475 643 593 913 834 29.7 40.2 37.0 56.7 51.8Raleigh, NC 1,606 1,532 1,384 1,408 2,018 138.0 128.9 114.0 113.3 162.4Richmond, VA 1,419 1,671 1,658 2,173 2,200 116.4 135.6 133.1 172.5 174.6Riverside-San Bernardino-Ontario, CA 2,330 3,031 3,273 4,292 4,904 54.1 69.7 74.7 96.6 110.4Sacramento-Roseville-Arden-Arcade, CA 1,913 2,324 2,597 2,616 3,317 87.9 105.8 117.2 116.6 147.8Salt Lake City, UT 197 342 690 1,026 1,078 17.8 30.4 60.5 89.0 93.5San Antonio-New Braunfels, TX 3,731 3,672 3,352 3,155 4,160 170.0 164.4 147.2 135.5 178.6San Diego-Carlsbad, CA 2,173 2,620 2,825 3,420 3,691 69.2 82.5 88.0 104.8 113.1San Francisco-Oakland-Hayward, CA 5,009 5,263 5,681 7,110 9,330 114.1 118.1 125.8 154.8 203.1San Jose-Sunnyvale-Santa Clara, CA 680 1,020 1,145 1,552 1,857 36.5 53.8 59.6 79.5 95.1Seattle-Tacoma-Bellevue, WA 1,971 2,323 2,990 3,931 4,766 56.3 65.4 82.8 107.1 129.8St. Louis, MO-IL 5,014 4,810 4,492 4,346 5,257 179.6 172.0 160.4 154.9 187.3Tampa-St. Petersburg-Clearwater, FL 3,655 3,422 3,660 3,455 3,916 129.4 120.4 127.5 118.5 134.3Virginia Beach-Norfolk-Newport News, VA-NC 2,813 2,630 2,581 3,206 3,300 166.9 154.7 151.2 186.8 192.2Washington-Arlington-Alexandria, DC-VA-MD-WV 5,503 5,369 5,616 2,974 3,008 95.6 91.6 94.4 49.3 49.9SELECTED MSAs TOTAL 197,279 205,487 202,170 212,240 239,580 116.4 120.0 117.0 121.4 137.0
* MSAs were selected on the basis of the largest population in the 2010 U.S. Census.
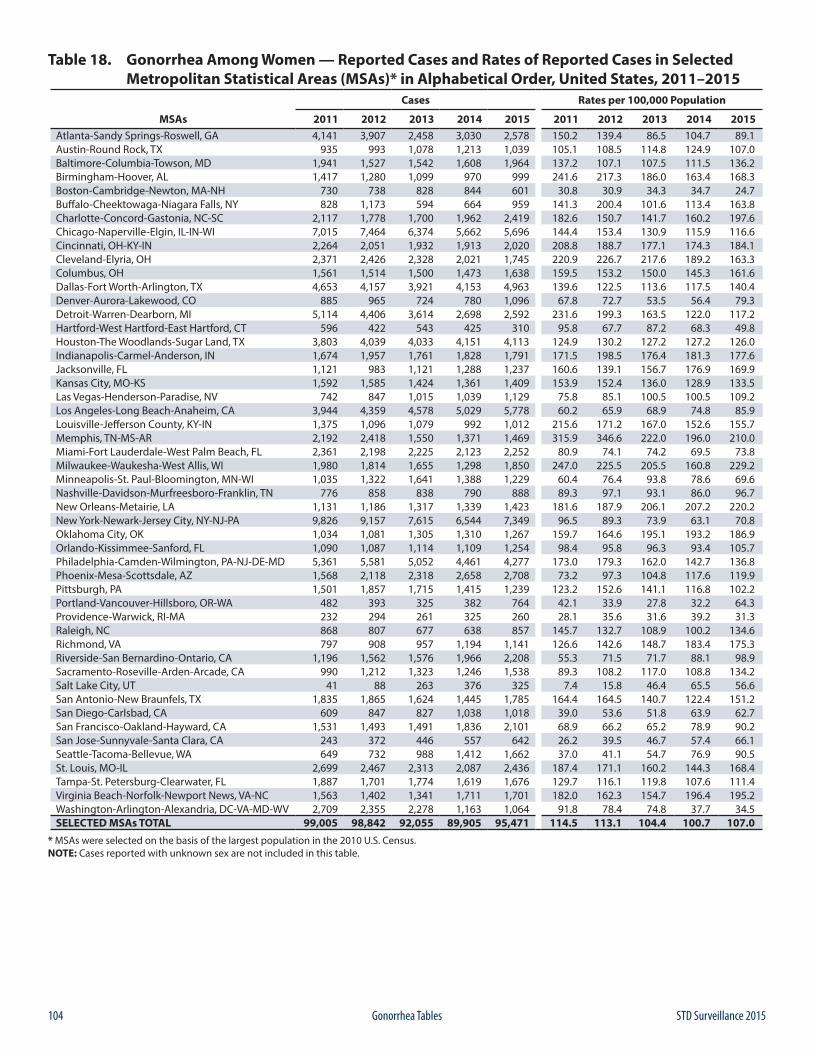
104 STD Surveillance 2015Gonorrhea Tables
Table 18. Gonorrhea Among Women — Reported Cases and Rates of Reported Cases in Selected Metropolitan Statistical Areas (MSAs)* in Alphabetical Order, United States, 2011–2015
Cases Rates per 100,000 Population
MSAs 2011 2012 2013 2014 2015 2011 2012 2013 2014 2015Atlanta-Sandy Springs-Roswell, GA 4,141 3,907 2,458 3,030 2,578 150.2 139.4 86.5 104.7 89.1Austin-Round Rock, TX 935 993 1,078 1,213 1,039 105.1 108.5 114.8 124.9 107.0Baltimore-Columbia-Towson, MD 1,941 1,527 1,542 1,608 1,964 137.2 107.1 107.5 111.5 136.2Birmingham-Hoover, AL 1,417 1,280 1,099 970 999 241.6 217.3 186.0 163.4 168.3Boston-Cambridge-Newton, MA-NH 730 738 828 844 601 30.8 30.9 34.3 34.7 24.7Buffalo-Cheektowaga-Niagara Falls, NY 828 1,173 594 664 959 141.3 200.4 101.6 113.4 163.8Charlotte-Concord-Gastonia, NC-SC 2,117 1,778 1,700 1,962 2,419 182.6 150.7 141.7 160.2 197.6Chicago-Naperville-Elgin, IL-IN-WI 7,015 7,464 6,374 5,662 5,696 144.4 153.4 130.9 115.9 116.6Cincinnati, OH-KY-IN 2,264 2,051 1,932 1,913 2,020 208.8 188.7 177.1 174.3 184.1Cleveland-Elyria, OH 2,371 2,426 2,328 2,021 1,745 220.9 226.7 217.6 189.2 163.3Columbus, OH 1,561 1,514 1,500 1,473 1,638 159.5 153.2 150.0 145.3 161.6Dallas-Fort Worth-Arlington, TX 4,653 4,157 3,921 4,153 4,963 139.6 122.5 113.6 117.5 140.4Denver-Aurora-Lakewood, CO 885 965 724 780 1,096 67.8 72.7 53.5 56.4 79.3Detroit-Warren-Dearborn, MI 5,114 4,406 3,614 2,698 2,592 231.6 199.3 163.5 122.0 117.2Hartford-West Hartford-East Hartford, CT 596 422 543 425 310 95.8 67.7 87.2 68.3 49.8Houston-The Woodlands-Sugar Land, TX 3,803 4,039 4,033 4,151 4,113 124.9 130.2 127.2 127.2 126.0Indianapolis-Carmel-Anderson, IN 1,674 1,957 1,761 1,828 1,791 171.5 198.5 176.4 181.3 177.6Jacksonville, FL 1,121 983 1,121 1,288 1,237 160.6 139.1 156.7 176.9 169.9Kansas City, MO-KS 1,592 1,585 1,424 1,361 1,409 153.9 152.4 136.0 128.9 133.5Las Vegas-Henderson-Paradise, NV 742 847 1,015 1,039 1,129 75.8 85.1 100.5 100.5 109.2Los Angeles-Long Beach-Anaheim, CA 3,944 4,359 4,578 5,029 5,778 60.2 65.9 68.9 74.8 85.9Louisville-Jefferson County, KY-IN 1,375 1,096 1,079 992 1,012 215.6 171.2 167.0 152.6 155.7Memphis, TN-MS-AR 2,192 2,418 1,550 1,371 1,469 315.9 346.6 222.0 196.0 210.0Miami-Fort Lauderdale-West Palm Beach, FL 2,361 2,198 2,225 2,123 2,252 80.9 74.1 74.2 69.5 73.8Milwaukee-Waukesha-West Allis, WI 1,980 1,814 1,655 1,298 1,850 247.0 225.5 205.5 160.8 229.2Minneapolis-St. Paul-Bloomington, MN-WI 1,035 1,322 1,641 1,388 1,229 60.4 76.4 93.8 78.6 69.6Nashville-Davidson-Murfreesboro-Franklin, TN 776 858 838 790 888 89.3 97.1 93.1 86.0 96.7New Orleans-Metairie, LA 1,131 1,186 1,317 1,339 1,423 181.6 187.9 206.1 207.2 220.2New York-Newark-Jersey City, NY-NJ-PA 9,826 9,157 7,615 6,544 7,349 96.5 89.3 73.9 63.1 70.8Oklahoma City, OK 1,034 1,081 1,305 1,310 1,267 159.7 164.6 195.1 193.2 186.9Orlando-Kissimmee-Sanford, FL 1,090 1,087 1,114 1,109 1,254 98.4 95.8 96.3 93.4 105.7Philadelphia-Camden-Wilmington, PA-NJ-DE-MD 5,361 5,581 5,052 4,461 4,277 173.0 179.3 162.0 142.7 136.8Phoenix-Mesa-Scottsdale, AZ 1,568 2,118 2,318 2,658 2,708 73.2 97.3 104.8 117.6 119.9Pittsburgh, PA 1,501 1,857 1,715 1,415 1,239 123.2 152.6 141.1 116.8 102.2Portland-Vancouver-Hillsboro, OR-WA 482 393 325 382 764 42.1 33.9 27.8 32.2 64.3Providence-Warwick, RI-MA 232 294 261 325 260 28.1 35.6 31.6 39.2 31.3Raleigh, NC 868 807 677 638 857 145.7 132.7 108.9 100.2 134.6Richmond, VA 797 908 957 1,194 1,141 126.6 142.6 148.7 183.4 175.3Riverside-San Bernardino-Ontario, CA 1,196 1,562 1,576 1,966 2,208 55.3 71.5 71.7 88.1 98.9Sacramento-Roseville-Arden-Arcade, CA 990 1,212 1,323 1,246 1,538 89.3 108.2 117.0 108.8 134.2Salt Lake City, UT 41 88 263 376 325 7.4 15.8 46.4 65.5 56.6San Antonio-New Braunfels, TX 1,835 1,865 1,624 1,445 1,785 164.4 164.5 140.7 122.4 151.2San Diego-Carlsbad, CA 609 847 827 1,038 1,018 39.0 53.6 51.8 63.9 62.7San Francisco-Oakland-Hayward, CA 1,531 1,493 1,491 1,836 2,101 68.9 66.2 65.2 78.9 90.2San Jose-Sunnyvale-Santa Clara, CA 243 372 446 557 642 26.2 39.5 46.7 57.4 66.1Seattle-Tacoma-Bellevue, WA 649 732 988 1,412 1,662 37.0 41.1 54.7 76.9 90.5St. Louis, MO-IL 2,699 2,467 2,313 2,087 2,436 187.4 171.1 160.2 144.3 168.4Tampa-St. Petersburg-Clearwater, FL 1,887 1,701 1,774 1,619 1,676 129.7 116.1 119.8 107.6 111.4Virginia Beach-Norfolk-Newport News, VA-NC 1,563 1,402 1,341 1,711 1,701 182.0 162.3 154.7 196.4 195.2Washington-Arlington-Alexandria, DC-VA-MD-WV 2,709 2,355 2,278 1,163 1,064 91.8 78.4 74.8 37.7 34.5SELECTED MSAs TOTAL 99,005 98,842 92,055 89,905 95,471 114.5 113.1 104.4 100.7 107.0
* MSAs were selected on the basis of the largest population in the 2010 U.S. Census.NOTE: Cases reported with unknown sex are not included in this table.
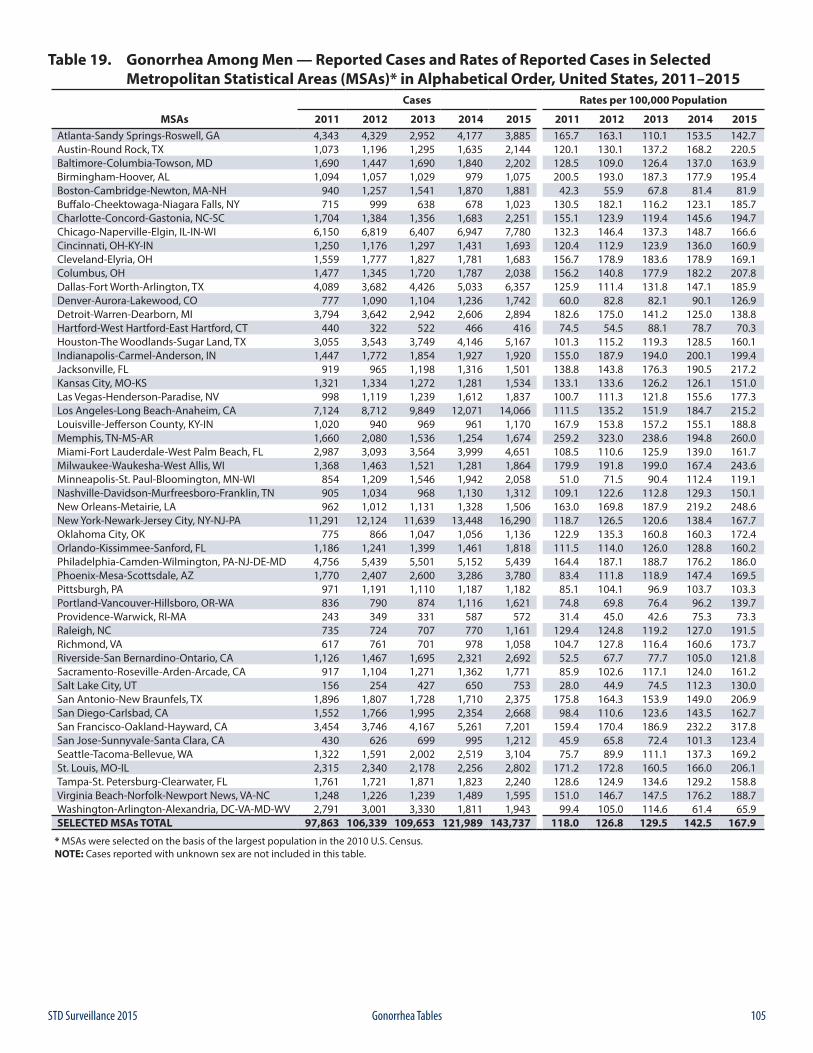
105STD Surveillance 2015 Gonorrhea Tables
Table 19. Gonorrhea Among Men — Reported Cases and Rates of Reported Cases in Selected Metropolitan Statistical Areas (MSAs)* in Alphabetical Order, United States, 2011–2015
Cases Rates per 100,000 Population
MSAs 2011 2012 2013 2014 2015 2011 2012 2013 2014 2015Atlanta-Sandy Springs-Roswell, GA 4,343 4,329 2,952 4,177 3,885 165.7 163.1 110.1 153.5 142.7Austin-Round Rock, TX 1,073 1,196 1,295 1,635 2,144 120.1 130.1 137.2 168.2 220.5Baltimore-Columbia-Towson, MD 1,690 1,447 1,690 1,840 2,202 128.5 109.0 126.4 137.0 163.9Birmingham-Hoover, AL 1,094 1,057 1,029 979 1,075 200.5 193.0 187.3 177.9 195.4Boston-Cambridge-Newton, MA-NH 940 1,257 1,541 1,870 1,881 42.3 55.9 67.8 81.4 81.9Buffalo-Cheektowaga-Niagara Falls, NY 715 999 638 678 1,023 130.5 182.1 116.2 123.1 185.7Charlotte-Concord-Gastonia, NC-SC 1,704 1,384 1,356 1,683 2,251 155.1 123.9 119.4 145.6 194.7Chicago-Naperville-Elgin, IL-IN-WI 6,150 6,819 6,407 6,947 7,780 132.3 146.4 137.3 148.7 166.6Cincinnati, OH-KY-IN 1,250 1,176 1,297 1,431 1,693 120.4 112.9 123.9 136.0 160.9Cleveland-Elyria, OH 1,559 1,777 1,827 1,781 1,683 156.7 178.9 183.6 178.9 169.1Columbus, OH 1,477 1,345 1,720 1,787 2,038 156.2 140.8 177.9 182.2 207.8Dallas-Fort Worth-Arlington, TX 4,089 3,682 4,426 5,033 6,357 125.9 111.4 131.8 147.1 185.9Denver-Aurora-Lakewood, CO 777 1,090 1,104 1,236 1,742 60.0 82.8 82.1 90.1 126.9Detroit-Warren-Dearborn, MI 3,794 3,642 2,942 2,606 2,894 182.6 175.0 141.2 125.0 138.8Hartford-West Hartford-East Hartford, CT 440 322 522 466 416 74.5 54.5 88.1 78.7 70.3Houston-The Woodlands-Sugar Land, TX 3,055 3,543 3,749 4,146 5,167 101.3 115.2 119.3 128.5 160.1Indianapolis-Carmel-Anderson, IN 1,447 1,772 1,854 1,927 1,920 155.0 187.9 194.0 200.1 199.4Jacksonville, FL 919 965 1,198 1,316 1,501 138.8 143.8 176.3 190.5 217.2Kansas City, MO-KS 1,321 1,334 1,272 1,281 1,534 133.1 133.6 126.2 126.1 151.0Las Vegas-Henderson-Paradise, NV 998 1,119 1,239 1,612 1,837 100.7 111.3 121.8 155.6 177.3Los Angeles-Long Beach-Anaheim, CA 7,124 8,712 9,849 12,071 14,066 111.5 135.2 151.9 184.7 215.2Louisville-Jefferson County, KY-IN 1,020 940 969 961 1,170 167.9 153.8 157.2 155.1 188.8Memphis, TN-MS-AR 1,660 2,080 1,536 1,254 1,674 259.2 323.0 238.6 194.8 260.0Miami-Fort Lauderdale-West Palm Beach, FL 2,987 3,093 3,564 3,999 4,651 108.5 110.6 125.9 139.0 161.7Milwaukee-Waukesha-West Allis, WI 1,368 1,463 1,521 1,281 1,864 179.9 191.8 199.0 167.4 243.6Minneapolis-St. Paul-Bloomington, MN-WI 854 1,209 1,546 1,942 2,058 51.0 71.5 90.4 112.4 119.1Nashville-Davidson-Murfreesboro-Franklin, TN 905 1,034 968 1,130 1,312 109.1 122.6 112.8 129.3 150.1New Orleans-Metairie, LA 962 1,012 1,131 1,328 1,506 163.0 169.8 187.9 219.2 248.6New York-Newark-Jersey City, NY-NJ-PA 11,291 12,124 11,639 13,448 16,290 118.7 126.5 120.6 138.4 167.7Oklahoma City, OK 775 866 1,047 1,056 1,136 122.9 135.3 160.8 160.3 172.4Orlando-Kissimmee-Sanford, FL 1,186 1,241 1,399 1,461 1,818 111.5 114.0 126.0 128.8 160.2Philadelphia-Camden-Wilmington, PA-NJ-DE-MD 4,756 5,439 5,501 5,152 5,439 164.4 187.1 188.7 176.2 186.0Phoenix-Mesa-Scottsdale, AZ 1,770 2,407 2,600 3,286 3,780 83.4 111.8 118.9 147.4 169.5Pittsburgh, PA 971 1,191 1,110 1,187 1,182 85.1 104.1 96.9 103.7 103.3Portland-Vancouver-Hillsboro, OR-WA 836 790 874 1,116 1,621 74.8 69.8 76.4 96.2 139.7Providence-Warwick, RI-MA 243 349 331 587 572 31.4 45.0 42.6 75.3 73.3Raleigh, NC 735 724 707 770 1,161 129.4 124.8 119.2 127.0 191.5Richmond, VA 617 761 701 978 1,058 104.7 127.8 116.4 160.6 173.7Riverside-San Bernardino-Ontario, CA 1,126 1,467 1,695 2,321 2,692 52.5 67.7 77.7 105.0 121.8Sacramento-Roseville-Arden-Arcade, CA 917 1,104 1,271 1,362 1,771 85.9 102.6 117.1 124.0 161.2Salt Lake City, UT 156 254 427 650 753 28.0 44.9 74.5 112.3 130.0San Antonio-New Braunfels, TX 1,896 1,807 1,728 1,710 2,375 175.8 164.3 153.9 149.0 206.9San Diego-Carlsbad, CA 1,552 1,766 1,995 2,354 2,668 98.4 110.6 123.6 143.5 162.7San Francisco-Oakland-Hayward, CA 3,454 3,746 4,167 5,261 7,201 159.4 170.4 186.9 232.2 317.8San Jose-Sunnyvale-Santa Clara, CA 430 626 699 995 1,212 45.9 65.8 72.4 101.3 123.4Seattle-Tacoma-Bellevue, WA 1,322 1,591 2,002 2,519 3,104 75.7 89.9 111.1 137.3 169.2St. Louis, MO-IL 2,315 2,340 2,178 2,256 2,802 171.2 172.8 160.5 166.0 206.1Tampa-St. Petersburg-Clearwater, FL 1,761 1,721 1,871 1,823 2,240 128.6 124.9 134.6 129.2 158.8Virginia Beach-Norfolk-Newport News, VA-NC 1,248 1,226 1,239 1,489 1,595 151.0 146.7 147.5 176.2 188.7Washington-Arlington-Alexandria, DC-VA-MD-WV 2,791 3,001 3,330 1,811 1,943 99.4 105.0 114.6 61.4 65.9SELECTED MSAs TOTAL 97,863 106,339 109,653 121,989 143,737 118.0 126.8 129.5 142.5 167.9
* MSAs were selected on the basis of the largest population in the 2010 U.S. Census.NOTE: Cases reported with unknown sex are not included in this table.
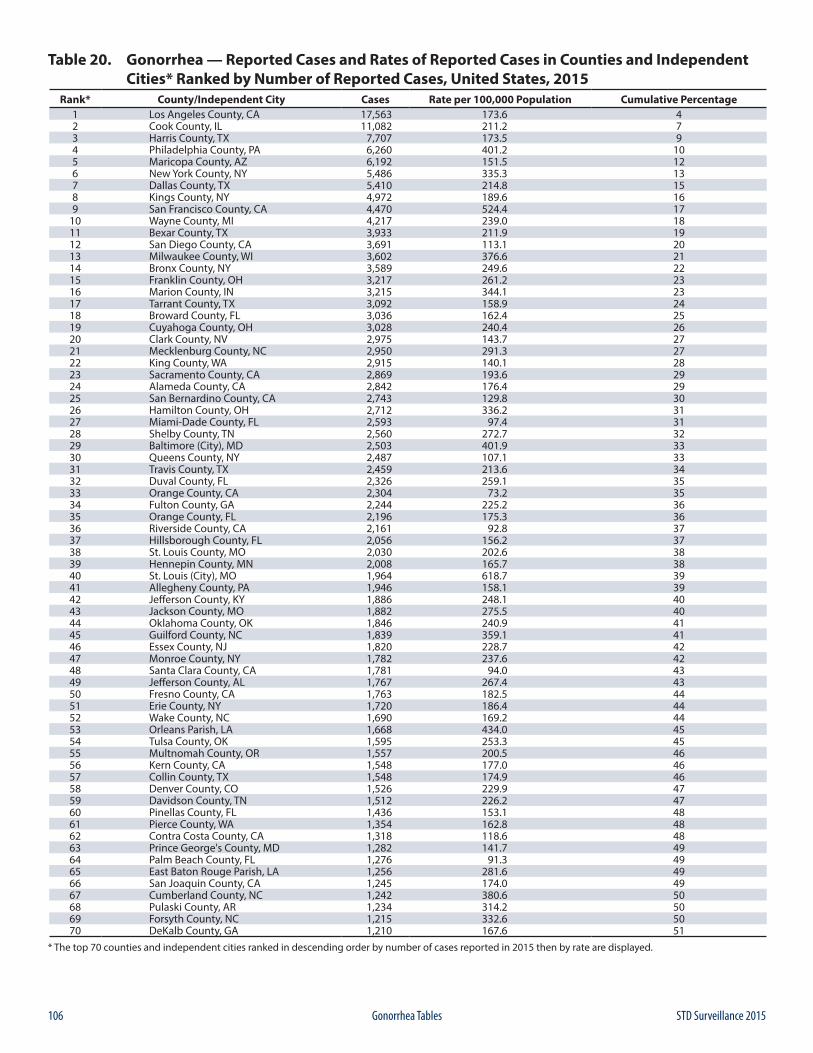
106 STD Surveillance 2015Gonorrhea Tables
Table 20. Gonorrhea — Reported Cases and Rates of Reported Cases in Counties and Independent Cities* Ranked by Number of Reported Cases, United States, 2015
Rank* County/Independent City Cases Rate per 100,000 Population Cumulative Percentage1 Los Angeles County, CA 17,563 173.6 42 Cook County, IL 11,082 211.2 73 Harris County, TX 7,707 173.5 94 Philadelphia County, PA 6,260 401.2 105 Maricopa County, AZ 6,192 151.5 126 New York County, NY 5,486 335.3 137 Dallas County, TX 5,410 214.8 158 Kings County, NY 4,972 189.6 169 San Francisco County, CA 4,470 524.4 17
10 Wayne County, MI 4,217 239.0 1811 Bexar County, TX 3,933 211.9 1912 San Diego County, CA 3,691 113.1 2013 Milwaukee County, WI 3,602 376.6 2114 Bronx County, NY 3,589 249.6 2215 Franklin County, OH 3,217 261.2 2316 Marion County, IN 3,215 344.1 2317 Tarrant County, TX 3,092 158.9 2418 Broward County, FL 3,036 162.4 2519 Cuyahoga County, OH 3,028 240.4 2620 Clark County, NV 2,975 143.7 2721 Mecklenburg County, NC 2,950 291.3 2722 King County, WA 2,915 140.1 2823 Sacramento County, CA 2,869 193.6 2924 Alameda County, CA 2,842 176.4 2925 San Bernardino County, CA 2,743 129.8 3026 Hamilton County, OH 2,712 336.2 3127 Miami-Dade County, FL 2,593 97.4 3128 Shelby County, TN 2,560 272.7 3229 Baltimore (City), MD 2,503 401.9 3330 Queens County, NY 2,487 107.1 3331 Travis County, TX 2,459 213.6 3432 Duval County, FL 2,326 259.1 3533 Orange County, CA 2,304 73.2 3534 Fulton County, GA 2,244 225.2 3635 Orange County, FL 2,196 175.3 3636 Riverside County, CA 2,161 92.8 3737 Hillsborough County, FL 2,056 156.2 3738 St. Louis County, MO 2,030 202.6 3839 Hennepin County, MN 2,008 165.7 3840 St. Louis (City), MO 1,964 618.7 3941 Allegheny County, PA 1,946 158.1 3942 Jefferson County, KY 1,886 248.1 4043 Jackson County, MO 1,882 275.5 4044 Oklahoma County, OK 1,846 240.9 4145 Guilford County, NC 1,839 359.1 4146 Essex County, NJ 1,820 228.7 4247 Monroe County, NY 1,782 237.6 4248 Santa Clara County, CA 1,781 94.0 4349 Jefferson County, AL 1,767 267.4 4350 Fresno County, CA 1,763 182.5 4451 Erie County, NY 1,720 186.4 4452 Wake County, NC 1,690 169.2 4453 Orleans Parish, LA 1,668 434.0 4554 Tulsa County, OK 1,595 253.3 4555 Multnomah County, OR 1,557 200.5 4656 Kern County, CA 1,548 177.0 4657 Collin County, TX 1,548 174.9 4658 Denver County, CO 1,526 229.9 4759 Davidson County, TN 1,512 226.2 4760 Pinellas County, FL 1,436 153.1 4861 Pierce County, WA 1,354 162.8 4862 Contra Costa County, CA 1,318 118.6 4863 Prince George's County, MD 1,282 141.7 4964 Palm Beach County, FL 1,276 91.3 4965 East Baton Rouge Parish, LA 1,256 281.6 4966 San Joaquin County, CA 1,245 174.0 4967 Cumberland County, NC 1,242 380.6 5068 Pulaski County, AR 1,234 314.2 5069 Forsyth County, NC 1,215 332.6 5070 DeKalb County, GA 1,210 167.6 51
* The top 70 counties and independent cities ranked in descending order by number of cases reported in 2015 then by rate are displayed.
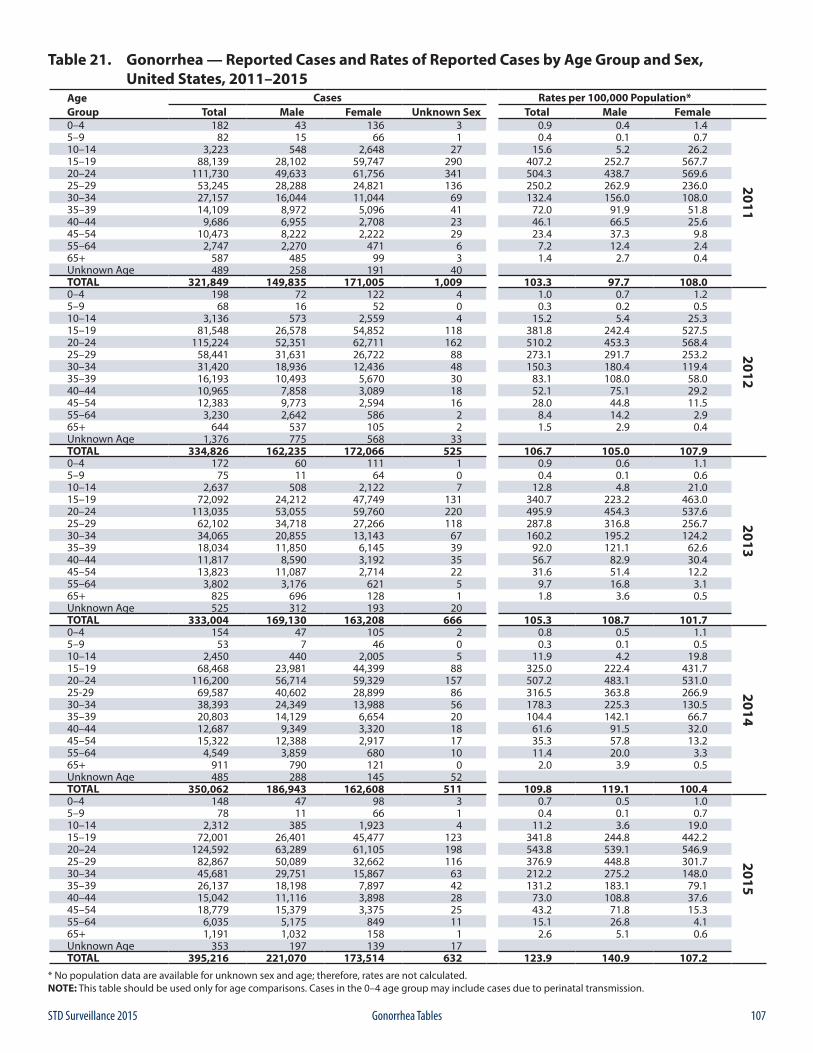
107STD Surveillance 2015 Gonorrhea Tables
Table 21. Gonorrhea — Reported Cases and Rates of Reported Cases by Age Group and Sex, United States, 2011–2015
Age Cases Rates per 100,000 Population*Group Total Male Female Unknown Sex Total Male Female0–4 182 43 136 3 0.9 0.4 1.4
2011
5–9 82 15 66 1 0.4 0.1 0.710–14 3,223 548 2,648 27 15.6 5.2 26.215–19 88,139 28,102 59,747 290 407.2 252.7 567.720–24 111,730 49,633 61,756 341 504.3 438.7 569.625–29 53,245 28,288 24,821 136 250.2 262.9 236.030–34 27,157 16,044 11,044 69 132.4 156.0 108.035–39 14,109 8,972 5,096 41 72.0 91.9 51.840–44 9,686 6,955 2,708 23 46.1 66.5 25.645–54 10,473 8,222 2,222 29 23.4 37.3 9.855–64 2,747 2,270 471 6 7.2 12.4 2.465+ 587 485 99 3 1.4 2.7 0.4Unknown Age 489 258 191 40TOTAL 321,849 149,835 171,005 1,009 103.3 97.7 108.00–4 198 72 122 4 1.0 0.7 1.2
2012
5–9 68 16 52 0 0.3 0.2 0.510–14 3,136 573 2,559 4 15.2 5.4 25.315–19 81,548 26,578 54,852 118 381.8 242.4 527.520–24 115,224 52,351 62,711 162 510.2 453.3 568.425–29 58,441 31,631 26,722 88 273.1 291.7 253.230–34 31,420 18,936 12,436 48 150.3 180.4 119.435–39 16,193 10,493 5,670 30 83.1 108.0 58.040–44 10,965 7,858 3,089 18 52.1 75.1 29.245–54 12,383 9,773 2,594 16 28.0 44.8 11.555–64 3,230 2,642 586 2 8.4 14.2 2.965+ 644 537 105 2 1.5 2.9 0.4Unknown Age 1,376 775 568 33TOTAL 334,826 162,235 172,066 525 106.7 105.0 107.90–4 172 60 111 1 0.9 0.6 1.1
2013
5–9 75 11 64 0 0.4 0.1 0.610–14 2,637 508 2,122 7 12.8 4.8 21.015–19 72,092 24,212 47,749 131 340.7 223.2 463.020–24 113,035 53,055 59,760 220 495.9 454.3 537.625–29 62,102 34,718 27,266 118 287.8 316.8 256.730–34 34,065 20,855 13,143 67 160.2 195.2 124.235–39 18,034 11,850 6,145 39 92.0 121.1 62.640–44 11,817 8,590 3,192 35 56.7 82.9 30.445–54 13,823 11,087 2,714 22 31.6 51.4 12.255–64 3,802 3,176 621 5 9.7 16.8 3.165+ 825 696 128 1 1.8 3.6 0.5Unknown Age 525 312 193 20TOTAL 333,004 169,130 163,208 666 105.3 108.7 101.70–4 154 47 105 2 0.8 0.5 1.1
2014
5–9 53 7 46 0 0.3 0.1 0.510–14 2,450 440 2,005 5 11.9 4.2 19.815–19 68,468 23,981 44,399 88 325.0 222.4 431.720–24 116,200 56,714 59,329 157 507.2 483.1 531.025-29 69,587 40,602 28,899 86 316.5 363.8 266.930–34 38,393 24,349 13,988 56 178.3 225.3 130.535–39 20,803 14,129 6,654 20 104.4 142.1 66.740–44 12,687 9,349 3,320 18 61.6 91.5 32.045–54 15,322 12,388 2,917 17 35.3 57.8 13.255–64 4,549 3,859 680 10 11.4 20.0 3.365+ 911 790 121 0 2.0 3.9 0.5Unknown Age 485 288 145 52TOTAL 350,062 186,943 162,608 511 109.8 119.1 100.40–4 148 47 98 3 0.7 0.5 1.0
2015
5–9 78 11 66 1 0.4 0.1 0.710–14 2,312 385 1,923 4 11.2 3.6 19.015–19 72,001 26,401 45,477 123 341.8 244.8 442.220–24 124,592 63,289 61,105 198 543.8 539.1 546.925–29 82,867 50,089 32,662 116 376.9 448.8 301.730–34 45,681 29,751 15,867 63 212.2 275.2 148.035–39 26,137 18,198 7,897 42 131.2 183.1 79.140–44 15,042 11,116 3,898 28 73.0 108.8 37.645–54 18,779 15,379 3,375 25 43.2 71.8 15.355–64 6,035 5,175 849 11 15.1 26.8 4.165+ 1,191 1,032 158 1 2.6 5.1 0.6Unknown Age 353 197 139 17TOTAL 395,216 221,070 173,514 632 123.9 140.9 107.2
* No population data are available for unknown sex and age; therefore, rates are not calculated.NOTE: This table should be used only for age comparisons. Cases in the 0–4 age group may include cases due to perinatal transmission.
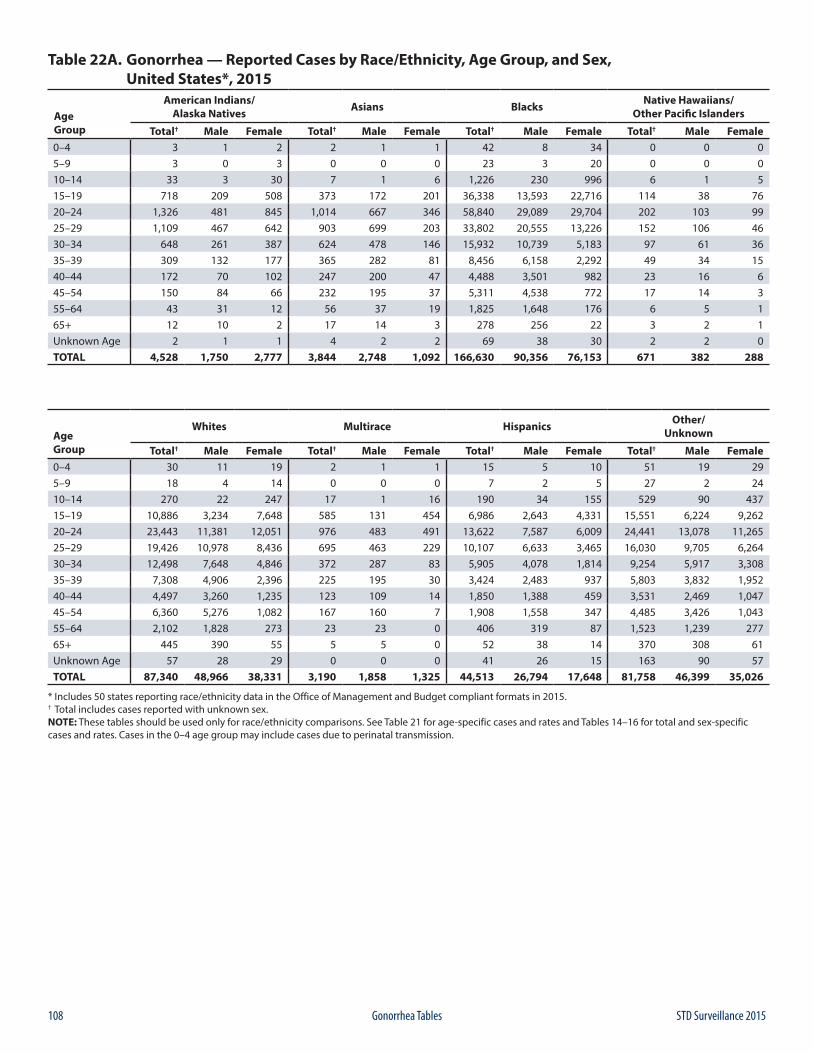
108 STD Surveillance 2015Gonorrhea Tables
Table 22A. Gonorrhea — Reported Cases by Race/Ethnicity, Age Group, and Sex, United States*, 2015
Age Group
American Indians/Alaska Natives Asians Blacks Native Hawaiians/
Other Pacific Islanders
Total† Male Female Total† Male Female Total† Male Female Total† Male Female0–4 3 1 2 2 1 1 42 8 34 0 0 05–9 3 0 3 0 0 0 23 3 20 0 0 010–14 33 3 30 7 1 6 1,226 230 996 6 1 515–19 718 209 508 373 172 201 36,338 13,593 22,716 114 38 7620–24 1,326 481 845 1,014 667 346 58,840 29,089 29,704 202 103 9925–29 1,109 467 642 903 699 203 33,802 20,555 13,226 152 106 4630–34 648 261 387 624 478 146 15,932 10,739 5,183 97 61 3635–39 309 132 177 365 282 81 8,456 6,158 2,292 49 34 1540–44 172 70 102 247 200 47 4,488 3,501 982 23 16 645–54 150 84 66 232 195 37 5,311 4,538 772 17 14 355–64 43 31 12 56 37 19 1,825 1,648 176 6 5 165+ 12 10 2 17 14 3 278 256 22 3 2 1Unknown Age 2 1 1 4 2 2 69 38 30 2 2 0TOTAL 4,528 1,750 2,777 3,844 2,748 1,092 166,630 90,356 76,153 671 382 288
Age Group
Whites Multirace Hispanics Other/Unknown
Total† Male Female Total† Male Female Total† Male Female Total† Male Female0–4 30 11 19 2 1 1 15 5 10 51 19 295–9 18 4 14 0 0 0 7 2 5 27 2 2410–14 270 22 247 17 1 16 190 34 155 529 90 43715–19 10,886 3,234 7,648 585 131 454 6,986 2,643 4,331 15,551 6,224 9,26220–24 23,443 11,381 12,051 976 483 491 13,622 7,587 6,009 24,441 13,078 11,26525–29 19,426 10,978 8,436 695 463 229 10,107 6,633 3,465 16,030 9,705 6,26430–34 12,498 7,648 4,846 372 287 83 5,905 4,078 1,814 9,254 5,917 3,30835–39 7,308 4,906 2,396 225 195 30 3,424 2,483 937 5,803 3,832 1,95240–44 4,497 3,260 1,235 123 109 14 1,850 1,388 459 3,531 2,469 1,04745–54 6,360 5,276 1,082 167 160 7 1,908 1,558 347 4,485 3,426 1,04355–64 2,102 1,828 273 23 23 0 406 319 87 1,523 1,239 27765+ 445 390 55 5 5 0 52 38 14 370 308 61Unknown Age 57 28 29 0 0 0 41 26 15 163 90 57TOTAL 87,340 48,966 38,331 3,190 1,858 1,325 44,513 26,794 17,648 81,758 46,399 35,026
* Includes 50 states reporting race/ethnicity data in the Office of Management and Budget compliant formats in 2015.† Total includes cases reported with unknown sex.NOTE: These tables should be used only for race/ethnicity comparisons. See Table 21 for age-specific cases and rates and Tables 14–16 for total and sex-specific cases and rates. Cases in the 0–4 age group may include cases due to perinatal transmission.
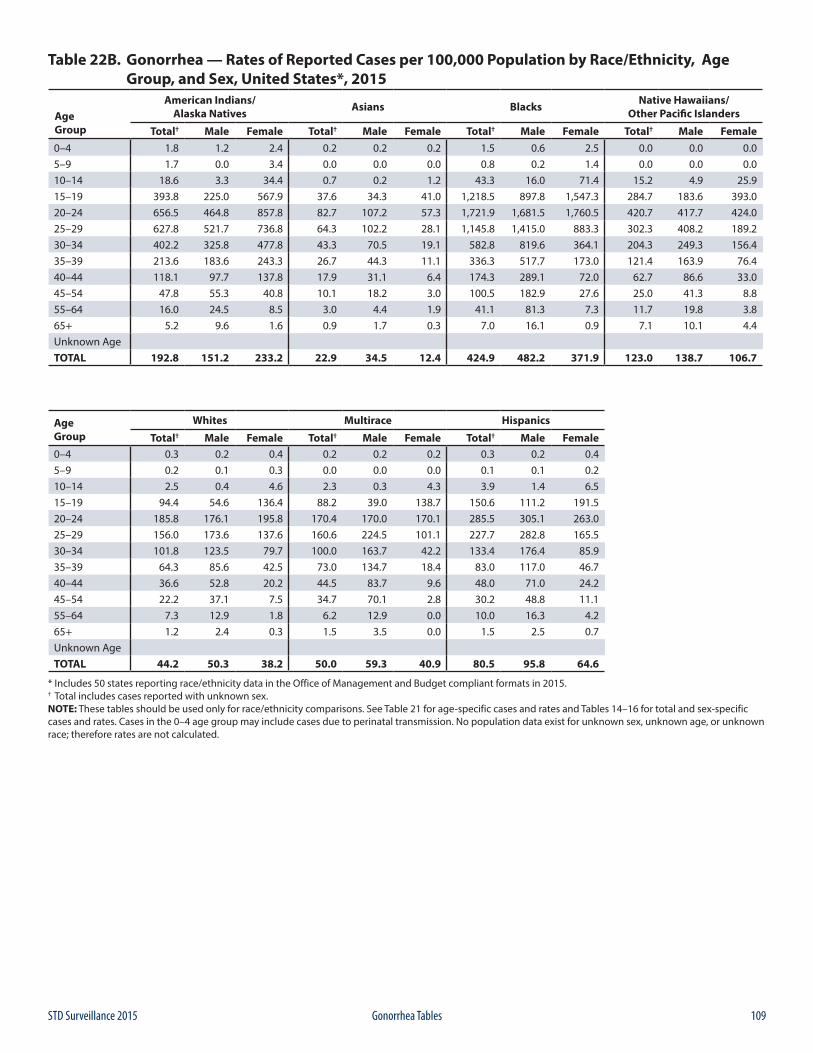
109STD Surveillance 2015 Gonorrhea Tables
Table 22B. Gonorrhea — Rates of Reported Cases per 100,000 Population by Race/Ethnicity, Age Group, and Sex, United States*, 2015
Age Group
American Indians/Alaska Natives Asians Blacks Native Hawaiians/
Other Pacific Islanders
Total† Male Female Total† Male Female Total† Male Female Total† Male Female0–4 1.8 1.2 2.4 0.2 0.2 0.2 1.5 0.6 2.5 0.0 0.0 0.05–9 1.7 0.0 3.4 0.0 0.0 0.0 0.8 0.2 1.4 0.0 0.0 0.010–14 18.6 3.3 34.4 0.7 0.2 1.2 43.3 16.0 71.4 15.2 4.9 25.915–19 393.8 225.0 567.9 37.6 34.3 41.0 1,218.5 897.8 1,547.3 284.7 183.6 393.020–24 656.5 464.8 857.8 82.7 107.2 57.3 1,721.9 1,681.5 1,760.5 420.7 417.7 424.025–29 627.8 521.7 736.8 64.3 102.2 28.1 1,145.8 1,415.0 883.3 302.3 408.2 189.230–34 402.2 325.8 477.8 43.3 70.5 19.1 582.8 819.6 364.1 204.3 249.3 156.435–39 213.6 183.6 243.3 26.7 44.3 11.1 336.3 517.7 173.0 121.4 163.9 76.440–44 118.1 97.7 137.8 17.9 31.1 6.4 174.3 289.1 72.0 62.7 86.6 33.045–54 47.8 55.3 40.8 10.1 18.2 3.0 100.5 182.9 27.6 25.0 41.3 8.855–64 16.0 24.5 8.5 3.0 4.4 1.9 41.1 81.3 7.3 11.7 19.8 3.865+ 5.2 9.6 1.6 0.9 1.7 0.3 7.0 16.1 0.9 7.1 10.1 4.4Unknown AgeTOTAL 192.8 151.2 233.2 22.9 34.5 12.4 424.9 482.2 371.9 123.0 138.7 106.7
Age Group
Whites Multirace Hispanics
Total† Male Female Total† Male Female Total† Male Female0–4 0.3 0.2 0.4 0.2 0.2 0.2 0.3 0.2 0.45–9 0.2 0.1 0.3 0.0 0.0 0.0 0.1 0.1 0.210–14 2.5 0.4 4.6 2.3 0.3 4.3 3.9 1.4 6.515–19 94.4 54.6 136.4 88.2 39.0 138.7 150.6 111.2 191.520–24 185.8 176.1 195.8 170.4 170.0 170.1 285.5 305.1 263.025–29 156.0 173.6 137.6 160.6 224.5 101.1 227.7 282.8 165.530–34 101.8 123.5 79.7 100.0 163.7 42.2 133.4 176.4 85.935–39 64.3 85.6 42.5 73.0 134.7 18.4 83.0 117.0 46.740–44 36.6 52.8 20.2 44.5 83.7 9.6 48.0 71.0 24.245–54 22.2 37.1 7.5 34.7 70.1 2.8 30.2 48.8 11.155–64 7.3 12.9 1.8 6.2 12.9 0.0 10.0 16.3 4.265+ 1.2 2.4 0.3 1.5 3.5 0.0 1.5 2.5 0.7Unknown AgeTOTAL 44.2 50.3 38.2 50.0 59.3 40.9 80.5 95.8 64.6
* Includes 50 states reporting race/ethnicity data in the Office of Management and Budget compliant formats in 2015.† Total includes cases reported with unknown sex.NOTE: These tables should be used only for race/ethnicity comparisons. See Table 21 for age-specific cases and rates and Tables 14–16 for total and sex-specific cases and rates. Cases in the 0–4 age group may include cases due to perinatal transmission. No population data exist for unknown sex, unknown age, or unknown race; therefore rates are not calculated.
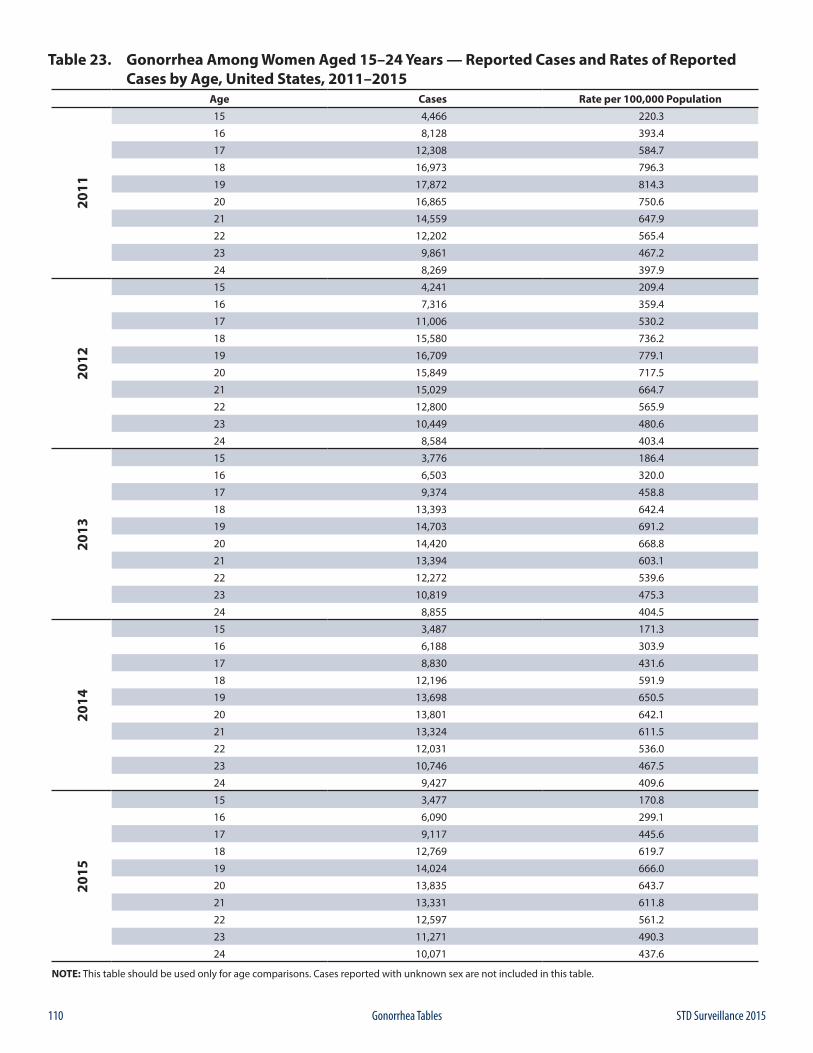
110 STD Surveillance 2015Gonorrhea Tables
Table 23. Gonorrhea Among Women Aged 15–24 Years — Reported Cases and Rates of Reported Cases by Age, United States, 2011–2015
Age Cases Rate per 100,000 Population20
11
15 4,466 220.3
16 8,128 393.4
17 12,308 584.7
18 16,973 796.3
19 17,872 814.3
20 16,865 750.6
21 14,559 647.9
22 12,202 565.4
23 9,861 467.2
24 8,269 397.9
2012
15 4,241 209.4
16 7,316 359.4
17 11,006 530.2
18 15,580 736.2
19 16,709 779.1
20 15,849 717.5
21 15,029 664.7
22 12,800 565.9
23 10,449 480.6
24 8,584 403.4
2013
15 3,776 186.4
16 6,503 320.0
17 9,374 458.8
18 13,393 642.4
19 14,703 691.2
20 14,420 668.8
21 13,394 603.1
22 12,272 539.6
23 10,819 475.3
24 8,855 404.5
2014
15 3,487 171.3
16 6,188 303.9
17 8,830 431.6
18 12,196 591.9
19 13,698 650.5
20 13,801 642.1
21 13,324 611.5
22 12,031 536.0
23 10,746 467.5
24 9,427 409.6
2015
15 3,477 170.8
16 6,090 299.1
17 9,117 445.6
18 12,769 619.7
19 14,024 666.0
20 13,835 643.7
21 13,331 611.8
22 12,597 561.2
23 11,271 490.3
24 10,071 437.6
NOTE: This table should be used only for age comparisons. Cases reported with unknown sex are not included in this table.
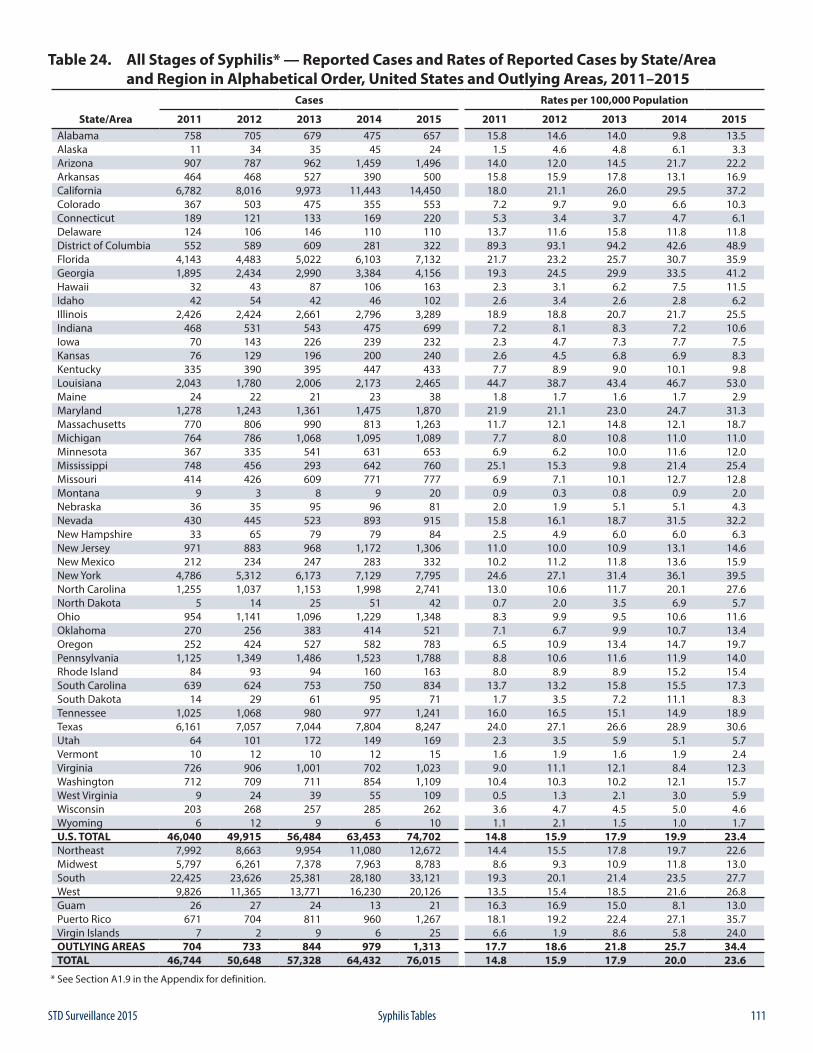
111STD Surveillance 2015 Syphilis Tables
Table 24. All Stages of Syphilis* — Reported Cases and Rates of Reported Cases by State/Area and Region in Alphabetical Order, United States and Outlying Areas, 2011–2015
Cases Rates per 100,000 Population
State/Area 2011 2012 2013 2014 2015 2011 2012 2013 2014 2015Alabama 758 705 679 475 657 15.8 14.6 14.0 9.8 13.5Alaska 11 34 35 45 24 1.5 4.6 4.8 6.1 3.3Arizona 907 787 962 1,459 1,496 14.0 12.0 14.5 21.7 22.2Arkansas 464 468 527 390 500 15.8 15.9 17.8 13.1 16.9California 6,782 8,016 9,973 11,443 14,450 18.0 21.1 26.0 29.5 37.2Colorado 367 503 475 355 553 7.2 9.7 9.0 6.6 10.3Connecticut 189 121 133 169 220 5.3 3.4 3.7 4.7 6.1Delaware 124 106 146 110 110 13.7 11.6 15.8 11.8 11.8District of Columbia 552 589 609 281 322 89.3 93.1 94.2 42.6 48.9Florida 4,143 4,483 5,022 6,103 7,132 21.7 23.2 25.7 30.7 35.9Georgia 1,895 2,434 2,990 3,384 4,156 19.3 24.5 29.9 33.5 41.2Hawaii 32 43 87 106 163 2.3 3.1 6.2 7.5 11.5Idaho 42 54 42 46 102 2.6 3.4 2.6 2.8 6.2Illinois 2,426 2,424 2,661 2,796 3,289 18.9 18.8 20.7 21.7 25.5Indiana 468 531 543 475 699 7.2 8.1 8.3 7.2 10.6Iowa 70 143 226 239 232 2.3 4.7 7.3 7.7 7.5Kansas 76 129 196 200 240 2.6 4.5 6.8 6.9 8.3Kentucky 335 390 395 447 433 7.7 8.9 9.0 10.1 9.8Louisiana 2,043 1,780 2,006 2,173 2,465 44.7 38.7 43.4 46.7 53.0Maine 24 22 21 23 38 1.8 1.7 1.6 1.7 2.9Maryland 1,278 1,243 1,361 1,475 1,870 21.9 21.1 23.0 24.7 31.3Massachusetts 770 806 990 813 1,263 11.7 12.1 14.8 12.1 18.7Michigan 764 786 1,068 1,095 1,089 7.7 8.0 10.8 11.0 11.0Minnesota 367 335 541 631 653 6.9 6.2 10.0 11.6 12.0Mississippi 748 456 293 642 760 25.1 15.3 9.8 21.4 25.4Missouri 414 426 609 771 777 6.9 7.1 10.1 12.7 12.8Montana 9 3 8 9 20 0.9 0.3 0.8 0.9 2.0Nebraska 36 35 95 96 81 2.0 1.9 5.1 5.1 4.3Nevada 430 445 523 893 915 15.8 16.1 18.7 31.5 32.2New Hampshire 33 65 79 79 84 2.5 4.9 6.0 6.0 6.3New Jersey 971 883 968 1,172 1,306 11.0 10.0 10.9 13.1 14.6New Mexico 212 234 247 283 332 10.2 11.2 11.8 13.6 15.9New York 4,786 5,312 6,173 7,129 7,795 24.6 27.1 31.4 36.1 39.5North Carolina 1,255 1,037 1,153 1,998 2,741 13.0 10.6 11.7 20.1 27.6North Dakota 5 14 25 51 42 0.7 2.0 3.5 6.9 5.7Ohio 954 1,141 1,096 1,229 1,348 8.3 9.9 9.5 10.6 11.6Oklahoma 270 256 383 414 521 7.1 6.7 9.9 10.7 13.4Oregon 252 424 527 582 783 6.5 10.9 13.4 14.7 19.7Pennsylvania 1,125 1,349 1,486 1,523 1,788 8.8 10.6 11.6 11.9 14.0Rhode Island 84 93 94 160 163 8.0 8.9 8.9 15.2 15.4South Carolina 639 624 753 750 834 13.7 13.2 15.8 15.5 17.3South Dakota 14 29 61 95 71 1.7 3.5 7.2 11.1 8.3Tennessee 1,025 1,068 980 977 1,241 16.0 16.5 15.1 14.9 18.9Texas 6,161 7,057 7,044 7,804 8,247 24.0 27.1 26.6 28.9 30.6Utah 64 101 172 149 169 2.3 3.5 5.9 5.1 5.7Vermont 10 12 10 12 15 1.6 1.9 1.6 1.9 2.4Virginia 726 906 1,001 702 1,023 9.0 11.1 12.1 8.4 12.3Washington 712 709 711 854 1,109 10.4 10.3 10.2 12.1 15.7West Virginia 9 24 39 55 109 0.5 1.3 2.1 3.0 5.9Wisconsin 203 268 257 285 262 3.6 4.7 4.5 5.0 4.6Wyoming 6 12 9 6 10 1.1 2.1 1.5 1.0 1.7U.S. TOTAL 46,040 49,915 56,484 63,453 74,702 14.8 15.9 17.9 19.9 23.4Northeast 7,992 8,663 9,954 11,080 12,672 14.4 15.5 17.8 19.7 22.6Midwest 5,797 6,261 7,378 7,963 8,783 8.6 9.3 10.9 11.8 13.0South 22,425 23,626 25,381 28,180 33,121 19.3 20.1 21.4 23.5 27.7West 9,826 11,365 13,771 16,230 20,126 13.5 15.4 18.5 21.6 26.8Guam 26 27 24 13 21 16.3 16.9 15.0 8.1 13.0Puerto Rico 671 704 811 960 1,267 18.1 19.2 22.4 27.1 35.7Virgin Islands 7 2 9 6 25 6.6 1.9 8.6 5.8 24.0OUTLYING AREAS 704 733 844 979 1,313 17.7 18.6 21.8 25.7 34.4TOTAL 46,744 50,648 57,328 64,432 76,015 14.8 15.9 17.9 20.0 23.6
* See Section A1.9 in the Appendix for definition.
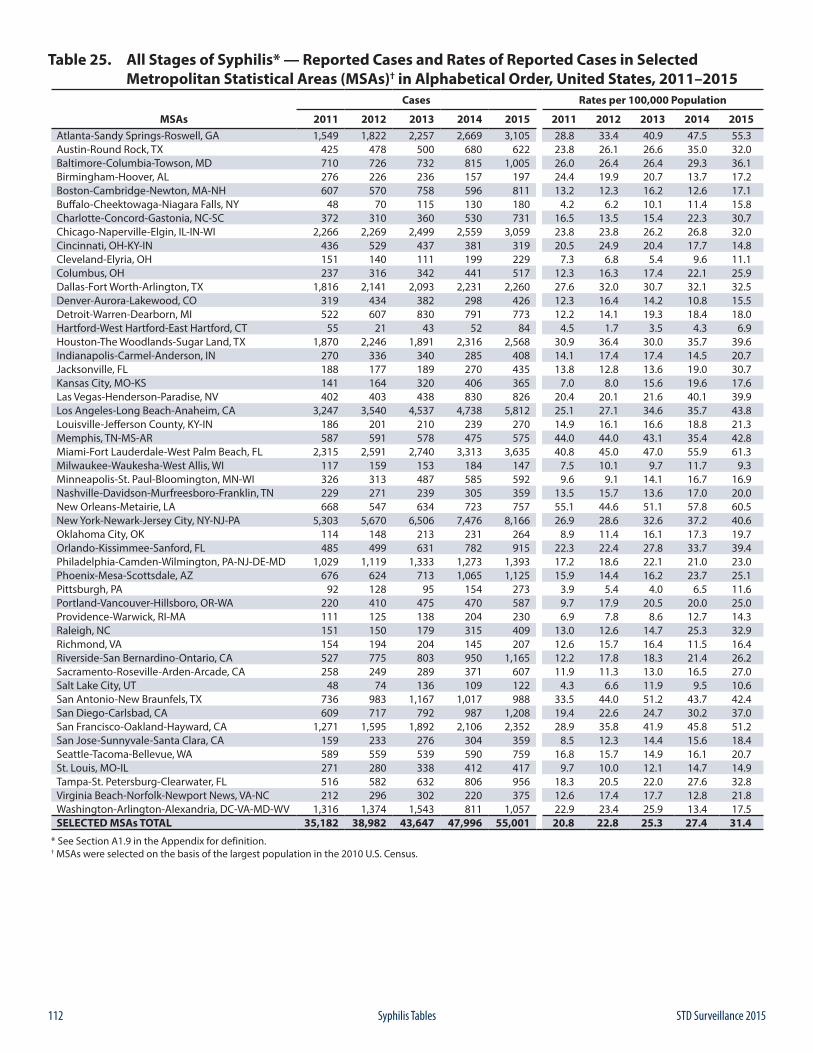
112 STD Surveillance 2015Syphilis Tables
Table 25. All Stages of Syphilis* — Reported Cases and Rates of Reported Cases in Selected Metropolitan Statistical Areas (MSAs)† in Alphabetical Order, United States, 2011–2015
Cases Rates per 100,000 Population
MSAs 2011 2012 2013 2014 2015 2011 2012 2013 2014 2015Atlanta-Sandy Springs-Roswell, GA 1,549 1,822 2,257 2,669 3,105 28.8 33.4 40.9 47.5 55.3Austin-Round Rock, TX 425 478 500 680 622 23.8 26.1 26.6 35.0 32.0Baltimore-Columbia-Towson, MD 710 726 732 815 1,005 26.0 26.4 26.4 29.3 36.1Birmingham-Hoover, AL 276 226 236 157 197 24.4 19.9 20.7 13.7 17.2Boston-Cambridge-Newton, MA-NH 607 570 758 596 811 13.2 12.3 16.2 12.6 17.1Buffalo-Cheektowaga-Niagara Falls, NY 48 70 115 130 180 4.2 6.2 10.1 11.4 15.8Charlotte-Concord-Gastonia, NC-SC 372 310 360 530 731 16.5 13.5 15.4 22.3 30.7Chicago-Naperville-Elgin, IL-IN-WI 2,266 2,269 2,499 2,559 3,059 23.8 23.8 26.2 26.8 32.0Cincinnati, OH-KY-IN 436 529 437 381 319 20.5 24.9 20.4 17.7 14.8Cleveland-Elyria, OH 151 140 111 199 229 7.3 6.8 5.4 9.6 11.1Columbus, OH 237 316 342 441 517 12.3 16.3 17.4 22.1 25.9Dallas-Fort Worth-Arlington, TX 1,816 2,141 2,093 2,231 2,260 27.6 32.0 30.7 32.1 32.5Denver-Aurora-Lakewood, CO 319 434 382 298 426 12.3 16.4 14.2 10.8 15.5Detroit-Warren-Dearborn, MI 522 607 830 791 773 12.2 14.1 19.3 18.4 18.0Hartford-West Hartford-East Hartford, CT 55 21 43 52 84 4.5 1.7 3.5 4.3 6.9Houston-The Woodlands-Sugar Land, TX 1,870 2,246 1,891 2,316 2,568 30.9 36.4 30.0 35.7 39.6Indianapolis-Carmel-Anderson, IN 270 336 340 285 408 14.1 17.4 17.4 14.5 20.7Jacksonville, FL 188 177 189 270 435 13.8 12.8 13.6 19.0 30.7Kansas City, MO-KS 141 164 320 406 365 7.0 8.0 15.6 19.6 17.6Las Vegas-Henderson-Paradise, NV 402 403 438 830 826 20.4 20.1 21.6 40.1 39.9Los Angeles-Long Beach-Anaheim, CA 3,247 3,540 4,537 4,738 5,812 25.1 27.1 34.6 35.7 43.8Louisville-Jefferson County, KY-IN 186 201 210 239 270 14.9 16.1 16.6 18.8 21.3Memphis, TN-MS-AR 587 591 578 475 575 44.0 44.0 43.1 35.4 42.8Miami-Fort Lauderdale-West Palm Beach, FL 2,315 2,591 2,740 3,313 3,635 40.8 45.0 47.0 55.9 61.3Milwaukee-Waukesha-West Allis, WI 117 159 153 184 147 7.5 10.1 9.7 11.7 9.3Minneapolis-St. Paul-Bloomington, MN-WI 326 313 487 585 592 9.6 9.1 14.1 16.7 16.9Nashville-Davidson-Murfreesboro-Franklin, TN 229 271 239 305 359 13.5 15.7 13.6 17.0 20.0New Orleans-Metairie, LA 668 547 634 723 757 55.1 44.6 51.1 57.8 60.5New York-Newark-Jersey City, NY-NJ-PA 5,303 5,670 6,506 7,476 8,166 26.9 28.6 32.6 37.2 40.6Oklahoma City, OK 114 148 213 231 264 8.9 11.4 16.1 17.3 19.7Orlando-Kissimmee-Sanford, FL 485 499 631 782 915 22.3 22.4 27.8 33.7 39.4Philadelphia-Camden-Wilmington, PA-NJ-DE-MD 1,029 1,119 1,333 1,273 1,393 17.2 18.6 22.1 21.0 23.0Phoenix-Mesa-Scottsdale, AZ 676 624 713 1,065 1,125 15.9 14.4 16.2 23.7 25.1Pittsburgh, PA 92 128 95 154 273 3.9 5.4 4.0 6.5 11.6Portland-Vancouver-Hillsboro, OR-WA 220 410 475 470 587 9.7 17.9 20.5 20.0 25.0Providence-Warwick, RI-MA 111 125 138 204 230 6.9 7.8 8.6 12.7 14.3Raleigh, NC 151 150 179 315 409 13.0 12.6 14.7 25.3 32.9Richmond, VA 154 194 204 145 207 12.6 15.7 16.4 11.5 16.4Riverside-San Bernardino-Ontario, CA 527 775 803 950 1,165 12.2 17.8 18.3 21.4 26.2Sacramento-Roseville-Arden-Arcade, CA 258 249 289 371 607 11.9 11.3 13.0 16.5 27.0Salt Lake City, UT 48 74 136 109 122 4.3 6.6 11.9 9.5 10.6San Antonio-New Braunfels, TX 736 983 1,167 1,017 988 33.5 44.0 51.2 43.7 42.4San Diego-Carlsbad, CA 609 717 792 987 1,208 19.4 22.6 24.7 30.2 37.0San Francisco-Oakland-Hayward, CA 1,271 1,595 1,892 2,106 2,352 28.9 35.8 41.9 45.8 51.2San Jose-Sunnyvale-Santa Clara, CA 159 233 276 304 359 8.5 12.3 14.4 15.6 18.4Seattle-Tacoma-Bellevue, WA 589 559 539 590 759 16.8 15.7 14.9 16.1 20.7St. Louis, MO-IL 271 280 338 412 417 9.7 10.0 12.1 14.7 14.9Tampa-St. Petersburg-Clearwater, FL 516 582 632 806 956 18.3 20.5 22.0 27.6 32.8Virginia Beach-Norfolk-Newport News, VA-NC 212 296 302 220 375 12.6 17.4 17.7 12.8 21.8Washington-Arlington-Alexandria, DC-VA-MD-WV 1,316 1,374 1,543 811 1,057 22.9 23.4 25.9 13.4 17.5SELECTED MSAs TOTAL 35,182 38,982 43,647 47,996 55,001 20.8 22.8 25.3 27.4 31.4
* See Section A1.9 in the Appendix for definition.† MSAs were selected on the basis of the largest population in the 2010 U.S. Census.
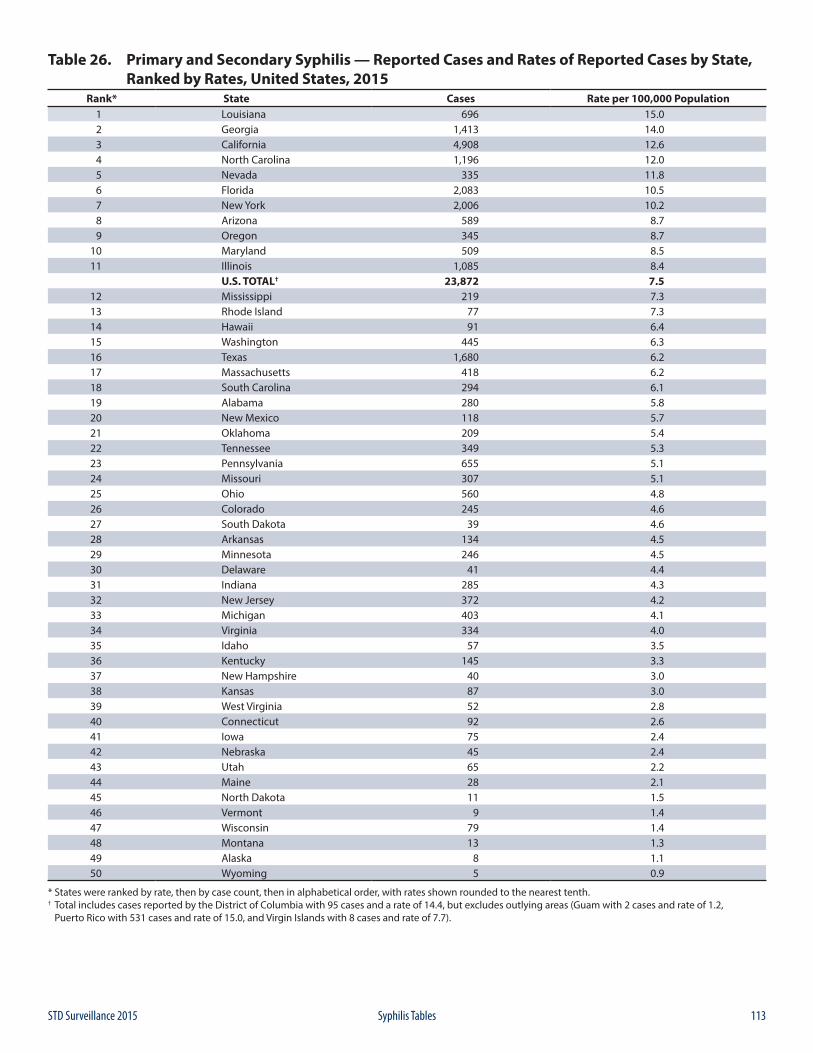
113STD Surveillance 2015 Syphilis Tables
Table 26. Primary and Secondary Syphilis — Reported Cases and Rates of Reported Cases by State, Ranked by Rates, United States, 2015
Rank* State Cases Rate per 100,000 Population1 Louisiana 696 15.02 Georgia 1,413 14.03 California 4,908 12.64 North Carolina 1,196 12.05 Nevada 335 11.86 Florida 2,083 10.57 New York 2,006 10.28 Arizona 589 8.79 Oregon 345 8.7
10 Maryland 509 8.511 Illinois 1,085 8.4
U.S. TOTAL† 23,872 7.512 Mississippi 219 7.313 Rhode Island 77 7.314 Hawaii 91 6.415 Washington 445 6.316 Texas 1,680 6.217 Massachusetts 418 6.218 South Carolina 294 6.119 Alabama 280 5.820 New Mexico 118 5.721 Oklahoma 209 5.422 Tennessee 349 5.323 Pennsylvania 655 5.124 Missouri 307 5.125 Ohio 560 4.826 Colorado 245 4.627 South Dakota 39 4.628 Arkansas 134 4.529 Minnesota 246 4.530 Delaware 41 4.431 Indiana 285 4.332 New Jersey 372 4.233 Michigan 403 4.134 Virginia 334 4.035 Idaho 57 3.536 Kentucky 145 3.337 New Hampshire 40 3.038 Kansas 87 3.039 West Virginia 52 2.840 Connecticut 92 2.641 Iowa 75 2.442 Nebraska 45 2.443 Utah 65 2.244 Maine 28 2.145 North Dakota 11 1.546 Vermont 9 1.447 Wisconsin 79 1.448 Montana 13 1.349 Alaska 8 1.150 Wyoming 5 0.9
* States were ranked by rate, then by case count, then in alphabetical order, with rates shown rounded to the nearest tenth.† Total includes cases reported by the District of Columbia with 95 cases and a rate of 14.4, but excludes outlying areas (Guam with 2 cases and rate of 1.2, Puerto Rico with 531 cases and rate of 15.0, and Virgin Islands with 8 cases and rate of 7.7).
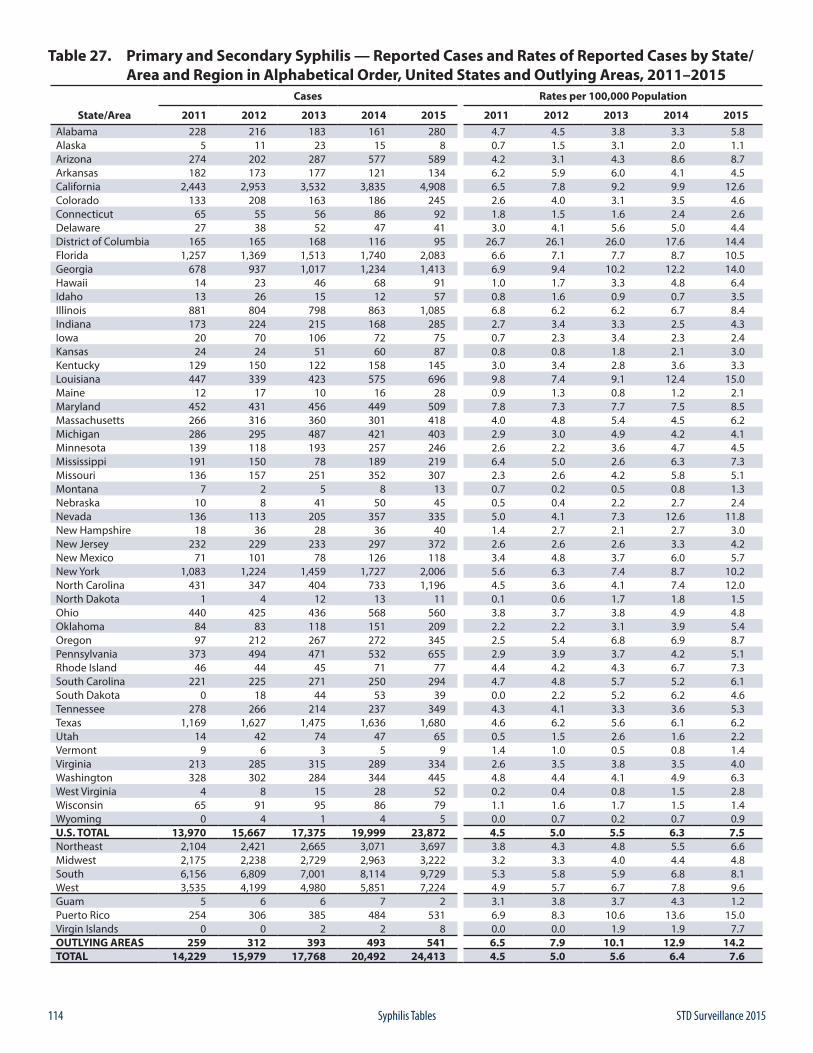
114 STD Surveillance 2015Syphilis Tables
Table 27. Primary and Secondary Syphilis — Reported Cases and Rates of Reported Cases by State/ Area and Region in Alphabetical Order, United States and Outlying Areas, 2011–2015
Cases Rates per 100,000 Population
State/Area 2011 2012 2013 2014 2015 2011 2012 2013 2014 2015Alabama 228 216 183 161 280 4.7 4.5 3.8 3.3 5.8Alaska 5 11 23 15 8 0.7 1.5 3.1 2.0 1.1Arizona 274 202 287 577 589 4.2 3.1 4.3 8.6 8.7Arkansas 182 173 177 121 134 6.2 5.9 6.0 4.1 4.5California 2,443 2,953 3,532 3,835 4,908 6.5 7.8 9.2 9.9 12.6Colorado 133 208 163 186 245 2.6 4.0 3.1 3.5 4.6Connecticut 65 55 56 86 92 1.8 1.5 1.6 2.4 2.6Delaware 27 38 52 47 41 3.0 4.1 5.6 5.0 4.4District of Columbia 165 165 168 116 95 26.7 26.1 26.0 17.6 14.4Florida 1,257 1,369 1,513 1,740 2,083 6.6 7.1 7.7 8.7 10.5Georgia 678 937 1,017 1,234 1,413 6.9 9.4 10.2 12.2 14.0Hawaii 14 23 46 68 91 1.0 1.7 3.3 4.8 6.4Idaho 13 26 15 12 57 0.8 1.6 0.9 0.7 3.5Illinois 881 804 798 863 1,085 6.8 6.2 6.2 6.7 8.4Indiana 173 224 215 168 285 2.7 3.4 3.3 2.5 4.3Iowa 20 70 106 72 75 0.7 2.3 3.4 2.3 2.4Kansas 24 24 51 60 87 0.8 0.8 1.8 2.1 3.0Kentucky 129 150 122 158 145 3.0 3.4 2.8 3.6 3.3Louisiana 447 339 423 575 696 9.8 7.4 9.1 12.4 15.0Maine 12 17 10 16 28 0.9 1.3 0.8 1.2 2.1Maryland 452 431 456 449 509 7.8 7.3 7.7 7.5 8.5Massachusetts 266 316 360 301 418 4.0 4.8 5.4 4.5 6.2Michigan 286 295 487 421 403 2.9 3.0 4.9 4.2 4.1Minnesota 139 118 193 257 246 2.6 2.2 3.6 4.7 4.5Mississippi 191 150 78 189 219 6.4 5.0 2.6 6.3 7.3Missouri 136 157 251 352 307 2.3 2.6 4.2 5.8 5.1Montana 7 2 5 8 13 0.7 0.2 0.5 0.8 1.3Nebraska 10 8 41 50 45 0.5 0.4 2.2 2.7 2.4Nevada 136 113 205 357 335 5.0 4.1 7.3 12.6 11.8New Hampshire 18 36 28 36 40 1.4 2.7 2.1 2.7 3.0New Jersey 232 229 233 297 372 2.6 2.6 2.6 3.3 4.2New Mexico 71 101 78 126 118 3.4 4.8 3.7 6.0 5.7New York 1,083 1,224 1,459 1,727 2,006 5.6 6.3 7.4 8.7 10.2North Carolina 431 347 404 733 1,196 4.5 3.6 4.1 7.4 12.0North Dakota 1 4 12 13 11 0.1 0.6 1.7 1.8 1.5Ohio 440 425 436 568 560 3.8 3.7 3.8 4.9 4.8Oklahoma 84 83 118 151 209 2.2 2.2 3.1 3.9 5.4Oregon 97 212 267 272 345 2.5 5.4 6.8 6.9 8.7Pennsylvania 373 494 471 532 655 2.9 3.9 3.7 4.2 5.1Rhode Island 46 44 45 71 77 4.4 4.2 4.3 6.7 7.3South Carolina 221 225 271 250 294 4.7 4.8 5.7 5.2 6.1South Dakota 0 18 44 53 39 0.0 2.2 5.2 6.2 4.6Tennessee 278 266 214 237 349 4.3 4.1 3.3 3.6 5.3Texas 1,169 1,627 1,475 1,636 1,680 4.6 6.2 5.6 6.1 6.2Utah 14 42 74 47 65 0.5 1.5 2.6 1.6 2.2Vermont 9 6 3 5 9 1.4 1.0 0.5 0.8 1.4Virginia 213 285 315 289 334 2.6 3.5 3.8 3.5 4.0Washington 328 302 284 344 445 4.8 4.4 4.1 4.9 6.3West Virginia 4 8 15 28 52 0.2 0.4 0.8 1.5 2.8Wisconsin 65 91 95 86 79 1.1 1.6 1.7 1.5 1.4Wyoming 0 4 1 4 5 0.0 0.7 0.2 0.7 0.9U.S. TOTAL 13,970 15,667 17,375 19,999 23,872 4.5 5.0 5.5 6.3 7.5Northeast 2,104 2,421 2,665 3,071 3,697 3.8 4.3 4.8 5.5 6.6Midwest 2,175 2,238 2,729 2,963 3,222 3.2 3.3 4.0 4.4 4.8South 6,156 6,809 7,001 8,114 9,729 5.3 5.8 5.9 6.8 8.1West 3,535 4,199 4,980 5,851 7,224 4.9 5.7 6.7 7.8 9.6Guam 5 6 6 7 2 3.1 3.8 3.7 4.3 1.2Puerto Rico 254 306 385 484 531 6.9 8.3 10.6 13.6 15.0Virgin Islands 0 0 2 2 8 0.0 0.0 1.9 1.9 7.7OUTLYING AREAS 259 312 393 493 541 6.5 7.9 10.1 12.9 14.2TOTAL 14,229 15,979 17,768 20,492 24,413 4.5 5.0 5.6 6.4 7.6
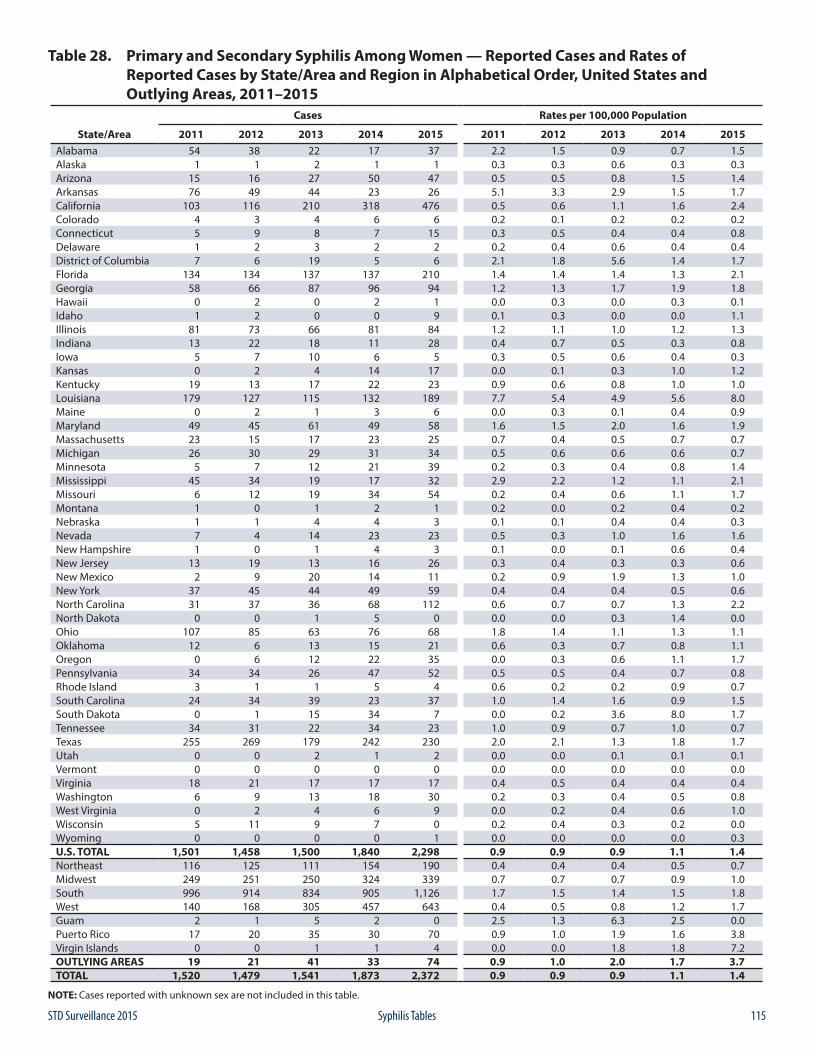
115STD Surveillance 2015 Syphilis Tables
Table 28. Primary and Secondary Syphilis Among Women — Reported Cases and Rates of Reported Cases by State/Area and Region in Alphabetical Order, United States and Outlying Areas, 2011–2015
Cases Rates per 100,000 Population
State/Area 2011 2012 2013 2014 2015 2011 2012 2013 2014 2015Alabama 54 38 22 17 37 2.2 1.5 0.9 0.7 1.5Alaska 1 1 2 1 1 0.3 0.3 0.6 0.3 0.3Arizona 15 16 27 50 47 0.5 0.5 0.8 1.5 1.4Arkansas 76 49 44 23 26 5.1 3.3 2.9 1.5 1.7California 103 116 210 318 476 0.5 0.6 1.1 1.6 2.4Colorado 4 3 4 6 6 0.2 0.1 0.2 0.2 0.2Connecticut 5 9 8 7 15 0.3 0.5 0.4 0.4 0.8Delaware 1 2 3 2 2 0.2 0.4 0.6 0.4 0.4District of Columbia 7 6 19 5 6 2.1 1.8 5.6 1.4 1.7Florida 134 134 137 137 210 1.4 1.4 1.4 1.3 2.1Georgia 58 66 87 96 94 1.2 1.3 1.7 1.9 1.8Hawaii 0 2 0 2 1 0.0 0.3 0.0 0.3 0.1Idaho 1 2 0 0 9 0.1 0.3 0.0 0.0 1.1Illinois 81 73 66 81 84 1.2 1.1 1.0 1.2 1.3Indiana 13 22 18 11 28 0.4 0.7 0.5 0.3 0.8Iowa 5 7 10 6 5 0.3 0.5 0.6 0.4 0.3Kansas 0 2 4 14 17 0.0 0.1 0.3 1.0 1.2Kentucky 19 13 17 22 23 0.9 0.6 0.8 1.0 1.0Louisiana 179 127 115 132 189 7.7 5.4 4.9 5.6 8.0Maine 0 2 1 3 6 0.0 0.3 0.1 0.4 0.9Maryland 49 45 61 49 58 1.6 1.5 2.0 1.6 1.9Massachusetts 23 15 17 23 25 0.7 0.4 0.5 0.7 0.7Michigan 26 30 29 31 34 0.5 0.6 0.6 0.6 0.7Minnesota 5 7 12 21 39 0.2 0.3 0.4 0.8 1.4Mississippi 45 34 19 17 32 2.9 2.2 1.2 1.1 2.1Missouri 6 12 19 34 54 0.2 0.4 0.6 1.1 1.7Montana 1 0 1 2 1 0.2 0.0 0.2 0.4 0.2Nebraska 1 1 4 4 3 0.1 0.1 0.4 0.4 0.3Nevada 7 4 14 23 23 0.5 0.3 1.0 1.6 1.6New Hampshire 1 0 1 4 3 0.1 0.0 0.1 0.6 0.4New Jersey 13 19 13 16 26 0.3 0.4 0.3 0.3 0.6New Mexico 2 9 20 14 11 0.2 0.9 1.9 1.3 1.0New York 37 45 44 49 59 0.4 0.4 0.4 0.5 0.6North Carolina 31 37 36 68 112 0.6 0.7 0.7 1.3 2.2North Dakota 0 0 1 5 0 0.0 0.0 0.3 1.4 0.0Ohio 107 85 63 76 68 1.8 1.4 1.1 1.3 1.1Oklahoma 12 6 13 15 21 0.6 0.3 0.7 0.8 1.1Oregon 0 6 12 22 35 0.0 0.3 0.6 1.1 1.7Pennsylvania 34 34 26 47 52 0.5 0.5 0.4 0.7 0.8Rhode Island 3 1 1 5 4 0.6 0.2 0.2 0.9 0.7South Carolina 24 34 39 23 37 1.0 1.4 1.6 0.9 1.5South Dakota 0 1 15 34 7 0.0 0.2 3.6 8.0 1.7Tennessee 34 31 22 34 23 1.0 0.9 0.7 1.0 0.7Texas 255 269 179 242 230 2.0 2.1 1.3 1.8 1.7Utah 0 0 2 1 2 0.0 0.0 0.1 0.1 0.1Vermont 0 0 0 0 0 0.0 0.0 0.0 0.0 0.0Virginia 18 21 17 17 17 0.4 0.5 0.4 0.4 0.4Washington 6 9 13 18 30 0.2 0.3 0.4 0.5 0.8West Virginia 0 2 4 6 9 0.0 0.2 0.4 0.6 1.0Wisconsin 5 11 9 7 0 0.2 0.4 0.3 0.2 0.0Wyoming 0 0 0 0 1 0.0 0.0 0.0 0.0 0.3U.S. TOTAL 1,501 1,458 1,500 1,840 2,298 0.9 0.9 0.9 1.1 1.4Northeast 116 125 111 154 190 0.4 0.4 0.4 0.5 0.7Midwest 249 251 250 324 339 0.7 0.7 0.7 0.9 1.0South 996 914 834 905 1,126 1.7 1.5 1.4 1.5 1.8West 140 168 305 457 643 0.4 0.5 0.8 1.2 1.7Guam 2 1 5 2 0 2.5 1.3 6.3 2.5 0.0Puerto Rico 17 20 35 30 70 0.9 1.0 1.9 1.6 3.8Virgin Islands 0 0 1 1 4 0.0 0.0 1.8 1.8 7.2OUTLYING AREAS 19 21 41 33 74 0.9 1.0 2.0 1.7 3.7TOTAL 1,520 1,479 1,541 1,873 2,372 0.9 0.9 0.9 1.1 1.4
NOTE: Cases reported with unknown sex are not included in this table.
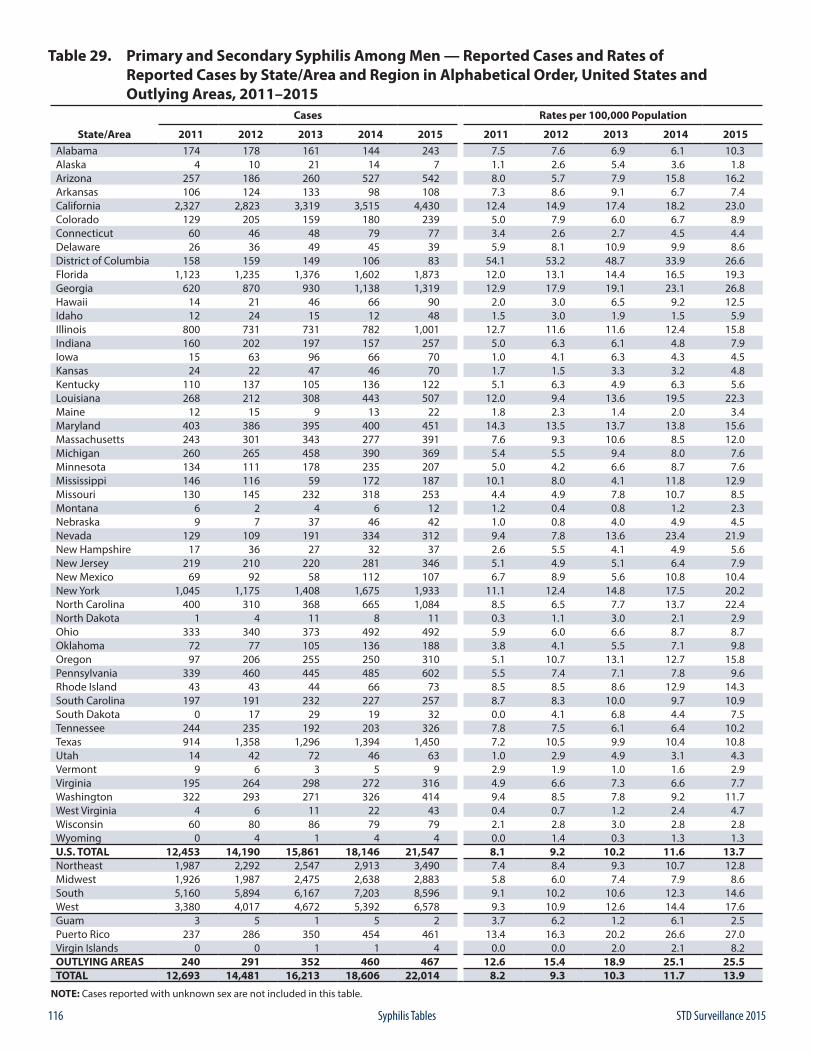
116 STD Surveillance 2015Syphilis Tables
Table 29. Primary and Secondary Syphilis Among Men — Reported Cases and Rates of Reported Cases by State/Area and Region in Alphabetical Order, United States and Outlying Areas, 2011–2015
Cases Rates per 100,000 Population
State/Area 2011 2012 2013 2014 2015 2011 2012 2013 2014 2015Alabama 174 178 161 144 243 7.5 7.6 6.9 6.1 10.3Alaska 4 10 21 14 7 1.1 2.6 5.4 3.6 1.8Arizona 257 186 260 527 542 8.0 5.7 7.9 15.8 16.2Arkansas 106 124 133 98 108 7.3 8.6 9.1 6.7 7.4California 2,327 2,823 3,319 3,515 4,430 12.4 14.9 17.4 18.2 23.0Colorado 129 205 159 180 239 5.0 7.9 6.0 6.7 8.9Connecticut 60 46 48 79 77 3.4 2.6 2.7 4.5 4.4Delaware 26 36 49 45 39 5.9 8.1 10.9 9.9 8.6District of Columbia 158 159 149 106 83 54.1 53.2 48.7 33.9 26.6Florida 1,123 1,235 1,376 1,602 1,873 12.0 13.1 14.4 16.5 19.3Georgia 620 870 930 1,138 1,319 12.9 17.9 19.1 23.1 26.8Hawaii 14 21 46 66 90 2.0 3.0 6.5 9.2 12.5Idaho 12 24 15 12 48 1.5 3.0 1.9 1.5 5.9Illinois 800 731 731 782 1,001 12.7 11.6 11.6 12.4 15.8Indiana 160 202 197 157 257 5.0 6.3 6.1 4.8 7.9Iowa 15 63 96 66 70 1.0 4.1 6.3 4.3 4.5Kansas 24 22 47 46 70 1.7 1.5 3.3 3.2 4.8Kentucky 110 137 105 136 122 5.1 6.3 4.9 6.3 5.6Louisiana 268 212 308 443 507 12.0 9.4 13.6 19.5 22.3Maine 12 15 9 13 22 1.8 2.3 1.4 2.0 3.4Maryland 403 386 395 400 451 14.3 13.5 13.7 13.8 15.6Massachusetts 243 301 343 277 391 7.6 9.3 10.6 8.5 12.0Michigan 260 265 458 390 369 5.4 5.5 9.4 8.0 7.6Minnesota 134 111 178 235 207 5.0 4.2 6.6 8.7 7.6Mississippi 146 116 59 172 187 10.1 8.0 4.1 11.8 12.9Missouri 130 145 232 318 253 4.4 4.9 7.8 10.7 8.5Montana 6 2 4 6 12 1.2 0.4 0.8 1.2 2.3Nebraska 9 7 37 46 42 1.0 0.8 4.0 4.9 4.5Nevada 129 109 191 334 312 9.4 7.8 13.6 23.4 21.9New Hampshire 17 36 27 32 37 2.6 5.5 4.1 4.9 5.6New Jersey 219 210 220 281 346 5.1 4.9 5.1 6.4 7.9New Mexico 69 92 58 112 107 6.7 8.9 5.6 10.8 10.4New York 1,045 1,175 1,408 1,675 1,933 11.1 12.4 14.8 17.5 20.2North Carolina 400 310 368 665 1,084 8.5 6.5 7.7 13.7 22.4North Dakota 1 4 11 8 11 0.3 1.1 3.0 2.1 2.9Ohio 333 340 373 492 492 5.9 6.0 6.6 8.7 8.7Oklahoma 72 77 105 136 188 3.8 4.1 5.5 7.1 9.8Oregon 97 206 255 250 310 5.1 10.7 13.1 12.7 15.8Pennsylvania 339 460 445 485 602 5.5 7.4 7.1 7.8 9.6Rhode Island 43 43 44 66 73 8.5 8.5 8.6 12.9 14.3South Carolina 197 191 232 227 257 8.7 8.3 10.0 9.7 10.9South Dakota 0 17 29 19 32 0.0 4.1 6.8 4.4 7.5Tennessee 244 235 192 203 326 7.8 7.5 6.1 6.4 10.2Texas 914 1,358 1,296 1,394 1,450 7.2 10.5 9.9 10.4 10.8Utah 14 42 72 46 63 1.0 2.9 4.9 3.1 4.3Vermont 9 6 3 5 9 2.9 1.9 1.0 1.6 2.9Virginia 195 264 298 272 316 4.9 6.6 7.3 6.6 7.7Washington 322 293 271 326 414 9.4 8.5 7.8 9.2 11.7West Virginia 4 6 11 22 43 0.4 0.7 1.2 2.4 4.7Wisconsin 60 80 86 79 79 2.1 2.8 3.0 2.8 2.8Wyoming 0 4 1 4 4 0.0 1.4 0.3 1.3 1.3U.S. TOTAL 12,453 14,190 15,861 18,146 21,547 8.1 9.2 10.2 11.6 13.7Northeast 1,987 2,292 2,547 2,913 3,490 7.4 8.4 9.3 10.7 12.8Midwest 1,926 1,987 2,475 2,638 2,883 5.8 6.0 7.4 7.9 8.6South 5,160 5,894 6,167 7,203 8,596 9.1 10.2 10.6 12.3 14.6West 3,380 4,017 4,672 5,392 6,578 9.3 10.9 12.6 14.4 17.6Guam 3 5 1 5 2 3.7 6.2 1.2 6.1 2.5Puerto Rico 237 286 350 454 461 13.4 16.3 20.2 26.6 27.0Virgin Islands 0 0 1 1 4 0.0 0.0 2.0 2.1 8.2OUTLYING AREAS 240 291 352 460 467 12.6 15.4 18.9 25.1 25.5TOTAL 12,693 14,481 16,213 18,606 22,014 8.2 9.3 10.3 11.7 13.9
NOTE: Cases reported with unknown sex are not included in this table.
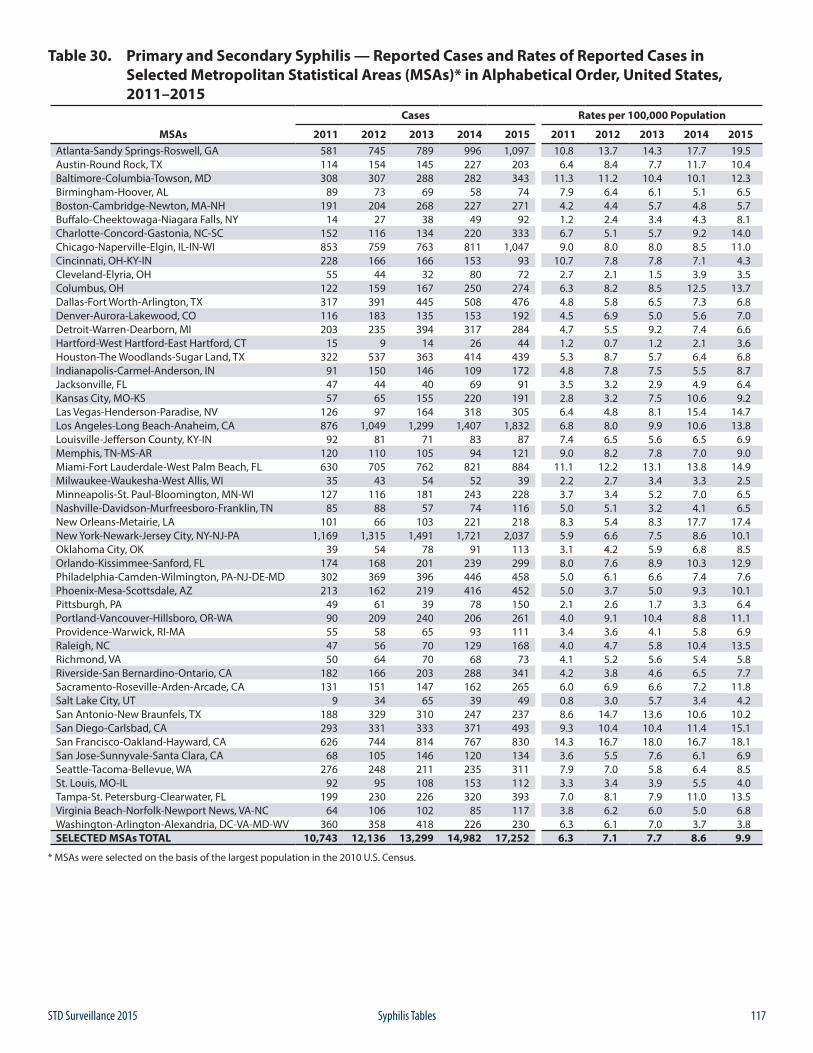
117STD Surveillance 2015 Syphilis Tables
Table 30. Primary and Secondary Syphilis — Reported Cases and Rates of Reported Cases in Selected Metropolitan Statistical Areas (MSAs)* in Alphabetical Order, United States, 2011–2015
Cases Rates per 100,000 Population
MSAs 2011 2012 2013 2014 2015 2011 2012 2013 2014 2015Atlanta-Sandy Springs-Roswell, GA 581 745 789 996 1,097 10.8 13.7 14.3 17.7 19.5Austin-Round Rock, TX 114 154 145 227 203 6.4 8.4 7.7 11.7 10.4Baltimore-Columbia-Towson, MD 308 307 288 282 343 11.3 11.2 10.4 10.1 12.3Birmingham-Hoover, AL 89 73 69 58 74 7.9 6.4 6.1 5.1 6.5Boston-Cambridge-Newton, MA-NH 191 204 268 227 271 4.2 4.4 5.7 4.8 5.7Buffalo-Cheektowaga-Niagara Falls, NY 14 27 38 49 92 1.2 2.4 3.4 4.3 8.1Charlotte-Concord-Gastonia, NC-SC 152 116 134 220 333 6.7 5.1 5.7 9.2 14.0Chicago-Naperville-Elgin, IL-IN-WI 853 759 763 811 1,047 9.0 8.0 8.0 8.5 11.0Cincinnati, OH-KY-IN 228 166 166 153 93 10.7 7.8 7.8 7.1 4.3Cleveland-Elyria, OH 55 44 32 80 72 2.7 2.1 1.5 3.9 3.5Columbus, OH 122 159 167 250 274 6.3 8.2 8.5 12.5 13.7Dallas-Fort Worth-Arlington, TX 317 391 445 508 476 4.8 5.8 6.5 7.3 6.8Denver-Aurora-Lakewood, CO 116 183 135 153 192 4.5 6.9 5.0 5.6 7.0Detroit-Warren-Dearborn, MI 203 235 394 317 284 4.7 5.5 9.2 7.4 6.6Hartford-West Hartford-East Hartford, CT 15 9 14 26 44 1.2 0.7 1.2 2.1 3.6Houston-The Woodlands-Sugar Land, TX 322 537 363 414 439 5.3 8.7 5.7 6.4 6.8Indianapolis-Carmel-Anderson, IN 91 150 146 109 172 4.8 7.8 7.5 5.5 8.7Jacksonville, FL 47 44 40 69 91 3.5 3.2 2.9 4.9 6.4Kansas City, MO-KS 57 65 155 220 191 2.8 3.2 7.5 10.6 9.2Las Vegas-Henderson-Paradise, NV 126 97 164 318 305 6.4 4.8 8.1 15.4 14.7Los Angeles-Long Beach-Anaheim, CA 876 1,049 1,299 1,407 1,832 6.8 8.0 9.9 10.6 13.8Louisville-Jefferson County, KY-IN 92 81 71 83 87 7.4 6.5 5.6 6.5 6.9Memphis, TN-MS-AR 120 110 105 94 121 9.0 8.2 7.8 7.0 9.0Miami-Fort Lauderdale-West Palm Beach, FL 630 705 762 821 884 11.1 12.2 13.1 13.8 14.9Milwaukee-Waukesha-West Allis, WI 35 43 54 52 39 2.2 2.7 3.4 3.3 2.5Minneapolis-St. Paul-Bloomington, MN-WI 127 116 181 243 228 3.7 3.4 5.2 7.0 6.5Nashville-Davidson-Murfreesboro-Franklin, TN 85 88 57 74 116 5.0 5.1 3.2 4.1 6.5New Orleans-Metairie, LA 101 66 103 221 218 8.3 5.4 8.3 17.7 17.4New York-Newark-Jersey City, NY-NJ-PA 1,169 1,315 1,491 1,721 2,037 5.9 6.6 7.5 8.6 10.1Oklahoma City, OK 39 54 78 91 113 3.1 4.2 5.9 6.8 8.5Orlando-Kissimmee-Sanford, FL 174 168 201 239 299 8.0 7.6 8.9 10.3 12.9Philadelphia-Camden-Wilmington, PA-NJ-DE-MD 302 369 396 446 458 5.0 6.1 6.6 7.4 7.6Phoenix-Mesa-Scottsdale, AZ 213 162 219 416 452 5.0 3.7 5.0 9.3 10.1Pittsburgh, PA 49 61 39 78 150 2.1 2.6 1.7 3.3 6.4Portland-Vancouver-Hillsboro, OR-WA 90 209 240 206 261 4.0 9.1 10.4 8.8 11.1Providence-Warwick, RI-MA 55 58 65 93 111 3.4 3.6 4.1 5.8 6.9Raleigh, NC 47 56 70 129 168 4.0 4.7 5.8 10.4 13.5Richmond, VA 50 64 70 68 73 4.1 5.2 5.6 5.4 5.8Riverside-San Bernardino-Ontario, CA 182 166 203 288 341 4.2 3.8 4.6 6.5 7.7Sacramento-Roseville-Arden-Arcade, CA 131 151 147 162 265 6.0 6.9 6.6 7.2 11.8Salt Lake City, UT 9 34 65 39 49 0.8 3.0 5.7 3.4 4.2San Antonio-New Braunfels, TX 188 329 310 247 237 8.6 14.7 13.6 10.6 10.2San Diego-Carlsbad, CA 293 331 333 371 493 9.3 10.4 10.4 11.4 15.1San Francisco-Oakland-Hayward, CA 626 744 814 767 830 14.3 16.7 18.0 16.7 18.1San Jose-Sunnyvale-Santa Clara, CA 68 105 146 120 134 3.6 5.5 7.6 6.1 6.9Seattle-Tacoma-Bellevue, WA 276 248 211 235 311 7.9 7.0 5.8 6.4 8.5St. Louis, MO-IL 92 95 108 153 112 3.3 3.4 3.9 5.5 4.0Tampa-St. Petersburg-Clearwater, FL 199 230 226 320 393 7.0 8.1 7.9 11.0 13.5Virginia Beach-Norfolk-Newport News, VA-NC 64 106 102 85 117 3.8 6.2 6.0 5.0 6.8Washington-Arlington-Alexandria, DC-VA-MD-WV 360 358 418 226 230 6.3 6.1 7.0 3.7 3.8SELECTED MSAs TOTAL 10,743 12,136 13,299 14,982 17,252 6.3 7.1 7.7 8.6 9.9
* MSAs were selected on the basis of the largest population in the 2010 U.S. Census.
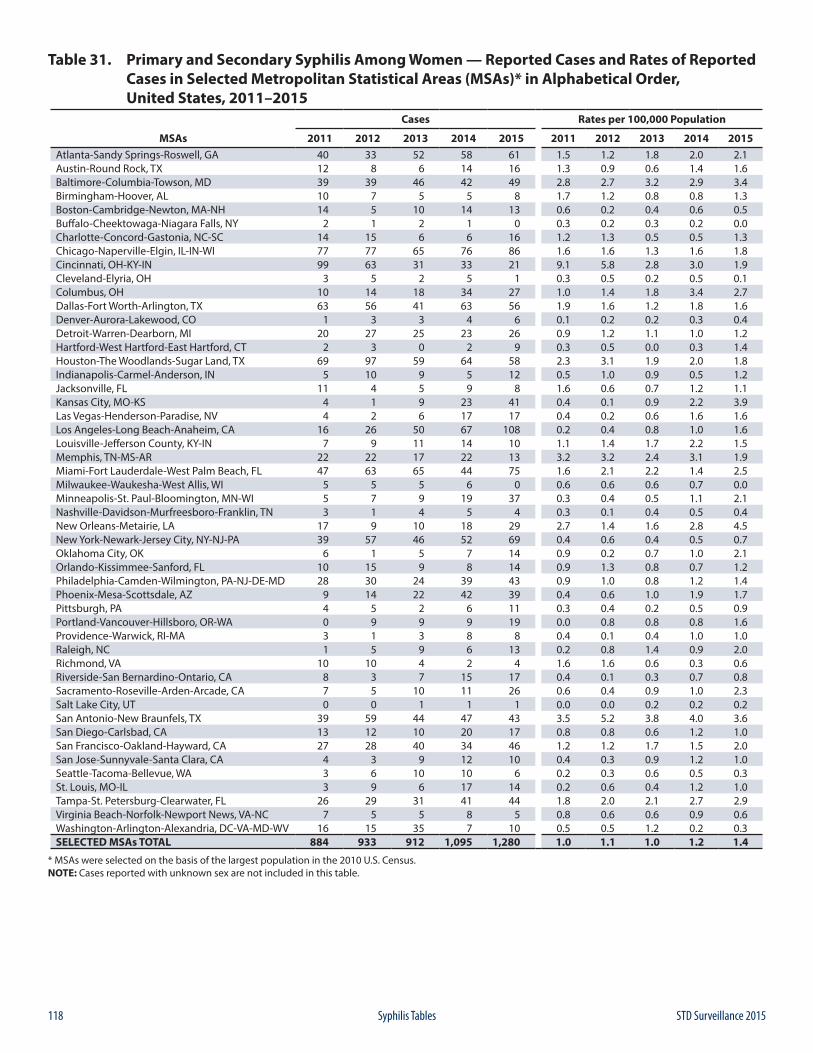
118 STD Surveillance 2015Syphilis Tables
Table 31. Primary and Secondary Syphilis Among Women — Reported Cases and Rates of Reported Cases in Selected Metropolitan Statistical Areas (MSAs)* in Alphabetical Order, United States, 2011–2015
Cases Rates per 100,000 Population
MSAs 2011 2012 2013 2014 2015 2011 2012 2013 2014 2015Atlanta-Sandy Springs-Roswell, GA 40 33 52 58 61 1.5 1.2 1.8 2.0 2.1Austin-Round Rock, TX 12 8 6 14 16 1.3 0.9 0.6 1.4 1.6Baltimore-Columbia-Towson, MD 39 39 46 42 49 2.8 2.7 3.2 2.9 3.4Birmingham-Hoover, AL 10 7 5 5 8 1.7 1.2 0.8 0.8 1.3Boston-Cambridge-Newton, MA-NH 14 5 10 14 13 0.6 0.2 0.4 0.6 0.5Buffalo-Cheektowaga-Niagara Falls, NY 2 1 2 1 0 0.3 0.2 0.3 0.2 0.0Charlotte-Concord-Gastonia, NC-SC 14 15 6 6 16 1.2 1.3 0.5 0.5 1.3Chicago-Naperville-Elgin, IL-IN-WI 77 77 65 76 86 1.6 1.6 1.3 1.6 1.8Cincinnati, OH-KY-IN 99 63 31 33 21 9.1 5.8 2.8 3.0 1.9Cleveland-Elyria, OH 3 5 2 5 1 0.3 0.5 0.2 0.5 0.1Columbus, OH 10 14 18 34 27 1.0 1.4 1.8 3.4 2.7Dallas-Fort Worth-Arlington, TX 63 56 41 63 56 1.9 1.6 1.2 1.8 1.6Denver-Aurora-Lakewood, CO 1 3 3 4 6 0.1 0.2 0.2 0.3 0.4Detroit-Warren-Dearborn, MI 20 27 25 23 26 0.9 1.2 1.1 1.0 1.2Hartford-West Hartford-East Hartford, CT 2 3 0 2 9 0.3 0.5 0.0 0.3 1.4Houston-The Woodlands-Sugar Land, TX 69 97 59 64 58 2.3 3.1 1.9 2.0 1.8Indianapolis-Carmel-Anderson, IN 5 10 9 5 12 0.5 1.0 0.9 0.5 1.2Jacksonville, FL 11 4 5 9 8 1.6 0.6 0.7 1.2 1.1Kansas City, MO-KS 4 1 9 23 41 0.4 0.1 0.9 2.2 3.9Las Vegas-Henderson-Paradise, NV 4 2 6 17 17 0.4 0.2 0.6 1.6 1.6Los Angeles-Long Beach-Anaheim, CA 16 26 50 67 108 0.2 0.4 0.8 1.0 1.6Louisville-Jefferson County, KY-IN 7 9 11 14 10 1.1 1.4 1.7 2.2 1.5Memphis, TN-MS-AR 22 22 17 22 13 3.2 3.2 2.4 3.1 1.9Miami-Fort Lauderdale-West Palm Beach, FL 47 63 65 44 75 1.6 2.1 2.2 1.4 2.5Milwaukee-Waukesha-West Allis, WI 5 5 5 6 0 0.6 0.6 0.6 0.7 0.0Minneapolis-St. Paul-Bloomington, MN-WI 5 7 9 19 37 0.3 0.4 0.5 1.1 2.1Nashville-Davidson-Murfreesboro-Franklin, TN 3 1 4 5 4 0.3 0.1 0.4 0.5 0.4New Orleans-Metairie, LA 17 9 10 18 29 2.7 1.4 1.6 2.8 4.5New York-Newark-Jersey City, NY-NJ-PA 39 57 46 52 69 0.4 0.6 0.4 0.5 0.7Oklahoma City, OK 6 1 5 7 14 0.9 0.2 0.7 1.0 2.1Orlando-Kissimmee-Sanford, FL 10 15 9 8 14 0.9 1.3 0.8 0.7 1.2Philadelphia-Camden-Wilmington, PA-NJ-DE-MD 28 30 24 39 43 0.9 1.0 0.8 1.2 1.4Phoenix-Mesa-Scottsdale, AZ 9 14 22 42 39 0.4 0.6 1.0 1.9 1.7Pittsburgh, PA 4 5 2 6 11 0.3 0.4 0.2 0.5 0.9Portland-Vancouver-Hillsboro, OR-WA 0 9 9 9 19 0.0 0.8 0.8 0.8 1.6Providence-Warwick, RI-MA 3 1 3 8 8 0.4 0.1 0.4 1.0 1.0Raleigh, NC 1 5 9 6 13 0.2 0.8 1.4 0.9 2.0Richmond, VA 10 10 4 2 4 1.6 1.6 0.6 0.3 0.6Riverside-San Bernardino-Ontario, CA 8 3 7 15 17 0.4 0.1 0.3 0.7 0.8Sacramento-Roseville-Arden-Arcade, CA 7 5 10 11 26 0.6 0.4 0.9 1.0 2.3Salt Lake City, UT 0 0 1 1 1 0.0 0.0 0.2 0.2 0.2San Antonio-New Braunfels, TX 39 59 44 47 43 3.5 5.2 3.8 4.0 3.6San Diego-Carlsbad, CA 13 12 10 20 17 0.8 0.8 0.6 1.2 1.0San Francisco-Oakland-Hayward, CA 27 28 40 34 46 1.2 1.2 1.7 1.5 2.0San Jose-Sunnyvale-Santa Clara, CA 4 3 9 12 10 0.4 0.3 0.9 1.2 1.0Seattle-Tacoma-Bellevue, WA 3 6 10 10 6 0.2 0.3 0.6 0.5 0.3St. Louis, MO-IL 3 9 6 17 14 0.2 0.6 0.4 1.2 1.0Tampa-St. Petersburg-Clearwater, FL 26 29 31 41 44 1.8 2.0 2.1 2.7 2.9Virginia Beach-Norfolk-Newport News, VA-NC 7 5 5 8 5 0.8 0.6 0.6 0.9 0.6Washington-Arlington-Alexandria, DC-VA-MD-WV 16 15 35 7 10 0.5 0.5 1.2 0.2 0.3SELECTED MSAs TOTAL 884 933 912 1,095 1,280 1.0 1.1 1.0 1.2 1.4
* MSAs were selected on the basis of the largest population in the 2010 U.S. Census.NOTE: Cases reported with unknown sex are not included in this table.
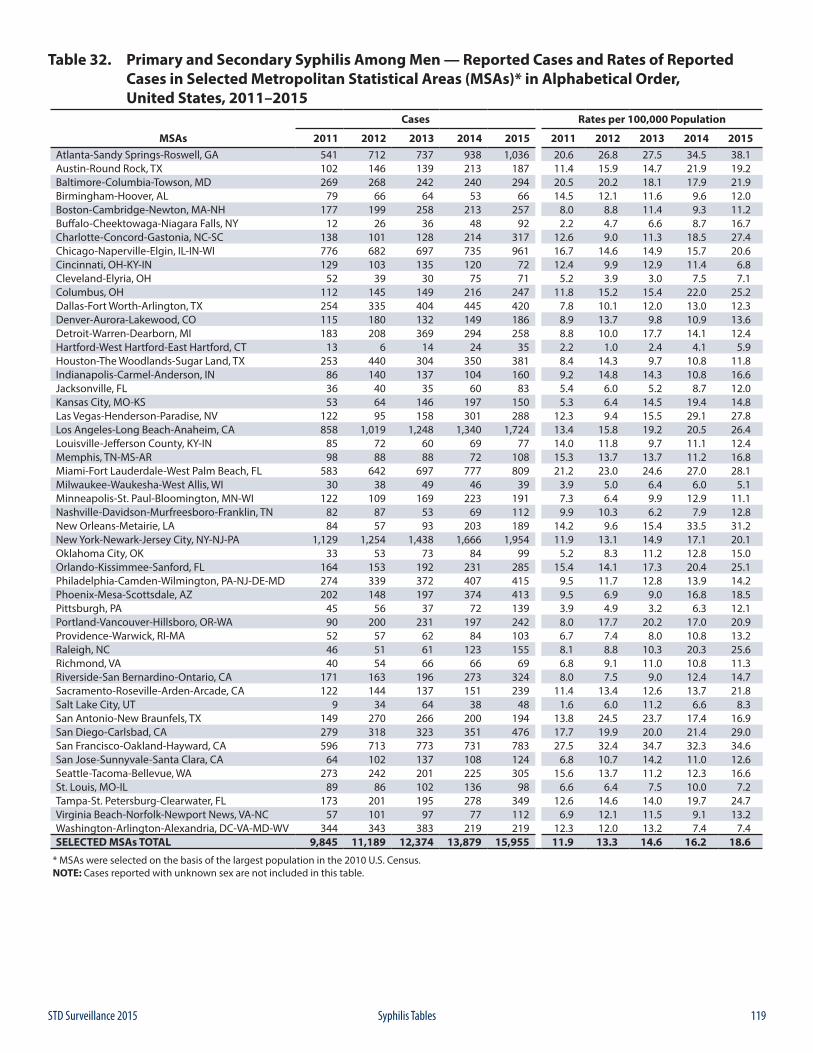
119STD Surveillance 2015 Syphilis Tables
Table 32. Primary and Secondary Syphilis Among Men — Reported Cases and Rates of Reported Cases in Selected Metropolitan Statistical Areas (MSAs)* in Alphabetical Order, United States, 2011–2015
Cases Rates per 100,000 Population
MSAs 2011 2012 2013 2014 2015 2011 2012 2013 2014 2015Atlanta-Sandy Springs-Roswell, GA 541 712 737 938 1,036 20.6 26.8 27.5 34.5 38.1Austin-Round Rock, TX 102 146 139 213 187 11.4 15.9 14.7 21.9 19.2Baltimore-Columbia-Towson, MD 269 268 242 240 294 20.5 20.2 18.1 17.9 21.9Birmingham-Hoover, AL 79 66 64 53 66 14.5 12.1 11.6 9.6 12.0Boston-Cambridge-Newton, MA-NH 177 199 258 213 257 8.0 8.8 11.4 9.3 11.2Buffalo-Cheektowaga-Niagara Falls, NY 12 26 36 48 92 2.2 4.7 6.6 8.7 16.7Charlotte-Concord-Gastonia, NC-SC 138 101 128 214 317 12.6 9.0 11.3 18.5 27.4Chicago-Naperville-Elgin, IL-IN-WI 776 682 697 735 961 16.7 14.6 14.9 15.7 20.6Cincinnati, OH-KY-IN 129 103 135 120 72 12.4 9.9 12.9 11.4 6.8Cleveland-Elyria, OH 52 39 30 75 71 5.2 3.9 3.0 7.5 7.1Columbus, OH 112 145 149 216 247 11.8 15.2 15.4 22.0 25.2Dallas-Fort Worth-Arlington, TX 254 335 404 445 420 7.8 10.1 12.0 13.0 12.3Denver-Aurora-Lakewood, CO 115 180 132 149 186 8.9 13.7 9.8 10.9 13.6Detroit-Warren-Dearborn, MI 183 208 369 294 258 8.8 10.0 17.7 14.1 12.4Hartford-West Hartford-East Hartford, CT 13 6 14 24 35 2.2 1.0 2.4 4.1 5.9Houston-The Woodlands-Sugar Land, TX 253 440 304 350 381 8.4 14.3 9.7 10.8 11.8Indianapolis-Carmel-Anderson, IN 86 140 137 104 160 9.2 14.8 14.3 10.8 16.6Jacksonville, FL 36 40 35 60 83 5.4 6.0 5.2 8.7 12.0Kansas City, MO-KS 53 64 146 197 150 5.3 6.4 14.5 19.4 14.8Las Vegas-Henderson-Paradise, NV 122 95 158 301 288 12.3 9.4 15.5 29.1 27.8Los Angeles-Long Beach-Anaheim, CA 858 1,019 1,248 1,340 1,724 13.4 15.8 19.2 20.5 26.4Louisville-Jefferson County, KY-IN 85 72 60 69 77 14.0 11.8 9.7 11.1 12.4Memphis, TN-MS-AR 98 88 88 72 108 15.3 13.7 13.7 11.2 16.8Miami-Fort Lauderdale-West Palm Beach, FL 583 642 697 777 809 21.2 23.0 24.6 27.0 28.1Milwaukee-Waukesha-West Allis, WI 30 38 49 46 39 3.9 5.0 6.4 6.0 5.1Minneapolis-St. Paul-Bloomington, MN-WI 122 109 169 223 191 7.3 6.4 9.9 12.9 11.1Nashville-Davidson-Murfreesboro-Franklin, TN 82 87 53 69 112 9.9 10.3 6.2 7.9 12.8New Orleans-Metairie, LA 84 57 93 203 189 14.2 9.6 15.4 33.5 31.2New York-Newark-Jersey City, NY-NJ-PA 1,129 1,254 1,438 1,666 1,954 11.9 13.1 14.9 17.1 20.1Oklahoma City, OK 33 53 73 84 99 5.2 8.3 11.2 12.8 15.0Orlando-Kissimmee-Sanford, FL 164 153 192 231 285 15.4 14.1 17.3 20.4 25.1Philadelphia-Camden-Wilmington, PA-NJ-DE-MD 274 339 372 407 415 9.5 11.7 12.8 13.9 14.2Phoenix-Mesa-Scottsdale, AZ 202 148 197 374 413 9.5 6.9 9.0 16.8 18.5Pittsburgh, PA 45 56 37 72 139 3.9 4.9 3.2 6.3 12.1Portland-Vancouver-Hillsboro, OR-WA 90 200 231 197 242 8.0 17.7 20.2 17.0 20.9Providence-Warwick, RI-MA 52 57 62 84 103 6.7 7.4 8.0 10.8 13.2Raleigh, NC 46 51 61 123 155 8.1 8.8 10.3 20.3 25.6Richmond, VA 40 54 66 66 69 6.8 9.1 11.0 10.8 11.3Riverside-San Bernardino-Ontario, CA 171 163 196 273 324 8.0 7.5 9.0 12.4 14.7Sacramento-Roseville-Arden-Arcade, CA 122 144 137 151 239 11.4 13.4 12.6 13.7 21.8Salt Lake City, UT 9 34 64 38 48 1.6 6.0 11.2 6.6 8.3San Antonio-New Braunfels, TX 149 270 266 200 194 13.8 24.5 23.7 17.4 16.9San Diego-Carlsbad, CA 279 318 323 351 476 17.7 19.9 20.0 21.4 29.0San Francisco-Oakland-Hayward, CA 596 713 773 731 783 27.5 32.4 34.7 32.3 34.6San Jose-Sunnyvale-Santa Clara, CA 64 102 137 108 124 6.8 10.7 14.2 11.0 12.6Seattle-Tacoma-Bellevue, WA 273 242 201 225 305 15.6 13.7 11.2 12.3 16.6St. Louis, MO-IL 89 86 102 136 98 6.6 6.4 7.5 10.0 7.2Tampa-St. Petersburg-Clearwater, FL 173 201 195 278 349 12.6 14.6 14.0 19.7 24.7Virginia Beach-Norfolk-Newport News, VA-NC 57 101 97 77 112 6.9 12.1 11.5 9.1 13.2Washington-Arlington-Alexandria, DC-VA-MD-WV 344 343 383 219 219 12.3 12.0 13.2 7.4 7.4SELECTED MSAs TOTAL 9,845 11,189 12,374 13,879 15,955 11.9 13.3 14.6 16.2 18.6
* MSAs were selected on the basis of the largest population in the 2010 U.S. Census.NOTE: Cases reported with unknown sex are not included in this table.
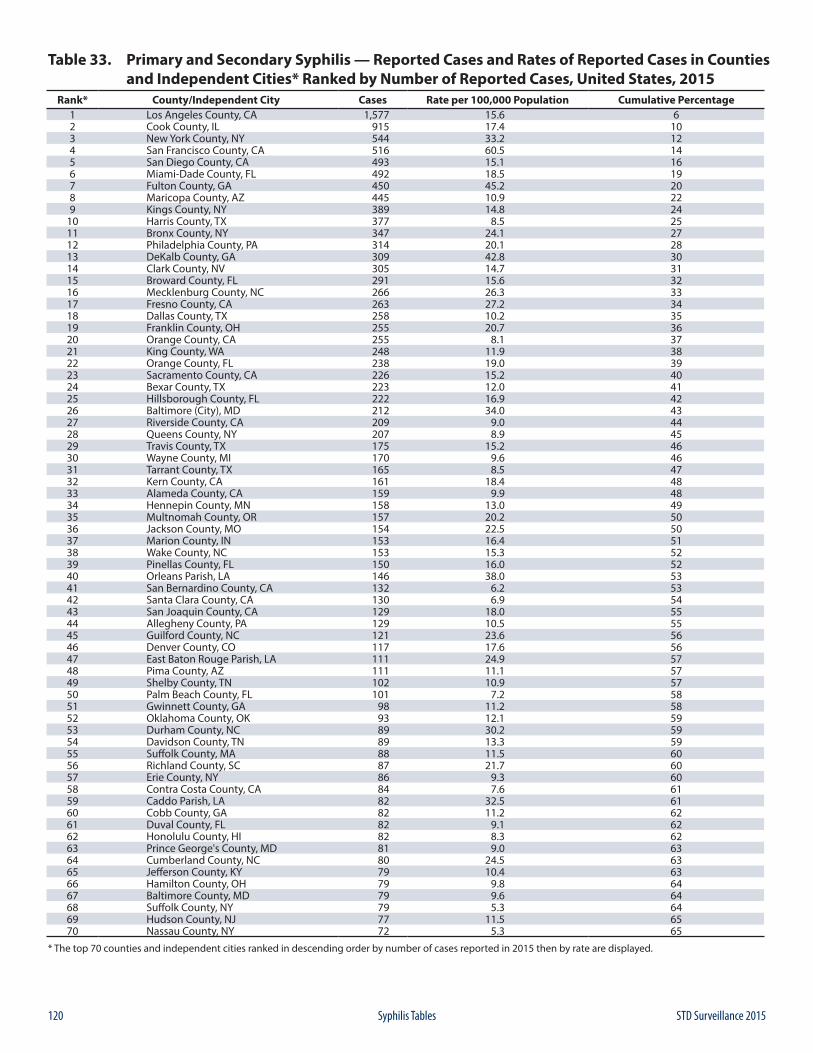
120 STD Surveillance 2015Syphilis Tables
Table 33. Primary and Secondary Syphilis — Reported Cases and Rates of Reported Cases in Counties and Independent Cities* Ranked by Number of Reported Cases, United States, 2015
Rank* County/Independent City Cases Rate per 100,000 Population Cumulative Percentage1 Los Angeles County, CA 1,577 15.6 62 Cook County, IL 915 17.4 103 New York County, NY 544 33.2 124 San Francisco County, CA 516 60.5 145 San Diego County, CA 493 15.1 166 Miami-Dade County, FL 492 18.5 197 Fulton County, GA 450 45.2 208 Maricopa County, AZ 445 10.9 229 Kings County, NY 389 14.8 24
10 Harris County, TX 377 8.5 2511 Bronx County, NY 347 24.1 2712 Philadelphia County, PA 314 20.1 2813 DeKalb County, GA 309 42.8 3014 Clark County, NV 305 14.7 3115 Broward County, FL 291 15.6 3216 Mecklenburg County, NC 266 26.3 3317 Fresno County, CA 263 27.2 3418 Dallas County, TX 258 10.2 3519 Franklin County, OH 255 20.7 3620 Orange County, CA 255 8.1 3721 King County, WA 248 11.9 3822 Orange County, FL 238 19.0 3923 Sacramento County, CA 226 15.2 4024 Bexar County, TX 223 12.0 4125 Hillsborough County, FL 222 16.9 4226 Baltimore (City), MD 212 34.0 4327 Riverside County, CA 209 9.0 4428 Queens County, NY 207 8.9 4529 Travis County, TX 175 15.2 4630 Wayne County, MI 170 9.6 4631 Tarrant County, TX 165 8.5 4732 Kern County, CA 161 18.4 4833 Alameda County, CA 159 9.9 4834 Hennepin County, MN 158 13.0 4935 Multnomah County, OR 157 20.2 5036 Jackson County, MO 154 22.5 5037 Marion County, IN 153 16.4 5138 Wake County, NC 153 15.3 5239 Pinellas County, FL 150 16.0 5240 Orleans Parish, LA 146 38.0 5341 San Bernardino County, CA 132 6.2 5342 Santa Clara County, CA 130 6.9 5443 San Joaquin County, CA 129 18.0 5544 Allegheny County, PA 129 10.5 5545 Guilford County, NC 121 23.6 5646 Denver County, CO 117 17.6 5647 East Baton Rouge Parish, LA 111 24.9 5748 Pima County, AZ 111 11.1 5749 Shelby County, TN 102 10.9 5750 Palm Beach County, FL 101 7.2 5851 Gwinnett County, GA 98 11.2 5852 Oklahoma County, OK 93 12.1 5953 Durham County, NC 89 30.2 5954 Davidson County, TN 89 13.3 5955 Suffolk County, MA 88 11.5 6056 Richland County, SC 87 21.7 6057 Erie County, NY 86 9.3 6058 Contra Costa County, CA 84 7.6 6159 Caddo Parish, LA 82 32.5 6160 Cobb County, GA 82 11.2 6261 Duval County, FL 82 9.1 6262 Honolulu County, HI 82 8.3 6263 Prince George's County, MD 81 9.0 6364 Cumberland County, NC 80 24.5 6365 Jefferson County, KY 79 10.4 6366 Hamilton County, OH 79 9.8 6467 Baltimore County, MD 79 9.6 6468 Suffolk County, NY 79 5.3 6469 Hudson County, NJ 77 11.5 6570 Nassau County, NY 72 5.3 65
* The top 70 counties and independent cities ranked in descending order by number of cases reported in 2015 then by rate are displayed.
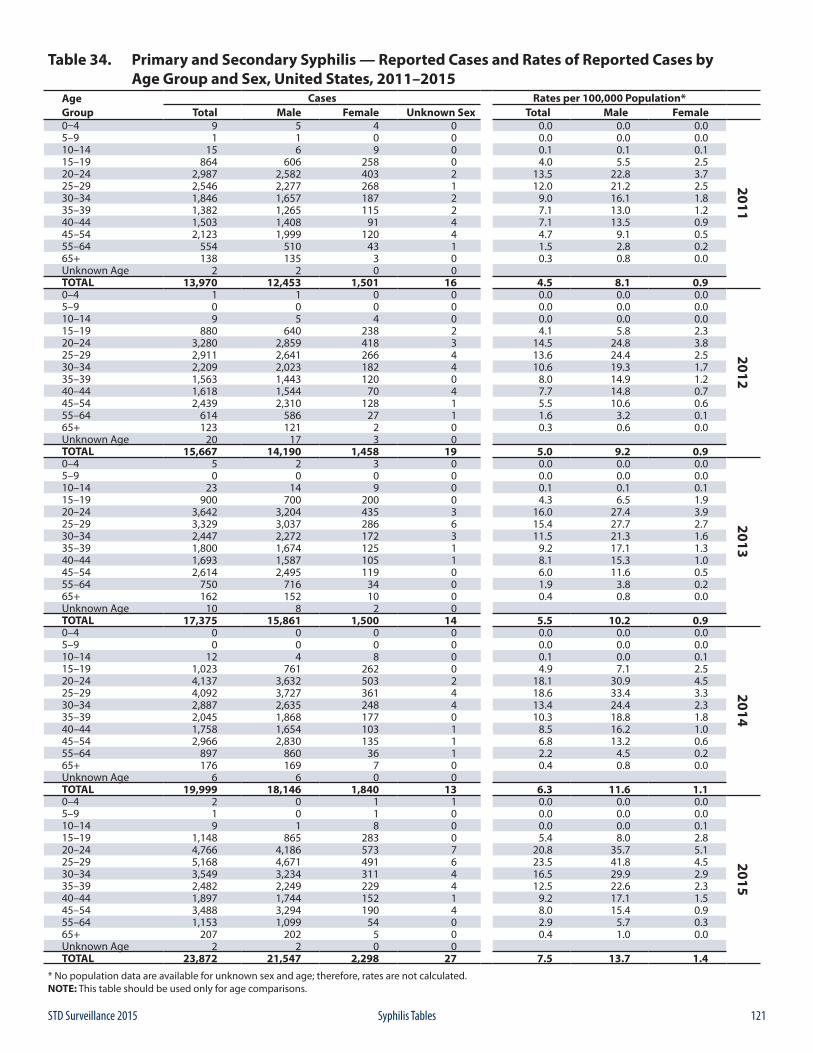
121STD Surveillance 2015 Syphilis Tables
Table 34. Primary and Secondary Syphilis — Reported Cases and Rates of Reported Cases by Age Group and Sex, United States, 2011–2015
Age Cases Rates per 100,000 Population*Group Total Male Female Unknown Sex Total Male Female0–4 9 5 4 0 0.0 0.0 0.0
2011
5–9 1 1 0 0 0.0 0.0 0.010–14 15 6 9 0 0.1 0.1 0.115–19 864 606 258 0 4.0 5.5 2.520–24 2,987 2,582 403 2 13.5 22.8 3.725–29 2,546 2,277 268 1 12.0 21.2 2.530–34 1,846 1,657 187 2 9.0 16.1 1.835–39 1,382 1,265 115 2 7.1 13.0 1.240–44 1,503 1,408 91 4 7.1 13.5 0.945–54 2,123 1,999 120 4 4.7 9.1 0.555–64 554 510 43 1 1.5 2.8 0.265+ 138 135 3 0 0.3 0.8 0.0Unknown Age 2 2 0 0TOTAL 13,970 12,453 1,501 16 4.5 8.1 0.90–4 1 1 0 0 0.0 0.0 0.0
2012
5–9 0 0 0 0 0.0 0.0 0.010–14 9 5 4 0 0.0 0.0 0.015–19 880 640 238 2 4.1 5.8 2.320–24 3,280 2,859 418 3 14.5 24.8 3.825–29 2,911 2,641 266 4 13.6 24.4 2.530–34 2,209 2,023 182 4 10.6 19.3 1.735–39 1,563 1,443 120 0 8.0 14.9 1.240–44 1,618 1,544 70 4 7.7 14.8 0.745–54 2,439 2,310 128 1 5.5 10.6 0.655–64 614 586 27 1 1.6 3.2 0.165+ 123 121 2 0 0.3 0.6 0.0Unknown Age 20 17 3 0TOTAL 15,667 14,190 1,458 19 5.0 9.2 0.90–4 5 2 3 0 0.0 0.0 0.0
2013
5–9 0 0 0 0 0.0 0.0 0.010–14 23 14 9 0 0.1 0.1 0.115–19 900 700 200 0 4.3 6.5 1.920–24 3,642 3,204 435 3 16.0 27.4 3.925–29 3,329 3,037 286 6 15.4 27.7 2.730–34 2,447 2,272 172 3 11.5 21.3 1.635–39 1,800 1,674 125 1 9.2 17.1 1.340–44 1,693 1,587 105 1 8.1 15.3 1.045–54 2,614 2,495 119 0 6.0 11.6 0.555–64 750 716 34 0 1.9 3.8 0.265+ 162 152 10 0 0.4 0.8 0.0Unknown Age 10 8 2 0TOTAL 17,375 15,861 1,500 14 5.5 10.2 0.90–4 0 0 0 0 0.0 0.0 0.0
2014
5–9 0 0 0 0 0.0 0.0 0.010–14 12 4 8 0 0.1 0.0 0.115–19 1,023 761 262 0 4.9 7.1 2.520–24 4,137 3,632 503 2 18.1 30.9 4.525–29 4,092 3,727 361 4 18.6 33.4 3.330–34 2,887 2,635 248 4 13.4 24.4 2.335–39 2,045 1,868 177 0 10.3 18.8 1.840–44 1,758 1,654 103 1 8.5 16.2 1.045–54 2,966 2,830 135 1 6.8 13.2 0.655–64 897 860 36 1 2.2 4.5 0.265+ 176 169 7 0 0.4 0.8 0.0Unknown Age 6 6 0 0TOTAL 19,999 18,146 1,840 13 6.3 11.6 1.10–4 2 0 1 1 0.0 0.0 0.0
2015
5–9 1 0 1 0 0.0 0.0 0.010–14 9 1 8 0 0.0 0.0 0.115–19 1,148 865 283 0 5.4 8.0 2.820–24 4,766 4,186 573 7 20.8 35.7 5.125–29 5,168 4,671 491 6 23.5 41.8 4.530–34 3,549 3,234 311 4 16.5 29.9 2.935–39 2,482 2,249 229 4 12.5 22.6 2.340–44 1,897 1,744 152 1 9.2 17.1 1.545–54 3,488 3,294 190 4 8.0 15.4 0.955–64 1,153 1,099 54 0 2.9 5.7 0.365+ 207 202 5 0 0.4 1.0 0.0Unknown Age 2 2 0 0TOTAL 23,872 21,547 2,298 27 7.5 13.7 1.4
* No population data are available for unknown sex and age; therefore, rates are not calculated.NOTE: This table should be used only for age comparisons.
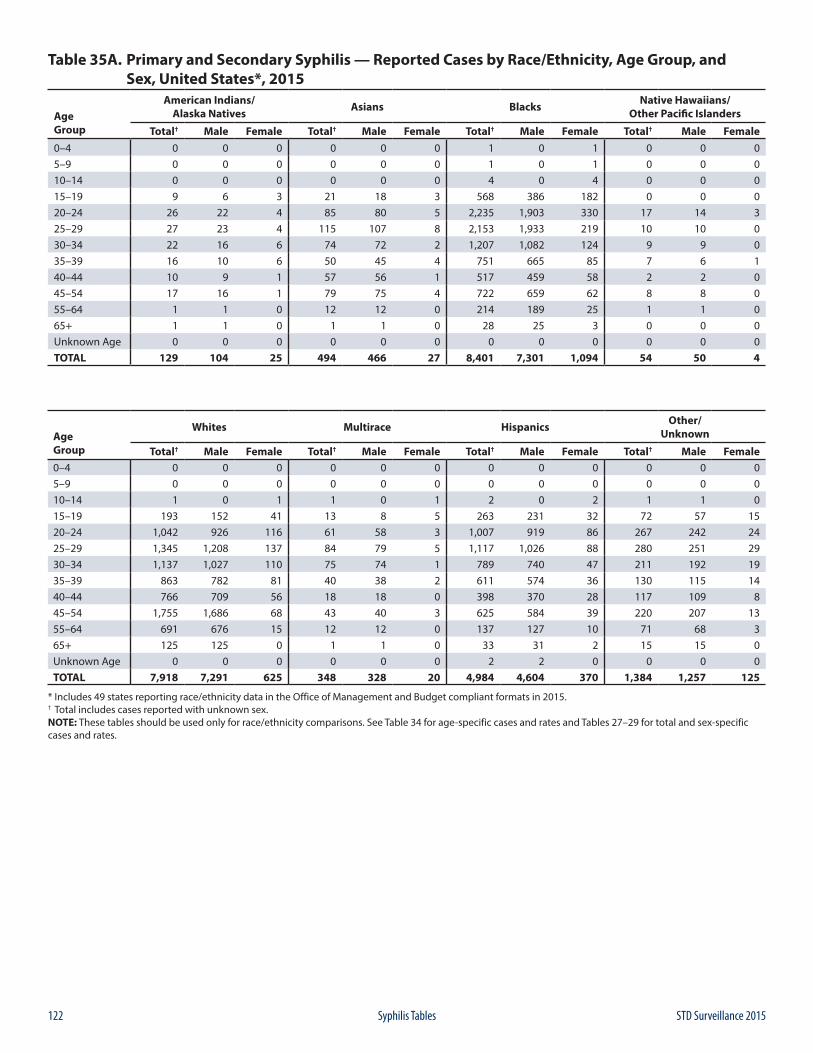
122 STD Surveillance 2015Syphilis Tables
Table 35A. Primary and Secondary Syphilis — Reported Cases by Race/Ethnicity, Age Group, and Sex, United States*, 2015
Age Group
American Indians/Alaska Natives Asians Blacks Native Hawaiians/
Other Pacific Islanders
Total† Male Female Total† Male Female Total† Male Female Total† Male Female0–4 0 0 0 0 0 0 1 0 1 0 0 05–9 0 0 0 0 0 0 1 0 1 0 0 010–14 0 0 0 0 0 0 4 0 4 0 0 015–19 9 6 3 21 18 3 568 386 182 0 0 020–24 26 22 4 85 80 5 2,235 1,903 330 17 14 325–29 27 23 4 115 107 8 2,153 1,933 219 10 10 030–34 22 16 6 74 72 2 1,207 1,082 124 9 9 035–39 16 10 6 50 45 4 751 665 85 7 6 140–44 10 9 1 57 56 1 517 459 58 2 2 045–54 17 16 1 79 75 4 722 659 62 8 8 055–64 1 1 0 12 12 0 214 189 25 1 1 065+ 1 1 0 1 1 0 28 25 3 0 0 0Unknown Age 0 0 0 0 0 0 0 0 0 0 0 0TOTAL 129 104 25 494 466 27 8,401 7,301 1,094 54 50 4
Age Group
Whites Multirace Hispanics Other/Unknown
Total† Male Female Total† Male Female Total† Male Female Total† Male Female0–4 0 0 0 0 0 0 0 0 0 0 0 05–9 0 0 0 0 0 0 0 0 0 0 0 010–14 1 0 1 1 0 1 2 0 2 1 1 015–19 193 152 41 13 8 5 263 231 32 72 57 1520–24 1,042 926 116 61 58 3 1,007 919 86 267 242 2425–29 1,345 1,208 137 84 79 5 1,117 1,026 88 280 251 2930–34 1,137 1,027 110 75 74 1 789 740 47 211 192 1935–39 863 782 81 40 38 2 611 574 36 130 115 1440–44 766 709 56 18 18 0 398 370 28 117 109 845–54 1,755 1,686 68 43 40 3 625 584 39 220 207 1355–64 691 676 15 12 12 0 137 127 10 71 68 365+ 125 125 0 1 1 0 33 31 2 15 15 0Unknown Age 0 0 0 0 0 0 2 2 0 0 0 0TOTAL 7,918 7,291 625 348 328 20 4,984 4,604 370 1,384 1,257 125
* Includes 49 states reporting race/ethnicity data in the Office of Management and Budget compliant formats in 2015.† Total includes cases reported with unknown sex.NOTE: These tables should be used only for race/ethnicity comparisons. See Table 34 for age-specific cases and rates and Tables 27–29 for total and sex-specific cases and rates.
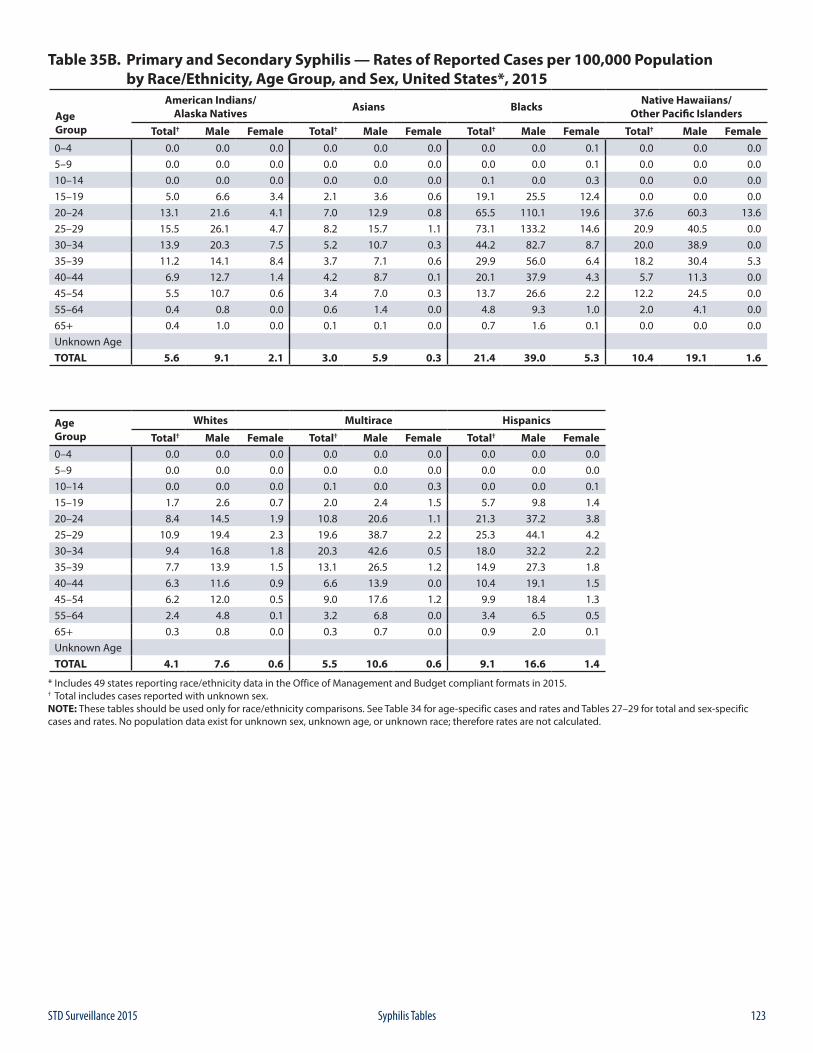
123STD Surveillance 2015 Syphilis Tables
Table 35B. Primary and Secondary Syphilis — Rates of Reported Cases per 100,000 Population by Race/Ethnicity, Age Group, and Sex, United States*, 2015
Age Group
American Indians/Alaska Natives Asians Blacks Native Hawaiians/
Other Pacific Islanders
Total† Male Female Total† Male Female Total† Male Female Total† Male Female0–4 0.0 0.0 0.0 0.0 0.0 0.0 0.0 0.0 0.1 0.0 0.0 0.05–9 0.0 0.0 0.0 0.0 0.0 0.0 0.0 0.0 0.1 0.0 0.0 0.010–14 0.0 0.0 0.0 0.0 0.0 0.0 0.1 0.0 0.3 0.0 0.0 0.015–19 5.0 6.6 3.4 2.1 3.6 0.6 19.1 25.5 12.4 0.0 0.0 0.020–24 13.1 21.6 4.1 7.0 12.9 0.8 65.5 110.1 19.6 37.6 60.3 13.625–29 15.5 26.1 4.7 8.2 15.7 1.1 73.1 133.2 14.6 20.9 40.5 0.030–34 13.9 20.3 7.5 5.2 10.7 0.3 44.2 82.7 8.7 20.0 38.9 0.035–39 11.2 14.1 8.4 3.7 7.1 0.6 29.9 56.0 6.4 18.2 30.4 5.340–44 6.9 12.7 1.4 4.2 8.7 0.1 20.1 37.9 4.3 5.7 11.3 0.045–54 5.5 10.7 0.6 3.4 7.0 0.3 13.7 26.6 2.2 12.2 24.5 0.055–64 0.4 0.8 0.0 0.6 1.4 0.0 4.8 9.3 1.0 2.0 4.1 0.065+ 0.4 1.0 0.0 0.1 0.1 0.0 0.7 1.6 0.1 0.0 0.0 0.0Unknown AgeTOTAL 5.6 9.1 2.1 3.0 5.9 0.3 21.4 39.0 5.3 10.4 19.1 1.6
Age Group
Whites Multirace Hispanics
Total† Male Female Total† Male Female Total† Male Female0–4 0.0 0.0 0.0 0.0 0.0 0.0 0.0 0.0 0.05–9 0.0 0.0 0.0 0.0 0.0 0.0 0.0 0.0 0.010–14 0.0 0.0 0.0 0.1 0.0 0.3 0.0 0.0 0.115–19 1.7 2.6 0.7 2.0 2.4 1.5 5.7 9.8 1.420–24 8.4 14.5 1.9 10.8 20.6 1.1 21.3 37.2 3.825–29 10.9 19.4 2.3 19.6 38.7 2.2 25.3 44.1 4.230–34 9.4 16.8 1.8 20.3 42.6 0.5 18.0 32.2 2.235–39 7.7 13.9 1.5 13.1 26.5 1.2 14.9 27.3 1.840–44 6.3 11.6 0.9 6.6 13.9 0.0 10.4 19.1 1.545–54 6.2 12.0 0.5 9.0 17.6 1.2 9.9 18.4 1.355–64 2.4 4.8 0.1 3.2 6.8 0.0 3.4 6.5 0.565+ 0.3 0.8 0.0 0.3 0.7 0.0 0.9 2.0 0.1Unknown AgeTOTAL 4.1 7.6 0.6 5.5 10.6 0.6 9.1 16.6 1.4
* Includes 49 states reporting race/ethnicity data in the Office of Management and Budget compliant formats in 2015.† Total includes cases reported with unknown sex.NOTE: These tables should be used only for race/ethnicity comparisons. See Table 34 for age-specific cases and rates and Tables 27–29 for total and sex-specific cases and rates. No population data exist for unknown sex, unknown age, or unknown race; therefore rates are not calculated.
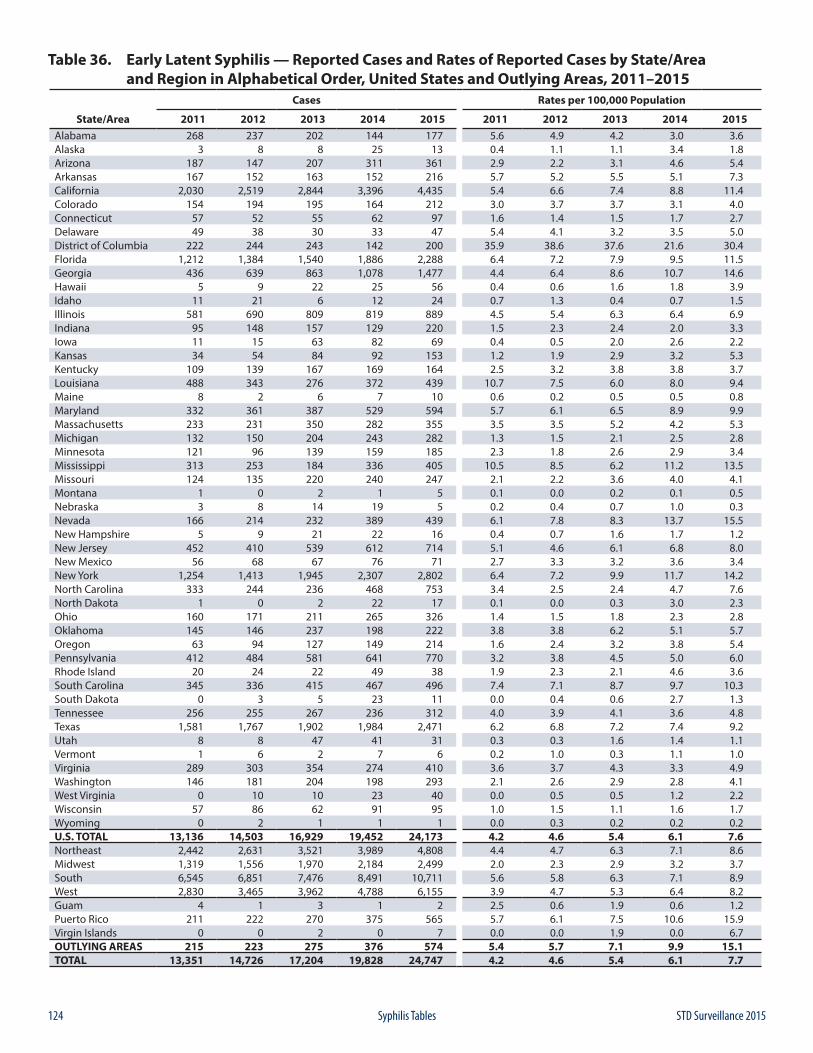
124 STD Surveillance 2015Syphilis Tables
Table 36. Early Latent Syphilis — Reported Cases and Rates of Reported Cases by State/Area and Region in Alphabetical Order, United States and Outlying Areas, 2011–2015
Cases Rates per 100,000 Population
State/Area 2011 2012 2013 2014 2015 2011 2012 2013 2014 2015Alabama 268 237 202 144 177 5.6 4.9 4.2 3.0 3.6Alaska 3 8 8 25 13 0.4 1.1 1.1 3.4 1.8Arizona 187 147 207 311 361 2.9 2.2 3.1 4.6 5.4Arkansas 167 152 163 152 216 5.7 5.2 5.5 5.1 7.3California 2,030 2,519 2,844 3,396 4,435 5.4 6.6 7.4 8.8 11.4Colorado 154 194 195 164 212 3.0 3.7 3.7 3.1 4.0Connecticut 57 52 55 62 97 1.6 1.4 1.5 1.7 2.7Delaware 49 38 30 33 47 5.4 4.1 3.2 3.5 5.0District of Columbia 222 244 243 142 200 35.9 38.6 37.6 21.6 30.4Florida 1,212 1,384 1,540 1,886 2,288 6.4 7.2 7.9 9.5 11.5Georgia 436 639 863 1,078 1,477 4.4 6.4 8.6 10.7 14.6Hawaii 5 9 22 25 56 0.4 0.6 1.6 1.8 3.9Idaho 11 21 6 12 24 0.7 1.3 0.4 0.7 1.5Illinois 581 690 809 819 889 4.5 5.4 6.3 6.4 6.9Indiana 95 148 157 129 220 1.5 2.3 2.4 2.0 3.3Iowa 11 15 63 82 69 0.4 0.5 2.0 2.6 2.2Kansas 34 54 84 92 153 1.2 1.9 2.9 3.2 5.3Kentucky 109 139 167 169 164 2.5 3.2 3.8 3.8 3.7Louisiana 488 343 276 372 439 10.7 7.5 6.0 8.0 9.4Maine 8 2 6 7 10 0.6 0.2 0.5 0.5 0.8Maryland 332 361 387 529 594 5.7 6.1 6.5 8.9 9.9Massachusetts 233 231 350 282 355 3.5 3.5 5.2 4.2 5.3Michigan 132 150 204 243 282 1.3 1.5 2.1 2.5 2.8Minnesota 121 96 139 159 185 2.3 1.8 2.6 2.9 3.4Mississippi 313 253 184 336 405 10.5 8.5 6.2 11.2 13.5Missouri 124 135 220 240 247 2.1 2.2 3.6 4.0 4.1Montana 1 0 2 1 5 0.1 0.0 0.2 0.1 0.5Nebraska 3 8 14 19 5 0.2 0.4 0.7 1.0 0.3Nevada 166 214 232 389 439 6.1 7.8 8.3 13.7 15.5New Hampshire 5 9 21 22 16 0.4 0.7 1.6 1.7 1.2New Jersey 452 410 539 612 714 5.1 4.6 6.1 6.8 8.0New Mexico 56 68 67 76 71 2.7 3.3 3.2 3.6 3.4New York 1,254 1,413 1,945 2,307 2,802 6.4 7.2 9.9 11.7 14.2North Carolina 333 244 236 468 753 3.4 2.5 2.4 4.7 7.6North Dakota 1 0 2 22 17 0.1 0.0 0.3 3.0 2.3Ohio 160 171 211 265 326 1.4 1.5 1.8 2.3 2.8Oklahoma 145 146 237 198 222 3.8 3.8 6.2 5.1 5.7Oregon 63 94 127 149 214 1.6 2.4 3.2 3.8 5.4Pennsylvania 412 484 581 641 770 3.2 3.8 4.5 5.0 6.0Rhode Island 20 24 22 49 38 1.9 2.3 2.1 4.6 3.6South Carolina 345 336 415 467 496 7.4 7.1 8.7 9.7 10.3South Dakota 0 3 5 23 11 0.0 0.4 0.6 2.7 1.3Tennessee 256 255 267 236 312 4.0 3.9 4.1 3.6 4.8Texas 1,581 1,767 1,902 1,984 2,471 6.2 6.8 7.2 7.4 9.2Utah 8 8 47 41 31 0.3 0.3 1.6 1.4 1.1Vermont 1 6 2 7 6 0.2 1.0 0.3 1.1 1.0Virginia 289 303 354 274 410 3.6 3.7 4.3 3.3 4.9Washington 146 181 204 198 293 2.1 2.6 2.9 2.8 4.1West Virginia 0 10 10 23 40 0.0 0.5 0.5 1.2 2.2Wisconsin 57 86 62 91 95 1.0 1.5 1.1 1.6 1.7Wyoming 0 2 1 1 1 0.0 0.3 0.2 0.2 0.2U.S. TOTAL 13,136 14,503 16,929 19,452 24,173 4.2 4.6 5.4 6.1 7.6Northeast 2,442 2,631 3,521 3,989 4,808 4.4 4.7 6.3 7.1 8.6Midwest 1,319 1,556 1,970 2,184 2,499 2.0 2.3 2.9 3.2 3.7South 6,545 6,851 7,476 8,491 10,711 5.6 5.8 6.3 7.1 8.9West 2,830 3,465 3,962 4,788 6,155 3.9 4.7 5.3 6.4 8.2Guam 4 1 3 1 2 2.5 0.6 1.9 0.6 1.2Puerto Rico 211 222 270 375 565 5.7 6.1 7.5 10.6 15.9Virgin Islands 0 0 2 0 7 0.0 0.0 1.9 0.0 6.7OUTLYING AREAS 215 223 275 376 574 5.4 5.7 7.1 9.9 15.1TOTAL 13,351 14,726 17,204 19,828 24,747 4.2 4.6 5.4 6.1 7.7
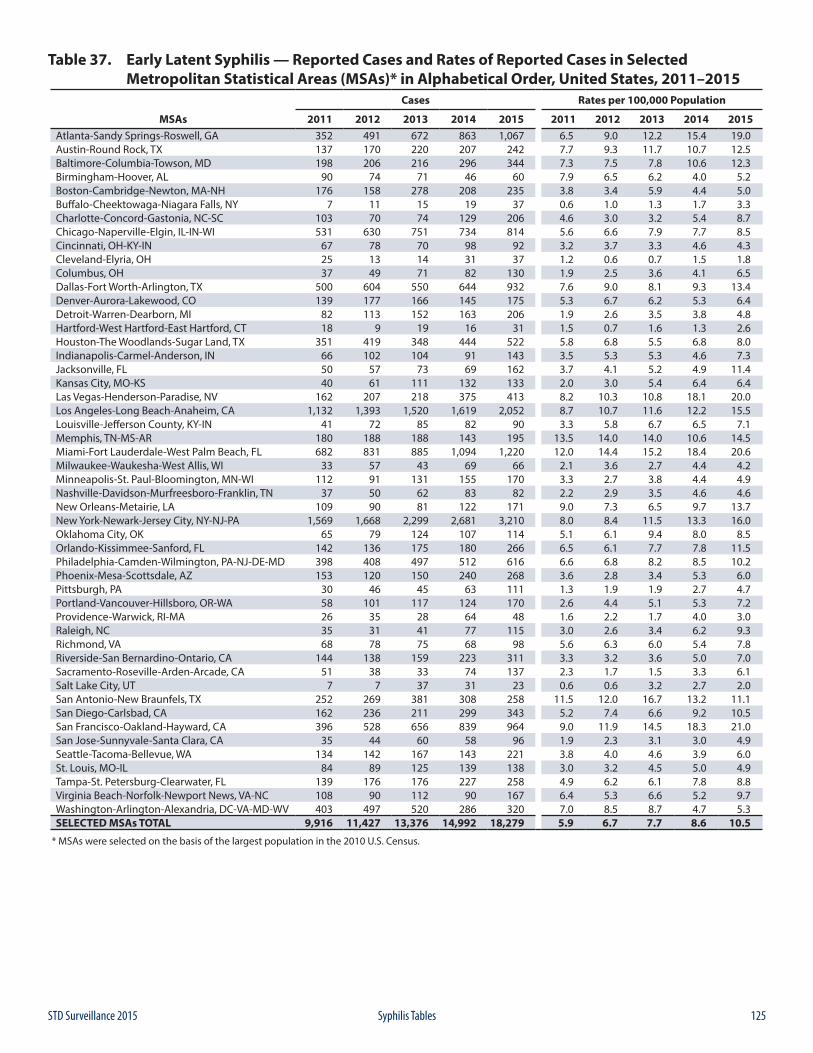
125STD Surveillance 2015 Syphilis Tables
Table 37. Early Latent Syphilis — Reported Cases and Rates of Reported Cases in Selected Metropolitan Statistical Areas (MSAs)* in Alphabetical Order, United States, 2011–2015
Cases Rates per 100,000 Population
MSAs 2011 2012 2013 2014 2015 2011 2012 2013 2014 2015Atlanta-Sandy Springs-Roswell, GA 352 491 672 863 1,067 6.5 9.0 12.2 15.4 19.0Austin-Round Rock, TX 137 170 220 207 242 7.7 9.3 11.7 10.7 12.5Baltimore-Columbia-Towson, MD 198 206 216 296 344 7.3 7.5 7.8 10.6 12.3Birmingham-Hoover, AL 90 74 71 46 60 7.9 6.5 6.2 4.0 5.2Boston-Cambridge-Newton, MA-NH 176 158 278 208 235 3.8 3.4 5.9 4.4 5.0Buffalo-Cheektowaga-Niagara Falls, NY 7 11 15 19 37 0.6 1.0 1.3 1.7 3.3Charlotte-Concord-Gastonia, NC-SC 103 70 74 129 206 4.6 3.0 3.2 5.4 8.7Chicago-Naperville-Elgin, IL-IN-WI 531 630 751 734 814 5.6 6.6 7.9 7.7 8.5Cincinnati, OH-KY-IN 67 78 70 98 92 3.2 3.7 3.3 4.6 4.3Cleveland-Elyria, OH 25 13 14 31 37 1.2 0.6 0.7 1.5 1.8Columbus, OH 37 49 71 82 130 1.9 2.5 3.6 4.1 6.5Dallas-Fort Worth-Arlington, TX 500 604 550 644 932 7.6 9.0 8.1 9.3 13.4Denver-Aurora-Lakewood, CO 139 177 166 145 175 5.3 6.7 6.2 5.3 6.4Detroit-Warren-Dearborn, MI 82 113 152 163 206 1.9 2.6 3.5 3.8 4.8Hartford-West Hartford-East Hartford, CT 18 9 19 16 31 1.5 0.7 1.6 1.3 2.6Houston-The Woodlands-Sugar Land, TX 351 419 348 444 522 5.8 6.8 5.5 6.8 8.0Indianapolis-Carmel-Anderson, IN 66 102 104 91 143 3.5 5.3 5.3 4.6 7.3Jacksonville, FL 50 57 73 69 162 3.7 4.1 5.2 4.9 11.4Kansas City, MO-KS 40 61 111 132 133 2.0 3.0 5.4 6.4 6.4Las Vegas-Henderson-Paradise, NV 162 207 218 375 413 8.2 10.3 10.8 18.1 20.0Los Angeles-Long Beach-Anaheim, CA 1,132 1,393 1,520 1,619 2,052 8.7 10.7 11.6 12.2 15.5Louisville-Jefferson County, KY-IN 41 72 85 82 90 3.3 5.8 6.7 6.5 7.1Memphis, TN-MS-AR 180 188 188 143 195 13.5 14.0 14.0 10.6 14.5Miami-Fort Lauderdale-West Palm Beach, FL 682 831 885 1,094 1,220 12.0 14.4 15.2 18.4 20.6Milwaukee-Waukesha-West Allis, WI 33 57 43 69 66 2.1 3.6 2.7 4.4 4.2Minneapolis-St. Paul-Bloomington, MN-WI 112 91 131 155 170 3.3 2.7 3.8 4.4 4.9Nashville-Davidson-Murfreesboro-Franklin, TN 37 50 62 83 82 2.2 2.9 3.5 4.6 4.6New Orleans-Metairie, LA 109 90 81 122 171 9.0 7.3 6.5 9.7 13.7New York-Newark-Jersey City, NY-NJ-PA 1,569 1,668 2,299 2,681 3,210 8.0 8.4 11.5 13.3 16.0Oklahoma City, OK 65 79 124 107 114 5.1 6.1 9.4 8.0 8.5Orlando-Kissimmee-Sanford, FL 142 136 175 180 266 6.5 6.1 7.7 7.8 11.5Philadelphia-Camden-Wilmington, PA-NJ-DE-MD 398 408 497 512 616 6.6 6.8 8.2 8.5 10.2Phoenix-Mesa-Scottsdale, AZ 153 120 150 240 268 3.6 2.8 3.4 5.3 6.0Pittsburgh, PA 30 46 45 63 111 1.3 1.9 1.9 2.7 4.7Portland-Vancouver-Hillsboro, OR-WA 58 101 117 124 170 2.6 4.4 5.1 5.3 7.2Providence-Warwick, RI-MA 26 35 28 64 48 1.6 2.2 1.7 4.0 3.0Raleigh, NC 35 31 41 77 115 3.0 2.6 3.4 6.2 9.3Richmond, VA 68 78 75 68 98 5.6 6.3 6.0 5.4 7.8Riverside-San Bernardino-Ontario, CA 144 138 159 223 311 3.3 3.2 3.6 5.0 7.0Sacramento-Roseville-Arden-Arcade, CA 51 38 33 74 137 2.3 1.7 1.5 3.3 6.1Salt Lake City, UT 7 7 37 31 23 0.6 0.6 3.2 2.7 2.0San Antonio-New Braunfels, TX 252 269 381 308 258 11.5 12.0 16.7 13.2 11.1San Diego-Carlsbad, CA 162 236 211 299 343 5.2 7.4 6.6 9.2 10.5San Francisco-Oakland-Hayward, CA 396 528 656 839 964 9.0 11.9 14.5 18.3 21.0San Jose-Sunnyvale-Santa Clara, CA 35 44 60 58 96 1.9 2.3 3.1 3.0 4.9Seattle-Tacoma-Bellevue, WA 134 142 167 143 221 3.8 4.0 4.6 3.9 6.0St. Louis, MO-IL 84 89 125 139 138 3.0 3.2 4.5 5.0 4.9Tampa-St. Petersburg-Clearwater, FL 139 176 176 227 258 4.9 6.2 6.1 7.8 8.8Virginia Beach-Norfolk-Newport News, VA-NC 108 90 112 90 167 6.4 5.3 6.6 5.2 9.7Washington-Arlington-Alexandria, DC-VA-MD-WV 403 497 520 286 320 7.0 8.5 8.7 4.7 5.3SELECTED MSAs TOTAL 9,916 11,427 13,376 14,992 18,279 5.9 6.7 7.7 8.6 10.5
* MSAs were selected on the basis of the largest population in the 2010 U.S. Census.
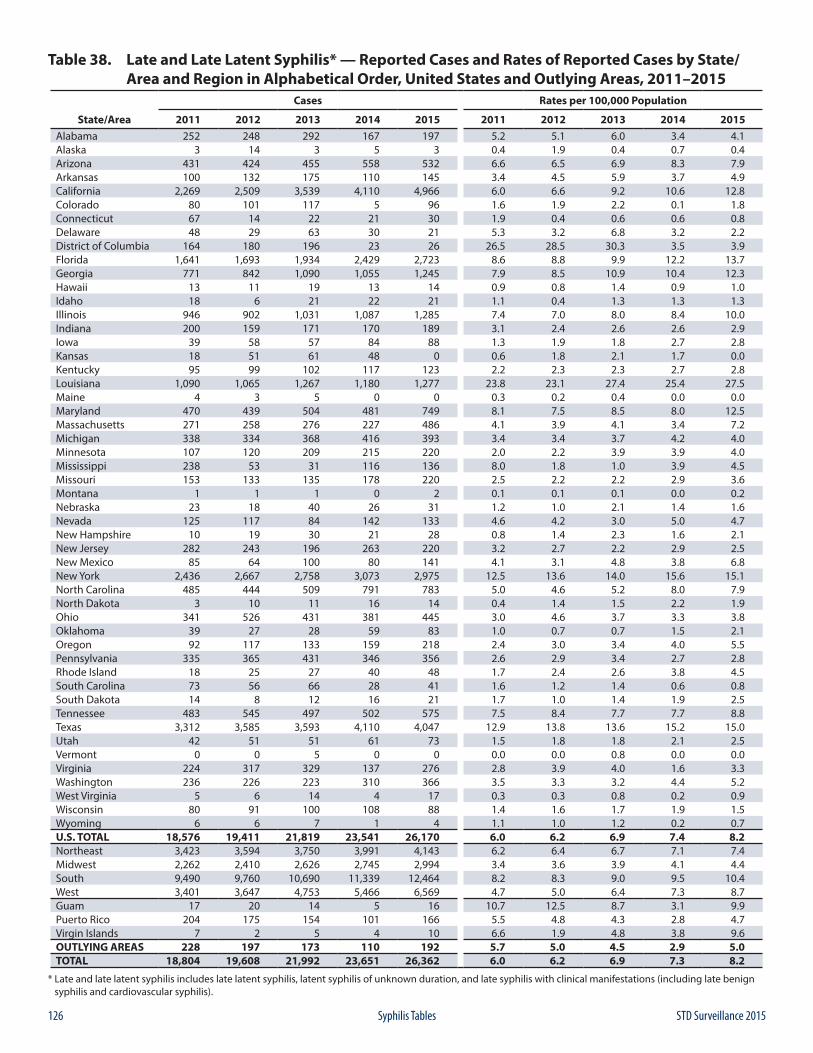
126 STD Surveillance 2015Syphilis Tables
Table 38. Late and Late Latent Syphilis* — Reported Cases and Rates of Reported Cases by State/ Area and Region in Alphabetical Order, United States and Outlying Areas, 2011–2015
Cases Rates per 100,000 Population
State/Area 2011 2012 2013 2014 2015 2011 2012 2013 2014 2015Alabama 252 248 292 167 197 5.2 5.1 6.0 3.4 4.1Alaska 3 14 3 5 3 0.4 1.9 0.4 0.7 0.4Arizona 431 424 455 558 532 6.6 6.5 6.9 8.3 7.9Arkansas 100 132 175 110 145 3.4 4.5 5.9 3.7 4.9California 2,269 2,509 3,539 4,110 4,966 6.0 6.6 9.2 10.6 12.8Colorado 80 101 117 5 96 1.6 1.9 2.2 0.1 1.8Connecticut 67 14 22 21 30 1.9 0.4 0.6 0.6 0.8Delaware 48 29 63 30 21 5.3 3.2 6.8 3.2 2.2District of Columbia 164 180 196 23 26 26.5 28.5 30.3 3.5 3.9Florida 1,641 1,693 1,934 2,429 2,723 8.6 8.8 9.9 12.2 13.7Georgia 771 842 1,090 1,055 1,245 7.9 8.5 10.9 10.4 12.3Hawaii 13 11 19 13 14 0.9 0.8 1.4 0.9 1.0Idaho 18 6 21 22 21 1.1 0.4 1.3 1.3 1.3Illinois 946 902 1,031 1,087 1,285 7.4 7.0 8.0 8.4 10.0Indiana 200 159 171 170 189 3.1 2.4 2.6 2.6 2.9Iowa 39 58 57 84 88 1.3 1.9 1.8 2.7 2.8Kansas 18 51 61 48 0 0.6 1.8 2.1 1.7 0.0Kentucky 95 99 102 117 123 2.2 2.3 2.3 2.7 2.8Louisiana 1,090 1,065 1,267 1,180 1,277 23.8 23.1 27.4 25.4 27.5Maine 4 3 5 0 0 0.3 0.2 0.4 0.0 0.0Maryland 470 439 504 481 749 8.1 7.5 8.5 8.0 12.5Massachusetts 271 258 276 227 486 4.1 3.9 4.1 3.4 7.2Michigan 338 334 368 416 393 3.4 3.4 3.7 4.2 4.0Minnesota 107 120 209 215 220 2.0 2.2 3.9 3.9 4.0Mississippi 238 53 31 116 136 8.0 1.8 1.0 3.9 4.5Missouri 153 133 135 178 220 2.5 2.2 2.2 2.9 3.6Montana 1 1 1 0 2 0.1 0.1 0.1 0.0 0.2Nebraska 23 18 40 26 31 1.2 1.0 2.1 1.4 1.6Nevada 125 117 84 142 133 4.6 4.2 3.0 5.0 4.7New Hampshire 10 19 30 21 28 0.8 1.4 2.3 1.6 2.1New Jersey 282 243 196 263 220 3.2 2.7 2.2 2.9 2.5New Mexico 85 64 100 80 141 4.1 3.1 4.8 3.8 6.8New York 2,436 2,667 2,758 3,073 2,975 12.5 13.6 14.0 15.6 15.1North Carolina 485 444 509 791 783 5.0 4.6 5.2 8.0 7.9North Dakota 3 10 11 16 14 0.4 1.4 1.5 2.2 1.9Ohio 341 526 431 381 445 3.0 4.6 3.7 3.3 3.8Oklahoma 39 27 28 59 83 1.0 0.7 0.7 1.5 2.1Oregon 92 117 133 159 218 2.4 3.0 3.4 4.0 5.5Pennsylvania 335 365 431 346 356 2.6 2.9 3.4 2.7 2.8Rhode Island 18 25 27 40 48 1.7 2.4 2.6 3.8 4.5South Carolina 73 56 66 28 41 1.6 1.2 1.4 0.6 0.8South Dakota 14 8 12 16 21 1.7 1.0 1.4 1.9 2.5Tennessee 483 545 497 502 575 7.5 8.4 7.7 7.7 8.8Texas 3,312 3,585 3,593 4,110 4,047 12.9 13.8 13.6 15.2 15.0Utah 42 51 51 61 73 1.5 1.8 1.8 2.1 2.5Vermont 0 0 5 0 0 0.0 0.0 0.8 0.0 0.0Virginia 224 317 329 137 276 2.8 3.9 4.0 1.6 3.3Washington 236 226 223 310 366 3.5 3.3 3.2 4.4 5.2West Virginia 5 6 14 4 17 0.3 0.3 0.8 0.2 0.9Wisconsin 80 91 100 108 88 1.4 1.6 1.7 1.9 1.5Wyoming 6 6 7 1 4 1.1 1.0 1.2 0.2 0.7U.S. TOTAL 18,576 19,411 21,819 23,541 26,170 6.0 6.2 6.9 7.4 8.2Northeast 3,423 3,594 3,750 3,991 4,143 6.2 6.4 6.7 7.1 7.4Midwest 2,262 2,410 2,626 2,745 2,994 3.4 3.6 3.9 4.1 4.4South 9,490 9,760 10,690 11,339 12,464 8.2 8.3 9.0 9.5 10.4West 3,401 3,647 4,753 5,466 6,569 4.7 5.0 6.4 7.3 8.7Guam 17 20 14 5 16 10.7 12.5 8.7 3.1 9.9Puerto Rico 204 175 154 101 166 5.5 4.8 4.3 2.8 4.7Virgin Islands 7 2 5 4 10 6.6 1.9 4.8 3.8 9.6OUTLYING AREAS 228 197 173 110 192 5.7 5.0 4.5 2.9 5.0TOTAL 18,804 19,608 21,992 23,651 26,362 6.0 6.2 6.9 7.3 8.2
* Late and late latent syphilis includes late latent syphilis, latent syphilis of unknown duration, and late syphilis with clinical manifestations (including late benign syphilis and cardiovascular syphilis).
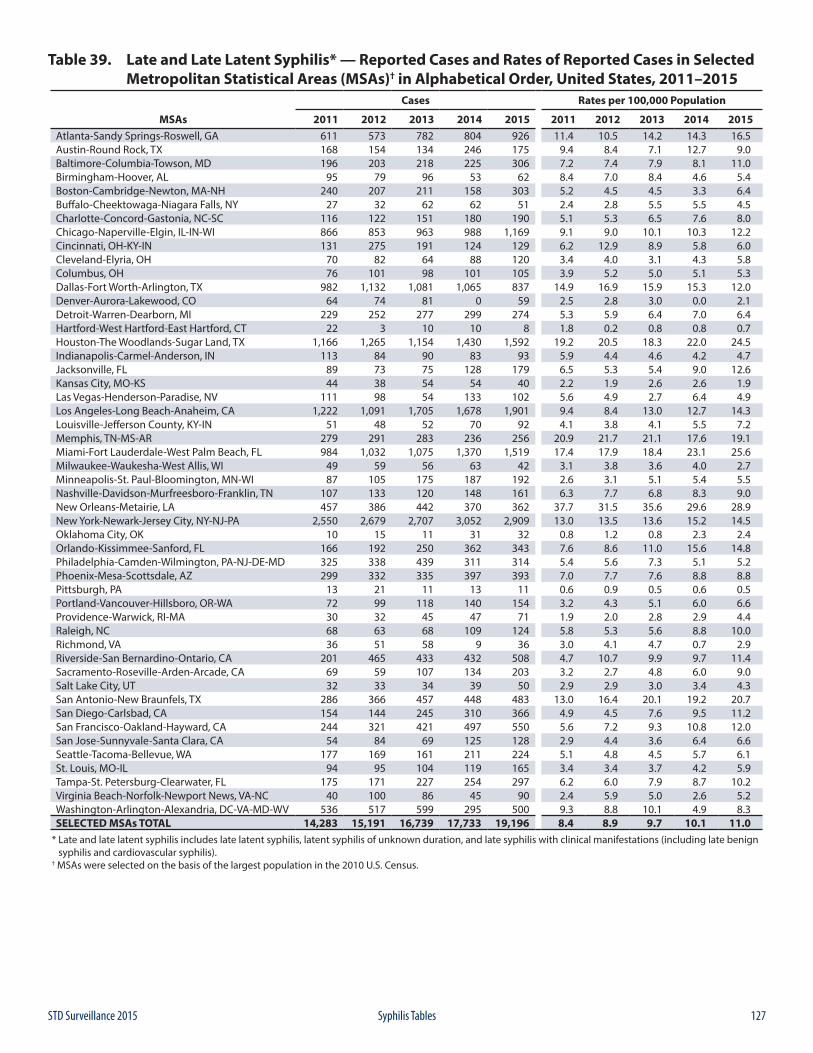
127STD Surveillance 2015 Syphilis Tables
Table 39. Late and Late Latent Syphilis* — Reported Cases and Rates of Reported Cases in Selected Metropolitan Statistical Areas (MSAs)† in Alphabetical Order, United States, 2011–2015
Cases Rates per 100,000 Population
MSAs 2011 2012 2013 2014 2015 2011 2012 2013 2014 2015Atlanta-Sandy Springs-Roswell, GA 611 573 782 804 926 11.4 10.5 14.2 14.3 16.5Austin-Round Rock, TX 168 154 134 246 175 9.4 8.4 7.1 12.7 9.0Baltimore-Columbia-Towson, MD 196 203 218 225 306 7.2 7.4 7.9 8.1 11.0Birmingham-Hoover, AL 95 79 96 53 62 8.4 7.0 8.4 4.6 5.4Boston-Cambridge-Newton, MA-NH 240 207 211 158 303 5.2 4.5 4.5 3.3 6.4Buffalo-Cheektowaga-Niagara Falls, NY 27 32 62 62 51 2.4 2.8 5.5 5.5 4.5Charlotte-Concord-Gastonia, NC-SC 116 122 151 180 190 5.1 5.3 6.5 7.6 8.0Chicago-Naperville-Elgin, IL-IN-WI 866 853 963 988 1,169 9.1 9.0 10.1 10.3 12.2Cincinnati, OH-KY-IN 131 275 191 124 129 6.2 12.9 8.9 5.8 6.0Cleveland-Elyria, OH 70 82 64 88 120 3.4 4.0 3.1 4.3 5.8Columbus, OH 76 101 98 101 105 3.9 5.2 5.0 5.1 5.3Dallas-Fort Worth-Arlington, TX 982 1,132 1,081 1,065 837 14.9 16.9 15.9 15.3 12.0Denver-Aurora-Lakewood, CO 64 74 81 0 59 2.5 2.8 3.0 0.0 2.1Detroit-Warren-Dearborn, MI 229 252 277 299 274 5.3 5.9 6.4 7.0 6.4Hartford-West Hartford-East Hartford, CT 22 3 10 10 8 1.8 0.2 0.8 0.8 0.7Houston-The Woodlands-Sugar Land, TX 1,166 1,265 1,154 1,430 1,592 19.2 20.5 18.3 22.0 24.5Indianapolis-Carmel-Anderson, IN 113 84 90 83 93 5.9 4.4 4.6 4.2 4.7Jacksonville, FL 89 73 75 128 179 6.5 5.3 5.4 9.0 12.6Kansas City, MO-KS 44 38 54 54 40 2.2 1.9 2.6 2.6 1.9Las Vegas-Henderson-Paradise, NV 111 98 54 133 102 5.6 4.9 2.7 6.4 4.9Los Angeles-Long Beach-Anaheim, CA 1,222 1,091 1,705 1,678 1,901 9.4 8.4 13.0 12.7 14.3Louisville-Jefferson County, KY-IN 51 48 52 70 92 4.1 3.8 4.1 5.5 7.2Memphis, TN-MS-AR 279 291 283 236 256 20.9 21.7 21.1 17.6 19.1Miami-Fort Lauderdale-West Palm Beach, FL 984 1,032 1,075 1,370 1,519 17.4 17.9 18.4 23.1 25.6Milwaukee-Waukesha-West Allis, WI 49 59 56 63 42 3.1 3.8 3.6 4.0 2.7Minneapolis-St. Paul-Bloomington, MN-WI 87 105 175 187 192 2.6 3.1 5.1 5.4 5.5Nashville-Davidson-Murfreesboro-Franklin, TN 107 133 120 148 161 6.3 7.7 6.8 8.3 9.0New Orleans-Metairie, LA 457 386 442 370 362 37.7 31.5 35.6 29.6 28.9New York-Newark-Jersey City, NY-NJ-PA 2,550 2,679 2,707 3,052 2,909 13.0 13.5 13.6 15.2 14.5Oklahoma City, OK 10 15 11 31 32 0.8 1.2 0.8 2.3 2.4Orlando-Kissimmee-Sanford, FL 166 192 250 362 343 7.6 8.6 11.0 15.6 14.8Philadelphia-Camden-Wilmington, PA-NJ-DE-MD 325 338 439 311 314 5.4 5.6 7.3 5.1 5.2Phoenix-Mesa-Scottsdale, AZ 299 332 335 397 393 7.0 7.7 7.6 8.8 8.8Pittsburgh, PA 13 21 11 13 11 0.6 0.9 0.5 0.6 0.5Portland-Vancouver-Hillsboro, OR-WA 72 99 118 140 154 3.2 4.3 5.1 6.0 6.6Providence-Warwick, RI-MA 30 32 45 47 71 1.9 2.0 2.8 2.9 4.4Raleigh, NC 68 63 68 109 124 5.8 5.3 5.6 8.8 10.0Richmond, VA 36 51 58 9 36 3.0 4.1 4.7 0.7 2.9Riverside-San Bernardino-Ontario, CA 201 465 433 432 508 4.7 10.7 9.9 9.7 11.4Sacramento-Roseville-Arden-Arcade, CA 69 59 107 134 203 3.2 2.7 4.8 6.0 9.0Salt Lake City, UT 32 33 34 39 50 2.9 2.9 3.0 3.4 4.3San Antonio-New Braunfels, TX 286 366 457 448 483 13.0 16.4 20.1 19.2 20.7San Diego-Carlsbad, CA 154 144 245 310 366 4.9 4.5 7.6 9.5 11.2San Francisco-Oakland-Hayward, CA 244 321 421 497 550 5.6 7.2 9.3 10.8 12.0San Jose-Sunnyvale-Santa Clara, CA 54 84 69 125 128 2.9 4.4 3.6 6.4 6.6Seattle-Tacoma-Bellevue, WA 177 169 161 211 224 5.1 4.8 4.5 5.7 6.1St. Louis, MO-IL 94 95 104 119 165 3.4 3.4 3.7 4.2 5.9Tampa-St. Petersburg-Clearwater, FL 175 171 227 254 297 6.2 6.0 7.9 8.7 10.2Virginia Beach-Norfolk-Newport News, VA-NC 40 100 86 45 90 2.4 5.9 5.0 2.6 5.2Washington-Arlington-Alexandria, DC-VA-MD-WV 536 517 599 295 500 9.3 8.8 10.1 4.9 8.3SELECTED MSAs TOTAL 14,283 15,191 16,739 17,733 19,196 8.4 8.9 9.7 10.1 11.0
* Late and late latent syphilis includes late latent syphilis, latent syphilis of unknown duration, and late syphilis with clinical manifestations (including late benign syphilis and cardiovascular syphilis).† MSAs were selected on the basis of the largest population in the 2010 U.S. Census.
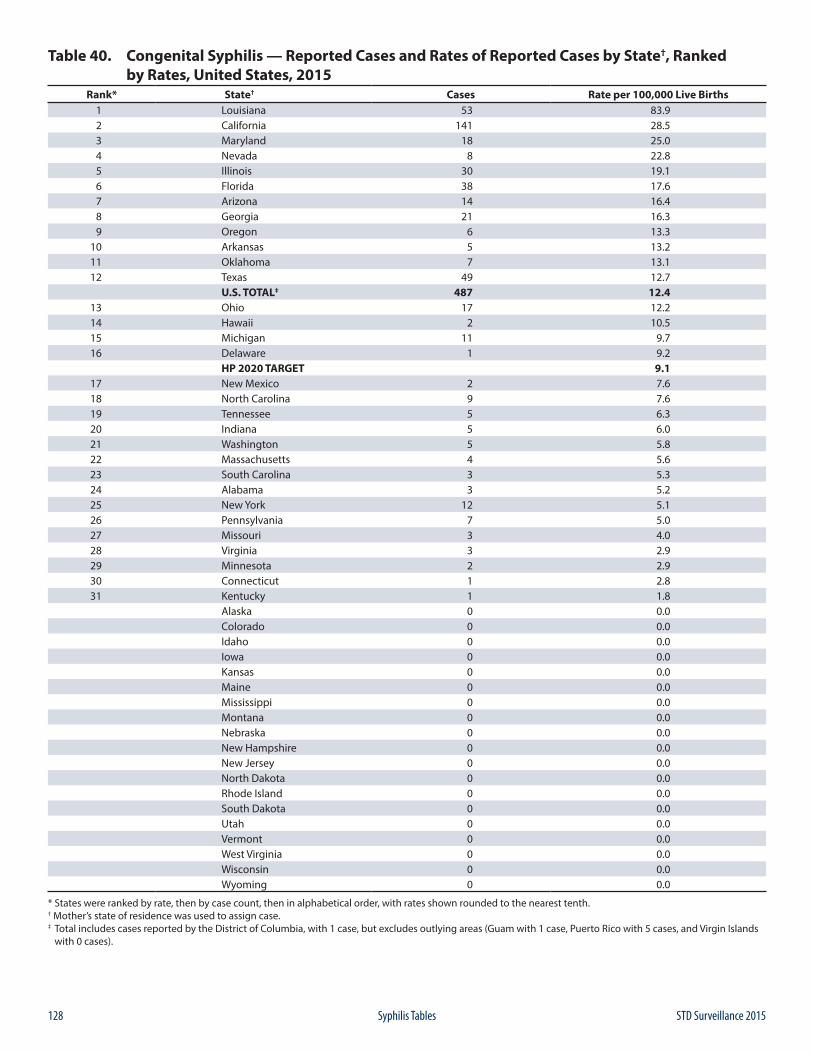
128 STD Surveillance 2015Syphilis Tables
Table 40. Congenital Syphilis — Reported Cases and Rates of Reported Cases by State†, Ranked by Rates, United States, 2015
Rank* State† Cases Rate per 100,000 Live Births1 Louisiana 53 83.92 California 141 28.53 Maryland 18 25.04 Nevada 8 22.85 Illinois 30 19.16 Florida 38 17.67 Arizona 14 16.48 Georgia 21 16.39 Oregon 6 13.3
10 Arkansas 5 13.211 Oklahoma 7 13.112 Texas 49 12.7
U.S. TOTAL‡ 487 12.413 Ohio 17 12.214 Hawaii 2 10.515 Michigan 11 9.716 Delaware 1 9.2
HP 2020 TARGET 9.117 New Mexico 2 7.618 North Carolina 9 7.619 Tennessee 5 6.320 Indiana 5 6.021 Washington 5 5.822 Massachusetts 4 5.623 South Carolina 3 5.324 Alabama 3 5.225 New York 12 5.126 Pennsylvania 7 5.027 Missouri 3 4.028 Virginia 3 2.929 Minnesota 2 2.930 Connecticut 1 2.831 Kentucky 1 1.8
Alaska 0 0.0Colorado 0 0.0Idaho 0 0.0Iowa 0 0.0Kansas 0 0.0Maine 0 0.0Mississippi 0 0.0Montana 0 0.0Nebraska 0 0.0New Hampshire 0 0.0New Jersey 0 0.0North Dakota 0 0.0Rhode Island 0 0.0South Dakota 0 0.0Utah 0 0.0Vermont 0 0.0West Virginia 0 0.0Wisconsin 0 0.0Wyoming 0 0.0
* States were ranked by rate, then by case count, then in alphabetical order, with rates shown rounded to the nearest tenth.† Mother’s state of residence was used to assign case.‡ Total includes cases reported by the District of Columbia, with 1 case, but excludes outlying areas (Guam with 1 case, Puerto Rico with 5 cases, and Virgin Islands with 0 cases).
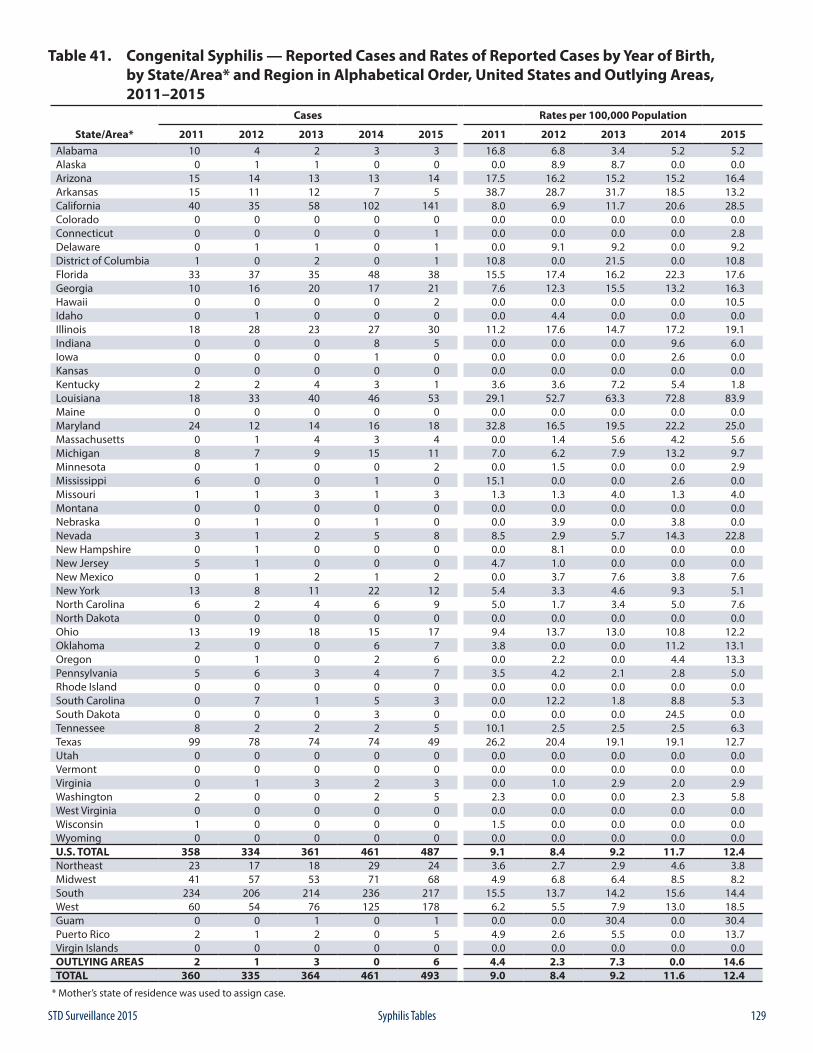
129STD Surveillance 2015 Syphilis Tables
Table 41. Congenital Syphilis — Reported Cases and Rates of Reported Cases by Year of Birth, by State/Area* and Region in Alphabetical Order, United States and Outlying Areas, 2011–2015
Cases Rates per 100,000 Population
State/Area* 2011 2012 2013 2014 2015 2011 2012 2013 2014 2015Alabama 10 4 2 3 3 16.8 6.8 3.4 5.2 5.2Alaska 0 1 1 0 0 0.0 8.9 8.7 0.0 0.0Arizona 15 14 13 13 14 17.5 16.2 15.2 15.2 16.4Arkansas 15 11 12 7 5 38.7 28.7 31.7 18.5 13.2California 40 35 58 102 141 8.0 6.9 11.7 20.6 28.5Colorado 0 0 0 0 0 0.0 0.0 0.0 0.0 0.0Connecticut 0 0 0 0 1 0.0 0.0 0.0 0.0 2.8Delaware 0 1 1 0 1 0.0 9.1 9.2 0.0 9.2District of Columbia 1 0 2 0 1 10.8 0.0 21.5 0.0 10.8Florida 33 37 35 48 38 15.5 17.4 16.2 22.3 17.6Georgia 10 16 20 17 21 7.6 12.3 15.5 13.2 16.3Hawaii 0 0 0 0 2 0.0 0.0 0.0 0.0 10.5Idaho 0 1 0 0 0 0.0 4.4 0.0 0.0 0.0Illinois 18 28 23 27 30 11.2 17.6 14.7 17.2 19.1Indiana 0 0 0 8 5 0.0 0.0 0.0 9.6 6.0Iowa 0 0 0 1 0 0.0 0.0 0.0 2.6 0.0Kansas 0 0 0 0 0 0.0 0.0 0.0 0.0 0.0Kentucky 2 2 4 3 1 3.6 3.6 7.2 5.4 1.8Louisiana 18 33 40 46 53 29.1 52.7 63.3 72.8 83.9Maine 0 0 0 0 0 0.0 0.0 0.0 0.0 0.0Maryland 24 12 14 16 18 32.8 16.5 19.5 22.2 25.0Massachusetts 0 1 4 3 4 0.0 1.4 5.6 4.2 5.6Michigan 8 7 9 15 11 7.0 6.2 7.9 13.2 9.7Minnesota 0 1 0 0 2 0.0 1.5 0.0 0.0 2.9Mississippi 6 0 0 1 0 15.1 0.0 0.0 2.6 0.0Missouri 1 1 3 1 3 1.3 1.3 4.0 1.3 4.0Montana 0 0 0 0 0 0.0 0.0 0.0 0.0 0.0Nebraska 0 1 0 1 0 0.0 3.9 0.0 3.8 0.0Nevada 3 1 2 5 8 8.5 2.9 5.7 14.3 22.8New Hampshire 0 1 0 0 0 0.0 8.1 0.0 0.0 0.0New Jersey 5 1 0 0 0 4.7 1.0 0.0 0.0 0.0New Mexico 0 1 2 1 2 0.0 3.7 7.6 3.8 7.6New York 13 8 11 22 12 5.4 3.3 4.6 9.3 5.1North Carolina 6 2 4 6 9 5.0 1.7 3.4 5.0 7.6North Dakota 0 0 0 0 0 0.0 0.0 0.0 0.0 0.0Ohio 13 19 18 15 17 9.4 13.7 13.0 10.8 12.2Oklahoma 2 0 0 6 7 3.8 0.0 0.0 11.2 13.1Oregon 0 1 0 2 6 0.0 2.2 0.0 4.4 13.3Pennsylvania 5 6 3 4 7 3.5 4.2 2.1 2.8 5.0Rhode Island 0 0 0 0 0 0.0 0.0 0.0 0.0 0.0South Carolina 0 7 1 5 3 0.0 12.2 1.8 8.8 5.3South Dakota 0 0 0 3 0 0.0 0.0 0.0 24.5 0.0Tennessee 8 2 2 2 5 10.1 2.5 2.5 2.5 6.3Texas 99 78 74 74 49 26.2 20.4 19.1 19.1 12.7Utah 0 0 0 0 0 0.0 0.0 0.0 0.0 0.0Vermont 0 0 0 0 0 0.0 0.0 0.0 0.0 0.0Virginia 0 1 3 2 3 0.0 1.0 2.9 2.0 2.9Washington 2 0 0 2 5 2.3 0.0 0.0 2.3 5.8West Virginia 0 0 0 0 0 0.0 0.0 0.0 0.0 0.0Wisconsin 1 0 0 0 0 1.5 0.0 0.0 0.0 0.0Wyoming 0 0 0 0 0 0.0 0.0 0.0 0.0 0.0U.S. TOTAL 358 334 361 461 487 9.1 8.4 9.2 11.7 12.4Northeast 23 17 18 29 24 3.6 2.7 2.9 4.6 3.8Midwest 41 57 53 71 68 4.9 6.8 6.4 8.5 8.2South 234 206 214 236 217 15.5 13.7 14.2 15.6 14.4West 60 54 76 125 178 6.2 5.5 7.9 13.0 18.5Guam 0 0 1 0 1 0.0 0.0 30.4 0.0 30.4Puerto Rico 2 1 2 0 5 4.9 2.6 5.5 0.0 13.7Virgin Islands 0 0 0 0 0 0.0 0.0 0.0 0.0 0.0OUTLYING AREAS 2 1 3 0 6 4.4 2.3 7.3 0.0 14.6TOTAL 360 335 364 461 493 9.0 8.4 9.2 11.6 12.4
* Mother’s state of residence was used to assign case.
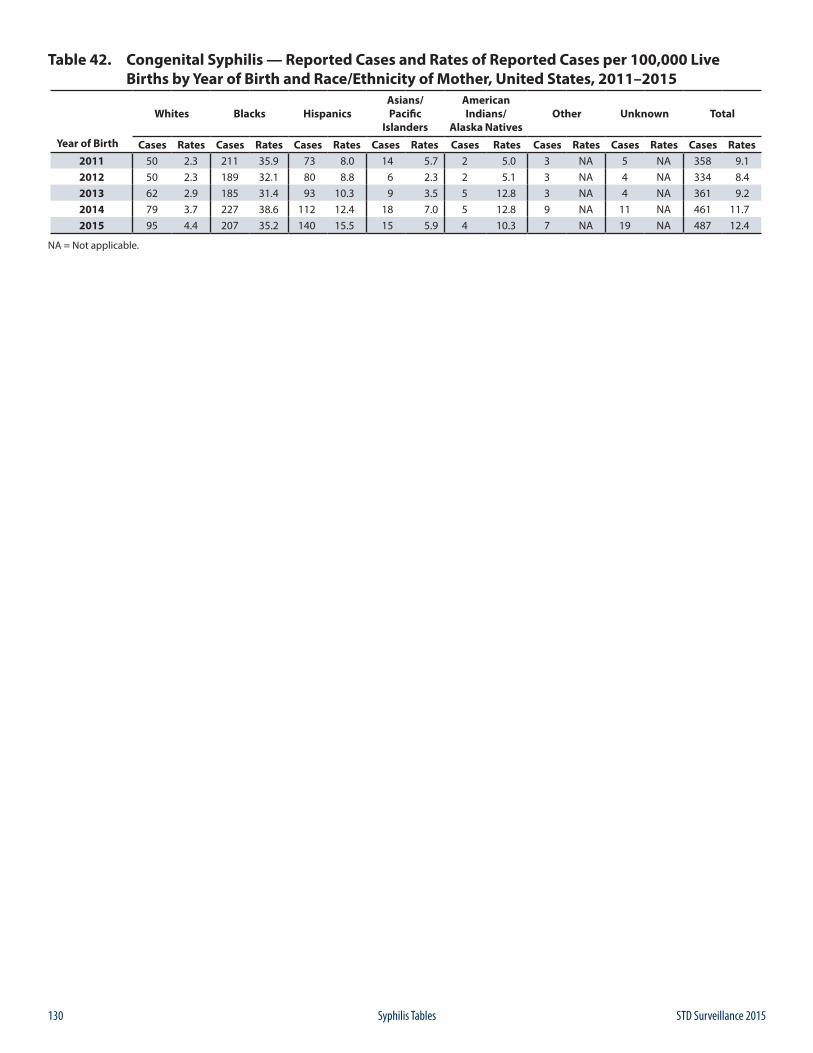
130 STD Surveillance 2015Syphilis Tables
Table 42. Congenital Syphilis — Reported Cases and Rates of Reported Cases per 100,000 Live Births by Year of Birth and Race/Ethnicity of Mother, United States, 2011–2015
Year of Birth
Whites Blacks HispanicsAsians/Pacific
Islanders
American Indians/
Alaska NativesOther Unknown Total
Cases Rates Cases Rates Cases Rates Cases Rates Cases Rates Cases Rates Cases Rates Cases Rates2011 50 2.3 211 35.9 73 8.0 14 5.7 2 5.0 3 NA 5 NA 358 9.12012 50 2.3 189 32.1 80 8.8 6 2.3 2 5.1 3 NA 4 NA 334 8.42013 62 2.9 185 31.4 93 10.3 9 3.5 5 12.8 3 NA 4 NA 361 9.22014 79 3.7 227 38.6 112 12.4 18 7.0 5 12.8 9 NA 11 NA 461 11.72015 95 4.4 207 35.2 140 15.5 15 5.9 4 10.3 7 NA 19 NA 487 12.4
NA = Not applicable.
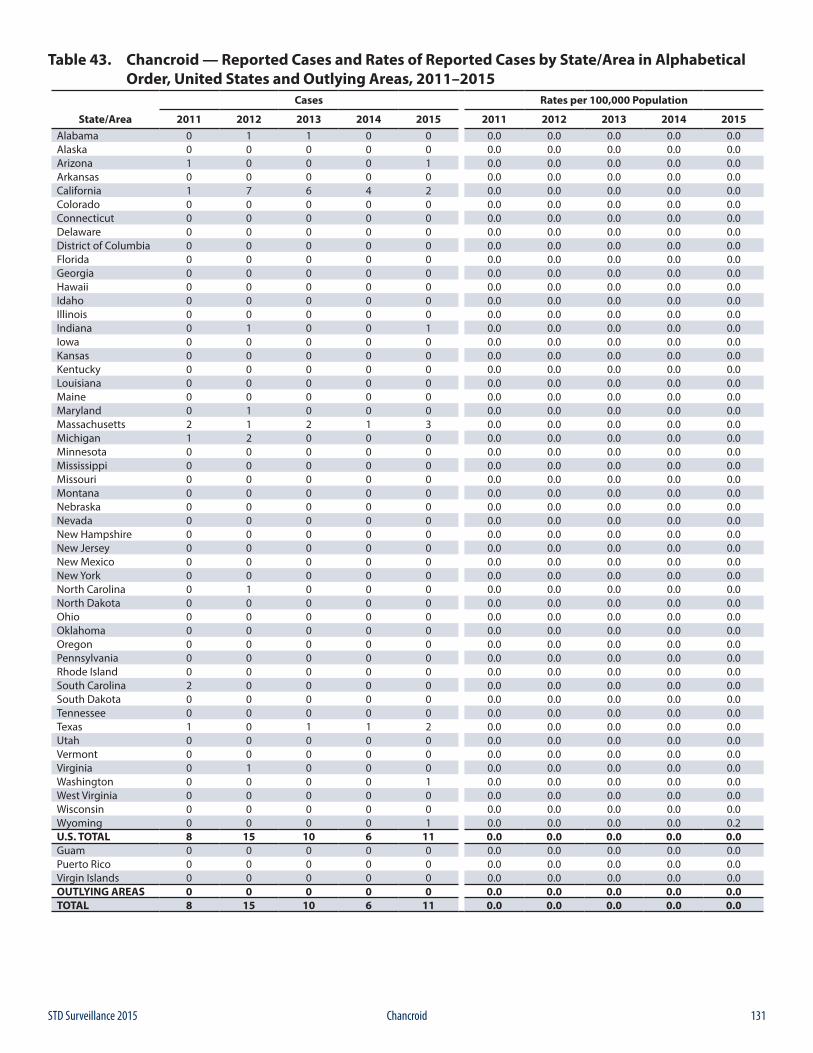
131STD Surveillance 2015 Chancroid
Table 43. Chancroid — Reported Cases and Rates of Reported Cases by State/Area in Alphabetical Order, United States and Outlying Areas, 2011–2015
Cases Rates per 100,000 Population
State/Area 2011 2012 2013 2014 2015 2011 2012 2013 2014 2015Alabama 0 1 1 0 0 0.0 0.0 0.0 0.0 0.0Alaska 0 0 0 0 0 0.0 0.0 0.0 0.0 0.0Arizona 1 0 0 0 1 0.0 0.0 0.0 0.0 0.0Arkansas 0 0 0 0 0 0.0 0.0 0.0 0.0 0.0California 1 7 6 4 2 0.0 0.0 0.0 0.0 0.0Colorado 0 0 0 0 0 0.0 0.0 0.0 0.0 0.0Connecticut 0 0 0 0 0 0.0 0.0 0.0 0.0 0.0Delaware 0 0 0 0 0 0.0 0.0 0.0 0.0 0.0District of Columbia 0 0 0 0 0 0.0 0.0 0.0 0.0 0.0Florida 0 0 0 0 0 0.0 0.0 0.0 0.0 0.0Georgia 0 0 0 0 0 0.0 0.0 0.0 0.0 0.0Hawaii 0 0 0 0 0 0.0 0.0 0.0 0.0 0.0Idaho 0 0 0 0 0 0.0 0.0 0.0 0.0 0.0Illinois 0 0 0 0 0 0.0 0.0 0.0 0.0 0.0Indiana 0 1 0 0 1 0.0 0.0 0.0 0.0 0.0Iowa 0 0 0 0 0 0.0 0.0 0.0 0.0 0.0Kansas 0 0 0 0 0 0.0 0.0 0.0 0.0 0.0Kentucky 0 0 0 0 0 0.0 0.0 0.0 0.0 0.0Louisiana 0 0 0 0 0 0.0 0.0 0.0 0.0 0.0Maine 0 0 0 0 0 0.0 0.0 0.0 0.0 0.0Maryland 0 1 0 0 0 0.0 0.0 0.0 0.0 0.0Massachusetts 2 1 2 1 3 0.0 0.0 0.0 0.0 0.0Michigan 1 2 0 0 0 0.0 0.0 0.0 0.0 0.0Minnesota 0 0 0 0 0 0.0 0.0 0.0 0.0 0.0Mississippi 0 0 0 0 0 0.0 0.0 0.0 0.0 0.0Missouri 0 0 0 0 0 0.0 0.0 0.0 0.0 0.0Montana 0 0 0 0 0 0.0 0.0 0.0 0.0 0.0Nebraska 0 0 0 0 0 0.0 0.0 0.0 0.0 0.0Nevada 0 0 0 0 0 0.0 0.0 0.0 0.0 0.0New Hampshire 0 0 0 0 0 0.0 0.0 0.0 0.0 0.0New Jersey 0 0 0 0 0 0.0 0.0 0.0 0.0 0.0New Mexico 0 0 0 0 0 0.0 0.0 0.0 0.0 0.0New York 0 0 0 0 0 0.0 0.0 0.0 0.0 0.0North Carolina 0 1 0 0 0 0.0 0.0 0.0 0.0 0.0North Dakota 0 0 0 0 0 0.0 0.0 0.0 0.0 0.0Ohio 0 0 0 0 0 0.0 0.0 0.0 0.0 0.0Oklahoma 0 0 0 0 0 0.0 0.0 0.0 0.0 0.0Oregon 0 0 0 0 0 0.0 0.0 0.0 0.0 0.0Pennsylvania 0 0 0 0 0 0.0 0.0 0.0 0.0 0.0Rhode Island 0 0 0 0 0 0.0 0.0 0.0 0.0 0.0South Carolina 2 0 0 0 0 0.0 0.0 0.0 0.0 0.0South Dakota 0 0 0 0 0 0.0 0.0 0.0 0.0 0.0Tennessee 0 0 0 0 0 0.0 0.0 0.0 0.0 0.0Texas 1 0 1 1 2 0.0 0.0 0.0 0.0 0.0Utah 0 0 0 0 0 0.0 0.0 0.0 0.0 0.0Vermont 0 0 0 0 0 0.0 0.0 0.0 0.0 0.0Virginia 0 1 0 0 0 0.0 0.0 0.0 0.0 0.0Washington 0 0 0 0 1 0.0 0.0 0.0 0.0 0.0West Virginia 0 0 0 0 0 0.0 0.0 0.0 0.0 0.0Wisconsin 0 0 0 0 0 0.0 0.0 0.0 0.0 0.0Wyoming 0 0 0 0 1 0.0 0.0 0.0 0.0 0.2U.S. TOTAL 8 15 10 6 11 0.0 0.0 0.0 0.0 0.0Guam 0 0 0 0 0 0.0 0.0 0.0 0.0 0.0Puerto Rico 0 0 0 0 0 0.0 0.0 0.0 0.0 0.0Virgin Islands 0 0 0 0 0 0.0 0.0 0.0 0.0 0.0OUTLYING AREAS 0 0 0 0 0 0.0 0.0 0.0 0.0 0.0TOTAL 8 15 10 6 11 0.0 0.0 0.0 0.0 0.0
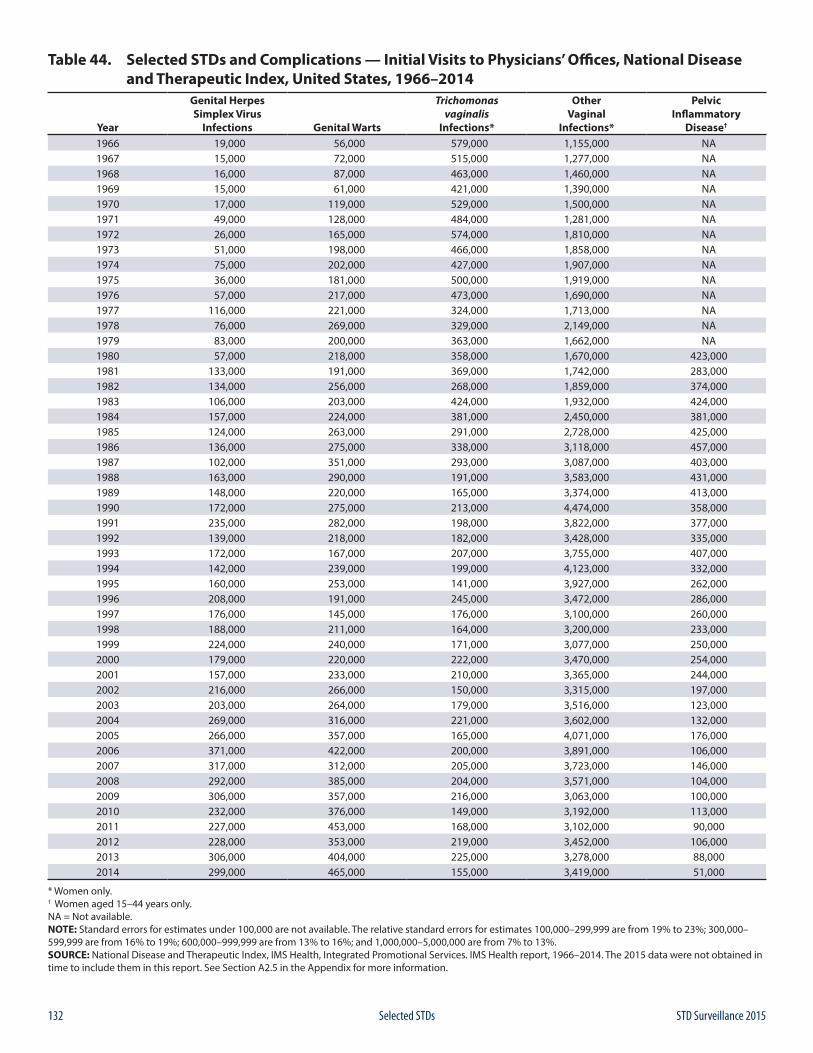
132 STD Surveillance 2015Selected STDs
Table 44. Selected STDs and Complications — Initial Visits to Physicians’ Offices, National Disease and Therapeutic Index, United States, 1966–2014
Year
Genital Herpes Simplex Virus
Infections Genital Warts
Trichomonas vaginalis
Infections*
Other Vaginal
Infections*
Pelvic Inflammatory
Disease†
1966 19,000 56,000 579,000 1,155,000 NA1967 15,000 72,000 515,000 1,277,000 NA1968 16,000 87,000 463,000 1,460,000 NA1969 15,000 61,000 421,000 1,390,000 NA1970 17,000 119,000 529,000 1,500,000 NA1971 49,000 128,000 484,000 1,281,000 NA1972 26,000 165,000 574,000 1,810,000 NA1973 51,000 198,000 466,000 1,858,000 NA1974 75,000 202,000 427,000 1,907,000 NA1975 36,000 181,000 500,000 1,919,000 NA1976 57,000 217,000 473,000 1,690,000 NA1977 116,000 221,000 324,000 1,713,000 NA1978 76,000 269,000 329,000 2,149,000 NA1979 83,000 200,000 363,000 1,662,000 NA1980 57,000 218,000 358,000 1,670,000 423,0001981 133,000 191,000 369,000 1,742,000 283,0001982 134,000 256,000 268,000 1,859,000 374,0001983 106,000 203,000 424,000 1,932,000 424,0001984 157,000 224,000 381,000 2,450,000 381,0001985 124,000 263,000 291,000 2,728,000 425,0001986 136,000 275,000 338,000 3,118,000 457,0001987 102,000 351,000 293,000 3,087,000 403,0001988 163,000 290,000 191,000 3,583,000 431,0001989 148,000 220,000 165,000 3,374,000 413,0001990 172,000 275,000 213,000 4,474,000 358,0001991 235,000 282,000 198,000 3,822,000 377,0001992 139,000 218,000 182,000 3,428,000 335,0001993 172,000 167,000 207,000 3,755,000 407,0001994 142,000 239,000 199,000 4,123,000 332,0001995 160,000 253,000 141,000 3,927,000 262,0001996 208,000 191,000 245,000 3,472,000 286,0001997 176,000 145,000 176,000 3,100,000 260,0001998 188,000 211,000 164,000 3,200,000 233,0001999 224,000 240,000 171,000 3,077,000 250,0002000 179,000 220,000 222,000 3,470,000 254,0002001 157,000 233,000 210,000 3,365,000 244,0002002 216,000 266,000 150,000 3,315,000 197,0002003 203,000 264,000 179,000 3,516,000 123,0002004 269,000 316,000 221,000 3,602,000 132,0002005 266,000 357,000 165,000 4,071,000 176,0002006 371,000 422,000 200,000 3,891,000 106,0002007 317,000 312,000 205,000 3,723,000 146,0002008 292,000 385,000 204,000 3,571,000 104,0002009 306,000 357,000 216,000 3,063,000 100,0002010 232,000 376,000 149,000 3,192,000 113,0002011 227,000 453,000 168,000 3,102,000 90,0002012 228,000 353,000 219,000 3,452,000 106,0002013 306,000 404,000 225,000 3,278,000 88,0002014 299,000 465,000 155,000 3,419,000 51,000
* Women only. † Women aged 15–44 years only. NA = Not available.NOTE: Standard errors for estimates under 100,000 are not available. The relative standard errors for estimates 100,000–299,999 are from 19% to 23%; 300,000– 599,999 are from 16% to 19%; 600,000–999,999 are from 13% to 16%; and 1,000,000–5,000,000 are from 7% to 13%.SOURCE: National Disease and Therapeutic Index, IMS Health, Integrated Promotional Services. IMS Health report, 1966–2014. The 2015 data were not obtained in time to include them in this report. See Section A2.5 in the Appendix for more information.

133STD Surveillance 2015
AP
PEN
DIX

134 STD Surveillance 2015
AP
PEN
DIX
135STD Surveillance 2015 Appendix: Interpreting STD Surveillance Data
Sexually Transmitted Disease Surveillance 2015 presents surveillance information derived from the official statistics for the reported occurrence of nationally notifiable sexually transmitted diseases (STDs) in the United States, test positivity and prevalence data from numerous prevalence monitoring initiatives, sentinel surveillance, and national health care services surveys.
A1. Nationally Notifiable STD SurveillanceNationally notifiable STD surveillance data are collected and compiled from reports sent by the STD control programs and health departments in all 50 states, the District of Columbia, selected cities, U.S. dependencies and possessions, and independent nations in free association with the United States to the Division of STD Prevention, National Center for HIV/AIDS, Viral Hepatitis, STD, and TB Prevention, Centers for Disease Control and Prevention (CDC). Included among the dependencies, possessions, and independent nations are Guam, Puerto Rico, and the Virgin Islands. These entities are identified as “outlying areas” of the United States in selected figures and tables.
A1.1 Reporting FormatsSTD morbidity data presented in this report are compiled from a combination of data reported on standardized hard copy reporting forms and electronic data received through the National Electronic Telecommunications System for Surveillance (NETSS).
Summary Report FormsThe following hard copy forms were used to report national STD morbidity data:
1. FORM CDC 73.998: Monthly Surveillance Report of Early Syphilis. This monthly hard copy reporting form was used during 1984–2002 to report summary data for primary and secondary syphilis and early latent syphilis by county and state.
2. FORM CDC 73.688: Sexually Transmitted Disease Morbidity Report. This quarterly hard copy reporting form was used during 1963–2002 to report summary data for all stages of syphilis, congenital syphilis, gonorrhea, chancroid, chlamydia, and other STDs by sex and source of report (private versus public) for all 50 states, the District of Columbia, 64 selected cities (including San Juan, Puerto Rico), and outlying areas of the United States.
Note: Chlamydial infection became a nationally notifiable condition in 1996, and the form was modified to support reporting of chlamydia that year. Congenital syphilis was dropped from this aggregate form in 1995 and replaced by the case-specific CDC 73.126 form described later in this section.
3. FORM CDC 73.2638: Report of Civilian Cases of Primary & Secondary Syphilis, Gonorrhea, and Chlamydia by Reporting Source, Sex, Race/Ethnicity, and Age Group. This annual hard copy form was used during 1981–2002 to report summary data for P&S syphilis, gonorrhea, and chlamydia by age, race, sex, and source (public versus private) for all 50 states, seven large cities (Baltimore, Chicago, New York City, Los Angeles, Philadelphia, San Francisco, and the District of Columbia), and outlying areas of the United States. Note: Chlamydial infection became a nationally notifiable condition in 1995, and the form was modified to support reporting of chlamydia that year.
4. FORM CDC 73.126: Congenital Syphilis (CS) Case Investigation and Reporting. This case-specific hard copy form was first used in 1983 and continues to be used to report detailed case-specific data for congenital syphilis in some areas.
National Electronic Telecommunications System for Surveillance Notifiable STD data reported electronically through the National Electronic Telecommunications System for Surveillance (NETSS) make up the nationally notifiable disease information published in CDC’s Morbidity and Mortality Weekly Report.
As of December 31, 2003, all 50 states and the District of Columbia had converted from summary hard copy reporting to electronic submission of line-listed (i.e., case-specific) STD data through NETSS (41 reporting areas submitted congenital syphilis surveillance data through NETSS in 2015). Puerto Rico converted to electronic reporting in 2006 for all STDs excluding congenital syphilis. Guam and the Virgin Islands continue to report STD data through summary hard copy forms.Surveillance data and updates sent to CDC through NETSS and on hard copy forms through June 8, 2016, are included in this report. The data presented in the figures and tables in this report supersede those in all earlier publications.
A. Interpreting STD Surveillance Data
136 STD Surveillance 2015Appendix: Interpreting STD Surveillance Data
A1.2 Population Denominators and Rate Calculations
2000–2015 Rates and Population For those figures and tables presenting race using the 1997 OMB race standards, non-bridged-race data provided directly by the U.S. Census Bureau were used to calculate race. The latest available year for population estimates at the time this report was written was 2014. Thus, 2014 population estimates were used to calculate 2015 rates. Once published, the 2015 population estimates will be used to calculate rates in the upcoming 2016 STD Surveillance Report.
Population estimates for Puerto Rico were obtained from the U.S. Census Bureau Web site at: https://factfinder.census.gov/faces/nav/jsf/pages/index.xhtml.
Population estimates for Guam and the Virgin Islands were obtained from the U.S. Census Bureau International Programs Web site at: https://www.census.gov/population/international/data/idb/informationGateway.php.
The 2015 rates by age and sex for Guam and the Virgin Islands were calculated using 2010 population estimates available at: https://factfinder.census.gov/faces/nav/jsf/pages/index.xhtml.
Because of the use of the updated population data, rates for 2000–2014 may be different from those presented in previous STD surveillance reports.
Several figures throughout this report depict state- or county-specific rates of reported cases of STDs. Rates were grouped and displayed by quartiles in Figures 3, 4, 15, 16, 34, B, C, D, H, I, J, K, L, M, N, and O. Rates were grouped and displayed in 4 categories – zero cases and tertiles – in Figure 35 and Figure D.
1990–1999 Rates and PopulationThe population counts for 1990 through 1999 incorporated the bridged single-race estimates of the April 1, 2000, U.S. resident population. These files were prepared by the U.S. Census Bureau with support from the National Cancer Institute.
1981–1989 Rates and PopulationRates were calculated by using U.S. Census Bureau population estimates for 1981 through 1989.1,2
1941–1980 Rates and PopulationRates for 1941 through 1980 were based on population estimates from the U.S. Census Bureau and are currently maintained by CDC’s Division of STD Prevention.
1941–2015 Congenital Syphilis Rates and Live BirthsThe congenital syphilis data in Table 1 of this report represent the number of congenital syphilis cases per 100,000 live births for all years during 1941–2015. Previous publications presented congenital syphilis rates per 100,000 population during 1941–1994 and rates for cases diagnosed at younger than 1 year of age per 100,000 live births during 1995–2005. To allow for trends in congenital syphilis rates to be compared for the period 1941 through 2015, live births now are used as the denominator for congenital syphilis, and case counts are no longer limited to those diagnosed within the first year of life. Congenital syphilis morbidity is assigned by year of birth. Rates of congenital syphilis for 1963 through 1988 were calculated by using published live birth data.3 Congenital syphilis rates for 1989 through 2013 were calculated by using live birth data based on information coded by the states and provided to the NCHS through the Vital Statistics Cooperative Program. Rates for 2014 and 2015 were calculated by using live birth data for 2013.
A1.3 Reporting PracticesAlthough most state and local STD programs generally adhere to the national notifiable STD case definitions collaboratively developed by the Council of State and Territorial Epidemiologists and CDC, differences in policies and systems for collecting surveillance data may exist. Thus, comparisons of case numbers and rates between jurisdictions should be interpreted with caution. However, because case definitions and surveillance activities within a given area remain relatively stable over time, trends should be minimally affected by these differences.
A1.4 Reporting of Surveillance Data by Metropolitan Statistical AreaSexually Transmitted Disease Surveillance 2015 continues the presentation of STD incidence data and rates for the 50 metropolitan statistical areas (MSAs) with the largest populations according to 2010 census data. STD surveillance reports published before 2005 presented data by selected cities; these data were derived from county data, which were used to estimate city-specific disease rates. Because county data were used to estimate city-specific morbidity and because current STD project areas’ reporting practices do not support direct identification of city-specific morbidity reports, MSAs were chosen as a geographic unit smaller than a state or territory for presentation of STD morbidity data.
MSAs are defined by the OMB to provide nationally consistent definitions for collecting, tabulating, and
137STD Surveillance 2015 Appendix: Interpreting STD Surveillance Data
publishing federal statistics for a set of geographic areas.4 An MSA is associated with at least one urbanized area that has a population of at least 50,000. The MSA comprises the central county or counties containing the central county, plus adjacent, outlying counties that have a high degree of social and economic integration with the central county as measured through commuting. The title of an MSA includes the name of the principal city with the largest 2010 census population. If there are multiple principal cities, the names of the second largest and third largest principal cities appear in the title in order of descending population size.
The MSA concept has been used as a statistical representation of the social and economic links between urban cores and outlying, integrated areas. However, MSAs do not equate to an urban-rural classification; all counties included in MSAs and many other counties contain both urban and rural territory and populations. STD programs that treat all parts of an MSA as if they were as urban as the densely settled core ignore the rural conditions that may exist in some parts of the area. In short, MSAs are not intended to be a general purpose geographic framework for nonstatistical activities or for use in program funding formulas.
For more information on the MSA definitions used in this report, go to: https://www.census.gov/population/metro/data/metrodef.html.
A1.5 Reporting of Data for Race/EthnicityIn April 2008, the NETSS record layout was updated to conform to the OMB’s current government-wide standard for race/ethnicity data. The OMB standards were first issued in 1997.5 Beginning with the publication of Sexually Transmitted Disease Surveillance 2012, the race/ethnicity data are presented according to the current standard categories: American Indian or Alaska Native, Asian, Black or African American, Hispanic or Latino, Native Hawaiian/Other Pacific Islander, White and Multirace. For this report, jurisdictions are considered to be OMB compliant for a condition if ≥97% of cases for that condition are reported using current OMB standards. As of reporting year 2015, 1 jurisdiction (the District of Columbia) was not compliant with the current OMB race/ethnicity standards when reporting chlamydia and gonorrhea. Only two jurisdictions (Utah and the District of Columbia) were not compliant with the current OMB race/ethnicity standards when reporting primary and secondary syphilis.
For chlamydia and gonorrhea figures showing trends for 2011–2015, data are included for all jurisdictions except six not consistently reporting race/ethnicity data according to the current standard categories for the five consecutive
years (Alaska, Maryland, Michigan, New York, North Carolina and the District of Columbia). For primary and secondary syphilis figures showing trends for 2011– 2015, data are included for all jurisdictions except six not consistently reporting race/ethnicity data according to the current standard categories for the five consecutive years (Alaska, Maryland, New York, North Carolina, Utah, and the District of Columbia).
A1.6 Management of Unknown, Missing, or Invalid Data for Age Group, Race/Ethnicity, and SexThe percentage of unknown, missing, or invalid data for age group, race/ethnicity, and sex varies from year to year, state to state, and by disease for reported STDs (Table A1).
Prior to the publication of Sexually Transmitted Disease Surveillance 2010, when the percentage of unknown, missing, or invalid values for age group, race/ethnicity, and sex exceeded 50% for any state, the state’s incidence and population data were excluded from the tables that presented data stratified by one or more of these variables. For the states for which 50% or more of their data were valid for age group, race/ethnicity, and sex, the values for unknown, missing, or invalid data were redistributed on the basis of the state’s distribution of known age group, race/ethnicity, and sex data. Beginning with the publication of Sexually Transmitted Disease Surveillance 2010, redistribution methodology is not applied to any of the data. The counts presented in this report are summations of all valid data reported in reporting year 2015.
As a result, rate data that are stratified by one or more of these variables reflect rates based on reported data only.
A1.7 Classification of STD Morbidity Reporting SourcesBefore 1996, states classified the source of case reports as either private source (including private physicians, hospitals, and institutions) or public source (primarily STD clinics). As states began reporting morbidity data electronically in 1996, the classification categories for source of case reports expanded to include the following data sources: STD clinics, HIV counseling and testing sites, drug treatment clinics, family planning clinics, prenatal/obstetrics clinics, tuberculosis clinics, private physicians/health maintenance organizations (HMOs), hospitals (inpatient), emergency rooms, correctional facilities, laboratories, blood banks, the National Job Training Program (NJTP), school-based clinics, mental health providers, the military, the Indian Health Service, and other unspecified sources. Figures 7, 8, 21, and 22 display trends in the proportion of cases reported in 2015 categorized by reporting source. Categories displayed vary
138 STD Surveillance 2015Appendix: Interpreting STD Surveillance Data
across these figures and include the five most commonly reported sources for the population included in the figure, along with trends for all other reporting sources combined into the “All Other” category, and trends in the proportion of cases with unknown reporting source.
A1.8 Interpreting Chlamydia Case ReportingTrends in rates of reported cases of chlamydia are influenced by changes in incidence of infection, as well as changes in diagnostic, screening, and reporting practices. As chlamydial infections are usually asymptomatic, the number of infections identified and reported can increase as more people are screened even when incidence is flat or decreasing. Expanded use of more sensitive diagnostic tests (e.g., nucleic acid amplification tests, [NAATs]) can also increase the number of infections identified and reported independent of increases in incidence. Although chlamydia has been a nationally notifiable condition since 1994, it was not until 2000 that all 50 states and the District of Columbia required reporting of chlamydia cases. National case rates prior to 2000 reflect incomplete reporting. Additionally, increasing use of electronic laboratory reporting has likely increased the proportion of diagnosed cases that are reported. Consequently, an increasing chlamydia case rate may reflect increases in incidence of infection, screening coverage, and use of more sensitive tests, as well as more complete reporting. Likewise, decreases in chlamydia case rates may suggest decreases in incidence of infection or screening coverage.
A1.9 Syphilis Morbidity ReportingThe category of “total syphilis” or “all stages of syphilis” includes primary syphilis, secondary syphilis, early latent syphilis, late latent syphilis, and late syphilis with clinical manifestations (including late benign syphilis and cardiovascular syphilis), and congenital syphilis.
Although neurosyphilis can occur at almost any stage of syphilis, during 1996–2005 it was classified and reported as one of several mutually exclusive stages of syphilis. Beginning in 2005, neurosyphilis was no longer classified or reported as a distinct stage of syphilis.
A1.10 Congenital Syphilis Morbidity ReportingIn 1988, the surveillance case definition for congenital syphilis was changed. This case definition has greater sensitivity than the former definition.6 In addition, many state and local STD programs have greatly enhanced active case finding for congenital syphilis since 1988. For these reasons, as well as because of increasing morbidity, the number of reported cases increased dramatically during 1989–1991. All reporting areas had implemented the
new case definition for reporting congenital syphilis by January 1, 1992. In addition to changing the case definition for congenital syphilis, CDC introduced a new data collection form (CDC 73.126) in 1990 (revised February 2013). Since 1995, the data collected on this form have been used for reporting congenital syphilis cases and associated rates. This form is used to collect individual case information, which allows more thorough analysis of case characteristics. For the purpose of analyzing race/ethnicity, cases are classified by the race/ethnicity of the mother. Similarly, since 1995, congenital syphilis cases are reported by state and city of residence of the mother.
Congenital syphilis reporting may be delayed as a result of case investigation and validation. Cases for previous years are added to CDC’s surveillance databases throughout the year. Congenital syphilis data reported after publication of the current annual STD surveillance report will appear in subsequent reports and are assigned by the case patient’s year of birth.
A2. Other Sources of Surveillance Data
A2.1 National Job Training Program Chlamydia and gonorrhea prevalence was calculated for men and women entering the National Job Training Program (NJTP). To increase the stability of the estimates, chlamydia or gonorrhea prevalence data are presented when valid test results for 100 or more students per year are available for the population subgroup and state. The majority of NJTP’s chlamydia screening tests are conducted by a single national contract laboratory, which provides these data to CDC. Gonorrhea screening tests for male and female students in many training centers are conducted by local laboratories; these data are not available to CDC. Test results for students at centers that submit specimens to the national contract laboratory are included only if the number of gonorrhea tests submitted is greater than 90% of the number of chlamydia tests submitted from the same center for the same period. Prevalence data for state-specific figures were published with permission from the Department of Labor. Prevalence data are presented in figures L, M, N, and O.
A2.2 STD Surveillance Network In 2005, CDC established the STD Surveillance Network (SSuN) as a collaborative network of state, county and/or city health departments following protocols to conduct sentinel and enhanced STD surveillance activities. The purpose of SSuN is to improve the capacity of national, state and local STD programs to detect, monitor, and respond to trends in STDs through enhanced collection, reporting, analysis, visualization, and interpretation of disease information.
139STD Surveillance 2015 Appendix: Interpreting STD Surveillance Data
Cycle 3 (2013–2018) of SSuN provides funding to 10 jurisdictions to conduct two core STD surveillance activities including; (1) sentinel facility component providing clinical and demographic information on a full census of patients attending categorical STD clinics and women aged 15–44 years presenting for care in reproductive health settings, and, (2) population component conducting enhanced health department look-back, provider and patient investigations on a probability sample of all persons diagnosed and reported with gonorrhea. Funded areas for both core activities in SSuN Cycle 3 include Baltimore City [Maryland], California, Florida, Massachusetts, Minnesota, Multnomah County [Oregon], Philadelphia City [Pennsylvania], New York City [New York], San Francisco County [California] and Washington State.
In both the facility and population components of SSuN Cycle 3, unique patients can be anonymously identified using non-identifying IDs to provide longitudinal information. In the facility component, the primary unit of analysis is the patient visit, which is merged with multiple laboratory, diagnostic and treatment observations. In the population component, the primary unit analysis is a reported episode of gonorrhea for a unique person merged with multiple laboratory observations, health department disease registry history, provider-based clinical information and patient demographic and behavioral interview data. For analysis in the population component, cases in the probability sample are weighted to reflect study design and to adjust for non-response by demographic category of the patient. Weighted analyses provides estimates of case and person characteristics representative of all reported cases in the collaborating jurisdictions.
Gay, bisexual, and other men who have sex with men (collectively referred to as MSM) are defined in all SSuN data collection activities as men who either reported having sex with another man in the preceding 2–3 months, report current history of male sex partners, and/or those who reported that they considered themselves gay/homosexual or bisexual. Men who have sex with women (MSW) are defined as men who reported having sex with women only, or who did not report the sex of their sex partners but reported that they considered themselves to be straight/heterosexual.
Data points presented in this report for 2015 from the facility component SSuN (Figures 9, 24, 49, W, X, and Y) are based on STD clinic data from 9 SSuN jurisdictions (Baltimore City [Maryland], California, Florida, Massachusetts, Multnomah County [Oregon], New York City [New York], Philadelphia City [Pennsylvania], San Francisco County [California] and Washington State). Data presented in the report from the population component of SSuN include Figure 23, which presents data collected June through December 2015 showing the proportion of cases attributable to MSM, MSW, and women for 7
jurisdictions (Baltimore City [Maryland], California, Florida, New York City [New York], Philadelphia City [Pennsylvania], San Francisco County [California] and Washington State).
A2.3 Gonococcal Isolate Surveillance Project Data on antimicrobial susceptibility in Neisseria gonorrhoeae were collected through the Gonococcal Isolate Surveillance Project (GISP), a sentinel system of selected STD clinics located at 25–30 GISP sentinel sites and 4–5 regional laboratories in the United States. For more details on findings from GISP, go to: https://www.cdc.gov/std/GISP.
For 2015, the antimicrobial agents tested by GISP were ceftriaxone, cefixime, azithromycin, ciprofloxacin, penicillin, tetracycline, and gentamicin.
The antimicrobial susceptibility criteria used in GISP for 2015 are as follows:
• Ceftriaxone, minimum inhibitory concentration (MIC) ≥0.5 µg/ml (decreased susceptibility)*
• Ceftriaxone, MIC ≥0.125 µg/ml (elevated MICs)*• Cefixime, MIC ≥0.5 µg/ml (decreased susceptibility)*• Cefixime, MIC ≥0.25 µg/ml (elevated MICs)*• Azithromycin, MIC ≥2.0 µg/ml (decreased
susceptibility)*• Ciprofloxacin, MIC ≥1.0 µg/ml (resistance)• Ciprofloxacin, MIC 0.125–0.5 µg/ml (intermediate
resistance)• Penicillin, MIC ≥2.0 µg/ml (resistance)• Tetracycline, MIC ≥2.0 µg/ml (resistance)• Gentamicin (MIC values correlated with
susceptibility and resistance have not been established).
The majority of these criteria are also recommended by the Clinical and Laboratory Standards Institute (CLSI).7
* The CLSI criteria for decreased susceptibility and resistance to ceftriaxone, cefixime, gentamicin, and azithromycin and for susceptibility to azithromycin have not been established for N. gonorrhoeae.
A2.4 National Health and Nutrition Examination Survey The National Health and Nutrition Examination Survey (NHANES) is a series of cross-sectional surveys designed to provide national statistics on the health and nutritional status of the general household population in the United States. Data are collected through household interviews,
140 STD Surveillance 2015Appendix: Interpreting STD Surveillance Data
standardized physical examinations, and the collection of biological samples in special mobile examination centers. In 1999, NHANES became a continuous survey with data released every 2 years. The sampling plan of the survey is a stratified, multistage, probability cluster design that selects a sample representative of the U.S. civilian, non-institutionalized population. For more information, see: https://www.cdc.gov/nchs/nhanes.htm.
A2.5 National Disease and Therapeutic Index The information on the number of initial visits to private physicians’ offices for STDs was based on analysis of data from the National Disease and Therapeutic Index (NDTI) (machine-readable files or summary statistics for 1966 through 2014; the 2015 NDTI data were not obtained in time to include them in this report). NDTI is a probability sample survey of private physicians’ clinical management practices. For more information on this database, contact IMS Health, e-mail: [email protected]; Telephone: (800) 523-5334.
1 U.S. Census Bureau. United States population estimates by age, sex and race: 1980–1988. In: Current population reports [Series P-25, No. 1045]. Washington, DC: U.S. Government Printing Office; 1990.
2 U.S. Census Bureau. United States population estimates by age, sex and race: 1989. In: Current population reports [Series P-25, No. 1057]. Washington, DC: U.S. Government Printing Office; 1990.
3 Centers for Disease Control and Prevention. Vital statistics of the United States 1988. vol.1 - natality. Hyattsville (MD): U.S. Department of Health and Human Services; 1990.
4 Office of Management and Budget. Standards for defining metropolitan and micropolitan statistical areas. Federal Register. 2000;65(249):82228-38.
5 Office of Management and Budget. Revisions to the Standards for Classification of Federal Data on Race and Ethnicity. Federal Register Notice. October 30, 1997.
6 Kaufman RE, Jones OG, Blount JH, et al. Questionnaire survey of reported early congenital syphilis: problems in diagnosis, prevention, and treatment. Sex Transm Dis. 1977;4:135-9.
7 Clinical and Laboratory Standards Institute. Performance standards for antimicrobial susceptibility testing; twenty-fifth informational supplement. M100-S25, 35(3). Wayne (PA): Clinical and Laboratory Standards Institute; 2015.
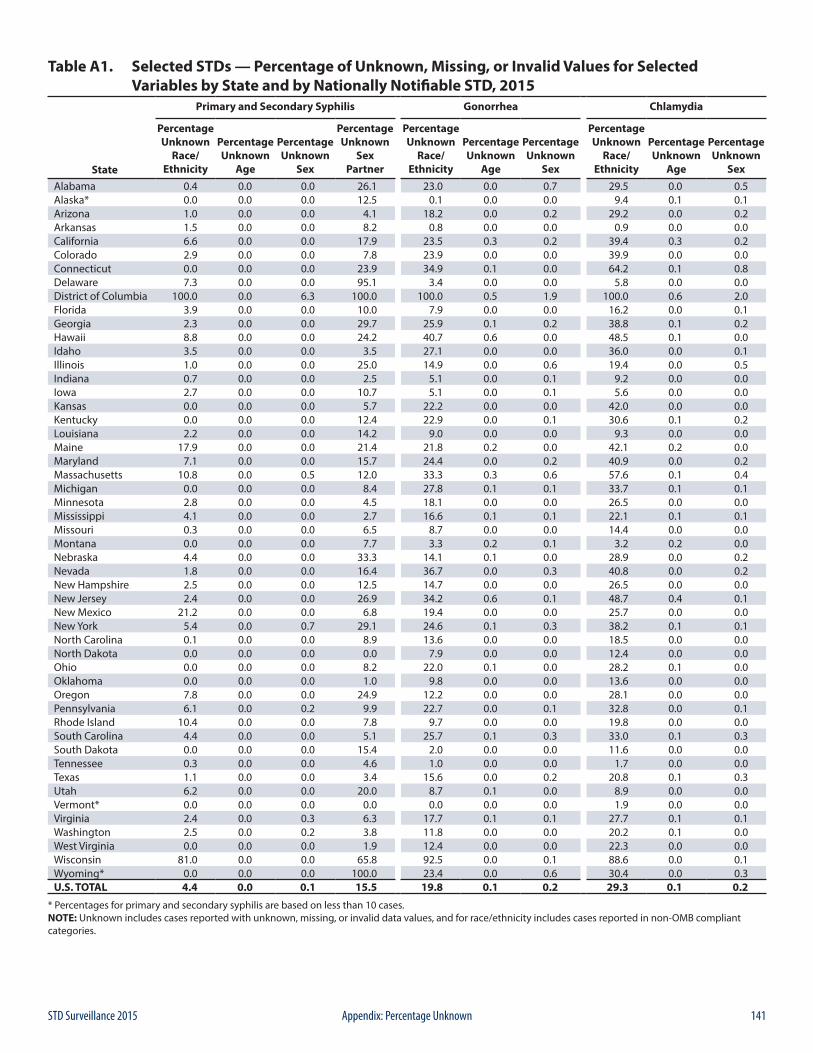
141STD Surveillance 2015 Appendix: Percentage Unknown
Table A1. Selected STDs — Percentage of Unknown, Missing, or Invalid Values for Selected Variables by State and by Nationally Notifiable STD, 2015
Primary and Secondary Syphilis Gonorrhea Chlamydia
State
PercentageUnknown
Race/Ethnicity
PercentageUnknown
Age
PercentageUnknown
Sex
PercentageUnknown
SexPartner
PercentageUnknown
Race/Ethnicity
PercentageUnknown
Age
PercentageUnknown
Sex
PercentageUnknown
Race/Ethnicity
PercentageUnknown
Age
PercentageUnknown
SexAlabama 0.4 0.0 0.0 26.1 23.0 0.0 0.7 29.5 0.0 0.5Alaska* 0.0 0.0 0.0 12.5 0.1 0.0 0.0 9.4 0.1 0.1Arizona 1.0 0.0 0.0 4.1 18.2 0.0 0.2 29.2 0.0 0.2Arkansas 1.5 0.0 0.0 8.2 0.8 0.0 0.0 0.9 0.0 0.0California 6.6 0.0 0.0 17.9 23.5 0.3 0.2 39.4 0.3 0.2Colorado 2.9 0.0 0.0 7.8 23.9 0.0 0.0 39.9 0.0 0.0Connecticut 0.0 0.0 0.0 23.9 34.9 0.1 0.0 64.2 0.1 0.8Delaware 7.3 0.0 0.0 95.1 3.4 0.0 0.0 5.8 0.0 0.0District of Columbia 100.0 0.0 6.3 100.0 100.0 0.5 1.9 100.0 0.6 2.0Florida 3.9 0.0 0.0 10.0 7.9 0.0 0.0 16.2 0.0 0.1Georgia 2.3 0.0 0.0 29.7 25.9 0.1 0.2 38.8 0.1 0.2Hawaii 8.8 0.0 0.0 24.2 40.7 0.6 0.0 48.5 0.1 0.0Idaho 3.5 0.0 0.0 3.5 27.1 0.0 0.0 36.0 0.0 0.1Illinois 1.0 0.0 0.0 25.0 14.9 0.0 0.6 19.4 0.0 0.5Indiana 0.7 0.0 0.0 2.5 5.1 0.0 0.1 9.2 0.0 0.0Iowa 2.7 0.0 0.0 10.7 5.1 0.0 0.1 5.6 0.0 0.0Kansas 0.0 0.0 0.0 5.7 22.2 0.0 0.0 42.0 0.0 0.0Kentucky 0.0 0.0 0.0 12.4 22.9 0.0 0.1 30.6 0.1 0.2Louisiana 2.2 0.0 0.0 14.2 9.0 0.0 0.0 9.3 0.0 0.0Maine 17.9 0.0 0.0 21.4 21.8 0.2 0.0 42.1 0.2 0.0Maryland 7.1 0.0 0.0 15.7 24.4 0.0 0.2 40.9 0.0 0.2Massachusetts 10.8 0.0 0.5 12.0 33.3 0.3 0.6 57.6 0.1 0.4Michigan 0.0 0.0 0.0 8.4 27.8 0.1 0.1 33.7 0.1 0.1Minnesota 2.8 0.0 0.0 4.5 18.1 0.0 0.0 26.5 0.0 0.0Mississippi 4.1 0.0 0.0 2.7 16.6 0.1 0.1 22.1 0.1 0.1Missouri 0.3 0.0 0.0 6.5 8.7 0.0 0.0 14.4 0.0 0.0Montana 0.0 0.0 0.0 7.7 3.3 0.2 0.1 3.2 0.2 0.0Nebraska 4.4 0.0 0.0 33.3 14.1 0.1 0.0 28.9 0.0 0.2Nevada 1.8 0.0 0.0 16.4 36.7 0.0 0.3 40.8 0.0 0.2New Hampshire 2.5 0.0 0.0 12.5 14.7 0.0 0.0 26.5 0.0 0.0New Jersey 2.4 0.0 0.0 26.9 34.2 0.6 0.1 48.7 0.4 0.1New Mexico 21.2 0.0 0.0 6.8 19.4 0.0 0.0 25.7 0.0 0.0New York 5.4 0.0 0.7 29.1 24.6 0.1 0.3 38.2 0.1 0.1North Carolina 0.1 0.0 0.0 8.9 13.6 0.0 0.0 18.5 0.0 0.0North Dakota 0.0 0.0 0.0 0.0 7.9 0.0 0.0 12.4 0.0 0.0Ohio 0.0 0.0 0.0 8.2 22.0 0.1 0.0 28.2 0.1 0.0Oklahoma 0.0 0.0 0.0 1.0 9.8 0.0 0.0 13.6 0.0 0.0Oregon 7.8 0.0 0.0 24.9 12.2 0.0 0.0 28.1 0.0 0.0Pennsylvania 6.1 0.0 0.2 9.9 22.7 0.0 0.1 32.8 0.0 0.1Rhode Island 10.4 0.0 0.0 7.8 9.7 0.0 0.0 19.8 0.0 0.0South Carolina 4.4 0.0 0.0 5.1 25.7 0.1 0.3 33.0 0.1 0.3South Dakota 0.0 0.0 0.0 15.4 2.0 0.0 0.0 11.6 0.0 0.0Tennessee 0.3 0.0 0.0 4.6 1.0 0.0 0.0 1.7 0.0 0.0Texas 1.1 0.0 0.0 3.4 15.6 0.0 0.2 20.8 0.1 0.3Utah 6.2 0.0 0.0 20.0 8.7 0.1 0.0 8.9 0.0 0.0Vermont* 0.0 0.0 0.0 0.0 0.0 0.0 0.0 1.9 0.0 0.0Virginia 2.4 0.0 0.3 6.3 17.7 0.1 0.1 27.7 0.1 0.1Washington 2.5 0.0 0.2 3.8 11.8 0.0 0.0 20.2 0.1 0.0West Virginia 0.0 0.0 0.0 1.9 12.4 0.0 0.0 22.3 0.0 0.0Wisconsin 81.0 0.0 0.0 65.8 92.5 0.0 0.1 88.6 0.0 0.1Wyoming* 0.0 0.0 0.0 100.0 23.4 0.0 0.6 30.4 0.0 0.3U.S. TOTAL 4.4 0.0 0.1 15.5 19.8 0.1 0.2 29.3 0.1 0.2
* Percentages for primary and secondary syphilis are based on less than 10 cases.NOTE: Unknown includes cases reported with unknown, missing, or invalid data values, and for race/ethnicity includes cases reported in non-OMB compliant categories.
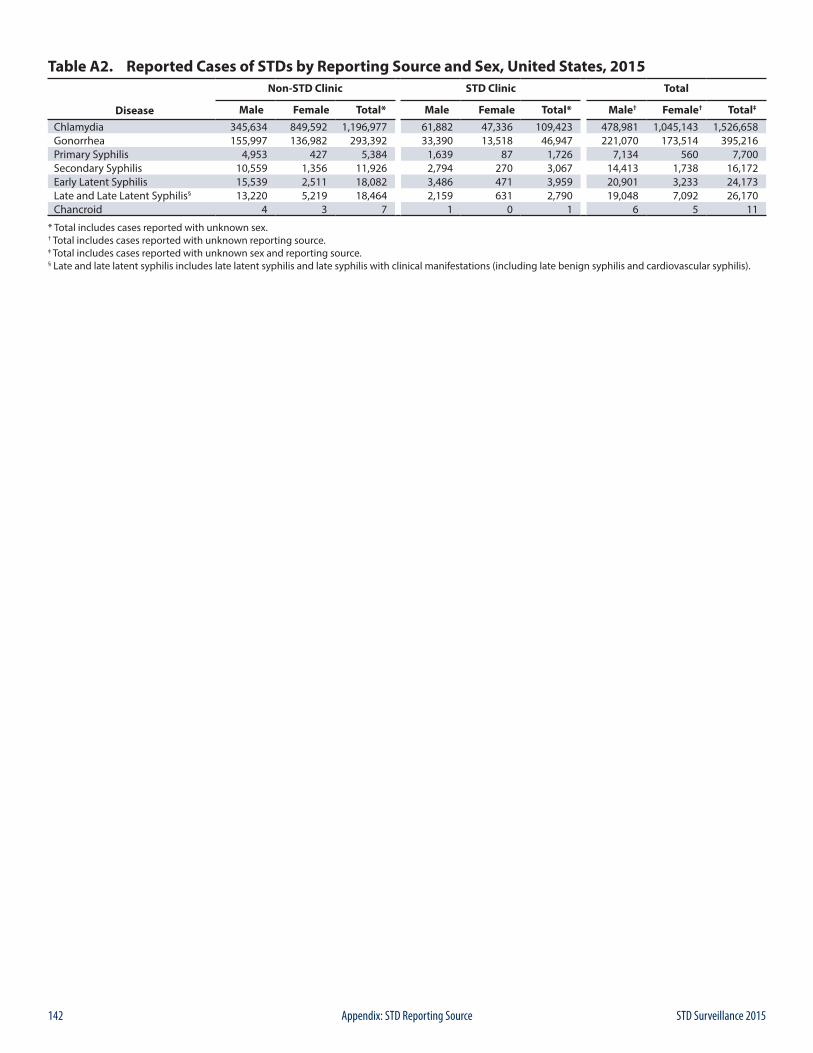
142 STD Surveillance 2015Appendix: STD Reporting Source
Table A2. Reported Cases of STDs by Reporting Source and Sex, United States, 2015Non-STD Clinic STD Clinic Total
Disease Male Female Total* Male Female Total* Male† Female† Total‡
Chlamydia 345,634 849,592 1,196,977 61,882 47,336 109,423 478,981 1,045,143 1,526,658Gonorrhea 155,997 136,982 293,392 33,390 13,518 46,947 221,070 173,514 395,216Primary Syphilis 4,953 427 5,384 1,639 87 1,726 7,134 560 7,700Secondary Syphilis 10,559 1,356 11,926 2,794 270 3,067 14,413 1,738 16,172Early Latent Syphilis 15,539 2,511 18,082 3,486 471 3,959 20,901 3,233 24,173Late and Late Latent Syphilis§ 13,220 5,219 18,464 2,159 631 2,790 19,048 7,092 26,170Chancroid 4 3 7 1 0 1 6 5 11
* Total includes cases reported with unknown sex.† Total includes cases reported with unknown reporting source.‡ Total includes cases reported with unknown sex and reporting source.§ Late and late latent syphilis includes late latent syphilis and late syphilis with clinical manifestations (including late benign syphilis and cardiovascular syphilis).
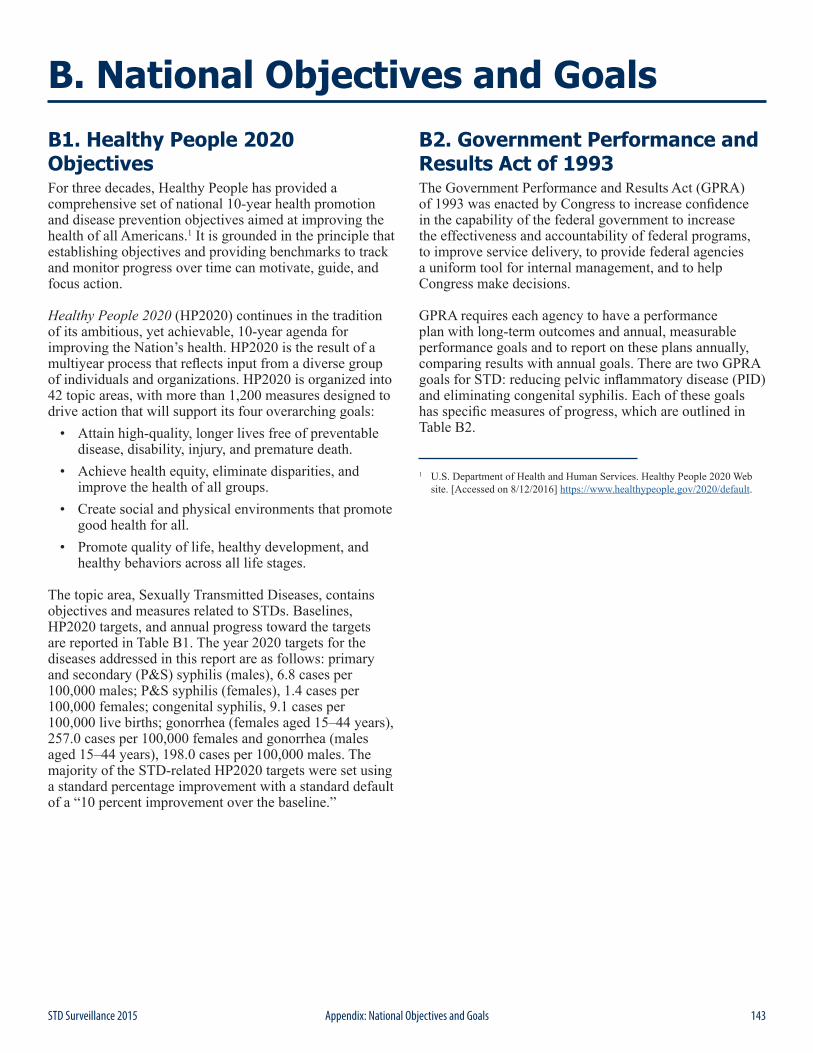
143STD Surveillance 2015 Appendix: National Objectives and Goals
B1. Healthy People 2020 ObjectivesFor three decades, Healthy People has provided a comprehensive set of national 10-year health promotion and disease prevention objectives aimed at improving the health of all Americans.1 It is grounded in the principle that establishing objectives and providing benchmarks to track and monitor progress over time can motivate, guide, and focus action.
Healthy People 2020 (HP2020) continues in the tradition of its ambitious, yet achievable, 10-year agenda for improving the Nation’s health. HP2020 is the result of a multiyear process that reflects input from a diverse group of individuals and organizations. HP2020 is organized into 42 topic areas, with more than 1,200 measures designed to drive action that will support its four overarching goals:
• Attain high-quality, longer lives free of preventable disease, disability, injury, and premature death.
• Achieve health equity, eliminate disparities, and improve the health of all groups.
• Create social and physical environments that promote good health for all.
• Promote quality of life, healthy development, and healthy behaviors across all life stages.
The topic area, Sexually Transmitted Diseases, contains objectives and measures related to STDs. Baselines, HP2020 targets, and annual progress toward the targets are reported in Table B1. The year 2020 targets for the diseases addressed in this report are as follows: primary and secondary (P&S) syphilis (males), 6.8 cases per 100,000 males; P&S syphilis (females), 1.4 cases per 100,000 females; congenital syphilis, 9.1 cases per 100,000 live births; gonorrhea (females aged 15–44 years), 257.0 cases per 100,000 females and gonorrhea (males aged 15–44 years), 198.0 cases per 100,000 males. The majority of the STD-related HP2020 targets were set using a standard percentage improvement with a standard default of a “10 percent improvement over the baseline.”
B2. Government Performance and Results Act of 1993The Government Performance and Results Act (GPRA) of 1993 was enacted by Congress to increase confidence in the capability of the federal government to increase the effectiveness and accountability of federal programs, to improve service delivery, to provide federal agencies a uniform tool for internal management, and to help Congress make decisions.
GPRA requires each agency to have a performance plan with long-term outcomes and annual, measurable performance goals and to report on these plans annually, comparing results with annual goals. There are two GPRA goals for STD: reducing pelvic inflammatory disease (PID) and eliminating congenital syphilis. Each of these goals has specific measures of progress, which are outlined in Table B2.
B. National Objectives and Goals
1 U.S. Department of Health and Human Services. Healthy People 2020 Web site. [Accessed on 8/12/2016] https://www.healthypeople.gov/2020/default.
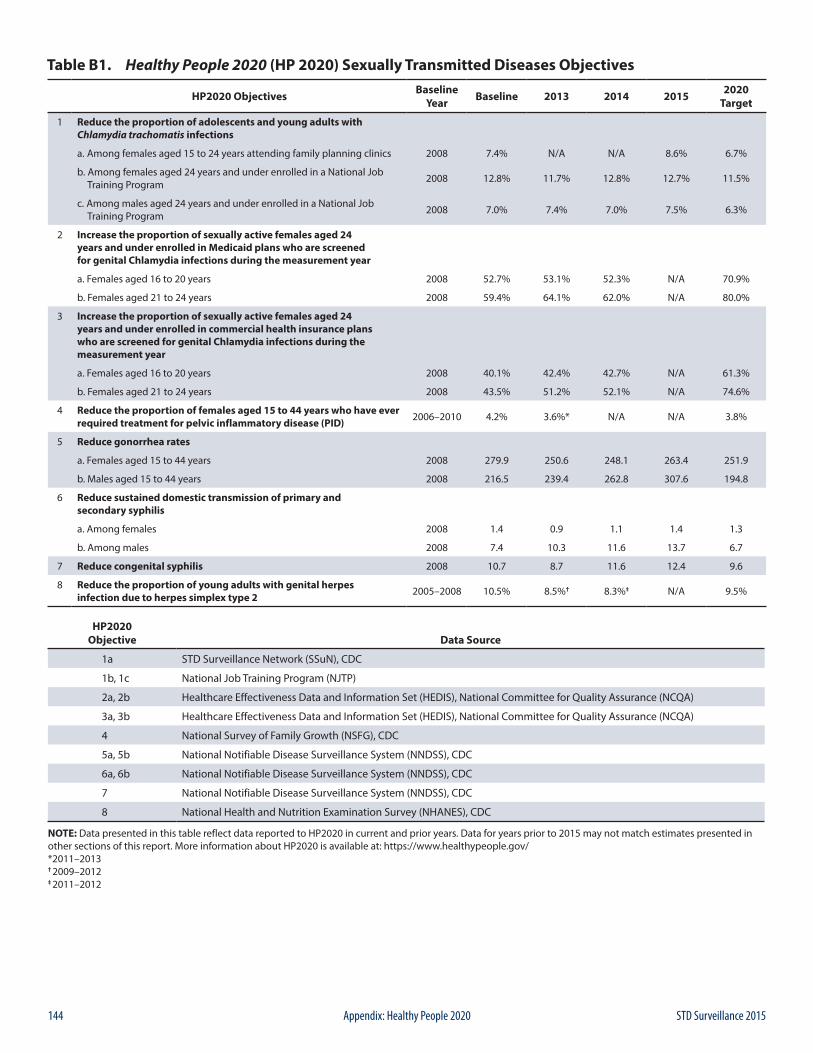
144 STD Surveillance 2015Appendix: Healthy People 2020
Table B1. Healthy People 2020 (HP 2020) Sexually Transmitted Diseases Objectives
HP2020 Objectives Baseline Year Baseline 2013 2014 2015 2020
Target
1 Reduce the proportion of adolescents and young adults with Chlamydia trachomatis infections
a. Among females aged 15 to 24 years attending family planning clinics 2008 7.4% N/A N/A 8.6% 6.7%
b. Among females aged 24 years and under enrolled in a National Job Training Program 2008 12.8% 11.7% 12.8% 12.7% 11.5%
c. Among males aged 24 years and under enrolled in a National Job Training Program 2008 7.0% 7.4% 7.0% 7.5% 6.3%
2 Increase the proportion of sexually active females aged 24 years and under enrolled in Medicaid plans who are screened for genital Chlamydia infections during the measurement year
a. Females aged 16 to 20 years 2008 52.7% 53.1% 52.3% N/A 70.9%
b. Females aged 21 to 24 years 2008 59.4% 64.1% 62.0% N/A 80.0%
3 Increase the proportion of sexually active females aged 24 years and under enrolled in commercial health insurance plans who are screened for genital Chlamydia infections during the measurement year
a. Females aged 16 to 20 years 2008 40.1% 42.4% 42.7% N/A 61.3%
b. Females aged 21 to 24 years 2008 43.5% 51.2% 52.1% N/A 74.6%
4 Reduce the proportion of females aged 15 to 44 years who have ever required treatment for pelvic inflammatory disease (PID) 2006–2010 4.2% 3.6%* N/A N/A 3.8%
5 Reduce gonorrhea rates
a. Females aged 15 to 44 years 2008 279.9 250.6 248.1 263.4 251.9
b. Males aged 15 to 44 years 2008 216.5 239.4 262.8 307.6 194.8
6 Reduce sustained domestic transmission of primary and secondary syphilis
a. Among females 2008 1.4 0.9 1.1 1.4 1.3
b. Among males 2008 7.4 10.3 11.6 13.7 6.7
7 Reduce congenital syphilis 2008 10.7 8.7 11.6 12.4 9.6
8 Reduce the proportion of young adults with genital herpes infection due to herpes simplex type 2 2005–2008 10.5% 8.5%† 8.3%‡ N/A 9.5%
HP2020 Objective Data Source
1a STD Surveillance Network (SSuN), CDC
1b, 1c National Job Training Program (NJTP)
2a, 2b Healthcare Effectiveness Data and Information Set (HEDIS), National Committee for Quality Assurance (NCQA)
3a, 3b Healthcare Effectiveness Data and Information Set (HEDIS), National Committee for Quality Assurance (NCQA)
4 National Survey of Family Growth (NSFG), CDC
5a, 5b National Notifiable Disease Surveillance System (NNDSS), CDC
6a, 6b National Notifiable Disease Surveillance System (NNDSS), CDC
7 National Notifiable Disease Surveillance System (NNDSS), CDC
8 National Health and Nutrition Examination Survey (NHANES), CDC
NOTE: Data presented in this table reflect data reported to HP2020 in current and prior years. Data for years prior to 2015 may not match estimates presented in other sections of this report. More information about HP2020 is available at: https://www.healthypeople.gov/ *2011–2013† 2009–2012‡ 2011–2012
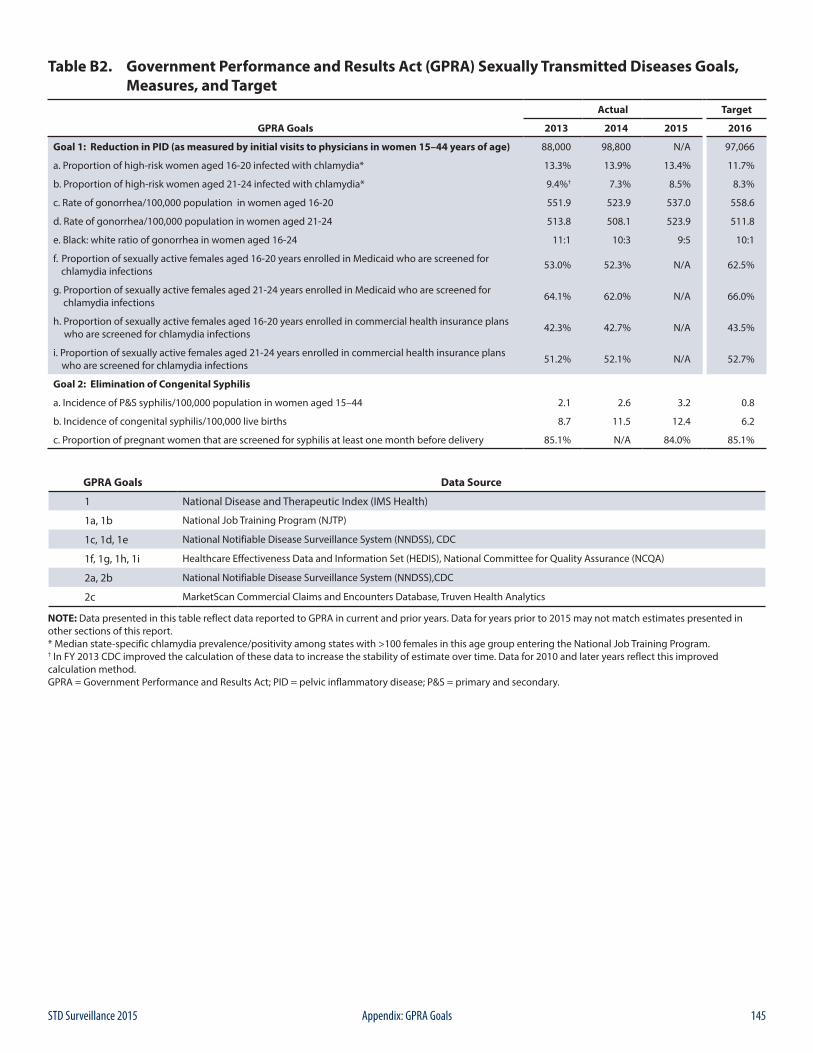
145STD Surveillance 2015 Appendix: GPRA Goals
Table B2. Government Performance and Results Act (GPRA) Sexually Transmitted Diseases Goals, Measures, and Target
GPRA Goals
Actual Target
2013 2014 2015 2016
Goal 1: Reduction in PID (as measured by initial visits to physicians in women 15–44 years of age) 88,000 98,800 N/A 97,066
a. Proportion of high-risk women aged 16-20 infected with chlamydia* 13.3% 13.9% 13.4% 11.7%
b. Proportion of high-risk women aged 21-24 infected with chlamydia* 9.4%† 7.3% 8.5% 8.3%
c. Rate of gonorrhea/100,000 population in women aged 16-20 551.9 523.9 537.0 558.6
d. Rate of gonorrhea/100,000 population in women aged 21-24 513.8 508.1 523.9 511.8
e. Black: white ratio of gonorrhea in women aged 16-24 11:1 10:3 9:5 10:1
f. Proportion of sexually active females aged 16-20 years enrolled in Medicaid who are screened for chlamydia infections 53.0% 52.3% N/A 62.5%
g. Proportion of sexually active females aged 21-24 years enrolled in Medicaid who are screened for chlamydia infections 64.1% 62.0% N/A 66.0%
h. Proportion of sexually active females aged 16-20 years enrolled in commercial health insurance plans who are screened for chlamydia infections 42.3% 42.7% N/A 43.5%
i. Proportion of sexually active females aged 21-24 years enrolled in commercial health insurance plans who are screened for chlamydia infections 51.2% 52.1% N/A 52.7%
Goal 2: Elimination of Congenital Syphilis
a. Incidence of P&S syphilis/100,000 population in women aged 15–44 2.1 2.6 3.2 0.8
b. Incidence of congenital syphilis/100,000 live births 8.7 11.5 12.4 6.2
c. Proportion of pregnant women that are screened for syphilis at least one month before delivery 85.1% N/A 84.0% 85.1%
GPRA Goals Data Source
1 National Disease and Therapeutic Index (IMS Health)
1a, 1b National Job Training Program (NJTP)
1c, 1d, 1e National Notifiable Disease Surveillance System (NNDSS), CDC
1f, 1g, 1h, 1i Healthcare Effectiveness Data and Information Set (HEDIS), National Committee for Quality Assurance (NCQA)
2a, 2b National Notifiable Disease Surveillance System (NNDSS),CDC
2c MarketScan Commercial Claims and Encounters Database, Truven Health Analytics
NOTE: Data presented in this table reflect data reported to GPRA in current and prior years. Data for years prior to 2015 may not match estimates presented in other sections of this report. * Median state-specific chlamydia prevalence/positivity among states with >100 females in this age group entering the National Job Training Program. † In FY 2013 CDC improved the calculation of these data to increase the stability of estimate over time. Data for 2010 and later years reflect this improved calculation method.GPRA = Government Performance and Results Act; PID = pelvic inflammatory disease; P&S = primary and secondary.
146 STD Surveillance 2015Appendix: STD Surveillance Case Definitions
C1. CASE DEFINITIONS FOR NATIONALLY NOTIFIABLE INFECTIOUS DISEASESThe Council of State and Territorial Epidemiologists (CSTE) recommends that state health departments report cases of selected diseases to CDC’s National Notifiable Diseases Surveillance System (NNDSS). Case definitions are periodically revised using CSTE’s Position Statements and provide uniform criteria of nationally notifiable conditions for reporting purposes. The most current surveillance case definitions for nationally notifiable STDs are listed below. Please see the NNDSS website (https://wwwn.cdc.gov/nndss/case-definitions.html) for historical case definitions.
C1.1 Chancroid (Revised 9/96)
Clinical descriptionA sexually transmitted disease characterized by painful genital ulceration and inflammatory inguinal adenopathy. The disease is caused by infection with Haemophilus ducreyi.
Laboratory criteria for diagnosis
• Isolation of H. ducreyi from a clinical specimen
Case classificationProbable: a clinically compatible case with both a) no evidence of Treponema pallidum infection by darkfield microscopic examination of ulcer exudate or by a serologic test for syphilis performed ≥7 days after onset of ulcers and b) either a clinical presentation of the ulcer(s) not typical of disease caused by herpes simplex virus (HSV) or a culture negative for HSV.
Confirmed: a clinically compatible case that is laboratory confirmed.
C1.2 Chlamydia trachomatis Infection (Revised 6/09)
Clinical descriptionInfection with Chlamydia trachomatis may result in urethritis, epididymitis, cervicitis, acute salpingitis, or other syndromes when sexually transmitted; however, the infection is often asymptomatic in women. Perinatal infections may result in inclusion conjunctivitis and pneumonia in newborns. Other syndromes caused by C. trachomatis include lymphogranuloma venereum (see Lymphogranuloma Venereum) and trachoma.
Laboratory criteria for diagnosis
• Isolation of C. trachomatis by culture or• Demonstration of C. trachomatis in a clinical specimen by detection of antigen or nucleic acid
Case classificationConfirmed: a case that is laboratory confirmed.
C. STD Surveillance Case Definitions
147STD Surveillance 2015 Appendix: STD Surveillance Case Definitions
C1.3 Gonorrhea (Effective 1/14)
Clinical descriptionA sexually transmitted infection commonly manifested by urethritis, cervicitis, proctitis, salpingitis, or pharyngitis. Infection may be asymptomatic.
Laboratory criteria for diagnosis
• Observation of gram-negative intracellular diplococci in a urethral smear obtained from a male or an endocervical smear obtained from a female, or
• Isolation of typical gram-negative, oxidase-positive diplococci by culture (presumptive Neisseria gonorrhoeae) from a clinical specimen, or
• Demonstration of N. gonorrhoeae in a clinical specimen by detection of antigen or nucleic acid
Case classificationProbable: demonstration of gram-negative intracellular diplococci in a urethral smear obtained from a male or an endocervical smear obtained from a female.
Confirmed: a person with laboratory isolation of typical gram-negative, oxidase-positive diplococci by culture (presumptive Neisseria gonorrhoeae) from a clinical specimen, or demonstration of N. gonorrhoeae in a clinical specimen by detection of antigen or detection of nucleic acid via nucleic acid amplification (e.g., PCR) or hybridization with a nucleic acid probe.
C1.4 Syphilis (Effective 1/14)Syphilis is a complex sexually transmitted disease that has a highly variable clinical course. Adherence to the following surveillance case definitions will facilitate understanding the epidemiology of this disease across the U.S.
Syphilis, primary (Effective 1/14)
Clinical descriptionA stage of infection with Treponema pallidum characterized by one or more ulcerative lesions (e.g. chancre), which might differ considerably in clinical appearance.
Laboratory criteria for diagnosisDemonstration of T. pallidum in clinical specimens by darkfield microscopy, or by polymerase chain reaction (PCR) or equivalent direct molecular methods.
Case classificationProbable: a case that meets the clinical description of primary syphilis with a reactive serologic test (nontreponemal: Venereal Disease Research Laboratory [VDRL], rapid plasma reagin [RPR], or equivalent serologic methods; treponemal: fluorescent treponemal antibody absorbed [FTA-ABS], T. pallidum particle agglutination [TP-PA], enzyme immunoassay [EIA], chemiluminescence immunoassay [CIA], or equivalent serologic methods). These treponemal tests supersede older testing technologies, including microhemagglutination assay for antibody to T. pallidum [MHA-TP].
Confirmed: a case that meets the clinical description of primary syphilis that is laboratory confirmed.
148 STD Surveillance 2015Appendix: STD Surveillance Case Definitions
Syphilis, secondary (Effective 1/14)
Clinical descriptionA stage of infection caused by T. pallidum characterized by localized or diffuse mucocutaneous lesions (e.g., rash – such as non-pruritic macular, maculopapular, popular, or pustular lesions), often with generalized lymphadenopathy. Other symptoms can include mucous patches, condyloma lata, and alopecia. The primary ulcerative lesion may still be present. Because of the wide array of symptoms possibly indicating secondary syphilis, serologic tests for syphilis and a thorough sexual history and physical examination are crucial to determining if a case should be classified as secondary syphilis.
Laboratory criteria for diagnosisDemonstration of T. pallidum in clinical specimens by darkfield microscopy, or by polymerase chain reaction (PCR) or equivalent direct molecular methods.
Case classificationProbable: a case that meets the clinical description of secondary syphilis with a nontreponemal (VDRL, RPR, or equivalent serologic methods) titer ≥4 and a reactive treponemal test (FTA-ABS, TP-PA, EIA, CIA, or equivalent serologic methods).
Confirmed: a case that meets the clinical description of secondary syphilis (with at least one sign or symptom) that is laboratory confirmed.
Syphilis, early latent (Effective 1/14)
Clinical descriptionA subcategory of latent syphilis (a stage of infection caused by T. pallidum in which organisms persist in the body of the infected person without causing symptoms or signs) when initial infection has occurred within the previous 12 months.
Case classificationProbable: A person with no clinical signs or symptoms of syphilis who has one of the following:
• No past diagnosis of syphilis, and a reactive nontreponemal test (e.g., VDRL, RPR, or equivalent serologic methods), and a reactive treponemal test (e.g., FTA-ABS, TP-PA, EIA, CIA, or equivalent serologic methods), or
• A current nontreponemal test titer demonstrating fourfold or greater increase from the last nontreponemal test titer
AND evidence of having acquired the infection within the previous 12 months based on one or more of the following criteria:
• Documented seroconversion or fourfold or greater increase in titer of a nontreponemal test during the previous 12 months
• Documented seroconversion of a treponemal test during the previous 12 months• A history of symptoms consistent with primary or secondary syphilis during the previous 12 months• A history of sexual exposure to a partner within the previous 12 months who had primary, secondary, or early latent
syphilis (documented independently as duration <12 months)• Only sexual contact was within the last 12 months (sexual debut).
There is no confirmed case classification for early latent syphilis.
Syphilis, late latent (Effective 1/14)
Clinical descriptionA subcategory of latent syphilis (a stage of infection caused by T. pallidum in which organisms persist in the body of the infected person without causing symptoms or signs) when initial infection has occurred >12 months previously.
149STD Surveillance 2015 Appendix: STD Surveillance Case Definitions
Case classificationProbable: a person with no clinical signs or symptoms of syphilis who has one of the following:
• No past diagnosis of syphilis, and a reactive nontreponemal test (e.g., VDRL, RPR, or equivalent serologic methods), and a reactive treponemal test (e.g., FTA-ABS, TP-PA, EIA, CIA, or equivalent serologic methods), or
• A past history of syphilis therapy and a current nontreponemal test titer demonstrating fourfold or greater increase from the last nontreponemal test titer.
AND who has no evidence of having acquired the disease within the preceding 12 months (see Syphilis, early latent).
There is no confirmed case classification for late latent syphilis.
Neurosyphilis (Effective 1/14)
Neurosyphilis can occur at any stage of syphilis. If the patient has neurologic manifestations of syphilis, the case should be reported with the appropriate stage of infection (as if neurologic manifestations were not present) and neurologic manifestations should be noted in the case report data. If no other stage is appropriate, the case should be staged as “late, with clinical manifestations”.
Neurosyphilis can apply to all stages of infection of syphilis listed, including: primary syphilis, secondary syphilis, early latent syphilis, late latent syphilis, and late syphilis with clinical manifestations.
Clinical descriptionInfection of the central nervous system with T. pallidum, as evidenced by manifestations including syphilitic meningitis, meningovascular syphilis, optical involvement including interstitial keratitis and uveitis, general paresis, including dementia, and tabes dorsalis.
Laboratory criteria for diagnosis
• A reactive VDRL in cerebrospinal fluid (CSF) and either (1) a reactive treponemal serologic test for syphilis (e.g., FTA- ABS, TP-PA, EIA, CIA, or equivalent serologic methods) or (2) a reactive nontreponemal serologic test for syphilis (VDRL, RPR, or equivalent serologic method).
Case classificationProbable: syphilis of any stage with a negative VDRL test in CSF specimen and either (1) a reactive treponemal serologic test for syphilis (e.g., FTA-ABS, TP-PA, EIA, CIA, or equivalent serologic methods) or (2) a reactive non-treponemal serologic test for syphilis (VDRL, RPR, or equivalent serologic method), and both of the following:
• Elevated CSF protein (>50 mg/dL2) or leukocyte count (>5 white blood cells/cubic millimeter CSF) in the absence of other known causes of these abnormalities, and
• Clinical symptoms or signs consistent with neurosyphilis without other known causes for these clinical abnormalities.
Confirmed: syphilis of any stage that meets the laboratory criteria for neurosyphilis.
Syphilis, late with clinical manifestations (including late benign syphilis and cardiovascular syphilis) (Effective 1/14)
Clinical descriptionClinical manifestations of late syphilis may include inflammatory lesions of the cardiovascular system (e.g., aortitis, coronary vessel disease), skin (e.g., gummatous lesions) bone (e.g., osteitis) or other tissue. Rarely, other structures (e.g., the upper and lower respiratory tracts, mouth, eye, abdominal organs, reproductive organs, lymph nodes, and skeletal muscle) may be involved. Late syphilis usually becomes clinically manifest only after a period of 15–30 years of untreated infection. If only neurologic manifestations of syphilis (e.g., tabes dorsalis, dementia) are present and infection occurred more than 12 months ago, the case should be reported as “late syphilis”.
150 STD Surveillance 2015Appendix: STD Surveillance Case Definitions
Laboratory criteria for diagnosisDemonstration of T. pallidum in late lesions by special stains (although organisms are rarely visualized in late lesions), or equivalent methods, or by polymerase chain reaction (PCR) or equivalent direct molecular methods.
Case classificationProbable: characteristic abnormalities or lesions of the cardiovascular system (e.g., aortitis, coronary vessel disease), skin (e.g., gummatous lesions), bone (e.g., osteitis), or other tissue and a reactive treponemal test (e.g., FTA-ABS, TP-PA, EIA, CIA, or equivalent serologic methods), in the absence of other known causes of these abnormalities. CSF abnormalities and clinical symptoms or signs consistent with neurologic manifestations of syphilis might be present.
Confirmed: a case that meets the clinical description of late syphilis that is laboratory confirmed.
Syphilis, Congenital (Revised 1/15)
Clinical descriptionA condition caused by infection in utero with Treponema pallidum. A wide spectrum of severity exists, from inapparent infection to severe cases that are clinically apparent at birth. An infant or child (aged less than 2 years) may have signs such as hepatosplenomegaly, rash, condyloma lata, snuffles, jaundice (nonviral hepatitis), pseudoparalysis, anemia, or edema (nephrotic syndrome and/or malnutrition). An older child may have stigmata (e.g., interstitial keratitis, nerve deafness, anterior bowing of shins, frontal bossing, mulberry molars, Hutchinson teeth, saddle nose, rhagades, or Clutton joints).
Laboratory criteria for diagnosis• Demonstration of T. pallidum by darkfield microscopy of lesions, body fluids, or neonatal nasal discharge, or• Polymerase chain reaction (PCR) or other equivalent direct molecular methods of lesions, placenta, umbilical cord,
or autopsy material, or• Immunohistochemistry (IHC), or special stains (e.g., silver staining) of specimens from lesions, neonatal nasal
discharge, placenta, umbilical cord, or autopsy material.
Case classificationProbable: a condition affecting an infant whose mother had untreated or inadequately treated* syphilis at delivery, regardless of signs in the infant, or an infant or child who has a reactive non-treponemal test for syphilis (Venereal Disease Research Laboratory [VDRL], rapid plasma reagin [RPR], or equivalent serologic methods) AND any one of the following:
• Any evidence of congenital syphilis on physical examination (see Clinical description)• Any evidence of congenital syphilis on radiographs of long bones• A reactive cerebrospinal fluid (CSF) venereal disease research laboratory (VDRL) test• In a nontraumatic lumbar puncture, an elevated CSF leukocyte (white blood cell, WBC) count or protein (without
other cause):Suggested parameters for abnormal CSF WBC and protein values:• During the first 30 days of life, a CSF WBC count of >15 WBC/mm3 or a CSF protein >120 mg/dL.• After the first 30 days of life, a CSF WBC count of >5 WBC mm3 or a CSF protein >40 mg/dL, regardless of
CSF serology.• The treating clinician should be consulted to interpret the CSF values for the specific patient.
Confirmed: a case that is laboratory confirmed.
* Adequate treatment is defined as completion of a penicillin-based regimen, in accordance with CDC treatment guidelines, appropriate for stage of infection, initiated 30 or more days before delivery.
151STD Surveillance 2015 Appendix: STD Surveillance Case Definitions
Syphilitic Stillbirth
Clinical case definitionA fetal death that occurs after a 20-week gestation or in which the fetus weighs greater than 500 g and the mother had untreated or inadequately treated* syphilis at delivery.
CommentCongenital and acquired syphilis may be difficult to distinguish when a child is seropositive after infancy. Signs of congenital syphilis may not be obvious, and stigmata may not yet have developed. Abnormal values for CSF VDRL, WBC cell count, and protein may be found in either congenital or acquired syphilis. Findings on radiographs of long bones may help because radiographic changes in the metaphysis and epiphysis are considered classic signs of congenitally acquired syphilis. While maternal antibodies can complicate interpretation of serologic tests in an infant, reactive tests past 18 months of age are considered to reflect the status of the child. The decision may ultimately be based on maternal history and clinical judgment. In a young child, the possibility of sexual abuse should be considered as a cause of acquired rather than congenital syphilis, depending on the clinical picture. For reporting purposes, congenital syphilis includes cases of congenitally acquired syphilis among infants and children as well as syphilitic stillbirths.
* Adequate treatment is defined as completion of a penicillin-based regimen, in accordance with CDC treatment guidelines, appropriate for stage of infection, initiated 30 or more days before delivery.
C2. CASE DEFINITIONS FOR NON-NOTIFIABLE INFECTIOUS DISEASESAlthough the conditions below are not currently nationally notifiable, they may be reportable in some jurisdictions. To provide uniform criteria for those jurisdictions, case definitions are provided by CSTE. Case definitions are periodically revised. The most current surveillance case definitions for non-notifiable STDs are listed below. Please see the NNDSS website (https://wwwn.cdc.gov/nndss/case-definitions.html) for historical case definitions.
C2.1 Genital Herpes (Herpes Simplex Virus) (Revised 9/96)
Clinical descriptionA condition characterized by visible, painful genital or anal lesions.
Laboratory criteria for diagnosis• Isolation of herpes simplex virus from cervix, urethra, or anogenital lesion, or• Demonstration of virus by antigen detection technique in clinical specimens from cervix, urethra, or anogenital
lesion, or• Demonstration of multinucleated giant cells on a Tzanck smear of scrapings from an anogenital lesion.
Case classificationProbable: a clinically compatible case (in which primary and secondary syphilis have been excluded by appropriate serologic tests and darkfield microscopy, when available) with either a diagnosis of genital herpes based on clinical presentation (without laboratory confirmation) or a history of one or more previous episodes of similar genital lesions.
Confirmed: a clinically compatible case that is laboratory confirmed.
CommentGenital herpes should be reported only once per patient. The first diagnosis for a patient with no previous diagnosis should be reported.
152 STD Surveillance 2015Appendix: STD Surveillance Case Definitions
C2.2 Genital Warts (Revised 9/96)
Clinical descriptionAn infection characterized by the presence of visible, exophytic (raised) growths on the internal or external genitalia, perineum, or perianal region.
Laboratory criteria for diagnosis• Histopathologic changes characteristic of human papillomavirus infection in specimens obtained by biopsy or
exfoliative cytology or• Demonstration of virus by antigen or nucleic acid detection in a lesion biopsy.
Case classificationProbable: a clinically compatible case without histopathologic diagnosis and without microscopic or serologic evidence that the growth is the result of secondary syphilis.
Confirmed: a clinically compatible case that is laboratory confirmed.
CommentGenital warts should be reported only once per patient. The first diagnosis for a patient with no previous diagnosis should be reported.
C2.3 Granuloma Inguinale
Clinical descriptionA slowly progressive ulcerative disease of the skin and lymphatics of the genital and perianal area caused by infection with Calymmatobacterium granulomatis. A clinically compatible case would have one or more painless or minimally painful granulomatous lesions in the anogenital area.
Laboratory criteria for diagnosisDemonstration of intracytoplasmic Donovan bodies in Wright or Giemsa-stained smears or biopsies of granulation tissue.
Case classificationConfirmed: a clinically compatible case that is laboratory confirmed.
C2.4 Lymphogranuloma Venereum
Clinical descriptionInfection with L1, L2, or, L3 serovars of Chlamydia trachomatis may result in a disease characterized by genital lesions, suppurative regional lymphadenopathy, or hemorrhagic proctitis. The infection is usually sexually transmitted.
Laboratory criteria for diagnosisIsolation of C. trachomatis, serotype L1, L2, or L3 from clinical specimen, or
• Demonstration by immunofluorescence of inclusion bodies in leukocytes of an inguinal lymph node (bubo) aspirate, or
• Positive microimmunofluorescent serologic test for a lymphogranuloma venereum strain of C. trachomatis.
153STD Surveillance 2015 Appendix: STD Surveillance Case Definitions
Case classificationProbable: a clinically compatible case with one or more tender fluctuant inguinal lymph nodes or characteristic proctogenital lesions with supportive laboratory findings of a single C. trachomatis complement fixation titer of >64.
Confirmed: a clinically compatible case that is laboratory confirmed.
C2.5 Mucopurulent Cervicitis (Revised 9/96)
Clinical descriptionCervical inflammation that is not the result of infection with Neisseria gonorrhoeae or Trichomonas vaginalis. Cervical inflammation is defined by the presence of one of the following criteria:• Mucopurulent secretion (from the endocervix) that is yellow or green when viewed on a white, cotton-tipped swab
(positive swab test)• Induced endocervical bleeding (bleeding when the first swab is placed in the endocervix).
Laboratory criteria for diagnosisNo evidence of N. gonorrhoeae by culture, Gram stain, or antigen or nucleic acid detection, and no evidence of T. vaginalis on wet mount.
Case classificationConfirmed: a clinically compatible case in a female who does not have either gonorrhea or trichomoniasis.
CommentMucopurulent cervicitis (MPC) is a clinical diagnosis of exclusion. The syndrome may result from infection with any of several agents (see Chlamydia trachomatis). If gonorrhea, trichomoniasis, and chlamydia are excluded, a clinically compatible illness should be classified as MPC. An illness in a female that meets the case definition of MPC and C. trachomatis infection should be classified as chlamydia.
C2.6 Nongonococcal Urethritis (Revised 9/96)
Clinical descriptionUrethral inflammation that is not the result of infection with Neisseria gonorrhoeae. Urethral inflammation may be diagnosed by the presence of one of the following criteria:
• A visible abnormal urethral discharge, or• A positive leukocyte esterase test from a male aged <60 years who does not have a history of kidney disease or
bladder infection, prostate enlargement, urogenital anatomic anomaly, or recent urinary tract instrumentation, or• Microscopic evidence of urethritis (≥5 white blood cells per high-power field) on a Gram stain of a urethral smear.
Laboratory criteria for diagnosisNo evidence of N. gonorrhoeae infection by culture, Gram stain, or antigen or nucleic acid detection.
Case classificationConfirmed: a clinically compatible case in a male in whom gonorrhea is not found, either by culture, Gram stain, or antigen or nucleic acid detection.
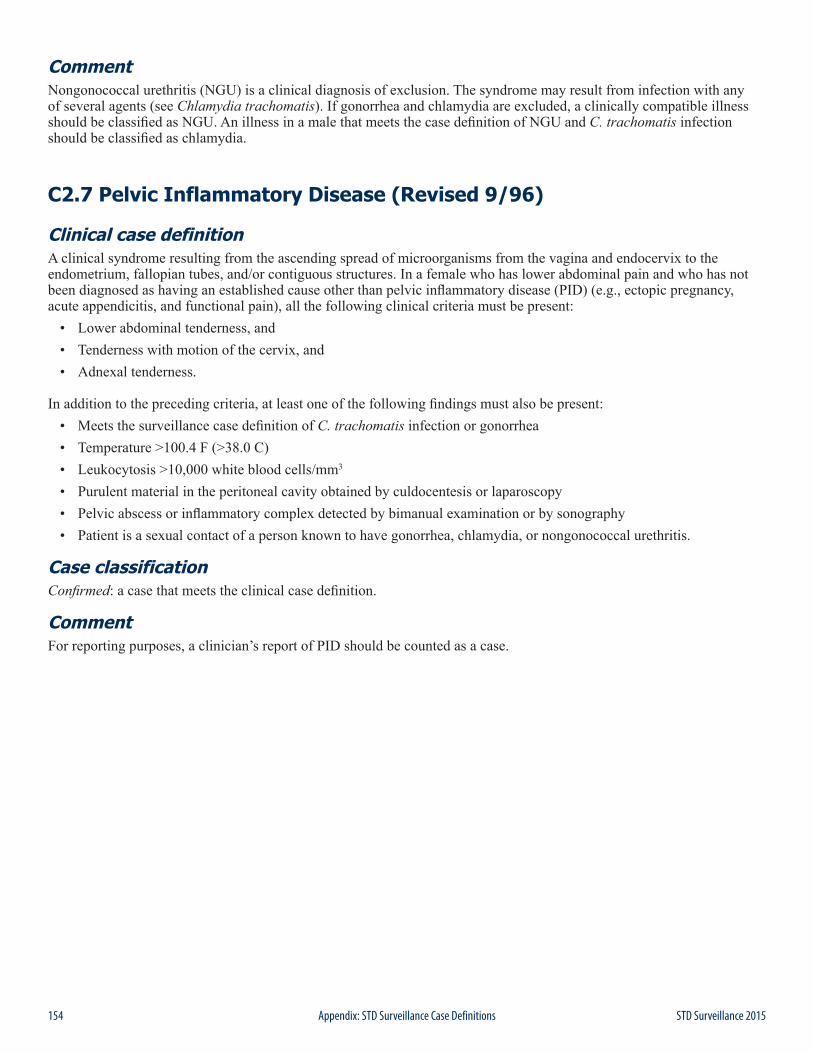
154 STD Surveillance 2015Appendix: STD Surveillance Case Definitions
CommentNongonococcal urethritis (NGU) is a clinical diagnosis of exclusion. The syndrome may result from infection with any of several agents (see Chlamydia trachomatis). If gonorrhea and chlamydia are excluded, a clinically compatible illness should be classified as NGU. An illness in a male that meets the case definition of NGU and C. trachomatis infection should be classified as chlamydia.
C2.7 Pelvic Inflammatory Disease (Revised 9/96)
Clinical case definitionA clinical syndrome resulting from the ascending spread of microorganisms from the vagina and endocervix to the endometrium, fallopian tubes, and/or contiguous structures. In a female who has lower abdominal pain and who has not been diagnosed as having an established cause other than pelvic inflammatory disease (PID) (e.g., ectopic pregnancy, acute appendicitis, and functional pain), all the following clinical criteria must be present:
• Lower abdominal tenderness, and• Tenderness with motion of the cervix, and• Adnexal tenderness.
In addition to the preceding criteria, at least one of the following findings must also be present:• Meets the surveillance case definition of C. trachomatis infection or gonorrhea• Temperature >100.4 F (>38.0 C)• Leukocytosis >10,000 white blood cells/mm3
• Purulent material in the peritoneal cavity obtained by culdocentesis or laparoscopy• Pelvic abscess or inflammatory complex detected by bimanual examination or by sonography• Patient is a sexual contact of a person known to have gonorrhea, chlamydia, or nongonococcal urethritis.
Case classificationConfirmed: a case that meets the clinical case definition.
CommentFor reporting purposes, a clinician’s report of PID should be counted as a case.
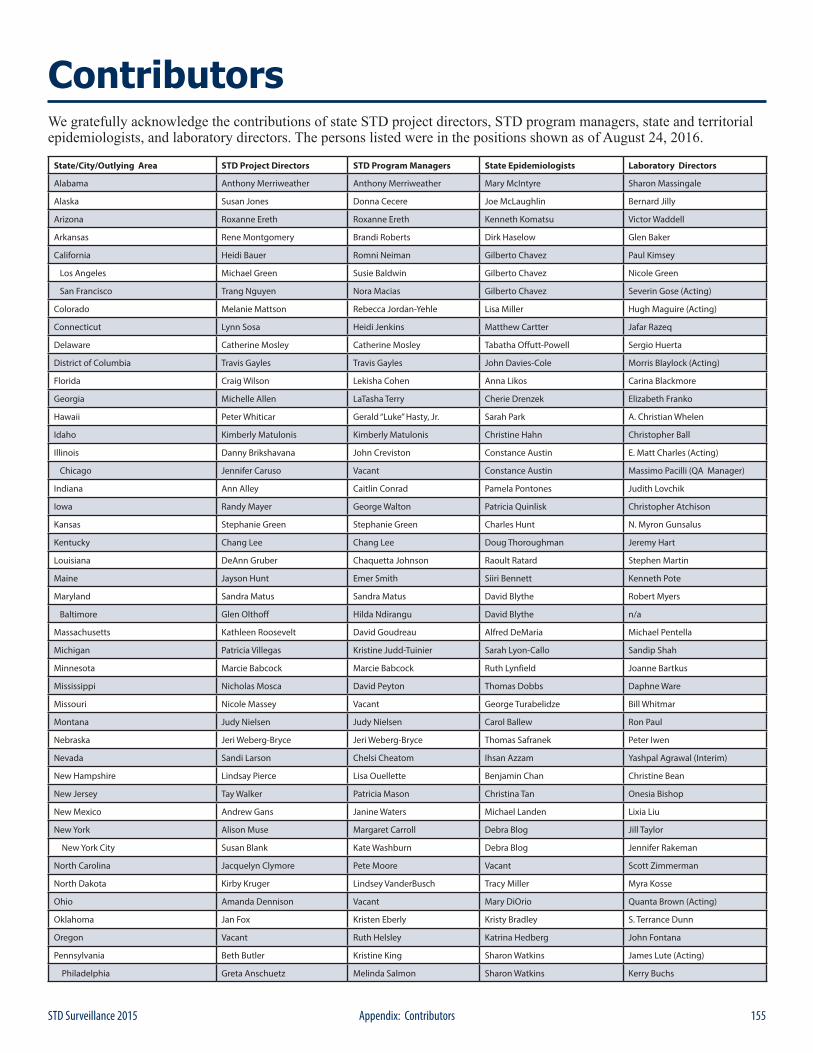
155STD Surveillance 2015 Appendix: Contributors
ContributorsWe gratefully acknowledge the contributions of state STD project directors, STD program managers, state and territorial epidemiologists, and laboratory directors. The persons listed were in the positions shown as of August 24, 2016.
State/City/Outlying Area STD Project Directors STD Program Managers State Epidemiologists Laboratory Directors
Alabama Anthony Merriweather Anthony Merriweather Mary McIntyre Sharon Massingale
Alaska Susan Jones Donna Cecere Joe McLaughlin Bernard Jilly
Arizona Roxanne Ereth Roxanne Ereth Kenneth Komatsu Victor Waddell
Arkansas Rene Montgomery Brandi Roberts Dirk Haselow Glen Baker
California Heidi Bauer Romni Neiman Gilberto Chavez Paul Kimsey
Los Angeles Michael Green Susie Baldwin Gilberto Chavez Nicole Green
San Francisco Trang Nguyen Nora Macias Gilberto Chavez Severin Gose (Acting)
Colorado Melanie Mattson Rebecca Jordan-Yehle Lisa Miller Hugh Maguire (Acting)
Connecticut Lynn Sosa Heidi Jenkins Matthew Cartter Jafar Razeq
Delaware Catherine Mosley Catherine Mosley Tabatha Offutt-Powell Sergio Huerta
District of Columbia Travis Gayles Travis Gayles John Davies-Cole Morris Blaylock (Acting)
Florida Craig Wilson Lekisha Cohen Anna Likos Carina Blackmore
Georgia Michelle Allen LaTasha Terry Cherie Drenzek Elizabeth Franko
Hawaii Peter Whiticar Gerald “Luke” Hasty, Jr. Sarah Park A. Christian Whelen
Idaho Kimberly Matulonis Kimberly Matulonis Christine Hahn Christopher Ball
Illinois Danny Brikshavana John Creviston Constance Austin E. Matt Charles (Acting)
Chicago Jennifer Caruso Vacant Constance Austin Massimo Pacilli (QA Manager)
Indiana Ann Alley Caitlin Conrad Pamela Pontones Judith Lovchik
Iowa Randy Mayer George Walton Patricia Quinlisk Christopher Atchison
Kansas Stephanie Green Stephanie Green Charles Hunt N. Myron Gunsalus
Kentucky Chang Lee Chang Lee Doug Thoroughman Jeremy Hart
Louisiana DeAnn Gruber Chaquetta Johnson Raoult Ratard Stephen Martin
Maine Jayson Hunt Emer Smith Siiri Bennett Kenneth Pote
Maryland Sandra Matus Sandra Matus David Blythe Robert Myers
Baltimore Glen Olthoff Hilda Ndirangu David Blythe n/a
Massachusetts Kathleen Roosevelt David Goudreau Alfred DeMaria Michael Pentella
Michigan Patricia Villegas Kristine Judd-Tuinier Sarah Lyon-Callo Sandip Shah
Minnesota Marcie Babcock Marcie Babcock Ruth Lynfield Joanne Bartkus
Mississippi Nicholas Mosca David Peyton Thomas Dobbs Daphne Ware
Missouri Nicole Massey Vacant George Turabelidze Bill Whitmar
Montana Judy Nielsen Judy Nielsen Carol Ballew Ron Paul
Nebraska Jeri Weberg-Bryce Jeri Weberg-Bryce Thomas Safranek Peter Iwen
Nevada Sandi Larson Chelsi Cheatom Ihsan Azzam Yashpal Agrawal (Interim)
New Hampshire Lindsay Pierce Lisa Ouellette Benjamin Chan Christine Bean
New Jersey Tay Walker Patricia Mason Christina Tan Onesia Bishop
New Mexico Andrew Gans Janine Waters Michael Landen Lixia Liu
New York Alison Muse Margaret Carroll Debra Blog Jill Taylor
New York City Susan Blank Kate Washburn Debra Blog Jennifer Rakeman
North Carolina Jacquelyn Clymore Pete Moore Vacant Scott Zimmerman
North Dakota Kirby Kruger Lindsey VanderBusch Tracy Miller Myra Kosse
Ohio Amanda Dennison Vacant Mary DiOrio Quanta Brown (Acting)
Oklahoma Jan Fox Kristen Eberly Kristy Bradley S. Terrance Dunn
Oregon Vacant Ruth Helsley Katrina Hedberg John Fontana
Pennsylvania Beth Butler Kristine King Sharon Watkins James Lute (Acting)
Philadelphia Greta Anschuetz Melinda Salmon Sharon Watkins Kerry Buchs
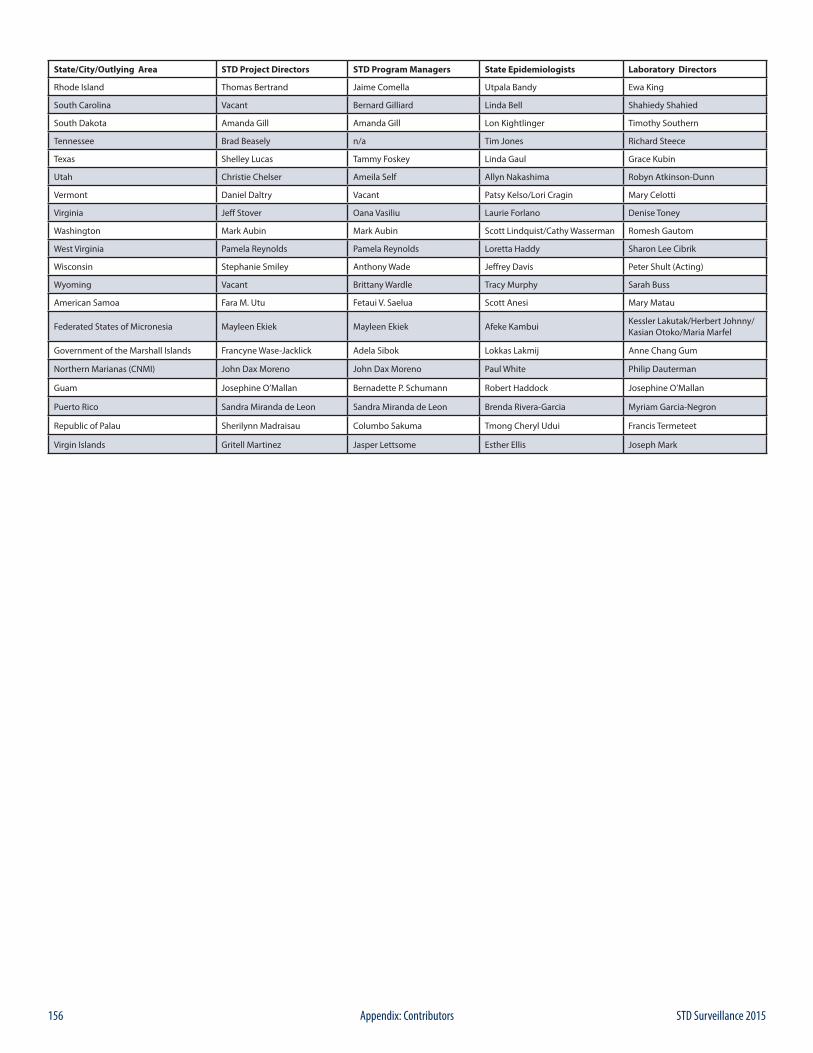
156 STD Surveillance 2015Appendix: Contributors
State/City/Outlying Area STD Project Directors STD Program Managers State Epidemiologists Laboratory Directors
Rhode Island Thomas Bertrand Jaime Comella Utpala Bandy Ewa King
South Carolina Vacant Bernard Gilliard Linda Bell Shahiedy Shahied
South Dakota Amanda Gill Amanda Gill Lon Kightlinger Timothy Southern
Tennessee Brad Beasely n/a Tim Jones Richard Steece
Texas Shelley Lucas Tammy Foskey Linda Gaul Grace Kubin
Utah Christie Chelser Ameila Self Allyn Nakashima Robyn Atkinson-Dunn
Vermont Daniel Daltry Vacant Patsy Kelso/Lori Cragin Mary Celotti
Virginia Jeff Stover Oana Vasiliu Laurie Forlano Denise Toney
Washington Mark Aubin Mark Aubin Scott Lindquist/Cathy Wasserman Romesh Gautom
West Virginia Pamela Reynolds Pamela Reynolds Loretta Haddy Sharon Lee Cibrik
Wisconsin Stephanie Smiley Anthony Wade Jeffrey Davis Peter Shult (Acting)
Wyoming Vacant Brittany Wardle Tracy Murphy Sarah Buss
American Samoa Fara M. Utu Fetaui V. Saelua Scott Anesi Mary Matau
Federated States of Micronesia Mayleen Ekiek Mayleen Ekiek Afeke Kambui Kessler Lakutak/Herbert Johnny/Kasian Otoko/Maria Marfel
Government of the Marshall Islands Francyne Wase-Jacklick Adela Sibok Lokkas Lakmij Anne Chang Gum
Northern Marianas (CNMI) John Dax Moreno John Dax Moreno Paul White Philip Dauterman
Guam Josephine O’Mallan Bernadette P. Schumann Robert Haddock Josephine O’Mallan
Puerto Rico Sandra Miranda de Leon Sandra Miranda de Leon Brenda Rivera-Garcia Myriam Garcia-Negron
Republic of Palau Sherilynn Madraisau Columbo Sakuma Tmong Cheryl Udui Francis Termeteet
Virgin Islands Gritell Martinez Jasper Lettsome Esther Ellis Joseph Mark
U.S DEPARTMENT OF HEALTH & HUMAN SERVICESCenters for Disease Control and Prevention, MS E-63Atlanta, Georgia 30333
OFFICIAL BUSINESSPenalty for Private Use $300
MEDIA MAILPOSTAGE & FEES PAID
CDCPermit No. G-284
CS255195