Embed Size (px)
Citation preview

Forschungsinstitut zur Zukunft der ArbeitInstitute for the Study of Labor
DI
SC
US
SI
ON
P
AP
ER
S
ER
IE
S
Sex, Race, and Job Satisfaction amongHighly Educated Workers
IZA DP No. 9355
September 2015
Joni HerschJean Xiao

Sex, Race, and Job Satisfaction among
Highly Educated Workers
Joni Hersch Vanderbilt University
and IZA
Jean Xiao
Vanderbilt University
Discussion Paper No. 9355 September 2015
IZA
P.O. Box 7240 53072 Bonn
Germany
Phone: +49-228-3894-0 Fax: +49-228-3894-180
E-mail: [email protected]
Any opinions expressed here are those of the author(s) and not those of IZA. Research published in this series may include views on policy, but the institute itself takes no institutional policy positions. The IZA research network is committed to the IZA Guiding Principles of Research Integrity. The Institute for the Study of Labor (IZA) in Bonn is a local and virtual international research center and a place of communication between science, politics and business. IZA is an independent nonprofit organization supported by Deutsche Post Foundation. The center is associated with the University of Bonn and offers a stimulating research environment through its international network, workshops and conferences, data service, project support, research visits and doctoral program. IZA engages in (i) original and internationally competitive research in all fields of labor economics, (ii) development of policy concepts, and (iii) dissemination of research results and concepts to the interested public. IZA Discussion Papers often represent preliminary work and are circulated to encourage discussion. Citation of such a paper should account for its provisional character. A revised version may be available directly from the author.

IZA Discussion Paper No. 9355 September 2015
ABSTRACT
Sex, Race, and Job Satisfaction among Highly Educated Workers* There has been a considerable amount of work focusing on job satisfaction and sex, generally finding that women are more satisfied than men despite having objectively worse job conditions. But there is little evidence on whether job satisfaction differs by race or ethnicity. We use data from the 2010 National Survey of College Graduates to examine the relation between job satisfaction and race and ethnicity among Asian, black, Hispanic/Latino, and white workers. Overall job satisfaction does not differ by sex among college graduates. Relative to white workers of the same sex, Asian and black workers are far less satisfied. The lower satisfaction of Asian and black workers relative to white workers is not explained by immigrant status, job match, or other individual or job characteristics. JEL Classification: J15, J16, J28, J71 Keywords: job satisfaction, gender, race and ethnicity, immigrants, college graduates, discrimination Corresponding author: Joni Hersch Vanderbilt Law School Vanderbilt University 131 21st Avenue South Nashville, TN 37203 USA E-mail: [email protected]
* We thank Barry Hirsch and participants at the Southern Economic Association 2014 annual meeting in the session “Gender and the Labor Market” for their comments.

1
Sex, Race, and Job Satisfaction Among Highly Educated Workers
1. Introduction
There is substantial economics literature concerning sex differences in job satisfaction,1
but very little work that investigates racial or ethnic differences in job satisfaction. In this paper,
we examine the relation between race or ethnicity and job satisfaction among a large sample of
college graduates.
Studies of the relation between sex and job satisfaction typically find that, despite having
lower pay and fewer opportunities for advancement—which may be related to discriminatory
treatment—women are more satisfied than men with their jobs. Possible explanations for this
apparent paradox include sex differences in values, in job expectations, and in labor force
participation rates. Women appear to value high pay and opportunities for advancement less than
men do, and women also appear to have lower expectations about their pay and prospects for
promotion and therefore may be more easily satisfied. Further, women who are not satisfied with
their jobs may choose to stay out of the labor market, so that the women who are employed are
on average more satisfied. The finding that women are on average more satisfied suggests that
the positive effect on job satisfaction of differences in values, lower expectations, and selection
into the labor market of those who are more satisfied with their jobs outweighs the negative
effect on job satisfaction of discriminatory treatment.
There is little evidence on whether nonwhite workers likewise experience a job
satisfaction differential relative to white workers. However, the reasons that job satisfaction may
differ by sex—that is, discriminatory treatment and differences in expectations, values, or labor
force participation—may also pertain to race or ethnicity.
Although some papers that examine the relation between sex and job satisfaction include
an indicator for black workers and find that black workers have lower job satisfaction (e.g.,
Donohue and Heywood 2004), there is little investigation into the source of this racial
differential. Notable exceptions are papers by Bartel (1981), who uses data from the National
Longitudinal Surveys of Mature Men, and Mukerjee (2014), who uses data from the General
Social Survey and the National Longitudinal Survey of Youth. Bartel (1981) finds that blacks
1 See, e.g., Clark (1997); Sloane and Williams (2000); Sousa-Poza and Sousa-Poza (2000); Ward and Sloane (2000); Donohue and Heywood (2004); Bender, Donohue, and Heywood (2005); Westover (2012). As we discuss later, these studies also provide evidence on sex differences in work values and job expectations.

2
report significantly higher job satisfaction. She surmises that blacks have lower expectations due
to discrimination, and thus, job expectations are more easily fulfilled for blacks. In contrast,
Mukerjee (2014) finds that blacks report significantly lower job satisfaction and that controlling
for perceived discrimination eliminates the black-white gap in job satisfaction. This suggests that
any lowering of expectations among black workers, as posited by Bartel (1981), is not sufficient
to offset the direct effect of perceived discriminatory treatment.
Most of the datasets that have been used to examine job satisfaction have too few
observations to provide adequate statistical power to examine workers of any race other than
black or white. By using data from the 2010 National Survey of College Graduates (NSCG),
which includes information on more than 77,000 college graduates, we have a large enough
sample to examine workers of the Asian race and those of Hispanic/Latino ethnicity, as well as
those of black and white races.2 The NSCG is a nationally representative survey of college
graduates. In addition to highly detailed demographic and labor market information, the NSCG
requests unusually extensive information on job satisfaction, with respondents reporting their
satisfaction for nine separate dimensions of their job, as well as overall satisfaction that is
typically used in job satisfaction studies. We augment the data available in the NSCG with
information on occupational characteristics from the Current Population Survey (CPS) and on
working conditions from the Department of Labor Occupational Information Network (O*NET)
database.
The contributions of this paper include providing additional evidence on sex differences
in job satisfaction using data on a large sample of college graduates; providing unique
information on whether job satisfaction differs by race or ethnicity; and providing unique
information on how satisfaction with specific aspects of the job differs by sex, race, or ethnicity.
We examine whether racial or ethnicity differences in job satisfaction are related to differences
in the population share who are immigrants, as well as whether job satisfaction differs within
2 We recognize that because the NSCG includes only those who are college graduates, our results may not be directly comparable to studies that are not restricted to those with college degrees. However, there are no other datasets with information on job satisfaction and the labor market that have a sufficient number of observations to provide adequate statistical power to examine races other than black or white. For example, even pooling multiple years of the General Social Survey would not avoid the sample size limitation because until 2000 race was recorded only as black, white, or other, and Hispanic ethnicity was not recorded. Although the Behavioral Risk Factor Surveillance System records have detailed race information and a large number of observations, this survey includes questions about life satisfaction and not about job satisfaction.

3
race or ethnicity by immigrant status. We also account for job match, unaccounted for in most of
the previous gender and race job satisfaction literature.
2. Theoretical and Empirical Framework
Conceptually, overall utility can be represented by v = v(u, μ), where u(·) is a sub-utility
function that captures utility from work and μ captures utility from other facets of life such as
relationships with friends and family (Clark and Oswald 1996). Work utility takes the form
(1) 𝑢𝑢 = 𝑢𝑢(𝑦𝑦,ℎ, 𝑥𝑥, 𝑐𝑐),
where y is income, h is the number of hours worked, x is a vector of individual characteristics,
and c is a vector of job-specific characteristics.
We use the NSCG job satisfaction measure as a proxy for utility from employment,
recognizing that utility from other facets of life embodied in the term μ may spill over and
influence utility as well as choices related to employment. A worker’s job satisfaction captures
the worker’s reaction to the “entire panoply of job characteristics” (Hamermesh 2001, p. 2).
Scholars have found job satisfaction to be correlated with quit intentions or turnover (Freeman
1978; Hersch and Stone 1990; Clark 2001; Lee 2012), worker absenteeism (Clegg 1983), worker
productivity (Mangione and Quinn 1975), and organizational performance (Ostroff 1992).
We estimate job satisfaction equations with the general form of
(2) 𝑠𝑠𝑖𝑖 = 𝛼𝛼 + 𝛽𝛽𝑥𝑥𝑖𝑖 + 𝛿𝛿𝑐𝑐𝑖𝑖 + 𝜀𝜀,
where s is a measure of job satisfaction, x is a vector of individual characteristics including sex,
race, and ethnicity, and c is a vector of job-specific characteristics including income, hours
worked, and working conditions.
We are interested in whether there are sex, race, or ethnicity differences in job
satisfaction. As discussed earlier, there is substantial literature examining sex and job satisfaction
but little literature examining the relation between race or ethnicity and job satisfaction. Many of
the arguments offered to explain sex disparities in satisfaction are relevant to race and ethnicity
as well, so we start by reviewing the hypotheses that relate sex to job satisfaction in order to
motivate our empirical specification.
First, past studies have noted that women value intangible aspects of the job such as good
relationships and the actual work itself more than men do, and men value the tangibles such as
salary and promotions more than women do (Clark 1997). If values differ by sex and workers
choose jobs based on their values, studies that do not control for less-quantifiable job aspects that

4
may be correlated with sex, such as workplace relationships, suffer from omitted variable bias. In
this case, the sex disparity would disappear if information on actual working conditions or
individual work values are taken into account. Bender, Donohue, and Heywood (2005) and Ward
and Sloane (2000) find that controlling for work values eliminates the unadjusted satisfaction
differential by sex.3 Similar arguments may pertain to race or ethnicity if work values differ by
race or ethnicity. Because workers may sort into occupations on the basis of work values, we
control for both occupation and occupational characteristics in the job satisfaction equations.
Second, women may expect less from their job than men, and thus, job expectations may
be more easily fulfilled for women. Or, relatedly, job satisfaction may be determined relative to
others; that is, expectations may be based on a reference point. There is indirect evidence
supporting this hypothesis. The differential in satisfaction by sex disappears for certain groups of
workers who are likely to have similar expectations. Clark (1997) finds no differential in overall
satisfaction for the young, the well-educated, and those in professional occupations. Donohue
and Heywood (2004) find no differential in their full sample of young workers.4 Ward and
Sloane (2000) find no differential in overall satisfaction for their sample of academics. Clark
(1997) and Sloane and Williams (2000) find that controlling for a measure of comparison income
decreases the size of the satisfaction differential between men and women. The influence of
expectations on job satisfaction observed in comparing male and female workers may also
pertain to race and ethnicity. Nonwhites in general may expect less from their jobs and therefore
be more easily satisfied, although we anticipate that the college graduates in our sample may
have expectations that are more similar than those of the general population.
Third, the satisfaction differential by sex may be attributed to different labor force
participation rates, with women who are genuinely dissatisfied with their jobs choosing to not
participate in the labor market. That is, the lower labor market participation rate of women may
reflect the fact that job satisfaction or dissatisfaction forms a component of the opportunity cost
3 Bender, Donohue, and Heywood (2005) use the 1997 National Study of the Changing Workforce and find that the sex difference in satisfaction becomes statistically insignificant after controlling for whether “employees have to choose between advancing in their jobs or devoting attention to their family or personal lives.” Based on data from Scottish academics, Ward and Sloane (2000) find that controlling for work values eliminates the unadjusted satisfaction differentials by sex for salary satisfaction and job security satisfaction. Work values in their study include “teaching importance” and “relationships with colleagues importance.” 4 Using data from the 1979 National Longitudinal Survey of Youth, Donohue and Heywood (2004) find the satisfaction disparity by sex becomes insignificant after controlling for fringe benefits such as the availability of childcare, paid vacation days, and a profit-sharing plan.

5
of market work relative to nonmarket work. Workers associate a higher reservation wage to low-
satisfaction jobs and a lower reservation wage to high-satisfaction jobs. The influence of job
satisfaction on the reservation wage may lead to sorting of women with higher levels of job
satisfaction into the labor market. This participation hypothesis emphasizes the importance of
taking into account selection into the labor force in estimating the relation between sex and job
satisfaction. It is notoriously hard to find credible instruments for the labor force participation
decision, and with the exception of Clark (1997), who finds that selection does not explain the
satisfaction disparity between men and women, studies do not correct for possible sample
selection bias. Later, we discuss whether differences in labor force participation may be relevant
in explaining job satisfaction differentials on the basis of race or ethnicity.
Because the share of a population who are immigrants differs by race and ethnicity, with
a large share of Asians and Hispanics/Latinos who are immigrants to the United States, racial or
ethnic differences in job satisfaction may actually reflect the distribution of immigrants within
the different racial and ethnic groups. Therefore, we also examine whether job satisfaction
differs within race or ethnicity by immigrant status. Immigrants’ job satisfaction may differ from
that of their same race or ethnic counterparts. They may have lower job satisfaction if they face
greater discrimination or if they have higher expectations, to the extent that immigrants are
positively selected on the basis of characteristics like skills and ambition. Immigrants may
instead have higher job satisfaction than their same race or ethnic counterparts if they have lower
expectations due to less familiarity with the language or culture of the United States. To our
knowledge, the only paper that has explored differentials in job satisfaction by immigrant status
is McGuinness and Byrne (2014), who find that female immigrants, but not male immigrants,
have lower job satisfaction than their same-sex native-born counterparts within a sample of
graduates of European universities. Their data does not allow an examination of ethnic
differentials.
Finally, studies find that workers who have better education or skill matches are more
satisfied with their jobs (e.g., Hersch 1991; Allen and van der Velden 2001), but job match has
not been widely accounted for in the sex and race job satisfaction literature. In situations of job
mismatch, there is a higher likelihood that workers’ job expectations are not met. To the extent
that job match quality differs by sex, race, ethnicity, or immigrant status, part of any satisfaction

6
differential may be attributable to job match quality. We therefore control in the estimates for job
match quality.
3. Data Sources and Variable Definitions
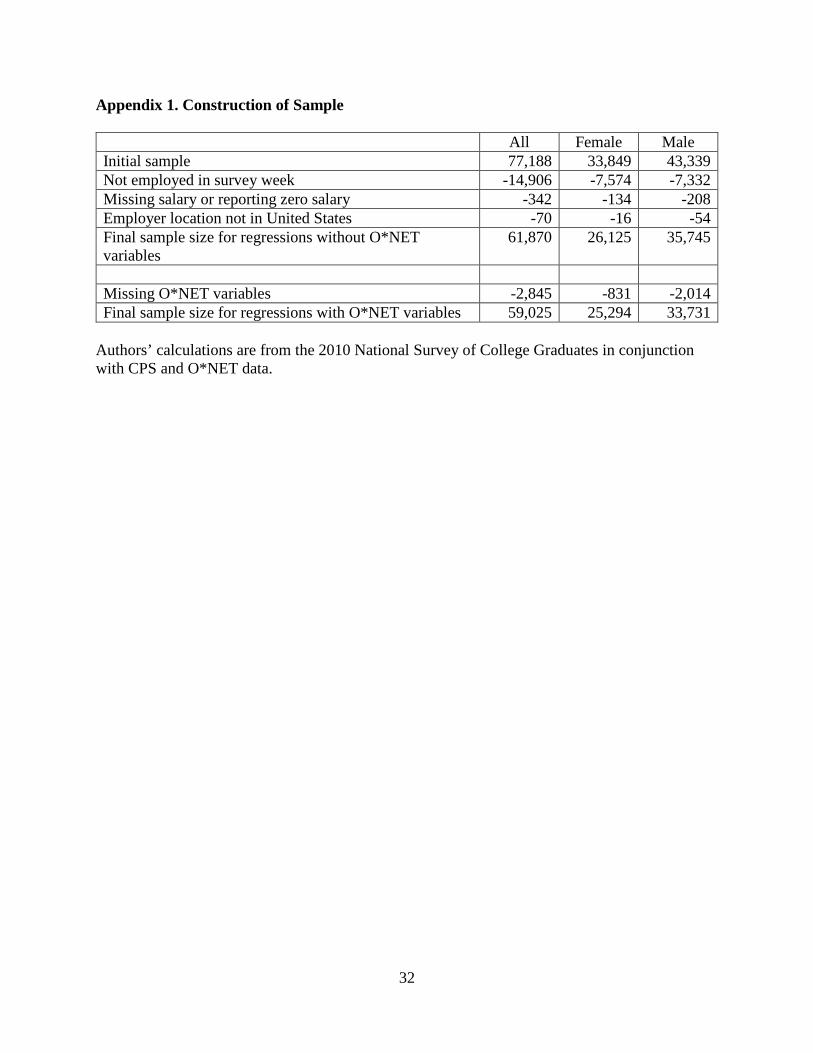
Our source for individual data is the 2010 National Survey of College Graduates
(NSCG).5 To be included in the NSCG sample, individuals must have a bachelor’s or higher
degree and be under 76 years old and not institutionalized as of the survey reference date
(October 1, 2010). The number of observations in the full sample is 77,188. Job satisfaction
questions are asked only of those employed as of the survey reference date, and we additionally
exclude from our analyses those missing salary or reporting zero salary on current job, as well as
those with a non-U.S. work location. This leaves us with 61,870 observations for most of the
analyses of this paper.6 We use the 2010 NSCG sampling weights to account for the survey’s
sample design in the reported descriptive statistics and regression results.
We describe the key variables used in the analyses below, starting with the job
satisfaction, race, and ethnicity measures, followed by individual characteristics and job
characteristics including income, hours worked, and measures of working conditions.
Descriptive statistics for all variables defined below are reported in Appendix 2 for the full
sample and by sex; descriptive statistics by race or ethnicity are reported in Appendix 3.
The NSCG asks respondents to rate their satisfaction on a four-point scale (very
dissatisfied, somewhat dissatisfied, somewhat satisfied, or very satisfied) with nine aspects of
their principal job: salary, benefits, job security, job location, opportunities for advancement,
intellectual challenge, level of responsibility, degree of independence, and contribution to
society. After rating their satisfaction with these specific aspects, respondents are asked to rate
their overall satisfaction with their job. Our analyses start by examining this measure of overall
job satisfaction. For each of the satisfaction questions, the responses are highly concentrated at
the upper end (i.e., somewhat satisfied and very satisfied). We create an indicator variable for
each measure of job satisfaction where the variable is equal to 1 if the respondent answers very
satisfied.
5 See http://www.nsf.gov/statistics/srvygrads/. The 2003 NSCG also includes information on job satisfaction and most of the information used in this paper, but information on fringe benefits that is reported in 2010 is not available in 2003, so we use only the 2010 wave in this paper. 6 See Appendix 1 for more information on the construction of the sample.

7
In addition to an indicator variable for sex, we create indicators for mutually exclusive
race and ethnicity categories, as well as an indicator for immigrants. All respondents reporting
Hispanic, Latino, or Spanish origin (any race) are identified by an indicator variable. We then
create mutually exclusive non-Hispanic or Latino race categories for those reporting only one
race of Asian, black, or white. Non-Hispanic individuals of any other race (specifically Native
Hawaiian or other Pacific Islander, or American Indian or Alaska Native) and reporting more
than one race are grouped in an ‘other race’ category. The respondent is categorized as an
immigrant if the respondent was not a U.S. citizen born in the United States, Puerto Rico, or
another U.S. territory, or was not born of U.S. citizen parent(s). Whether an individual is an
immigrant to the United States varies considerably by race and ethnicity.7 We also create
mutually exclusive race or ethnicity categories by immigrant status in order to help identify the
source of job satisfaction disparities by race or ethnicity.
Individual characteristics include detailed demographic, health, and educational
information. We control for age, being married or living in a marriage-like relationship (which
we refer to as ‘married’ for brevity), total number of children under 18 in the household, and
whether the person is an immigrant. To account for health status, we use the four survey
questions on functional limitations that ask the respondents to rate their difficulty with seeing,
hearing, walking, and lifting. For each question, the respondent could answer no difficulty, slight
difficulty, moderate difficulty, severe difficulty, or unable to do the activity in question. We
create an indicator variable for each functional limitation where the variable is equal to 1 if the
respondent answered moderate difficulty, severe difficulty, or unable to do the activity in
question.
NSCG respondents report information on their first bachelor’s degree and two most
recent degrees (other than first bachelor’s degree) at the bachelor’s level or higher. For each
degree reported, respondents provide the year the degree was obtained, the type of degree
(bachelor’s, master’s, doctorate, or professional), and the field of study (selecting from a list of
more than 140 fields). From this information, we create mutually exclusive indicator variables
for the highest degree obtained: JD, MD, MBA, MA not in business, PhD, and no graduate
degree.
7 Specifically, within our sample, the shares that are immigrants are as follows: white, 5%; Asian, 81%; black, 15%; other race, 11%; Hispanic/Latino, 30%.

8
The NSCG includes extensive information on job characteristics. Our measure of salary
is basic annual salary on the principal job held as of the survey reference date.8 In the regression
analyses, we control for log of own salary, which is typically found to be positively related to job
satisfaction (e.g., Clark 1997; Sloane and Williams 2000). Fringe benefits form an additional
component of pay. Respondents are asked whether any of these benefits were available to them,
even if they chose not to take them: health insurance that is at least partially paid by employer,
pension or retirement plan to which employer contributed, profit-sharing plan, and paid vacation,
sick, or personal days. Because fringe benefits are a form of compensation, we expect those with
fringe benefits to be more satisfied with their jobs. We also control for the log of usual hours
worked per week in a typical week on the principal job. Studies (e.g., Clark 1997) have found an
inverse relation between job satisfaction and hours worked per week. Tenure is the number of
years that the respondent had worked for the principal employer from the time the respondent
started the job to the survey’s reference date.
Respondents report whether they supervise the work of others as part of their principal
job, and we create a supervisor indicator variable. Firm size is reported in eight categories, from
10 or fewer employees to 25,000 or more employees. We create indicator variables for each of
the provided firm size categories. We create indicator variables for type of employer:
government, self-employed, non-profit, for-profit, or other employer type. We also create
indicator variables for employer location based on region of country, which is reported in nine
Census categories.9 To account for job match quality, we create indicator variables using
respondents’ report of whether their job is closely related, somewhat related, or not related to the
field of their highest degree.
Occupation is reported in the NSCG by selection from a list of 132 occupations. We
control in the regressions for occupation by grouping these occupations into 10 categories based
on the 2010 Standard Occupational Classification (SOC) intermediate aggregation level
categories.10
8 The specific question is: “Before deductions, what was your basic annual salary on this job [that is, the principal job] as of the week of October 1, 2010?” The question includes this instruction in parentheses: “Do not include bonuses, overtime, or additional compensation for summertime teaching or research.” Those who are not salaried are asked to estimate their earned income, excluding business expenses. 9 No other locational information such as SMSA or city size is available. 10 These occupations are management, business, and financial; computer, engineering, and science; education, legal, and community service; arts and media; healthcare practitioners and technical; service; sales and related; office and

9
For comparison to other studies, we construct additional variables which we match to
individuals by assigning occupational average job characteristics calculated from the CPS and
O*NET database. The NSCG does not report whether an individual is a member of a union or
covered by a union contract. Union status has been shown to be negatively associated with job
satisfaction (e.g., Bender and Sloane 1998; Artz 2012). Artz (2012) suggests that a higher
percentage of females in an organization is positively associated with job satisfaction. Along
similar lines of reasoning, the percentages of different minorities at a workplace might also be
important to job satisfaction. Using CPS data for the years 2008–2010, we create, by
occupational category, variables for the percentage of workers in a union or covered by a union
contract, female, white, Asian, black, other race, and Hispanic/Latino. To improve the precision
of the match, the percentages are generated based on the 22 occupation categories in the SOC
major groups categorization.11 We generate a three-year average to reduce measurement error. In
order to match the variables constructed from the CPS to the NSCG, we create the same 22
occupation categories from NSCG occupation codes and link the percentages calculated from the
CPS to observations in the NSCG by matching the occupation group in the CPS to the
corresponding occupation group in the NSCG.
We also supplement the information available in the NSCG with data from the O*NET
database, which provides ratings for many different skill requirements and work characteristics.
Prior studies have used O*NET data to control for occupational characteristics in wage
equations. For example, using O*NET data, Hirsch (2005) shows that much of the wage gap
between full-time and part-time workers is due to occupation skill requirements and working
conditions. To select specific characteristics to include in our analyses, we draw on Krueger and
Schkade (2008) who show, using data that the authors themselves collected, that personal
interactions on the job, an unpleasant physical work environment, and pressure at work
significantly affect job satisfaction. Using O*NET data, they demonstrate that extroverted
administrative support; natural resources, construction, maintenance, production, transportation, and material moving (e.g., ‘blue-collar occupations’); and other. 11 The 22 occupation categories are management; business and financial operations; computer and mathematical; architecture and engineering; life, physical, and social science; community and social service; legal; education, training, and library; arts, design, entertainment, sports, and media; healthcare practitioners and technical; healthcare support; protective service; food preparation and serving related; other service; sales and related; office and administrative; farming, fishing, and forestry; construction and extraction; installation, maintenance, and repair; production; transportation and material moving; and other. Because industry is not reported in the 2010 NSCG, we are unable to match percentage unionized by industry.

10
workers sort into occupations that involve more personal interactions with others. We therefore
chose O*NET variables that measure personal interactions on the job, an unpleasant work
environment, and pressure at work. We additionally include O*NET measures that account for
physical effort required on the job, dangerousness of the job, and autonomy and structure on the
job.12
We match these O*NET variables to individual observations in the NSCG by using a
crosswalk between individual SOC codes and the NSCG occupation categories. Of the 132
occupations indicated in the NSCG, there are 7 occupations for which the O*NET variables do
not have ratings and thus could not be matched to O*NET data. In regressions controlling for
O*NET characteristics, we drop the observations that could not be matched and ones for which
certain O*NET variables had missing data, leaving us with 59,025 observations.13
4. Descriptive Statistics
Tables 1 and 2 provide descriptive statistics on overall job satisfaction by sex and race or
ethnicity. Table 1 shows that there is no difference on average by sex in overall job satisfaction
for the full sample. However, the overall values mask considerable differences by race or
ethnicity. The difference in satisfaction between men and women who are either white or in the
‘other race’ category is not statistically significant. But Asian and black men are about 4
percentage points more likely than women of the same race to report that they are very satisfied,
and Hispanic/Latino women are 6 percentage points more likely to report they are very satisfied
than are Hispanic/Latino men. These statistics highlight the importance of considering the role of
race or ethnicity in any comparison of sex differences in job satisfaction.
Furthermore, white workers have considerably higher job satisfaction than Asian and
black workers of the same sex. Table 2 shows the magnitudes of the differences in percentages
that are very satisfied and indicates which pairs have statistically significant differences. White
12 The O*NET variables used here are coded on 1–5 scales of importance, incidence, and degree. O*NET variables for personal interactions on the job (except for contact with others, deal with unpleasant or angry people, and deal with physically aggressive people) and O*NET variables for physical effort required for the job are measured on a scale of importance, from 1 (not important) to 5 (essential). O*NET variables for an unpleasant work environment, along with the variables deal with unpleasant or angry people and deal with physically aggressive people, are measured on a scale of frequency, from 1 (never) to 5 (every day). The O*NET variable contact with others, along with variables for autonomy and structure on the job, are measured on a scale of degree, from 1 (none) to 5 (a lot). 13 As an alternative, we estimate regressions including indicator variables for each of the 132 NSCG occupations in the regressions. This approach directly nets out the influence on job satisfaction of working conditions associated with the individual’s occupation. The estimates are very similar using either approach.
11
and Hispanic/Latino women report similar levels of job satisfaction and are about 15 percentage
points more likely to report they are very satisfied than are Asian and black women. White men
report higher job satisfaction than Hispanic/Latino men, but both white and Hispanic/Latino men
are more likely to report they are very satisfied than are Asian and black men. White men are
about 11 percentage points more likely to report that they are very satisfied than Asian and black
men, and Hispanic/Latino men are about 5 percentage points more likely to report that they are
very satisfied than Asian or black men.
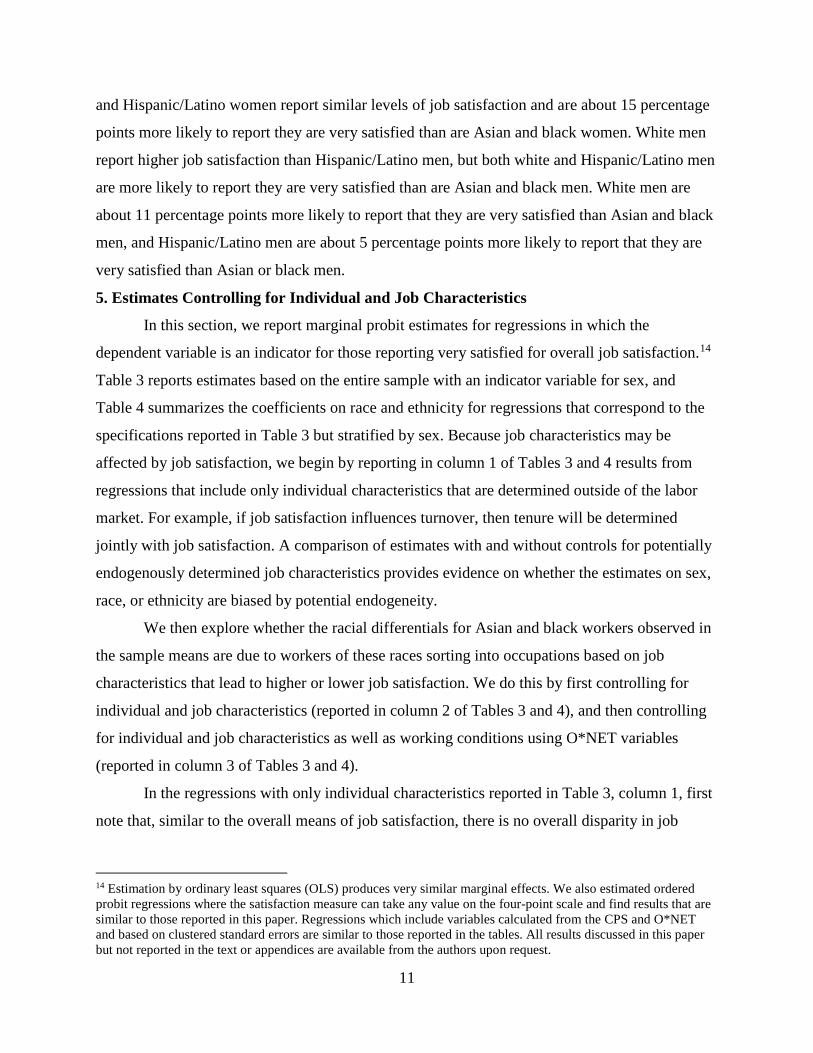
5. Estimates Controlling for Individual and Job Characteristics
In this section, we report marginal probit estimates for regressions in which the
dependent variable is an indicator for those reporting very satisfied for overall job satisfaction.14
Table 3 reports estimates based on the entire sample with an indicator variable for sex, and
Table 4 summarizes the coefficients on race and ethnicity for regressions that correspond to the
specifications reported in Table 3 but stratified by sex. Because job characteristics may be
affected by job satisfaction, we begin by reporting in column 1 of Tables 3 and 4 results from
regressions that include only individual characteristics that are determined outside of the labor
market. For example, if job satisfaction influences turnover, then tenure will be determined
jointly with job satisfaction. A comparison of estimates with and without controls for potentially
endogenously determined job characteristics provides evidence on whether the estimates on sex,
race, or ethnicity are biased by potential endogeneity.
We then explore whether the racial differentials for Asian and black workers observed in
the sample means are due to workers of these races sorting into occupations based on job
characteristics that lead to higher or lower job satisfaction. We do this by first controlling for
individual and job characteristics (reported in column 2 of Tables 3 and 4), and then controlling
for individual and job characteristics as well as working conditions using O*NET variables
(reported in column 3 of Tables 3 and 4).
In the regressions with only individual characteristics reported in Table 3, column 1, first
note that, similar to the overall means of job satisfaction, there is no overall disparity in job
14 Estimation by ordinary least squares (OLS) produces very similar marginal effects. We also estimated ordered probit regressions where the satisfaction measure can take any value on the four-point scale and find results that are similar to those reported in this paper. Regressions which include variables calculated from the CPS and O*NET and based on clustered standard errors are similar to those reported in the tables. All results discussed in this paper but not reported in the text or appendices are available from the authors upon request.
12
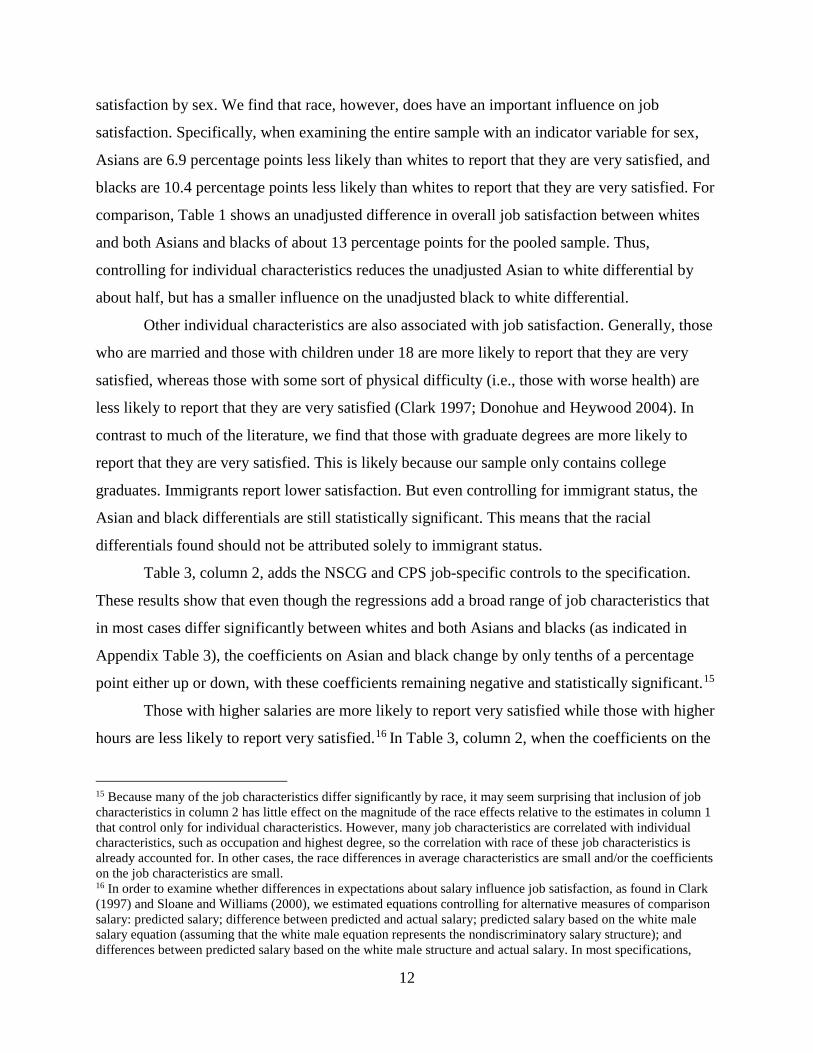
satisfaction by sex. We find that race, however, does have an important influence on job
satisfaction. Specifically, when examining the entire sample with an indicator variable for sex,
Asians are 6.9 percentage points less likely than whites to report that they are very satisfied, and
blacks are 10.4 percentage points less likely than whites to report that they are very satisfied. For
comparison, Table 1 shows an unadjusted difference in overall job satisfaction between whites
and both Asians and blacks of about 13 percentage points for the pooled sample. Thus,
controlling for individual characteristics reduces the unadjusted Asian to white differential by
about half, but has a smaller influence on the unadjusted black to white differential.
Other individual characteristics are also associated with job satisfaction. Generally, those
who are married and those with children under 18 are more likely to report that they are very
satisfied, whereas those with some sort of physical difficulty (i.e., those with worse health) are
less likely to report that they are very satisfied (Clark 1997; Donohue and Heywood 2004). In
contrast to much of the literature, we find that those with graduate degrees are more likely to
report that they are very satisfied. This is likely because our sample only contains college
graduates. Immigrants report lower satisfaction. But even controlling for immigrant status, the
Asian and black differentials are still statistically significant. This means that the racial
differentials found should not be attributed solely to immigrant status.
Table 3, column 2, adds the NSCG and CPS job-specific controls to the specification.
These results show that even though the regressions add a broad range of job characteristics that
in most cases differ significantly between whites and both Asians and blacks (as indicated in
Appendix Table 3), the coefficients on Asian and black change by only tenths of a percentage
point either up or down, with these coefficients remaining negative and statistically significant.15
Those with higher salaries are more likely to report very satisfied while those with higher
hours are less likely to report very satisfied.16 In Table 3, column 2, when the coefficients on the
15 Because many of the job characteristics differ significantly by race, it may seem surprising that inclusion of job characteristics in column 2 has little effect on the magnitude of the race effects relative to the estimates in column 1 that control only for individual characteristics. However, many job characteristics are correlated with individual characteristics, such as occupation and highest degree, so the correlation with race of these job characteristics is already accounted for. In other cases, the race differences in average characteristics are small and/or the coefficients on the job characteristics are small. 16 In order to examine whether differences in expectations about salary influence job satisfaction, as found in Clark (1997) and Sloane and Williams (2000), we estimated equations controlling for alternative measures of comparison salary: predicted salary; difference between predicted and actual salary; predicted salary based on the white male salary equation (assuming that the white male equation represents the nondiscriminatory salary structure); and differences between predicted salary based on the white male structure and actual salary. In most specifications,

13
fringe benefit variables are significant, they are positive. Those who are supervisors are more
likely to report that they are very satisfied. Job satisfaction is lower among employees of larger
firms. Compared to those in the for-profit sector, those who work for a government employer,
non-profit employer, or are self-employed are more likely to report very satisfied. Also, relative
to those in management, business, and financial occupations, those in office and administrative
support and blue-collar occupations are less likely to report very satisfied. These findings are
standard in the empirical literature on job satisfaction.
Having a job that is closely related to one’s highest degree is associated with higher job
satisfaction. In contrast to much of the literature, we find that those in occupations with more
unionized workers do not have statistically lower job satisfaction. The relation between job
satisfaction and union status may differ from that found in other studies because our sample only
contains college graduates. In the pooled regressions reported in Table 3, we find that the percent
female has no significant effect on job satisfaction. However, in our regressions stratified by sex,
we find that men in occupations with a greater share of women have lower job satisfaction,
although the share of women in an occupation is not related to job satisfaction among women.17
This is in part consistent with Haile (2012), who suggests that the sex composition of the
workplace has different effects on men and women, although Haile (2012) finds that greater
gender diversity lowers job satisfaction for women and not for men.
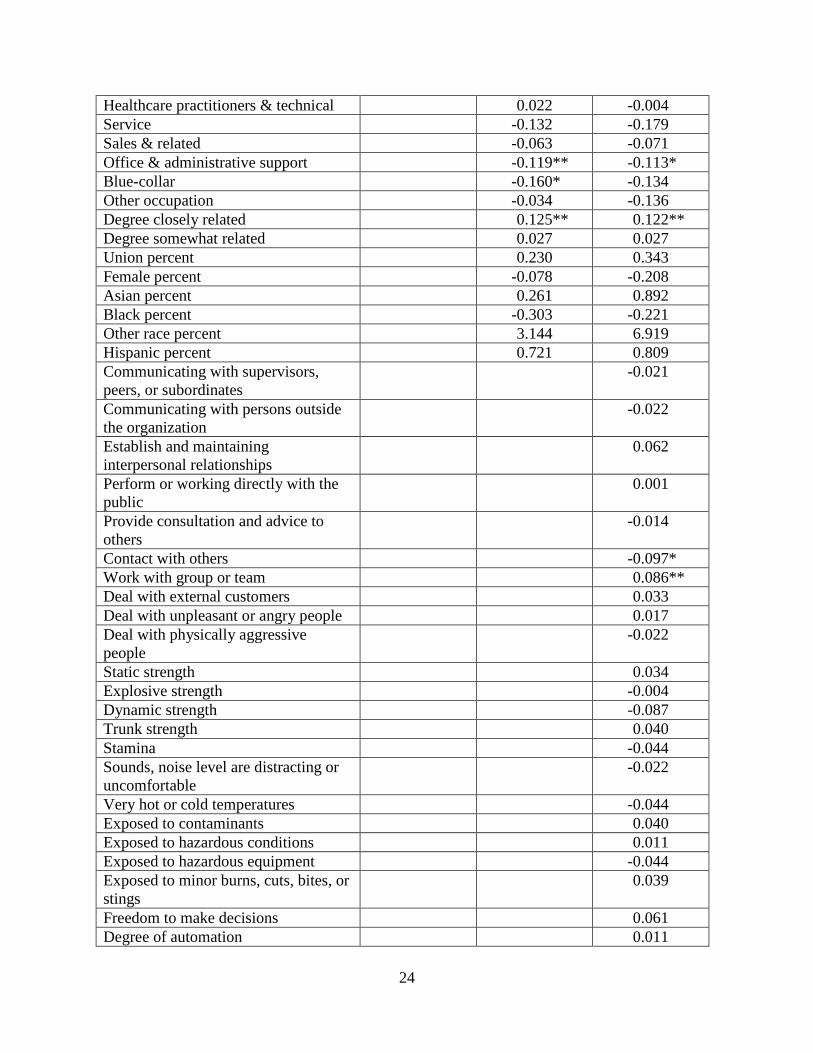
The results reported in Table 3, column 3, show that adding the O*NET occupational
characteristics slightly decreases the coefficient on Asian and increases the coefficient on black,
but by only tenths of a percentage point. Very few O*NET variables individually have a
significant effect on overall job satisfaction, and when they are statistically significant, the signs
and significance sometimes differ between men and women. Because the insignificance of the
individual working conditions may be due to collinearity, we also use factor analysis to create
latent factors for personal interactions, physical effort required, unpleasant environment,
dangerousness, autonomy and structure, and pressure by combining the O*NET variables in each
comparison salary did not have a statistically significant relation with job satisfaction. Most importantly, there was very little difference in the sex and race satisfaction differentials relative to those reported in Tables 3 and 4. Overall, these results suggest that expectations may not be an important determinant of job satisfaction among college graduates, and that the sex and racial differentials are not due to differences in expectations about income. 17 In the wage context, Macpherson and Hirsch (1995) also find that the percent female in an occupation has a stronger negative effect on wages among men than among women.

14
category, respectively.18 As we found when we control for individual O*NET characteristics,
estimates with these latent factors show little change in the coefficients on sex, race, and
ethnicity. We also find that the only factor that has a statistically significant relation with job
satisfaction is the factor representing freedom to make decisions and extent of structured work,
which has a positive relation in the full sample.19
Table 4 reports coefficients on race and ethnicity for estimates that stratify the sample by
sex, with estimates for women summarized in Panel A and estimates for men summarized in
Panel B. As in the estimates pooling men and women reported in Table 3, there is no significant
difference in satisfaction between white workers and Hispanic/Latino workers or those in the
‘other race’ category. Among workers of the same sex, Asian and black workers are less satisfied
with their jobs relative to whites. But the gap in satisfaction between Asian and black workers
relative to whites of the same sex is smaller for men than for women. As in Table 3, sequentially
adding more controls usually has only a small effect on the coefficients on Asian and black.
Within sex, controlling for individual characteristics reduces the unadjusted Asian to white
differential (reported in Table 2) by about half, but has a smaller influence on the unadjusted
black to white differential.
A possible interpretation of the smaller racial gap in satisfaction among men relative to
women may relate to racial differences in labor force participation within sex. We report labor
force participation rates by sex, race, and ethnicity in Table 5. The labor force participation rate
of college educated men is higher for men than for women of the same race, with the exception
of blacks. The labor force participation rate of black women is 9 percentage points higher than
the rate of white women and, at 87 percent, is similar to that of white men. If white women who
are dissatisfied with their jobs are more likely to exit the labor force than are dissatisfied black
women, at least part of the satisfaction differential between black and white women may be due
to selection. However, because Asian and white women have similar labor force participation
rates, as do black and white men, selection is unlikely to explain the satisfaction differential
between Asian and white women or between black and white men.
By including an indicator for immigrant status in Tables 3 and 4, we test whether racial
or ethnic differences in job satisfaction were due to immigrant status. However, this average
18 See Hirsch and Manzella (2015) for a thorough description of how to create latent factors from O*NET variables. 19 In estimates stratified by sex, this factor is statistically significant and positive for women but not for men.

15
effect may mask heterogeneity in the effect of immigrant status by race or ethnicity. As we
discussed earlier, immigrants’ job satisfaction may differ from their same race or ethnic
counterparts. Because the share who are immigrants differs by race and ethnicity, the
substantially lower satisfaction of Asians relative to whites may be driven by the large proportion
of immigrants in the sample of Asian workers, while the absence of a significant difference
between Hispanic/Latino and white workers may be related to the smaller share of
Hispanic/Latino workers within our sample who are immigrants. To test this hypothesis, we
estimate equations that include separate indicators for race and ethnicity by immigrant status. We
summarize the coefficients on race or ethnicity by immigrant status in Table 6, with estimates
summarized in column 1 for the full sample, in column 2 for women, and column 3 for men. The
reported estimates are based on regressions with the full set of variables corresponding to
column 3 of Tables 3 and 4. That is, we control for individual characteristics, job characteristics,
and O*NET occupational characteristics.
For women, these results show negative Asian and black satisfaction differentials
regardless of immigrant status, with magnitudes that are larger (although not statistically
different) for immigrants than for native-born U.S. citizens of the same race. For men, there is no
difference in job satisfaction between native-born whites and Asians, showing that the Asian
satisfaction differential is driven by immigrants. However, among men, there is no difference in
job satisfaction between native-born whites and black immigrants, showing that the black
satisfaction differential is driven by black natives. Interestingly, white male immigrants have
lower job satisfaction relative to native-born white male workers.
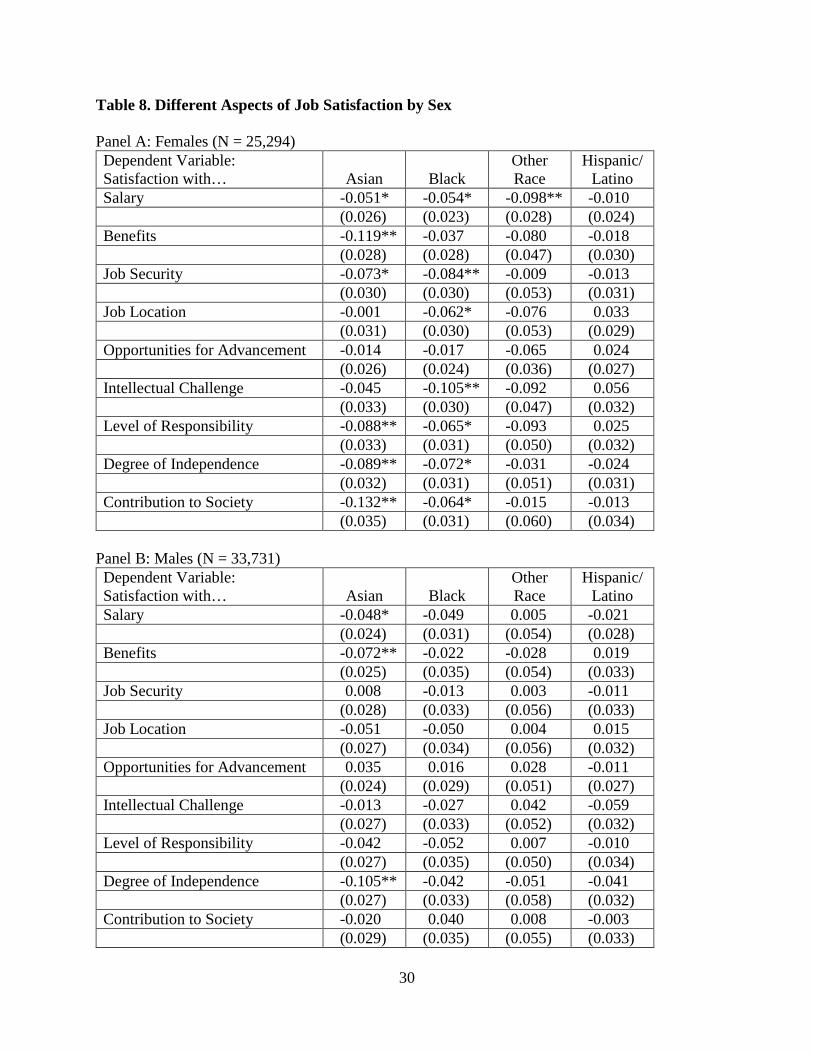
6. Different Aspects of Job Satisfaction
In Tables 7 and 8, we summarize the coefficients on race and ethnicity for job satisfaction
regressions based on the nine specific aspects of job satisfaction available in the NSCG. To see
whether different aspects of job satisfaction differ by sex, Table 7 reports estimates pooling men
and women, with an indicator for female. To examine whether there are racial or ethnic
differences in specific aspects of job satisfaction within sex, Table 8 provides corresponding
estimates stratified by sex. Each row reports a different regression with the dependent variable
indicated in the left column, and all regressions control for the full set of individual, job, and
O*NET characteristics that correspond to column 3 in Tables 3 and 4.

16
Although there is no difference in overall satisfaction between men and women, Table 7
shows that women are more satisfied than men for five satisfaction measures: job location,
opportunities for advancement, intellectual challenge, level of responsibility, and contribution to
society. Women are no less satisfied than are men with salary, benefits, job security, and degree
of independence. That is, women seem to be more satisfied than men with aspects of their jobs
that seem to reflect values and preferences, suggesting that any female advantage in job
satisfaction is not necessarily paradoxical.
In contrast, Table 7 shows that the negative differentials for Asians and blacks in the
overall satisfaction regressions are reflected in most of the individual satisfaction measures.
There is a negative Asian differential for five satisfaction measures: salary, benefits, level of
responsibility, degree of independence, and contribution to society. The magnitudes are
considerable, with, for instance, a gap of 5 percentage points for salary, and about 10 percentage
points for benefits and degree of independence. Similarly, there is a negative black differential
for six satisfaction measures: salary, job security, job location, intellectual challenge, level of
responsibility, and degree of independence. There is no Hispanic/Latino or ‘other race’
differential in any measure of job satisfaction.
Table 8 provides corresponding estimates for different aspects of job satisfaction by sex.
Reflecting their lower overall job satisfaction relative to white women, Asian and black female
workers are less satisfied than white female workers on most of the nine aspects of job
satisfaction. For females, there is a negative Asian differential in six satisfaction measures:
salary, benefits, job security, level of responsibility, degree of independence, and contribution to
society. Similarly, there is a negative black differential for seven satisfaction measures: salary,
job security, job location, intellectual challenge, level of responsibility, degree of independence,
and contribution to society. Other race women are less satisfied than white women with their
salary, but there are otherwise no differences in satisfaction with specific job aspects between
white women and those of other race or Hispanic/Latino.
Although Asian and black men report substantially lower overall job satisfaction relative
to white men, they are less likely than are women to report lower satisfaction with specific
aspects of their jobs. Asian men report lower satisfaction than white men in three areas: salary,
benefits, and degree of independence. There are no differentials between black and white men in
17
any of the specific aspects of job satisfaction, nor are there any differences between men who are
other race or Hispanic/Latino and white men in any of the specific measures of job satisfaction.
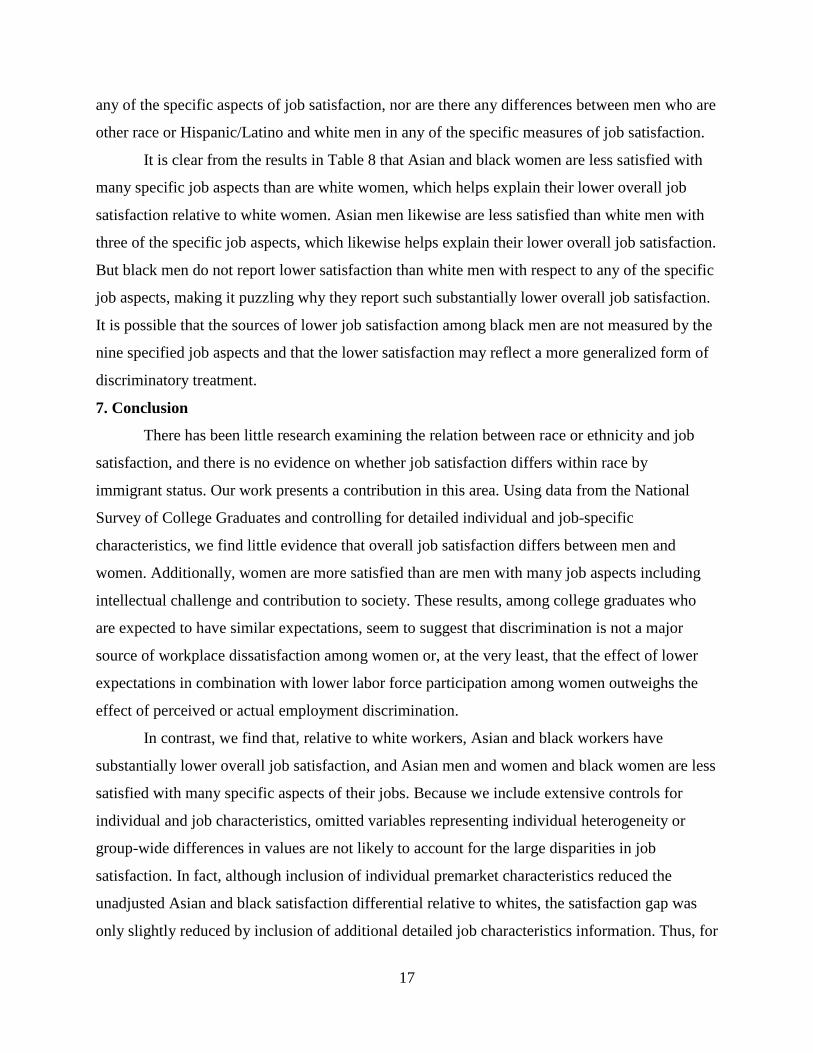
It is clear from the results in Table 8 that Asian and black women are less satisfied with
many specific job aspects than are white women, which helps explain their lower overall job
satisfaction relative to white women. Asian men likewise are less satisfied than white men with
three of the specific job aspects, which likewise helps explain their lower overall job satisfaction.
But black men do not report lower satisfaction than white men with respect to any of the specific
job aspects, making it puzzling why they report such substantially lower overall job satisfaction.
It is possible that the sources of lower job satisfaction among black men are not measured by the
nine specified job aspects and that the lower satisfaction may reflect a more generalized form of
discriminatory treatment.
7. Conclusion
There has been little research examining the relation between race or ethnicity and job
satisfaction, and there is no evidence on whether job satisfaction differs within race by
immigrant status. Our work presents a contribution in this area. Using data from the National
Survey of College Graduates and controlling for detailed individual and job-specific
characteristics, we find little evidence that overall job satisfaction differs between men and
women. Additionally, women are more satisfied than are men with many job aspects including
intellectual challenge and contribution to society. These results, among college graduates who
are expected to have similar expectations, seem to suggest that discrimination is not a major
source of workplace dissatisfaction among women or, at the very least, that the effect of lower
expectations in combination with lower labor force participation among women outweighs the
effect of perceived or actual employment discrimination.
In contrast, we find that, relative to white workers, Asian and black workers have
substantially lower overall job satisfaction, and Asian men and women and black women are less
satisfied with many specific aspects of their jobs. Because we include extensive controls for
individual and job characteristics, omitted variables representing individual heterogeneity or
group-wide differences in values are not likely to account for the large disparities in job
satisfaction. In fact, although inclusion of individual premarket characteristics reduced the
unadjusted Asian and black satisfaction differential relative to whites, the satisfaction gap was
only slightly reduced by inclusion of additional detailed job characteristics information. Thus, for

18
unobserved individual heterogeneity to have an important influence in potentially reducing the
racial satisfaction differential, the omitted characteristics would need to have a stronger influence
on satisfaction than observed characteristics, have a low correlation with observed characteristics
included in the regressions, and would have to be distributed in such a way that white workers
are more satisfied than other workers.
Although we establish that Asian and black workers have lower job satisfaction than their
white counterparts, one limitation of our study is that we are not able to distinguish between
differences in expectations and discrimination as the source of lower job satisfaction. A second
limitation of our study is that only college graduates are represented, which means that the
results may not generalize to the entire labor market. In particular, even though
Hispanics/Latinos in the United States generally fare far worse than whites in terms of education
and earnings, the absence of a job satisfaction differential between whites and Hispanics/Latinos
in this study suggests that college educated Hispanics/Latinos are similar to college educated
whites in their expectations or experience with discrimination.
Because turnover is related to job satisfaction, the lower job satisfaction of Asian and
black workers even in regressions that control for income and fringe benefits suggests that
nondiscrimination in pay may not be sufficient for firms to maintain a diverse workforce.
Employers should consider whether other environmental characteristics are disproportionately
lowering the job satisfaction of Asian and black workers. Future research would benefit from
data that tracks actual turnover as well as provides more information on employers and
employees.
19
References Allen, Jim, and Rolf van der Velden. 2001. Educational Mismatches versus Skill Mismatches: Effects on Wages, Job Satisfaction, and On-the-Job Search. Oxford Economic Papers 53(3): 434–52. Artz, Benjamin. 2012. Does the Impact of Union Experience on Job Satisfaction Differ by Gender? Industrial and Labor Relations Review 65(2): 225–43. Bartel, Ann P. 1981. Race Differences in Job Satisfaction: A Reappraisal. Journal of Human Resources 16(2): 294–303. Bender, Keith A., and Peter J. Sloane. 1998. Job Satisfaction, Trade Unions, and Exit-Voice Revisited. Industrial and Labor Relations Review 51(2): 222–40. Bender, Keith A., Susan M. Donohue, and John S. Heywood. 2005. Job Satisfaction and Gender Segregation. Oxford Economic Papers 57(3): 479–96. Clark, Andrew E. 1997. Job Satisfaction and Gender: Why are Women so Happy at Work? Labour Economics 4(4): 341–72. Clark, Andrew E. 2001. What Really Matters in a Job? Hedonic Measurement Using Quit Data. Labour Economics 8(2): 223–42. Clark, Andrew E., and Andrew J. Oswald. 1996. Satisfaction and Comparison Income. Journal of Public Economics 61(3): 359–81. Clegg, Chris W. 1983. Psychology of Employee Lateness, Absence, and Turnover: A Methodological Critique and an Empirical Study. Journal of Applied Psychology 68(1): 88–101. Donohue, Susan M., and John S. Heywood. 2004. Job Satisfaction and Gender: An Expanded Specification from the NLSY. International Journal of Manpower 25(2): 211–38. Freeman, R. B. 1978. Job Satisfaction as an Economic Variable. American Economic Review 68(2): 135–41. Haile, Getinet Astatike. 2012. Unhappy Working with Men? Workplace Gender Diversity and Job-Related Well-Being in Britain. Labour Economics 19(3): 329–50. Hamermesh, Daniel S. 2001. The Changing Distribution of Job Satisfaction. Journal of Human Resources 36(1): 1–30. Hersch, Joni. 1991. Education Match and Job Match. Review of Economics and Statistics 73(1): 140–44.

20
Hersch, Joni, and Joe A. Stone. 1990. Is Union Job Dissatisfaction Real? Journal of Human Resources 25(4): 736–51. Hirsch, Barry T. 2005. Why Do Part-Time Workers Earn Less? The Role of Worker and Job Skills. Industrial and Labor Relations Review 58(4): 525–51. Hirsch, Barry T., and Julia Manzella. 2015. Who Cares – and Does It Matter? Measuring Wage Penalties for Caring Work. In Research in Labor Economics 41, edited by Solomon W. Polachek, Konstantinos Tatsiramos, and Klaus F. Zimmermann. Bingley, United Kingdom: Emerald Publishing Group, pp. 213–75. Krueger, Alan B., and David Schkade. 2008. Sorting in the Labor Market: Do Gregarious Workers Flock to Interactive Jobs? Journal of Human Resources 43(4): 859–83. Lee, Tae Heon. 2012. Gender Differences in Voluntary Turnover: Still a Paradox? International Business Research 5(10): 19–28. Macpherson, David A., and Barry T. Hirsch. 1995. Wages and Gender Composition: Why Do Women’s Jobs Pay Less? Journal of Labor Economics 13(3): 426–71. Mangione, Thomas W., and Robert P. Quinn. 1975. Job Satisfaction, Counterproductive Behavior, and Drug Use at Work. Journal of Applied Psychology 60(1): 114–16. McGuinness, Seamus, and Delma Byrne. 2014. Examining the Relationships Between Labour Market Mismatches, Earnings and Job Satisfaction Among Immigrant Graduates in Europe. IZA Discussion Paper No. 8440. Mukerjee, Swati. 2014. Job Satisfaction in the United States: Are Blacks Still More Satisfied? Review of Black Political Economy 41(1): 61–81. Ostroff, Cheri. 1992. The Relationship Between Satisfaction, Attitudes and Performance: An Organizational Level Analysis. Journal of Applied Psychology 77(6): 963–74. Sloane, P. J., and H. Williams. 2000. Job Satisfaction, Comparison Earnings, and Gender. Labour 14(3): 473–502. Sousa-Poza, Alfonso, and Andrés A. Sousa-Poza. 2000. Taking Another Look at the Gender/Job-Satisfaction Paradox. Kyklos 53(2): 135–52. Ward, Melanie E., and Peter J. Sloane. 2000. Non-Pecuniary Advantages Versus Pecuniary Disadvantages; Job Satisfaction Among Male and Female Academics in Scottish Universities. Scottish Journal of Political Economy 47(3): 273–303. Westover, Jonathan H. 2012. The Job Satisfaction-Gender Paradox Revisited: A Cross-National Look at Gender Differences in Job Satisfaction, 1989-2005. Journal of Global Responsibility 3(2): 263–77.

21
Table 1. Percentage Reporting Very Satisfied for Overall Job Satisfaction by Sex, Race, and Ethnicity Female Male All N White 48.02 47.67 47.84 38,149 Asian 32.57 36.17** 34.64 10,119 Black 33.20 37.17** 34.83 5,629 Other Race 38.26 41.56 39.80 1,756 Hispanic/Latino 47.16** 40.91 44.23 6,217 All 45.48 45.51 45.50 61,870 N 26,125 35,745 61,870
Authors’ calculations are from the 2010 National Survey of College Graduates. All values are calculated using the NSCG sample weight. Overall job satisfaction equals 1 if very satisfied and 0 if somewhat satisfied, somewhat dissatisfied, or very dissatisfied. Differences in percentages between female and male within race or ethnicity are tested using the Bonferroni comparison test, with asterisks associated with the group with higher value. * significant at 5% level; ** significant at 1% level.

22
Table 2. Differences in Overall Job Satisfaction by Race and Ethnicity Within Sex Panel A: Female (N = 26,125) White Asian Black Other Race Asian -15.46** --- --- --- Black -14.83** 0.63 --- --- Other Race -9.76** 5.69* 5.06 --- Hispanic/Latino -0.86 14.59** 13.96** 8.90**
Panel B: Male (N = 35,745) White Asian Black Other Race Asian -11.50** --- --- --- Black -10.50** 1.00 --- --- Other Race -6.11** 5.39* 4.39 --- Hispanic/Latino -6.76** 4.74** 3.74* -0.65
Authors’ calculations are from the 2010 National Survey of College Graduates. All values are calculated using the NSCG sample weight. Overall job satisfaction equals 1 if very satisfied and 0 if somewhat satisfied, somewhat dissatisfied, or very dissatisfied. The magnitude of the difference between the row variable mean minus the column variable mean is reported. Differences in percentages between race or ethnicity among those of the same sex are tested using the Bonferroni comparison test. * significant at 5% level; ** significant at 1% level.

23
Table 3. Overall Job Satisfaction Regressions – Pooled by Sex
(1) (2) (3) Female 0.013 0.021 0.020
(0.011) (0.012) (0.012) Asian -0.069** -0.065** -0.061**
(0.020) (0.020) (0.021) Black -0.104** -0.105** -0.108**
(0.022) (0.022) (0.022) Other Race -0.050 -0.061 -0.062
(0.039) (0.041) (0.042) Hispanic/Latino 0.006 0.008 0.011
(0.023) (0.023) (0.023) Immigrant -0.083** -0.061** -0.060**
(0.017) (0.017) (0.018) Age -0.007* -0.015** -0.015** Age squared/100 0.012** 0.020** 0.020** Married 0.060** 0.045** 0.044** Children under 18 in household 0.020** 0.015** 0.014* Difficulty with seeing -0.075* -0.077* -0.079* Difficulty with hearing -0.065* -0.061 -0.060 Difficulty with walking 0.004 0.012 0.015 Difficulty with lifting -0.023 -0.007 -0.006 JD 0.068* -0.009 0.036 MD 0.215** 0.044 -0.011 MBA -0.007 -0.044 -0.040 MA not in business 0.081** 0.017 0.012 PhD 0.101** -0.003 -0.021 Log(salary) 0.067** 0.070** Health insurance 0.015 0.016 Pension plan 0.037* 0.039* Profit-sharing plan 0.087** 0.087** Paid vacation, sick, or personal days 0.009 0.005 Log(hours) -0.050** -0.052** Tenure -0.003 -0.003 Tenure squared/100 0.014* 0.013* Supervisor 0.049** 0.041** Government employer 0.127** 0.123** Self-employed 0.049** 0.048** Non-profit employer 0.132** 0.122** Other type of employer 0.040 0.044 Computer, engineering, & science -0.039 -0.096* Education, legal, & community service
-0.022 -0.044
Arts & media -0.059 -0.040
24
Healthcare practitioners & technical 0.022 -0.004 Service -0.132 -0.179 Sales & related -0.063 -0.071 Office & administrative support -0.119** -0.113* Blue-collar -0.160* -0.134 Other occupation -0.034 -0.136 Degree closely related 0.125** 0.122** Degree somewhat related 0.027 0.027 Union percent 0.230 0.343 Female percent -0.078 -0.208 Asian percent 0.261 0.892 Black percent -0.303 -0.221 Other race percent 3.144 6.919 Hispanic percent 0.721 0.809 Communicating with supervisors, peers, or subordinates
-0.021
Communicating with persons outside the organization
-0.022
Establish and maintaining interpersonal relationships
0.062
Perform or working directly with the public
0.001
Provide consultation and advice to others
-0.014
Contact with others -0.097* Work with group or team 0.086** Deal with external customers 0.033 Deal with unpleasant or angry people 0.017 Deal with physically aggressive people
-0.022
Static strength 0.034 Explosive strength -0.004 Dynamic strength -0.087 Trunk strength 0.040 Stamina -0.044 Sounds, noise level are distracting or uncomfortable
-0.022
Very hot or cold temperatures -0.044 Exposed to contaminants 0.040 Exposed to hazardous conditions 0.011 Exposed to hazardous equipment -0.044 Exposed to minor burns, cuts, bites, or stings
0.039
Freedom to make decisions 0.061 Degree of automation 0.011

25
Importance of repeating the same tasks -0.013 Extent of structured work -0.015 Level of competition -0.005 Time pressure -0.036 N 61,870 61,870 59,025 Pseudo R-Squared 0.0263 0.0704 0.0732 Log Likelihood -41511 -39634 -37708
Authors’ calculations are from the 2010 National Survey of College Graduates in conjunction with CPS and O*NET data. All values are calculated using the NSCG sample weight. Overall job satisfaction equals 1 if very satisfied and 0 if somewhat satisfied, somewhat dissatisfied, or very dissatisfied. The values listed are marginal effects from probit estimation using robust standard errors. To save space, standard errors are reported in parentheses only for the coefficients on sex, race, ethnicity, and immigrant status. Firm size and employer location indicators are also included in the regressions reported in columns 2 and 3, but the coefficients are not reported in the table. * significant at 5% level; ** significant at 1% level.

26
Table 4. Overall Job Satisfaction Regressions by Sex Panel A: Female
(1) (2) (3) Asian -0.084** -0.091** -0.086**
(0.030) (0.030) (0.031) Black -0.122** -0.126** -0.134**
(0.028) (0.029) (0.029) Other Race -0.061 -0.066 -0.061
(0.051) (0.052) (0.054) Hispanic/Latino 0.034 0.030 0.033
(0.031) (0.031) (0.031) Demographics yes yes yes Job Characteristics yes yes O*NET Variables yes N 26,125 26,125 25,294 Pseudo R-Squared 0.0327 0.0716 0.0776 Log Likelihood -17414 -16712 -16079
Panel B: Male
(1) (2) (3) Asian -0.059* -0.052* -0.045
(0.026) (0.026) (0.028) Black -0.078* -0.077* -0.077*
(0.034) (0.033) (0.034) Other Race -0.033 -0.054 -0.058
(0.058) (0.060) (0.064) Hispanic/Latino -0.025 -0.028 -0.027
(0.032) (0.032) (0.033) Demographics yes yes yes Job Characteristics yes yes O*NET Variables yes N 35,745 35,745 33,731 Pseudo R-Squared 0.0236 0.0837 0.0868 Log Likelihood -24051 -22572 -21239
Authors’ calculations are from the 2010 National Survey of College Graduates in conjunction with CPS and O*NET data. All values are calculated using the NSCG sample weight. Overall job satisfaction equals 1 if very satisfied and 0 if somewhat satisfied, somewhat dissatisfied, or very dissatisfied. The values listed are marginal effects from probit estimation with robust standard errors in parentheses. The regressions in column 1 also include age, marital status, children, immigrant status, health limitations, and highest degree. Column 2 adds log of real annual salary, fringe benefits, log of usual hours worked, tenure, supervisor status, firm size, type of employer, employer location, occupation categories, job’s relation to highest degree, percent union, percent female, and percent of race/ethnicity. Column 3 adds O*NET occupational characteristics. * significant at 5% level; ** significant at 1% level.

27
Table 5. Labor Force Participation Rates by Sex, Race, and Ethnicity Panel A: By Sex Female Male White 77.89 86.90** Asian 76.05 90.43** Black 87.01 86.80 Other Race 81.13 91.65** Hispanic/Latino 83.46 89.95** All 78.94 87.49** N 33,849 43,339
Panel B: By Race (Significance Relative to White) White Asian Black Other Race Hispanic/Latino Female 77.89 76.05* 87.01** 81.13 83.46** Male 86.90 90.43** 86.80 91.65** 89.95** All 82.27 83.57** 86.92** 85.63** 86.35** N 48,012 12,378 7,080 2,185 7,533
Authors’ calculations are from the 2010 National Survey of College Graduates. All values are calculated using the NSCG sample weight. Differences in percentages between female and male and between white and another race or ethnicity are tested using the Bonferroni comparison test. * significant at 5% level; ** significant at 1% level.

28
Table 6. Overall Job Satisfaction Regressions Accounting for Immigrant Status Within Race
All Female Male Female 0.021
(0.012) White – Immigrant -0.058* -0.059 -0.061*
(0.023) (0.035) (0.029) Asian – Native U.S. -0.059 -0.109* -0.019
(0.034) (0.044) (0.049) Asian – Immigrant -0.119** -0.145** -0.099**
(0.019) (0.031) (0.023) Black – Native U.S. -0.111** -0.135** -0.080*
(0.024) (0.030) (0.039) Black – Immigrant -0.145** -0.180* -0.113
(0.050) (0.073) (0.066) Other Race – Native U.S. -0.058 -0.055 -0.059
(0.045) (0.057) (0.069) Other Race – Immigrant -0.149 -0.163 -0.106
(0.107) (0.144) (0.112) Hispanic/Latino – Native U.S. 0.014 0.047 -0.045
(0.027) (0.036) (0.039) Hispanic/Latino – Immigrant -0.056 -0.077 -0.043
(0.040) (0.055) (0.057) N 59,025 25,294 33,731 Pseudo R-Squared 0.0733 0.0777 0.0870 Log Likelihood -37707 -16076 -21235
Authors’ calculations are from the 2010 National Survey of College Graduates in conjunction with CPS and O*NET data. All values are calculated using the NSCG sample weight. Overall job satisfaction equals 1 if very satisfied and 0 if somewhat satisfied, somewhat dissatisfied, or very dissatisfied. The values listed are marginal effects from probit estimation with robust standard errors in parentheses. All regressions also include age, marital status, children, immigrant status, health limitations, highest degree, log of real annual salary, fringe benefits, log of usual hours worked, tenure, supervisor status, firm size, type of employer, employer location, occupation categories, job’s relation to highest degree, percent union, percent female, percent of race/ethnicity, and O*NET occupational characteristics. * significant at 5% level; ** significant at 1% level.

29
Table 7. Different Aspects of Job Satisfaction Dependent Variable: Satisfaction with…
Female
Asian
Black
Other Race
Hispanic/ Latino
Salary 0.009 -0.049** -0.054** -0.056 -0.013 (0.011) (0.017) (0.019) (0.032) (0.019)
Benefits 0.014 -0.092** -0.032 -0.057 0.002 (0.012) (0.019) (0.022) (0.036) (0.022)
Job Security -0.011 -0.031 -0.059** -0.001 -0.010 (0.012) (0.020) (0.022) (0.039) (0.023)
Job Location 0.037** -0.027 -0.064** -0.045 0.028 (0.012) (0.020) (0.023) (0.038) (0.021)
Opportunities for Advancement 0.026* 0.009 -0.006 -0.028 0.008 (0.010) (0.018) (0.019) (0.032) (0.019)
Intellectual Challenge 0.056** -0.027 -0.070** -0.032 0.006 (0.012) (0.021) (0.023) (0.037) (0.023)
Level of Responsibility 0.061** -0.060** -0.063** -0.050 0.013 (0.012) (0.021) (0.024) (0.036) (0.024)
Degree of Independence 0.015 -0.097** -0.060** -0.043 -0.031 (0.012) (0.021) (0.023) (0.039) (0.023)
Contribution to Society 0.036** -0.075** -0.024 -0.007 -0.005 (0.013) (0.022) (0.024) (0.041) (0.024)
Each row represents a different regression. N = 59,025 for all regressions. Authors’ calculations are from the 2010 National Survey of College Graduates in conjunction with CPS and O*NET data. All values are calculated using the NSCG sample weight. Each job satisfaction measure equals 1 if very satisfied and 0 if somewhat satisfied, somewhat dissatisfied, or very dissatisfied. The values listed are marginal effects from probit estimation with robust standard errors in parentheses. All regressions also include age, marital status, children, immigrant status, health limitations, highest degree, log of real annual salary, fringe benefits, log of usual hours worked, tenure, supervisor status, firm size, type of employer, employer location, occupation categories, job’s relation to highest degree, percent union, percent female, percent of race/ethnicity, and O*NET occupational characteristics. * significant at 5% level; ** significant at 1% level.
30
Table 8. Different Aspects of Job Satisfaction by Sex Panel A: Females (N = 25,294) Dependent Variable: Satisfaction with…
Asian
Black
Other Race
Hispanic/ Latino
Salary -0.051* -0.054* -0.098** -0.010 (0.026) (0.023) (0.028) (0.024)
Benefits -0.119** -0.037 -0.080 -0.018 (0.028) (0.028) (0.047) (0.030)
Job Security -0.073* -0.084** -0.009 -0.013 (0.030) (0.030) (0.053) (0.031)
Job Location -0.001 -0.062* -0.076 0.033 (0.031) (0.030) (0.053) (0.029)
Opportunities for Advancement -0.014 -0.017 -0.065 0.024 (0.026) (0.024) (0.036) (0.027)
Intellectual Challenge -0.045 -0.105** -0.092 0.056 (0.033) (0.030) (0.047) (0.032)
Level of Responsibility -0.088** -0.065* -0.093 0.025 (0.033) (0.031) (0.050) (0.032)
Degree of Independence -0.089** -0.072* -0.031 -0.024 (0.032) (0.031) (0.051) (0.031)
Contribution to Society -0.132** -0.064* -0.015 -0.013 (0.035) (0.031) (0.060) (0.034)
Panel B: Males (N = 33,731) Dependent Variable: Satisfaction with…
Asian
Black
Other Race
Hispanic/ Latino
Salary -0.048* -0.049 0.005 -0.021 (0.024) (0.031) (0.054) (0.028)
Benefits -0.072** -0.022 -0.028 0.019 (0.025) (0.035) (0.054) (0.033)
Job Security 0.008 -0.013 0.003 -0.011 (0.028) (0.033) (0.056) (0.033)
Job Location -0.051 -0.050 0.004 0.015 (0.027) (0.034) (0.056) (0.032)
Opportunities for Advancement 0.035 0.016 0.028 -0.011 (0.024) (0.029) (0.051) (0.027)
Intellectual Challenge -0.013 -0.027 0.042 -0.059 (0.027) (0.033) (0.052) (0.032)
Level of Responsibility -0.042 -0.052 0.007 -0.010 (0.027) (0.035) (0.050) (0.034)
Degree of Independence -0.105** -0.042 -0.051 -0.041 (0.027) (0.033) (0.058) (0.032)
Contribution to Society -0.020 0.040 0.008 -0.003 (0.029) (0.035) (0.055) (0.033)

31
Each row represents a different regression. Authors’ calculations are from the 2010 National Survey of College Graduates in conjunction with CPS and O*NET data. All values are calculated using the NSCG sample weight. Each job satisfaction measure equals 1 if very satisfied and 0 if somewhat satisfied, somewhat dissatisfied, or very dissatisfied. The values listed are marginal effects from probit estimation with robust standard errors in parentheses. All regressions also include age, marital status, children, immigrant status, health limitations, highest degree, log of real annual salary, fringe benefits, log of usual hours worked, tenure, supervisor status, firm size, type of employer, employer location, occupation categories, job’s relation to highest degree, percent union, percent female, percent of race/ethnicity, and O*NET occupational characteristics. * significant at 5% level; ** significant at 1% level.
32
Appendix 1. Construction of Sample All Female Male Initial sample 77,188 33,849 43,339 Not employed in survey week -14,906 -7,574 -7,332 Missing salary or reporting zero salary -342 -134 -208 Employer location not in United States -70 -16 -54 Final sample size for regressions without O*NET variables
61,870 26,125 35,745
Missing O*NET variables -2,845 -831 -2,014 Final sample size for regressions with O*NET variables 59,025 25,294 33,731
Authors’ calculations are from the 2010 National Survey of College Graduates in conjunction with CPS and O*NET data.

33
Appendix 2. Demographics and Job Characteristics Descriptive Statistics by Sex All Female Male
Demographics Female (%) 49.20 --- --- White (%) 76.18 75.18 77.15** Asian (%) 7.88 6.81 8.91** Black (%) 6.79 8.13** 5.51 Other Race (%) 2.01 2.18** 1.85 Hispanic/Latino (%) 7.14 7.70** 6.59 Immigrant (%) 13.57 11.79 15.31** Age 44.10 43.11 45.06** Married (%) 72.96 68.12 77.65** Children under 18 in household 0.79 0.74 0.84** Difficulty with seeing (%) 3.73 3.71 3.75 Difficulty with hearing (%) 2.64 1.54 3.70** Difficulty with walking (%) 1.12 1.05 1.18 Difficulty with lifting (%) 1.36 1.65** 1.09 JD (%) 3.40 2.89 3.89** MD (%) 2.72 1.74 3.66** MBA (%) 3.91 2.70 5.07** MA not in business (%) 23.25 26.43** 20.16 PhD (%) 3.71 2.62 4.76** No graduate degree (%) 63.02 63.62** 62.45
Job Characteristics Salary ($) 71,675 55,538 87,303** Log(salary) 10.83 10.59 11.07** Predicted salary using full sample ($) 71,675 55,538 87,303** Predicted salary using white males ($) 78,895 67,332 90,092** Health insurance (%) 79.91 78.16 81.60** Pension plan (%) 68.79 69.21* 68.39 Profit-sharing plan (%) 24.58 21.55 27.51** Paid vacation, sick, or personal days (%) 80.18 79.96 80.40 Log(hours) 3.67 3.58 3.75** Tenure (years) 7.80 7.04 8.53** Supervisor (%) 39.89 31.67 49.95** 10 or fewer employees (%) 15.09 12.79 17.32** 11 to 24 employees (%) 6.05 5.94 6.16 25 to 99 employees (%) 10.93 11.31** 10.57 100 to 499 employees (%) 15.49 16.39** 14.62 500 to 999 employees (%) 7.69 9.27** 6.17 1,000 to 4,999 employees (%) 15.45 16.48** 14.45 5,000 to 24,999 employees (%) 13.13 13.41* 12.86 25,000 and more employees (%) 16.17 14.42 17.86** Government employer (%) 27.64 33.88** 21.60

34
All Female Male Self-employed (%) 19.86 16.60 23.01** Non-profit employer (%) 13.27 17.77** 8.91 For-profit employer (%) 38.97 31.49 46.22** Other employer type (%) 0.26 0.26 0.26 New England (%) 6.12 5.85 6.39** Middle Atlantic (%) 14.47 14.97** 13.97 East North Central (%) 14.82 14.71 14.93 West North Central (%) 7.43 7.74** 7.12 South Atlantic (%) 19.41 19.35 19.46 East South Central (%) 4.67 4.70 4.64 West South Central (%) 9.03 8.84 9.21 Mountain (%) 6.76 6.79 6.74 Pacific (%) 17.30 17.04 17.54 Management, business, & financial (%) 26.54 20.75 32.16** Computer, engineering, & science (%) 15.20 8.47 21.73** Education, legal, & community service (%) 23.31 31.36** 15.52 Arts & media (%) 2.71 3.11** 2.33 Healthcare practitioners & technical (%) 10.32 14.31** 6.46 Service (%) 4.62 4.40 4.83* Sales & related (%) 7.39 6.42 8.32** Office & administrative support (%) 5.66 8.95** 2.48 Blue-collar (%) 3.39 1.23 5.47** Other occupation (%) 0.85 1.01** 0.70 Degree closely related (%) 56.01 58.33** 53.77 Degree somewhat related (%) 23.64 20.23 26.95** Degree not related (%) 20.35 21.44** 19.28 Union percent+ (%) 12.74 15.15** 10.40 Female percent+ (%) 54.61 62.54** 46.92 White percent+ (%) 76.42 75.54 77.27** Asian percent+ (%) 5.03 4.61 5.44** Black percent+ (%) 8.58 9.53** 7.65 Other race percent+ (%) 2.25 2.32** 2.17 Hispanic/Latino percent+ (%) 7.72 8.00** 7.46 N 61,870 26,125 35,745
Authors’ calculations are from the 2010 National Survey of College Graduates in conjunction with CPS. All values are calculated using the NSCG sample weight. + signifies that the variable is created from the CPS, and the variable’s mean is calculated across individuals in the NSCG. Differences between female and male are tested using the Bonferroni comparison test. * significant at 5% level; ** significant at 1% level.

35
Appendix 3. Demographics and Job Characteristics Descriptive Statistics by Race or Ethnicity
White
Asian
Black Other Race
Hispanic/ Latino
Demographics Female (%) 48.55 42.53** 58.84** 53.35** 53.09** Immigrant (%) 5.04 80.91** 15.03** 10.72** 29.73** Age 44.79 41.65** 43.10** 40.55** 41.47** Married (%) 75.27 75.68 53.68** 63.48** 66.43** Children under 18 in household 0.77 0.76 0.91** 0.77 0.90** Difficulty with seeing (%) 3.37 3.47 5.42** 3.26 6.34** Difficulty with hearing (%) 2.96 1.60** 1.11** 2.45 1.84** Difficulty with walking (%) 1.05 0.77 2.36** 2.73** 0.63* Difficulty with lifting (%) 1.12 1.55** 3.00** 3.63** 1.60* JD (%) 3.77 1.47** 2.07** 3.88 2.66** MD (%) 2.55 5.32** 1.58** 2.82 2.71 MBA (%) 3.76 4.11 6.32** 2.74 3.26 MA not in business (%) 23.39 24.68 24.46 18.02** 20.46** PhD (%) 3.53 7.61** 2.75* 2.38 2.65** No graduate degree (%) 63.01 56.82 62.81 70.15 68.25
Job Characteristics Salary ($) 72,917 77,826** 63,423** 65,833** 61,127** Log(salary) 10.84 10.97** 10.70** 10.85 10.70** Predicted salary full sample ($) 72,917 77,826** 63,423** 65,833** 61,127** Predicted salary white males ($) 78,248 92,540** 74,180** 73,136** 76,858 Health insurance (%) 79.12 80.39* 85.47** 82.89** 81.69** Pension plan (%) 68.70 63.64** 75.93** 67.93 68.95 Profit-sharing plan (%) 24.02 25.75** 28.45** 19.01** 27.22** Paid vacation, sick, or personal days (%)
79.49 80.29 84.12** 85.52** 82.25**
Log(hours) 3.66 3.68* 3.66 3.69 3.67 Tenure (years) 8.16 6.46** 6.67** 6.63** 6.86** Supervisor (%) 40.92 37.02** 37.98** 37.97 34.45** 10 or fewer employees (%) 16.05 13.82** 8.40** 15.98 12.34** 11 to 24 employees (%) 6.30 5.95 2.99** 8.45** 5.79 25 to 99 employees (%) 11.40 9.73** 8.11** 10.02 10.25 100 to 499 employees (%) 15.99 12.53** 17.33 16.96 11.32** 500 to 999 employees (%) 7.74 7.12 8.00 4.66** 8.34 1,000 to 4,999 employees (%) 15.22 15.36 16.74* 13.66 17.24** 5,000 to 24,999 employees (%) 12.70 13.51 14.36** 12.68 16.18** 25,000 and more employees (%) 14.60 21.97** 24.06** 17.59** 18.54** Government employer (%) 26.74 19.42** 39.39** 31.28** 34.02** Self-employed (%) 20.57 21.16 13.79** 16.42** 17.56** Non-profit employer (%) 13.61 10.55** 14.31 15.38 11.04**

36
White
Asian
Black
Other Race
Hispanic/ Latino
For-profit employer (%) 38.96 48.25** 32.06** 35.93 36.30** Other employer type (%) 0.11 0.62** 0.45** 1.00** 1.07** New England (%) 6.98 4.30** 2.80** 3.66** 2.79** Middle Atlantic (%) 14.63 17.65** 14.77** 10.67 9.94** East North Central (%) 16.53 10.63** 11.32** 10.59** 5.71** West North Central (%) 8.82 2.61** 3.47** 5.10** 2.26** South Atlantic (%) 18.45 13.67** 37.49** 23.15** 17.66 East South Central (%) 5.08 1.55** 8.41** 1.62** 1.06** West South Central (%) 8.18 7.91 10.69** 11.72** 16.99** Mountain (%) 7.55 3.07** 1.80** 5.52** 7.54 Pacific (%) 13.77 38.61** 9.26** 27.96** 36.05** Management, business, & financial (%)
27.12 22.33** 26.37 28.14 24.78**
Computer, engineering, & science (%)
14.06 33.87** 10.96** 13.56 11.34**
Education, legal, & community service (%)
24.18 8.76** 27.76** 22.14 26.20**
Arts & media (%) 2.97 1.14** 2.11** 2.22 2.37 Healthcare practitioners & technical (%)
9.91 15.99** 9.30 9.86 9.57
Service (%) 4.37 3.75 6.28** 4.98 6.58** Sales & related (%) 7.78 5.52** 4.97** 6.71 7.77 Office & administrative support (%) 5.19 6.36** 8.05** 9.45** 6.56** Blue-collar (%) 3.50 1.81** 3.34 2.53 4.16 Other occupation (%) 0.92 0.46** 0.85 0.41 0.66 Degree closely related (%) 55.79 59.15** 53.08** 55.89 57.74* Degree somewhat related (%) 23.76 23.41 23.82 23.09 22.60 Degree not related (%) 20.45 17.44** 23.10** 21.01 19.66 Union percent+ (%) 12.89 9.46** 13.74** 12.03* 13.91** Female percent+ (%) 54.75 49.92** 57.06** 55.17 55.73** White percent+ (%) 76.58 75.78** 75.57** 76.54 76.21** Asian percent+ (%) 4.93 6.56** 4.77** 4.86 4.72** Black percent+ (%) 8.51 8.28** 9.37** 8.55 8.82** Other race percent+ (%) 2.25 2.16** 2.32** 2.25 2.29** Hispanic/Latino percent+ (%) 7.73 7.21** 7.96** 7.79 7.96** N 38,149 10,119 5,629 1,756 6,217
Authors’ calculations are from the 2010 National Survey of College Graduates in conjunction with CPS. All values are calculated using the NSCG sample weight. + signifies that the variable is created from the CPS, and the variable’s mean is calculated across individuals in the NSCG. Differences between white and another race or ethnicity are tested using the Bonferroni comparison test. * significant at 5% level; ** significant at 1% level.