Embed Size (px)
Citation preview

fphys-10-00295 March 22, 2019 Time: 11:52 # 1
ORIGINAL RESEARCHpublished: 22 March 2019
doi: 10.3389/fphys.2019.00295
Edited by:Luca Paolo Ardigò,
University of Verona, Italy
Reviewed by:Boye Welde,
UiT The Arctic University of Norway,Norway
Mikael Swarén,Royal Institute of Technology, Sweden
Gerald Allen Smith,Colorado Mesa University,
United States
*Correspondence:Erik Petrus Andersson
Specialty section:This article was submitted to
Exercise Physiology,a section of the journalFrontiers in Physiology
Received: 20 December 2018Accepted: 06 March 2019Published: 22 March 2019
Citation:Andersson EP, Govus A,
Shannon OM and McGawley K (2019)Sex Differences in Performance
and Pacing Strategies DuringSprint Skiing. Front. Physiol. 10:295.
doi: 10.3389/fphys.2019.00295
Sex Differences in Performance andPacing Strategies DuringSprint SkiingErik Petrus Andersson1* , Andrew Govus1,2, Oliver Michael Shannon3 andKerry McGawley1
1 Swedish Winter Sports Research Centre, Department of Health Sciences, Mid Sweden University, Östersund, Sweden,2 Department of Rehabilitation, Nutrition and Sport, La Trobe University, Melbourne, VIC, Australia, 3 Human NutritionResearch Centre, Institute of Cellular Medicine, Newcastle University, Newcastle upon Tyne, United Kingdom
Purpose: This study aimed to compare performance and pacing strategies betweenelite male and female cross-country skiers during a sprint competition on snow usingthe skating technique.
Methods: Twenty male and 14 female skiers completed an individual time-trial prolog(TT) and three head-to-head races (quarter, semi, and final) on the same 1,572-m course, which was divided into flat, uphill and downhill sections. Section-specificspeeds, choice of sub-technique (i.e., gear), cycle characteristics, heart rate and post-race blood lactate concentration were monitored. Power output was estimated for thedifferent sections during the TT, while metabolic demand was estimated for two uphillcamera sections and the final 50-m flat camera section.
Results: Average speed during the four races was ∼12.5% faster for males thanfemales (P < 0.001), while speeds on the flat, uphill and downhill sections were ∼11,18, and 9% faster for the males than females (all P < 0.001 for terrain, sex, andinteraction). Differences in uphill TT speed between the sexes were associated withdifferent sub-technique preferences, with males using a higher gear more frequently thanfemales (P < 0.05). The estimated metabolic demand relative to maximal oxygen uptake(V̇O2max) was similar for both sexes during the two uphill camera sections (∼129% ofV̇O2max) and for the final 50-m flat section (∼153% of V̇O2max). Relative power outputduring the TT was 18% higher for males compared to females (P < 0.001) and washighly variable along the course for both sexes (coefficient of variation [CV] betweensections 4–9 was 53%), while the same variation in heart rate was low (CV was ∼3%).The head-to-head races were ∼2.4% faster than the TT for both sexes and most racewinners (61%) were positioned first already after 30 m of the race. No sex differenceswere observed during any of the races for heart rate or blood lactate concentration.
Conclusion: The average sex difference in sprint skiing performance was ∼12.5%,with varying differences for terrain-specific speeds. Moreover, females skied relativelyslower uphill (at a lower gear) and thereby elicited more variation in their speed profilescompared to the males.
Keywords: cross-country skiing, elite athletes, head-to-head, metabolic demand, power output, time-trial
Frontiers in Physiology | www.frontiersin.org 1 March 2019 | Volume 10 | Article 295

fphys-10-00295 March 22, 2019 Time: 11:52 # 2
Andersson et al. Pacing and Performance in Sprint Skiing
INTRODUCTION
Cross-country sprint ski competitions are conducted over 3–4 h and involve an initial qualification time trial (a prolog)followed by three head-to-head knockout races (the quarter-finals, semi-finals, and final), with each race lasting ∼2–4 min(Andersson et al., 2016). Unlike other head-to-head endurancesports that require races to be completed successively on thesame day (e.g., swimming, track athletics, or track cycling), thequalification race within a sprint skiing competition is conductedas a time trial, and therefore without direct contact withopponents. The subsequent head-to-head knockout races theninvolve six athletes competing together. A further distinctionwithin cross-country sprint ski racing is the undulating terrain,which results in the use of several different sub-techniques withinthe two separate disciplines of classic and skate skiing (Stögglet al., 2007; Andersson et al., 2010). These factors influencethe athlete’s distribution of both power output and energeticresources during sprint skiing races (Andersson et al., 2016;Swarén and Eriksson, 2017), thereby creating unique challengesin terms of optimizing pacing strategies (Sundström et al., 2013;Andersson et al., 2016).
Swarén and Eriksson (2017) analyzed one female and onemale cross-country skier and demonstrated highly variablespeed and power output profiles during a sprint skiing timetrial using the classic technique. The highest power outputswere generated at the beginning of steep uphills, while thedownhill gliding sections involved no active generation of poweroutput. Hence, sprint cross-country skiing is highly intermittent,involving periods of very high-intensity exercise interspersedwith periods of lower-intensity exercise or recovery. This differsmarkedly from swimming, track running and track cyclingevents lasting ∼2–4 min, which are typically characterized bymore even speed and/or power-output distributions (Corbettet al., 2009; Hanon and Thomas, 2011; Skorski et al., 2014).Instead, the intensity profile in cross-country skiing is moresimilar to the demands of cross-country mountain bikingand road cycling over undulating terrain. In cycling, highpower outputs are typical during uphills and power outputprofiles are intermittent over the course of a race, indicatinga variable, terrain-specific pacing strategy (Jeukendrup et al.,2000; Abbiss et al., 2013). However, to date, there is noinformation relating to the power output distributions andsimultaneous heart rate responses during a sprint skiing time trialon snow. Such information is likely important when planningtraining, preparing to race, and evaluating performance in cross-country skiing.
Previous studies have shown that performance and pacingstrategies are different when athletes perform individually(i.e., during time-trial races) compared to when they comeinto direct contact with an opponent (i.e., during head-to-head races) (Corbett et al., 2012; Konings et al., 2016).For performance outdoors, this is at least partly due to theadvantages associated with drafting, whereby power outputand energy cost are substantially lower for the same speedwhen sheltered in the slipstream of an opponent (Bilodeauet al., 1994; Brisswalter and Hausswirth, 2008). Due to a
reduced effect of drafting at lower speeds (Brisswalter andHausswirth, 2008), it is logical to assume that a relativeincrease in effort and therefore speed is likely to occurduring uphill sections of head-to-head races for any athleteattempting a breakaway. In addition, positioning andmaximal speed capacities may be of crucial importanceduring knockout races in sprint skiing, especially inhead-to-head situations when approaching the finishingstraight. However, there is currently no informationregarding differences in pacing strategies between a timetrial and the head-to-head races in sprint cross-countryskiing, or regarding positioning and performance duringhead-to-head sprint races.
In middle-distance track running, males appear to be ∼12%faster than females under race conditions (Coast et al., 2004;Cheuvront et al., 2005). In elite cross-country sprint skiers,Sandbakk et al. (2014) observed a sex difference in peakspeed during an incremental treadmill test of 17% when usingthe skating technique. In contrast to track running, however,the characteristics of cross-country skiing are distinguished byseveral different sub-techniques involving upper- and lower-body muscle groups operating in various combinations. Thesedifferent sub-techniques are referred to as “gears” (G) and thechoice of gear is highly related to skiing speed, with slowerskiers using lower gears during skating. The two main sub-techniques employed during uphill ski-skating are G2 andG3, where G2 is an asymmetrical sub-technique involvingone poling action over every second leg stroke and G3is a symmetrical sub-technique involving one poling actionfor each leg stroke (Andersson et al., 2010). Therefore, itis likely that the slower female skiers would use a higherpercentage of G2 than G3 during uphill skiing and as aresult, use the upper body to a lower relative extent thanmales (Kvamme et al., 2005). As well as on uphill terrain,G3 is also employed on level terrain. The G4 sub-techniqueis mainly applied on level terrain and slight downhills andinvolves one poling movement for two leg strokes. The actionof skating without poling is referred to as G5 and is performedat high speeds on level and slight downhill terrain, with thebody in a relatively crouched position to reduce air drag(Andersson et al., 2010).
Although studies evaluating cross-country skiing performancein the laboratory have revealed performance differences betweenmales and females, no study appears to have comparedperformance and pacing strategies in a group of elite maleand female skiers during a sprint skiing competition on snow.Thus, the aim of the current study was to describe elite cross-country skiers’ sprint skiing performance using an ecologicallyvalid yet experimentally controlled approach. It was hypothesizedthat: (1) male skiers would perform significantly faster thanfemale skiers and that this difference would be augmented duringuphill skiing; (2) the skiers would utilize a variable terrain-specific pacing strategy, whereby the greatest power outputswould be attained on the uphill sections; (3) the average speedwould be faster during the head-to-head races compared tothe time-trial, with different speed profiles characterizing thetwo types of races.
Frontiers in Physiology | www.frontiersin.org 2 March 2019 | Volume 10 | Article 295

fphys-10-00295 March 22, 2019 Time: 11:52 # 3
Andersson et al. Pacing and Performance in Sprint Skiing
MATERIALS AND METHODS
ParticipantsThirty-four elite cross-country skiers were recruited for thisstudy, which was pre-approved by the Regional Ethical ReviewBoard of Umeå University, Umeå, Sweden (#2016-443-31M) andconducted in accordance with the Declaration of Helsinki. Allparticipants were informed of the nature of the study beforeproviding written consent to participate. Three participantswere aged <18 years, thus written consent was also providedby a parent or guardian. Of the 34 recruited skiers, 32 weremembers of the Swedish national senior and junior teams andtwo (both male) were previous members of the senior nationalteam. Twenty of the skiers were male (age: 23.1 ± 4.4 years,height: 182.8 ± 6.9 cm, body mass: 75.7 ± 7.7 kg) and 14were female (age: 21.4 ± 3.3 years, height: 171.3 ± 4.8 cm,body mass: 64.4 ± 5.2 kg). According to the International SkiFederation (FIS) ranking points system, the males and femaleshad 86.9 ± 42.1 and 89.7 ± 53.1 sprint points, respectively, and61.6 ± 30.9 and 77.3 ± 27.8 distance points (FIS, 2016). TheFIS ranking system is based on a zero-point standard set bythe top-ranked skier in the world, thus the best skiers have thelowest FIS points.
Study OverviewThe cross-country sprint skiing competition was organized by theSwedish Ski Association and was designed to simulate World Cupcompetition conditions. Unlike real-world sprint racing, all skierscompleted all four races of the competition, i.e., the individualtime-trial prolog (TT) and the head-to-head quarter-final (QF),semi-final (SF) and final (F). The race was 1,572 m for both malesand females and involved the ski-skating technique. Skiers wereinstructed to warm up and compete exactly as they normallywould during a regular sprint skiing competition. Rest periodsbetween races simulated real-world racing conditions and theskier’s overall sprint performance was defined as time taken tocomplete all four races. Heart rate was recorded continuouslyfrom the beginning of the warm-up prior to the TT until the endof the cool-down after the full competition.
Equipment and Measurements Duringthe Preliminary Laboratory TestWithin 1 month prior to the study, maximal oxygen uptake(V̇O2max) was determined using an uphill (7◦), diagonal-stride,roller-skiing time-trial test on a treadmill (Rodby InnovationAB, Vänge, Sweden) over a distance of 700 and 800 m forfemales and males, respectively, as a part of their regularphysiological monitoring (McGawley and Holmberg, 2014). Theparticipants used Pro-Ski C2 roller skis (Sterners SpecialfabrikAB, Dala-Järna, Sweden) equipped with the NNN (RottefellaAS, Klockarstua, Norway) binding system. The coefficient ofrolling resistance was measured to 0.023. The participants usedtheir own ski poles, which were equipped with carbide tipsdesigned for treadmill skiing. For safety reasons, each skier worea safety harness around their waist that was suspended fromthe ceiling and connected to an emergency brake. Participants
controlled the speed of the treadmill by adjusting their positionon the belt (Swarén et al., 2013). Respiratory variables weremeasured using an ergospirometry system (AMIS 2001 modelC, Innovision AS, Odense, Denmark) and the V̇O2max duringthe time trial was based on the highest 30-s moving average.The V̇O2max and maximum heart rate during the time-trialwas 72.7 ± 4.5 mL kg−1 min−1 (5.5 ± 0.5 L min−1) and188 ± 5 beats min−1, respectively, for the male skiers (n = 17),and 59.8 ± 3.7 mL kg−1
·min−1 (3.9 ± 0.4 L min−1) and188± 8 beats min−1 for the female skiers (n = 12).
Equipment and Measurements Duringthe Field TestingSkiing Equipment, Blood Lactate, and Heart RateThe skiers used their own racing skis, boots, and poles with atotal mass of 3.2 ± 0.2 kg. The temperature of the snow was 0◦Cand the ambient temperature was 1.0 ± 0.1◦C, calculated fromthree measurements taken∼2 min before, approximately halfwaythrough and∼5 min after the competition. The dynamic frictioncoefficient between ski and snow was estimated to µ = 0.045,representing a typical value for a snow surface temperature of 0◦C(Colbeck, 1994, unpublished data; Buhl et al., 2001). All skis wereselected and prepared for prevailing snow conditions by a team ofprofessional ski technicians using the same stone grind and glide-wax (Briko Maplus Med Base). The skis were glide tested overa 36-m downhill section four times for each ski pair by the skitechnicians prior to and after the race. The glide time for all testedski pairs (based on the average time for each pair and excludingthe most deviating time) was 4.74 ± 0.04 s prior to the race and4.80± 0.04 s after the race.
Participants’ height and body mass, as well as equipmentmass, were measured in the morning prior to the sprintcompetition using an electronic measuring and weighing station(Seca 764, Hamburg, Germany). Blood samples (20 µl) weretaken from the fingertip 1–3 min after each race and wereanalyzed for the determination of blood lactate concentrationwithin 60 min of sampling (Biosen S-line, EKF diagnostic GmbH,Magdeburg, Germany). The Biosen system was calibrated with astandard solution of lactate (12 mmol L−1) prior to the analysis.The participants used their own heart rate monitors set at asampling frequency of 1 Hz, including sports watches from Polar(M400, M600, and V800; Polar Electro Oy, Kempele, Finland),Garmin (645, 935, 735XT, 920 XT; Garmin, Ltd., Olathe, KS,United States) and Suunto (Spartan Sport Wrist HR SportsWatch; Suunto Oy, Vanda, Finland). Heart rate was expressedas a percent of the race-day peak value, which was calculated asthe highest 1-s heart rate value measured during any of the raceson the race-day. Missing heart rate data for two male and threefemale skiers, due to technical problems, resulted in available datafor n = 18 males and n = 11 females.
Course ProfileThe sprint course included 56% of flat or undulating terrain,22% of uphill terrain and 22% of downhill terrain divided intonine different sections (S1–S9), as illustrated in Figure 1A. Theuphill and downhill sections were characterized by a minimumelevation difference of 5 m within the section, while sections
Frontiers in Physiology | www.frontiersin.org 3 March 2019 | Volume 10 | Article 295

fphys-10-00295 March 22, 2019 Time: 11:52 # 4
Andersson et al. Pacing and Performance in Sprint Skiing
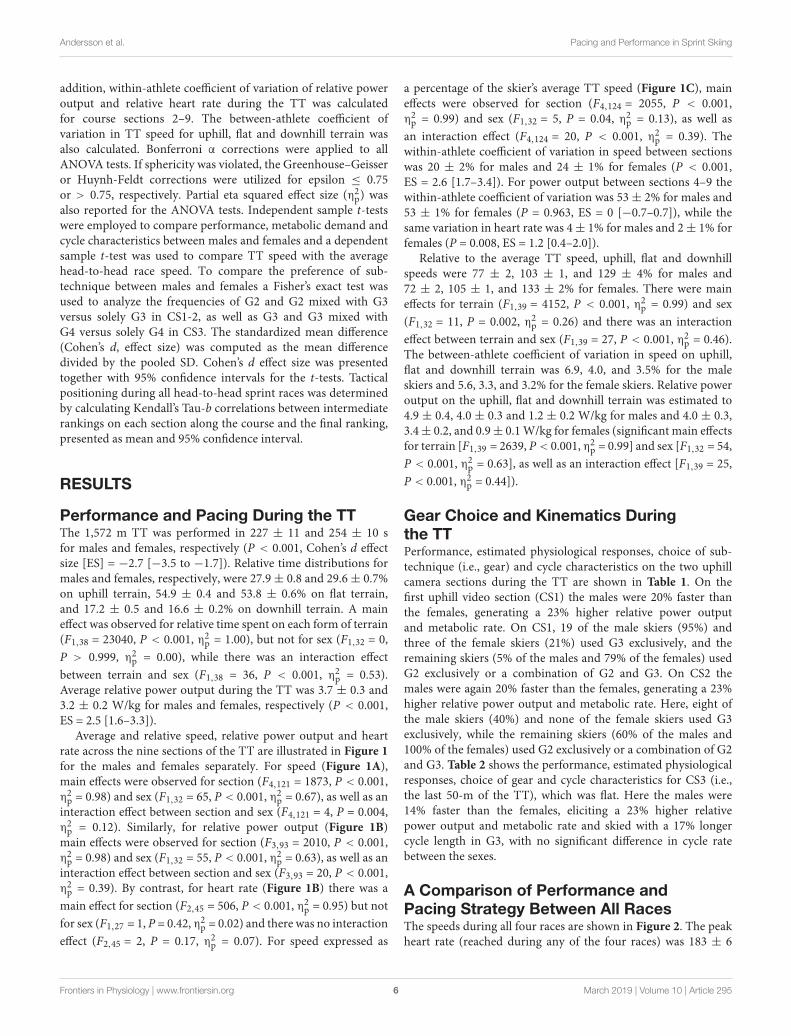
FIGURE 1 | (A) Average skiing speeds over the different course sections(S1–S9) during the time trial (TT) race for male (n = 20) and female (n = 14)skiers, together with the course profile. The solid vertical lines represent thenine different sections and the dashed vertical lines represent the threecamera sections (CS1–3). (B) Average relative power output (males: n = 20;and females: n = 14) over the different sections together with heart rate (HR)(females: n = 11, males: n = 18) during the TT. (C) Speed plotted as apercentage of the average (avg) TT speed over the different sections and thebetween-athlete coefficient of variation (CV) for this relative speed.
with a total ascent or descent of <5 m were defined as flator undulating. The course consisted of three uphill sections(S3 [83 m], S4 [178 m], and S7 [74 m]), with mean inclinesof 3.9, 3.1, and 3.7◦, respectively. There were two downhillsections (S5 [89 m] and S8 [259 m]), with mean inclines of−1.9 and −3.6◦, respectively, and four flat sections (S1 [32 m],S2 [201 m], S6 [218 m], and S9 [437 m]) with mean inclinesranging between−0.7 and 1.4◦. The maximal elevation differenceof the course was 20 m with a total vertical climb of 29 m.
The topography and distance of the course and the specificsections were measured 2 days prior to the race with a highaccuracy Global Navigation Satellite System (GNSS) positioningequipment (Topcon HiPer II, Topcon Corporation, Tokyo,Japan). The system simultaneously receives signals from both theUnited States and Russian global navigation systems (GPS andGLONASS) and surveys positions at dual frequencies (L1/L2) inthe real-time kinematic mode with 10 mm+ 1 ppm and 15 mm+1 ppm horizontal and vertical accuracies, respectively, as reportedby the manufacturer. The section times were measured with theEMIT timing system (Emit AS, Oslo, Norway).
Video Recording, Sub-Techniques, and CycleCharacteristicsThree camera sections (CS1-3; Figure 1A) were included in thecurrent study for the kinematical analysis of G2, G3, and G4 usingKinovea open source video-analysis software1. The total distancesfor the camera sections were 25, 35, and 40 m, with averageinclines of 4.2, 3.7, and 0.3◦ for CS1, CS2, and CS3, respectively.All camera sections were marked with orange reference polesplaced at 5-m intervals. The skiers were video recorded at a highresolution (1920 × 1080 progressive scan) in the sagittal planeusing JVC GZ-R435BEU video cameras (JVC, corp., Yokohama,Japan) set at 50 Hz, with a shutter speed of 1/500th of a second.The video cameras were positioned on fixed tripods placedperpendicular to the track at a distance allowing coverage of theentire sections. Due to an error detected in the orientation of thecamera positioned in CS2, the distance skied using specific gearscould not be determined accurately and therefore no cycle lengthswere reported for this camera section.
All four main ski-skating gears were used in the currentstudy. However, the first 30-m section (i.e., S1) was performedusing the classic double-poling sub-technique in all races andby all athletes, as is standard in a sprint race. The time andnumber of movement cycles for the specific gears used in CS1-3 were analyzed from the video. One movement cycle wasdefined as a complete left and right leg stroke, together withthe accompanying poling action (which differs for the differentgears). For the calculation of cycle rate, the number of movementcycles was divided by the time spent using the specific gear. Cyclelength was calculated by dividing the distance using a specificgear by the number of movement cycles. However, cycle lengthwas not calculated if more than one gear was used in the specificcamera section. Distance and speed for the specific gears weredetermined from the video footage using the reference poles.
Race ProceduresThe sprint ski competition was performed in conjunction witha pre-season training camp at an international-standard skistadium situated at an altitude of 710 m. The participants wereasked to perform no more than light-intensity exercise (≤70%of maximal heart rate) the day before the race and to refrainfrom ingesting alcohol for at least 24 h. All skiers ate breakfastfrom a buffet stocked with familiar foods∼3 h before the start ofthe sprint competition, and were instructed to take on foods and
1www.kinovea.org
Frontiers in Physiology | www.frontiersin.org 4 March 2019 | Volume 10 | Article 295

fphys-10-00295 March 22, 2019 Time: 11:52 # 5
Andersson et al. Pacing and Performance in Sprint Skiing
fluids throughout the competition as they normally would. Priorto the competition, carbohydrate intake was 1.6 ± 0.5 g/kg bodymass for both the males and the females. During the competition,males consumed 1.0 ± 0.5 g of carbohydrate per kg body massand females consumed 1.3 ± 0.3 g of carbohydrate per kg bodymass. A thorough description of the nutritional intakes of theseathletes recorded before and during the competition are availablein a related article (Carr et al., 2018).
The race course was covered with a solid base (40–50 cm)of artificial snow that was covered by ∼5 cm of fresh, packednatural snow. The course was machine-prepared on the eveningprior to the competition and once more on the morning of thecompetition, due to overnight snowfall, in order to optimizeracing conditions. Unlike an official sprint competition, all skierscompleted all four races, regardless of their result in each race,with rest periods between races simulating real-world racingconditions. The females competed first in each round, followedby the males, as is typical of real-world sprint ski racing. The TTstarted at 09:30 in the morning and was followed by the threehead-to-head races (the QF, SF, and F). The times from start-to-start for all skiers were 103 ± 9, 34 ± 7, and 20 ± 3 min for theTT to QF, QF to SF, and SF to F, respectively.
The starting order for the TT was based on the FIS-pointsprint ranking system for males and females, respectively, wherethe athlete with the best rank started first and a time gap of15 s separated each skier. The head-to-head races were thenperformed with five males or seven females in each heat, resultingin four heats (A–D) per race for the males and two heats (A andB) per race for the females. Hence, 18 head-to-head heats wereperformed in total. The progress of skiers to the specific QF heatswas based on performance during the TT, such that the fastestskiers in the TT were placed in heat A and the next fastest inheat B (and so forth down to heat D for the males). The two bestskiers in each of the QF and SF heats were moved up one heatso that they started in a better heat during the SF and F, whilethe two slowest skiers were moved down one heat. This structureenhanced competitiveness, providing incentive to the athletes tofinish in the top two of any heat and allowing those of relativelysimilar performance levels to race head-to-head in the SF and F.
CalculationsThe estimated average propulsive power output over the specificcourse sections was calculated as the sum of power exerted toelevate system mass (msys; body mass together with equipmentmass) against gravity (g), and to overcome snow friction (µF) andair drag:
Power output [w] = msysg sin(α)ν+ µFmsysg cos(α)ν (1)
+ 0.5ρCdAν3
where α is the average incline (◦) of the course section, v isspeed (m/s) and the final term describes the power from air dragacting on the skier, where ρ is the air density and CdA is theeffective drag area (Swarén and Eriksson, 2017). Air density (ρ)was calculated from ambient temperature measured at the racelocation and air pressure obtained from an automatic weather
station (HydroMet MAWS201M, Vaisala Oy, Helsinki, Finland)by dividing air pressure by the product of the specific gasconstant and the ambient temperature. The effective drag area ofthe skier (CdA) was determined using a scaling function basedon a reference value for an 80.2 kg skier with a CdA of 0.67m2 (CdAref ) during uphill G3 skiing (Sundström et al., 2013;Ainegren and Jonsson, 2018):
CdA = CdAref × (BM/BMref )2/3 (2)
where BM is the body mass of the participating skier and BMref isthe body mass of the reference skier. For downhill skiing, whichmainly encompassed active ski-skating without poling in a tuckedposition (G5), a CdAref of 0.34 m2 was used, and for flat terrain, aCdAref of 0.63 m2 was used (Ainegren and Jonsson, 2018).
Since only average speeds were calculated for each section,the power output for acceleration (i.e., the rate of change ofkinetic energy) was neglected and Equation (1) is thus a simplifiedversion from that suggested by van Ingen Schenau and Cavanagh(1990) and used by Swarén and Eriksson (2017). As such, poweroutput was not estimated for the first section (i.e., the 30-mdouble-poling section), where acceleration of the msys composea major part of the total power output. The average relativepower output for uphill, flat and downhill terrain, as well asfor the total TT race, was calculated as the sum of work forspecific sections divided by the total time to cover these sectionsdivided by the msys. Average relative power output on the videosections was based on average speed obtained from the EMITtiming system data and the average incline derived from theGNSS measurements.
The average relative metabolic rate for the video sectionswas calculated by dividing the relative power output with anestimated average gross efficiency. The gross efficiencies for uphillskiing with G2 and G3 were fixed at 17.5 and 16.9% for CS1 andCS2, respectively, and for flat skiing with G3 and G4 at 15.8%for CS3. These values were used for both males and femalesand were based on previous results at approximately similarinclines (Losnegard et al., 2012; Sandbakk et al., 2013), as wellas unpublished data from our laboratory. The V̇O2 demand inmL·kg−1
·min−1 was estimated by converting the metabolic ratein J·s−1 to J·min−1 and dividing by an energetic equivalent of20.92 J mL−1 O2 (assuming 100% carbohydrate utilization) andthe skier’s msys.
StatisticsThe Statistical Package for the Social Sciences (SPSS 21, IBM,Corp., Armonk, NY, United States) was used to carry outstatistical analyses and the level of significance was set atα ≤ 0.05. Data were confirmed to be normally distributed byvisual inspection of Q–Q plots and histograms together with theShapiro-Wilks analysis and are presented as mean ± standarddeviation (SD) or as median and interquartile range for cyclecharacteristic data with n ≤ 4. A mixed-model ANOVA wasused to analyze skiing performance between males and femalesover (1) all the different course sections and (2) the threedifferent terrain types. Within-athlete coefficient of variationof skiing speed across sections was calculated for the TT. In
Frontiers in Physiology | www.frontiersin.org 5 March 2019 | Volume 10 | Article 295
fphys-10-00295 March 22, 2019 Time: 11:52 # 6
Andersson et al. Pacing and Performance in Sprint Skiing
addition, within-athlete coefficient of variation of relative poweroutput and relative heart rate during the TT was calculatedfor course sections 2–9. The between-athlete coefficient ofvariation in TT speed for uphill, flat and downhill terrain wasalso calculated. Bonferroni α corrections were applied to allANOVA tests. If sphericity was violated, the Greenhouse–Geisseror Huynh-Feldt corrections were utilized for epsilon ≤ 0.75or > 0.75, respectively. Partial eta squared effect size (η2
p) wasalso reported for the ANOVA tests. Independent sample t-testswere employed to compare performance, metabolic demand andcycle characteristics between males and females and a dependentsample t-test was used to compare TT speed with the averagehead-to-head race speed. To compare the preference of sub-technique between males and females a Fisher’s exact test wasused to analyze the frequencies of G2 and G2 mixed with G3versus solely G3 in CS1-2, as well as G3 and G3 mixed withG4 versus solely G4 in CS3. The standardized mean difference(Cohen’s d, effect size) was computed as the mean differencedivided by the pooled SD. Cohen’s d effect size was presentedtogether with 95% confidence intervals for the t-tests. Tacticalpositioning during all head-to-head sprint races was determinedby calculating Kendall’s Tau-b correlations between intermediaterankings on each section along the course and the final ranking,presented as mean and 95% confidence interval.
RESULTS
Performance and Pacing During the TTThe 1,572 m TT was performed in 227 ± 11 and 254 ± 10 sfor males and females, respectively (P < 0.001, Cohen’s d effectsize [ES] = −2.7 [−3.5 to −1.7]). Relative time distributions formales and females, respectively, were 27.9± 0.8 and 29.6± 0.7%on uphill terrain, 54.9 ± 0.4 and 53.8 ± 0.6% on flat terrain,and 17.2 ± 0.5 and 16.6 ± 0.2% on downhill terrain. A maineffect was observed for relative time spent on each form of terrain(F1,38 = 23040, P < 0.001, η2
p = 1.00), but not for sex (F1,32 = 0,P > 0.999, η2
p = 0.00), while there was an interaction effectbetween terrain and sex (F1,38 = 36, P < 0.001, η2
p = 0.53).Average relative power output during the TT was 3.7 ± 0.3 and3.2 ± 0.2 W/kg for males and females, respectively (P < 0.001,ES = 2.5 [1.6–3.3]).
Average and relative speed, relative power output and heartrate across the nine sections of the TT are illustrated in Figure 1for the males and females separately. For speed (Figure 1A),main effects were observed for section (F4,121 = 1873, P < 0.001,η2
p = 0.98) and sex (F1,32 = 65, P < 0.001, η2p = 0.67), as well as an
interaction effect between section and sex (F4,121 = 4, P = 0.004,η2
p = 0.12). Similarly, for relative power output (Figure 1B)main effects were observed for section (F3,93 = 2010, P < 0.001,η2
p = 0.98) and sex (F1,32 = 55, P < 0.001, η2p = 0.63), as well as an
interaction effect between section and sex (F3,93 = 20, P < 0.001,η2
p = 0.39). By contrast, for heart rate (Figure 1B) there was amain effect for section (F2,45 = 506, P < 0.001, η2
p = 0.95) but notfor sex (F1,27 = 1, P = 0.42, η2
p = 0.02) and there was no interactioneffect (F2,45 = 2, P = 0.17, η2
p = 0.07). For speed expressed as
a percentage of the skier’s average TT speed (Figure 1C), maineffects were observed for section (F4,124 = 2055, P < 0.001,η2
p = 0.99) and sex (F1,32 = 5, P = 0.04, η2p = 0.13), as well as
an interaction effect (F4,124 = 20, P < 0.001, η2p = 0.39). The
within-athlete coefficient of variation in speed between sectionswas 20 ± 2% for males and 24 ± 1% for females (P < 0.001,ES = 2.6 [1.7–3.4]). For power output between sections 4–9 thewithin-athlete coefficient of variation was 53± 2% for males and53 ± 1% for females (P = 0.963, ES = 0 [−0.7–0.7]), while thesame variation in heart rate was 4± 1% for males and 2± 1% forfemales (P = 0.008, ES = 1.2 [0.4–2.0]).
Relative to the average TT speed, uphill, flat and downhillspeeds were 77 ± 2, 103 ± 1, and 129 ± 4% for males and72 ± 2, 105 ± 1, and 133 ± 2% for females. There were maineffects for terrain (F1,39 = 4152, P < 0.001, η2
p = 0.99) and sex(F1,32 = 11, P = 0.002, η2
p = 0.26) and there was an interactioneffect between terrain and sex (F1,39 = 27, P < 0.001, η2
p = 0.46).The between-athlete coefficient of variation in speed on uphill,flat and downhill terrain was 6.9, 4.0, and 3.5% for the maleskiers and 5.6, 3.3, and 3.2% for the female skiers. Relative poweroutput on the uphill, flat and downhill terrain was estimated to4.9 ± 0.4, 4.0 ± 0.3 and 1.2 ± 0.2 W/kg for males and 4.0 ± 0.3,3.4± 0.2, and 0.9± 0.1 W/kg for females (significant main effectsfor terrain [F1,39 = 2639, P< 0.001, η2
p = 0.99] and sex [F1,32 = 54,P < 0.001, η2
p = 0.63], as well as an interaction effect [F1,39 = 25,P < 0.001, η2
p = 0.44]).
Gear Choice and Kinematics Duringthe TTPerformance, estimated physiological responses, choice of sub-technique (i.e., gear) and cycle characteristics on the two uphillcamera sections during the TT are shown in Table 1. On thefirst uphill video section (CS1) the males were 20% faster thanthe females, generating a 23% higher relative power outputand metabolic rate. On CS1, 19 of the male skiers (95%) andthree of the female skiers (21%) used G3 exclusively, and theremaining skiers (5% of the males and 79% of the females) usedG2 exclusively or a combination of G2 and G3. On CS2 themales were again 20% faster than the females, generating a 23%higher relative power output and metabolic rate. Here, eight ofthe male skiers (40%) and none of the female skiers used G3exclusively, while the remaining skiers (60% of the males and100% of the females) used G2 exclusively or a combination of G2and G3. Table 2 shows the performance, estimated physiologicalresponses, choice of gear and cycle characteristics for CS3 (i.e.,the last 50-m of the TT), which was flat. Here the males were14% faster than the females, eliciting a 23% higher relativepower output and metabolic rate and skied with a 17% longercycle length in G3, with no significant difference in cycle ratebetween the sexes.
A Comparison of Performance andPacing Strategy Between All RacesThe speeds during all four races are shown in Figure 2. The peakheart rate (reached during any of the four races) was 183 ± 6
Frontiers in Physiology | www.frontiersin.org 6 March 2019 | Volume 10 | Article 295

fphys-10-00295 March 22, 2019 Time: 11:52 # 7
Andersson et al. Pacing and Performance in Sprint Skiing
TABLE 1 | Performance, power output, estimated physiological response, choice of sub-technique (i.e., gear) and cycle characteristics for the two uphill camerasections (CS1 and CS2) during the 1,572 m sprint time trial.
Uphill (4.2◦) CS1 Uphill (3.7◦) CS2
Speed, power andmetabolic demand
Males Females ES Males Females ES
Speed (km·h−1) 15.9 ± 1.1∗ 13.2 ± 0.9 2.6 (1.6–3.4) 16.8 ± 1.3∗ 14.1 ± 1.0 2.3 (1.4–3.2)
Total power output(W·kg−1)
5.6 ± 0.5∗ 4.5 ± 0.3 2.5 (1.6–3.4) 5.6 ± 0.5∗ 4.5 ± 0.4 2.3 (1.4–3.1)
Power output againstgravity (W·kg−1)
3.2 ± 0.2∗ 2.6 ± 0.2 2.6 (1.6–3.4) 3.0 ± 0.2∗ 2.5 ± 0.2 2.3 (1.4–3.2)
Power output against snowfriction (W·kg−1)
1.9 ± 0.1∗ 1.6 ± 0.1 2.6 (1.6–3.4) 2.1 ± 0.2∗ 1.7 ± 0.1 2.3 (1.4–3.2)
Power output against airdrag (W·kg−1)
0.5 ± 0.1∗ 0.3 ± 0.1 2.4 (1.4–3.2) 0.5 ± 0.1∗ 0.3 ± 0.1 2.1 (1.2–2.9)
Metabolic rate (W·kg−1) 31.9 ± 2.6∗ 26.0 ± 1.9 2.5 (1.6–3.4) 33.0 ± 3.0∗ 26.8 ± 2.1 2.3 (1.4–3.1)
V̇O2 demand(mL·kg−1
·min−1)91 ± 7∗ 74 ± 5 2.5 (1.6–3.4) 95 ± 9∗ 77 ± 6 2.3 (1.4–3.1)
V̇O2 demand (% ofV̇O2max)#
126 ± 14 127 ± 9 −0.1 (−0.8–0.6) 132 ± 15 131 ± 13 0.0 (−0.7–0.8)
Gear choice andkinematics
G2 exclusively n = 1 n = 9 – – n = 2 –
Speed (km·h−1) 15.0 12.9 ± 0.8 – – 12.9 (12.7–13.2) –
Cycle rate (Hz) 1.00 0.92 ± 0.04 – – 1.04 (1.03–1.05) –
Cycle length (m) 4.2 3.9 ± 0.2 – – – –
G3 exclusively n = 19∗ n = 3 – n = 8 – –
Speed (km·h−1) 15.9 ± 1.1 13.7 (13.5–14.2) – 17.2 ± 1.2 – –
Cycle rate (Hz) 0.58 ± 0.02 0.58 (0.57–0.60) – 0.62 ± 0.03 – –
Cycle length (m) 7.7 ± 0.6 6.7 (6.4–6.8) – – – –
G3/G2 mixSpeed (km·h−1) G3
– n = 2 – n = 12 n = 12 –
– 13.2 (13.1–13.4) – 16.6 ± 1.4G3/G2avg∗ 14.3 ± 0.9G3/G2avg 2.0 (1.1–2.8)
G2 – 15.1 (14.8–15.3) – – – –
Cycle rate (Hz) G3 – 0.56 (0.55–0.57) – 0.61 ± 0.04 0.62 ± 0.03 −0.1 (−0.8–0.6)
G2 – 1.00 (1.00–1.00) – 1.12 ± 0.09 1.07 ± 0.08 0.5 (−0.2–1.2)
The values are presented as mean ± SD or as median and interquartile range (n = 14 for females and n = 20 for males). ES, Cohen’s d effect size and 95% confidenceinterval in parenthesis; G2, gear 2; G3, gear 3; G3/G2 mix, a mixed usage of G3 and G2; G3/G2avg, the average value for skiing with both gears. ∗P < 0.001 in comparisonto females. P > 0.05 in comparison to females. Statistical comparisons were performed for variables where ES is presented with exception for gear preference. #Males:n = 19; females: n = 12.
and 182± 7 beats·min−1 for the males and females, respectively,and this value was reached by 27, 30, 30, and 12% of the skiersin the TT, QF, SF, and F, respectively. Over the four races, themale skiers were on average 12.5% faster than the female skiersover the 1,572 m course. The most pronounced sex differenceswere evident on the uphill terrain, where the male skiers wereon average 17.7% faster than the female skiers. By contrast, thesmallest sex differences were observed on the downhill terrain,where the males were on average 8.8% faster than the females.The total race times in the QF, SF, F were 222 ± 8, 222 ± 12, and219 ± 11 s for males and 247 ± 8, 251 ± 12, and 249 ± 11 s forfemales, resulting in average head-to-head race speeds that were2.8 ± 1.7% (P < 0.001, ES = 1.8) and 2.4 ± 1.0% (P < 0.001,ES = 2.5) faster than the TT for males and females, respectively.
Mean heart rate during the TT, QF, SF, and F was 95 ± 2,95 ± 1, 95 ± 1, and 95 ± 2% of maximum for males and 96 ± 1,95 ± 2, 95 ± 2, and 94 ± 2% of maximum for females. There
was a main effect for race (F3,81 = 5, P = 0.005, η2p = 0.12),
but not for sex (F1,27 = 0, P = 0.797, η2p = 0.00) and there
was no significant interaction effect (F3,81 = 1, P = 0.420,η2
p = 0.03). Post-race blood lactate concentration following TT,QF, SF, and F was 10.1 ± 1.9, 9.8 ± 1.4, 10.3 ± 2.0, and11.4± 1.7 mmol L−1 for males and 9.8± 1.5, 8.8± 2.7, 9.5± 2.8,and 10.4 ± 3.1 mmol L−1 for females. Again, there was a maineffect for race (F3,87 = 5, P = 0.002, η2
p = 0.16) but not forsex (F1,29 = 2, P = 0.190, η2
p = 0.06), and no interaction effect(F3,87 = 0, P = 0.761, η 2
p = 0.01).The relative differences in speeds for the head-to-head races
(i.e., QF, SF, and F) versus the TT are shown in Figure 3, whilemean speeds and heart rates for specific course sections (S1–S9)during the four separate sprint races are displayed in Table 3.Comparisons of the male skiers’ section speeds between the fourraces revealed a main effect for course section (F2,46 = 1213,
Frontiers in Physiology | www.frontiersin.org 7 March 2019 | Volume 10 | Article 295

fphys-10-00295 March 22, 2019 Time: 11:52 # 8
Andersson et al. Pacing and Performance in Sprint Skiing
TABLE 2 | Performance, power output, estimated physiological response, choiceof sub-technique (i.e., gear) and cycle characteristics for the final 50 m camerasection of the 1,572 m sprint time trial (CS3).
Flat (0.3◦) CS3
Speed, power andmetabolic demand
Males Females ES
Speed (km·h−1) 27.8 ± 1.5∗ 24.4 ± 1.3 2.4 (1.5–3.2)
Total power output(W·kg−1)
6.1 ± 0.5∗ 4.9 ± 0.4 2.3 (1.4–3.1)
Power output againstgravity (W·kg−1)
0.4 ± 0.0∗ 0.3 ± 0.0 2.4 (1.5–3.2)
Power output againstsnow friction (W·kg−1)
3.4 ± 0.2∗ 3.0 ± 0.2 2.4 (1.5–3.2)
Power output againstair drag (W·kg−1)
2.3 ± 0.3∗ 1.6 ± 0.2 2.2 (1.3–3.0)
Metabolic rate (W·kg−1) 38.5 ± 3.4∗ 31.3 ± 2.7 2.3 (1.4–3.1)
V̇O2 demand(mL·kg−1
·min−1)111 ± 10∗ 90 ± 8 2.3 (1.4–3.1)
V̇O2 demand (% ofV̇O2max)#
154 ± 15 152 ± 18 0.1 (−0.7–0.8)
Gear choice andkinematics
G3 exclusively n = 13 n = 11 –
Speed (km·h−1) 27.8 ± 1.5∗ 24.4 ± 1.2 2.5 (1.5–3.3)
Cycle rate (Hz) 0.58 ± 0.03 0.60 ± 0.03 −0.5 (−1.2–0.2)
Cycle length (m) 13.3 ± 0.7∗ 11.4 ± 0.6 2.9 (1.9–3.8)
G4 exclusively n = 3 – –
Speed (km·h−1) 27.8 (27.7–28.8) – –
Cycle rate (Hz) 0.83 (0.76–0.85) – –
Cycle length (m) 10.0 (9.4–10.6) – –
G4/G3 mix n = 4 n = 3 –
Speed (km·h−1) G4 28.8 (27.9–29.0) 26.6 (26.0–27.6) –
G3 26.1 (25.0–27.3) 23.7 (22.7–25.2) –
Cycle rate (Hz) G4 0.82 (0.79–0.84) 0.71 (0.71–0.72) –
G3 0.54 (0.52–0.55) 0.61 (0.60–0.62) –
The values are presented as mean ± SD or as median and interquartile range(n = 14 for females and n = 20 for males). ES, Cohen’s d effect size and 95%confidence interval in parenthesis; G3, gear 3; G4, gear 4; G4/G3avg, a mixedusage of G4 and G3; G4/G3avg, the average value for skiing with both gears.∗P < 0.001 in comparison to females. P > 0.05 in comparison to females.Statistical comparisons were performed for variables where ES is presented.#Males: n = 19; females: n = 12.
P < 0.001, η2p = 0.98) and race (F3,57 = 5, P = 0.003, η2
p = 0.22),as well as an interaction effect between course section and race(F24,456 = 8, P < 0.001, η2
p = 0.30). The same comparison forthe female skiers showed a similar result (main effect for coursesection [F3,36 = 1838, P < 0.001, η2
p = 0.99], race [F3,39 = 12,P < 0.001, η2
p = 0.48], and an interaction effect [F24,312 = 13,P < 0.001, η2
p = 0.50]). Comparing male skiers’ heart ratevalues between the four races showed a main effect for section(F1,25 = 748, P < 0.001, η2
p = 0.98), with no main effect forheat (F3,51 = 1, P = 0.632, η2
p = 0.03), but an interaction effectbetween section and heat (F24,408 = 8, P < 0.001, η2
p = 0.33).Similar results were observed for the female skiers’ heart ratevalues, with a main effect for section [F2,16 = 201, P < 0.001,η2
p = 0.95], no main effect for heat [F3,30 = 2, P = 0.149, η2p = 0.16],
FIGURE 2 | Average skiing speeds during the 1,572 m time trial (TT),quarter-final (QF), semi-final (SF), and final (F) for (A) the total race, (B) uphillterrain, (C) flat terrain, and (D) downhill terrain. #Main effect for race. †Maineffect for sex. $ Interactive effect (race × sex). ∗P < 0.05, ∗∗P < 0.01, and∗∗∗P < 0.001. η2
p, partial eta squared effect size.
but an interaction effect between section and heat [F24,240 = 4,P < 0.001, η 2
p = 0.30]).Correlations between course section rankings and final
rankings based on all 18 head-to-head races (i.e., all QF, SF,and F races) are also shown in Table 3. The average correlationcoefficients ranged from 0.51 to 0.84, with a gradual increasefrom S1 to S8. In addition, descriptive data showing the relativefrequencies of all head-to-head race winners’ positions at the
Frontiers in Physiology | www.frontiersin.org 8 March 2019 | Volume 10 | Article 295

fphys-10-00295 March 22, 2019 Time: 11:52 # 9
Andersson et al. Pacing and Performance in Sprint Skiing
FIGURE 3 | (A) The average section speeds relative to the time trial (TT)speeds during the head-to-head races (i.e., quarter-final [QF], semi-final [SF],and final [F]) for the males (n = 20) together with the course profile. (B) Thesame figure as in (A) but with female skiers. The vertical lines represent thenine different sections (S1–S9).
end of each section are displayed in Table 3 and show thatapproximately two-thirds of head-to-head race winners werepositioned at the front of the race already after the first section.
DISCUSSION
This investigation of differences in performance and pacingstrategies between sexes during a sprint skiing competitionhas shown:
(1) An overall sex difference in TT performance of 12%, withmale skiers considerably (19%) faster on the uphill sections,where they also used G3 more frequently than the females;
(2) That the speed profile and power output distribution alongthe course were highly variable for both sexes, while thevariation in heart rate was low;
(3) That the head-to-head races (i.e., QF, SF, and F) were 2.6and 2.1% faster than the TT for the male and female skiers,respectively, with main differences between the head-to-head races and the TT observed during the uphill andfinal flat sections.
Sex Differences in TT PerformanceAs hypothesized, the male skiers were considerably faster thanthe females during the TT, by a magnitude of ∼12%, which has
also been observed for middle- and long-distance running (Coastet al., 2004; Cheuvront et al., 2005). Unlike studies performedin the laboratory, the influence of air drag on cross-countryskiing performed outdoors is an important factor to consider. Forinstance, during the TT in the current study, the males generatedan 18.2% higher relative power output than the females, while thedifference in speed was considerably lower at 12.2%. However, ifa similar TT was conducted on a treadmill, differences in relativepower output and speed had been similar due to the negligibleair drag (Andersson et al., 2017). Hence, the influence of airdrag clearly reduces outdoor performance differences betweenathletes of differing capacities and body sizes, with this effectamplified at increased average speeds (di Prampero, 1986; Bergh,1987; Jeukendrup et al., 2000). In the current study, the greatestdifference in speed between sexes was observed during uphillskiing (being 19% higher for the males), where power exertedagainst air drag constitutes a minor part of the total power output.Higher uphill speeds among male cross-country skiers have beenobserved previously by Sandbakk et al. (2012), who demonstrated17% higher peak speeds for males compared with females duringan indoor incremental time-to-exhaustion test using G3 at a 2.9◦incline. This appears to be related to a divergence between thesexes as the relative contribution from the upper body increases(Sandbakk et al., 2014), with a greater relative reliance on theupper body for propulsion during ski-skating on uphill comparedto level and downhill terrain (Millet et al., 1998; Smith, 2003).
For endurance sports in general, performance differencesbetween sexes have been attributed to differences in V̇O2max,where females typically display ∼10–15% lower relative values,which are assumed to be mainly due to a lower relativehemoglobin mass in females (Cheuvront et al., 2005; Sandbakket al., 2012). In the current study, the female skiers had a17.8% lower relative V̇O2max. Although oxygen uptake was notmeasured during the sprint competition, no difference in relativeheart rate was observed between the sexes, which indicates asimilar fractional utilization of V̇O2max (Londeree and Ames,1976) between the male and female skiers. Moreover, eventhough blood lactate concentration is only an indirect marker ofanaerobic energy production, the similar post-race blood lactateconcentrations between sexes indicate a comparable anaerobicenergy production (Vandewalle et al., 1987). Thus, it is likelythat a major part of the observed sex difference in sprint skiingperformance was related to differences in V̇O2max.
In ski-skating, gear choice is likely to be most prominentlyinfluenced by a combination of factors such as speed, slopeincline, technical skill and physiological ability (Kvamme et al.,2005; Andersson et al., 2010; Losnegard et al., 2012). Previousfindings by Andersson et al. (2010) showed that faster skiersuse higher gears during uphill skiing, which is also supportedby findings from the current study, whereby most of the fastermales used G3 exclusively and most of the females used G2exclusively. In addition, the fastest female skier over the firstcamera section used G3 exclusively and was 10% faster thanthe female group average. Although the different gear choicesbetween males and females made the comparison of gear-specificcycle characteristics problematic, these data indicate that maleskiers generate higher speeds in G3 compared to the females
Frontiers in Physiology | www.frontiersin.org 9 March 2019 | Volume 10 | Article 295

fphys-10-00295 March 22, 2019 Time: 11:52 # 10
Andersson et al. Pacing and Performance in Sprint Skiing
TABLE 3 | Mean ± SD speeds and heart rates (HR) in specific sections (S1–S9) for the four separate sprint races (i.e., the time trial [TT], quarter-final [QF], semi-final [SF],and final [F]) together with the tactical positioning during the head-to-head (HH) races (i.e., QF, SF, and F).
Course sections (S1–S9)
Race Speed(km·h−1)
S1 (−0.5◦) S2 (1.4◦) S3 (3.9◦) S4 (3.1◦) S5 (−1.9◦) S6 (−0.7◦) S7 (3.7◦) S8 (−3.6◦) S9 (−0.5◦)
TT Males 23.2 ± 0.7 25.7 ± 1.7 18.3 ± 1.4 18.4 ± 1.3 25.6 ± 1.4 23.6 ± 0.8 23.0 ± 1.5 35.5 ± 1.1 27.2 ± 1.2
Females 21.2 ± 0.7 22.6 ± 1.0 15.3 ± 0.9 15.3 ± 1.0 22.9 ± 0.8 21.7 ± 0.7 19.7 ± 1.1 33.2 ± 1.1 25.0 ± 0.9
QF Males 23.4 ± 0.8 25.5 ± 0.9 18.7 ± 1.6 18.9 ± 1.1 26.4 ± 1.9 23.5 ± 0.7 23.3 ± 1.4 36.0 ± 1.7 28.7 ± 1.8
Females 21.4 ± 0.7 22.7 ± 0.5 16.9 ± 0.8 16.4 ± 1.0 23.6 ± 0.9 22.0 ± 0.7 20.7 ± 1.4 34.3 ± 1.0 25.4 ± 1.1
SF Males 23.0 ± 1.2 25.8 ± 1.0 19.0 ± 1.1 19.0 ± 1.2 25.9 ± 1.4 23.8 ± 1.1 23.9 ± 2.0 36.5 ± 1.8 28.3 ± 2.6
Females 20.9 ± 1.0 21.7 ± 0.8 15.5 ± 0.6 16.4 ± 1.5 23.1 ± 1.2 21.7 ± 1.1 20.1 ± 1.6 33.6 ± 1.4 25.6 ± 1.2
F Males 23.1 ± 0.9 25.4 ± 1.5 19.6 ± 1.2 19.3 ± 1.4 26.1 ± 1.0 23.9 ± 1.2 24.1 ± 1.9 36.8 ± 1.8 28.9 ± 1.9
Females 21.3 ± 1.3 22.0 ± 0.8 16.1 ± 0.7 16.1 ± 1.0 22.9 ± 1.1 21.7 ± 0.9 20.8 ± 1.9 34.1 ± 1.4 26.0 ± 1.3
Race HR (% ofmaximum)#
TT Males 70 ± 4 88 ± 4 95 ± 2 97 ± 2 98 ± 1 98 ± 1 98 ± 1 97 ± 1 97 ± 1
Females 71 ± 7 90 ± 4 97 ± 2 98 ± 1 99 ± 1 98 ± 1 97 ± 2 97 ± 2 97 ± 2
QF Males 69 ± 5 89 ± 2 95 ± 1 97 ± 1 97 ± 1 97 ± 1 97 ± 1 97 ± 1 98 ± 1
Females 69 ± 5 90 ± 3 96 ± 2 97 ± 1 98 ± 2 97 ± 2 97 ± 2 96 ± 3 96 ± 2
SF Males 72 ± 4 89 ± 2 95 ± 1 96 ± 1 97 ± 1 97 ± 1 97 ± 1 96 ± 1 97 ± 1
Females 72 ± 5 90 ± 3 95 ± 2 97 ± 1 97 ± 2 96 ± 2 96 ± 2 95 ± 3 96 ± 2
F Males 74 ± 5 89 ± 3 95 ± 2 96 ± 2 97 ± 2 97 ± 2 96 ± 2 96 ± 2 97 ± 2
Females 73 ± 6 90 ± 3 95 ± 1 96 ± 1 96 ± 2 96 ± 2 96 ± 2 95 ± 3 96 ± 2
HH races Correlationwith S9†
Kendalls tau b 0.51 0.63 0.66 0.72 0.73 0.75 0.78 0.84 –
95% CI 0.37–0.64 0.50–0.77 0.53–0.79 0.61–0.83 0.62–0.84 0.64–0.86 0.67–0.89 0.77–0.92 –
HH races The winner’sposition†
1st 61% 61% 67% 67% 67% 67% 61% 72% –
2nd 22% 28% 28% 22% 22% 22% 28% 22% –
3rd 11% 6% 0% 6% 6% 6% 6% 6% –
4th 6% 6% 6% 6% 6% 6% 6% 0% –
≥5th 0% 0% 0% 0% 0% 0% 0% 0% –
CI, confidence interval. #Males: n = 18; females: n = 11. †The “Correlation with S9” data are the correlations between positioning and final rank, while “The winner’sposition” data are the relative frequencies (in %) of all the race winners’ positions at the end of each section. These data are based on all 18 HH races (six for females[n = 7 per race] and 12 for males [n = 5 per race]).
using G3, primarily due to longer cycle lengths at relativelysimilar cycle rates (see Tables 1, 2).
Pacing Strategy and Performance Duringthe TTTo our knowledge, this is the first study to analyze pacingstrategies during a full sprint skiing competition on snow.Although pacing is usually described as being positive, even ornegative, the variable terrain in cross-country skiing, togetherwith the fact that skiers typically race only one lap on a givencourse, make such classifications inappropriate. In order to bestsimulate World Cup conditions, the current study was conductedon a one-lap course over varying terrain. As a result, the skiersemployed a variable pacing strategy in terms of power outputestimated from the TT, resulting in a highly variable metabolicrequirement over the course. The estimated metabolic demandsfor the two uphill camera sections (i.e., ∼76 mL kg−1 min−1 forthe females and∼93 mL kg−1 min−1 for the males) were∼129%
of V̇O2max for both sexes, indicating a considerable anaerobicenergy yield during uphill skiing. Supramaximal intensities foruphill roller-skiing using the skating technique have recentlybeen observed during a 15-km outdoor TT race, with reporteduphill exercise intensities of ∼115% of V̇O2max for relativelyshort (∼65 m) and steep (8.7◦) climbs preceded by a relativelyflat section (Karlsson et al., 2018). Hence, a skier’s ability togenerate and tolerate uphill exercise intensities above V̇O2maxis likely to be an important factor for predicting both sprintand distance cross-country skiing performance. Interestingly, asshown in Figure 1B, the heart rate was relatively stable from thebeginning of the fourth section until the finish. Since heart ratecan be viewed as a surrogate marker of relative oxygen uptake(i.e., percent of V̇O2max) (Londeree and Ames, 1976), it is likelythat most of the variation in power output, and hence metabolicrequirement, was due to a fluctuating anaerobic energy yieldalong the course, as has been previously shown for classic roller-skiing (Andersson et al., 2016, 2017). For sprint cross-country
Frontiers in Physiology | www.frontiersin.org 10 March 2019 | Volume 10 | Article 295

fphys-10-00295 March 22, 2019 Time: 11:52 # 11
Andersson et al. Pacing and Performance in Sprint Skiing
skiing modeled on an undulating course, Sundström et al.(2013) predicted improved performance with a more variablepower output profile (i.e., higher power output on uphillterrain) in order to achieve a more even speed profile, therebyreducing air drag (van Ingen Schenau et al., 1992). Therefore,if a skier improves his/her ability to repeatedly generateand tolerate high levels of anaerobic energy production onuphills, with efficient recovery on downhills at an elevatedV̇O2 in comparison to the V̇O2 demand, the utilization ofaerobic and anaerobic metabolic resources may be enhanced.This would also likely improve the pacing strategy from amechanical perspective, and thereby performance, due to a moreeven speed profile.
For the relative speed profile, expressed as a percentageof the average TT speed, the between-athlete coefficient ofvariation across the course sections was relatively small (2–4%), indicating relatively similar pacing strategies within eachsex group. However, an interaction effect between the sexeswas observed for the relative speed profile (Figure 1C), wherefemales demonstrated a higher variation in relative speed. Thiswas mainly due to relatively slower speeds on the uphills andfaster speeds on the downhills, in comparison to the males.Since the power output required to overcome air drag increasesexponentially with skiing speed, it is likely that faster skiers, ingeneral, would demonstrate a less variable speed profile thanthat of slower skiers (i.e., that the more even speed profilefor faster than slower skiers is an outcome rather than theaim, per se). That is because the power output required toovercome air drag is the cube of the skiing speed; hence,at relatively high speeds where a major part of the poweroutput is used to overcome air drag, a small increase in speedrequires an exponential increase in the metabolic demand (diPrampero, 1986; Jeukendrup et al., 2000). This is exemplifiedwhen comparing the relative differences in speed and metabolicrate between the sexes for the three camera sections. Of note,the power output and metabolic rate were both 23% higherfor males than females on the two uphill camera sections andthe flat camera section, while the difference in speed was 20%for uphill skiing versus 14% on the flat camera section. Thismay explain why differences in speeds between sexes were lowerfor flat and downhill terrain than for uphill terrain in thecurrent study, and why overall sex differences in performanceare lower for “high-speed” events such as speed skating andcycling (∼7.9%) than were observed in the current study (12.2%)(Thibault et al., 2010). Therefore, differences in TT performanceover different sections of the course for the males and femalesin the current study were probably due to a combined effectof differences in the total metabolic resources, mainly due todifferences in V̇O2max, together with an external air drag effecton the relative speed profile.
Head-to-Head Sprint SkiingPerformance, Pacing Strategy, and RaceTacticsA unique characteristic of sprint cross-country ski competitionsis that athletes complete four separate races on the same day,
where the TT qualification race (i.e., the prolog) is withoutdirect contact with opponents and the remaining three knockoutraces involve six skiers racing head-to-head. While the aim ofthe TT prolog is to ensure qualification to the QF (i.e., a finalranking in the top 30), the focus of the head-to-head racesis to finish in the top two (for the QF and SF) or first (inthe F). Speed is therefore of less importance during the head-to-head races and pacing is likely to be influenced by othercompetitors’ race tactics. However, this dynamic is made morecomplex by the fact that the two fastest skiers in each knockoutround who finish outside of the top two in each heat qualifyto the next round as “lucky losers,” making final race time notentirely redundant. In the current study, the three head-to-head races were on average 2.6 and 2.1% faster than the TTfor the males and females, respectively. Although not all skierswould have benefited similarly from drafting, particularly therace winners who were typically leading after the first 30 m,the improved average performances in the head-to-head raceswere probably partly due to the reduced air-drag resulting fromdrafting. The presence of direct competitors has also been shownto affect performance, with cycle TT performance improvingby ∼2.5% when moderately-trained individuals raced againsta virtual opponent compared to no opponent (Corbett et al.,2012; Konings et al., 2017). However, the elite athletes inthe current study would be expected to have a high internalmotivation, irrespective of whether they were racing head-to-head or alone (Corbett et al., 2012). Thus, the effects of externalstimuli (i.e., direct contact with opponents) could be lower forthe current group of participants compared with lower-levelathletes or non-athletes.
Even though main effects of race (i.e., TT, QF, SF, and F)were observed for heart rate and blood lactate concentration,differences in these physiological responses were relatively smallbetween the four races. Therefore, it is likely that the advantageof drafting other skiers would be the main contributing factorfor the faster speeds achieved during the head-to-head races,rather than greater effort. As shown in Figure 3, the speedprofiles during the head-to-head races differed compared to theTT, with higher speeds achieved on the main uphill sections(S3, S4, and S7) and for the final section (S9). This waspossibly a direct cause of breakaway attempts by skiers on theuphill sections, due to the relatively lower benefit of draftingwhen speed is lower (Bilodeau et al., 1994; Brisswalter andHausswirth, 2008). The relatively higher speeds observed overS9 was likely due to faster end spurts in the head-to-head racessince these races are determined by final position rather thantotal race time.
The current study is the first to our knowledge to haveanalyzed the associations between positioning and performancein head-to-head knockout races in sprint skiing. As shownin Table 3, most of the head-to-head race winners werealready leading after the first section (i.e., after 30 m), andthe correlation coefficients between positioning on the courseand final rank gradually increased with increased distance. Themoderate correlations at the early stages of the race in cross-country sprint skiing are in contrast to sports such as 1500-m short-track speed-skating and sprint track cycling, where
Frontiers in Physiology | www.frontiersin.org 11 March 2019 | Volume 10 | Article 295

fphys-10-00295 March 22, 2019 Time: 11:52 # 12
Andersson et al. Pacing and Performance in Sprint Skiing
most race winners draft behind other competitors during theearly stages of the race (Moffatt et al., 2014; Konings et al.,2016). This difference is most likely related to the lowerabsolute speeds and the substantially lower air frictional lossesin sprint skiing, which lead to a lower relative advantage ofdrafting. However, the energy saving benefits of drafting incross-country skiing should not be underestimated, especiallyfor fast skiing over flat and downhill terrain. For instance,drafting another skier (of a similar performance level) at anaverage speed of 20.1 km h−1 lowered relative heart rateby five percentage points during 2 km of high-intensity ski-skating compared to the leading skier (Bilodeau et al., 1994).As shown in Figure 3, the knockout races were finishedwith a more pronounced end spurt than the TT, makingrapid anaerobic energy supply at the very end of theseraces potentially decisive for successful performance. Therefore,a skier’s maximal speed capacity and the ability for rapidaccelerations are probably more important in knockout sprintraces, where head-to-head positioning exerts a direct impact onthe race result.
LimitationsThe results presented in the current study are derivedfrom a relatively large number of male and female skierswith good control and organization for this type ofapplied field study. However, it is acknowledged that thesimulation was not entirely representative of a World Cupcompetition, since all skiers completed all four races andwere not knocked out through the rounds. This method wasadopted for the obvious reason of maintaining a participantgroup of n = 34 throughout the entire study. As a result,performance was defined as total race time, which differsfrom a real-world scenario where final positions in thehead-to-head races would determine further qualificationand performance.
It is also acknowledged that data presented for power outputand metabolic demand were based on some assumptions. Forinstance, the friction coefficient, effective drag area and grossefficiency for the calculations of power output and metabolicdemand were estimated based on previous studies and additionalunpublished data. Also, gross efficiency determined for roller-skiing may not be exactly the same as for on-snow skiing inslow snow conditions (i.e., wet, fresh snow). From the glide-test results, it can be noted that the gliding properties ofthe skis were slightly altered from pre- to post-competition,with downhill speeds ∼1% slower following the competition.Moreover, the power output estimates were solely based onaverage section speeds and the influence of instantaneous changesof momentum on the power output estimate was neglected. Theaccuracy of the propulsive power output and metabolic demandmeasures could, therefore, be improved by employing moresophisticated individual assessments of these parameters. Thus,future studies may benefit from the use of high-accuracy GNSSequipment, which would enable detailed analyses of a skier’sposition and speed along the course, preferably also combinedwith a portable respiratory gas analyzer for the quantificationof oxygen uptake.
CONCLUSION AND PERSPECTIVES
The present findings reveal an overall sex difference insprint cross-country skiing performance of ∼12.5%. Thisdifference in performance was significantly affected byterrain type, where considerably larger sex differenceswere observed during uphill compared with downhill andflat skiing. Moreover, the females were 19% slower uphillthan the males during the TT, with females using moreof G2 compared to the males who mainly used G3. Thefemale skiers also demonstrated a more variable speedprofile than the males.
The power output distribution along the course was highlyvariable, with the highest power outputs being generated onthe uphill sections, while the variation in heart rate was low.This suggests a highly variable anaerobic energy yield alongthe course. The head-to-head races were on average 2.4% fasterthan the TT for both sex groups, while average heart rate andpost-race blood lactate concentrations were relatively similarfor all races. Therefore, the faster race times during the head-to-head races may be primarily related to reduced air-dragdue to drafting.
The results presented in the current study provide importantinsight into the sex differences associated with performanceand pacing strategies during field-based sprint skiing on snowin a group of elite cross-country skiers. A novel findingwas that the relative sex difference in estimated relativepower output for uphill and flat skiing during the TT wassimilar, while the associated relative difference in speed wassubstantially higher for uphill than flat skiing. This differsfrom laboratory studies using treadmill roller-skiing, wheredifferences in relative power output and speed between sexesare similar due to negligible air-drag (Sandbakk et al., 2012,2014). This highlights the importance of conducting studies ofthese elite athletes in field-based environments. An additionalfinding was the more variable power output distributionalong the course compared with the heart rate response,which indicates an intermittent need for anaerobic energyproduction. More importantly, from an applied perspectivethis finding confirms that heart rate conveys an incompletepicture for describing exercise intensity during sprint skiing,which has been suggested previously for other modes of exercise(Buchheit and Laursen, 2013).
DATA AVAILABILITY
The datasets generated for this study are available on request tothe corresponding author.
AUTHOR CONTRIBUTIONS
EA performed the data and statistical analysis, interpreted theresults and wrote the first draft. EA, AG, OS, and KM designedthe study, collected the data, revised the manuscript, approvedthe final version, and agreed to be accountable for all aspectsof the work.
Frontiers in Physiology | www.frontiersin.org 12 March 2019 | Volume 10 | Article 295

fphys-10-00295 March 22, 2019 Time: 11:52 # 13
Andersson et al. Pacing and Performance in Sprint Skiing
FUNDING
This study was partly funded by the Rolf andGunilla Enström foundation (The article fee will becovered by the BISAM Frontiers Agreement with MidSweden University).
ACKNOWLEDGMENTS
The authors thank the athletes, coaches, and service team fortheir participation, enthusiasm, and cooperation in this study.The authors also like to express special thanks to Lars Ljung, LarsSelin, and Marie Ohlsson for their support and expertise.
REFERENCESAbbiss, C. R., Ross, M. L., Garvican, L. A., Ross, N., Pottgiesser, T., Gregory, J.,
et al. (2013). The distribution of pace adopted by cyclists during a cross-countrymountain bike world championships. J. Sports Sci. 31, 787–794. doi: 10.1080/02640414.2012.751118
Ainegren, M., and Jonsson, P. (2018). Drag area, frontal area and dragcoefficient in cross-country skiing techniques. Proceedings 2:313. doi: 10.3390/proceedings2060313
Andersson, E., Björklund, G., Holmberg, H. C., and Ørtenblad, N. (2017). Energysystem contributions and determinants of performance in sprint cross-countryskiing. Scand. J. Med. Sci. Sports 27, 385–398. doi: 10.1111/sms.12666
Andersson, E., Holmberg, H. C., Ørtenblad, N., and Björklund, G. (2016).Metabolic responses and pacing strategies during successive sprint skiingtime trials. Med. Sci. Sports Exerc. 48, 2544–2554. doi: 10.1249/mss.0000000000001037
Andersson, E., Supej, M., Sandbakk, Ø., Sperlich, B., Stöggl, T., and Holmberg,H. C. (2010). Analysis of sprint cross-country skiing using a differential globalnavigation satellite system. Eur. J. Appl. Physiol. 110, 585–595. doi: 10.1007/s00421-010-1535-2
Bergh, U. (1987). The influence of body mass in cross-country skiing. Med. Sci.Sports Exerc. 19, 324–331.
Bilodeau, B., Roy, B., and Boulay, M. R. (1994). Effect of drafting on heart rate incross-country skiing. Med. Sci. Sports Exerc. 26, 637–641.
Brisswalter, J., and Hausswirth, C. (2008). Consequences of drafting on humanlocomotion: benefits on sports performance. Int. J. Sports Physiol. Perform. 3,3–15. doi: 10.1123/ijspp.3.1.3
Buchheit, M., and Laursen, P. B. (2013). High-intensity interval training, solutionsto the programming puzzle: part I: cardiopulmonary emphasis. Sports Med. 43,313–338. doi: 10.1007/s40279-013-0029-x
Buhl, D., Fauve, M., and Rhyner, H. (2001). The kinetic friction of polyethylenon snow: the influence of the snow temperature and the load. Cold Reg. Sci.Technol. 33, 133–140. doi: 10.1016/S0165-232X(01)00034-9
Carr, A., McGawley, K., Govus, A., Andersson, E. P., Shannon, O. M., Mattsson, S.,et al. (2018). Nutritional intake in elite cross-country skiers during two days oftraining and competition. Int. J. Sport Nutr. Exerc. Metab. doi: 10.1123/ijsnem.2017-0411 [Epub ahead of print].
Cheuvront, S. N., Carter, R., DeRuisseau, K. C., and Moffatt, R. J. (2005). Runningperformance differences between men and women. Sports Med. 35, 1017–1024.
Coast, J. R., Blevins, J. S., and Wilson, B. A. (2004). Do gender differencesin running performance disappear with distance? Can. J. Appl. Physiol. 29,139–145.
Colbeck, S. C. (1994). A review of the friction of snow skis. J. Sports Sci. 12, 285–295.doi: 10.1080/02640419408732174
Corbett, J., Barwood, M. J., Ouzounoglou, A., Thelwell, R., and Dicks, M. (2012).Influence of competition on performance and pacing during cycling exercise.Med. Sci. Sports Exerc. 44, 509–515. doi: 10.1249/MSS.0b013e31823378b1
Corbett, J., Barwood, M. J., and Parkhouse, K. (2009). Effect of task familiarisationon distribution of energy during a 2000 m cycling time trial. Br. J. Sports Med.43, 770–774. doi: 10.1136/bjsm.2008.056416
di Prampero, P. E. (1986). The energy cost of human locomotion on land and inwater. Int. J. Sports Med. 7, 55–72. doi: 10.1055/s-2008-1025736
Fis. (2016). International Ski Federation, FIS Points List. Available at: http://www.fis-ski.com
Hanon, C., and Thomas, C. (2011). Effects of optimal pacing strategies for 400-,800-, and 1500-m races on the VO2 response. J. Sports Sci. 29, 905–912. doi:10.1080/02640414.2011.562232
Jeukendrup, A. E., Craig, N. P., and Hawley, J. A. (2000). The bioenergetics of worldclass cycling. J. Sci. Med. Sport 3, 414–433.
Karlsson, Ø., Gilgien, M., Gløersen, Ø.N., Rud, B., and Losnegard, T. (2018).Exercise intensity during cross-country skiing described by oxygen demandsin flat and uphill terrain. Front. Physiol. 9:846. doi: 10.3389/fphys.2018.00846
Konings, M. J., Parkinson, J., Zijdewind, I., and Hettinga, F. J. (2017). Racingan opponent alters pacing, performance and muscle force decline, butnot RPE. Int. J. Sports Physiol. Perform. 13, 283–289. doi: 10.1123/ijspp.2017-0220
Konings, M. J., Schoenmakers, P. P., Walker, A. J., and Hettinga, F. J. (2016). Thebehavior of an opponent alters pacing decisions in 4-km cycling time trials.Physiol. Behav. 158, 1–5. doi: 10.1016/j.physbeh.2016.02.023
Kvamme, B., Jakobsen, V., Hetland, S., and Smith, G. A. (2005). Ski skatingtechnique and physiological responses across slopes and speeds. Eur. J. Appl.Physiol. 95, 205–212.
Londeree, B. R., and Ames, S. A. (1976). Trend analysis of the % VO2 max-HRregression. Med. Sci. Sports 8, 123–125.
Losnegard, T., Myklebust, H., and Hallén, J. (2012). No differences in O2-cost between V1 and V2 skating techniques during treadmill roller skiing atmoderate to steep inclines. J. Strength Cond. Res. 26, 1340–1347. doi: 10.1519/JSC.0b013e318231a69e
McGawley, K., and Holmberg, H. C. (2014). Aerobic and anaerobic contributionsto energy production among junior male and female cross-country skiersduring diagonal skiing. Int. J. Sport Physiol. 9, 32–40. doi: 10.1123/Ijspp.2013-0239
Millet, G. Y., Hoffman, M. D., Candau, R. B., and Clifford, P. S. (1998). Poling forcesduring roller skiing: effects of technique and speed. Med. Sci. Sports Exerc. 30,1645–1653.
Moffatt, J., Scarf, P., Passfield, L., McHale, I. G., and Zhang, K. (2014). To lead ornot to lead: analysis of the sprint in track cycling. J. Quant. Anal. Sports 10,161–172. doi: 10.1515/jqas-2013-0112
Sandbakk, Ø., Ettema, G., and Holmberg, H. C. (2014). Gender differences inendurance performance by elite cross-country skiers are influenced by thecontribution from poling. Scand. J. Med. Sci. Sports 24, 28–33. doi: 10.1111/j.1600-0838.2012.01482.x
Sandbakk, Ø, Ettema, G., Leirdal, S., and Holmberg, H. C. (2012). Genderdifferences in the physiological responses and kinematic behaviour of elitesprint cross-country skiers. Eur. J. Appl. Physiol. 112, 1087–1094. doi: 10.1007/s00421-011-2063-4
Sandbakk, Ø., Hegge, A. M., and Ettema, G. (2013). The role of incline,performance level, and gender on the gross mechanical efficiency of roller skiskating. Front. Physiol. 4:293. doi: 10.3389/fphys.2013.00293
Skorski, S., Faude, O., Caviezel, S., and Meyer, T. (2014). Reproducibility of pacingprofiles in elite swimmers. Int. J. Sports Physiol. Perform. 9, 217–225. doi:10.1123/ijspp.2012-0258
Smith, G. A. (2003). “Biomechanics of cross country skiing,” in Handbook of SportsMedicine and Science, ed. H. Rusko (Hoboken, NJ: Wiley), 32–61.
Stöggl, T., Lindinger, S., and Müller, E. (2007). Analysis of a simulated sprintcompetition in classical cross country skiing. Scand. J. Med. Sci. Sports 17,362–372. doi: 10.1111/j.1600-0838.2006.00589.x
Sundström, D., Carlsson, P., Ståhl, F., and Tinnsten, M. (2013). Numericaloptimization of pacing strategy in cross-country skiing. Struct. Multidiscip.Optim. 47, 943–950. doi: 10.1007/s00158-012-0856-7
Swarén, M., and Eriksson, A. (2017). Power and pacing calculations based on real-time locating data from a cross-country skiing sprint race. Sports Biomech.doi: 10.1080/14763141.2017.1391323 [Epub ahead of print].
Swarén, M., Supej, M., Eriksson, A., and Holmberg, H. C. (2013). “Treadmillsimulation of Olympic cross-country ski tracks,” in Science and Nordic SkiingII, eds A. Hakkarainen, V. Linnamo, and S. J. Lindinger (Oxford: Meyer andMeyer Verlag), 237–242.
Frontiers in Physiology | www.frontiersin.org 13 March 2019 | Volume 10 | Article 295

fphys-10-00295 March 22, 2019 Time: 11:52 # 14
Andersson et al. Pacing and Performance in Sprint Skiing
Thibault, V., Guillaume, M., Berthelot, G., El Helou, N., Schaal, K., Quinquis, L.,et al. (2010). Women and men in sport performance: the gender gap has notevolved since 1983. J. Sports Sci. Med. 9, 214–223.
van Ingen Schenau, G. J., and Cavanagh, P. R. (1990). Power equations inendurance sports. J. Biomech. 23, 865–881.
van Ingen Schenau, G. J., de Koning, J. J., and de Groot, G. (1992). The distributionof anaerobic energy in 1000 and 4000 metre cycling bouts. Int. J. Sports Med. 13,447–451. doi: 10.1055/s-2007-1021296
Vandewalle, H., Peres, G., and Monod, H. (1987). Standard anaerobic exercise tests.Sports Med. 4:268. doi: 10.2165/00007256-198704040-00004
Conflict of Interest Statement: The authors declare that the research wasconducted in the absence of any commercial or financial relationships that couldbe construed as a potential conflict of interest.
Copyright © 2019 Andersson, Govus, Shannon andMcGawley. This is an open-accessarticle distributed under the terms of the Creative Commons Attribution License(CC BY). The use, distribution or reproduction in other forums is permitted, providedthe original author(s) and the copyright owner(s) are credited and that the originalpublication in this journal is cited, in accordance with accepted academic practice. Nouse, distribution or reproduction is permitted which does not comply with these terms.
Frontiers in Physiology | www.frontiersin.org 14 March 2019 | Volume 10 | Article 295