Embed Size (px)
Citation preview
Edge Power International (HK) Ltd. Document Name:
Sewage Signaling System
For CUHK pump station
User’s Manual
Contract No. DC/2009/14
19/11/2011
Revision history
Revision Date Description
V0.1 19/11/2011 Original by York M. Hwe
V1.0 6/1/2012 Added "Maintenance" section
Edge Power International (HK) Ltd. Document Name:
1 Introduction....................................................................................................................... 4
2 Scope ................................................................................................................................ 5
3 System .............................................................................................................................. 5
3.1 Configuration .................................................................................................. 6
3.1.1 System block diagram ................................................................................. 6
3.1.2 System interface .......................................................................................... 6
3.2 System features ............................................................................................... 7
3.2.1 Monitor and data collection ........................................................................ 7
3.2.1.1 Water pump ...................................................................................... 7
3.2.1.2 Power supplies ................................................................................. 8
3.2.1.3 Water tank ........................................................................................ 8
3.2.1.4 Flow meters ...................................................................................... 8
3.2.2 Display ........................................................................................................ 8
3.2.3 Communication ........................................................................................... 8
3.2.3.1 Data link ........................................................................................... 9
3.2.3.2 Alert SMS messages ........................................................................ 9
3.2.4 Host interface .............................................................................................. 9
3.2.5 Host Application ......................................................................................... 9
3.3 System Hardware ............................................................................................ 9
3.3.1 SCB Hardware block diagram .................................................................. 10
3.3.1.1 Optical Isolator and I/O extender ................................................... 10
3.3.1.2 MCU .............................................................................................. 10
3.3.1.3 Analog inputs ................................................................................. 10
3.3.1.4 UARTS ............................................................................................ 11
3.3.1.5 SPI and I2C ..................................................................................... 11
3.3.1.6 USB ................................................................................................. 11
3.3.1.7 GSM modem ................................................................................... 11
3.3.2 SCB physical layout ................................................................................... 11
3.4 Signaling system performance ....................................................................... 11
3.4.1 Sample rate ................................................................................................ 12
3.4.2 Display ...................................................................................................... 12
3.4.3 Data link .................................................................................................... 12
3.4.4 SMS message ............................................................................................ 13
3.4.5 Host interface data .................................................................................... 13
3.5 Events and SMS message .............................................................................. 13
4 Operation ........................................................................................................................ 13
4.1 System components ....................................................................................... 14
Edge Power International (HK) Ltd. Document Name:
4.1.1 Server and client panel .............................................................................. 14
4.1.1.1 Data link and operation indicator ................................................... 15
4.1.1.2 LCD display ................................................................................... 15
4.1.2 Host PC ..................................................................................................... 16
4.1.3 SMS subscribers ........................................................................................ 16
4.2 Host application ............................................................................................. 16
4.2.1 System setup and operation monitor ......................................................... 17
4.2.2 SMS subscriber and report generation ...................................................... 18
5 Maintenance .................................................................................................................... 19
5.1 Normal operation ........................................................................................... 20
5.1.1 Lamp test button ....................................................................................... 20
5.1.2 LCD display .............................................................................................. 20
5.1.2.1 System clock (server panel) ........................................................... 20
5.1.2.2 Sample clock (client panel) ............................................................ 20
5.1.2.3 Host Link ....................................................................................... 20
5.1.2.4 Flow rate and calibration ................................................................ 21
5.1.3 Data link LED (client)............................................................................... 21
5.2 System start up .............................................................................................. 21
5.2.1 Before reset/power down .......................................................................... 21
5.2.2 After reset/power up ................................................................................. 21
5.2.3 Reset and Power down/up ......................................................................... 22
6 Summary ......................................................................................................................... 22
Appendix A Hardware interface (with other system components) ............................... 23
Appendix B Internal cables and signal assignment ...................................................... 29
Appendix C Event and SMS message .......................................................................... 33
Edge Power International (HK) Ltd. Document Name:
1 Introduction
This document specifies the signaling system for the Temporary Sewage Pump Facility (TSPF)
project. The TSPT a sewage water pump station located at Chinese University. The TSPT is
remotely monitored at Sha Tin Sewage Treatment Works (STSTW). As part of the pump
station system, signaling system is the key component that makes remotely monitoring
possible. The signaling system provides the following functions:
1. Monitor and display devices and operation status of the pump station
2. Send real time operation status to the remote location
3. Generates and store operation records
4. Create reports/summary in digital file format for analysis
5. Send critical data and alert messages to mobile phone through GSM network
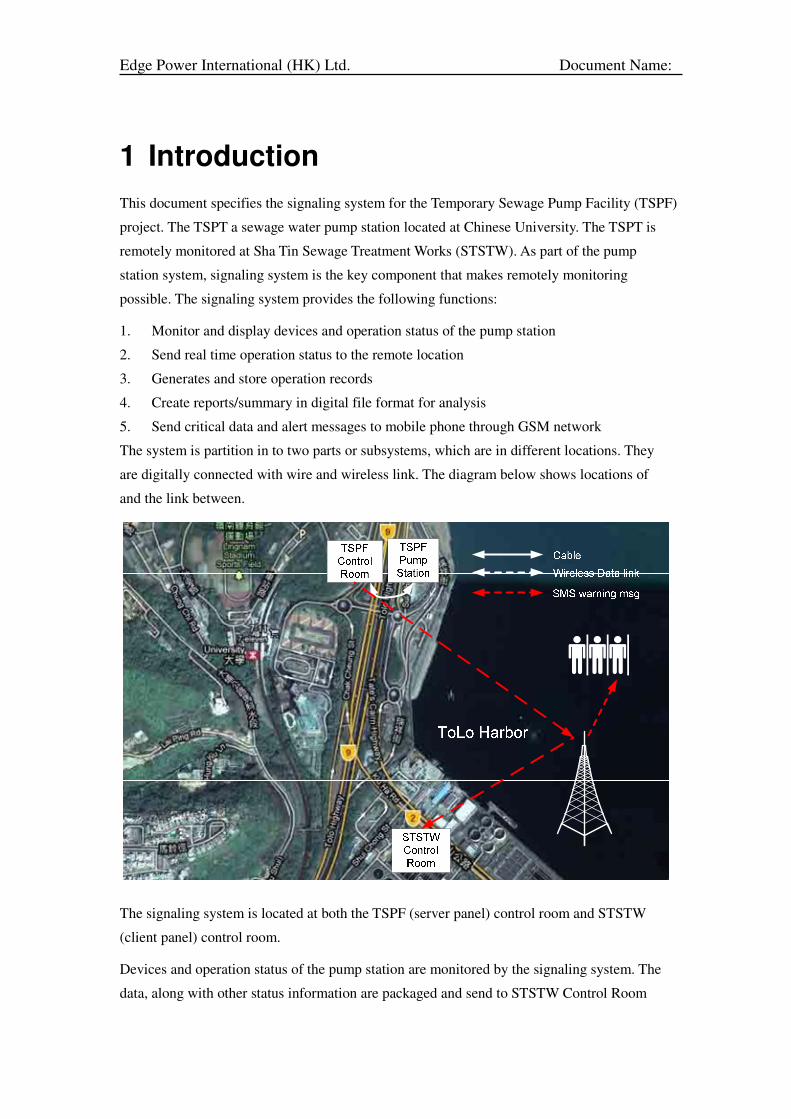
The system is partition in to two parts or subsystems, which are in different locations. They
are digitally connected with wire and wireless link. The diagram below shows locations of
and the link between.
The signaling system is located at both the TSPF (server panel) control room and STSTW
(client panel) control room.
Devices and operation status of the pump station are monitored by the signaling system. The
data, along with other status information are packaged and send to STSTW Control Room
Edge Power International (HK) Ltd. Document Name:
periodically. The operation status of the pump station are displayed on the remote monitor
panel installed in the STSTW control room
In an event system failure, device failure or alarm conditions are reached, the system will
send SMS message to the predefined mobile phones.
Chapter two of the document defines the scope of the document. Chapter three will have a
general description of the system. The system configurations, interface between components
will also be defined in the chapter. The chapter will also describe the inter system
communication, system hardware and the system performance.
Chapter four will have detail description system operation and how to use the system.
2 Scope
This document is the user manual of the signaling system for the TSPF. The connection and
interface to the other system and/or devices will be described. The function of the signaling
system will be enlisted, along with the performance of the signaling system. The document
will also cover where the status and data being display and how to use the functions.
The implementation of the function is beyond the scope of this document. More over, the
daily operation procedures (i.e. when the report should be generated) belong to a higher level
of document and will not be covered in this document. The installation of the system is also
outside the scope of this document.
3 System
The signaling system is part of the pump station system. Through hardware connection the
signaling system monitors the operation status devices in real time The operation status will
be recorded in a format easy to understand (i.e. report in Excel format), as well as SMS
message to mobile phone. In an event of abnormal operation, the signaling system will send
SMS to alert to the group of predefined user.
This chapter will describe the system. The first section will provides the configuration of the
signaling system from the system point of view. The second section will describe the features
of the signaling system. The first section covers the partition and the configuration of the
system. The second section will descript the functions of each subsystem and the interface
between. The first section is the system configuration. The third chapter will describe the
general features of the system.
Edge Power International (HK) Ltd. Document Name:
3.1 Configuration
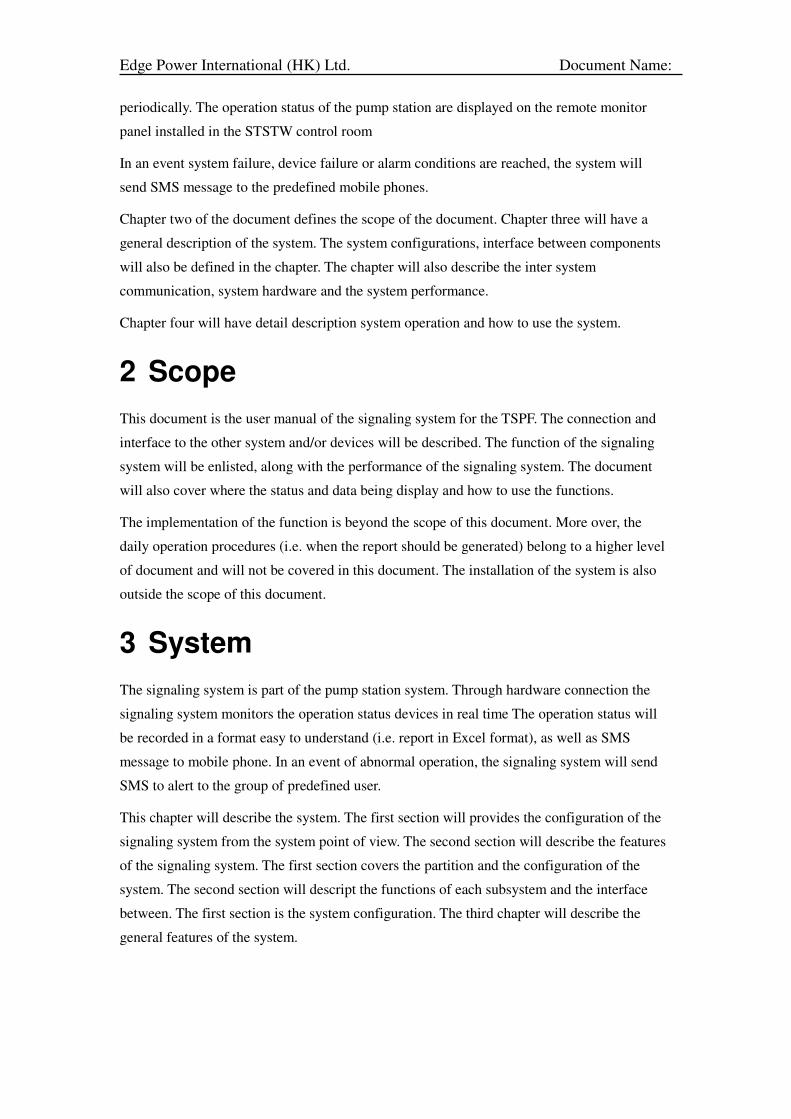
The system block diagram shows the system and the interface between signaling system and
other subsystem. The block diagram also shows partition of the signaling system.
The system interface defines the signal and connection between the signaling system and the
other part of the system.
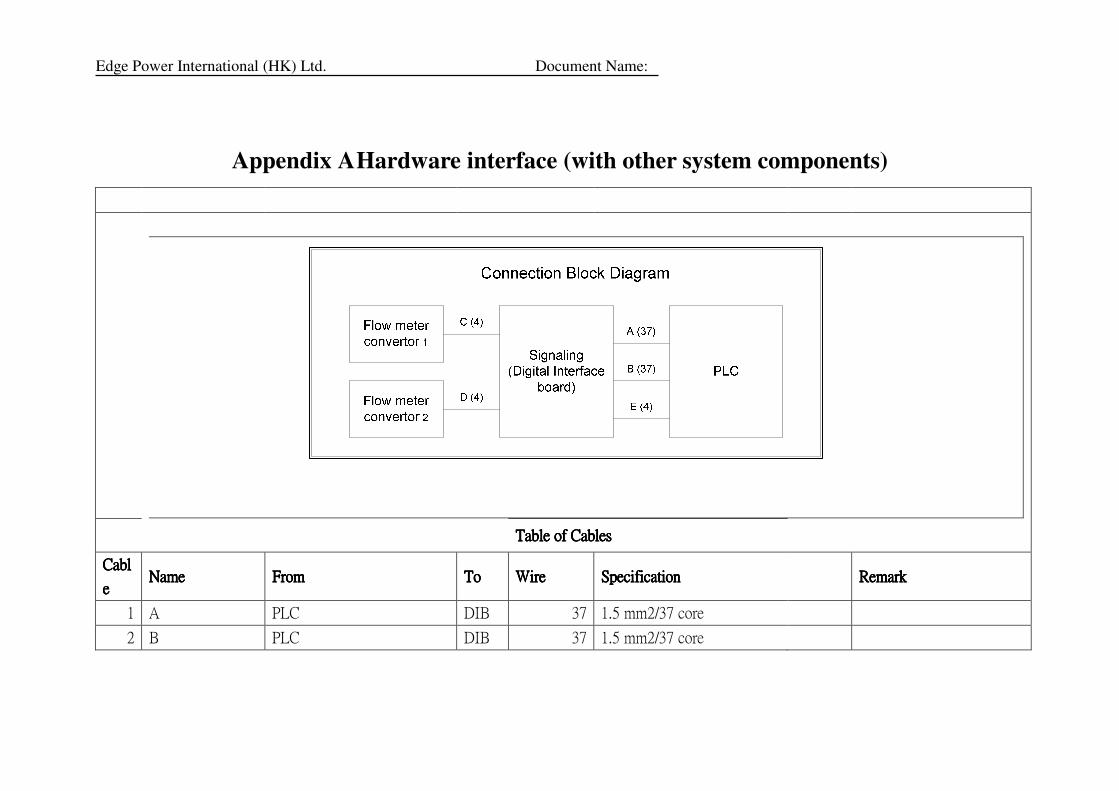
3.1.1 System block diagram
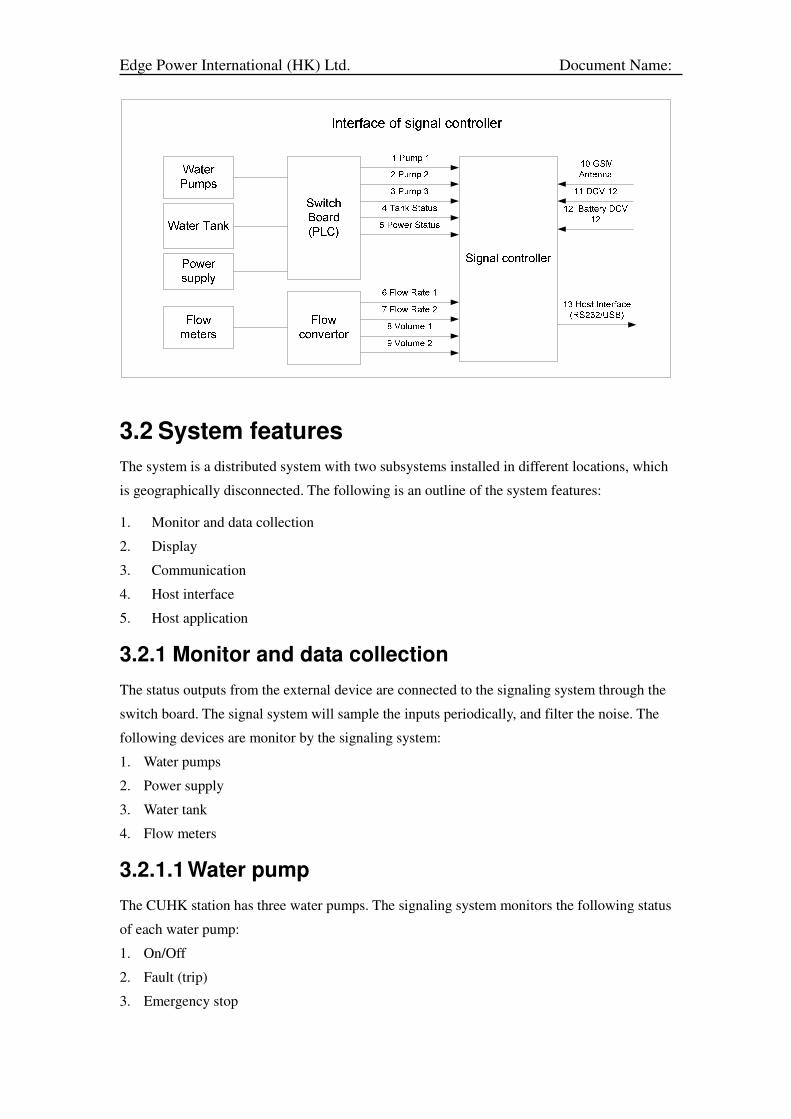
3.1.2 System interface
The signaling system interface defines the connection to the other part of the system.
Signaling system process the input signal, and output the processed signals. The following
sections will specify the interface, signals and direction of the interface. The connector will be
specified in the chapter with hardware description, while the pin and cable assignment will be
specified in the appendix A.
Edge Power International (HK) Ltd. Document Name:
3.2 System features
The system is a distributed system with two subsystems installed in different locations, which
is geographically disconnected. The following is an outline of the system features:
1. Monitor and data collection
2. Display
3. Communication
4. Host interface
5. Host application
3.2.1 Monitor and data collection
The status outputs from the external device are connected to the signaling system through the
switch board. The signal system will sample the inputs periodically, and filter the noise. The
following devices are monitor by the signaling system:
1. Water pumps
2. Power supply
3. Water tank
4. Flow meters
3.2.1.1 Water pump
The CUHK station has three water pumps. The signaling system monitors the following status
of each water pump:
1. On/Off
2. Fault (trip)
3. Emergency stop
Edge Power International (HK) Ltd. Document Name:
4. Power failure
As by design, the power failure will also trigger the emergency stop and the fault status.
3.2.1.2 Power supplies
The power for the pump station may come from three different sources:
1. CLP
2. Emergency power
3. UPS
Under normal operation, power is provided by CLP. In an event CLP failure, Emergency
power will kick in. UPS will be final power source. The signaling system monitors the status
of all three power sources. In additional, the signaling system has its own build-in battery
with enough power to issue SMS alert even all other power source failed.
3.2.1.3 Water tank
The status of the water tank is monitored by the signaling system. The signaling system
monitors the following (abnormal) status of the water tank:
1. High level
2. Over flow
3.2.1.4 Flow meters
Flow meter provides real time information of the water flow rate, and accumulated volume
flowed through the pipe. There are two flow meter installed at the site, and the signaling
system collect both the flow rate and volume of two flow meters.
3.2.2 Display
The signaling system displays the operation status of the pump station on the devices
appropriate for the message being delivered. The following are list of devices/methods:
1. LED light on the signal controller (both the server and client)
2. LCD display on the signal controller (both the server and client)
3. SMS message to the mobile phone
The display function of the signaling system will be described in detail in user interface
chapter.
3.2.3 Communication
The communication channel for signaling system is GSM in SMS format. The signal system
use SMS for communication between server and client, as well as with human being.
Edge Power International (HK) Ltd. Document Name:
3.2.3.1 Data link
For communication between server and client, the signaling system will package the
information into a message and deliver periodically. The message includes the information as
follow:
1. Message start indicator
2. Message type
3. Port number (term for internal component intended to deliver)
4. Information (i.e. the current status information)
5. Check sum
6. Message end indicator
3.2.3.2 Alert SMS messages
Alert SMS messages are delivered to mobile phone for user. The alert messages informed the
user a predefined alert has happened. The conditions of user receiving the alert SMS message
are:
1. Mobile phone number is entered into the system
2. Subscripted to the event
3.2.4 Host interface
The host interface is design for host device (i.e. PC) connect to the system. The signaling
system defined a set of interface command, enable the host to collect data and make
configuration change the signaling system.
3.2.5 Host Application
The PC application provides a graphic user interface for use to monitor and manage the
system through the host interface.
1. Collect data from the signaling system
2. Store data for statistic analysis
3. Setup signaling system
4. Manage/change system configuration
5. Create reports
3.3 System Hardware
The main hardware for the signaling system is the Signal Controller Board (SCB), one for the
server and one for the client. A block diagram of the SCB shows the components and
connection of the SCB, follow by a brief description of the components and connections.
A picture of the SCB shows the layout and physical location of the components and
Edge Power International (HK) Ltd. Document Name:
connectors.
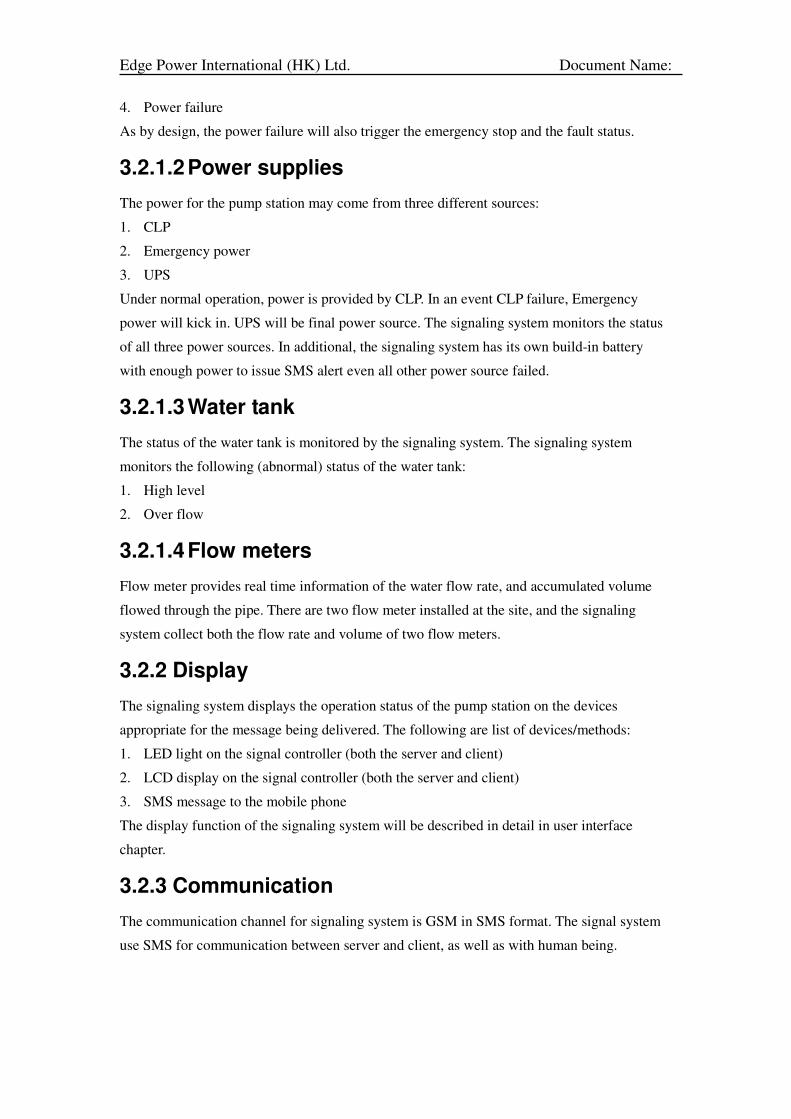
3.3.1 SCB Hardware block diagram
3.3.1.1 Optical Isolator and I/O extender
The optical isolator isolates the signaling system from the other part of the system. The
isolator interfaces with the external devices with the industrial standard of 24 DCV. Since the
SCB handles a large amount of I/O signals, an input extender circuitry is designed to expand
the digital inputs, and an output extender circuitry is designed to expand the output signals.
3.3.1.2 MCU
The MCU is the central component of the SCB. The 32 bit MCU is running at 36 MHz clock
speed with internal peripheral controller to control the other functional blocks of the SCB. In
additional, an internal real time clock keep a system time and provides a accurate time base to
time stamped the sample
3.3.1.3 Analog inputs
The flow meter use current to indicate the flow rate. The SCB use two internal ADC (one for
each flow meter) to acquire data from the flow meter. The operational amplifiers are used to
as pre-condition the analog signal inputs.
Edge Power International (HK) Ltd. Document Name:
3.3.1.4 UARTS
The MCU has two internal UARTS. UART 0 is assigned to the GSM modem, while UART 1
is used for the host interface;
3.3.1.5 SPI and I2C
The SPI interface is used to control the LCD display. The I2C is assigned to access the on
board EEPROM.
3.3.1.6 USB
USB is used for the system development.
3.3.1.7 GSM modem
The GSM modem is the bridge between the signaling system and the GSM network.
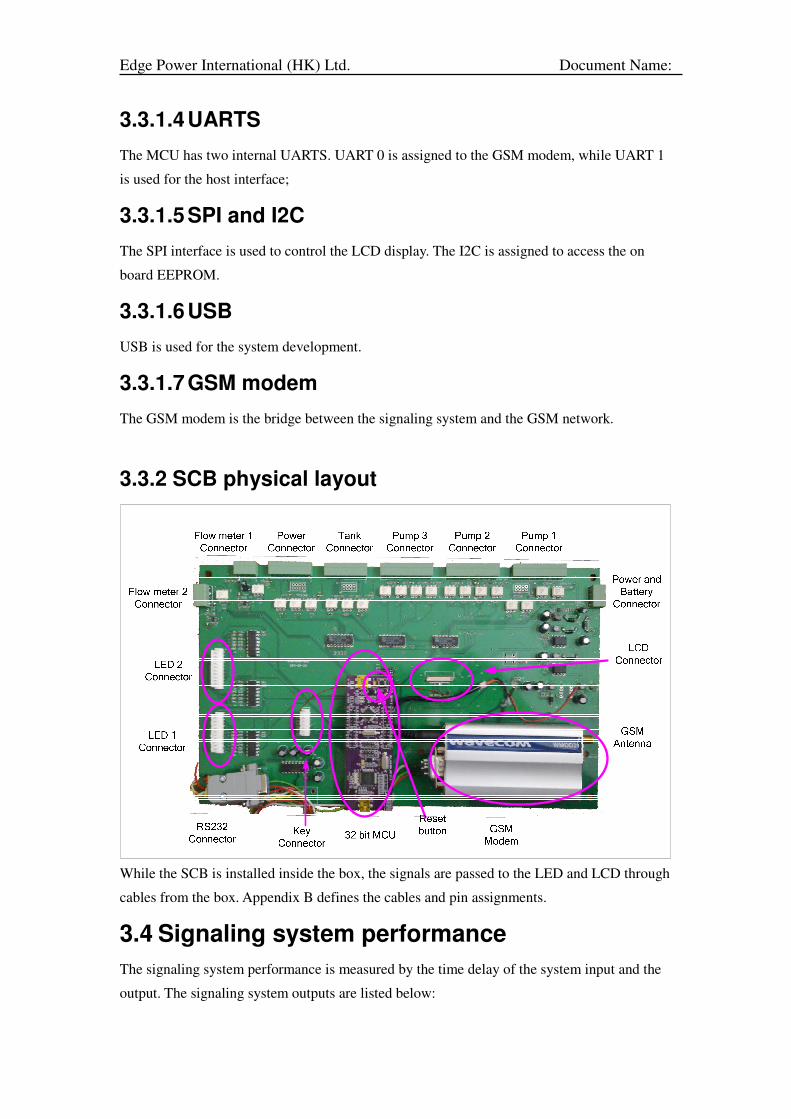
3.3.2 SCB physical layout
While the SCB is installed inside the box, the signals are passed to the LED and LCD through
cables from the box. Appendix B defines the cables and pin assignments.
3.4 Signaling system performance
The signaling system performance is measured by the time delay of the system input and the
output. The signaling system outputs are listed below:
Edge Power International (HK) Ltd. Document Name:
1. Client
2. Display
3. SMS message
4. Host interface
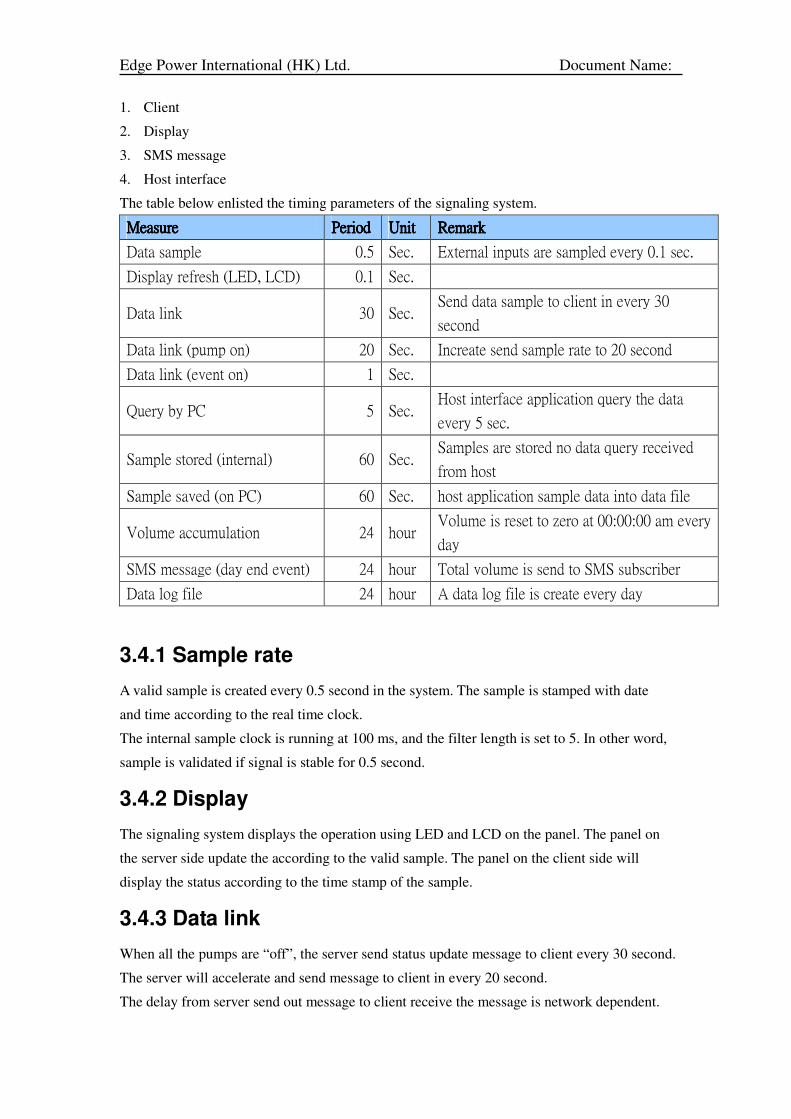
The table below enlisted the timing parameters of the signaling system.
MeasureMeasureMeasureMeasure PeriodPeriodPeriodPeriod UnitUnitUnitUnit RemarkRemarkRemarkRemark
Data sample 0.5 Sec. External inputs are sampled every 0.1 sec.
Display refresh (LED, LCD) 0.1 Sec.
Data link 30 Sec. Send data sample to client in every 30
second
Data link (pump on) 20 Sec. Increate send sample rate to 20 second
Data link (event on) 1 Sec.
Query by PC 5 Sec. Host interface application query the data
every 5 sec.
Sample stored (internal) 60 Sec. Samples are stored no data query received
from host
Sample saved (on PC) 60 Sec. host application sample data into data file
Volume accumulation 24 hour Volume is reset to zero at 00:00:00 am every
day
SMS message (day end event) 24 hour Total volume is send to SMS subscriber
Data log file 24 hour A data log file is create every day
3.4.1 Sample rate
A valid sample is created every 0.5 second in the system. The sample is stamped with date
and time according to the real time clock.
The internal sample clock is running at 100 ms, and the filter length is set to 5. In other word,
sample is validated if signal is stable for 0.5 second.
3.4.2 Display
The signaling system displays the operation using LED and LCD on the panel. The panel on
the server side update the according to the valid sample. The panel on the client side will
display the status according to the time stamp of the sample.
3.4.3 Data link
When all the pumps are “off”, the server send status update message to client every 30 second.
The server will accelerate and send message to client in every 20 second.
The delay from server send out message to client receive the message is network dependent.
Edge Power International (HK) Ltd. Document Name:
3.4.4 SMS message
The SMS message is delivered through GSM network. The delay time is depending on the
GSM network condition.
3.4.5 Host interface data
The signaling system responds to the request from host interface with up to date sample. The
current host application requests status update in every 5 second.
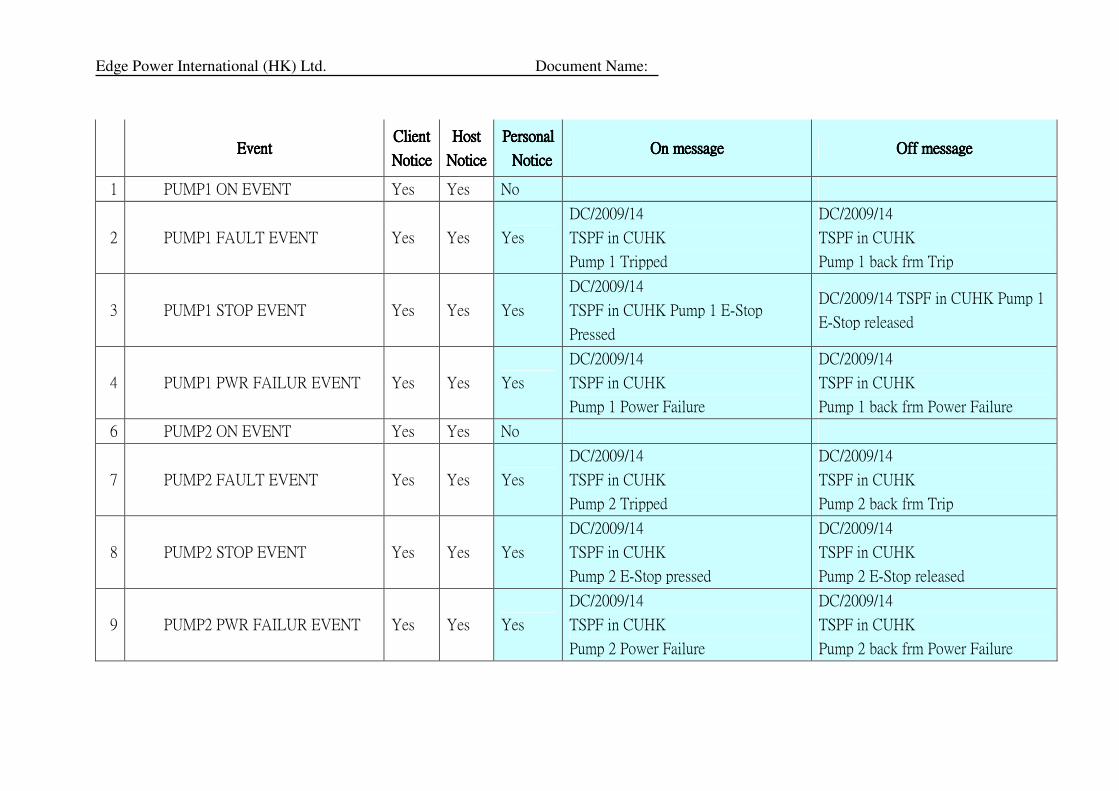
3.5 Events and SMS message
Event is a change of state in the system, i.e. the water pump start/stop, or water reached high
level. Some of the event must be notified by other part of the system, while other may be the
interest of a user or a group of user. A user will receive the SMS for the specific event by
subscription. Appendix will enlist all the events and the SMS text for the event. The chapter
for operation will describe the host application and how to manage user and subscription.
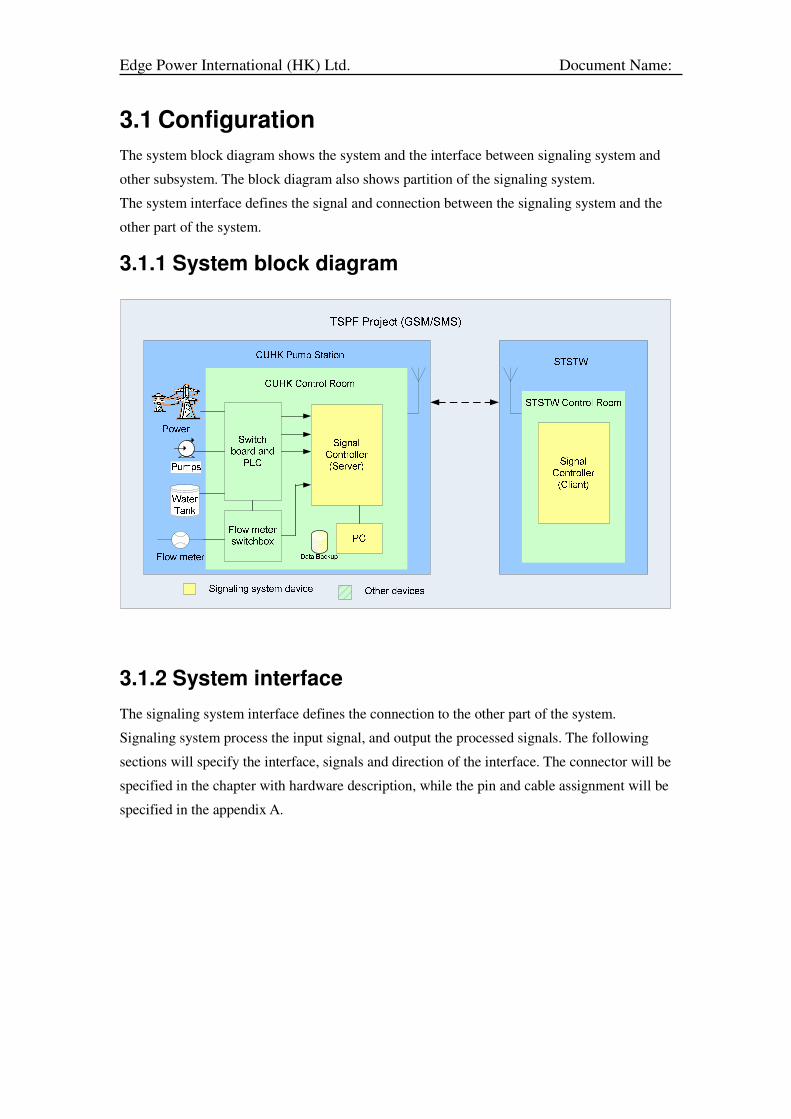
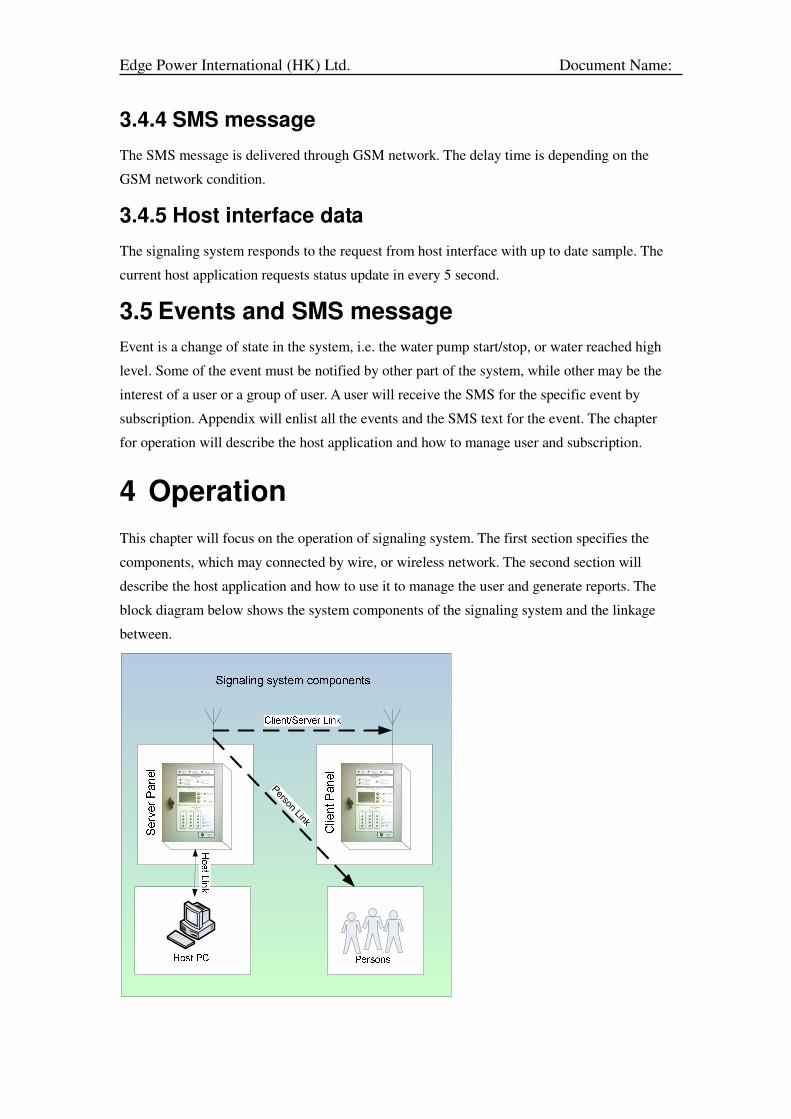
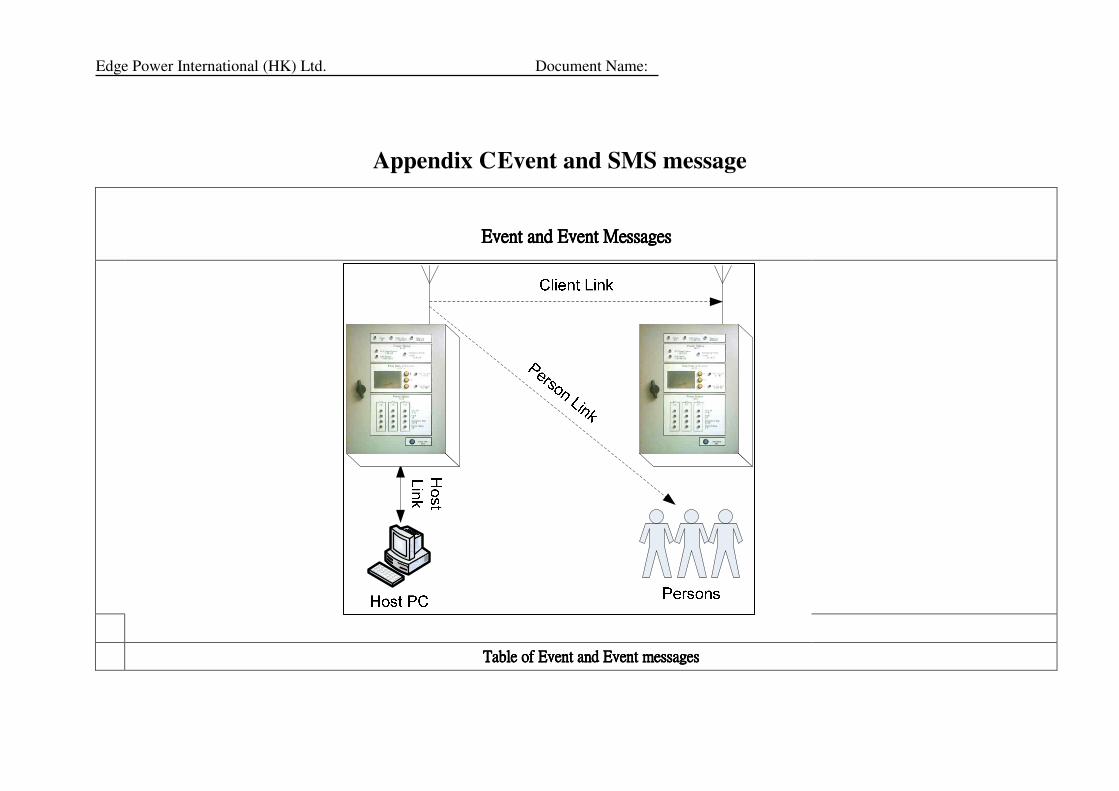
4 Operation
This chapter will focus on the operation of signaling system. The first section specifies the
components, which may connected by wire, or wireless network. The second section will
describe the host application and how to use it to manage the user and generate reports. The
block diagram below shows the system components of the signaling system and the linkage
between.
Person Link
Edge Power International (HK) Ltd. Document Name:
4.1 System components
The signaling system has the following components:
5. Server panel
6. Client panel
7. Host PC
8. SMS subscribers.
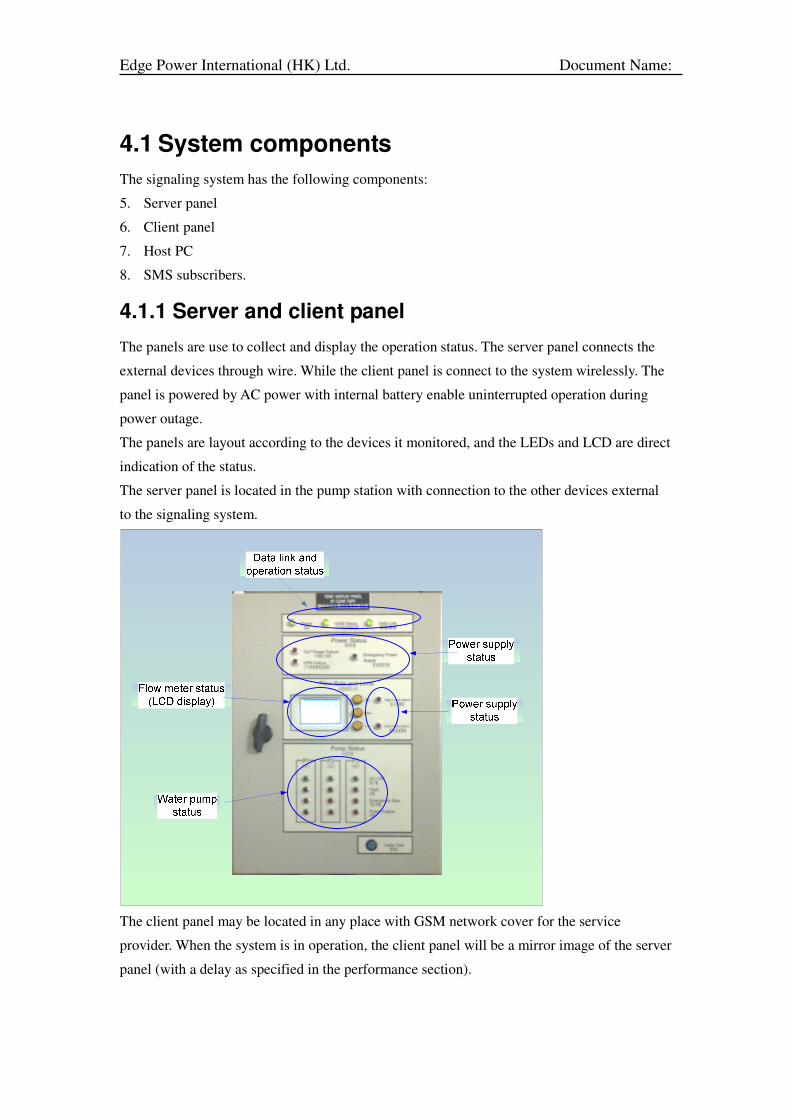
4.1.1 Server and client panel
The panels are use to collect and display the operation status. The server panel connects the
external devices through wire. While the client panel is connect to the system wirelessly. The
panel is powered by AC power with internal battery enable uninterrupted operation during
power outage.
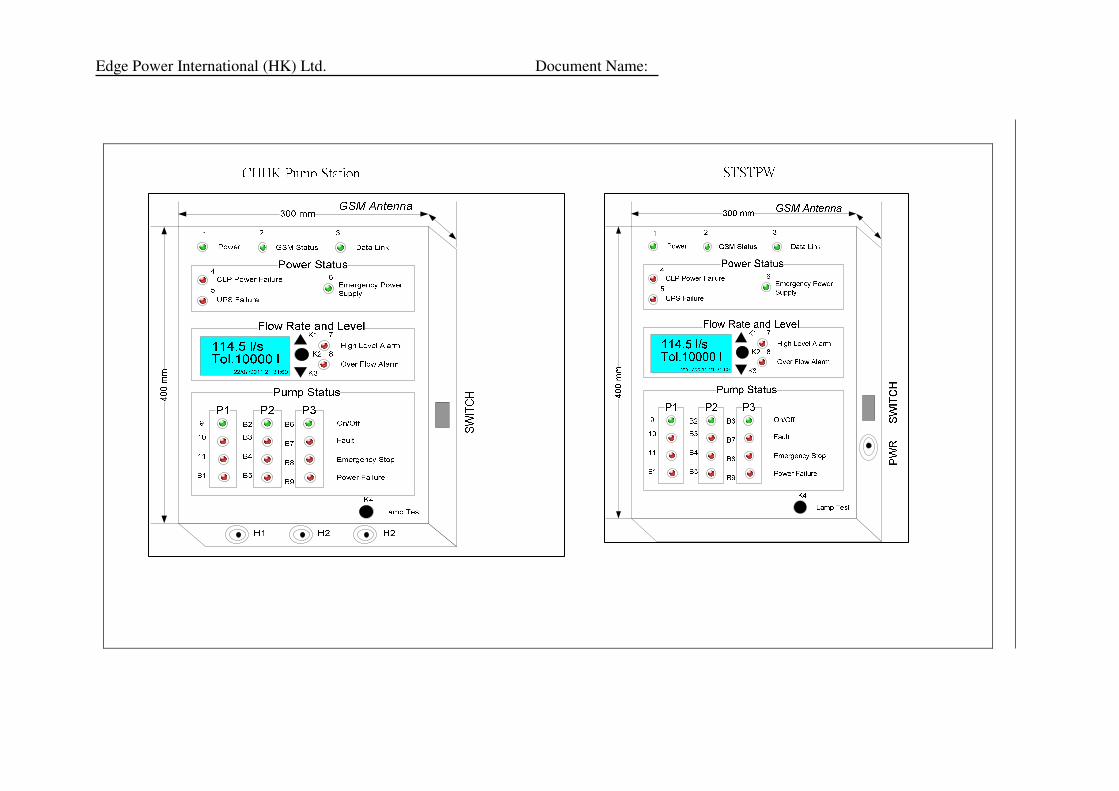
The panels are layout according to the devices it monitored, and the LEDs and LCD are direct
indication of the status.
The server panel is located in the pump station with connection to the other devices external
to the signaling system.
The client panel may be located in any place with GSM network cover for the service
provider. When the system is in operation, the client panel will be a mirror image of the server
panel (with a delay as specified in the performance section).
Edge Power International (HK) Ltd. Document Name:
4.1.1.1 Data link and operation indicator
There are three LED indicates the operation and data link: Power, GSM status and data link.
The power LED is on when the panel is powered. The LED will not distinguish whether the
panel is powered by battery or the power supply.
The GSM status indicates the activities of the GSM network. The LED will brink once with it
a message is received, and twice with it send out a message.
The data link LED indicates on the client panel indicates the linkage between the client and
the server: the LED will be off if the client did not receive a message for 1.5 minute.
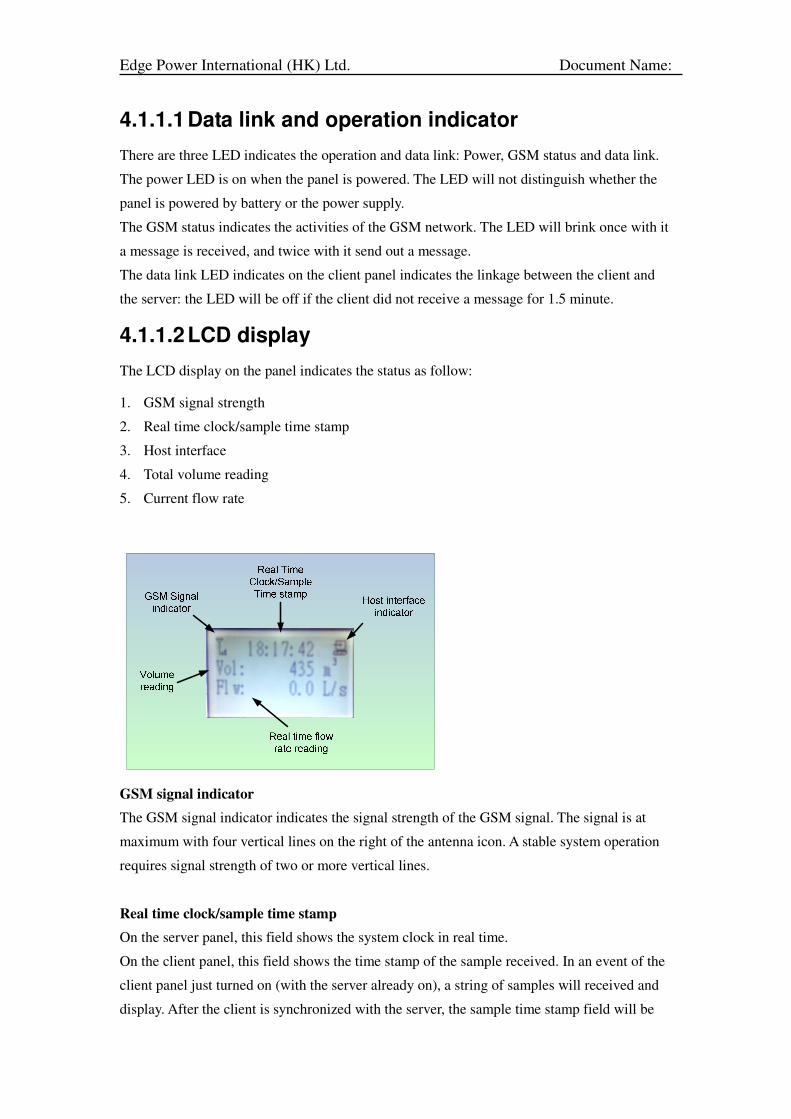
4.1.1.2 LCD display
The LCD display on the panel indicates the status as follow:
1. GSM signal strength
2. Real time clock/sample time stamp
3. Host interface
4. Total volume reading
5. Current flow rate
GSM signal indicator
The GSM signal indicator indicates the signal strength of the GSM signal. The signal is at
maximum with four vertical lines on the right of the antenna icon. A stable system operation
requires signal strength of two or more vertical lines.
Real time clock/sample time stamp
On the server panel, this field shows the system clock in real time.
On the client panel, this field shows the time stamp of the sample received. In an event of the
client panel just turned on (with the server already on), a string of samples will received and
display. After the client is synchronized with the server, the sample time stamp field will be
Edge Power International (HK) Ltd. Document Name:
update every 30 second.
Host interface indicator
The host interface indicator displays the status of host interface connection. When the host
interface is connected (USB/RS232 cable connected and the PC application is running), the
indicator will become animated with arrow flashed on top of the PC icon.
Total volume reading
The volume reading is the total volume flow through the pipes which installed flow meters.
The reading is reset to zero at 00:00:00 am every day, and start counting for the day.
Flow rate reading
The flow rate reading is the summary flow rate in two pipes with the flow meters installed.
4.1.2 Host PC
The host PC connects to the panel through a serial data link. A communication protocol with a
set of command will enable user perform the function as listed below:
1. Collect status information of the signaling system
2. Setup system parameters (i.e. day and time)
3. Set initial values
4. Fine tune reading from external device
5. Setup SMS user and event subscription
A PC application implemented utilized the command set enable user to perform the function
listed above with a graphic user interface. The PC application will be described in detail in the
PC application section.
4.1.3 SMS subscribers
A user may subscript to SMS message for events from the signaling system. The signaling
system is capable to handle up to 12 users. A SMS subscriber of the signal system mush
provides a valid mobile phone number, and the selection of events he/she want to subscript to.
Some of the event will have one message indicates it happened (i.e. total volume for the day).
While others may have two messages for an event (i.e. one message for power failure and one
for power back to normal).
4.2 Host application
The host application is a software application running on PC. The application will acquire
time status from the server panel and display result on the screen in real time. The status is
Edge Power International (HK) Ltd. Document Name:
stored at the PC in a format of data file. The host application use the data file to create report
in excel format.
The host application provide graphic user interface for setting system parameters and manage
SMS subscriber, as well as subscriptions.
The function is divided in to two GUI screen. The system setup and operation monitor screen
is used for system setup and real time monitoring. The second screen is used for manage SMS
subscriber and subscription, and report mange reports. The following section will have a
detail description of how to use the functions in host application.
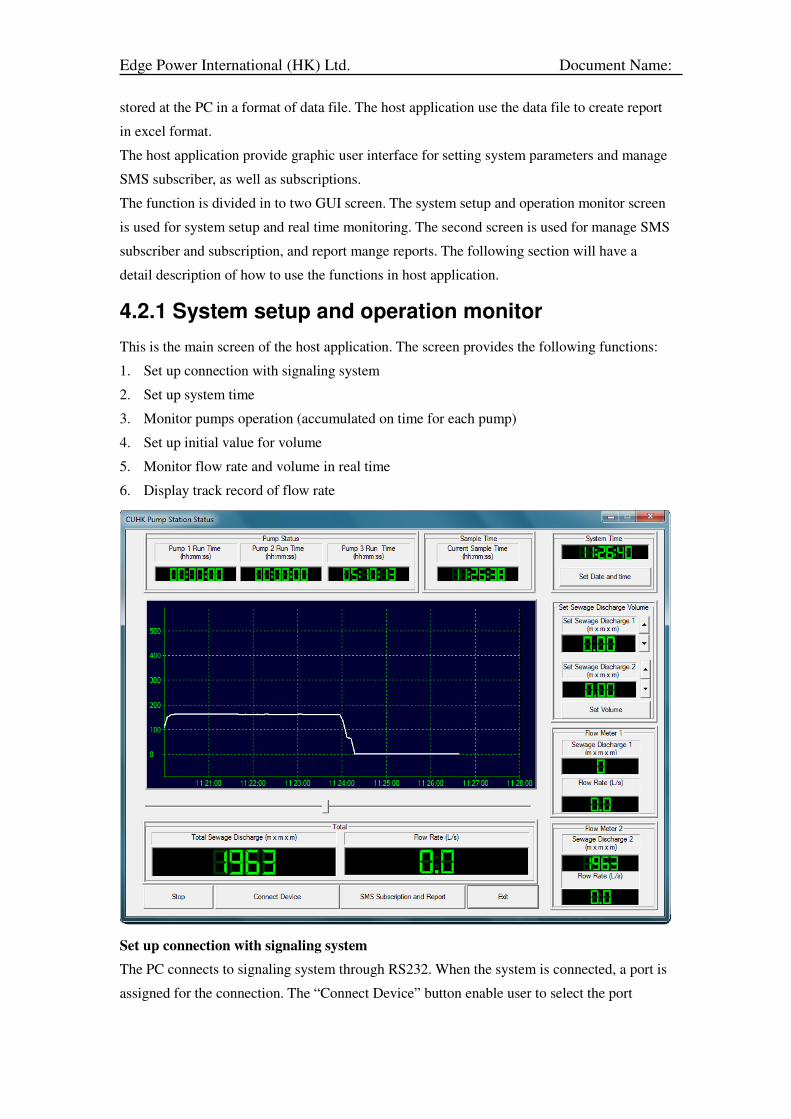
4.2.1 System setup and operation monitor
This is the main screen of the host application. The screen provides the following functions:
1. Set up connection with signaling system
2. Set up system time
3. Monitor pumps operation (accumulated on time for each pump)
4. Set up initial value for volume
5. Monitor flow rate and volume in real time
6. Display track record of flow rate
Set up connection with signaling system
The PC connects to signaling system through RS232. When the system is connected, a port is
assigned for the connection. The “Connect Device” button enable user to select the port
Edge Power International (HK) Ltd. Document Name:
number use for the connection. When the two systems are connected, the Start/Stop button
will be enabled.
Setup system time
The signaling system has its own real time clock. The clock should be synchronized with the
outside world (i.e. the computer time). The system time field display the computer time, while
the current sample time shows the signaling system time. The “Set data and time” button will
change the signaling system clock to the computer time.
Set up initial value for volume
The discharge volume for the signaling system is reset to zero and start counting from
00:00:00 am. When the signaling system is interrupted and restarted again, an initial value
may be set to adjust for the interruption time.
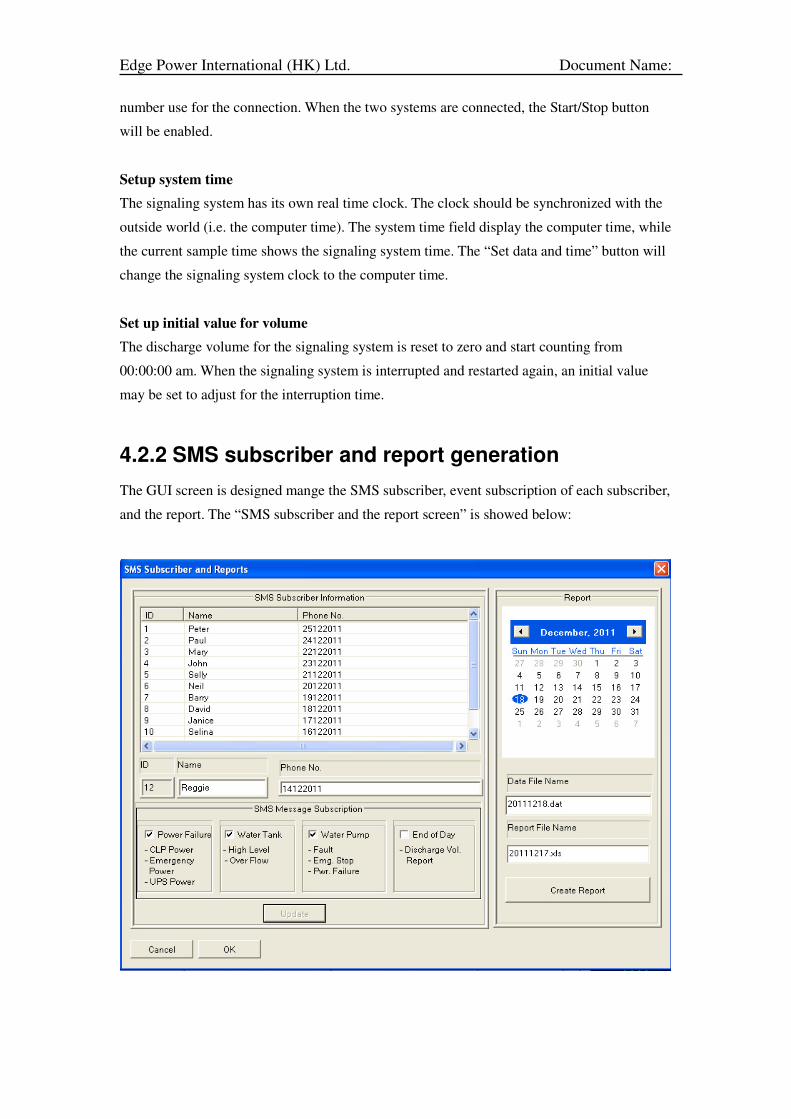
4.2.2 SMS subscriber and report generation
The GUI screen is designed mange the SMS subscriber, event subscription of each subscriber,
and the report. The “SMS subscriber and the report screen” is showed below:
Edge Power International (HK) Ltd. Document Name:
SMS subscriber and event subscription
SMS subscriber may be modified by selecting the user from the list, make change of name,
phone number and the subscription.
Report generator
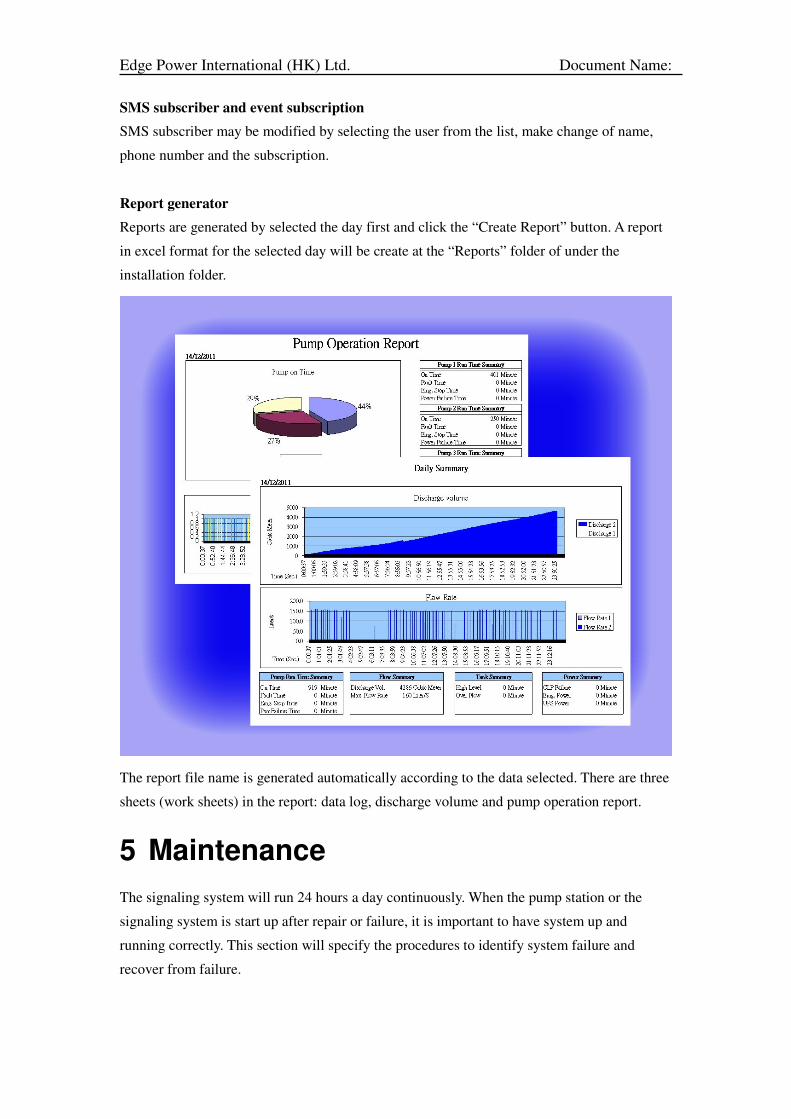
Reports are generated by selected the day first and click the “Create Report” button. A report
in excel format for the selected day will be create at the “Reports” folder of under the
installation folder.
The report file name is generated automatically according to the data selected. There are three
sheets (work sheets) in the report: data log, discharge volume and pump operation report.
5 Maintenance
The signaling system will run 24 hours a day continuously. When the pump station or the
signaling system is start up after repair or failure, it is important to have system up and
running correctly. This section will specify the procedures to identify system failure and
recover from failure.
Edge Power International (HK) Ltd. Document Name:
5.1 Normal operation
5.1.1 Lamp test button
The “Lamp test button” is located in the lower right hand corner of the panel box. The “lamp
test button” is designed to check if the LED display is function correctly. The respond to the
button push is also an indication of the system is still running. When the button is pushed, all
the LEDs will be turn on.
If none of the LED responds to the button push, please follow the procedure listed below:
1. Check connector
2. Check wiring
3. Check LED
4. If 1,2,3 step could not correct the problem, the system need to be reset
5.1.2 LCD display
5.1.2.1 System clock (server panel)
As indicates by previous section, the LCD display shows the system clock of the signaling
system. The clock will be updated every second, and it is an indication of the system is
running. If the clock stopped, please follow the procedure listed below:
1. Check connection cable from the PCB to the LCD
2. “Lamp test button”. If the “Lamp test button” failed the system is down and need to be
reset or restart.
The system clock may have a variation of +- 3~4 second per day. Please check and
synchronize the system clock using the host application.
5.1.2.2 Sample clock (client panel)
The clock display the time stamp of the current sample received. The clock will be updated
approximately 30 second (20 second if the one or more pump is on).
5.1.2.3 Host Link
As described in the previous chapter, the host link icon indicates the status of host connection.
Under normal operation, the host should be connected to the panel at the server side. If the
animated icon is not moving, please follow the procedure listed below:
1. Check the USB cable to the PC,
2. Check host application.
3. If step 1,2 could not correct the problem, restart the host application
Edge Power International (HK) Ltd. Document Name:
5.1.2.4 Flow rate and calibration
The flow rate field will display the total of flow meter 1 and 2. The reading should be within
+-5% of the reading show at flow meter. A re-calibration will be needed if the discrepancy
exceeded the range. Flow rate calibration may be performed when system is running.
However, since this is a critical procedure, calibration should not be performed by ordinary
user.
5.1.3 Data link LED (client)
The data link LED indicates the linkage between the server and client. The under normal
operation, data link LED should be always on. In circumstances like network traffic is
congested, or server has a large number of SMS to send, the data link LED may be temporary
for a while. However, if the data link LED is off for a few minute, please follow the procedure
listed below:
1. Check GSM antenna and signal strength
2. Check GEM modem light blink at the frequency of about 1 Hz
3. If the blink faster then 1 Hz, check SIM card, connection and subscription expiration
date.
4. If step 1,2,3 could not correct the problem. Go to the server site and
5. Check GSM status LED and check if it blinks twice every 30 second.
6. Reset the server panel if GSM status LED does not blink
7. Consult network service provider
5.2 System start up
This section will specify the procedure for reset or power down/up the system.
5.2.1 Before reset/power down
When system is reset or power down, there will be data lost. Some may need to be recorded
and restored when the system is up. Please follow the procedure listed below prior to system
reset or power down:
1. Record the flow volume on signaling system
2. Record the flow volume on the flow meter
3. Record the pump on time for all three pumps
4. Record the data/time of the reset/power down
5.2.2 After reset/power up
When system is back on running, data has to be re-installed and system parameters have to be
set. Please follow the procedure listed below after system reset or power down:
Edge Power International (HK) Ltd. Document Name:
1. Reset system clock (click “Set date and time” button on the main screen)
2. Set volume (use up arrow at “Sewage discharge volume” field and click set button)
5.2.3 Reset and Power down/up
There is a power switch on the right hand side of the panel box. In order to reset the system,
please open the cover of the panel box and locate the SCB and push the button indicated in
the SCB physical layout section.
6 Summary
The introduction of the signaling system into the pump station elevated the automation of
pump station management into a new level. Since the operation of a pump station for a
sewage system is critical for the environment of the area. The addition of advance signaling
system in the pump station will enable pump station status to be recorded automatically,
monitored remotely. Important status (i.e. abnormal system behavior) or data (i.e. end of the
day data) will be notice by SMS immediately.
.
Edge Power International (HK) Ltd. Document Name:
Appendix A Hardware interface (with other system components)
Table of CablesTable of CablesTable of CablesTable of Cables
CablCablCablCabl
eeee NameNameNameName FromFromFromFrom ToToToTo WireWireWireWire SpecificationSpecificationSpecificationSpecification RemarkRemarkRemarkRemark
1 A PLC DIB 37 1.5 mm2/37 core
2 B PLC DIB 37 1.5 mm2/37 core
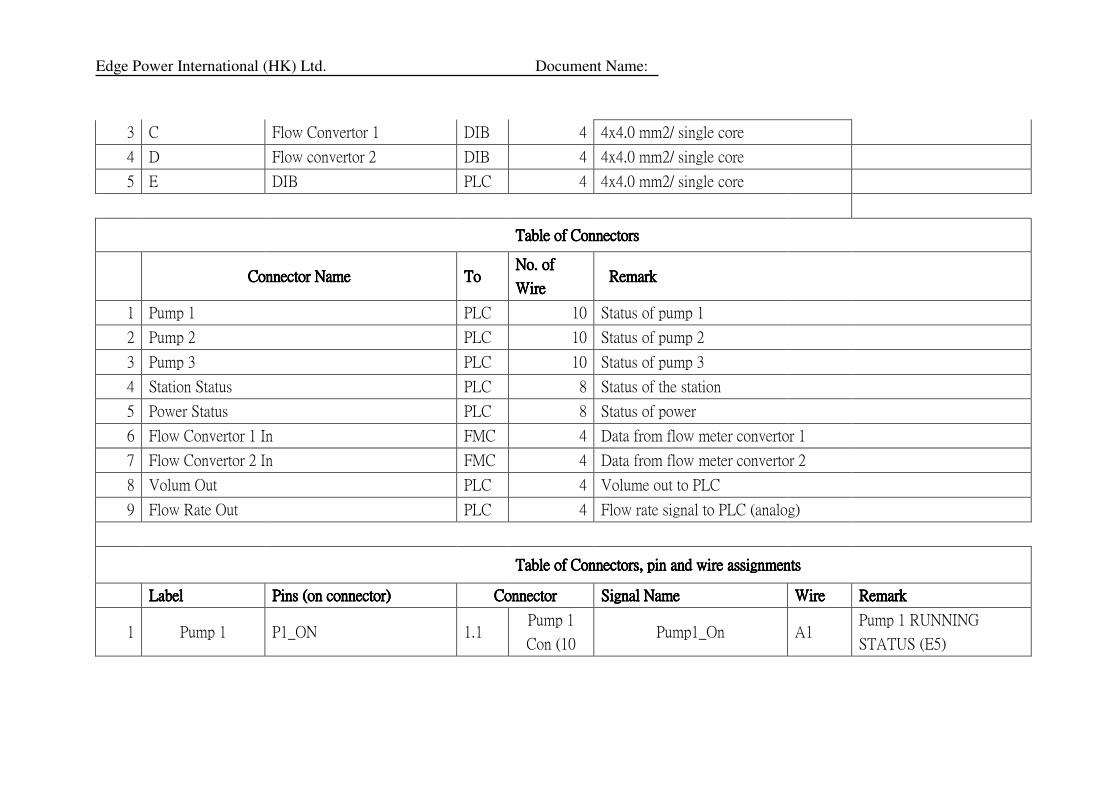
Edge Power International (HK) Ltd. Document Name:
3 C Flow Convertor 1 DIB 4 4x4.0 mm2/ single core
4 D Flow convertor 2 DIB 4 4x4.0 mm2/ single core
5 E DIB PLC 4 4x4.0 mm2/ single core
Table of ConnectorsTable of ConnectorsTable of ConnectorsTable of Connectors
Connector NameConnector NameConnector NameConnector Name ToToToTo No. of No. of No. of No. of
WireWireWireWire RemarkRemarkRemarkRemark
1 Pump 1 PLC 10 Status of pump 1
2 Pump 2 PLC 10 Status of pump 2
3 Pump 3 PLC 10 Status of pump 3
4 Station Status PLC 8 Status of the station
5 Power Status PLC 8 Status of power
6 Flow Convertor 1 In FMC 4 Data from flow meter convertor 1
7 Flow Convertor 2 In FMC 4 Data from flow meter convertor 2
8 Volum Out PLC 4 Volume out to PLC
9 Flow Rate Out PLC 4 Flow rate signal to PLC (analog)
Table of Connectors, pin and wire assignmentsTable of Connectors, pin and wire assignmentsTable of Connectors, pin and wire assignmentsTable of Connectors, pin and wire assignments
LabelLabelLabelLabel Pins (on connector)Pins (on connector)Pins (on connector)Pins (on connector) ConnectorConnectorConnectorConnector Signal NameSignal NameSignal NameSignal Name WireWireWireWire RemarkRemarkRemarkRemark
1 Pump 1 P1_ON 1.1 Pump 1
Con (10 Pump1_On A1
Pump 1 RUNNING
STATUS (E5)
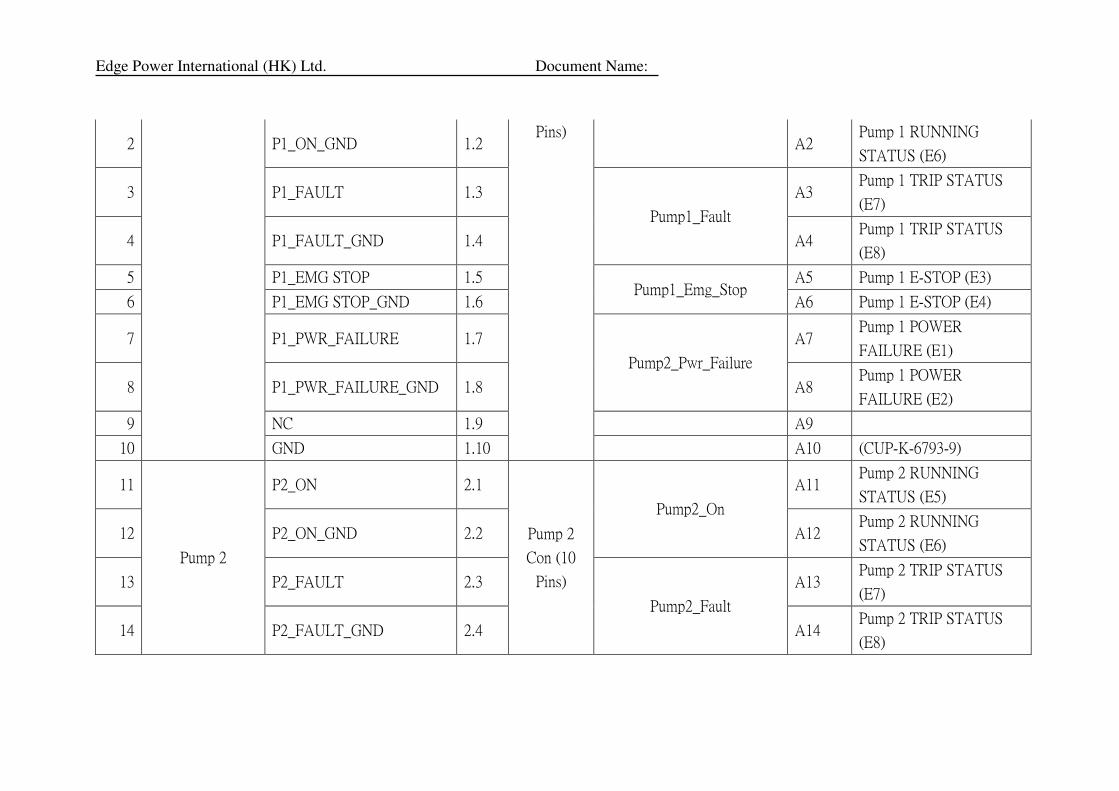
Edge Power International (HK) Ltd. Document Name:
2 P1_ON_GND 1.2 Pins)
A2 Pump 1 RUNNING
STATUS (E6)
3 P1_FAULT 1.3
Pump1_Fault
A3 Pump 1 TRIP STATUS
(E7)
4 P1_FAULT_GND 1.4 A4 Pump 1 TRIP STATUS
(E8)
5 P1_EMG STOP 1.5 Pump1_Emg_Stop
A5 Pump 1 E-STOP (E3)
6 P1_EMG STOP_GND 1.6 A6 Pump 1 E-STOP (E4)
7 P1_PWR_FAILURE 1.7
Pump2_Pwr_Failure
A7 Pump 1 POWER
FAILURE (E1)
8 P1_PWR_FAILURE_GND 1.8 A8 Pump 1 POWER
FAILURE (E2)
9 NC 1.9 A9
10 GND 1.10 A10 (CUP-K-6793-9)
11
Pump 2
P2_ON 2.1
Pump 2
Con (10
Pins)
Pump2_On
A11 Pump 2 RUNNING
STATUS (E5)
12 P2_ON_GND 2.2 A12 Pump 2 RUNNING
STATUS (E6)
13 P2_FAULT 2.3
Pump2_Fault
A13 Pump 2 TRIP STATUS
(E7)
14 P2_FAULT_GND 2.4 A14 Pump 2 TRIP STATUS
(E8)
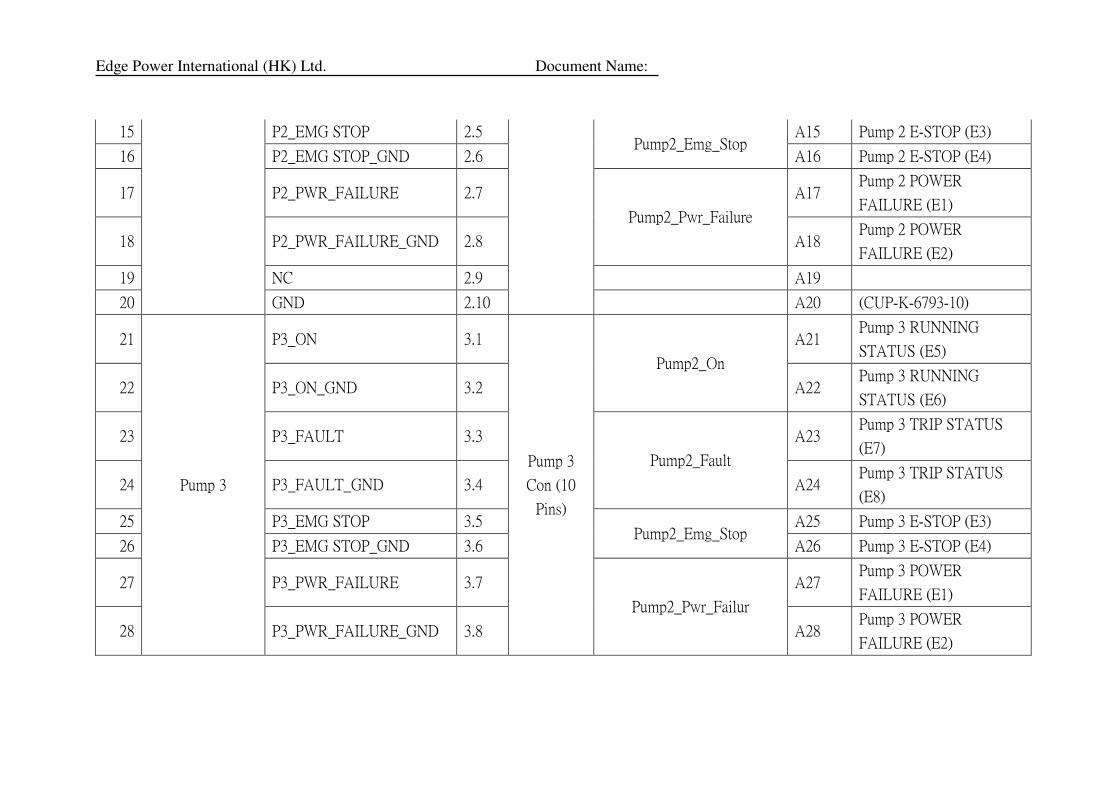
Edge Power International (HK) Ltd. Document Name:
15 P2_EMG STOP 2.5 Pump2_Emg_Stop
A15 Pump 2 E-STOP (E3)
16 P2_EMG STOP_GND 2.6 A16 Pump 2 E-STOP (E4)
17 P2_PWR_FAILURE 2.7
Pump2_Pwr_Failure
A17 Pump 2 POWER
FAILURE (E1)
18 P2_PWR_FAILURE_GND 2.8 A18 Pump 2 POWER
FAILURE (E2)
19 NC 2.9 A19
20 GND 2.10 A20 (CUP-K-6793-10)
21
Pump 3
P3_ON 3.1
Pump 3
Con (10
Pins)
Pump2_On
A21 Pump 3 RUNNING
STATUS (E5)
22 P3_ON_GND 3.2 A22 Pump 3 RUNNING
STATUS (E6)
23 P3_FAULT 3.3
Pump2_Fault
A23 Pump 3 TRIP STATUS
(E7)
24 P3_FAULT_GND 3.4 A24 Pump 3 TRIP STATUS
(E8)
25 P3_EMG STOP 3.5 Pump2_Emg_Stop
A25 Pump 3 E-STOP (E3)
26 P3_EMG STOP_GND 3.6 A26 Pump 3 E-STOP (E4)
27 P3_PWR_FAILURE 3.7
Pump2_Pwr_Failur
A27 Pump 3 POWER
FAILURE (E1)
28 P3_PWR_FAILURE_GND 3.8 A28 Pump 3 POWER
FAILURE (E2)
Edge Power International (HK) Ltd. Document Name:
29 NC 3.9 A29
30 GND 3.10 A30 (CUP-K-6793-11)
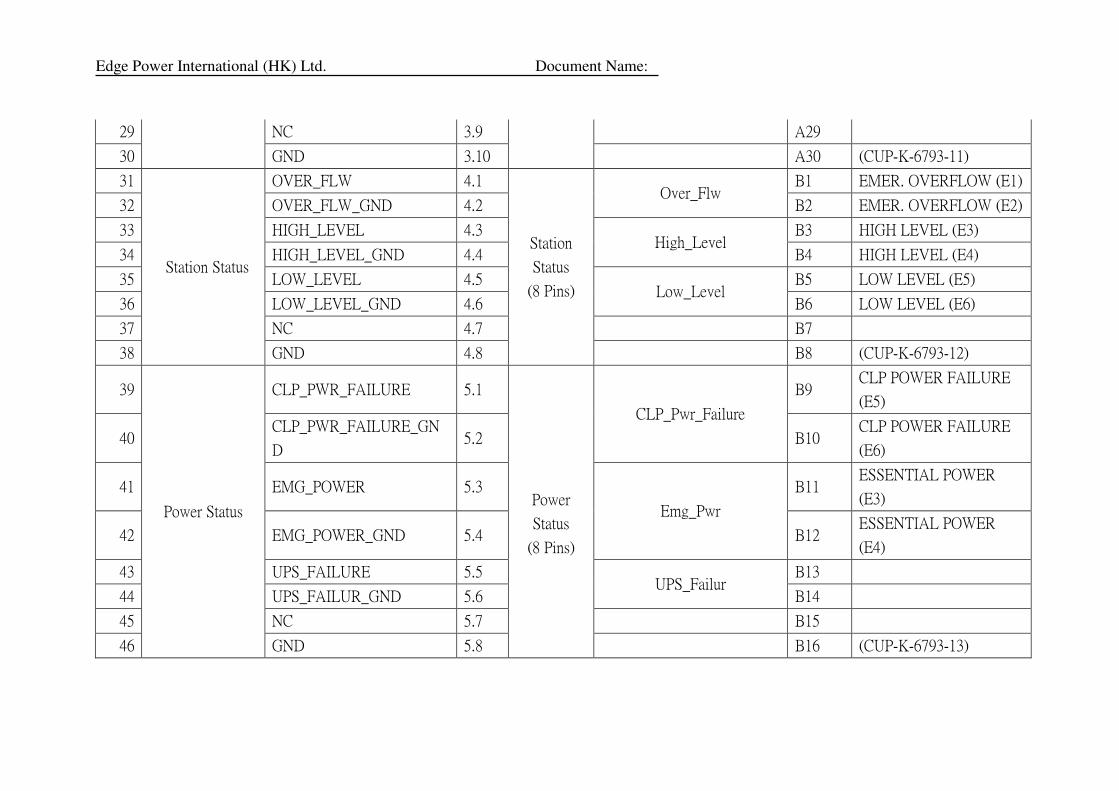
31
Station Status
OVER_FLW 4.1
Station
Status
(8 Pins)
Over_Flw B1 EMER. OVERFLOW (E1)
32 OVER_FLW_GND 4.2 B2 EMER. OVERFLOW (E2)
33 HIGH_LEVEL 4.3 High_Level
B3 HIGH LEVEL (E3)
34 HIGH_LEVEL_GND 4.4 B4 HIGH LEVEL (E4)
35 LOW_LEVEL 4.5 Low_Level
B5 LOW LEVEL (E5)
36 LOW_LEVEL_GND 4.6 B6 LOW LEVEL (E6)
37 NC 4.7 B7
38 GND 4.8 B8 (CUP-K-6793-12)
39
Power Status
CLP_PWR_FAILURE 5.1
Power
Status
(8 Pins)
CLP_Pwr_Failure
B9 CLP POWER FAILURE
(E5)
40 CLP_PWR_FAILURE_GN
D 5.2 B10
CLP POWER FAILURE
(E6)
41 EMG_POWER 5.3
Emg_Pwr
B11 ESSENTIAL POWER
(E3)
42 EMG_POWER_GND 5.4 B12 ESSENTIAL POWER
(E4)
43 UPS_FAILURE 5.5 UPS_Failur
B13
44 UPS_FAILUR_GND 5.6 B14
45 NC 5.7 B15
46 GND 5.8 B16 (CUP-K-6793-13)
Edge Power International (HK) Ltd. Document Name:
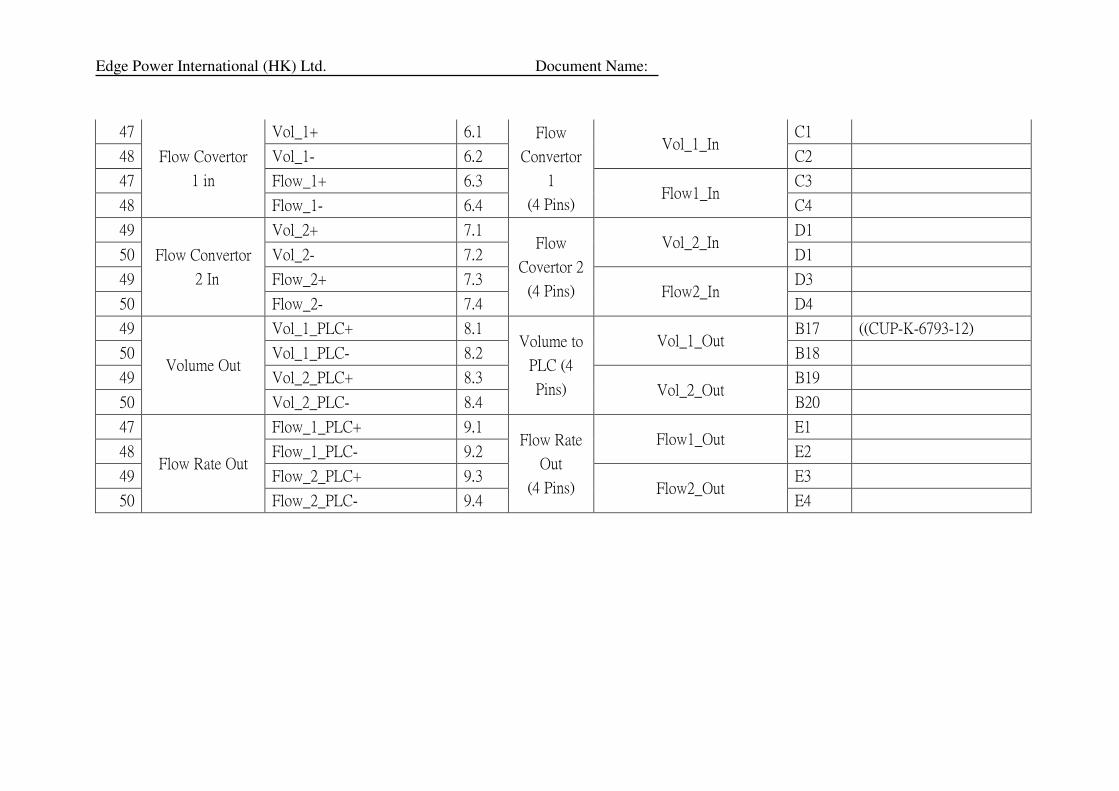
47
Flow Covertor
1 in
Vol_1+ 6.1 Flow
Convertor
1
(4 Pins)
Vol_1_In C1
48 Vol_1- 6.2 C2
47 Flow_1+ 6.3 Flow1_In
C3
48 Flow_1- 6.4 C4
49
Flow Convertor
2 In
Vol_2+ 7.1 Flow
Covertor 2
(4 Pins)
Vol_2_In D1
50 Vol_2- 7.2 D1
49 Flow_2+ 7.3 Flow2_In
D3
50 Flow_2- 7.4 D4
49
Volume Out
Vol_1_PLC+ 8.1 Volume to
PLC (4
Pins)
Vol_1_Out B17 ((CUP-K-6793-12)
50 Vol_1_PLC- 8.2 B18
49 Vol_2_PLC+ 8.3 Vol_2_Out
B19
50 Vol_2_PLC- 8.4 B20
47
Flow Rate Out
Flow_1_PLC+ 9.1 Flow Rate
Out
(4 Pins)
Flow1_Out E1
48 Flow_1_PLC- 9.2 E2
49 Flow_2_PLC+ 9.3 Flow2_Out
E3
50 Flow_2_PLC- 9.4 E4
Edge Power International (HK) Ltd. Document Name:
Appendix B Internal cables and signal assignment
Edge Power International (HK) Ltd. Document Name:
CUHK Pump Station STSTPW
Edge Power International (HK) Ltd. Document Name:
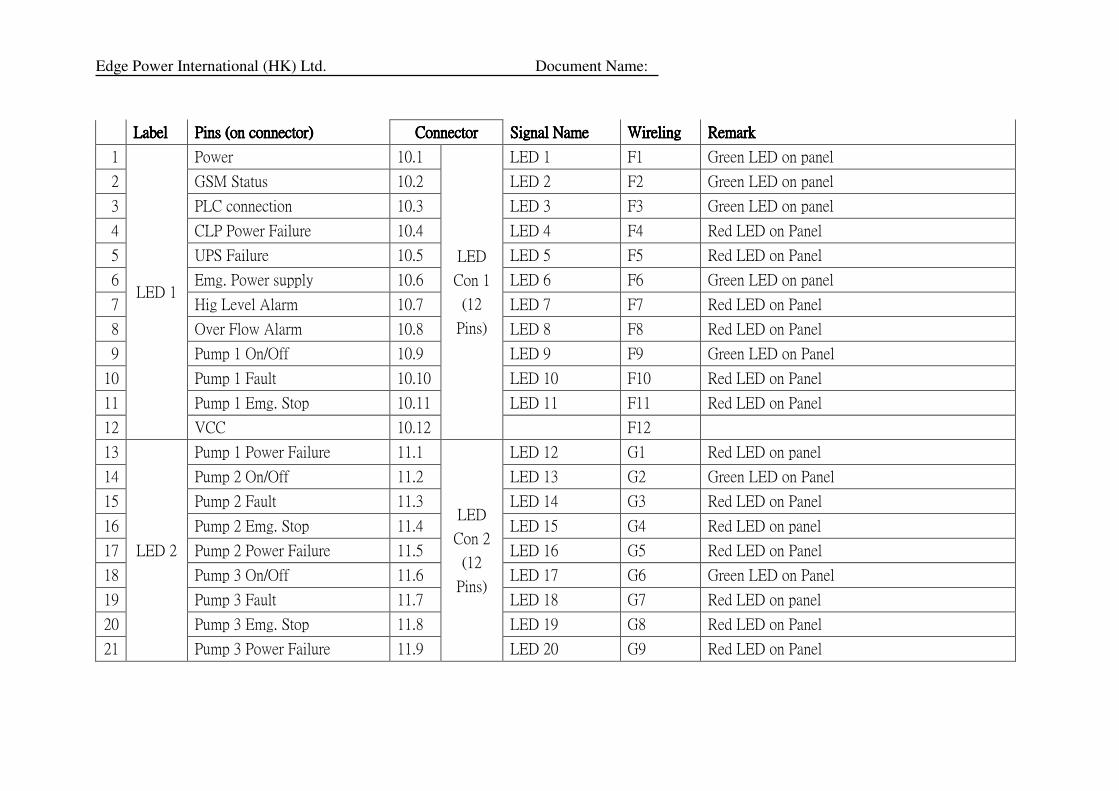
LabelLabelLabelLabel Pins (on connector)Pins (on connector)Pins (on connector)Pins (on connector) ConnectorConnectorConnectorConnector Signal NameSignal NameSignal NameSignal Name WirelingWirelingWirelingWireling RemarkRemarkRemarkRemark
1
LED 1
Power 10.1
LED
Con 1
(12
Pins)
LED 1 F1 Green LED on panel
2 GSM Status 10.2 LED 2 F2 Green LED on panel
3 PLC connection 10.3 LED 3 F3 Green LED on panel
4 CLP Power Failure 10.4 LED 4 F4 Red LED on Panel
5 UPS Failure 10.5 LED 5 F5 Red LED on Panel
6 Emg. Power supply 10.6 LED 6 F6 Green LED on panel
7 Hig Level Alarm 10.7 LED 7 F7 Red LED on Panel
8 Over Flow Alarm 10.8 LED 8 F8 Red LED on Panel
9 Pump 1 On/Off 10.9 LED 9 F9 Green LED on Panel
10 Pump 1 Fault 10.10 LED 10 F10 Red LED on Panel
11 Pump 1 Emg. Stop 10.11 LED 11 F11 Red LED on Panel
12 VCC 10.12 F12
13
LED 2
Pump 1 Power Failure 11.1
LED
Con 2
(12
Pins)
LED 12 G1 Red LED on panel
14 Pump 2 On/Off 11.2 LED 13 G2 Green LED on Panel
15 Pump 2 Fault 11.3 LED 14 G3 Red LED on Panel
16 Pump 2 Emg. Stop 11.4 LED 15 G4 Red LED on panel
17 Pump 2 Power Failure 11.5 LED 16 G5 Red LED on Panel
18 Pump 3 On/Off 11.6 LED 17 G6 Green LED on Panel
19 Pump 3 Fault 11.7 LED 18 G7 Red LED on panel
20 Pump 3 Emg. Stop 11.8 LED 19 G8 Red LED on Panel
21 Pump 3 Power Failure 11.9 LED 20 G9 Red LED on Panel
Edge Power International (HK) Ltd. Document Name:
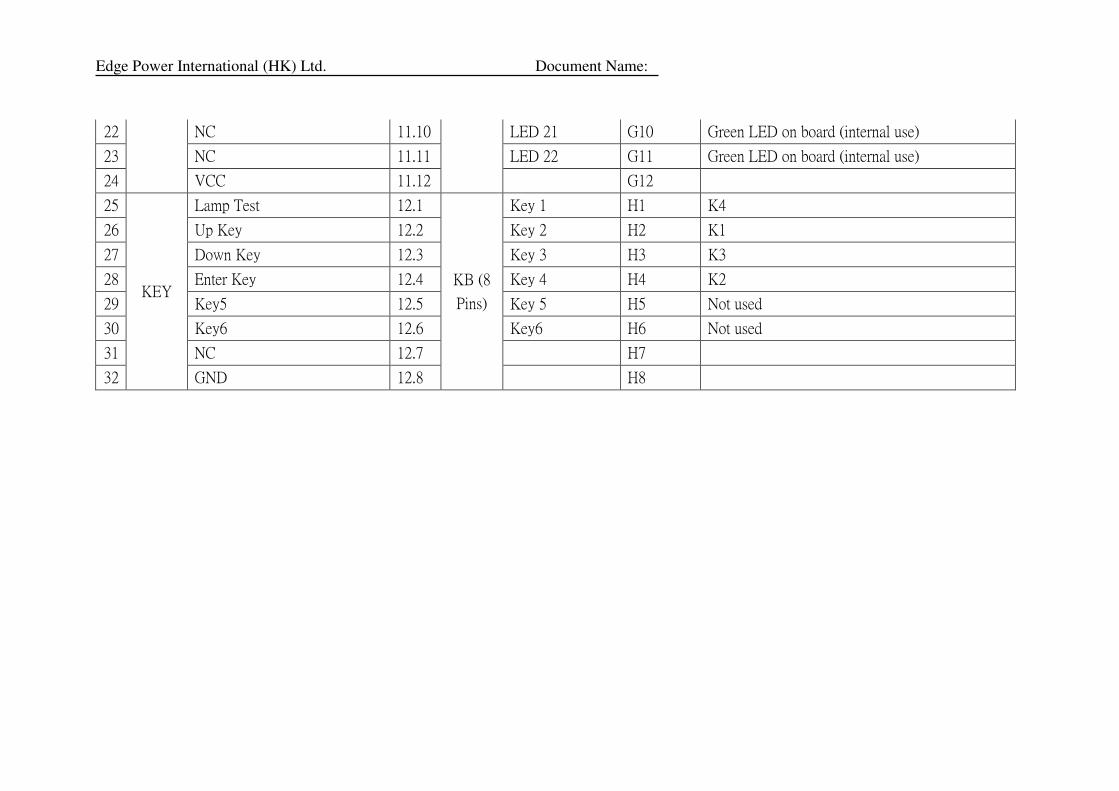
22 NC 11.10 LED 21 G10 Green LED on board (internal use)
23 NC 11.11 LED 22 G11 Green LED on board (internal use)
24 VCC 11.12 G12
25
KEY
Lamp Test 12.1
KB (8
Pins)
Key 1 H1 K4
26 Up Key 12.2 Key 2 H2 K1
27 Down Key 12.3 Key 3 H3 K3
28 Enter Key 12.4 Key 4 H4 K2
29 Key5 12.5 Key 5 H5 Not used
30 Key6 12.6 Key6 H6 Not used
31 NC 12.7 H7
32 GND 12.8 H8
Edge Power International (HK) Ltd. Document Name:
Appendix C Event and SMS message
Event and EventEvent and EventEvent and EventEvent and Event MessagesMessagesMessagesMessages
Table of Event and Event messagesTable of Event and Event messagesTable of Event and Event messagesTable of Event and Event messages
Edge Power International (HK) Ltd. Document Name:
EventEventEventEvent Client Client Client Client
NoticeNoticeNoticeNotice
Host Host Host Host
NoticeNoticeNoticeNotice
PersonalPersonalPersonalPersonal
NoticeNoticeNoticeNotice On messageOn messageOn messageOn message Off messageOff messageOff messageOff message
1 PUMP1 ON EVENT Yes Yes No
2 PUMP1 FAULT EVENT Yes Yes Yes
DC/2009/14
TSPF in CUHK
Pump 1 Tripped
DC/2009/14
TSPF in CUHK
Pump 1 back frm Trip
3 PUMP1 STOP EVENT Yes Yes Yes
DC/2009/14
TSPF in CUHK Pump 1 E-Stop
Pressed
DC/2009/14 TSPF in CUHK Pump 1
E-Stop released
4 PUMP1 PWR FAILUR EVENT Yes Yes Yes
DC/2009/14
TSPF in CUHK
Pump 1 Power Failure
DC/2009/14
TSPF in CUHK
Pump 1 back frm Power Failure
6 PUMP2 ON EVENT Yes Yes No
7 PUMP2 FAULT EVENT Yes Yes Yes
DC/2009/14
TSPF in CUHK
Pump 2 Tripped
DC/2009/14
TSPF in CUHK
Pump 2 back frm Trip
8 PUMP2 STOP EVENT Yes Yes Yes
DC/2009/14
TSPF in CUHK
Pump 2 E-Stop pressed
DC/2009/14
TSPF in CUHK
Pump 2 E-Stop released
9 PUMP2 PWR FAILUR EVENT Yes Yes Yes
DC/2009/14
TSPF in CUHK
Pump 2 Power Failure
DC/2009/14
TSPF in CUHK
Pump 2 back frm Power Failure
Edge Power International (HK) Ltd. Document Name:
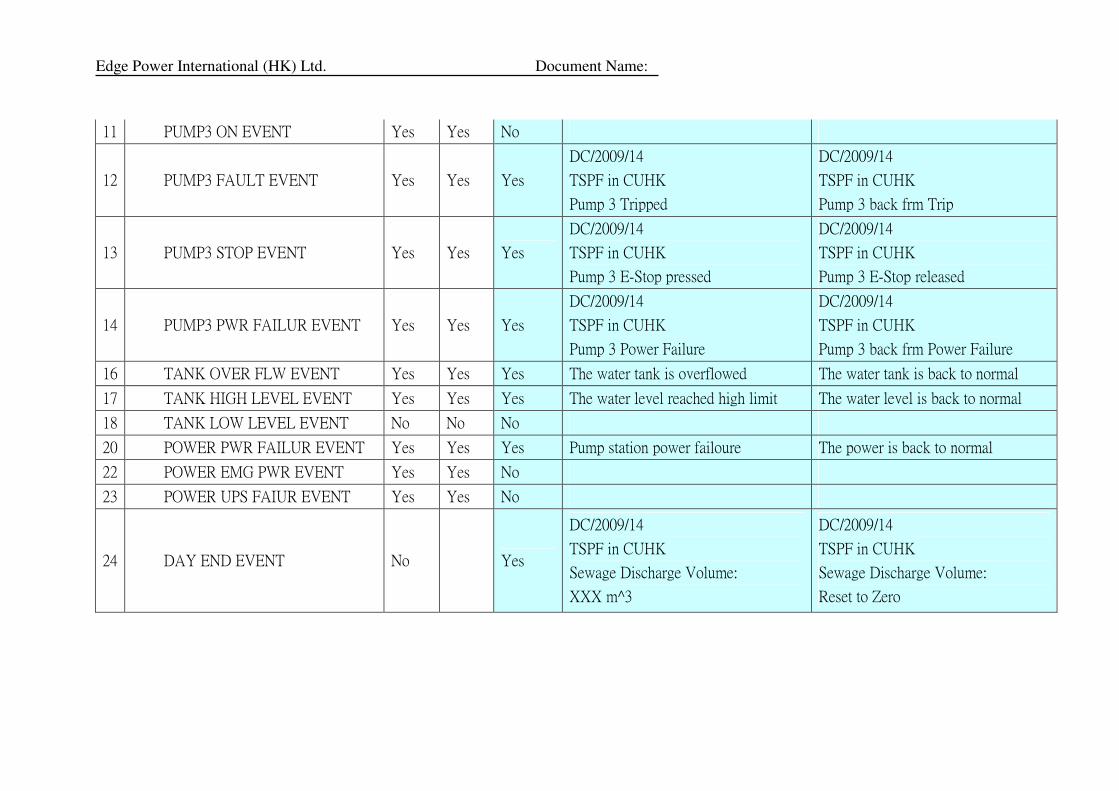
11 PUMP3 ON EVENT Yes Yes No
12 PUMP3 FAULT EVENT Yes Yes Yes
DC/2009/14
TSPF in CUHK
Pump 3 Tripped
DC/2009/14
TSPF in CUHK
Pump 3 back frm Trip
13 PUMP3 STOP EVENT Yes Yes Yes
DC/2009/14
TSPF in CUHK
Pump 3 E-Stop pressed
DC/2009/14
TSPF in CUHK
Pump 3 E-Stop released
14 PUMP3 PWR FAILUR EVENT Yes Yes Yes
DC/2009/14
TSPF in CUHK
Pump 3 Power Failure
DC/2009/14
TSPF in CUHK
Pump 3 back frm Power Failure
16 TANK OVER FLW EVENT Yes Yes Yes The water tank is overflowed The water tank is back to normal
17 TANK HIGH LEVEL EVENT Yes Yes Yes The water level reached high limit The water level is back to normal
18 TANK LOW LEVEL EVENT No No No
20 POWER PWR FAILUR EVENT Yes Yes Yes Pump station power failoure The power is back to normal
22 POWER EMG PWR EVENT Yes Yes No
23 POWER UPS FAIUR EVENT Yes Yes No
24 DAY END EVENT No Yes
DC/2009/14
TSPF in CUHK
Sewage Discharge Volume:
XXX m^3
DC/2009/14
TSPF in CUHK
Sewage Discharge Volume:
Reset to Zero