Embed Size (px)
Citation preview
HYDRAULICS BRANCH OFFICIAL FILE COPY
SEVENTH INTERAGENCY CONFERENCE ON
HYDRAULIC LABORATORY TECHNIQUES AND INSTRUMENTATION
APRIL 21 · . 22, 1971
CORPS OF ENGINEERS TENNESSEE VALLEY AUTHORITY
BUREAU OF RECLAMATION
Bureau of Reclamation Engineering and Research Center
Denver, Colorado
SEVENTH INTERAGENCY CONFERENCE ON
HYDRAULIC LABORATORY TECHNIQUES AND INSTRUMENTATION
April 21-22, 1971
CORPS or ENGINEERS TENNESSEE VALLEY AUTHORITY
BUREAU OF RECLAMATION
Bureau of Reclamation Engineering and Research Center
Denver, Colorado
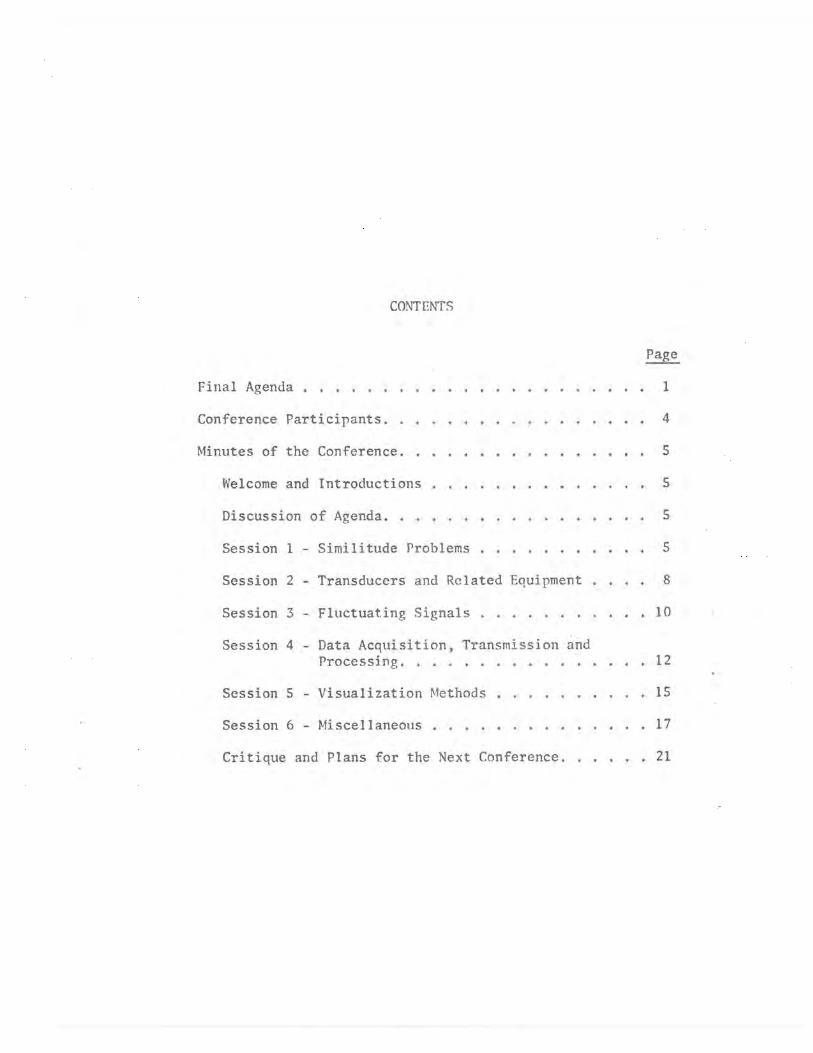
CONTENTS
Final Agenda ...•.•
Conference Participants.
Minutes of the Conference.
Welcome and Introductions
Discussion of Agenda ...
Session 1 - Similitude Problems
Session 2 - Transducers and Related Equipment
Session 3 - Fluctuating Signals ..
Session 4 - Data Acquisition, Transmission and
1
4
s
s
s
s
8
10
Processing. . . 12
Session S - Visualization Methods 15
Session 6 Miscellaneous
Critique and Plans for the Next Conference.
17
21
SEVENTH INTERAGENCY CONFERENCE ON
HYDRAULIC LABORATORY TECHNIQUES AND INSTRUMENTATION
April 21-22, 1971
Bureau of Reclamation Engineering and Research Center
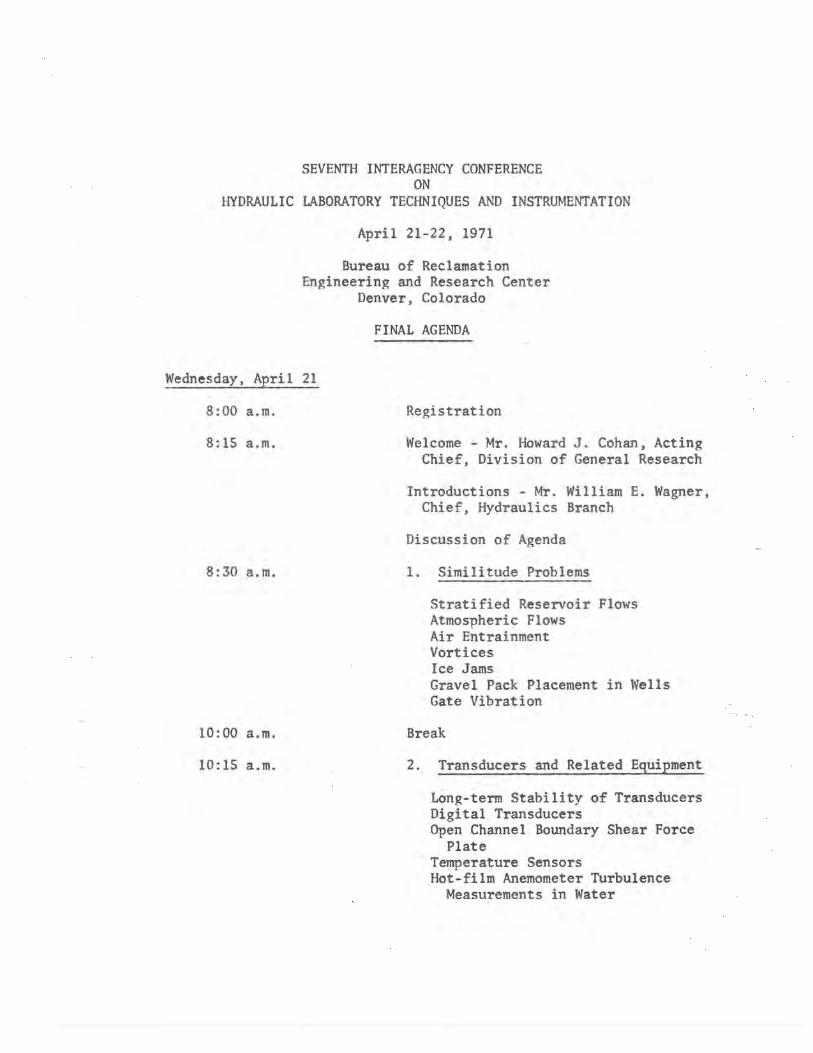
Wednesday, April 21
8:00 a.m.
8:15 a.m.
8:30 a.m.
10:00 a.m.
10:15 a.m.
Denver, Colorado
FINAL AGENDA
Registration
Welcome - Mr. Howard J. Cohan, Acting Chief, Division of General Research
Introductions - Mr. William E. Wagner, Chief, Hydraulics Branch
Discussion of Agenda
1. Similitude Problems
Stratified Reservoir Flows Atmospheric Flows Air Entrainment Vortices Ice Jams Gravel Pack Placement in Wells Gate Vibration
Break
2. Transducers and Related Equipment
Long-term Stability of Transducers Digital Transducers Open Channel Boundary Shear Force
Plate Temperature Sensors Hot-film Anemometer Turbulence
Measurements in Water
11:45 a.m.
12:45 p.m.
2:15 p.m.
2:30 p.m.
Thursday, April 22
8:15 a.m.
9:45 a.m.
10:00 a.m.
Lunch
3. Fluctuating Signals
Analog Versus Digital Data Processing
Wave and Surge Measurements Pressure Surges Nappe Oscillation Dynamic Loads on Training Walls
Break
4. Data Acquisition, Transmission, and Processing
·Automated Data Acquisition and Processing
Model Control and On-line Data Reduction by Digital Computer
R-F and Hard Wire Data Transfer Data Logging and Processing by
Mini-computers Analog to Digital Data Interface
Equipment
5, Visualization Methods
Video Tape Recording Laser Shadowgrams Infrared Sensing Underwater 1V Time-sequence Motion Pictures
Break
6. Miscellaneous
2
Dilution and Dispersion Sampling of Particles Suspended
in Air or Water Specific Gravity Determination
of Saline Solutions Two-phase (Air, Water) Testing Ice and Spray Nozzles
11:20 a.m.
11: 30 a.m.
11 :45 a.m.
12:45 p.m.
2:30 p.m.
6. Miscellaneous (Cont)
Velocity and Oxygen Monitoring in Spawning Gravels
Field-related Topics
Critique and Plans for the Next Conference
Photographs
Lunch
Hydraulics Laboratory Tour
Special Interest Discussions
3
~\
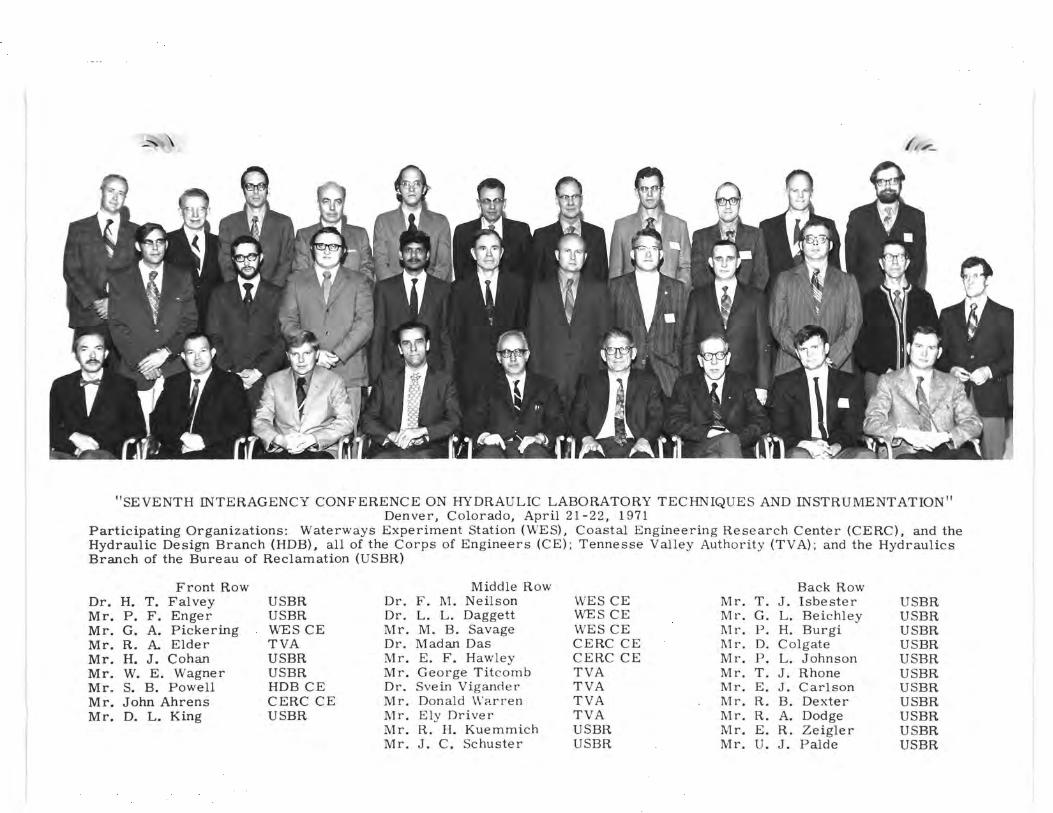
"SEVENTH INTERAGENCY CONFERENCE ON HYDRAULIC LABORATORY TECHNIQUES AND INSTRUMENTATION" Denver, Colorado, April 21-22, 1971
Participating Organizations: Waterways Experiment Station (WES), Coastal Engineering Research Center (CERC), and the Hydraulic Design Branch (HDB), all of the Corps of Engineers (CE) ; Tennesse Valley Authority (TVA); and the Hydraulics Branch of the Bureau of Reclamation (USBR)
Front Row Middle Row Back Row Dr. H. T. Falvey USBR Dr. F. M. Neilson WES CE Mr. T. J. Isbester USBR Mr. P. F. Enger USBR Dr. L. L. Daggett WES CE Mr. G. L. Beichley USBR Mr. G. A. Pickering WES CE Mr. M. B. Savage WES CE 1\1 r. P. H. Burgi USBR Mr. R. A. Elder TVA Dr. Madan Das CERC CE Mr. D. Colgate USBR Mr. H. J. Cohan USBR Mr. E. F. Hawley CERC CE Mr. P. L. Johnson USBR Mr. w. E. Wagner USBR Mr. George Titcomb TVA Mr. T. J. Rhone USBR Mr. s. B. Powell HDB CE Dr. Svein Vigancier TVA Mr. E. J. Carlson USBR Mr. John Ahrens CERC CE Mr. Donald Warren TVA Mr. R. B. Dexter USBR Mr. D. L. King USBR Mr. Ely Driver TVA Mr. R. A. Dodge USBR
Mr. R. H. Kuemmich USBR Mr. E. R. Zeigler USBR Mr. J. C. Schuster USBR Mr. u. J. Palde USBR
SEVENTH INTERAGENCY CONFERENCE ON
HYDRAULIC LABORATORY TECHNIQUES AND INSTRUMENTATION
April 21-22, 1971
Bureau of Reclamation Engineering and Research Center
Denver, Colorado
CONFERENCE PARTICIPANTS
U.S. Army Engineers
Engineering Division
Mr. S. B. Powe 11
Waterways Experiment Station
Dr. F. M. Neilson Mr. G. A. Pickering
Coastal Engineering Research Center
Dr. Madan Das Mr. John Ahrens
Tennessee Valley Authority
Mr. R. A. Elder Mr. Ely Driver Mr. George Titcomb
Bureau of Reclamation
Mr. w. E. Wagner Dr. H. T. Falvey Mr. D. L. King Mr. P. F. Enger Mr. G. L. Beichley Mr. P. H. Burgi Mr. D. Colgate Mr. T. J. Isbester Mr. P. L. Johnson
4
Dr. L. L. Daggett Mr. M. B. Savage
Mr. E. F. Hawley
Dr. Svein Vigander Mr. Donald Warren
Mr. T. J. Rhone Mr. E. J. Carlson Mr. R. B. Dexter Mr. R. A. Dodge Mr. u. J. Palde Mr. J. c. Schuster Mr. E. R. Zeigler Mr. R. H. Kuemmich
MINUTES OF THE CONFERENCE
WELCOME AND INTRODUCTIONS
Mr. William E. Wagner, Chief, Hydraulics Branch, opened the conference and introduced Mr. Howard J. Cohan, Acting Chief, Division of General Research. Mr. Cohan welcomed the visitors to the Bureau of Reclamation Engineering and Research Center and wished the participants an informative and successful conference.
On Mr. Wagner's suggestion, a member of each delegation introduced his agency's participants. The CE North Pacific Division Laboratory had not been able to send a delegate due to travel fund limitations. Mr. Wagner then introduced the staff of the Bureau of Reclamation Hydraulics Branch.
DISCUSSION OF AGENDA
Three subject items were added to the preliminary agenda and one item was moved to a different session.
SESSION 1 - SIMILITUDE PROBLEMS
Stratified Reservoir Flows
A representative of WES discussed their test facilities and some of their findings that are meant to aid the designers. He note~ that salt was used to establish their density stratification. Room temperature variations necessitated the use of both thermistors and conductivity probes to monitor the densities. The question arose as to what the similitude problems might be in selective withdrawal studies. USBR is preparing a discussion of a paper by Bohan and Grace on this matter. It was observed that WES data could agree with the findings of Dehler. Dehler had also used salt to create the density stratification. Debler's study yielded a critical densimetric Froude number of 0.28. On the other hand, USBR has found the critical densimetric Froude number to be approximately 0.10, using a thermal model. It was noted that TVA observed critical densimetric Froude numbers averaging 0.16 in prototype testing. The problem may be due to the fact that flows in the model are near laminar while prototype flows are turbulent. Mr. Powell stated that the WES findings
5
agree quite well with prototype studies done in Texas and reasonably well with the TVA prototype data. They have also obtained good correlation with Orlob's mathematical model. Mr. Elder noted that TVA has obtained prototype data that has not yet been explained by theory. It was wondered if this might be due to unsteady flow conditions in the reservoir. Mr. Elder said that he did not feel that this was the case. He agrees that the problem may be one of laminar versus turbulent similitude.
Air Entrainment
The discussion centered around methods of evaluating and comparing the amount and distribution of air in a model flow to the prototype situation at a considerable (300-foot prototype) distance downstream from the point of entrainment. USBR is putting air into flows to alleviate cavi ta ti.on damage. Only visual and photographic observation have been used to evaluate the distribution of entrained air at the downstream location in the model. It was questioned if any other method of evaluation had been used. The only suggestion came from WES where an M-scope water surface indicator, manufactured by Fish~r Research Laboratory, was used to evaluate the conductivity of the flow. The M-scope output determines whether air or water is in contact with the probe, but the local airflow or waterflow is not measured. The discussion did not reveal any model versus prototype comparison data.
Gate Vibration
A 1:12 scale model of a prototype gate having vibration problems has been studied at WES. All the members and the weights of the gate were scaled. The elasticity of the support was not considered a pertinent factor. Amplitude and frequency were not analyzed. The only consideration was whether a vibration existed. It was concluded that the cause of the trouble was the gate seal and gate lip shape. However, the flexibility of the seal could not be scaled. No vibrations were observed in the model when vibration of the prototype gate was caused by the fluttering of the rubber seal. Removal of the rubber seal from the prototype solved the problem. However, when prototype vibration was caused by the shifting of the flow control point on the gate lip, the vibration was reproduced in the model and eliminated by revising the shape of the gate lip. It was recommended that further seal studies should be done at a 1:1 scale.
Vortices
USBR has been evaluating this problem for Grand Coulee Third Powerplant. The model scale is 120:1. It was questioned what
6
similitude solutions exist for vortices and how vortex intensity can be evaluated in the laboratory. USBR noted work done by Denny and Young with 4 or 5:1 model scales which were based on the Froude number. Their model data and prototype data show satisfactory but not conclusive correspondence. USBR felt that the models should be operated at higher velocities than velocities based on the Froude number. It was also questioned what the effects of initial swirl in the flow might be. WES stated that they have found Reynolds number to be an important factor. They have carried out tests using water-oil and water-glycerine solutions. The amount of swirl in the flow was controlled. They observed that as viscosity is increased viscous effects overcame the small swirls in the flow but could not do so on larger swirls. They also observed that regions of air core formation could be defined and are a function of depth of liquid, swirl, and Reynolds number. More details and a progress report can be obtained from WES. TVA also has problems in this area. They are working on a pump-storage facility that shows vortex problems. It appears that the problem lies w:th the modeling of eddy viscosity and initial reservoir circulation (two major factors). They have been working with studies by Lee and Einstein, but still feel more work must be done. They had proposed a research program in this field. Until that program shows results, they will continue to be quite conservative on this matter. It was cautioned that equal velocity modeling may not supply the correct answers.
Ice Jams
The USBR use of a laboratory model to study ice jams was discussed in Session 3. Mr. Burgi described the model techniques used to simulate and apply an ice cover to a model of an ice control structure presently in use on the North Platte River. Polyethelyene plastic with a specific gravity of 0.92 was used to simulate floating river ice. The degree of similitude achieved in the river model was discussed briefly. Although the plastic particles appear to simulate the float ice, it was emphasized that the freezing process present in the field was not simulated in the model. An attempt to simulate the shore ice present at the ice control structure in the field was mentioned.
Atmospheric Flows Gravel Pack Placement in Wells
These subjects were not discussed due to insufficient time remaining in the session.
7
SESSION 2 - TRANSDUCERS AND RELATED EQUIPMENT
Long-term Stability of Transducers
Mr. Enger of USBR asked for discussion from the group concerning research on long-term stability (up to 5 years) of transducers. Dr. Neilson of WES stated that the digital transducers to be used in Los Angeles harbor were guaranteed to maintain the accuracy for 1 year . Mr. Hawley stated that the underwater transducers used by CERC have been under water for 2 years and appear to be holding their accuracy except for one transducer which allegedly has a fish living in the casing.
The consensus of the discussion was that there appeared to be no one with experience in this area, although all agreed that there was a need for transducers with long-term stability characteristics.
Digital Transducers
Mr. Enger gave a brief introduction to the topic and defined the types of digital transducers which he felt would be of most interest. He asked for the experience of others with digital transducers. Mr. Savage of WES gave a brief discussion on the Bell and Howell digital pressure transducers that WES plans to install in Los Angeles harbor. They will use the transducers to monitor lowamplitude harbor surges. WES asked for best possible accuracy. Bell and Howell indicates they can provide 0.05 percent of full scale at the transducer.
Dr. Daggett of WES suggested that possibly the processing industries (chemical and oil refineries) might be able to provide information related to digital transducers.
There was some discussion as to the advantages of digital over analog transducers. A digital signal can be transmitted with much less loss of signal than an analog signal. The digital units are small and output may be in either parallel or serial mode. Mr. Kuemmich of USBR suggested the use of an analog to digital converter at the site and then transmitting the digital signal. Mr. Savage felt the repeatability and resolution of the analog signal would be reduced during transmission and therefore an immediate conversion to digital form is advantageous.
Open Channel Boundary Shear Force Plate
Mr. Savage of WES and Mr. Powell of CE Engineering Division discussed the problems of monitoring shear stresses on the bed and
8
sides of earth channels. Mr. Savage mentioned the work of Dr. Shen at Colorado State University. Dr. Shen uses a shear plate which can be displaced and therefore can interfere with the flow in the immediate area of the plate. Mr. Savage suggested the use of a servoforce feedback system which will not be displaced.
Hot-film Anemometer Turbulence Measurements in Water
CERC representative, Dr. Das, discussed the principle of the hotfilm anemometer as it is used for turbulence measurements in water. The hot-film probe eliminates the instability due to conductivity and electrolysis. The major disadvantage of the hot-film results from the contamination of the probe by impurities, such as dissolved air, dirt, and chemicals in the water. He indicated the use of filtered water and methods such as distillation, application of vacuum, temporary heating and subsequent cooling, and passage through a convergent-divergent nozzle for. removal of dissolved air. This is particularly necessary for purposes of calibration to establish voltage-velocity relationships at various overheat ratios. The method proposed by Richardson and McQuivey, and also verified by Resch, for introducing correction to turbulence measurements in contaminated water was outlined by him.
He stated that the standard hot-wire or hot-film method of measuring turbulence would require the presence of a mean flow velocity large compared to the turbulent fluctuations, permitting linearization and neglect of second order terms in the expression for the effective cooling velocity of the sensor. Therefore, he concluded his first part of the discussion by saying that, except for some troubles due to instability caused by contamination of the probes, the measurement of turbulence in water with appreciable mean flow, or with gradually varying mean as in tidal flow, can be made with a reliable degree of accuracy.
Next he discussed the problems associated with the application of the hot-film probe in an oscillating flow field under water waves. He explained the following effects by using transparencies:
1. The delay in the establishment of free convection boundary layer near the point of flow reversal. This was indicated from the works of Drs. Fingerson and Das, who oscillated the probe in still water. The higher the frequency of oscillation of the probe, the greater was the deviation of the output signal at point of flow reversal from the output at zero velocity.
2. The velocity wake effect indicated in the work of Dr. Kolpak.
9
In the second part of the discussion CERC showed slides of measurements of vertical component of turbulent velocity fluctuations in the flow field above an oscillating flat plate, simulating the hydrodynamic condition at the bed under oscillatory waves. Under a CERC-sponsored project at the University of California, Berkeley, the setup used to calibrate the hot-film was illustrated. Since the flow field tmder investigation had no mean velocity, the probe could not be used in the conventional manner to measure a component of the turbulent fluctuations. The probe was oscillated vertically to superimpose a known velocity on the turbulent fluctuations to be measured. The results of measurements were shown in slides.
Mr. King asked if a calibrator is available commercially. CERC referenced to the probe calibrator manufactured by Thermo-Systems, Inc. This has also been used quite successfully at the University of California, Berkeley. Mr. King also asked how to prevent the breakage of the hot-films. CERC made reference to shields which can be placed over the probes to prevent breakage. These shielding devices are available from Thermo-Systems or can be made locally.
Temperature Sensors
Mr. King of USBR discussed the use of the Yellow Springs thermistor used for model investigation of stratified flows by the USBR and the calibration procedure using a quartz thermometer. He stated that the scanning time was a problem and made reference to the rapid scanning procedure used by 1VA which will be discussed in another session.
Miscellaneous
Dr. Falvey of USBR asked if any of the participants had experience with velocity measurements using tellurium probes or the hydrogen bubble method. Mr. Savage referred to some work by WES with the hydrogen bubble method. Dr. Falvey mentioned the need for a high contrast to effectively measure the velocities.
SESSION 3 - FLUCTUATING SIGNALS
Analog Versus Digital Data Processing
Introductory material by 1VA defined the problem as measuring a time-related signal of random or periodic nature. An analysis of the signal can involve a root mean square, distribution function,
10
autocorrelation, frequency, and power density spectrum. Hydraulic fluctuating signals of common interest are in the range Oto 10 hz.
Analysis from analog signal is usually slow and limited by lowfrequency resolution. Digital analysis by large capacity or mini-computers takes advantage of fast Fourier techniques.
Recommendation was made that preprogramed digital analyzers be considered for purchase and use. High-speed A to D converters are becoming available for use with digital programs that are fast and accurate.
An improved method of handling data files and information is becoming available and can be obtained by writing Office, Chief of Engineers, Washington, Attention: R. L. Renner.
Wave and Surge Measurements
CERC described a wave runup board designed to study the wave runup characteristics on plane, smooth, impermeable slopes in a small wave flume. The runup sensor is an adaptation of the relay-type step-resistance wave gage similar to the one described in CERC Technical Memorandum 30. The relay contacts are copper strips, several thousandths of an inch thick, bonded to a fiberglass board three-eights of an inch thick. The relay contacts are spaced onetenth of a foot apart along the board and on the presently used slope of 1 on 10 give a vertical resolution of runup of about 0.01 foot. The flume has a piston-type wave maker which can follow an electronic signal down to a wave period of about 0.5 second. The runup characteristics of both monochromatic and irregular waves have been studied by use of this gage. The advantages of this runup gage are: it is self-calibrating, linear, will operate in fresh water, has a smooth surface, and responds quickly enough to record the complex runup patterns of both regular and irregular waves. There are also locations on the runup board where the pressure can be measured by pressure transducers so that the thickness of the runup water mass can be measured.
Pressure Surges
USBR presented a laboratory approach to defining frequency and amplitude of surges occurring in turbine draft tubes. A pressure transducer signal was conditioned by an amplifier and tunable filter to be displayed on a retentive oscilloscope. The method allows reasonably fast analysis. Discussion pointed out that the method works well for signals having definite periodicity but is not very exact for signals having random components. No data
11
interface with the computer other than the investigator was used in the study. Data were transferred to punch cards for parameter calculation and plotting by computer.
Nappe Oscillation
Measurements necessary in a study by the USBR included two lowfrequency modes of flutter of a nappe, both moderately related to discharge. After considerable effort was expended in trying to measure the frequency of flutter, a probe contact completing a d-c electrical circuit through a counter proved to be a simple, reliable, and accurate means of measuring frequency.
Dynamic Loads on Training Walls
Instead of placing a limited number of piezometers in a training wall, segments of the wall (monol_iths) were equipped as dynamometers by WES. Fourteen load cells reacting from hinged plates representing training wall segments measure the loading on the wall.
Analog tape was recorded at 3-3/4 inches per second (ips) in 3-minute tests. Various manipulations of playback and rerecording tape speeds were used in analyzing data. A spectrum analyzer is used on selected channels, and all channels are analyzed by a digital computer and specific information printed for the project engineer.
Extension of the investigation may include a comparison of the total load measurement with that integrated from point pressure measurement.
SESSION 4 - DATA ACQUISITION, TRANSMISSION, AND PROCESSING
Model Control and On-line Data Reduction by Digital Computer
TVA is constructing an automated system where a digital computer acquires hydraulic model data, makes on-line computations, and also controls operation of the hydraulic model. Five miles of the Wheeler Reservoir at the Brown's Ferry Nuclear Plant site is modeled. Adjacent to the reservoir is a thermal generation plant, and condenser cooling water from the plant is mixed with the reservoir water. Further complicating the hydraulic and water temperature problem is the m1steady water releases from Gm1tersville and Wheeler Dams for generating peaking power. Tite purpose of the hydraulic model is to study the effect of m1steady flows upon the water temperature in the reservoir and in the river below the dam.
12
It is imperative that hot water released from the thermal plant does not violate water temperature pollution laws established by the state.
There are 400 thermistors installed in the model for measuring water temperatures at various locations. The system is capable of scanning 300 thermistors, making the necessary on-line computer computations, and plotting the temperature data with an on-line X-Y plotter. Also, there is a scope on-line for making data displays. There are seven butterfly valves and three flowmeters installed in the hydraulic model which the system automatically monitors. The model discharges and valve position data are related to the computer, compared with preprogramed model discharges, and then the computer controls the necessary opening or closing of the valves. The 3- and 4-inch-diameter valves are operated with a digital servo system and can be fully closed or opened in 5 seconds. During a test run all data will be recorded on punched tape.
Automated Data Acquisition and Processing
WES is presently expanding a facility for automated acquisition of hydraulic model data, hydraulic model control, and on-line data processing. Since WES operates many hydraulic models, their system is required to be portable, and therefore some equipment of the system is in a trailer. The equipment housed in the trailer is a hybrid computer, high-speed paper tape and magnetic tapes that can be used for data input and recording. The system has . an analog capacity of SO channels and a digital capacity of scanning 32,000 samples per second. There are two recorders to display online information; each recorder has eight channels.
The New York estuary model, which is a fixed bed model, was selected for testing the equipment. The automated system controls generation of the tide in the model at two different points with preprogramed information supplied by the computer. Fresh water inflow into the model is by analog control. The analog signal is generated with the aid of a cam. Salinity cells, with a temperature correction feature, are used for measuring salt concentrations at different locations within the model, and water temperatures are measured with thermocouples. Water level sensors measure water surface elevations within the model. The system controls and records the taking of model data.
Presently the system has SK storage, but it is planned to increase the storage up to 16K and have the capacity for running several models at the same time.
13
WES has also worked in developing equipment for measuring low water velocities in water and measuring the bed surface occurring in movable bed models. The velocity meter is a propeller-cup type. There is an annular flat disk, with small evenly spaced holes, attached to the propeller which rotates in the same plane as the propeller. On one side of the disk there is a light source and on the other side a photocell. Rotation of the propeller is measured by counting the light pulses. Electronic equipment is used to count the pulses. Direction of the water velocity is measured with a small drag wire which indicates flow upstream or downstream. Measurements of the model bed surface are made with the aid of a vertical rod plunger which is mounted on a movable carriage. A 3/4-inch flat disk is attached on the rod end to prevent excessive penetration of the rod into the model bed. The rod is lowered and comes to rest against the bed. The distance of rod movement with respect to an established elevation datum is automatically measured and recorded.
Analog to Digital Data Interface Equipment
USBR is preparing to model test a Francis turbine. Water for the model tests will be diverted from power generation. Therefore it is desirable to perform the model tests with a minimal use of water. A system is being assembled for analog data acquisition, analog to digital conversion, on-site computation, printout, and X-Y plot of test results. The model test data will be measurements of discharge, pressures at various points within the model, . shaft speed, shaft torque, and water temperature. The Bureau has most of the equipment needed for obtaining the physical measurements, an electronic digital calculator with an X-Y plotter, and a printer. The major problem in composing the system is an economical analogdigital interface for the digital calculator. Equipment must be purchased to scan analog signals, convert the analog signals into digital signals, and transmit the digital signals to the calculator. A coupler-controller, reed switch scanners, and digital voltmeter (supplied as an integrated system) are being purchased.
Miscellaneous
At this point in the session a discussion developed about problems in purchasing expensive electronic equipment. What policy was used in making payment to the manufacturer with respect to the quality of the equipment received? The Bureau's policy is to receive individual equipment and then test the equipment for compliance with the specifications. If the equipment is inadequate, the manufacturer is notified. No payment is made until the equipment is judged satisfactory. WES policy is similar. When possible, their
14
policy is to write specifications for purchasing a system of electronic equipment. The components of the system are received and assembled. No payment is made until the whole system performs adequately.
Data Logging and Processing by Mini-computers
TVA is installing a system for environmental surveillance of a large steam generating plant. The plant, which is presently under construction and is adjacent to a river, has two 1,000-foot-high smokestacks. Environmental data measurements of the system are weather data (wind velocities and direction), water temperatures at different locations in the river, and S02 measurements of the air at different locations surrounding the plant. A mini-computer is used to control the system and process the data. Twenty data samples are scanned. The S02 measurements are made every minute and water temperature measurements every 10 minutes. Some of the S02 and river temperature measurements are made at remote locations, and this information is transmitted to the central station by radio. The mini-computer was judged to be very flexible in operation and in processing the data for the system. Something fast was needed or the system would soon be overwhelmed with data.
R-F and Hard Wire Data Transfer
This subject was not discussed due to insufficient time remaining in the session.
SESSION 5 - VISUALIZATION METHODS
Video Tape Recording and Underwater Cameras
The use of black and white video tape recording equipment was discussed by TVA representatives. They have had 18 months of successful use of a video tape recording system that cost about $4,500. The system includes three cameras, one portable and two studiotype decks for 1/2-inch tape, one large and one small screen monitor, and special effects console that adds some very useful features to the system. The special effects console can control four cameras providing fade-in, fade-out, superimposing, negative imagery, splitting of the screen horizontally, vertically, and in combination for rectangular sectioning. A tape was played for the conference to demonstrate the use of the equipment. The equipment was used for a navigational study and showed a split-screen simultaneously recording a remotely operated vessel traveling in a
15
channel and dials that were indicating vessel power and the steering operations. A representative of CERC asked about light requirements. TVA replied that they are practically nil for black and white cameras because of the sensitivity of the camera and automatic light adjustment capabilities. Another advantage of the use of video equipment mentioned was that the tape costs about the same as 16-mm film but can be erased and reused. Tapes can be played in slow motion. Instant playback can be used to observe rapidly occurring events over and over and images can be frozen, although with some difficulty. A typical use such as this was described by a TVA representative using instant replay to determine the squatting of vessels that pass over diffuser pipes. When asked about timesequence use of video equipment, a WES representative stated that it could be done but with some difficulty . Another suggested use for the video equipment was the recording of destructive tests. lVA representatives mentioned a borehole television camera that can look up, down, or mirror sweep 360°. A representative of CE mentioned another borehole-type camera (not video) that photographs 360°. Photographs are projected on a ground glass cylinder and viewed similarly to looking at an actual core sample.
Time-sequence Motion Pictures
A USBR time sequence movie of the movement of a fresh water-salt water interface was shown to the conference. The USBR uses an industrial timer to take frames at intervals of 1, 3, and 7 minutes. The lighting can be a problem in the laboratory where night and day changes can vary the quantity and quality of light. The USBR also has used time-sequence movies for weather modification and stratified flow studies. The U.S. Army Engineers have used time-sequence movies to study harbor surging and sand wave travel.
Infrared Sensing
This discussion was introduced by lVA representatives by showing photographs taken to study the effectiveness of skinuner weirs to separate cold and warm water at Bull R1.D'l Thermal Steam Plant. The photographs were taken at 1,000 feet and have a resolution of 30 feet. There is a trade off of thermal resolution and spacial resolution. Scaling and determination of isotherms can be accomplished by means of gate slicing equipment and using radiometers. Temperature isotherms can be indicated either by gray shading or by color. The method is very helpful in indicating general thermal events occurring in large areas. Certain precautions were expressed. One was that the interpretation of a photograph was still an art. The best time for taking photographs is still in question. Also, the photographs show just surface temperatures which can be affected
16

by conditions and events Wlderneath. A USBR representative asked if anybody or any organization had any experience in using infrared techniques on a smaller scale such as in model studies.
Apparently none of the representatives or organizations present had any such experience. A TVA representative stated that they have the cost of infrared photography data reduction down to $4 per mile and that the overflight is now the major cost. TVA representatives stated that they have a cooperative program with NASA in their two EROS shots.
Laser Shadowgrams
This subject was introduced by the USBR by describing their study of supersonic nozzles for cloud seeding, A sample laser shadowgram was shown to the conference. This photograph clearly showed shockwaves, and the photograph was simply obtained by using the laser and a couple of lenses. The USBR representative asked if any of the other organizations had experience with lasers, Schlerin photography, or shadowgraphics. A TVA representative had some experience with Schlerin photography and suggested that the USBR might use a knife edge in the beam which might sharpen the shadowgrams considerably. The problem of safety was brought up by the USBR representatives. The USBR had been concerned enough to take efforts to reduce the possibility of reflection and to require eye tests for the operators befQre and after the use of the laser. The other organizations did not have as much concern because of the use of low-wattage continuous-beam lasers, except for the possibility of looking directly at the beam. The USBR representative offered to provide information to any of the organizations if they are ever pressed by safety requirements in the future.
High-speed Photography
A CE representative described the use of high-speed photography to study effects of high-velocity ejection from orifices and sudden changes of pressure on fish.
SESSION 6 - MISCELLANEOUS
Dilution and Dispersion
The presentation was made by WES. A model of a brine and waste dispersion study for Office of Saline Water demineralizer plants was described. The main goal of the study is to determine dispersion of concentrated brine at coastline demineralizer stations.
17

Fresh and salt water are used in the model to reproduce the density differential between the outfall and estuary. Tilermistors and conductivity probes are used to monitor the densities at various distances from the outfall. Movies and tracings are used to trace the geometry of the jet. Tile following slides were shown:
1. A view of the flume being used for the brine dispersion study
2. A tank used for mixing the brine solution to the required density
3. Rotometer installation and related piping for flow measurements of saline solutions
4. A view of diffusers of different sizes to investigate the geometry of a brine jet _as it mixes with fresh water
5. Overall view of the diffusion flume with glass sidewall
WE~ is trying to develop parameters to define brine dispersion as a function of the Froude number at the outfall but they have had limited success. Tiley have also encountered the problem of a reverse buoyancy phenomenon that initially causes the brine to rise in fresh water then sink to the bottom when there is no ambient velocity of the fresh water.
Specific Gravity Determination of Saline Solutions
A USBR representative explained that a mixture of dye and saline solution might be useful to detect density differences based upon dye concentration rather than salinity measurements. Difficulty has been experienced by many investigators because conductivity probes are very sensitive to temperature changes and require frequent recalibration. WES has tried water temperature gradients to create density stratification but lack of temperature control of the surrounding atmosphere has negated this effort. WES is using Beckman conductivity probes with platinum sensors, but these require frequent cleaning and recalibration. Tilese probes last about 1 year then need to be replatinized. Tiley believe it is advisable to replace the probes about every 6 months. 'IVA has had similar problems with platinized probes.
USBR is trying to assemble a bank of platinized platinum probes for an abnormally wide range of salinity. USBR is interested in determining density through conductivity measurements but investigations are in the early stages. USBR wants to try neutral buoyancy spheres
18
to define density gradients but has not been able to find spheres of small enough size. TVA has tried this but small temperature change of liquid caused changes in water density and the buoyant spheres either descended or ascended in the liquid. USBR might try to mount a buoyant ball on the free end of a horizontal rod to indicate change in vertical force on the ball due to density changes of the supporting liquid.
TVA has knowledge of an instrument in use at Delft, Netherlands, that might solve the problem. USBR plans to use light transmission of dyed saline solution to determine the density. TVA reported that Dr. Glover (State University of Iowa, Hydraulic Research Institute) has used a photoelectric probe to correlate particle suspension. TVA thinks this probe might be built up from an IBM punchcard reader. WES has obtained good correlation of dye and salt concentrations for low-range salinity values, using Pontacyl Pink dye for this purpose.
Velocity and Oxygen Monitoring in Spawning Gravel
Presentation by USBR representative. The following visual aids were projected:
1. A drawing of a salmon redd in a gravel channel bottom. An explanation of sediment collection in the spawning gravel and resultant decrease in oxygen in the gravel was presented. This makes it necessary to monitor the rate of oxygen flow in the gravel voids.
2, A drawing to show the design of the Tehama-Colusa fish spawning canal and permanently installed equipment that will be used to measure water velocity and oxygen in the gravel bed.
3. Display of an eight-channel recorder (Tech-nirite) that will be used to obtain data along the Tehama-Colusa spawning canal.
4. Photograph of a Yellow Springs Instrument Company oxygen monitoring instrument.
s. Drawing of a mechanical gravel-scouring machine that will be used to remove sediment from the gravel of the spawning canal.
Following projection of the visual aids, a short discussion of the spawning and life cycle of Pacific salmon took place. The underwater velocity and oxygen monitoring equipment in the TehamaColusa Canal is a permanent installation. The oxygen content of
19
the water in the gravel voids will be determined by pumping the water through a portable oxygen monitor. Oxygen determinations will be made about once per week. Monitoring of the velocity of the water and oxygen content in the gravel voids can reduce gravel cleaning costs to a great extent. WES asked for information on sampling of water nitrogen content. Mr. Powell explained that this is done through water analysis based upon dissolved gases in the water. CE is now investigating portable equipment available for monitoring nitrogen concentration in water.
Ice and Spray Nozzles and Sampling of Particles Suspended in Air or Water
The USBR is investigating cloud seeding in two forms: nozzles to form an ice embryo develop snow and fine sprays for warm weather seeding of clouds to induce rain. Of particular interest in the investigation is determination of particle size and number. For the ice embryo study a nuclei counter has been used. The particles are drawn through a small tube into a sonic counter. The coW1ter was operated both inside and outside the cold room where the nuclei are formed. The effectiveness of the counter proved Wtsatisfactory. Photographic methods are also used to determine the size and distribution of the ice nuclei. The method consists of a narrow field of focus, large camera magnification, and high-speed exposure.
For the spray nozzle, similar photographic techniques were found to be inadequate and inconsistent. The larger droplets were on the outside of the spray cloud. Another method was to catch the droplets on a slide coated with various materials such as gelatin. The droplets impinge on the coating and leave a mark or crater after evaporating. Assumed relationships of crater size to droplet size may be inaccurate. The velocity of the droplets and angle of impingement seem to affect the crater size. The efficiency of droplet collection may also present errors. Counting and sizing are very time consuming.
It has been determined that commercial devices are available, but they are of doubtful accuracy and very expensive. There are commercial devices available that are primarily for determining pollution levels and consequently give the mass rather than the breakdown of size versus quantity. The laboratory problem is determining particle size which is usually smaller than 10 microns.
There were no comments or suggestions from the participants on this problem other than agreement that the problem exists.
20
Two-phase (Air, Water) Testing
TVA discussed a similar problem in polyphase (air, water, and flyash) testing. They also have found many problems with very few solutions. Apparently commercial firms are trying to develop efficient counters but they are primarily directed toward showing the total concentration and are dependent on the particle size without separating the sizes. TVA's specific studies were of an air-solid water mixture formed by directing a jet of air containing flyash onto a moving stream of water in an enclosed system. This causes a spray with droplet size of 1 to 50 microns. They are presently using· isokinetic methods in which a sample of the mist is withdrawn and the solids are separated from the gas. This gives proportion of the two but not an indication of size. TVA has also tried a hot-film cone-shaped anemometer. The instrument is very delicate and \Dlder test conditions many were destroyed. The method shows good promise if a more reliable ~ensor could be developed and if methods could be devised to separate airborne and waterborne solids.
Other suggestions during subsequent discussion were an optical scanner which senses sizes and numbers of droplets from a photograph and feeds the information into an electronic counter or computer. Also, placing an electrical charge on particles and scanning them with a plate having an opposite charge could possibly be developed.
Field-related Topics
Items proposed \Dlder this subject were not discussed due to insufficient time remaining in the session.
CRITIQUE AND PLANS FOR THE NEXT CONFERENCE
Mr. Wagner asked for comments about the agenda of the conference that had just concluded. Mr. Hawley asked about the frequency of the conferences. He was told that they have been held every 2 years. Mr. Wagner explained that the location for the conference rotates among the organizations represented, and asked if the Coastal Engineering Research Center could host the conference in 1972. Mr. Hawley replied that he could not make a commitment now but could reply later through correspondence. Mr. Powell expressed the opinion that the San Francisco Bay Hydraulic Laboratory (Corps of Engineers) should probably be represented at any future conferences. Mr. Wagn·er explained that representatives of the David Taylor Model Basin were not invited to the present conference
21
because they did not attend the previous one. It was pointed out DTMB made significant contributions at previous conferences. Mr. Wagner asked for opinions of plans to invite tm.iversity laboratory representatives to future conferences. Mr. Elder stated that this was not advisable because of difficulties with "which ones and how many." Mr. Powell thought that in view of travel time involved for conference attendees that more agenda time should be allowed for special interest and small group discussions. Mr. Elder expressed the opinion that the length of the conference could be based on the need for special interest discussions. Mr. Schuster thought that a tour of the host laboratory before the conference instead of following the conference would be valuable. Mr. Wagner stated that this would be a suggestion worthy of consideration by the host when the agenda for the next conference is prepared.
The conference was concluded with a tour of the Bureau Hydraulics Laboratory.
22