Embed Size (px)
Citation preview
Seventh Grade Pacing Guide
Vision Statement
Imagine a classroom, a school, or a school district where all students have access to high-quality, engaging mathematics instruction. There are ambitious
expectations for all, with accommodation for those who need it. Knowledgeable teachers have adequate resources to support their work and are continually
growing as professionals. The curriculum is mathematically rich, offering students opportunities to learn important mathematical concepts and procedures
with understanding. Technology is an essential component of the environment. Students confidently engage in complex mathematical tasks chosen carefully
by teachers. They draw on knowledge from a wide variety of mathematical topics, sometimes approaching the same problem from different mathematical
perspectives or representing the mathematics in different ways until they find methods that enable them to make progress. Teachers help students make,
refine, and explore conjectures on the basis of evidence and use a variety of reasoning and proof techniques to confirm or disprove those conjectures.
Students are flexible and resourceful problem solvers. Alone or in groups and with access to technology, they work productively and reflectively, with the
skilled guidance of their teachers. Orally and in writing, students communicate their ideas and results effectively. They value mathematics and engage
actively in learning it.
National Council of Teachers of Mathematics
Process Standards
Mathematical Problem Solving Students will apply mathematical concepts and skills and the relationships among them to solve problem situations of varying complexities. Students also will
recognize and create problems from real-life data and situations within and outside mathematics and then apply appropriate strategies to find acceptable solutions.
To accomplish this goal, students will need to develop a repertoire of skills and strategies for solving a variety of problem types. A major goal of the mathematics
program is to help students become competent mathematical problem solvers.
Mathematical Communication Students will use the language of mathematics, including specialized vocabulary and symbols, to express mathematical ideas precisely. Representing, discussing,
reading, writing, and listening to mathematics will help students to clarify their thinking and deepen their understanding of the mathematics being studied.
Mathematical Reasoning Students will recognize reasoning and proof as fundamental aspects of mathematics. Students will learn and apply inductive and deductive reasoning skills to
make, test, and evaluate mathematical statements and to justify steps in mathematical procedures. Students will use logical reasoning to analyze an argument and
to determine whether conclusions are valid. In addition, students will learn to apply proportional and spatial reasoning and to reason from a variety of
representations such as graphs, tables, and charts.
Mathematical Connections Students will relate concepts and procedures from different topics in mathematics to one another and see mathematics as an integrated field of study. Through the
application of content and process skills, students will make connections between different areas of mathematics and between mathematics and other disciplines,
especially science. Science and mathematics teachers and curriculum writers are encouraged to develop mathematics and science curricula that reinforce each
other.
Mathematical Representations Students will represent and describe mathematical ideas, generalizations, and relationships with a variety of methods. Students will understand that representations
of mathematical ideas are an essential part of learning, doing, and communicating mathematics. Students should move easily among different
representationsgraphical, numerical, algebraic, verbal, and physicaland recognize that representation is both a process and a product.
In the middle grades, the focus of mathematics learning is to
build on students’ concrete reasoning experiences developed in the elementary grades;
construct a more advanced understanding of mathematics through active learning experiences;
develop deep mathematical understandings required for success in abstract learning experiences; and
apply mathematics as a tool in solving practical problems.
Students in the middle grades use problem solving, mathematical communication, mathematical reasoning, connections, and representations to
integrate understanding within this strand and across all the strands.
Students extend their knowledge of patterns developed in the elementary grades and through life experiences by investigating and describing
functional relationships.
Students learn to use algebraic concepts and terms appropriately. These concepts and terms include variable, term, coefficient, exponent,
expression, equation, inequality, domain, and range. Developing a beginning knowledge of algebra is a major focus of mathematics learning in
the middle grades.
Students learn to solve equations by using concrete materials. They expand their skills from one-step to two-step equations and inequalities.
Students learn to represent relations by using ordered pairs, tables, rules, and graphs. Graphing in the coordinate plane linear equations in two
variables is a focus of the study of functions.
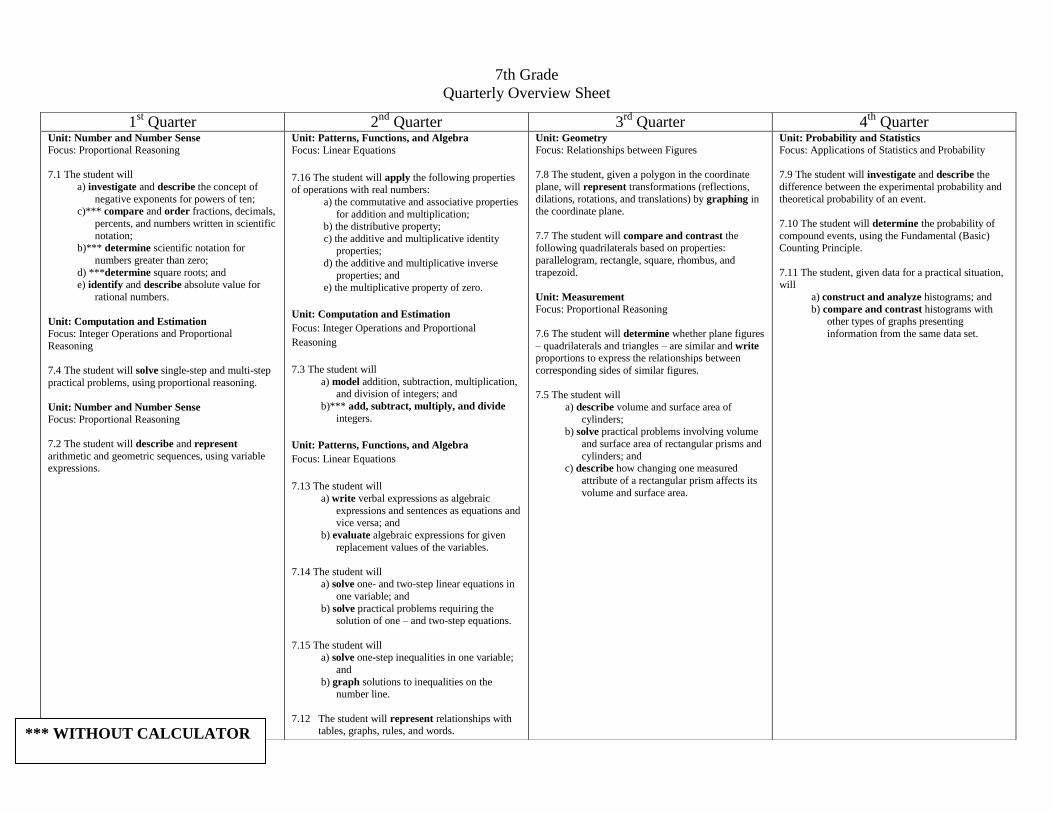
7th Grade
Quarterly Overview Sheet
1st Quarter 2
nd Quarter 3
rd Quarter 4
th Quarter
Unit: Number and Number Sense
Focus: Proportional Reasoning
7.1 The student will
a) investigate and describe the concept of
negative exponents for powers of ten; c)*** compare and order fractions, decimals,
percents, and numbers written in scientific
notation; b)*** determine scientific notation for
numbers greater than zero;
d) ***determine square roots; and e) identify and describe absolute value for
rational numbers.
Unit: Computation and Estimation Focus: Integer Operations and Proportional
Reasoning
7.4 The student will solve single-step and multi-step
practical problems, using proportional reasoning.
Unit: Number and Number Sense Focus: Proportional Reasoning
7.2 The student will describe and represent
arithmetic and geometric sequences, using variable expressions.
Unit: Patterns, Functions, and Algebra
Focus: Linear Equations
7.16 The student will apply the following properties of operations with real numbers:
a) the commutative and associative properties
for addition and multiplication; b) the distributive property;
c) the additive and multiplicative identity
properties;
d) the additive and multiplicative inverse
properties; and e) the multiplicative property of zero.
Unit: Computation and Estimation
Focus: Integer Operations and Proportional
Reasoning
7.3 The student will
a) model addition, subtraction, multiplication, and division of integers; and
b)*** add, subtract, multiply, and divide
integers.
Unit: Patterns, Functions, and Algebra
Focus: Linear Equations
7.13 The student will
a) write verbal expressions as algebraic
expressions and sentences as equations and vice versa; and
b) evaluate algebraic expressions for given
replacement values of the variables.
7.14 The student will a) solve one- and two-step linear equations in
one variable; and
b) solve practical problems requiring the solution of one – and two-step equations.
7.15 The student will a) solve one-step inequalities in one variable;
and
b) graph solutions to inequalities on the number line.
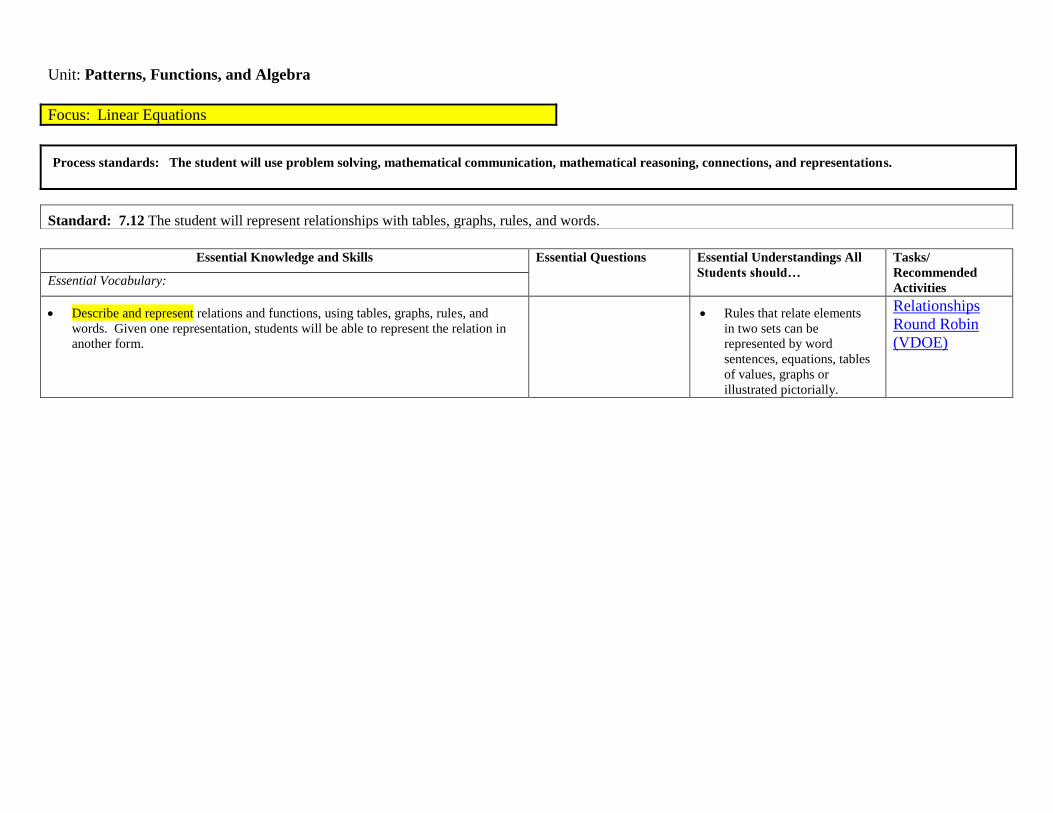
7.12 The student will represent relationships with tables, graphs, rules, and words.
Unit: Geometry Focus: Relationships between Figures
7.8 The student, given a polygon in the coordinate
plane, will represent transformations (reflections,
dilations, rotations, and translations) by graphing in the coordinate plane.
7.7 The student will compare and contrast the following quadrilaterals based on properties:
parallelogram, rectangle, square, rhombus, and
trapezoid.
Unit: Measurement Focus: Proportional Reasoning
7.6 The student will determine whether plane figures
– quadrilaterals and triangles – are similar and write proportions to express the relationships between
corresponding sides of similar figures.
7.5 The student will
a) describe volume and surface area of
cylinders;
b) solve practical problems involving volume
and surface area of rectangular prisms and
cylinders; and c) describe how changing one measured
attribute of a rectangular prism affects its
volume and surface area.
Unit: Probability and Statistics Focus: Applications of Statistics and Probability
7.9 The student will investigate and describe the
difference between the experimental probability and
theoretical probability of an event.
7.10 The student will determine the probability of
compound events, using the Fundamental (Basic) Counting Principle.
7.11 The student, given data for a practical situation, will
a) construct and analyze histograms; and
b) compare and contrast histograms with other types of graphs presenting
information from the same data set.
*** WITHOUT CALCULATOR
Unit: Number and Number Sense
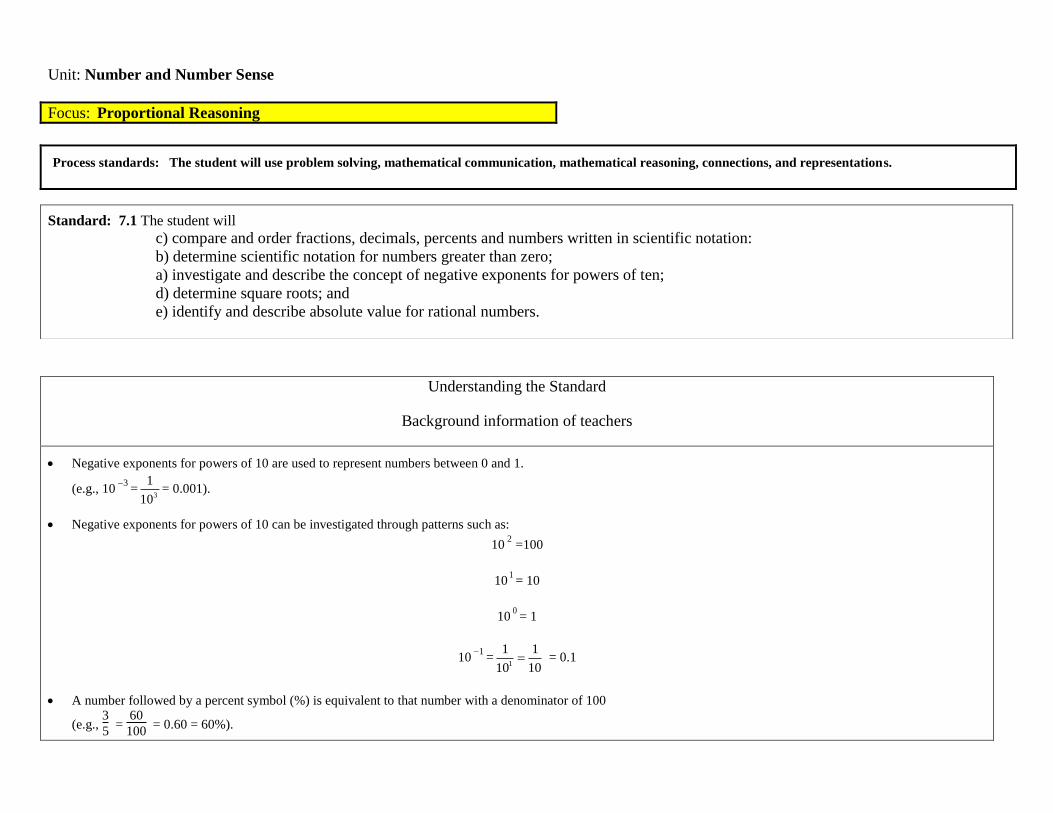
Understanding the Standard
Background information of teachers
Negative exponents for powers of 10 are used to represent numbers between 0 and 1.
(e.g., 103
=3
1
10= 0.001).
Negative exponents for powers of 10 can be investigated through patterns such as:
102
=100
101= 10
100
= 1
101
=1
1 1
1010 = 0.1
A number followed by a percent symbol (%) is equivalent to that number with a denominator of 100
(e.g., 3
5 =
60
100 = 0.60 = 60%).
Focus: Proportional Reasoning
Process standards: The student will use problem solving, mathematical communication, mathematical reasoning, connections, and representations.
Standard: 7.1 The student will
c) compare and order fractions, decimals, percents and numbers written in scientific notation:
b) determine scientific notation for numbers greater than zero;
a) investigate and describe the concept of negative exponents for powers of ten;
d) determine square roots; and
e) identify and describe absolute value for rational numbers.
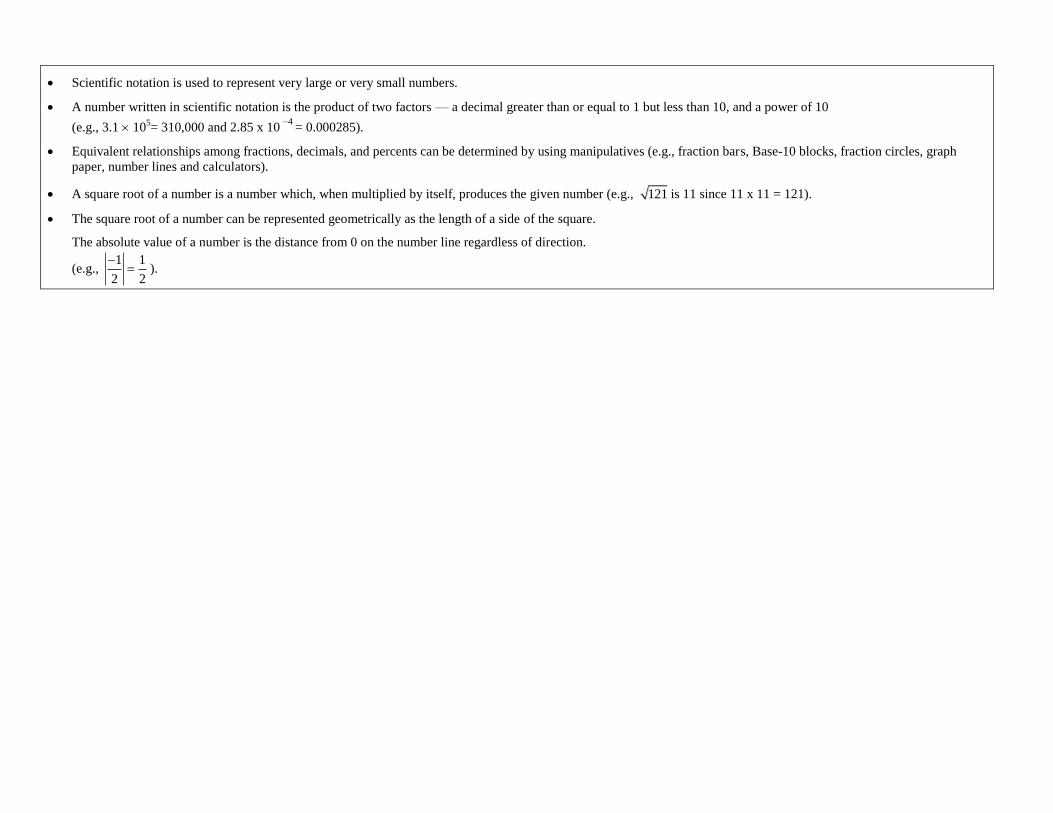
Scientific notation is used to represent very large or very small numbers.
A number written in scientific notation is the product of two factors — a decimal greater than or equal to 1 but less than 10, and a power of 10
(e.g., 3.1 105= 310,000 and 2.85 x 10
4= 0.000285).
Equivalent relationships among fractions, decimals, and percents can be determined by using manipulatives (e.g., fraction bars, Base-10 blocks, fraction circles, graph
paper, number lines and calculators).
A square root of a number is a number which, when multiplied by itself, produces the given number (e.g., 121 is 11 since 11 x 11 = 121).
The square root of a number can be represented geometrically as the length of a side of the square.
The absolute value of a number is the distance from 0 on the number line regardless of direction.
(e.g., 1 1
2 2
).
Unit: Number and Number Sense
Focus: Proportional Reasoning
Process standards: The student will use problem solving, mathematical communication, mathematical reasoning, connections, and representations.
Standard: 7.1 The student will
c) compare and order fractions, decimals, percents and numbers written in scientific notation:
b) determine scientific notation for numbers greater than zero;
a) investigate and describe the concept of negative exponents for powers of ten;
d) determine square roots; and
e) identify and describe absolute value for rational numbers.
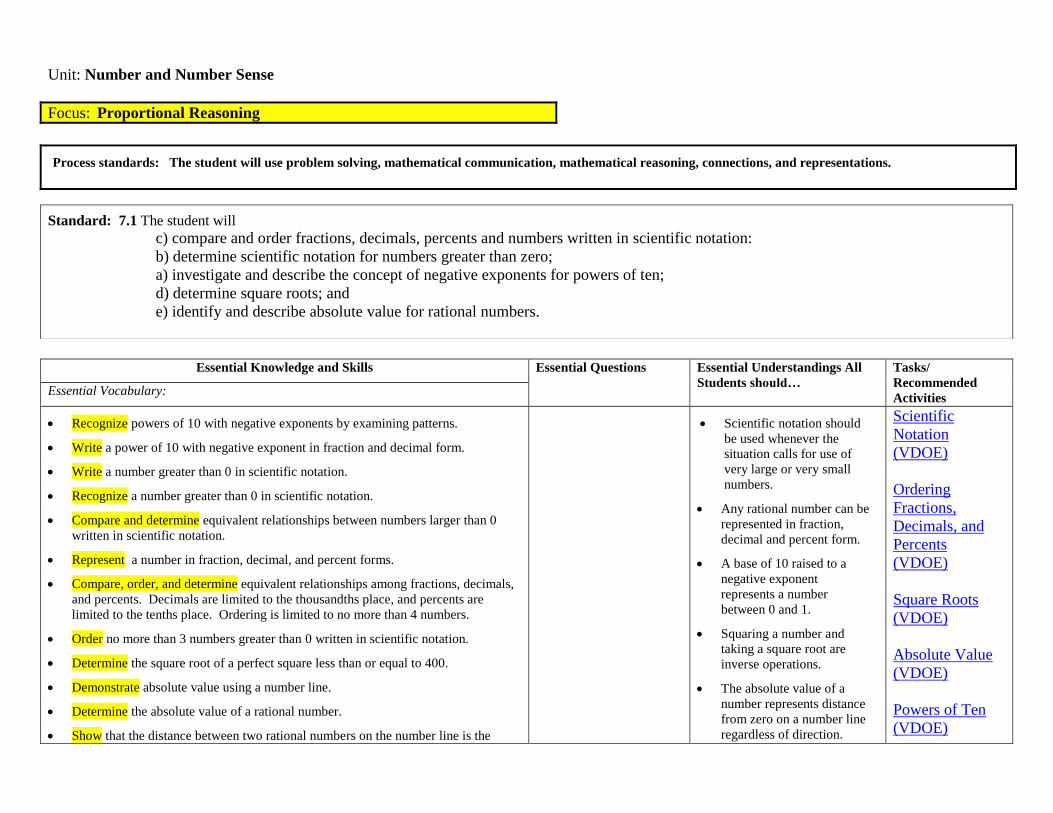
Essential Knowledge and Skills Essential Questions Essential Understandings All
Students should…
Tasks/
Recommended
Activities Essential Vocabulary:
Recognize powers of 10 with negative exponents by examining patterns.
Write a power of 10 with negative exponent in fraction and decimal form.
Write a number greater than 0 in scientific notation.
Recognize a number greater than 0 in scientific notation.
Compare and determine equivalent relationships between numbers larger than 0
written in scientific notation.
Represent a number in fraction, decimal, and percent forms.
Compare, order, and determine equivalent relationships among fractions, decimals,
and percents. Decimals are limited to the thousandths place, and percents are
limited to the tenths place. Ordering is limited to no more than 4 numbers.
Order no more than 3 numbers greater than 0 written in scientific notation.
Determine the square root of a perfect square less than or equal to 400.
Demonstrate absolute value using a number line.
Determine the absolute value of a rational number.
Show that the distance between two rational numbers on the number line is the
Scientific notation should
be used whenever the
situation calls for use of
very large or very small
numbers.
Any rational number can be
represented in fraction,
decimal and percent form.
A base of 10 raised to a
negative exponent
represents a number
between 0 and 1.
Squaring a number and
taking a square root are
inverse operations.
The absolute value of a
number represents distance
from zero on a number line
regardless of direction.
Scientific
Notation
(VDOE)
Ordering
Fractions,
Decimals, and
Percents
(VDOE)
Square Roots
(VDOE)
Absolute Value
(VDOE)
Powers of Ten
(VDOE)
absolute value of their difference and apply this principle to solve practical
problems.
Distance is positive. Smart Lesson
TEI’s
Unit: Computation and Estimation
Understanding the Standard
Background information of teachers
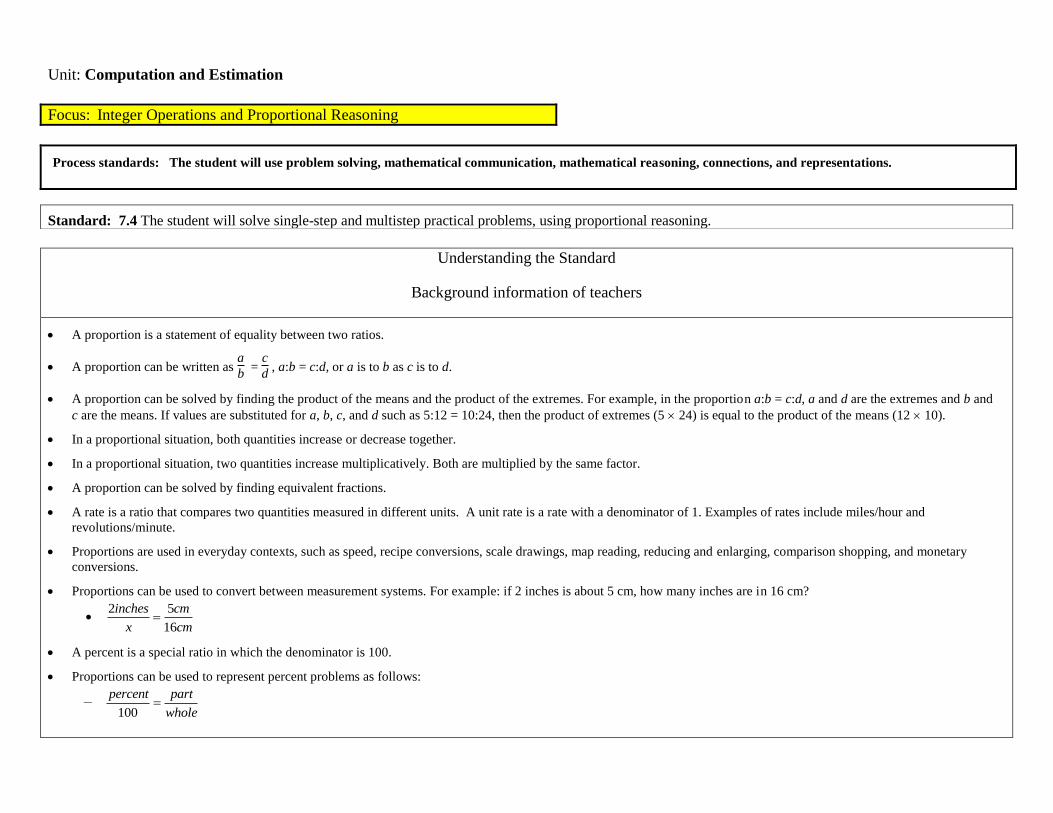
A proportion is a statement of equality between two ratios.
A proportion can be written as a
b =
c
d , a:b = c:d, or a is to b as c is to d.
A proportion can be solved by finding the product of the means and the product of the extremes. For example, in the proportion a:b = c:d, a and d are the extremes and b and
c are the means. If values are substituted for a, b, c, and d such as 5:12 = 10:24, then the product of extremes (5 24) is equal to the product of the means (12 10).
In a proportional situation, both quantities increase or decrease together.
In a proportional situation, two quantities increase multiplicatively. Both are multiplied by the same factor.
A proportion can be solved by finding equivalent fractions.
A rate is a ratio that compares two quantities measured in different units. A unit rate is a rate with a denominator of 1. Examples of rates include miles/hour and
revolutions/minute.
Proportions are used in everyday contexts, such as speed, recipe conversions, scale drawings, map reading, reducing and enlarging, comparison shopping, and monetary
conversions.
Proportions can be used to convert between measurement systems. For example: if 2 inches is about 5 cm, how many inches are in 16 cm?
2 5
16
inches cm
x cm
A percent is a special ratio in which the denominator is 100.
Proportions can be used to represent percent problems as follows:
– 100
percent part
whole
Focus: Integer Operations and Proportional Reasoning
Process standards: The student will use problem solving, mathematical communication, mathematical reasoning, connections, and representations.
Standard: 7.4 The student will solve single-step and multistep practical problems, using proportional reasoning.
Unit: Computation and Estimation
Focus: Integer Operations and Proportional Reasoning
Process standards: The student will use problem solving, mathematical communication, mathematical reasoning, connections, and representations.
Standard: 7.4 The student will solve single-step and multistep practical problems, using proportional reasoning.
Essential Knowledge and Skills Essential Questions Essential Understandings All
Students should…
Tasks/
Recommended
Activities Essential Vocabulary:
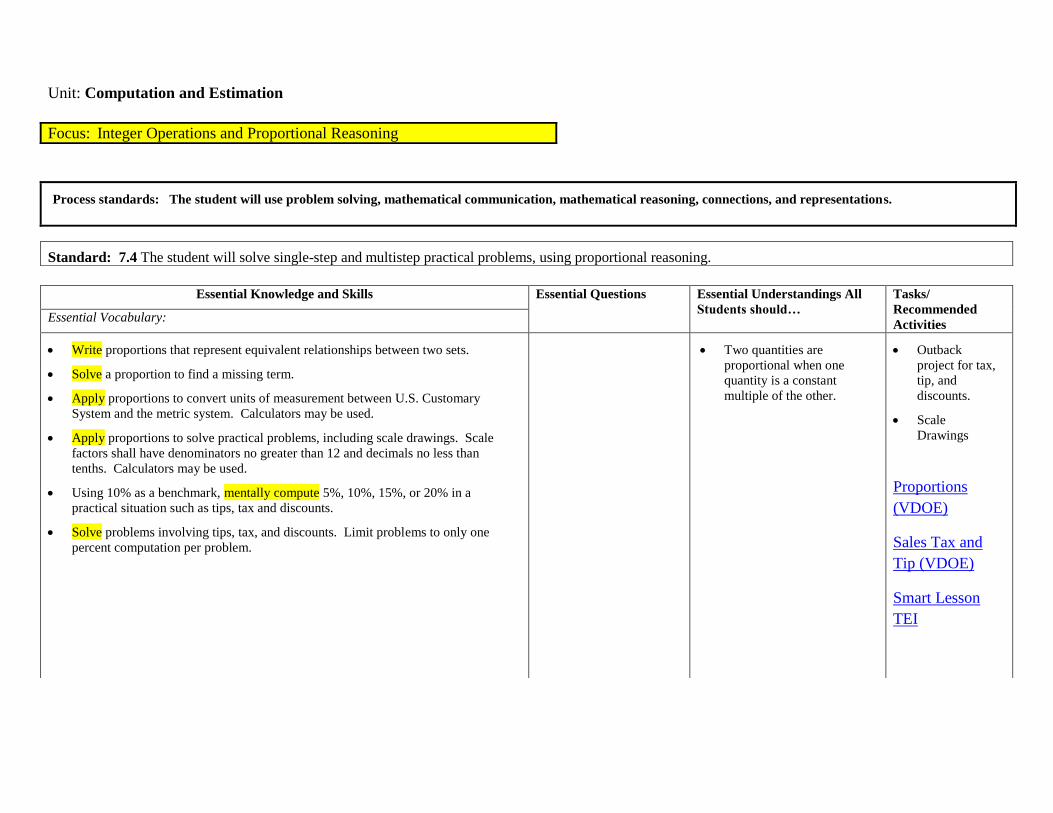
Write proportions that represent equivalent relationships between two sets.
Solve a proportion to find a missing term.
Apply proportions to convert units of measurement between U.S. Customary
System and the metric system. Calculators may be used.
Apply proportions to solve practical problems, including scale drawings. Scale
factors shall have denominators no greater than 12 and decimals no less than
tenths. Calculators may be used.
Using 10% as a benchmark, mentally compute 5%, 10%, 15%, or 20% in a
practical situation such as tips, tax and discounts.
Solve problems involving tips, tax, and discounts. Limit problems to only one
percent computation per problem.
Two quantities are
proportional when one
quantity is a constant
multiple of the other.
Outback
project for tax,
tip, and
discounts.
Scale
Drawings
Proportions
(VDOE)
Sales Tax and
Tip (VDOE)
Smart Lesson
TEI
Unit: Number and Number Sense
Understanding the Standard
Background information of teachers
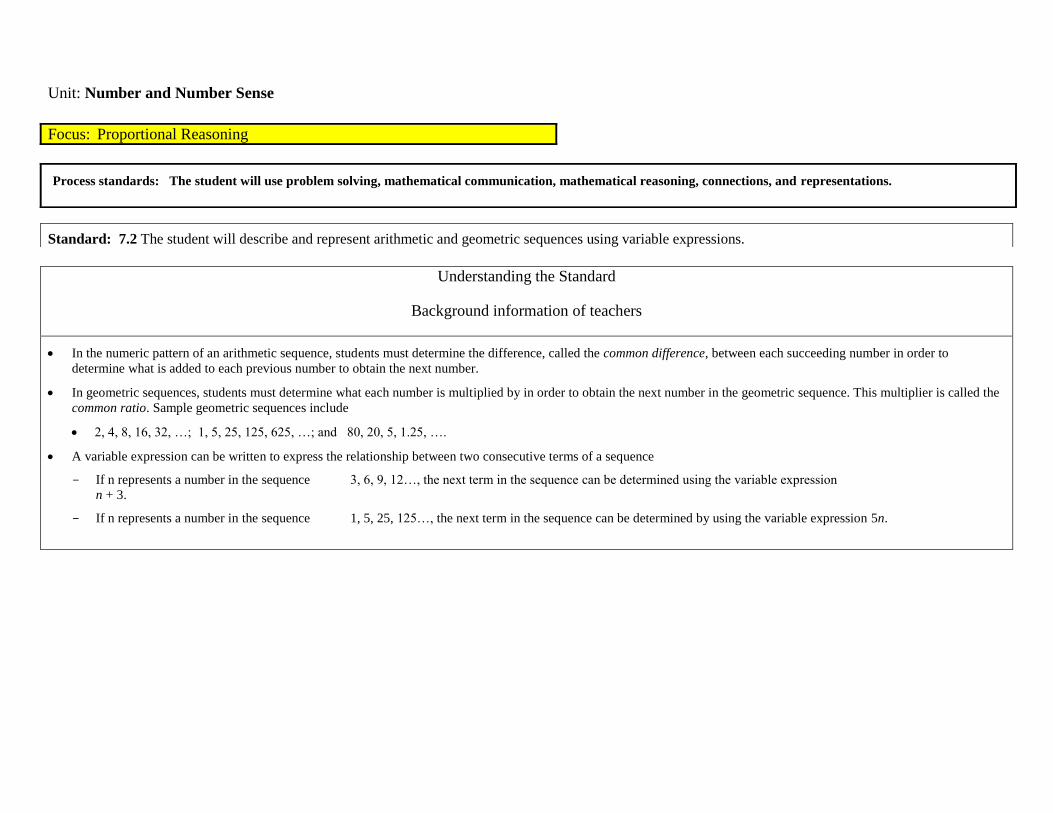
In the numeric pattern of an arithmetic sequence, students must determine the difference, called the common difference, between each succeeding number in order to
determine what is added to each previous number to obtain the next number.
In geometric sequences, students must determine what each number is multiplied by in order to obtain the next number in the geometric sequence. This multiplier is called the
common ratio. Sample geometric sequences include
2, 4, 8, 16, 32, …; 1, 5, 25, 125, 625, …; and 80, 20, 5, 1.25, ….
A variable expression can be written to express the relationship between two consecutive terms of a sequence
If n represents a number in the sequence 3, 6, 9, 12…, the next term in the sequence can be determined using the variable expression
n + 3.
If n represents a number in the sequence 1, 5, 25, 125…, the next term in the sequence can be determined by using the variable expression 5n.
Focus: Proportional Reasoning
Process standards: The student will use problem solving, mathematical communication, mathematical reasoning, connections, and representations.
Standard: 7.2 The student will describe and represent arithmetic and geometric sequences using variable expressions.
Unit: Number and Number Sense
Focus: Proportional Reasoning
Process standards: The student will use problem solving, mathematical communication, mathematical reasoning, connections, and representations.
Standard: 7.2 The student will describe and represent arithmetic and geometric sequences using variable expressions.
Essential Knowledge and Skills Essential Questions Essential Understandings All
Students should…
Tasks/
Recommended
Activities Essential Vocabulary:
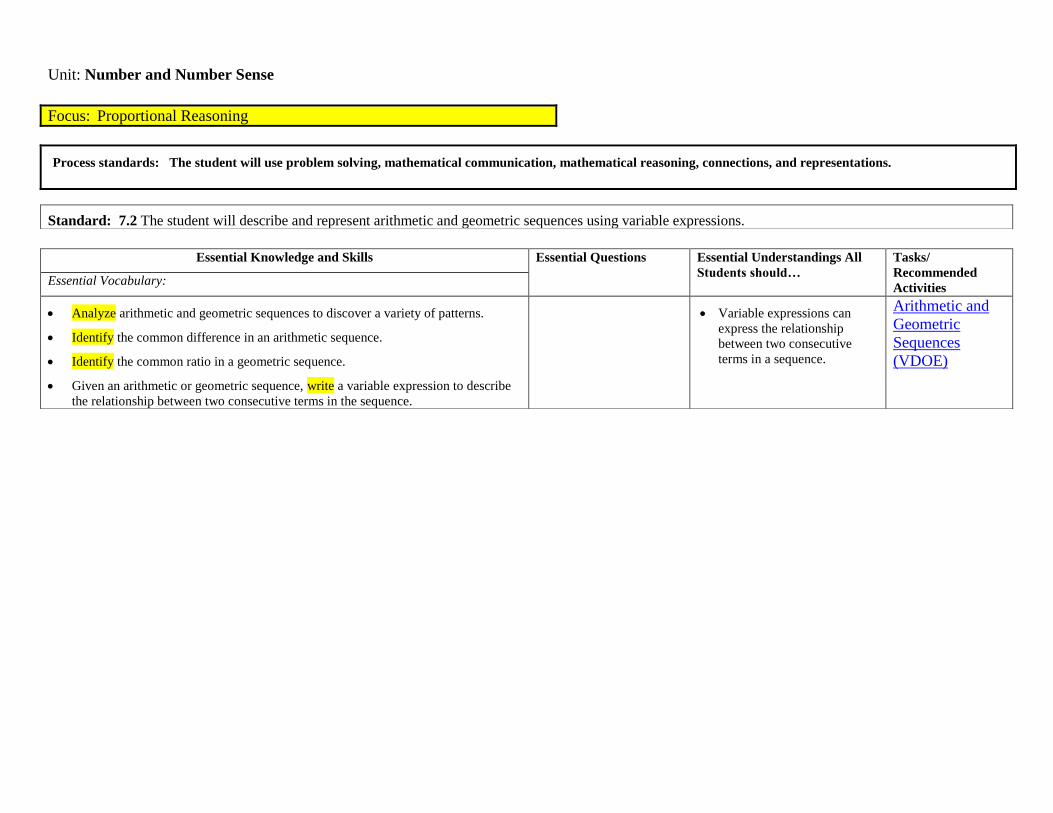
Analyze arithmetic and geometric sequences to discover a variety of patterns.
Identify the common difference in an arithmetic sequence.
Identify the common ratio in a geometric sequence.
Given an arithmetic or geometric sequence, write a variable expression to describe
the relationship between two consecutive terms in the sequence.
Variable expressions can
express the relationship
between two consecutive
terms in a sequence.
Arithmetic and
Geometric
Sequences
(VDOE)
Unit: Patterns, Functions, and Algebra
Understanding the Standard
Background information of teachers
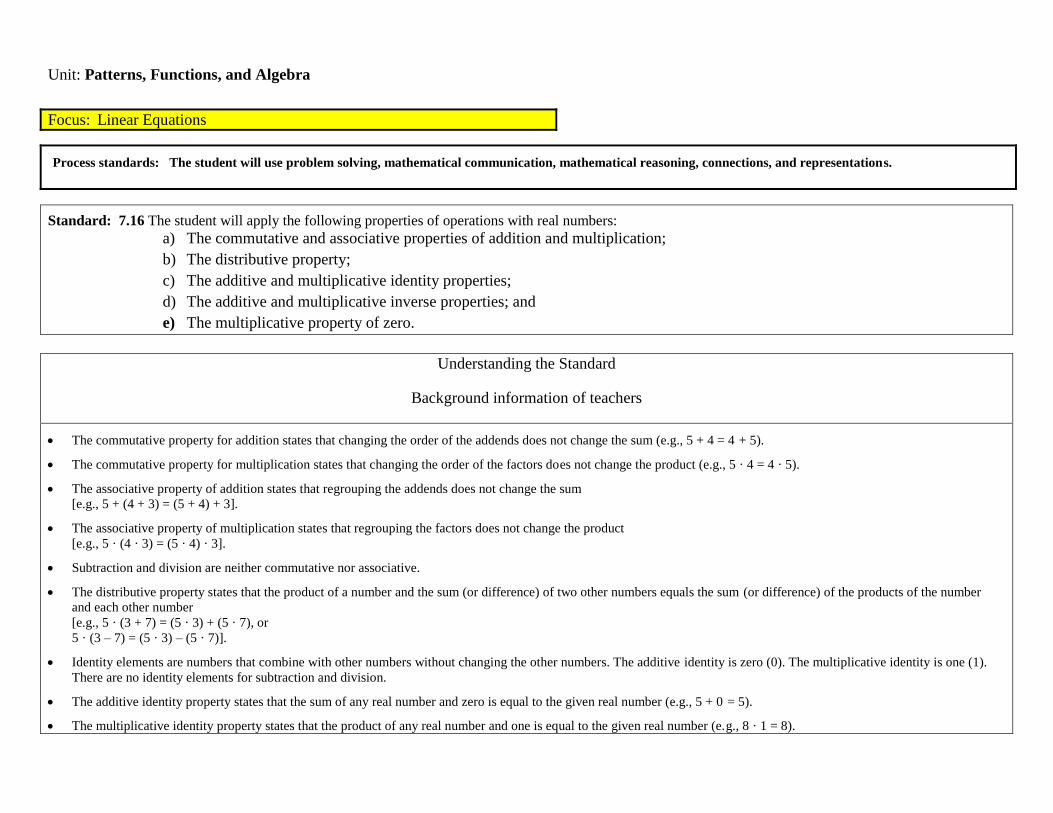
The commutative property for addition states that changing the order of the addends does not change the sum (e.g., 5 + 4 = 4 + 5).
The commutative property for multiplication states that changing the order of the factors does not change the product (e.g., 5 · 4 = 4 · 5).
The associative property of addition states that regrouping the addends does not change the sum
[e.g., 5 + (4 + 3) = (5 + 4) + 3].
The associative property of multiplication states that regrouping the factors does not change the product
[e.g., 5 · (4 · 3) = (5 · 4) · 3].
Subtraction and division are neither commutative nor associative.
The distributive property states that the product of a number and the sum (or difference) of two other numbers equals the sum (or difference) of the products of the number
and each other number
[e.g., 5 · (3 + 7) = (5 · 3) + (5 · 7), or
5 · (3 – 7) = (5 · 3) – (5 · 7)].
Identity elements are numbers that combine with other numbers without changing the other numbers. The additive identity is zero (0). The multiplicative identity is one (1).
There are no identity elements for subtraction and division.
The additive identity property states that the sum of any real number and zero is equal to the given real number (e.g., 5 + 0 = 5).
The multiplicative identity property states that the product of any real number and one is equal to the given real number (e.g., 8 · 1 = 8).
Focus: Linear Equations
Process standards: The student will use problem solving, mathematical communication, mathematical reasoning, connections, and representations.
Standard: 7.16 The student will apply the following properties of operations with real numbers:
a) The commutative and associative properties of addition and multiplication;
b) The distributive property;
c) The additive and multiplicative identity properties;
d) The additive and multiplicative inverse properties; and
e) The multiplicative property of zero.
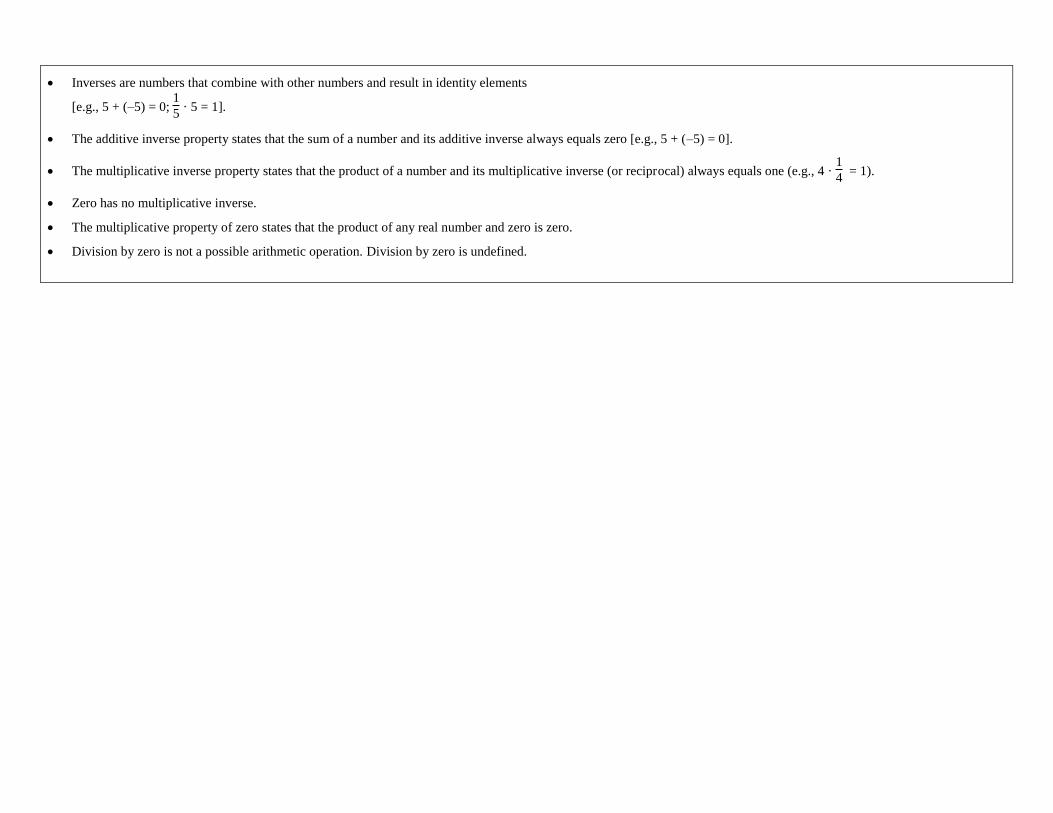
Inverses are numbers that combine with other numbers and result in identity elements
[e.g., 5 + (–5) = 0; 1
5 · 5 = 1].
The additive inverse property states that the sum of a number and its additive inverse always equals zero [e.g., 5 + (–5) = 0].
The multiplicative inverse property states that the product of a number and its multiplicative inverse (or reciprocal) always equals one (e.g., 4 · 1
4 = 1).
Zero has no multiplicative inverse.
The multiplicative property of zero states that the product of any real number and zero is zero.
Division by zero is not a possible arithmetic operation. Division by zero is undefined.
Unit: Patterns, Functions, and Algebra
Focus: Linear Equations
Process standards: The student will use problem solving, mathematical communication, mathematical reasoning, connections, and representations.
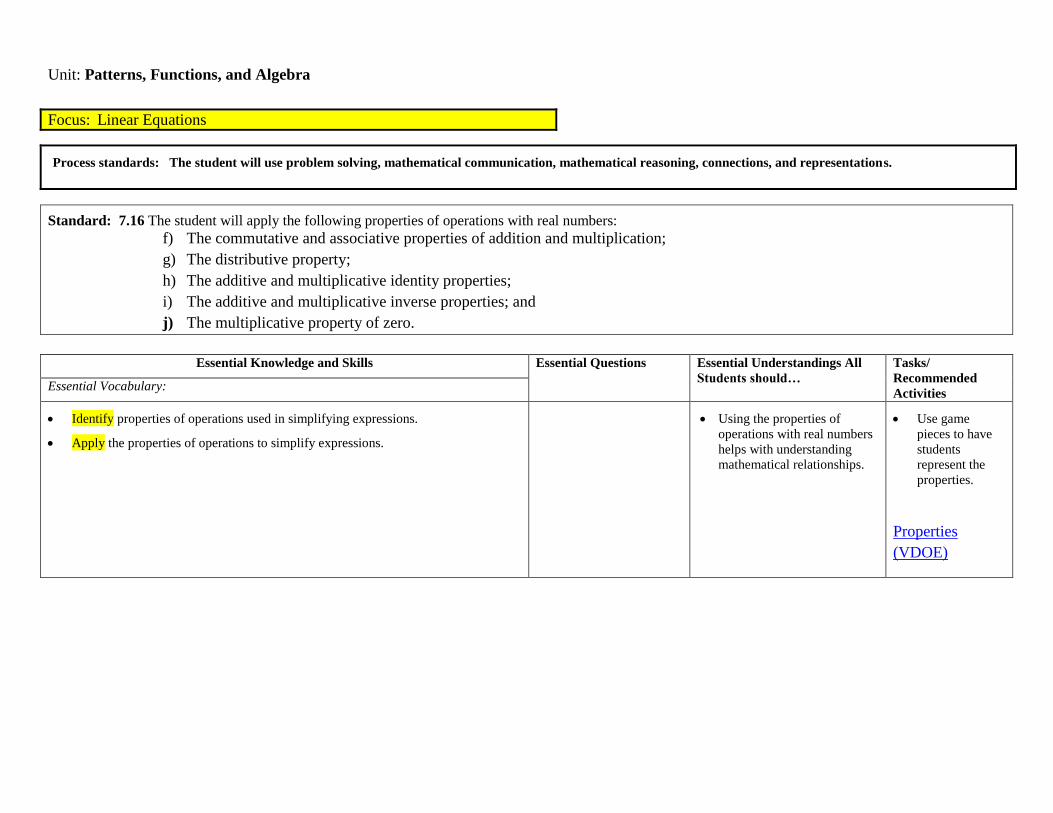
Standard: 7.16 The student will apply the following properties of operations with real numbers:
f) The commutative and associative properties of addition and multiplication;
g) The distributive property;
h) The additive and multiplicative identity properties;
i) The additive and multiplicative inverse properties; and
j) The multiplicative property of zero.
Essential Knowledge and Skills Essential Questions Essential Understandings All
Students should…
Tasks/
Recommended
Activities Essential Vocabulary:
Identify properties of operations used in simplifying expressions.
Apply the properties of operations to simplify expressions.
Using the properties of
operations with real numbers
helps with understanding
mathematical relationships.
Use game
pieces to have
students
represent the
properties.
Properties
(VDOE)
Unit: Computation and Estimation
Understanding the Standard
Background information of teachers
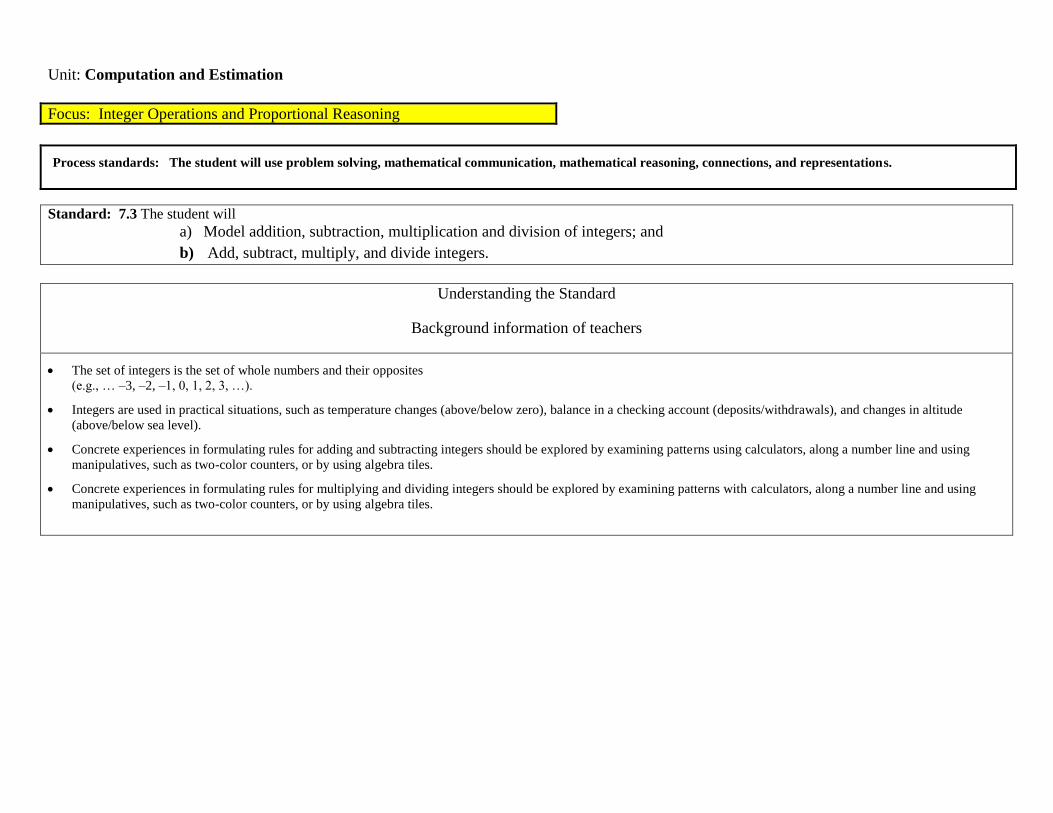
The set of integers is the set of whole numbers and their opposites
(e.g., … –3, –2, –1, 0, 1, 2, 3, …).
Integers are used in practical situations, such as temperature changes (above/below zero), balance in a checking account (deposits/withdrawals), and changes in altitude
(above/below sea level).
Concrete experiences in formulating rules for adding and subtracting integers should be explored by examining patterns using calculators, along a number line and using
manipulatives, such as two-color counters, or by using algebra tiles.
Concrete experiences in formulating rules for multiplying and dividing integers should be explored by examining patterns with calculators, along a number line and using
manipulatives, such as two-color counters, or by using algebra tiles.
Focus: Integer Operations and Proportional Reasoning
Process standards: The student will use problem solving, mathematical communication, mathematical reasoning, connections, and representations.
Standard: 7.3 The student will
a) Model addition, subtraction, multiplication and division of integers; and
b) Add, subtract, multiply, and divide integers.
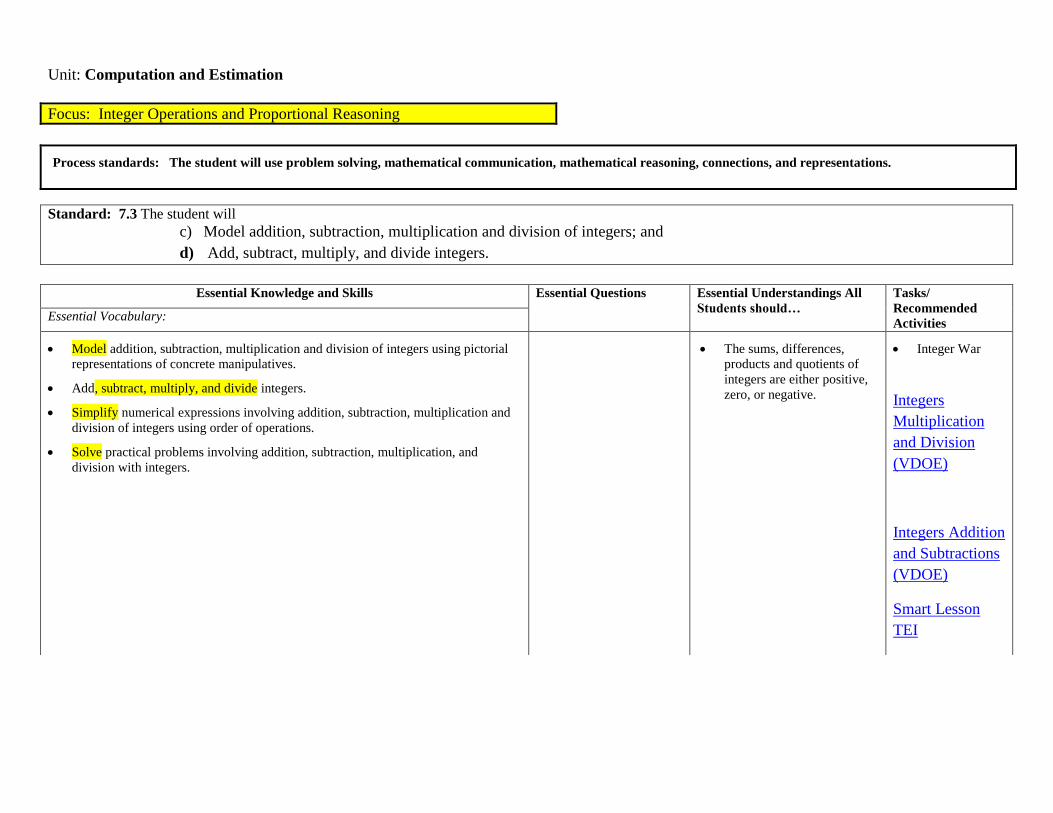
Unit: Computation and Estimation
Focus: Integer Operations and Proportional Reasoning
Process standards: The student will use problem solving, mathematical communication, mathematical reasoning, connections, and representations.
Standard: 7.3 The student will
c) Model addition, subtraction, multiplication and division of integers; and
d) Add, subtract, multiply, and divide integers.
Essential Knowledge and Skills Essential Questions Essential Understandings All
Students should…
Tasks/
Recommended
Activities Essential Vocabulary:
Model addition, subtraction, multiplication and division of integers using pictorial
representations of concrete manipulatives.
Add, subtract, multiply, and divide integers.
Simplify numerical expressions involving addition, subtraction, multiplication and
division of integers using order of operations.
Solve practical problems involving addition, subtraction, multiplication, and
division with integers.
The sums, differences,
products and quotients of
integers are either positive,
zero, or negative.
Integer War
Integers
Multiplication
and Division
(VDOE)
Integers Addition
and Subtractions
(VDOE)
Smart Lesson
TEI
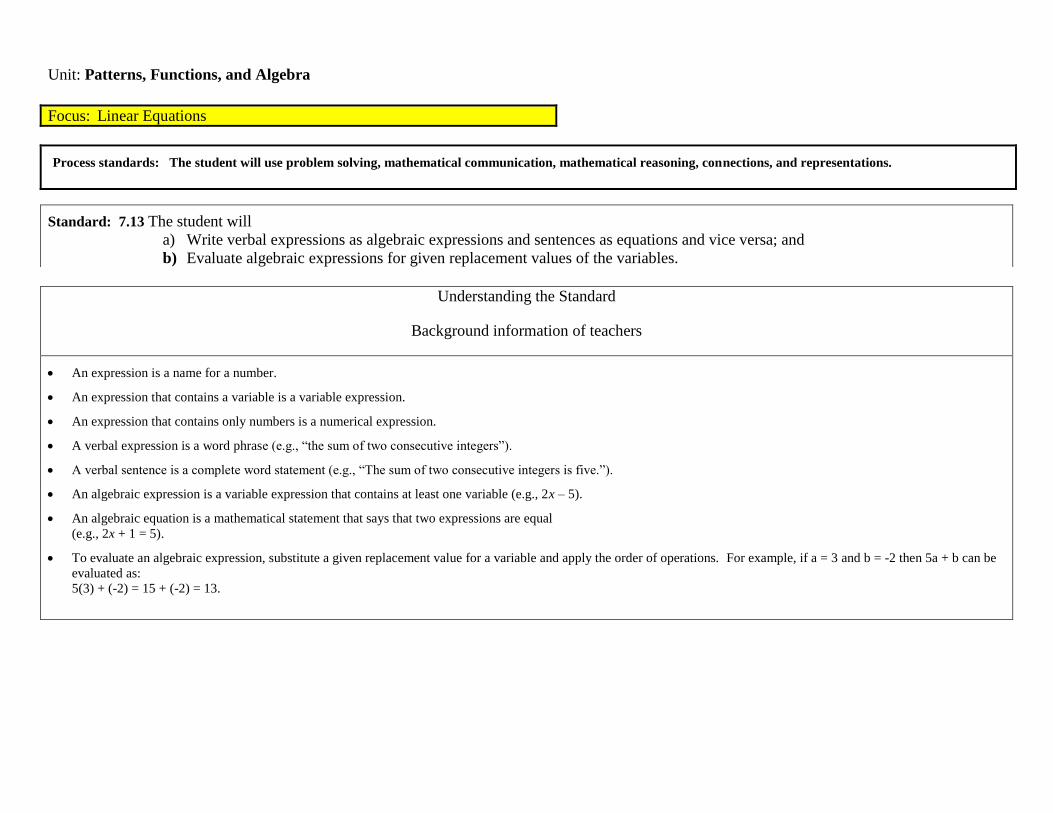
Unit: Patterns, Functions, and Algebra
Understanding the Standard
Background information of teachers
An expression is a name for a number.
An expression that contains a variable is a variable expression.
An expression that contains only numbers is a numerical expression.
A verbal expression is a word phrase (e.g., ―the sum of two consecutive integers‖).
A verbal sentence is a complete word statement (e.g., ―The sum of two consecutive integers is five.‖).
An algebraic expression is a variable expression that contains at least one variable (e.g., 2x – 5).
An algebraic equation is a mathematical statement that says that two expressions are equal
(e.g., 2x + 1 = 5).
To evaluate an algebraic expression, substitute a given replacement value for a variable and apply the order of operations. For example, if a = 3 and b = -2 then 5a + b can be
evaluated as:
5(3) + (-2) = 15 + (-2) = 13.
Focus: Linear Equations
Process standards: The student will use problem solving, mathematical communication, mathematical reasoning, connections, and representations.
Standard: 7.13 The student will
a) Write verbal expressions as algebraic expressions and sentences as equations and vice versa; and
b) Evaluate algebraic expressions for given replacement values of the variables.
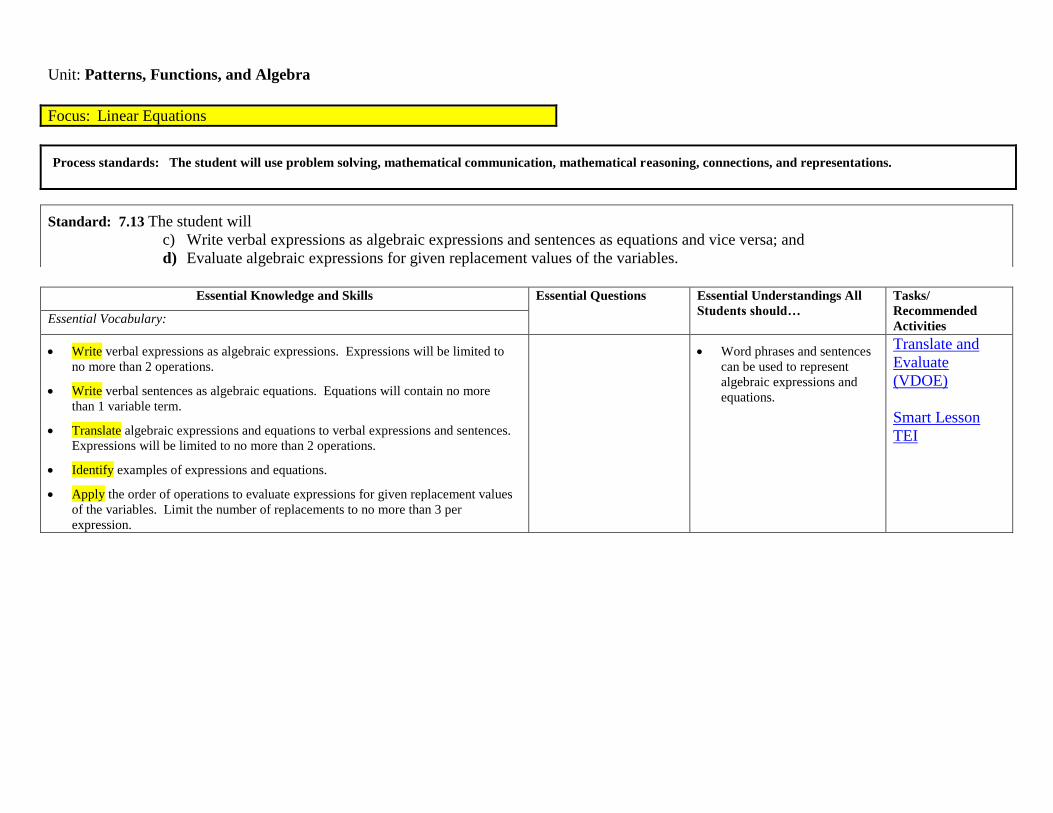
Unit: Patterns, Functions, and Algebra
Focus: Linear Equations
Process standards: The student will use problem solving, mathematical communication, mathematical reasoning, connections, and representations.
Standard: 7.13 The student will
c) Write verbal expressions as algebraic expressions and sentences as equations and vice versa; and
d) Evaluate algebraic expressions for given replacement values of the variables.
Essential Knowledge and Skills Essential Questions Essential Understandings All
Students should…
Tasks/
Recommended
Activities Essential Vocabulary:
Write verbal expressions as algebraic expressions. Expressions will be limited to
no more than 2 operations.
Write verbal sentences as algebraic equations. Equations will contain no more
than 1 variable term.
Translate algebraic expressions and equations to verbal expressions and sentences.
Expressions will be limited to no more than 2 operations.
Identify examples of expressions and equations.
Apply the order of operations to evaluate expressions for given replacement values
of the variables. Limit the number of replacements to no more than 3 per
expression.
Word phrases and sentences
can be used to represent
algebraic expressions and
equations.
Translate and
Evaluate
(VDOE)
Smart Lesson
TEI
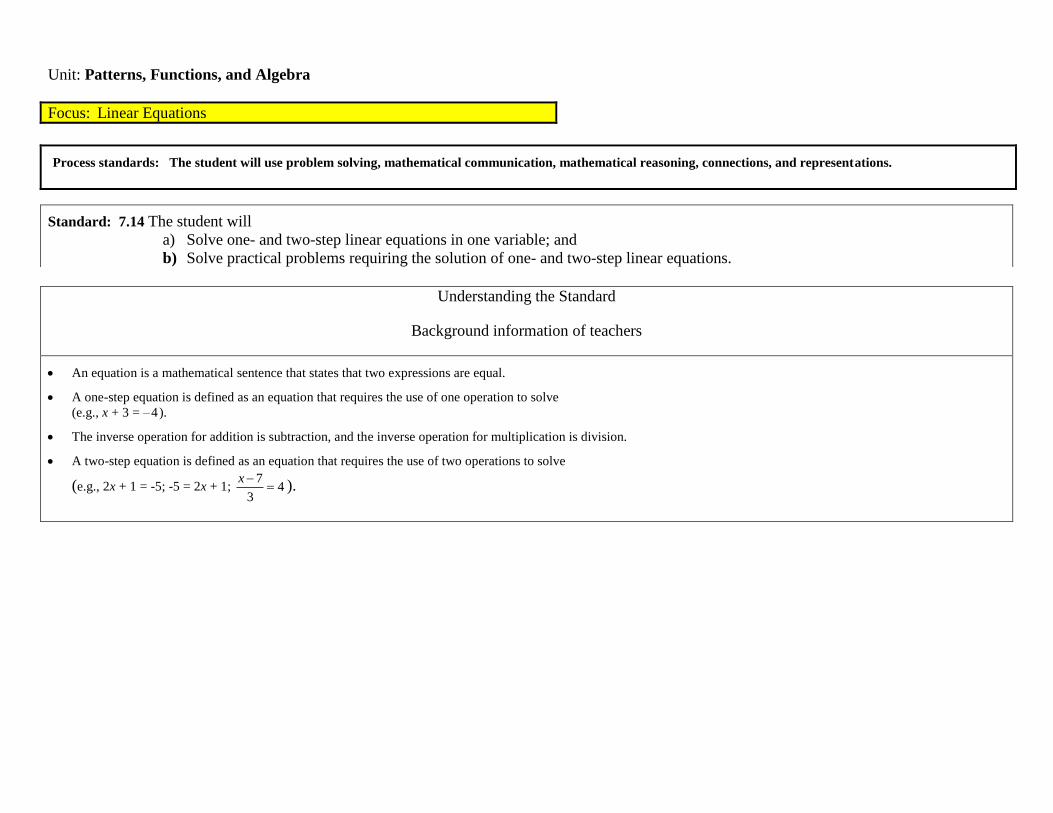
Unit: Patterns, Functions, and Algebra
Understanding the Standard
Background information of teachers
An equation is a mathematical sentence that states that two expressions are equal.
A one-step equation is defined as an equation that requires the use of one operation to solve
(e.g., x + 3 = –4).
The inverse operation for addition is subtraction, and the inverse operation for multiplication is division.
A two-step equation is defined as an equation that requires the use of two operations to solve
(e.g., 2x + 1 = -5; -5 = 2x + 1; 7
43
x ).
Focus: Linear Equations
Process standards: The student will use problem solving, mathematical communication, mathematical reasoning, connections, and representations.
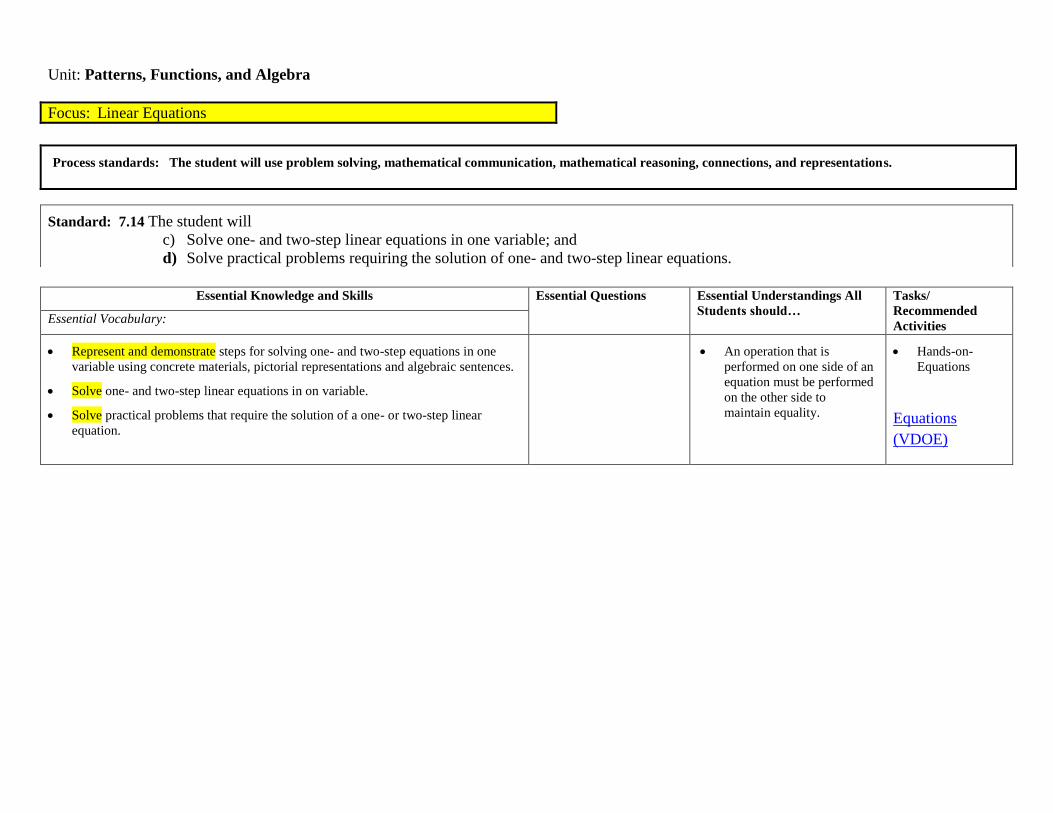
Standard: 7.14 The student will
a) Solve one- and two-step linear equations in one variable; and
b) Solve practical problems requiring the solution of one- and two-step linear equations.
Unit: Patterns, Functions, and Algebra
Focus: Linear Equations
Process standards: The student will use problem solving, mathematical communication, mathematical reasoning, connections, and representations.
Standard: 7.14 The student will
c) Solve one- and two-step linear equations in one variable; and
d) Solve practical problems requiring the solution of one- and two-step linear equations.
Essential Knowledge and Skills Essential Questions Essential Understandings All
Students should…
Tasks/
Recommended
Activities Essential Vocabulary:
Represent and demonstrate steps for solving one- and two-step equations in one
variable using concrete materials, pictorial representations and algebraic sentences.
Solve one- and two-step linear equations in on variable.
Solve practical problems that require the solution of a one- or two-step linear
equation.
An operation that is
performed on one side of an
equation must be performed
on the other side to
maintain equality.
Hands-on-
Equations
Equations
(VDOE)
Unit: Patterns, Functions, and Algebra
Understanding the Standard
Background information of teachers
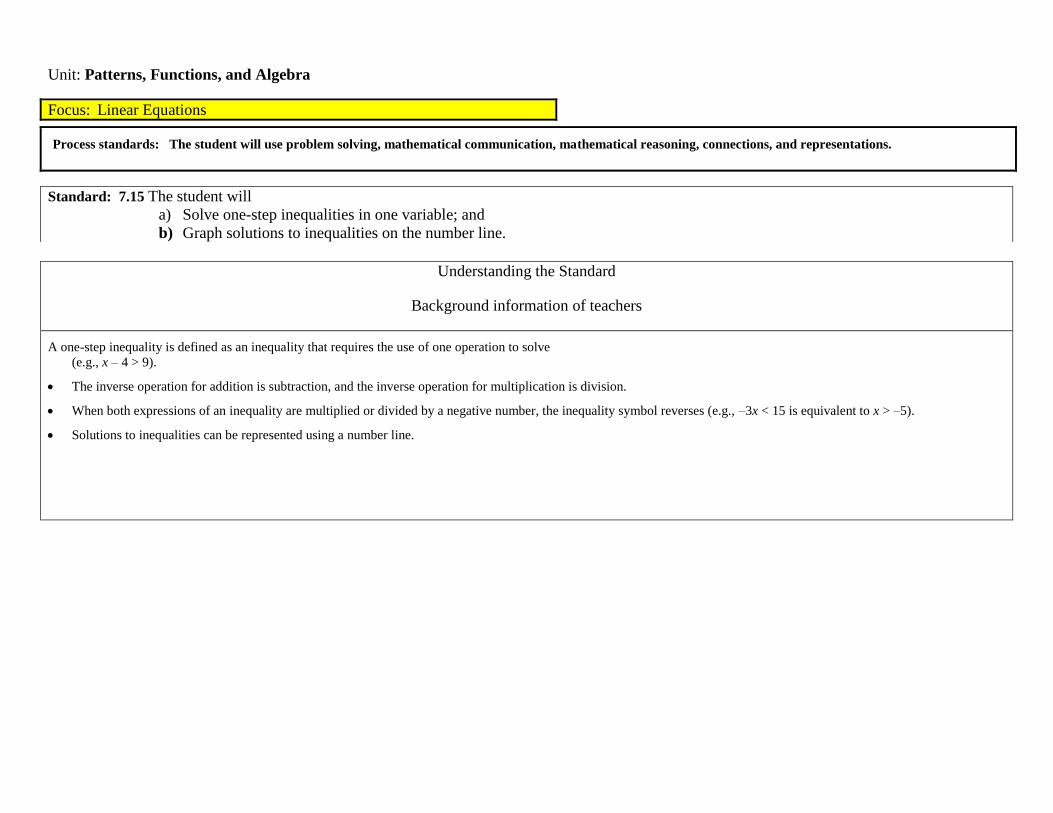
A one-step inequality is defined as an inequality that requires the use of one operation to solve
(e.g., x – 4 > 9).
The inverse operation for addition is subtraction, and the inverse operation for multiplication is division.
When both expressions of an inequality are multiplied or divided by a negative number, the inequality symbol reverses (e.g., –3x < 15 is equivalent to x > –5).
Solutions to inequalities can be represented using a number line.
Focus: Linear Equations
Process standards: The student will use problem solving, mathematical communication, mathematical reasoning, connections, and representations.
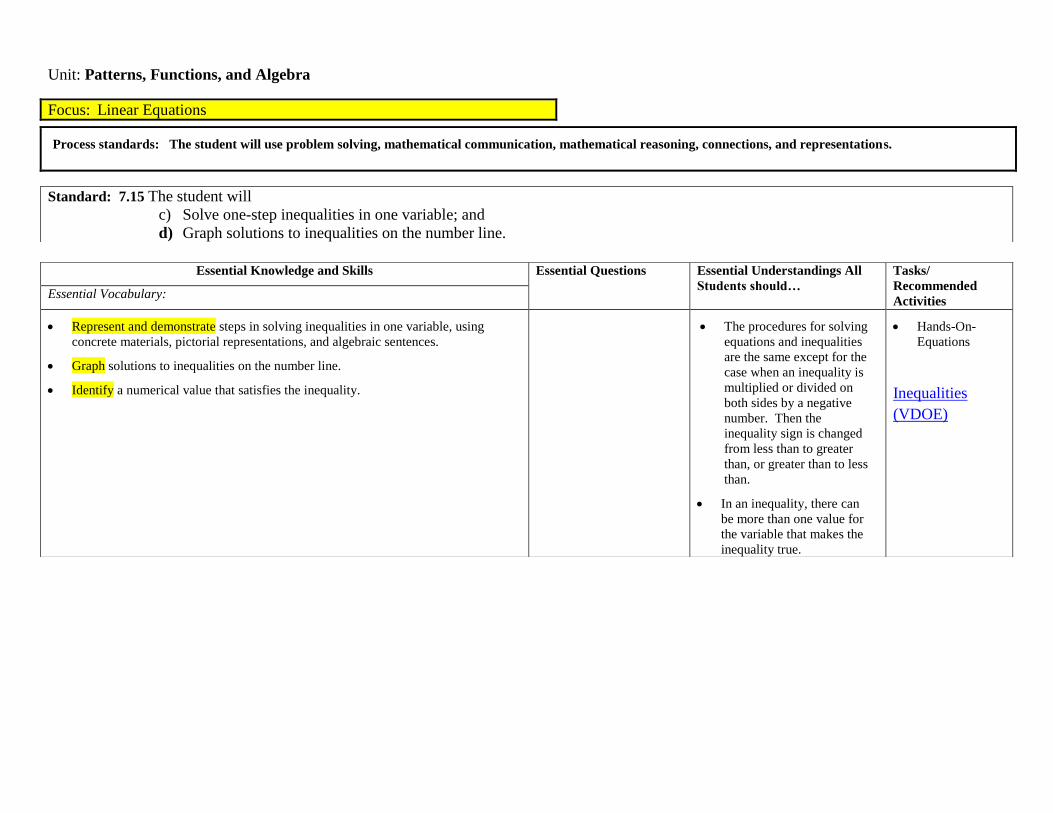
Standard: 7.15 The student will
a) Solve one-step inequalities in one variable; and
b) Graph solutions to inequalities on the number line.
Unit: Patterns, Functions, and Algebra
Focus: Linear Equations
Process standards: The student will use problem solving, mathematical communication, mathematical reasoning, connections, and representations.
Standard: 7.15 The student will
c) Solve one-step inequalities in one variable; and
d) Graph solutions to inequalities on the number line.
Essential Knowledge and Skills Essential Questions Essential Understandings All
Students should…
Tasks/
Recommended
Activities Essential Vocabulary:
Represent and demonstrate steps in solving inequalities in one variable, using
concrete materials, pictorial representations, and algebraic sentences.
Graph solutions to inequalities on the number line.
Identify a numerical value that satisfies the inequality.
The procedures for solving
equations and inequalities
are the same except for the
case when an inequality is
multiplied or divided on
both sides by a negative
number. Then the
inequality sign is changed
from less than to greater
than, or greater than to less
than.
In an inequality, there can
be more than one value for
the variable that makes the
inequality true.
Hands-On-
Equations
Inequalities
(VDOE)
Unit: Patterns, Functions, and Algebra
Understanding the Standard
Background information of teachers
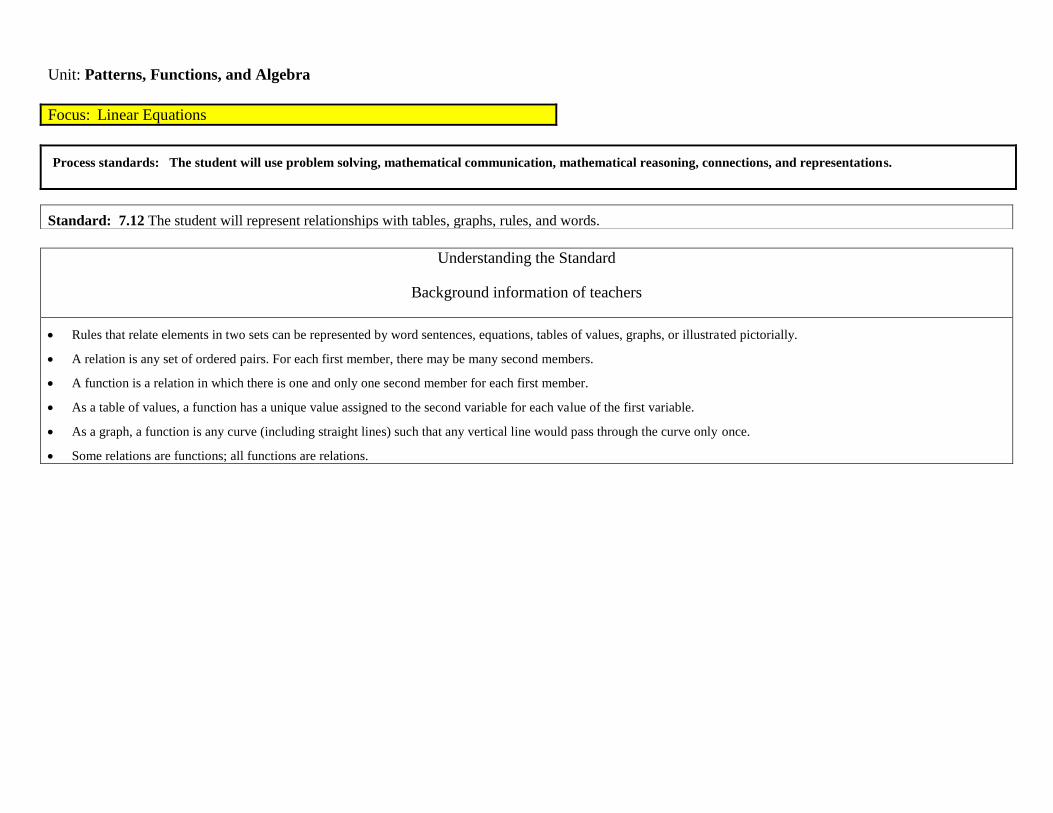
Rules that relate elements in two sets can be represented by word sentences, equations, tables of values, graphs, or illustrated pictorially.
A relation is any set of ordered pairs. For each first member, there may be many second members.
A function is a relation in which there is one and only one second member for each first member.
As a table of values, a function has a unique value assigned to the second variable for each value of the first variable.
As a graph, a function is any curve (including straight lines) such that any vertical line would pass through the curve only once.
Some relations are functions; all functions are relations.
Focus: Linear Equations
Process standards: The student will use problem solving, mathematical communication, mathematical reasoning, connections, and representations.
Standard: 7.12 The student will represent relationships with tables, graphs, rules, and words.
Unit: Patterns, Functions, and Algebra
Focus: Linear Equations
Process standards: The student will use problem solving, mathematical communication, mathematical reasoning, connections, and representations.
Standard: 7.12 The student will represent relationships with tables, graphs, rules, and words.
Essential Knowledge and Skills Essential Questions Essential Understandings All
Students should…
Tasks/
Recommended
Activities Essential Vocabulary:
Describe and represent relations and functions, using tables, graphs, rules, and
words. Given one representation, students will be able to represent the relation in
another form.
Rules that relate elements
in two sets can be
represented by word
sentences, equations, tables
of values, graphs or
illustrated pictorially.
Relationships
Round Robin
(VDOE)
Unit: Geometry
Understanding the Standard
Background information of teachers
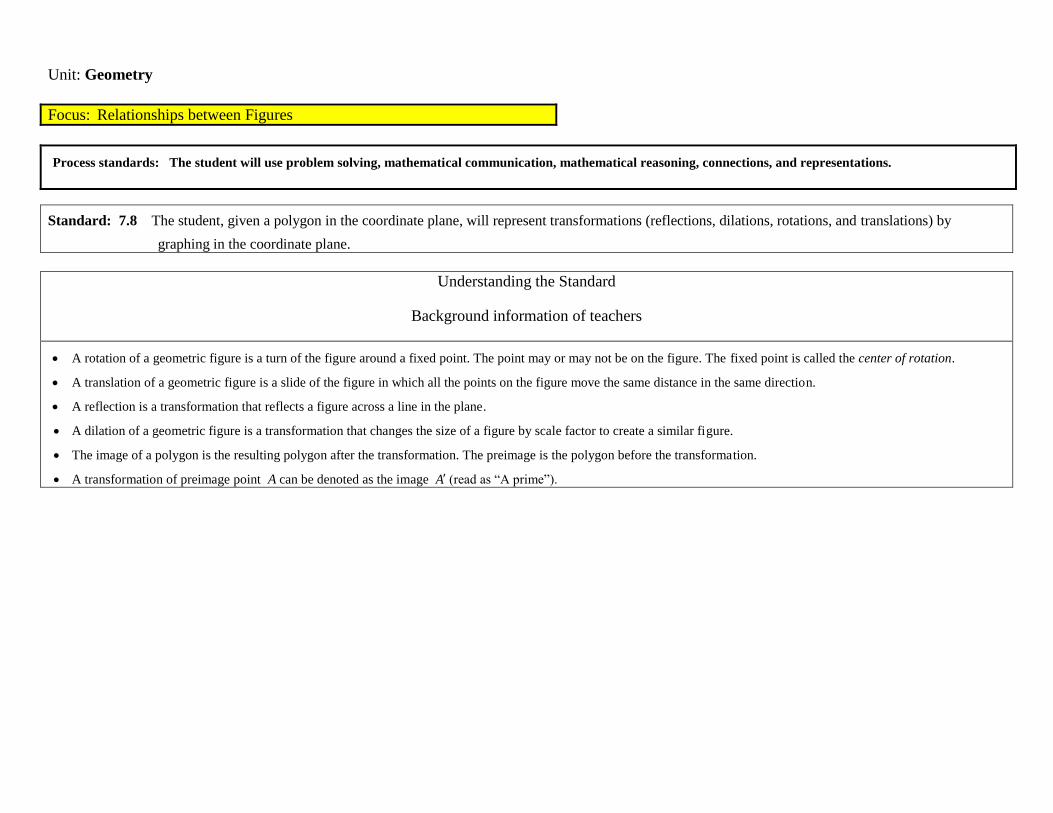
A rotation of a geometric figure is a turn of the figure around a fixed point. The point may or may not be on the figure. The fixed point is called the center of rotation.
A translation of a geometric figure is a slide of the figure in which all the points on the figure move the same distance in the same direction.
A reflection is a transformation that reflects a figure across a line in the plane.
A dilation of a geometric figure is a transformation that changes the size of a figure by scale factor to create a similar figure.
The image of a polygon is the resulting polygon after the transformation. The preimage is the polygon before the transformation.
A transformation of preimage point A can be denoted as the image A (read as ―A prime‖).
Focus: Relationships between Figures
Process standards: The student will use problem solving, mathematical communication, mathematical reasoning, connections, and representations.
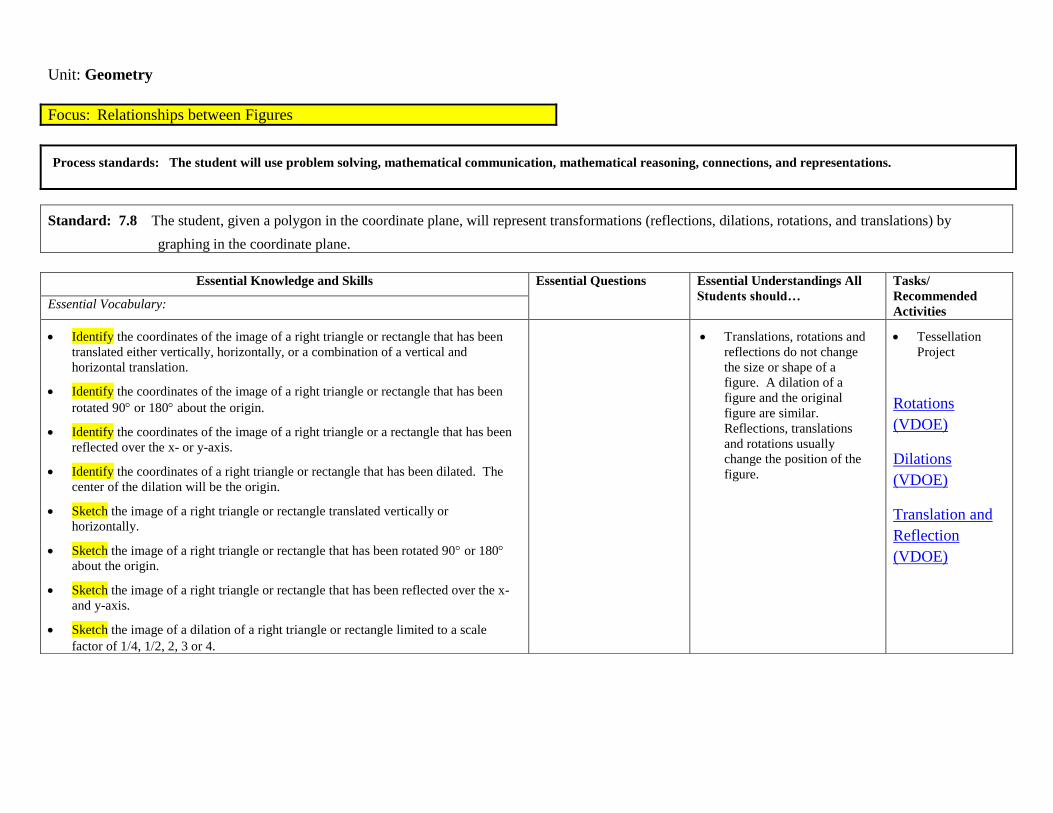
Standard: 7.8 The student, given a polygon in the coordinate plane, will represent transformations (reflections, dilations, rotations, and translations) by
graphing in the coordinate plane.
Unit: Geometry
Focus: Relationships between Figures
Process standards: The student will use problem solving, mathematical communication, mathematical reasoning, connections, and representations.
Standard: 7.8 The student, given a polygon in the coordinate plane, will represent transformations (reflections, dilations, rotations, and translations) by
graphing in the coordinate plane.
Essential Knowledge and Skills Essential Questions Essential Understandings All
Students should…
Tasks/
Recommended
Activities Essential Vocabulary:
Identify the coordinates of the image of a right triangle or rectangle that has been
translated either vertically, horizontally, or a combination of a vertical and
horizontal translation.
Identify the coordinates of the image of a right triangle or rectangle that has been
rotated 90 or 180 about the origin.
Identify the coordinates of the image of a right triangle or a rectangle that has been
reflected over the x- or y-axis.
Identify the coordinates of a right triangle or rectangle that has been dilated. The
center of the dilation will be the origin.
Sketch the image of a right triangle or rectangle translated vertically or
horizontally.
Sketch the image of a right triangle or rectangle that has been rotated 90 or 180
about the origin.
Sketch the image of a right triangle or rectangle that has been reflected over the x-
and y-axis.
Sketch the image of a dilation of a right triangle or rectangle limited to a scale
factor of 14, 12, 2, 3 or 4.
Translations, rotations and
reflections do not change
the size or shape of a
figure. A dilation of a
figure and the original
figure are similar.
Reflections, translations
and rotations usually
change the position of the
figure.
Tessellation
Project
Rotations
(VDOE)
Dilations
(VDOE)
Translation and
Reflection
(VDOE)
Unit: Geometry
Understanding the Standard
Background information of teachers
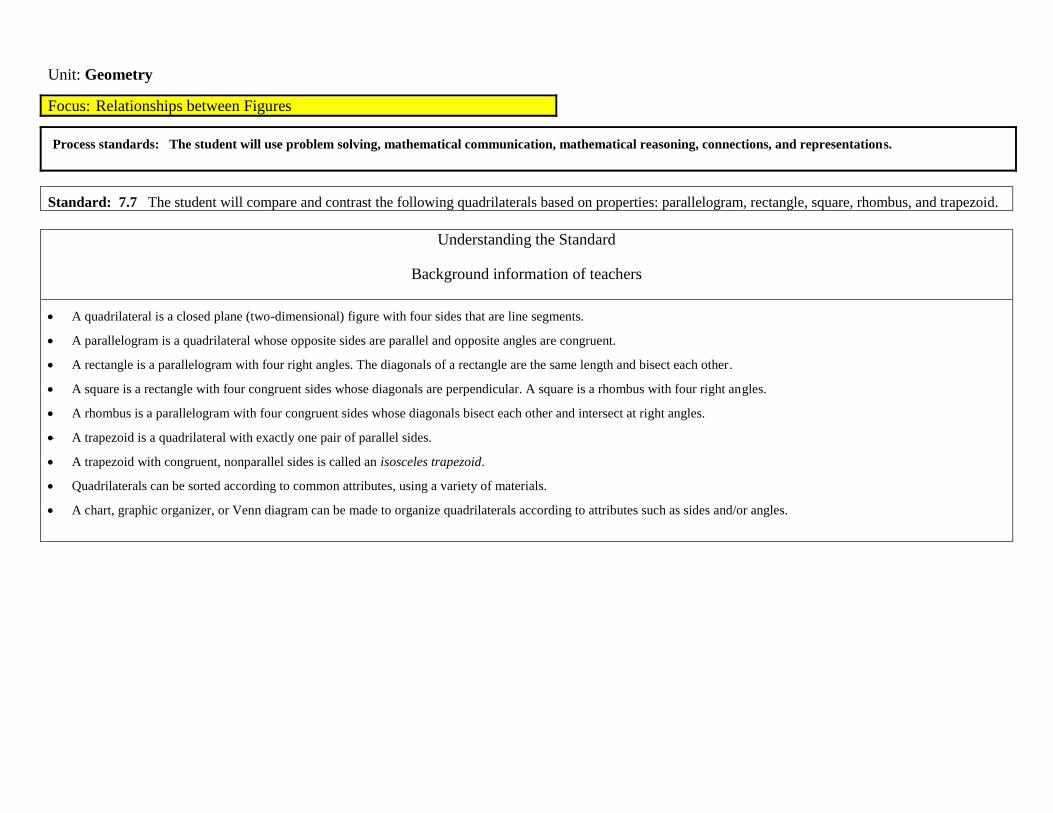
A quadrilateral is a closed plane (two-dimensional) figure with four sides that are line segments.
A parallelogram is a quadrilateral whose opposite sides are parallel and opposite angles are congruent.
A rectangle is a parallelogram with four right angles. The diagonals of a rectangle are the same length and bisect each other.
A square is a rectangle with four congruent sides whose diagonals are perpendicular. A square is a rhombus with four right angles.
A rhombus is a parallelogram with four congruent sides whose diagonals bisect each other and intersect at right angles.
A trapezoid is a quadrilateral with exactly one pair of parallel sides.
A trapezoid with congruent, nonparallel sides is called an isosceles trapezoid.
Quadrilaterals can be sorted according to common attributes, using a variety of materials.
A chart, graphic organizer, or Venn diagram can be made to organize quadrilaterals according to attributes such as sides and/or angles.
Focus: Relationships between Figures
Process standards: The student will use problem solving, mathematical communication, mathematical reasoning, connections, and representations.
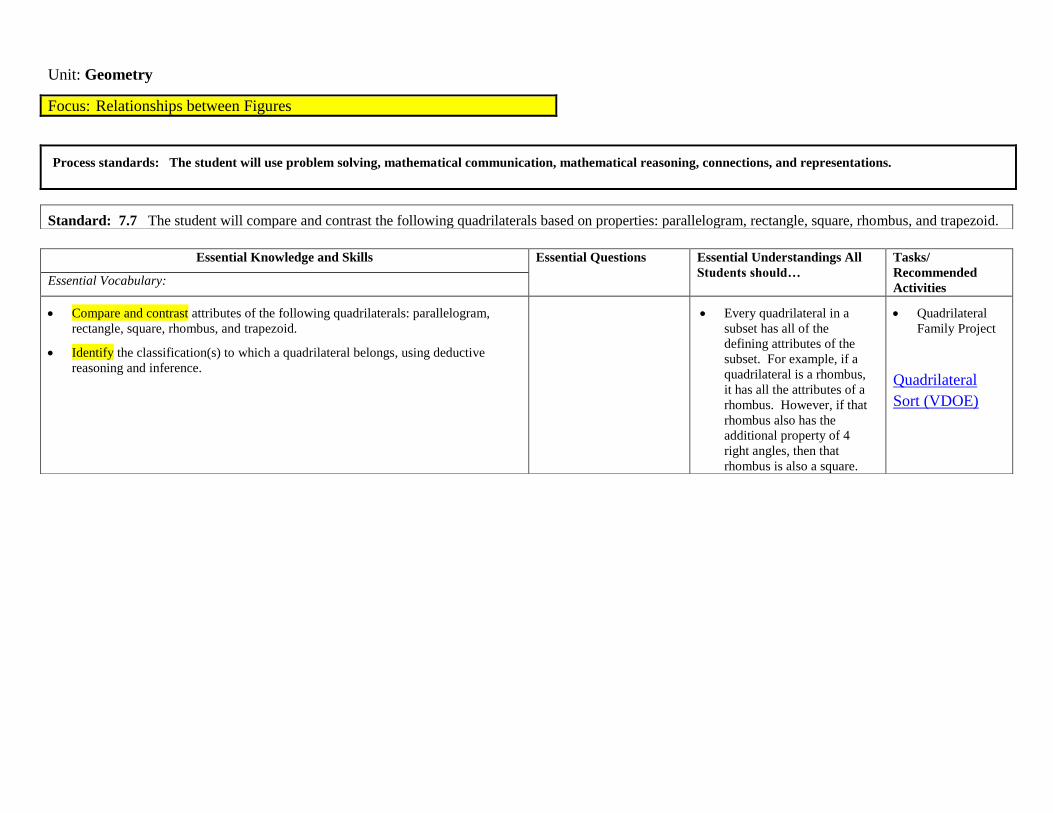
Standard: 7.7 The student will compare and contrast the following quadrilaterals based on properties: parallelogram, rectangle, square, rhombus, and trapezoid.
Unit: Geometry
Focus: Relationships between Figures
Process standards: The student will use problem solving, mathematical communication, mathematical reasoning, connections, and representations.
Standard: 7.7 The student will compare and contrast the following quadrilaterals based on properties: parallelogram, rectangle, square, rhombus, and trapezoid.
Essential Knowledge and Skills Essential Questions Essential Understandings All
Students should…
Tasks/
Recommended
Activities Essential Vocabulary:
Compare and contrast attributes of the following quadrilaterals: parallelogram,
rectangle, square, rhombus, and trapezoid.
Identify the classification(s) to which a quadrilateral belongs, using deductive
reasoning and inference.
Every quadrilateral in a
subset has all of the
defining attributes of the
subset. For example, if a
quadrilateral is a rhombus,
it has all the attributes of a
rhombus. However, if that
rhombus also has the
additional property of 4
right angles, then that
rhombus is also a square.
Quadrilateral
Family Project
Quadrilateral
Sort (VDOE)
Unit: Measurement
Understanding the Standard
Background information of teachers
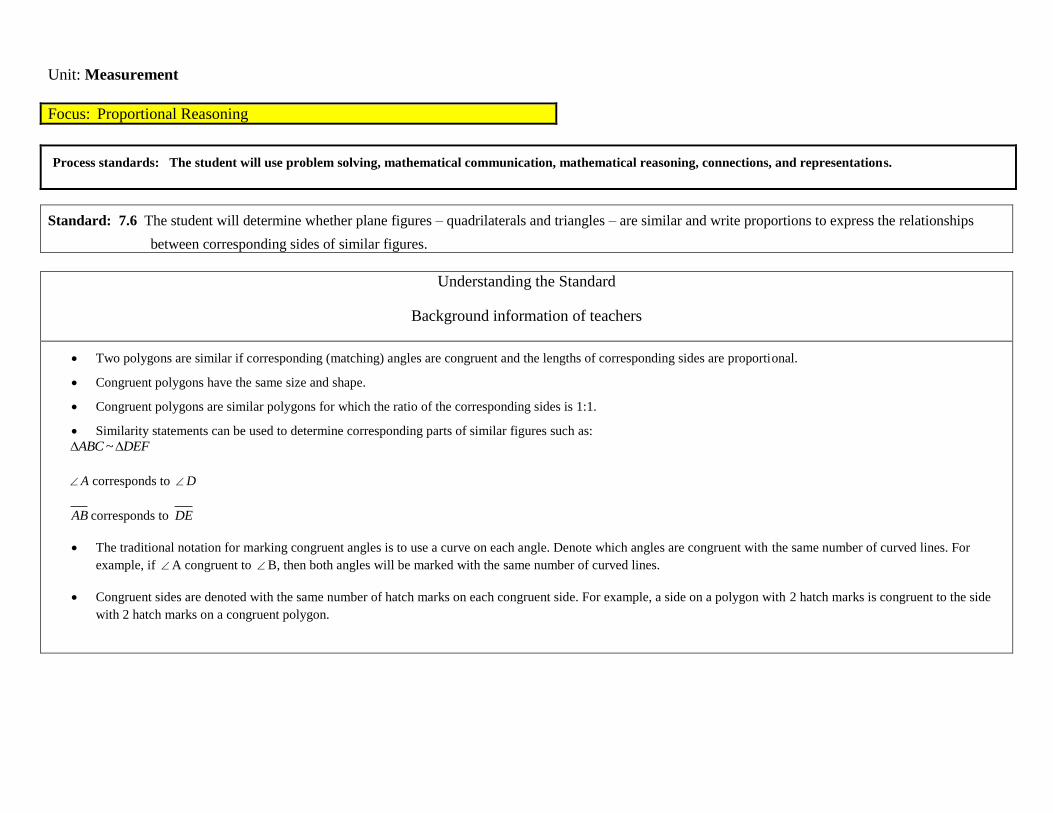
Two polygons are similar if corresponding (matching) angles are congruent and the lengths of corresponding sides are proportional.
Congruent polygons have the same size and shape.
Congruent polygons are similar polygons for which the ratio of the corresponding sides is 1:1.
Similarity statements can be used to determine corresponding parts of similar figures such as:
~ABC DEF
A corresponds to D
AB corresponds to DE
The traditional notation for marking congruent angles is to use a curve on each angle. Denote which angles are congruent with the same number of curved lines. For
example, if A congruent to B, then both angles will be marked with the same number of curved lines.
Congruent sides are denoted with the same number of hatch marks on each congruent side. For example, a side on a polygon with 2 hatch marks is congruent to the side
with 2 hatch marks on a congruent polygon.
Focus: Proportional Reasoning
Process standards: The student will use problem solving, mathematical communication, mathematical reasoning, connections, and representations.
Standard: 7.6 The student will determine whether plane figures – quadrilaterals and triangles – are similar and write proportions to express the relationships
between corresponding sides of similar figures.
Unit: Measurement
Focus: Proportional Reasoning
Process standards: The student will use problem solving, mathematical communication, mathematical reasoning, connections, and representations.
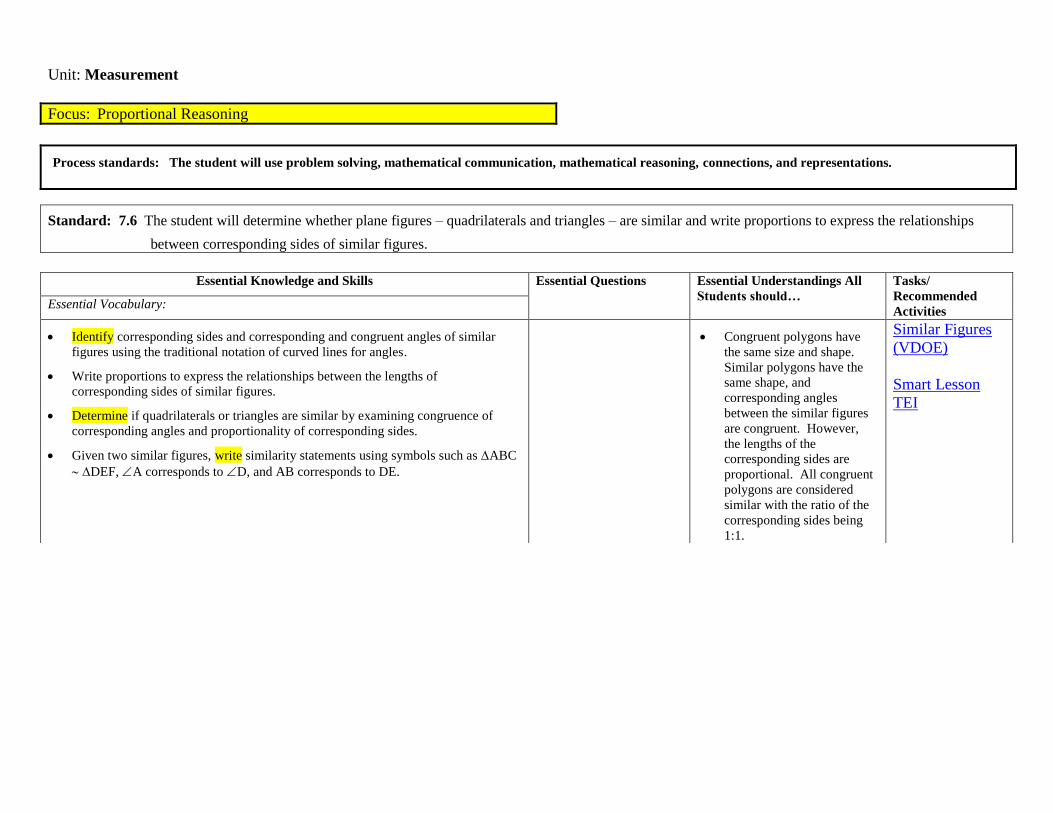
Standard: 7.6 The student will determine whether plane figures – quadrilaterals and triangles – are similar and write proportions to express the relationships
between corresponding sides of similar figures.
Essential Knowledge and Skills Essential Questions Essential Understandings All
Students should…
Tasks/
Recommended
Activities Essential Vocabulary:
Identify corresponding sides and corresponding and congruent angles of similar
figures using the traditional notation of curved lines for angles.
Write proportions to express the relationships between the lengths of
corresponding sides of similar figures.
Determine if quadrilaterals or triangles are similar by examining congruence of
corresponding angles and proportionality of corresponding sides.
Given two similar figures, write similarity statements using symbols such as ABC
DEF, A corresponds to D, and AB corresponds to DE.
Congruent polygons have
the same size and shape.
Similar polygons have the
same shape, and
corresponding angles
between the similar figures
are congruent. However,
the lengths of the
corresponding sides are
proportional. All congruent
polygons are considered
similar with the ratio of the
corresponding sides being
1:1.
Similar Figures
(VDOE)
Smart Lesson
TEI
Unit: Measurement
Focus: Proportional Reasoning
Understanding the Standard
Background information of teachers
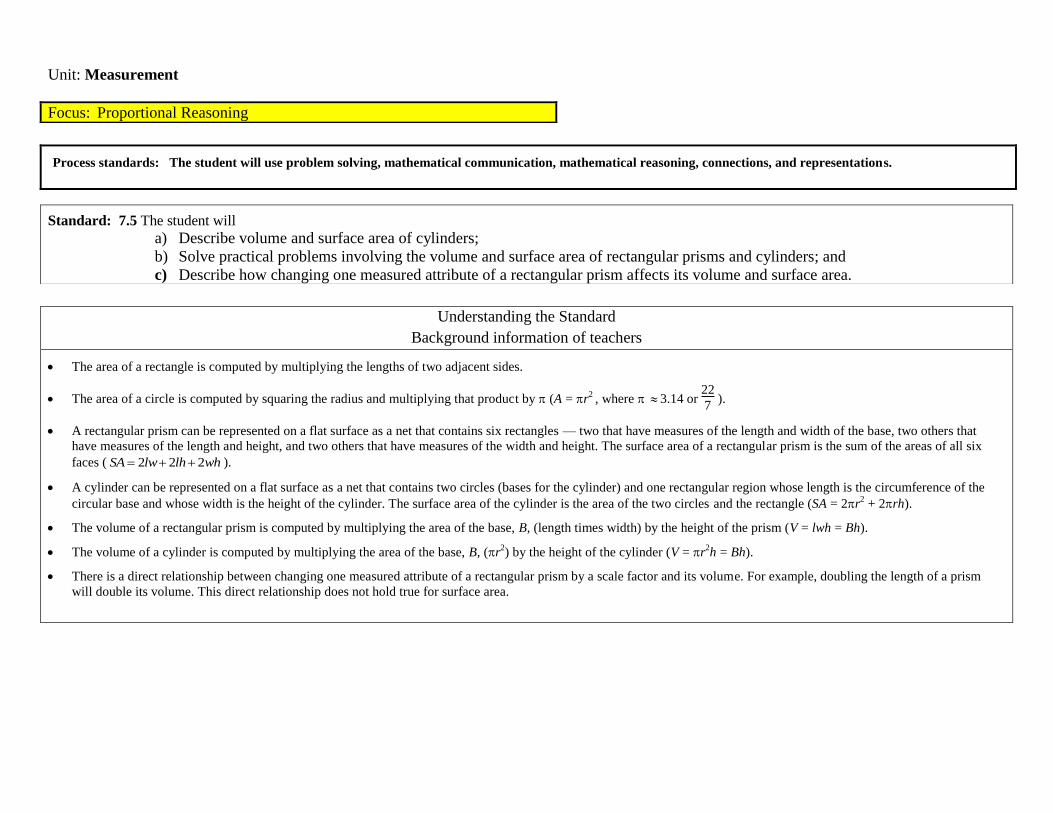
The area of a rectangle is computed by multiplying the lengths of two adjacent sides.
The area of a circle is computed by squaring the radius and multiplying that product by (A = r2 , where 3.14 or
22
7 ).
A rectangular prism can be represented on a flat surface as a net that contains six rectangles — two that have measures of the length and width of the base, two others that
have measures of the length and height, and two others that have measures of the width and height. The surface area of a rectangular prism is the sum of the areas of all six
faces ( 2 2 2SA lw lh wh ).
A cylinder can be represented on a flat surface as a net that contains two circles (bases for the cylinder) and one rectangular region whose length is the circumference of the
circular base and whose width is the height of the cylinder. The surface area of the cylinder is the area of the two circles and the rectangle (SA = 2r2 + 2rh).
The volume of a rectangular prism is computed by multiplying the area of the base, B, (length times width) by the height of the prism (V = lwh = Bh).
The volume of a cylinder is computed by multiplying the area of the base, B, (r2) by the height of the cylinder (V = r
2h = Bh).
There is a direct relationship between changing one measured attribute of a rectangular prism by a scale factor and its volume. For example, doubling the length of a prism
will double its volume. This direct relationship does not hold true for surface area.
Process standards: The student will use problem solving, mathematical communication, mathematical reasoning, connections, and representations.
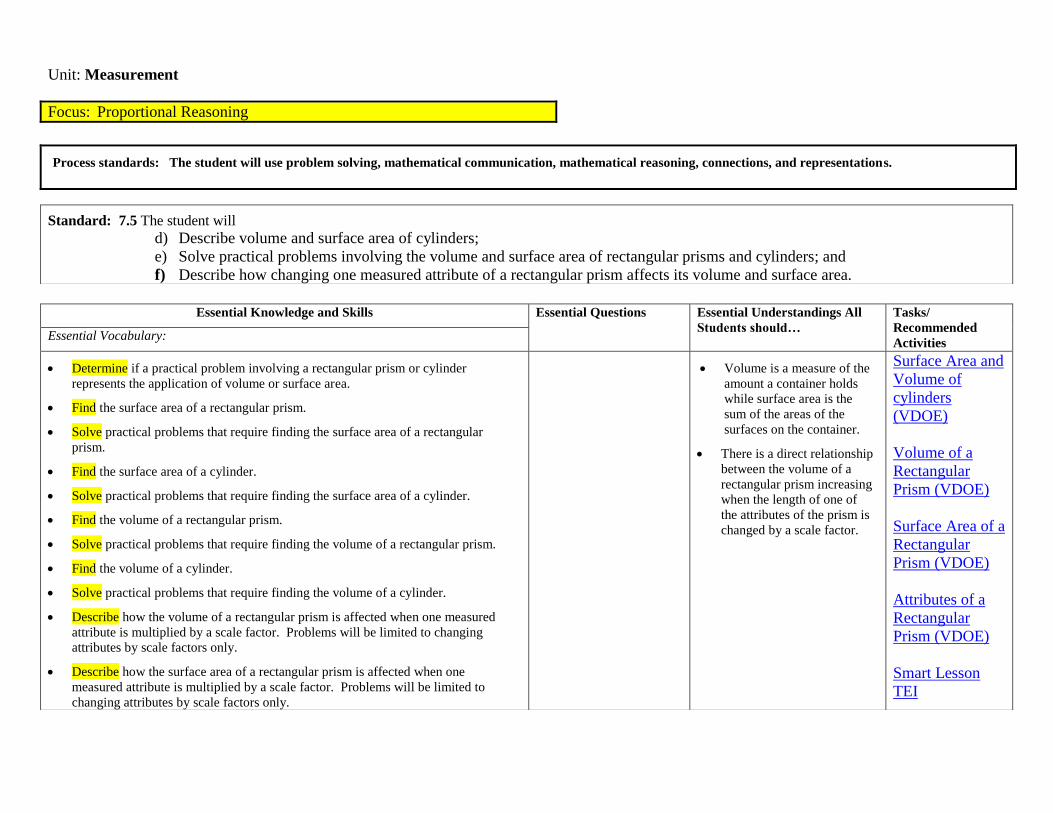
Standard: 7.5 The student will
a) Describe volume and surface area of cylinders;
b) Solve practical problems involving the volume and surface area of rectangular prisms and cylinders; and
c) Describe how changing one measured attribute of a rectangular prism affects its volume and surface area.
Unit: Measurement
Focus: Proportional Reasoning
Process standards: The student will use problem solving, mathematical communication, mathematical reasoning, connections, and representations.
Standard: 7.5 The student will
d) Describe volume and surface area of cylinders;
e) Solve practical problems involving the volume and surface area of rectangular prisms and cylinders; and
f) Describe how changing one measured attribute of a rectangular prism affects its volume and surface area.
Essential Knowledge and Skills Essential Questions Essential Understandings All
Students should…
Tasks/
Recommended
Activities Essential Vocabulary:
Determine if a practical problem involving a rectangular prism or cylinder
represents the application of volume or surface area.
Find the surface area of a rectangular prism.
Solve practical problems that require finding the surface area of a rectangular
prism.
Find the surface area of a cylinder.
Solve practical problems that require finding the surface area of a cylinder.
Find the volume of a rectangular prism.
Solve practical problems that require finding the volume of a rectangular prism.
Find the volume of a cylinder.
Solve practical problems that require finding the volume of a cylinder.
Describe how the volume of a rectangular prism is affected when one measured
attribute is multiplied by a scale factor. Problems will be limited to changing
attributes by scale factors only.
Describe how the surface area of a rectangular prism is affected when one
measured attribute is multiplied by a scale factor. Problems will be limited to
changing attributes by scale factors only.
Volume is a measure of the
amount a container holds
while surface area is the
sum of the areas of the
surfaces on the container.
There is a direct relationship
between the volume of a
rectangular prism increasing
when the length of one of
the attributes of the prism is
changed by a scale factor.
Surface Area and
Volume of
cylinders
(VDOE)
Volume of a
Rectangular
Prism (VDOE)
Surface Area of a
Rectangular
Prism (VDOE)
Attributes of a
Rectangular
Prism (VDOE)
Smart Lesson
TEI
Unit: Probability and Statistics
Focus: Applications of Statistics and Probability
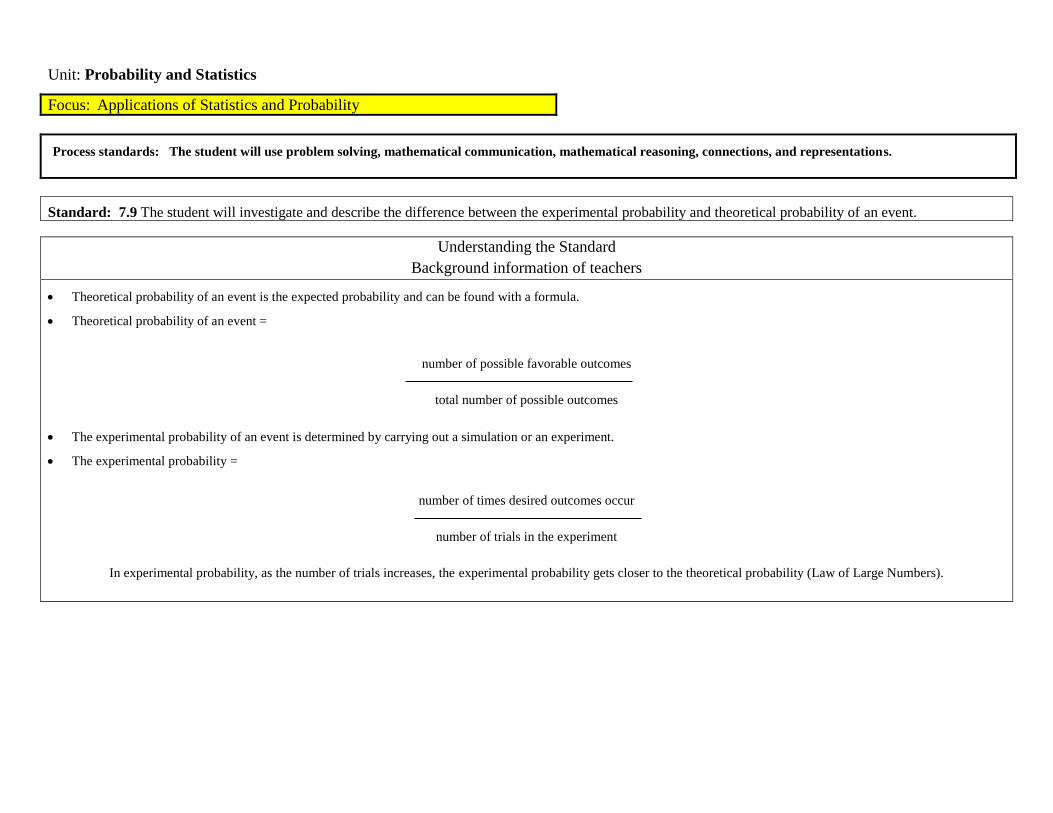
Understanding the Standard
Background information of teachers
Theoretical probability of an event is the expected probability and can be found with a formula.
Theoretical probability of an event =
number of possible favorable outcomes
total number of possible outcomes
The experimental probability of an event is determined by carrying out a simulation or an experiment.
The experimental probability =
number of times desired outcomes occur
number of trials in the experiment
In experimental probability, as the number of trials increases, the experimental probability gets closer to the theoretical probability (Law of Large Numbers).
Process standards: The student will use problem solving, mathematical communication, mathematical reasoning, connections, and representations.
Standard: 7.9 The student will investigate and describe the difference between the experimental probability and theoretical probability of an event.
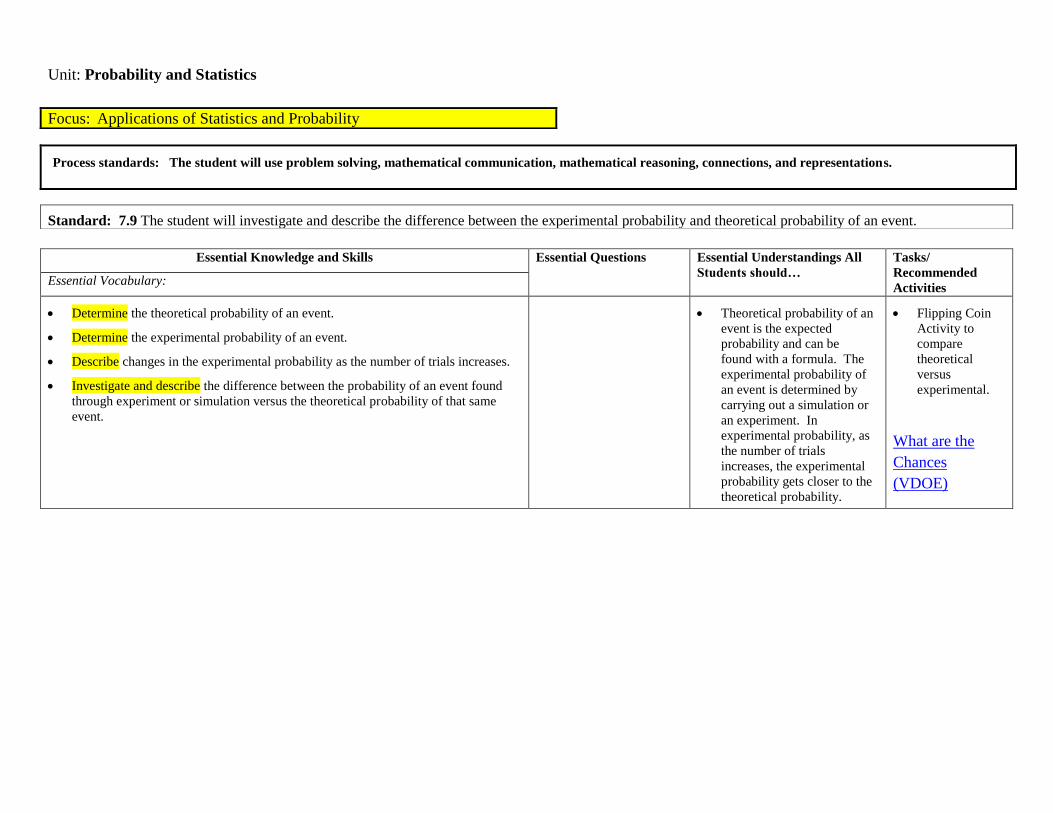
Unit: Probability and Statistics
Focus: Applications of Statistics and Probability
Process standards: The student will use problem solving, mathematical communication, mathematical reasoning, connections, and representations.
Standard: 7.9 The student will investigate and describe the difference between the experimental probability and theoretical probability of an event.
Essential Knowledge and Skills Essential Questions Essential Understandings All
Students should…
Tasks/
Recommended
Activities Essential Vocabulary:
Determine the theoretical probability of an event.
Determine the experimental probability of an event.
Describe changes in the experimental probability as the number of trials increases.
Investigate and describe the difference between the probability of an event found
through experiment or simulation versus the theoretical probability of that same
event.
Theoretical probability of an
event is the expected
probability and can be
found with a formula. The
experimental probability of
an event is determined by
carrying out a simulation or
an experiment. In
experimental probability, as
the number of trials
increases, the experimental
probability gets closer to the
theoretical probability.
Flipping Coin
Activity to
compare
theoretical
versus
experimental.
What are the
Chances
(VDOE)
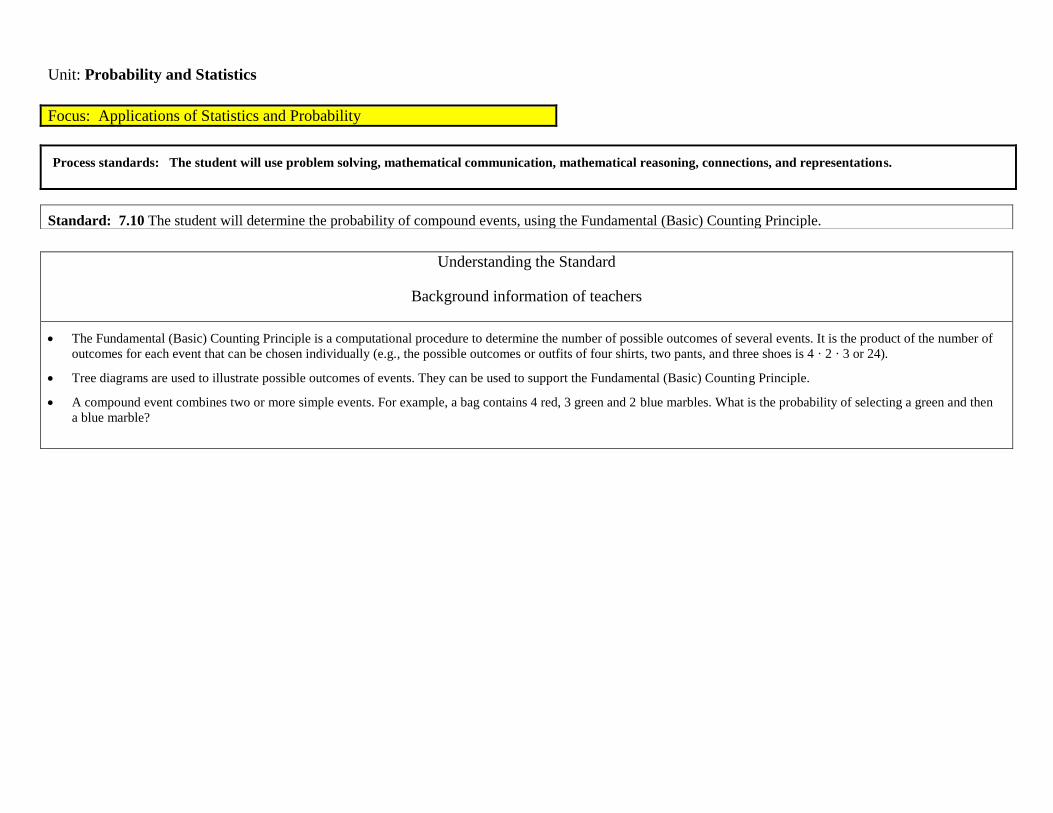
Unit: Probability and Statistics
Focus: Applications of Statistics and Probability
Process standards: The student will use problem solving, mathematical communication, mathematical reasoning, connections, and representations.
Standard: 7.10 The student will determine the probability of compound events, using the Fundamental (Basic) Counting Principle.
Understanding the Standard
Background information of teachers
The Fundamental (Basic) Counting Principle is a computational procedure to determine the number of possible outcomes of several events. It is the product of the number of
outcomes for each event that can be chosen individually (e.g., the possible outcomes or outfits of four shirts, two pants, and three shoes is 4 · 2 · 3 or 24).
Tree diagrams are used to illustrate possible outcomes of events. They can be used to support the Fundamental (Basic) Counting Principle.
A compound event combines two or more simple events. For example, a bag contains 4 red, 3 green and 2 blue marbles. What is the probability of selecting a green and then
a blue marble?
Unit: Probability and Statistics
Focus: Applications of Statistics and Probability
Process standards: The student will use problem solving, mathematical communication, mathematical reasoning, connections, and representations.
Standard: 7.10 The student will determine the probability of compound events, using the Fundamental (Basic) Counting Principle.
Essential Knowledge and Skills Essential Questions Essential Understandings All
Students should…
Tasks/
Recommended
Activities Essential Vocabulary:
Compute the number of possible outcomes by using the Fundamental (Basic)
Counting Principle.
Determine the probability of a compound event containing no more than 2 events.
The Fundamental (Basic)
Counting Principle is a
computational procedure
used to determine the
number of possible
outcomes of several events.
The Fundamental (Basic)
Counting Principle is used
to determine the number of
outcomes of several events.
It is the product of the
number of outcomes for
each event that can be
chosen individually.
The Real Meal
Deal (VDOE)
Unit: Probability and Statistics
Focus: Applications of Statistics and Probability
Process standards: The student will use problem solving, mathematical communication, mathematical reasoning, connections, and representations.
Standard: 7.11 The student, given data in a practical situation, will
a) Construct and analyze histograms; and
b) Compare and contrast histograms with other types of graphs presenting information from the same data set.
Understanding the Standard
Background information of teachers
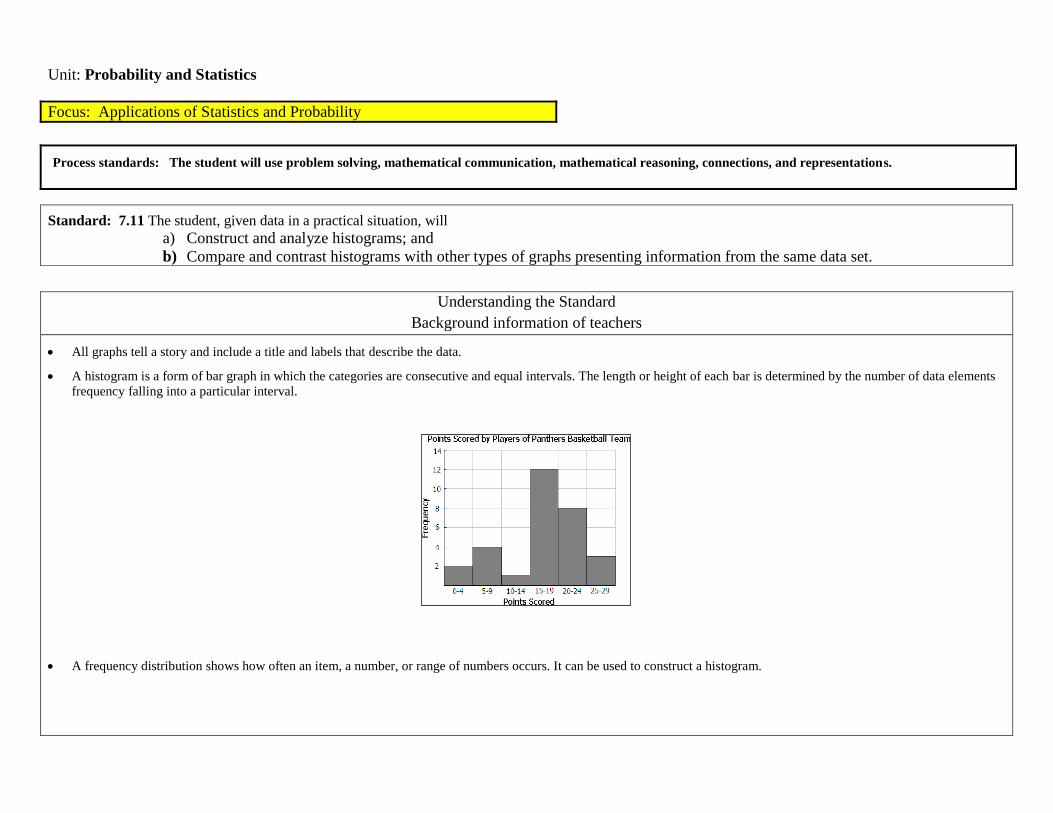
All graphs tell a story and include a title and labels that describe the data.
A histogram is a form of bar graph in which the categories are consecutive and equal intervals. The length or height of each bar is determined by the number of data elements
frequency falling into a particular interval.
A frequency distribution shows how often an item, a number, or range of numbers occurs. It can be used to construct a histogram.
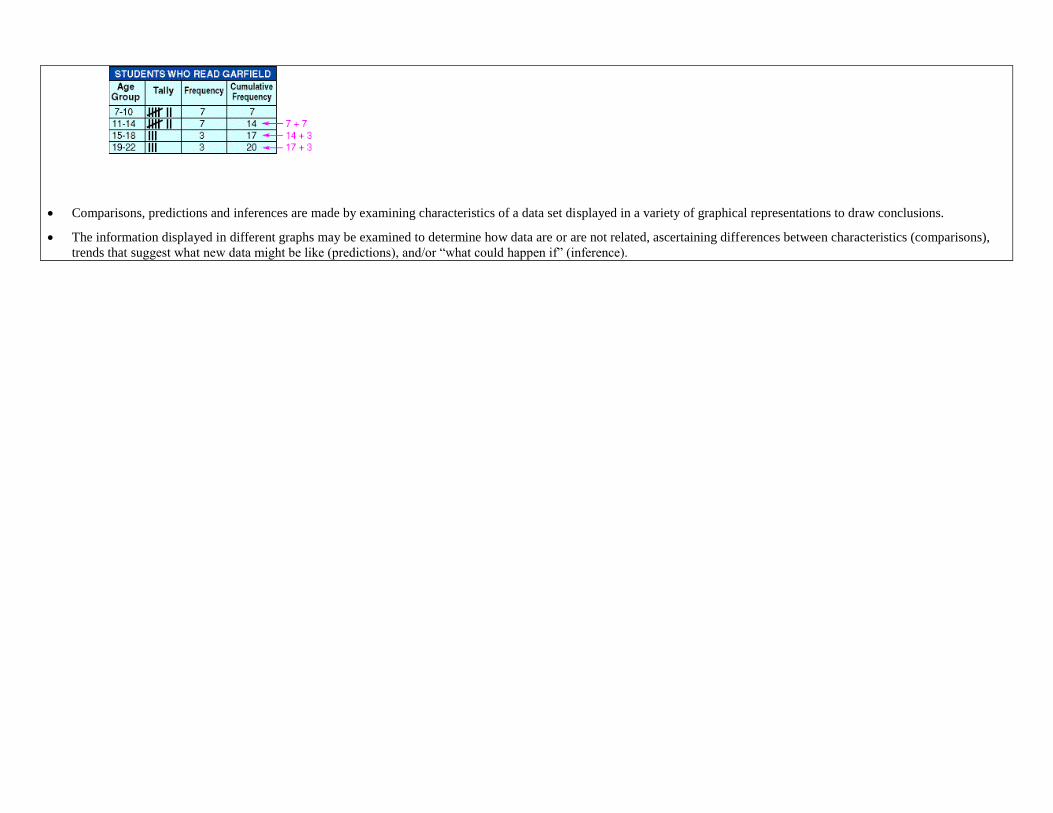
Comparisons, predictions and inferences are made by examining characteristics of a data set displayed in a variety of graphical representations to draw conclusions.
The information displayed in different graphs may be examined to determine how data are or are not related, ascertaining differences between characteristics (comparisons),
trends that suggest what new data might be like (predictions), and/or ―what could happen if‖ (inference).
Unit: Probability and Statistics
Focus: Applications of Statistics and Probability
Process standards: The student will use problem solving, mathematical communication, mathematical reasoning, connections, and representations.
Standard: 7.11 The student, given data in a practical situation, will
c) Construct and analyze histograms; and
d) Compare and contrast histograms with other types of graphs presenting information from the same data set.
Essential Knowledge and Skills Essential Questions Essential Understandings All
Students should…
Tasks/
Recommended
Activities Essential Vocabulary:
Collect, analyze, display, and interpret a data set using histograms. For collection
and display of raw data, limit the data to 20 items.
Determine patterns and relationships within data sets (e.g., trends).
Make inferences, conjectures, and predictions based on analysis of a set of data.
Compare and contrast histograms with line plots, circle graphs, and stem-and-leaf
plots presenting information from the same data set.
Numerical data that can be
characterized using
consecutive intervals are
best displayed in a
histogram.
Name and
Number (VDOE)