Embed Size (px)
Citation preview

4400, 525 – 8th Ave SWEighth Avenue Place EastCalgary, AB T2P 1G1
T: (403) 718-0700E: [email protected]
www.7genergy.com Kakwa River Project Annual Report 2016
AN
NU
AL R
EPOR
T 2016
SEVEN
GEN
ERATIO
NS EN
ERGY LTD
.

Corporate InformationMANAGEMENT
Pat CarlsonCEO
Marty ProctorPresident & COO
Christopher LawCFO
Glen Nevokshonoff Senior Vice President, Operations
Susan TargettSenior Vice President
Merlyn SpenceSenior Vice President, Marketing
Tim StauftSenior Vice President
Kyle BrunnerGeneral Counsel
Chris FeltinVice President, Corporate Planning
Randall HnatuikVice President, Business Development
Barry HucikVice President, Drilling
Kevin JohnstonVice President, Accounting & Controller
Brian NewmarchVice President, Capital Markets
Charlotte RaggettVice President, Midstream Business Development
DIRECTORS
Kent JespersenChairman
Pat CarlsonCEO
Kevin Brown
Avik Dey
Harvey Doerr
Paul Hand
Dale Hohm
Michael Kanovsky
Bill McAdam
Kaush Rakhit
M. Jacqueline Sheppard
Jeff van Steenbergen
CORPORATE OFFICE
4400, 525 – 8 Ave SWCalgary, Alberta, T2P 1G1Telephone: (403) 718-0700Fax: (403) 532-8020
TRUSTEE AND TRANSFER AGENT
Computershare Trust Company Of Canada600, 530 – 8 Ave SWCalgary, Alberta, T2P 3S8
BANKS
Royal Bank of Canada
Credit Suisse AG, Toronto Branch
Bank of Montreal
Canadian Imperial Bank of Commerce
National Bank of Canada
The Bank of Nova Scotia
The Toronto-Dominion Bank
Alberta Treasury Branches
Caisse Centrale Desjardins
JP Morgan Chase Bank, N.A., Toronto Branch
Wells Fargo Bank, N.A., Canadian Branch
Export Development Canada
AUDITORS
PricewaterhouseCoopers LLP
LEGAL COUNSEL
Stikeman Elliott LLP
INDEPENDENT EVALUATORS
McDaniel & Associates Consultants Ltd.
STOCK SYMBOL
VIIToronto Stock Exchange
2016 At a Glance
Seven Generations Energy Ltd. is an independent, publicly-traded energy company focused on the acquisition, development and value optimization of high-quality, tight rock, natural gas resource plays.
Seven Generations diff erentiates itself through its core attributes: the quality of its liquids-rich asset, large resource size, desirable location and market access, a high degree of operational control, proven and innovative technical execution and unique operating approaches.
We are committed to protecting the natural beauty of the environment and preserving its capacity for current and future generations. While we recognize that our activity and operations impact the air, water, land and natural life, we believe it is vital that we work with all our stakeholders to reduce and minimize our environmental impacts.
Environment Employees
Communities
Supply & ServiceProviders
Government &Regulators
Partners
Shareholders
IN BUSINESS TO SERVE OUR STAKEHOLDERS.
DRIVEN TO SERVE THEM IN DIFFERENTIATED WAYS.
See page 7 for our Level 1 Corporate Policy, our Code of Conduct.
Table of Contents
CEO’s Message .............................................. 2
Level 1 Corporate Policy ...............................7
President’s Message .................................... 8
Financial Strength .......................................10
Optimizing Assets .......................................12
Serving Stakeholders inDiff erent, Better Ways ...............................14
Highlights Summary ....................................18
Management’s Discussion and Analysis ................................................20
Independent Auditor’s Report ..................65
Consolidated Financial Statements ........66
Notes to the Consolidated Financial Statements ................................. 70
Corporate Information ... Inside Back Cover
For important additional information, please refer to the reader advisories on page 61 and to the “Non-IFRS Financial Measures” advisory on page 54.
On the cover: Kakwa River Project, Lator natural gas plant in the distance.

OUR STRATEGY
Stakeholder Service
Differentiate in the service of all stakeholders.
Enhance social license by adhering to 7G’s Level 1 Corporate Policy, or Code of Conduct.
In a competitive world, only those who best serve their stakeholders can expect long term survival.
Supply Cost
Combine resource selection with innovation, technology and efficiency to remain among North America’s lowest supply cost gas developers.
Financial Sustainability
Continued profitable growth to achieve cash flow self sufficiency.
Earn full cycle returns on capital employed across the entire commodity cycle.
Focused capital deployment on high return opportunities with hedged economics.
Market Access
Seek out and position in gathering, processing, transportation and marketing opportunities to expand market access.
Leverage market access to capture premium markets for the Company’s production.
Seven Generations trades on the Toronto Stock Exchange under the symbol VII.
2016 PRODUCTION SPLIT
33% Condensate 41% Natural Gas 26% Natural Gas Liquids
$733 millionFUNDS FROM OPERATIONS
+77%
117,800 boe/dAVERAGE PRODUCTION
+95%
65% growthPRODUCTION PER SHARE
825 MMboePROVED RESERVES
+95%
$21.12 per boeOPERATING NETBACK
50% growthFUNDS FROM OPERATIONS PER SHARE
SEVEN GENERATIONS 2016 Annual Report 1
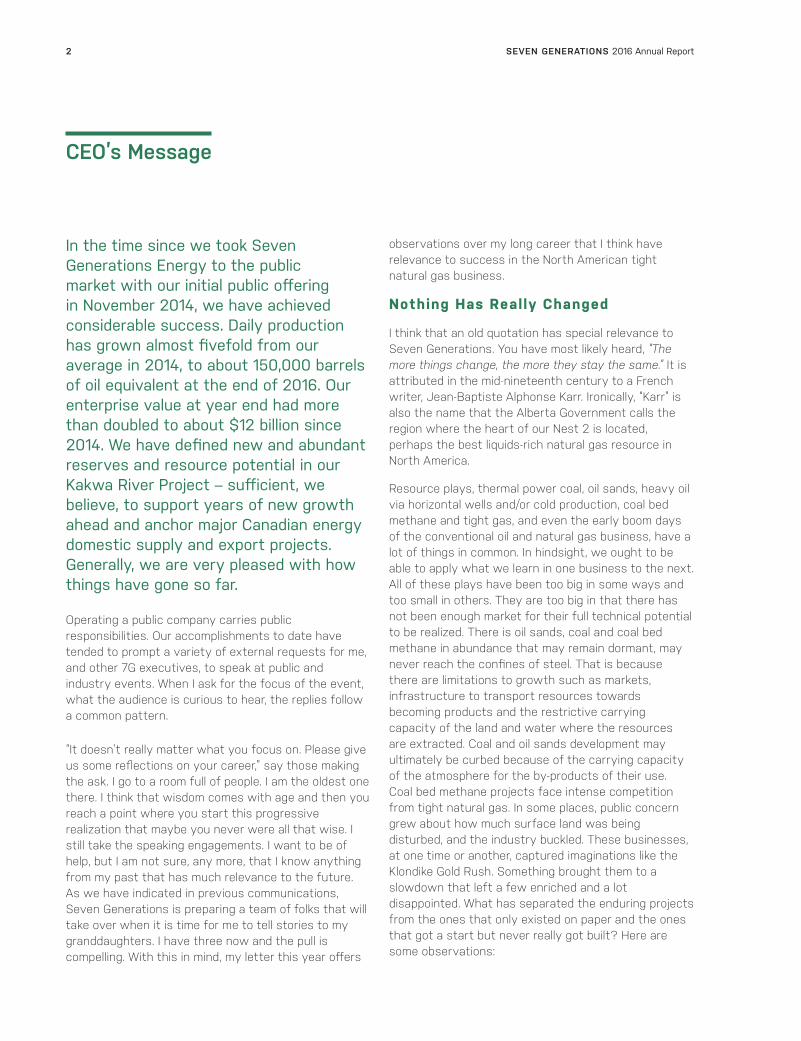
CEO’s Message
In the time since we took Seven Generations Energy to the public market with our initial public offering in November 2014, we have achieved considerable success. Daily production has grown almost fivefold from our average in 2014, to about 150,000 barrels of oil equivalent at the end of 2016. Our enterprise value at year end had more than doubled to about $12 billion since 2014. We have defined new and abundant reserves and resource potential in our Kakwa River Project – sufficient, we believe, to support years of new growth ahead and anchor major Canadian energy domestic supply and export projects. Generally, we are very pleased with how things have gone so far.
Operating a public company carries public responsibilities. Our accomplishments to date have tended to prompt a variety of external requests for me, and other 7G executives, to speak at public and industry events. When I ask for the focus of the event, what the audience is curious to hear, the replies follow a common pattern.
“It doesn’t really matter what you focus on. Please give us some reflections on your career,” say those making the ask. I go to a room full of people. I am the oldest one there. I think that wisdom comes with age and then you reach a point where you start this progressive realization that maybe you never were all that wise. I still take the speaking engagements. I want to be of help, but I am not sure, any more, that I know anything from my past that has much relevance to the future. As we have indicated in previous communications, Seven Generations is preparing a team of folks that will take over when it is time for me to tell stories to my granddaughters. I have three now and the pull is compelling. With this in mind, my letter this year offers
observations over my long career that I think have relevance to success in the North American tight natural gas business.
Nothing Has Really Changed
I think that an old quotation has special relevance to Seven Generations. You have most likely heard, “The more things change, the more they stay the same.” It is attributed in the mid-nineteenth century to a French writer, Jean-Baptiste Alphonse Karr. Ironically, “Karr” is also the name that the Alberta Government calls the region where the heart of our Nest 2 is located, perhaps the best liquids-rich natural gas resource in North America.
Resource plays, thermal power coal, oil sands, heavy oil via horizontal wells and/or cold production, coal bed methane and tight gas, and even the early boom days of the conventional oil and natural gas business, have a lot of things in common. In hindsight, we ought to be able to apply what we learn in one business to the next. All of these plays have been too big in some ways and too small in others. They are too big in that there has not been enough market for their full technical potential to be realized. There is oil sands, coal and coal bed methane in abundance that may remain dormant, may never reach the confines of steel. That is because there are limitations to growth such as markets, infrastructure to transport resources towards becoming products and the restrictive carrying capacity of the land and water where the resources are extracted. Coal and oil sands development may ultimately be curbed because of the carrying capacity of the atmosphere for the by-products of their use. Coal bed methane projects face intense competition from tight natural gas. In some places, public concern grew about how much surface land was being disturbed, and the industry buckled. These businesses, at one time or another, captured imaginations like the Klondike Gold Rush. Something brought them to a slowdown that left a few enriched and a lot disappointed. What has separated the enduring projects from the ones that only existed on paper and the ones that got a start but never really got built? Here are some observations:
SEVEN GENERATIONS 2016 Annual Report2

Pat Carlson, Chief Executive Officer

Canadian Economic Success Built on Seaways, Roads, Rail and Pipe to Create Markets for Abundant Resources, and the Fortune of Our Wealth Generation
Historically, successful Canadian developers often had to invest in market access infrastructure – the seaways, roads, rail and pipe. About 20 years ago, about 20 exploration and production companies built the Alliance Pipeline, from northeast British Columbia to the US Midwest and the Aux Sable extraction and fractionation plant in Illinois, to construct their own liquids-rich natural gas market. In the middle of the past century, Husky built a refinery at Lloydminster to convert heavy oil from its vast land holdings to marketable products. Syncrude was launched offering contracts for the construction of a pipeline for its product and a power plant. Going back to the Canadian Pacific Railway in the 1880s, these big projects forged our nation from Atlantic to Pacific. They are as old as European settlement of Western Canada and the enduring ones often have required a major concomitant market access project. Western Canada’s history is founded in big resource plays and putting together the pieces to get our products to the world. Nothing has really changed. Vast Canadian tight gas resources face dwindling incremental North American market potential as burgeoning supplies compete for the limited domestic market. North America’s natural gas demand typically grows at 1-2 percent a year, modest at best. Whereas, over the next 20 years, industry experts predict that Asia’s natural gas market will require additional volumes similar to that now consumed in the United States. Others estimate global natural gas demand will grow 45 percent by 2020. Here in Alberta, we can and should develop our own petrochemical markets and convert coal-fired power generation to natural gas – market developments that can certainly help grow Canadian demand. But to tap anything close to our full potential, we need to access Asian markets, where we can deliver our abundant natural gas in the form of liquefied natural gas (LNG). Alberta and Canada have the people, expertise, technology, sound regulations, world-class engineering and competitive resources to take a meaningful and leading place in the global energy market, and 7G has an expert team actively pursuing these vertical market expansions.
Resource Size Matters, A Lot
Canadian economic history has also taught us that large amounts of resource need to be dedicated up front in order to finance large, remote resource developments. Domestic markets are rarely sufficient for the kind of large-scale projects that Canada’s immense and sparsely populated geography supports and demands. Pipelines, railways, roads and seaways are often part of resource extraction projects, and those projects need to be big enough to pay, either directly or through tariffs, for the construction of this infrastructure. To encourage the development of the forestry industry in northern Alberta, the provincial government granted harvesting rights over huge areas to companies that were willing to build pulp, paper and forestry plants. Oil sands projects require similar scale to make their developments economic and attractive to financiers. Nothing has really changed. In the tight gas plays of northwest Alberta, large tracts of land containing high-quality resource will have to be committed for long periods to finance the pipelines to the Pacific and the LNG plants to serve Asian consumers. At 7G, we can drill wells at the extended reaches of our large land base to preserve our lease entitlements. But the few land-retention wells we are forced to drill, an obligation under regulation designed to serve previous resource characteristics, do not really serve the public interest over the long term, the environment or the owners of the resource – Albertans. The more environmentally responsible practice is to focus development in a small area with minimal disturbance of regions that will be required in the more distant, but foreseeable future. We, along with concerned stakeholders, are advocating for the modernization of land tenure regulations to enable lease retention on the basis of capital deployed, without the requirement to drill land-retention wells and disturb lands that need not be developed until they are required later in the rational economic life of a project.
SEVEN GENERATIONS 2016 Annual Report4
Preserving Canadian Land Values
The most successful project proponents have taken it upon themselves to secure social license. Right or wrong, many Canadians see themselves among the most loved children of Mother Nature. Perhaps citizens of all nations feel that way, but Canadians love their land. Television commercial writers have figured out that if you show Canadians stunning photos of their land, lakes and coastal waters, glaciers, waves crashing on a rocky coast, huge trees poking holes in the sky, snow-capped mountains, or a stampeding herd of caribou they will buy the next thing they see. We are endowed with the second most expansive land mass on Earth, the most fresh water, the longest coastline, a diversity of mountains and plains, forests, grasslands and tundra all shared with an abundance of wildlife. Love of our natural land’s beauty is a universal Canadian value. We pretty much all feel a sense of custodial protection toward our vast and stunning landscape. But in the world of advanced industrial democracies, we are the resource provider – the grown up, stable nation that can be relied upon to supply, the jurisdiction where courts have settled disputes with a century-and-a-half tradition of fairness. Our history as a modern nation grew out of being a station for the European fur, lumber and fish trade. Many of the descendants of the first European settlers ventured deep into the forests to trade with and engage the First Nations in the fur trade – possibly the first, big Canadian industrial project, a community project in the broadest sense, engaging everyone. Nothing has really changed. We will build our projects in the Canadian way, like the transcontinental railways and pipelines, by consensus from consultation, respecting each other and our natural endowment, with pride as a nation, together, unbeatable. This is what we do. We will do it again as we have done it before, reaching a shared vision and working together. Seven Generations is actively engaging stakeholders, looking to build consensus for its vision to be a leading global tight gas developer and LNG exporter.
National Leadership Enables Vision
Governments will play a very important role, but historically they have been led. They did not lead project development. Canadian governments at all levels differentiate their leadership by providing a sense of durable justice and a secure economic climate. We are Canada, still a land of big ideas, still a land of opportunity, still a land to build a vision. We look to our governments to maintain peace, order and good government. Legislation has tended to enable visions, not to inspire them. There is often a forward-looking politician
associated with some of our great projects. Premier W.A.C. Bennett is associated with British Columbia’s hydro business. Alberta’s Premier Peter Lougheed enabled Syncrude and Premier Ralph Klein put in place the oil sands lease tenure and royalty systems that led to the oil sands boom. Our first Prime Minister, Sir John A. Macdonald, pushed through the legislation that made the transcontinental railway happen. These leaders bought into an industrial vision and picked up their load – the burden of aligning the law and the regulators. Theirs was a pivotal role but, like other modern industrial democracies, for the most part, our entrepreneurs build and our governments clear obstacles and inspire confidence in fairness for the future. Nothing has really changed. As is demanded by our Code of Conduct, Seven Generations is working with governments to improve the regulatory environment so that our industry can better serve society.
Applying Experimentation to Remain Competitive
Along with the scale and quality of resource, technology plays a crucial role in resource development. The cold production and horizontal well booms of the 1990s brought huge amounts of oil, particularly heavy oil, to the market. Mining innovations and Steam Assisted Gravity Drainage opened up the oil sands. With these technologies, the pioneering projects started with small initiatives and commercial intent applied alongside a large component of experimentation. The developers tried a concept, figured out how to improve it, and looked for resource that could be developed with the evolving understanding of the resource and recovery process. Eventually new projects were packaged, combining technological successes with waiting resources, and large scale projects moved ahead. Nothing has really changed. Tight gas in Canada has been travelling down this path for the past decade. We have reduced extraction costs by experimenting to find the right techniques to apply to various resources. Some combinations of resource and technology, such as the Nest area of the Kakwa River Project, are commercially attractive and can profitably capture the existing markets and underpin the infrastructure investment needed for market expansion. Others need higher prices or the development of new technology.
SEVEN GENERATIONS 2016 Annual Report 5

Striking an Incremental Balance to Reach Commerciality
This is how plays develop. It starts with a test to determine the resource is there and the rock has potential. A demonstration well is drilled to see what the best guess at the right technology will do. A few wells, each with refinements to the technology, reveal how extensive the resource of a certain nature is and what technical adjustments can make the development commercial. Then the resource, like 7G’s Nests 1 and 2, is ready for commercial development. There is a right balance to achieve, between commercializing and delineating new resources, and profitably developing the core resource while continuing to optimize. Striking this balance depends on the size and quality of the resource and the financial capacity and characteristics of the company. 7G seeks a balance between the pursuit of cash flow self-sufficiency and the commercialization of its vast land holdings outside of the Nest. The point is innovation and an entrepreneurial spirit are required to commercialize the resource and keep it economic when the market is flooded with competing supply. We sell resources. We use technology. We balance economics against innovation, directing our focus to reach and maintain financial sustainability.
Successful Journeys Enhanced by Arriving at a Vision
Normally I am a little resentful and embarrassed that the first European settlers felt empowered to change the names the inhabitants used for their land and its features. That is why we selected Kakwa as the name for our project. It is the Cree word meaning porcupine and the name of the only one of three rivers that transect our project that survived renaming. Perhaps, though, some unknown force was at hand when the Karr region was named. Jean-Baptiste Alphonse Karr was right. The more things change the more they stay the same. What can look at first glance as bold and risky can be, on deeper investigation, just very good risk management at work. Taking on a big project or a small project involves just that – thorough study of what needs to be done to manage risk. In the end, big projects – vertically integrated by ownership or by contracted infrastructure, the highest quality resource projects and publicly supported projects – have proven to be some of Canada’s greatest achievements. We can pursue that vision, do really well during the journey, and excel when we arrive, because nothing has really changed.
Sincerely,
Pat Carlson, P.Eng. Chief Executive Officer
March 2017
SEVEN GENERATIONS 2016 Annual Report6

Level 1 Corporate Policy, our Code of Conduct
We believe that companies have only the rights given to them by society. While people have a natural entitlement to basic rights, corporations are an instrument created by society to provide its needs and ought to have no expectation of basic entitlements other than equitable rights with other corporations, including those wholly owned by a person. We recognize that rights, sufficient to build and operate an energy project, can be granted and taken away by society. Over the longer term, companies can only expect to thrive if they serve the legitimate needs of society in which they exist. To thrive, companies must differentiate, rise above the pack, stand out as being among the best with all of their stakeholders. At Seven Generations Energy Ltd., we acknowledge this granted entitlement and accept from our stakeholders a duty to thrive and an understanding of the need to differentiate. Specifically, in acceptance of this challenge to differentiate with all stakeholders, we acknowledge:
The need of society for us to conduct our business in a way that protects the natural beauty of the environment and preserves the capacity of the earth to meet the needs of present and future generations;
The need of Canada and Alberta for us to obey all regulations and to proactively assist with the formulation of new policy that enables our company and our industry to better serve society;
The need of the communities where we operate to be engaged in the planning of our projects and to participate in the benefits arising from them as they are built and operated;
The need of our business partners and infrastructure customers to be treated fairly and attentively;
The need of our suppliers and service providers to be treated fairly and paid promptly for equipment and services provided to us and to receive feedback from us that can help them to be competitive and thrive in their businesses;
The need of our employees to be compensated fairly and provided a safe, healthy and happy work environment including a healthy work life – outside life balance; and
The need of our shareholders and capital providers to have their investment managed responsibly and ethically and to earn strong returns.
We see ourselves as being in the service business, serving the needs of our stakeholders. We seek satisfaction for all stakeholders. Differentiation is imperative. We support an open and competitive business environment, recognizing in the competitive world that we envision, only those who best serve their stakeholders can expect the support required to survive for the longer term.
Aseniwuche Winewak dancers perform at a Cultural Awareness Camp in Susa Creek, Alberta.
SEVEN GENERATIONS 2016 Annual Report 7

President’s Message
Seven Generations achieved a number of important milestones in 2016 and set the stage for continued growth for years ahead. We executed a $1 billion capital investment program, brought 60 new wells online, and nearly doubled our production while maintaining our high liquids production ratio. We kept our balance sheet strong and maintained the financial strength to fund our growth plans. We grew our funds from operations to $733 million, and for every barrel of oil we produced in 2016, we added an estimated 10.3 barrels of proved reserves.
As I emphasized in my letter last year, Seven Generations is and always will be in a race against our competitors to maintain the lowest supply costs in North America. Most of the tools and technologies of our industry are not proprietary and therefore we must continually innovate and optimize the way we work through extensive innovation and experimentation in the field. In 2016, we continued to make steady improvements in drilling and completing our Montney wells by drilling faster and applying larger fractures spaced closer together.
In 2016, we enhanced well productivity by increasing the average number of fracture stages we employed to 32, up from 29 stages in 2015. We also increased the amount of proppant we used to fracture the rock by 23 percent.
Our drilling efficiencies improved too. We drilled wells 9 days faster, on average, than we did in 2015 and we reduced our average drilling cost per lateral metre by 13 percent. Taken as a whole, our march to improve capital efficiencies saw Seven Generations’ average drilling and completion cost decline by 19 percent in 2016 compared to 2015, to $9.6 million per well.
We conducted our operations while following a Code of Conduct that is grounded in keeping our neighbours, employees, contractors and business partners safe. Quite simply, safety is the most important aspect of our business. We have a robust safety program that focuses on cultural alignment, proactive hazard identification, training, analysis, measurement and accountability. Our senior leaders regularly visit the field, where they stress the importance of safety and the responsibility we all share in developing a gold star safety culture. We train and expect our employees to look out for and protect one another and their work environment. We carefully analyze near-misses and we learn from them.
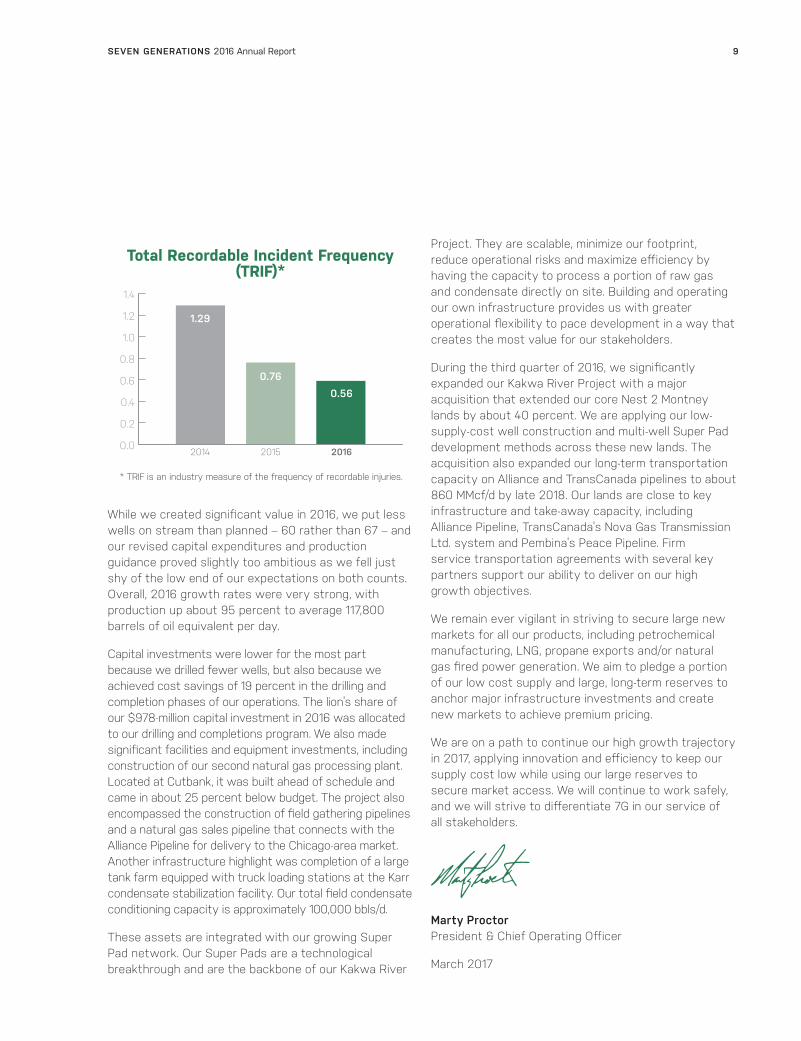
Our Total Recordable Incident Frequency (TRIF) was 1.29 in 2014, 0.76 in 2015 and 0.56 in 2016. So far, the trend looks good, but we will not be satisfied until everyone gets home safely every day.
Marty Proctor
SEVEN GENERATIONS 2016 Annual Report8
While we created significant value in 2016, we put less wells on stream than planned – 60 rather than 67 – and our revised capital expenditures and production guidance proved slightly too ambitious as we fell just shy of the low end of our expectations on both counts. Overall, 2016 growth rates were very strong, with production up about 95 percent to average 117,800 barrels of oil equivalent per day.
Capital investments were lower for the most part because we drilled fewer wells, but also because we achieved cost savings of 19 percent in the drilling and completion phases of our operations. The lion’s share of our $978-million capital investment in 2016 was allocated to our drilling and completions program. We also made significant facilities and equipment investments, including construction of our second natural gas processing plant. Located at Cutbank, it was built ahead of schedule and came in about 25 percent below budget. The project also encompassed the construction of field gathering pipelines and a natural gas sales pipeline that connects with the Alliance Pipeline for delivery to the Chicago-area market. Another infrastructure highlight was completion of a large tank farm equipped with truck loading stations at the Karr condensate stabilization facility. Our total field condensate conditioning capacity is approximately 100,000 bbls/d.
These assets are integrated with our growing Super Pad network. Our Super Pads are a technological breakthrough and are the backbone of our Kakwa River
Project. They are scalable, minimize our footprint, reduce operational risks and maximize efficiency by having the capacity to process a portion of raw gas and condensate directly on site. Building and operating our own infrastructure provides us with greater operational flexibility to pace development in a way that creates the most value for our stakeholders.
During the third quarter of 2016, we significantly expanded our Kakwa River Project with a major acquisition that extended our core Nest 2 Montney lands by about 40 percent. We are applying our low-supply-cost well construction and multi-well Super Pad development methods across these new lands. The acquisition also expanded our long-term transportation capacity on Alliance and TransCanada pipelines to about 860 MMcf/d by late 2018. Our lands are close to key infrastructure and take-away capacity, including Alliance Pipeline, TransCanada’s Nova Gas Transmission Ltd. system and Pembina’s Peace Pipeline. Firm service transportation agreements with several key partners support our ability to deliver on our high growth objectives.
We remain ever vigilant in striving to secure large new markets for all our products, including petrochemical manufacturing, LNG, propane exports and/or natural gas fired power generation. We aim to pledge a portion of our low cost supply and large, long-term reserves to anchor major infrastructure investments and create new markets to achieve premium pricing.
We are on a path to continue our high growth trajectory in 2017, applying innovation and efficiency to keep our supply cost low while using our large reserves to secure market access. We will continue to work safely, and we will strive to differentiate 7G in our service of all stakeholders.
Marty Proctor President & Chief Operating Officer
March 2017
Total Recordable Incident Frequency(TRIF)*
0.0
0.2
0.4
0.6
0.8
1.0
1.2
1.4
2014 2015 2016
1.29
0.760.56
* TRIF is an industry measure of the frequency of recordable injuries.
SEVEN GENERATIONS 2016 Annual Report 9
Financial Strength
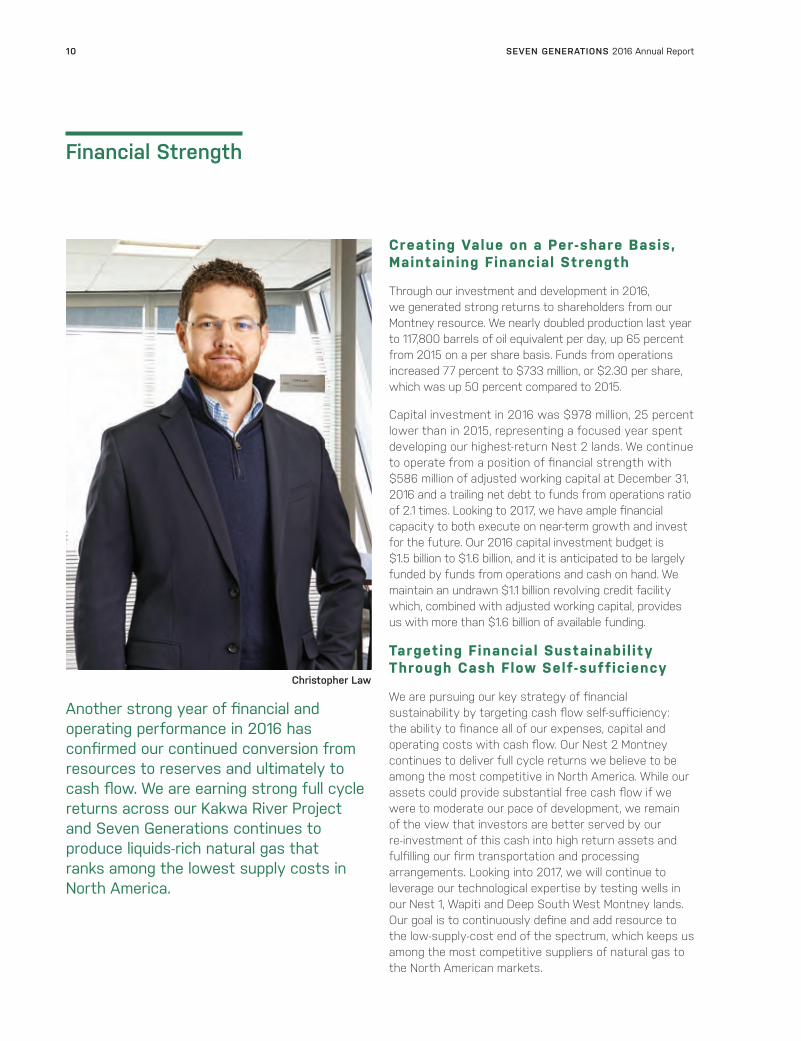
Another strong year of financial and operating performance in 2016 has confirmed our continued conversion from resources to reserves and ultimately to cash flow. We are earning strong full cycle returns across our Kakwa River Project and Seven Generations continues to produce liquids-rich natural gas that ranks among the lowest supply costs in North America.
Creating Value on a Per-share Basis, Maintaining Financial Strength
Through our investment and development in 2016, we generated strong returns to shareholders from our Montney resource. We nearly doubled production last year to 117,800 barrels of oil equivalent per day, up 65 percent from 2015 on a per share basis. Funds from operations increased 77 percent to $733 million, or $2.30 per share, which was up 50 percent compared to 2015.
Capital investment in 2016 was $978 million, 25 percent lower than in 2015, representing a focused year spent developing our highest-return Nest 2 lands. We continue to operate from a position of financial strength with $586 million of adjusted working capital at December 31, 2016 and a trailing net debt to funds from operations ratio of 2.1 times. Looking to 2017, we have ample financial capacity to both execute on near-term growth and invest for the future. Our 2016 capital investment budget is $1.5 billion to $1.6 billion, and it is anticipated to be largely funded by funds from operations and cash on hand. We maintain an undrawn $1.1 billion revolving credit facility which, combined with adjusted working capital, provides us with more than $1.6 billion of available funding.
Targeting Financial Sustainability Through Cash Flow Self-sufficiency
We are pursuing our key strategy of financial sustainability by targeting cash flow self-sufficiency: the ability to finance all of our expenses, capital and operating costs with cash flow. Our Nest 2 Montney continues to deliver full cycle returns we believe to be among the most competitive in North America. While our assets could provide substantial free cash flow if we were to moderate our pace of development, we remain of the view that investors are better served by our re-investment of this cash into high return assets and fulfilling our firm transportation and processing arrangements. Looking into 2017, we will continue to leverage our technological expertise by testing wells in our Nest 1, Wapiti and Deep South West Montney lands. Our goal is to continuously define and add resource to the low-supply-cost end of the spectrum, which keeps us among the most competitive suppliers of natural gas to the North American markets.
Christopher Law
SEVEN GENERATIONS 2016 Annual Report10

While we are forecasting a modest outspend of capital versus funds flow in the near-term, we continue to reduce leverage because our cash flow growth is outpacing anticipated increases in debt given prevailing commodity prices. We believe this puts us on enviable financial footing versus many of our peers.
Our strategic priorities are driven by our prevailing belief that the North American natural gas market is grossly oversupplied, and in order to maximize the net present value of the resources, we need to accelerate and significantly expand both our market share and our markets. Keep in mind that we must have markets for all products in order to be able to produce any of them. While liquids can be transported by both truck and pipeline, natural gas is restricted to pipeline only, so the challenge to grow is dominated by the need to find expanded pipeline capacity to new natural gas markets and those where our low-cost natural gas will supersede competitors and attract additional buyers.
Searching for New Markets
The value of market access is growing due to the oversupply of natural gas in North America. We have sufficient pipeline capacity to accommodate our growing production levels and we are looking for more for future growth. We are ready to contribute our large reserves as an anchor supply for investment in additional market development, such as natural gas to replace coal-fired electricity in Alberta, petrochemical plants and LNG exports to Asia off Canada’s West Coast. To improve our competitive edge, we are working to increase our financial strength by lowering our debt ratios to achieve investment grade credit ratings, which will help us access a lower cost of capital. For Seven Generations, we believe that partial vertical integration in the future may be required to realize long-term strategic benefits, as dedicated transportation and processing access have become key assets in a producer’s portfolio.
Strategic Alignment by Owning Processing Infrastructure
We have always been and remain of the view that constructing our own field-processing infrastructure provides us the ability to deliver superior growth rather
than having to rely on third party midstream companies. This strategy puts us firmly in the driver’s seat to control the pace of our development. We keep control over our operational reliability and the ability to expand and debottleneck whenever it is required or opportune. This also substantially reduces interruption risk. There is ample evidence in recent years of companies not being able to achieve targeted production levels due to restrictions by third party midstream operators. By owning and operating our processing infrastructure, we believe we are in a better position to deliver on our long-term development plan.
We are a company focused on innovation and the application of new technology. For instance, we strive to determine the optimal well design for a specific area because the faster we arrive at the optimal design, the greater the project’s net present value. In a resource play that will extend well into future generations, the remaining inventory of wells can be multiplied by the demonstrated well economics at a given time to determine a simplistic value baseline. The faster we arrive at the optimal design, the higher the remaining well count that this design applies against, resulting in a lift to the value of all future wells and a significant rise above baseline value. Therefore, we embody a spirit of innovation within the company because, quite simply, it makes good economic sense to do so.
Christopher Law Chief Financial Officer
March 2017
SEVEN GENERATIONS 2016 Annual Report 11
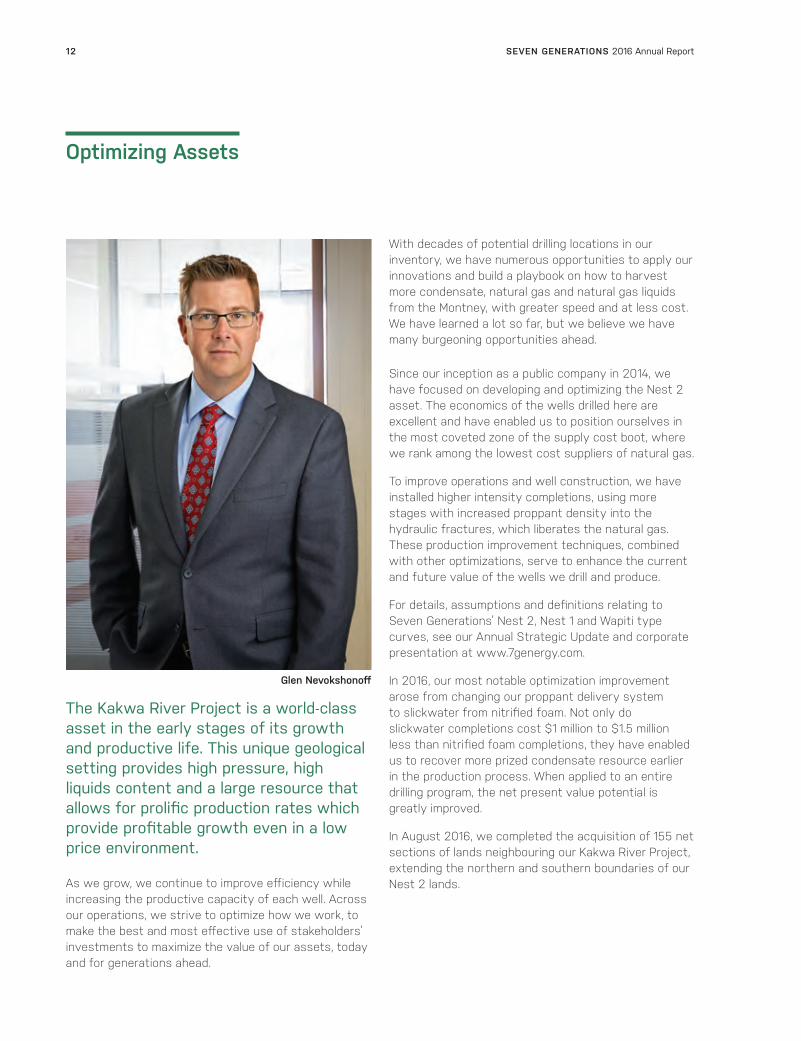
The Kakwa River Project is a world-class asset in the early stages of its growth and productive life. This unique geological setting provides high pressure, high liquids content and a large resource that allows for prolific production rates which provide profitable growth even in a low price environment.
As we grow, we continue to improve efficiency while increasing the productive capacity of each well. Across our operations, we strive to optimize how we work, to make the best and most effective use of stakeholders’ investments to maximize the value of our assets, today and for generations ahead.
With decades of potential drilling locations in our inventory, we have numerous opportunities to apply our innovations and build a playbook on how to harvest more condensate, natural gas and natural gas liquids from the Montney, with greater speed and at less cost. We have learned a lot so far, but we believe we have many burgeoning opportunities ahead.
Since our inception as a public company in 2014, we have focused on developing and optimizing the Nest 2 asset. The economics of the wells drilled here are excellent and have enabled us to position ourselves in the most coveted zone of the supply cost boot, where we rank among the lowest cost suppliers of natural gas.
To improve operations and well construction, we have installed higher intensity completions, using more stages with increased proppant density into the hydraulic fractures, which liberates the natural gas. These production improvement techniques, combined with other optimizations, serve to enhance the current and future value of the wells we drill and produce.
For details, assumptions and definitions relating to Seven Generations’ Nest 2, Nest 1 and Wapiti type curves, see our Annual Strategic Update and corporate presentation at www.7genergy.com.
In 2016, our most notable optimization improvement arose from changing our proppant delivery system to slickwater from nitrified foam. Not only do slickwater completions cost $1 million to $1.5 million less than nitrified foam completions, they have enabled us to recover more prized condensate resource earlier in the production process. When applied to an entire drilling program, the net present value potential is greatly improved.
In August 2016, we completed the acquisition of 155 net sections of lands neighbouring our Kakwa River Project, extending the northern and southern boundaries of our Nest 2 lands.
Optimizing Assets
Glen Nevokshonoff
SEVEN GENERATIONS 2016 Annual Report12

Strong Initial Production from Wells on Major Acquisition Lands
7G intends to allocate about 40 percent of its 2017 drilling and capital investment to the neighbouring lands it acquired in the summer of 2016, where initial well results are exceeding expectations. 7G recently tied in a six-well pad where wells had an average 30-day, initial production rate of 2,000 boe/d, with condensate yields of about 170 barrels per MMcf. 7G is installing its Super Pad and gas lift infrastructure selectively onto the acquired lands to enable wide scale development.
As we look to 2017, our growth is poised to continue. We plan to drill 100 to 110 wells and invest $1.5 billion to $1.6 billion to grow production to between 180,000 and 190,000 boe/d, representing an approximate 57 percent increase over our 2016 average production of 117,800 boe/d.
These very strong growth rates, and the large inventory of resources we have yet to drill illustrates that we are still in the early days of developing the long-term potential of our Kakwa River Project.
Proved Plus Probable Reserves and Best Estimate Contingent Resources each up about 80 Percent
During 2016, we tied in 60 new producing wells, adding to the conversion of contingent resources into reserves and production. Despite annual production of 43 million barrels of oil equivalent (MMboe), we increased proved reserves 95 percent to 825 MMboe, as estimated by McDaniel & Associates Consultants Ltd. (McDaniel) at December 31, 2016. Proved plus probable reserves increased 79 percent to 1.53 billion boe, with liquids making up 53 percent of the total recoverable reserves. Risked best estimate contingent resources were 1.39 billion boe at December 31, 2016, up 80 percent compared to 771 million boe at December 31, 2015.
These are very strong reserve additions in one of the lowest supply-cost natural gas and liquids projects in North America. We are drilling long wells with larger and more intense hydraulic fractures – innovations that have shown a one-third increase in condensate
production per well compared to two years ago. By boosting production of our most valuable product – condensate – during the early life of our wells, we pay for our wells faster, accelerate the time it takes to earn full-cycle returns and increase the value of our project.
Glen Nevokshonoff Senior Vice President, Operations
March 2017
SEVEN GENERATIONS 2016 Annual Report 13
Canadian business continues to evolve as it has through past decades with new and higher standards required by our stakeholders to gain support for project development. It takes more than financial commitment and execution. It takes a community to build a project. When we started 7G, we were a small business, serving a relatively small community. As we grow and evolve into a leading Canadian energy producer, our communities grow, our stakeholders increase in number and our impact expands. As our employee and contractor count rises, more families and individuals rely on Seven Generations’ success.
We have a very large resource base and we need to expand our markets in order to realize full value from those resources, which belong to the people of Alberta – an obvious and key stakeholder. As we vertically integrate, as we sponsor or pledge a sizeable portion of our liquid-rich natural gas resources to underpin large midstream and downstream projects, our community grows.
This growth is vital, and we will, by necessity form new business relationships along the value chain. Just as we only expect to survive when we serve the legitimate needs of society, the same applies to our business partners. As we say in our Level 1, “we acknowledge this granted entitlement and accept from our stakeholders a duty to thrive and an understanding of the need to differentiate.”
We also have a duty to ensure that our new business partners along the value chain accept, practice and honor this stakeholder philosophy, this duty to serve.
Author and marketing consultant Simon Sinek routinely offers wise insight on how to build and sustain trust in and outside an organization. You may have seen him delivering one of his compelling talks on YouTube or in a TED video. All of our stakeholders are part of our Simon Sinek circle of safety. All are owners of the project in at least one sense of the term “owner.”
Our circle of stakeholder service starts at the top, with our most senior executives, who invest a considerable portion of their time to meet our stakeholders face to face and develop relationships in the community. And
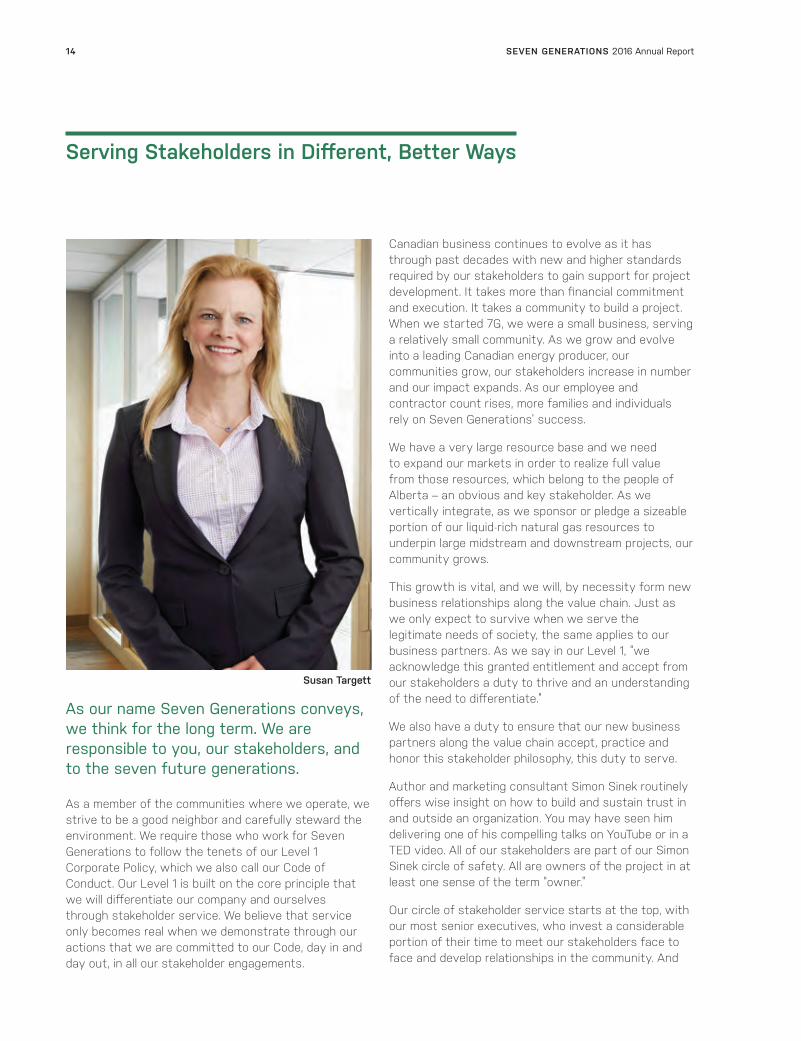
Serving Stakeholders in Different, Better Ways
As our name Seven Generations conveys, we think for the long term. We are responsible to you, our stakeholders, and to the seven future generations.
As a member of the communities where we operate, we strive to be a good neighbor and carefully steward the environment. We require those who work for Seven Generations to follow the tenets of our Level 1 Corporate Policy, which we also call our Code of Conduct. Our Level 1 is built on the core principle that we will differentiate our company and ourselves through stakeholder service. We believe that service only becomes real when we demonstrate through our actions that we are committed to our Code, day in and day out, in all our stakeholder engagements.
Susan Targett
SEVEN GENERATIONS 2016 Annual Report14

our stakeholder service permeates through all our staff, who tell our story on a day-to-day basis. To give a real-time and vivid look at our operations, we conduct numerous field tours of our Kakwa River Project – hosting regulators, government leaders, investors and analysts, community leaders and First Nation councils and elders, and business partners.
We solicit their feedback. We listen. We exchange ideas. And we learn. That’s how we get better. Through conversations and feedback from the people who may be impacted by our development, we gain a better understanding of how we can continuously improve.
In our community, we encourage our employees to roll up their sleeves and volunteer. Whether it’s serving clients breakfast at the Calgary Drop-In & Rehab Centre, ushering music fans at the Bear Creek Folk Festival in Grande Prairie, or serving steaks at the Sturgeon Lake Cree Nation PowWow, we are honored to contribute to those communities as they are all part of our community. It’s by building long-term relationships based on trust and honesty that we expand our circle of safety which protects us all from the times when we need to work through a problem, a challenge or a disagreement, because those are inevitable. Our relationships will sustain our company because they sustain our stakeholders.
Environment
We aim to be among the best environmental performers in our industry. This requires having a mindset of continuous improvement and going above and beyond whenever possible. As one example of putting our beliefs into action, stakeholders say they are concerned about the potential effects of seismic activity in our Kakwa River project. Does hydraulic fracturing cause earthquakes? We also wanted to know, so in advance of any regulation, we launched our own research. The only way to know if we may cause seismic-related damage was to directly test. After installing five seismometers spanning our field to monitor for the past year, the data told us there has been no single seismic event that could be felt on surface, no Richter scale event that even comes close to Alberta Energy Regulator (AER) magnitude limits. The AER says it must
be notified if there’s a 2.0 reading, and work must stop at 4.0. Our highest reading to date is 1.4, well below anything that can be sensed by people on the surface.
Water
Water is precious, our lifeblood. That’s why we are continually looking to improve water management practices through new technology and innovative conservation processes. Before beginning a project, we first consider regional water availability and conservation efforts. We then look for ways to meet or exceed regulations.
To better manage our water use, we are investigating alternative hydraulic fracturing methods that could reduce water use, ways to more sustainably withdraw water, as well as alternative water sources.
A Seven Generations’ study concluded that given continued careful stewardship in managing the methods, timing and location of water withdrawal from surface water bodies, the regional watershed system will not be adversely impacted by the amount of water withdrawal we forecast once industry achieves full commercial development of the Montney and Duvernay formations in the Smoky River basin.
We work with other water-conscientious groups, as a member of the Foothills Stream Crossing Partnership, to improve stream crossings and protect fish habitat. We sit on the AER’s stakeholder advisory panel to explore potential cumulative effects of withdrawal from water sources in the M.D. of Greenview No. 1.
Our stakeholders want us to keep looking for ways to protect water bodies and minimize our water use. We agree. We are testing ways to recycle produced water, we are carefully managing our approach to riverbanks and we are using fresh water intake systems that are safe for fish. We build ponds to store water collected during peak river flow periods, which we use during low flow times. With the possibility that climate conditions may evolve to become warmer and dryer, our ponds may serve our purposes and become an important habitat for regional wildlife and an important water supply for forest fighters. In addition, we are
SEVEN GENERATIONS 2016 Annual Report 15

researching how we can use fossil water that is too deep underground to be of domestic or agricultural use, but works for well completions.
Greenhouse Gas Emissions
As a natural gas producer, we supply people with fuel to warm their homes, heat water and the hydrocarbon feedstock to make millions of common consumer products, from toothbrushes to televisions. All these things require the burning or transformation of natural gas, and that generates emissions. That’s why we are looking across our operations, testing and researching
technologies and practices to find ways to optimize and reduce our emissions.
Our industry-leading leak detection and repair program (LDAR) helps detect and remediate methane emissions. To help eliminate fugitive emissions, we converted numerous natural gas driven controls and pumps to compressed air and have improved equipment reliability, which eliminates process and maintenance venting. The controls on our compressor fleet are being upgraded to improve efficiency, reduce fuel consumption and emissions as well as maintenance costs.
Seven Generations staff learn to prepare a moose hide for tanning at an Aseniwuche Winewak Cultural Awareness Camp at Susa Creek, Alberta.
SEVEN GENERATIONS 2016 Annual Report16
Seven Generations will continue to do its part, but we believe that we all have a role to play in reducing emissions. And we believe that getting broad public consensus on how to do so is the best way to start down that path. We have kicked off an educational speaker series to facilitate this goal.
To measure and facilitate continual improvement in our performance, we joined the Carbon Disclosure Project (CDP) in 2016, reporting our 2015 performance. Our entire operation’s GHG footprint was assessed and we received a B grade, among the leading marks for Canadian producers. We reported a carbon intensity – metric tonnes of carbon dioxide per barrel of oil equivalent of production – of 0.0127, which also ranks Seven Generations among the leading Canadian energy companies that reported to CDP. So far, so good, but we remain focused on technological innovation and process improvements to continuously improve our GHG emission intensity.
Preserving Wildlife Habitat
Our operations are located on provincial Crown land in a mixed forest where logging and trappers also make a living from the land. It’s also home to bountiful wildlife – including bears, moose, lynx, coyotes and numerous woodland creatures. That’s why we work to limit our surface disturbance. Where we need to store water, we design animal-friendly fresh water storage ponds that also support moose, deer and wildlife in their natural setting. We are participating in the Foothills Landscape Management Forum where we collaborate with a number of stakeholder groups with a shared goal of protecting Caribou habitat. We also sponsor the Foothills Research Institute’s Grizzly Bear Research Program to gain further understanding and to incorporate learnings in our operational activities.
Learning about animal behaviour and habitat helps us modify our behaviour to minimize contact with wildlife – and we incorporate these learnings into project planning.
Minimizing Our Footprint
Unconventional resource development requires unconventional thinking. Our multi-well Super Pads tap the Montney formation to maximize resource recovery while minimizing our footprint. We target total surface disturbance, excluding major plants, camps and storage yards, to about 5 percent of the land. With technological improvements, our drilling and completions teams hope to drill longer wells from fewer pads to cut our surface disturbance to less than 4 percent.
Since the inception of the company, the Seven Generations team has been fortunate to spend personal time with many of our stakeholders, to share our philosophy with them, to expand and develop our community and to include them in our stakeholder circle. For those who are interested in learning more about our corporate sustainability, including our interactions with government and regulators, suppliers and contractors, infrastructure partners, employees and investors, we encourage you to review our 2016 Strategic Update, as well as our Generations stakeholder report, which are available on our website.
Susan Targett Senior Vice President
March 2017
SEVEN GENERATIONS 2016 Annual Report 17
2016 Highlights Summary
CORPORATE
• On August 18, 2016, Seven Generations completed a major acquisition of additional Montney assets in the Kakwa River area valued at $1.9 billion at the time of announcement on July 6, 2016. Total consideration at closing of the major acquisition included $505.1 million cash, the issuance of 33.5 million common shares, the assumption of US$450 million ($580 million) of acquired notes and the transfer of the right, title and interest of certain oil and natural gas properties valued at $6 million. The major acquisition expands the company’s Nest landholdings by approximately 40 percent and expands Seven Generations’ long-term transportation capacity on Alliance and TransCanada pipelines to approximately 860 MMcf/d in 2018.
FINANCIAL
• Funds from operations increased 77 percent to $733 million, or $2.30 per share – up 50 percent compared to 2015.
• Capital investments were $978 million for the year.
• Maintained balance sheet strength with net debt of approximately $1.5 billion and available funding of $1.6 billion at year-end 2016.
• In February, completed a private placement of 21.4 million common shares at a price of $14 per share for gross proceeds of $300 million and net proceeds of about $287 million.
• In July, closed a bought-deal financing, issuing 30.7 million subscription receipts at $24.35 per subscription receipt for gross proceeds of $747.7 million and net proceeds of $717.7 million.
OPERATIONAL
• Reached an average annual production rate of 117,800 barrels of oil equivalent per day in 2016, up 65 percent on a per share basis from 2015.
• Tied in 60 new producing wells in 2016, taking the number of producing Montney wells to 232, of which about one quarter were acquired.
• Drilling and completion cost per well decreased from $11.8 million to $9.6 million. Even with this 19 percent cost reduction, 7G’s well designs reflected a focus on higher intensity completions. Tonnes of proppant pumped per well increased by 23 percent – averaging 5,403 tonnes in 2016 compared to 4,395 tonnes in 2015, and the stage count per well increased by 10 percent – averaging 32 stages in 2016 compared to 29 stages in 2015.
• Completed the Cutbank processing plant early and about 25 percent under budget, adding 250 MMcf/d of processing capacity.
• 7G started production from its ninth Super Pad. Super Pads are designed to facilitate raw gas dehydration, compression and liquid separation from the liquids-rich natural gas.
RESERVES – EVALUATED BY MCDANIEL AS AT DECEMBER 31, 2016
• Proved developed producing reserves were 166 MMboe, up 127 percent from 73 MMboe at December 31, 2015.
• Total proved reserves were 825 MMboe and proved plus probable reserves were 1.53 billion boe, representing an increase of 95 percent and 79 percent, respectively, when compared to 7G’s total proved and proved plus probable reserves on December 31, 2015.
• Total proved plus probable reserves at year end were estimated to have a before tax net present value of approximately $10 billion as of December 31, 2016 compared to $6.5 billion at the end of 2015, a 54 percent increase from the December 31, 2015 reserve report, using a discount rate of 10 percent.
• Risked best estimate contingent resources increased 80 percent to 1.39 billion boe at December 31, 2016 compared to 771 million boe at December 31, 2015. The before tax net present value increased 10 percent, from $2.79 billion at December 31, 2015 to $3.07 billion at December 31, 2016 using a 10 percent discount rate.
SEVEN GENERATIONS 2016 Annual Report18

2016 FINANCIAL AND OPERATING RESULTS
Years ended December 31
2016 2015 % Change
Operational Highlights
($ millions, except per share and volume data)
Production
Condensate (mbbls/d) 39.3 21.2 85
NGLs (mbbls/d) 30.0 14.3 110
Natural gas (MMcf/d) 291 149 95
Total (mboe/d) 117.8 60.4 95
Liquids % 59% 59% –
Realized prices
Condensate and oil ($/bbl) 50.59 50.84 –
NGLs ($/bbl) 13.08 10.34 26
Natural gas ($/Mcf) 3.53 2.65 33
Total ($/boe) 28.92 26.84 8
OPERATING NETBACK (1) ($/boe)
Liquids and natural gas revenues $ 28.92 $ 26.84 8
Royalties (0.16) (2.63) (94)
Operating expenses (4.22) (4.59) (8)
Transportation and processing (5.53) (2.68) 106
Netback prior to hedging 19.01 16.94 12
Realized hedging gain 2.11 6.83 (69)
Operating netback after hedging $ 21.12 $ 23.77 (11)
General and administrative expenses per boe $ 1.09 $ 1.10 (1)
Selected financial information
Liquids and natural gas revenue 1,246.9 591.9 111
Operating income (1)(3) 160.6 52.1 208
Per share – diluted 0.50 0.19 163
Net income (loss) for the period (3) (26.2) (187.3) (86)
Per share – diluted (0.09) (0.75) (88)
Funds from operations (1)(3) 732.6 414.6 77
Per share – diluted 2.30 1.53 50
Cash provided by operating activities 644.6 380.1 70
Total capital investments (4) 978.0 1,309.0 (25)
Adjusted working capital 585.9 306.0 91
Available funding (1) 1,626.7 1,118.0 46
Net debt (1) 1,528.8 1,250.9 22
Debt outstanding 2,111.9 1,546.8 37
Weighted average shares – basic (2) 299.8 249.6 20
Weighted average shares – diluted (2) 318.8 270.1 18
(1) Operating netback, funds from operations, operating income, available funding and net debt are not defined under IFRS. See “Non-IFRS Financial Measures” in Management’s Discussion and Analysis for the years ended December 31, 2016 and 2015.
(2) Basic weighted average shares are used to calculate diluted per share amounts when the company is in a loss position.(3) Includes $27.4 million ($20.0 million after tax) of prior period royalty recoveries for the year ended December 31, 2016.(4) Excluding acquisitions and investments.
SEVEN GENERATIONS 2016 Annual Report 19

Management’s Discussion and AnalysisThis Management’s Discussion and Analysis (“MD&A”), dated March 7, 2017, is management’s assessment of the historical financial position and results of Seven Generations Energy Ltd. (the “Company” or “Seven Generations”) for the year ended December 31, 2016. This MD&A should be read in conjunction with the audited annual consolidated financial statements and notes thereto for the years ended December 31, 2016 and 2015 (the “consolidated financial statements”). These consolidated financial statements, including the comparative figures, were prepared in accordance with International Financial Reporting Standards (“IFRS”). Unless otherwise noted, all financial measures are expressed in Canadian dollars and tabular dollar amounts are in millions. See “Non-IFRS Financial Measures” for reconciliations and information regarding the following non-IFRS financial measures used in this MD&A: “funds from operations”, “operating income”, “operating netback”, “adjusted working capital”, “available funding” and “net debt”. This MD&A contains forward-looking information based on the Company’s current expectations and projections. For information on the material factors and assumptions underlying such forward looking information, refer to the “Forward-Looking Information Advisory” included at the end of this MD&A. A number of abbreviated terms used throughout this MD&A are explained on the last pages of this MD&A. Additional information about Seven Generations is available on the SEDAR website at www.sedar.com, including the Company’s Annual Information Form for the year ended December 31, 2016, dated March 7, 2017 (the “AIF”).
ABOUT SEVEN GENERATIONS
Seven Generations is a low supply cost, high-growth Canadian natural gas developer generating long-life value from its liquids-rich Montney Kakwa River Project, located about 100 kilometres south of its operations headquarters in Grande Prairie, Alberta. Seven Generations’ corporate headquarters are in Calgary and its Class A Common Shares (“Common Shares”) trade on the TSX under the symbol VII.
Seven Generations differentiates itself based on four key strategies:
• stakeholder service: recognizing that in a competitive world, only those who best serve their stakeholders can expect to survive in the long term;
• supply cost: combining resource selection with innovation, technology and efficiency to remain among North America’s lowest supply cost unconventional gas developers;
• financial sustainability: profitable growth to achieve positive free cash flow, earn full-cycle returns on capital employed across the entire commodity price cycle and focused capital deployment on high return opportunities with hedged economics; and
• market access: seek out a position in gathering, processing, transportation and marketing opportunities to expand market access, and leverage market access to capture premium markets for the Company’s production.
Highlights for the Fourth Quarter and Year Ended December 31, 2016
Financial Performance
Seven Generations achieved record production levels in 2016, reaching an average annual production rate of 117.8 mboe/d. For the fourth quarter of 2016, average production of 132.3 mboe/d was 70% higher than the same period in 2015, primarily due to new production from the Kakwa River Project including approximately 21.1 mboe/d of acquired production. Significant production growth contributed to funds from operations of $219.7 million for the 2016 fourth quarter, an increase of 107% from the same period in 2015. Cash from operating activities increased 231% to $178.6 million in the fourth quarter.
SEVEN GENERATIONS 2016 Annual Report20
On July 6, 2016, the Company announced an agreement to acquire additional Montney assets in the Kakwa River area valued at $1.9 billion, at the time of announcement (the “Acquisition”). Upon closing on August 18, 2016, total consideration for the Acquisition included of $505.1 million cash, $965.1 million issued in Common Shares (based on the share price at closing), the assumption of US$450 million ($580 million) of acquired notes (the “Acquired Notes”) and the transfer of the right, title and interest of certain oil and natural gas properties valued at $6.0 million. Costs associated with the transaction were $7.4 million. The Acquisition expands the Company’s Nest landholdings by approximately 40% and expands Seven Generations’ long term transportation capacity on Alliance and TransCanada pipelines to 870 MMcf/d in 2018.
The Company maintained balance sheet strength by closing the fourth quarter of 2016 with net debt of approximately $1.5 billion and available funding of $1.6 billion. In the third quarter, the Company’s lenders increased the available maximum under the credit facility from $850 million to $1.1 billion. At December 31, 2016, the Company had adjusted working capital of $585.9 million including cash and cash equivalents of $630.8 million.
Capital Investments
Seven Generations invested $283.6 million for the fourth quarter of 2016, drilling 12.0 wells and completing 21.0 wells while bringing 10.0 wells on production and continuing to advance infrastructure development in the Kakwa River Project.
Transportation and Marketing
Through the year ended December 31, 2016, the Company continued shipments of rich gas against the firm Alliance commitment. The firm commitment averaged 350 MMcf/d for 2016 exiting at 430 MMcf/d. In the fourth quarter of 2016, the Company contracted 100,000 dth/d of firm service on the Natural Gas Pipeline of America Pipeline System (“NGPL”) to transport natural gas from Chicago down to the US Gulf Coast. Seven Generations holds total natural gas transportation capacity that grows incrementally over the next two years, reaching approximately 870 MMcf/d in the third quarter of 2018.
The Company’s lands are close to key infrastructure and take-away capacity, including the Alliance Pipeline, TransCanada’s Nova Gas Transmission Ltd. (“NGTL”) system and the Peace Pipeline System that is owned by Pembina Pipeline Corporation (“Pembina”). The Company believes the firm service transportation agreements in place with several key partners support the Company’s ability to deliver on its high growth objectives.
Reserves Update
The Company’s independent qualified reserve evaluators, McDaniel & Associates Consultants Ltd. (“McDaniel”), have completed independent reserve evaluations. Effective December 31, 2016, the Company’s total gross proved reserves (“1P”) were 825 MMboe, an increase of 95% compared to the Company’s December 31, 2015 reserve evaluations. Total gross proved plus probable reserves (“2P”) increased 79% to 1,535 MMboe relative to the December 31, 2015 estimates. Using a discount rate of 10%, the Company’s total gross 2P reserves as at December 31, 2016 were estimated to have a before tax net present value of approximately $10.0 billion compared to $6.5 billion, a 54% increase from the December 31, 2015 reserve report.
For important additional information pertaining to the Company’s estimated reserves and the estimated net present value of future net revenue that is attributed to the reserves, as evaluated by McDaniel as at December 31, 2016, please refer to the AIF on the SEDAR website at www.sedar.com.
2016 2015
As at December 31, MMboe $MM (3) MMboe $MM (3)
PDP + PDNP (1) 176 2,120 79 951
Proved Reserves (1P) (2) 825 5,146 424 2,937
Proved Plus Probable Reserves (2P) (2) 1,535 9,996 859 6,507
(1) Gross proved developed producing plus gross proved developed non-producing reserves as determined by McDaniel.(2) Company gross reserves as determined by McDaniel.(3) Estimated before tax net present value using a 10% discount rate as determined by McDaniel.
SEVEN GENERATIONS 2016 Annual Report 21

Outlook and 2017 Guidance
Although uncertainty with commodity prices and the oversupply of natural gas markets persisted throughout 2016, Seven Generations remained focused on innovation, efficiency and value optimization to be among the lowest supply cost gas suppliers in North America. 2016 guidance was originally provided in November 2015 and then revised in January 2016 due to lower commodity prices. With the announcement of the Acquisition in July 2016, guidance was updated. A summary of the guidance that was provided by the Company in January 2016 as well as the updated guidance that was provided in July 2016, compared to the actual results from 2016, are as follows:
January Revised 2016 Guidance
July Updated 2016 Guidance 2016 Results
Capital investments ($ millions) 900 – 950 1,050 – 1,100 978.0
Production (mboe/d) 100 – 110 120 – 125 117.8
Wells brought on production 67.0 67.0 60.0
Actual results for 2016 were lower than the guidance as provided for the following reasons:
• extra time was required to fine tune artificial lift systems on offset wells that experienced a surge of emulsion production as the Company changed its standard well completion design to use slickwater in the fracturing process instead of nitrified foam;
• weather delays impacted construction schedules, ultimately impacting the number of wells brought on production as well as total production for the year;
• the Alliance Pipeline shutdown in October was longer than anticipated and the Company’s ramp up to bring production back on-stream took longer than expected; and
• the Alliance outage coincided with turnaround work at the Pembina Cutbank Complex and as a result, October production was reduced by approximately 50 mboe/d, impacting fourth quarter production by approximately 12.5 mboe/d and 2016 annual production by approximately 4.2 mboe/d.
This is described in greater detail in the news release that was issued by the Company on January 23, 2017, which is available on SEDAR at www.sedar.com.
On January 6, 2017, the Company announced its guidance for 2017 with the following highlights:
2017 Guidance
Capital investments ($ millions) 1,500 – 1,600
Production (mboe/d) 180 – 190
Wells to be brought on production 100 – 110
The Company remains focused on: (i) cash flow self sufficiency; (ii) the development of a large inventory of relatively low supply cost, liquids-rich horizontal well drilling opportunities in its core focus area; (iii) building facilities to gather and process the produced natural gas, condensate and other NGLs; and (iv) establishing further opportunities to maximize value.
SEVEN GENERATIONS 2016 Annual Report22

Operational and Financial Highlights
The following table presents selected operational and financial information:
Three months ended December 31,
Three months ended September 30,
Years ended December 31,
($ millions, except per share and volume data) 2016 2015 % Change 2016 % Change 2016 2015 % Change
Production
Condensate (mbbls/d) 43.2 25.6 69 46.5 (7) 39.3 21.2 85
NGLs (mbbls/d) 33.4 19.2 74 33.8 (1) 30.0 14.3 110
Liquids (mbbls/d) 76.6 44.8 71 80.3 (5) 69.3 35.5 95
Natural gas (MMcf/d) 334 197 70 314 6 291 149 95
Total Production (mboe/d) 132.3 77.7 70 132.6 – 117.8 60.4 95
Liquids % 58% 58% – 61% (5) 59% 59% –
FinancialOperating income(loss) (1) (3) 47.6 (14.2) nm 47.7 – 160.6 52.1 208
Per share – diluted 0.13 (0.05) nm 0.15 (13) 0.50 0.19 163
Revenue (2) 262.2 244.7 7 361.7 (28) 1,064.1 675.4 58
Net loss and comprehensive loss (3) (104.9) (28.9) 263 (2.2) nm (26.2) (187.3) (86)
Per share – diluted (0.30) (0.11) 173 (0.01) nm (0.09) (0.75) (88)
Funds from operations (1) (3) 219.7 106.0 107 204.7 7 732.6 414.6 77 Per share – diluted 0.60 0.39 54 0.62 (3) 2.30 1.53 50
Cash provided by operating activities 178.6 53.9 231 169.3 5 644.6 380.1 70
Capital investments (4) 283.6 301.1 (6) 207.8 36 978.0 1,309.0 (25)
Adjusted working capital (1) 585.9 306.0 91 629.3 (7) 585.9 306.0 91
Available funding (1) 1,626.7 1,118.0 46 1,673.4 (3) 1,626.7 1,118.0 46
Net debt (1) 1,528.8 1,250.9 22 1,436.6 6 1,528.8 1,250.9 22
Debt outstanding 2,111.9 1,546.8 37 2,063.0 2 2,111.9 1,546.8 37
Weighted average shares – basic (5) 347.2 252.9 37 309.8 12 299.8 249.6 20
Weighted average shares – diluted (5) 365.0 273.1 34 329.8 11 318.8 270.1 18
(1) See “Non-IFRS Financial Measures”.(2) Represents the total of liquids and natural gas sales, net of royalties, gains (losses) on risk management contracts and other income.(3) Includes $27.4 million ($20.0 million after tax) of prior period royalty recoveries for the year ended December 31, 2016.(4) Excluding acquisitions and equity investments. (5) Basic weighted average shares are used to calculate diluted per share amounts when the Company is in a loss position.
SEVEN GENERATIONS 2016 Annual Report 23
Operating Netback
Three months ended December 31,
Three months ended September 30,
2016 2015 % Change 2016 % Change
Liquids and natural gas sales $ 33.67 $ 24.97 35 $ 29.65 14
Realized hedging gains 0.48 3.22 (85) 1.57 (69)
Royalties (0.98) (1.69) (42) (0.03) nm
Operating expenses (4.86) (4.11) 18 (3.85) 26
Transportation and processing (1) (5.92) (3.30) 79 (6.12) (3)
Operating netback per boe (2) $ 22.39 $ 19.09 17 $ 21.22 6
(1) Comparative figures have been reclassified to conform to current period. (2) See “Non-IFRS Financial Measures”.
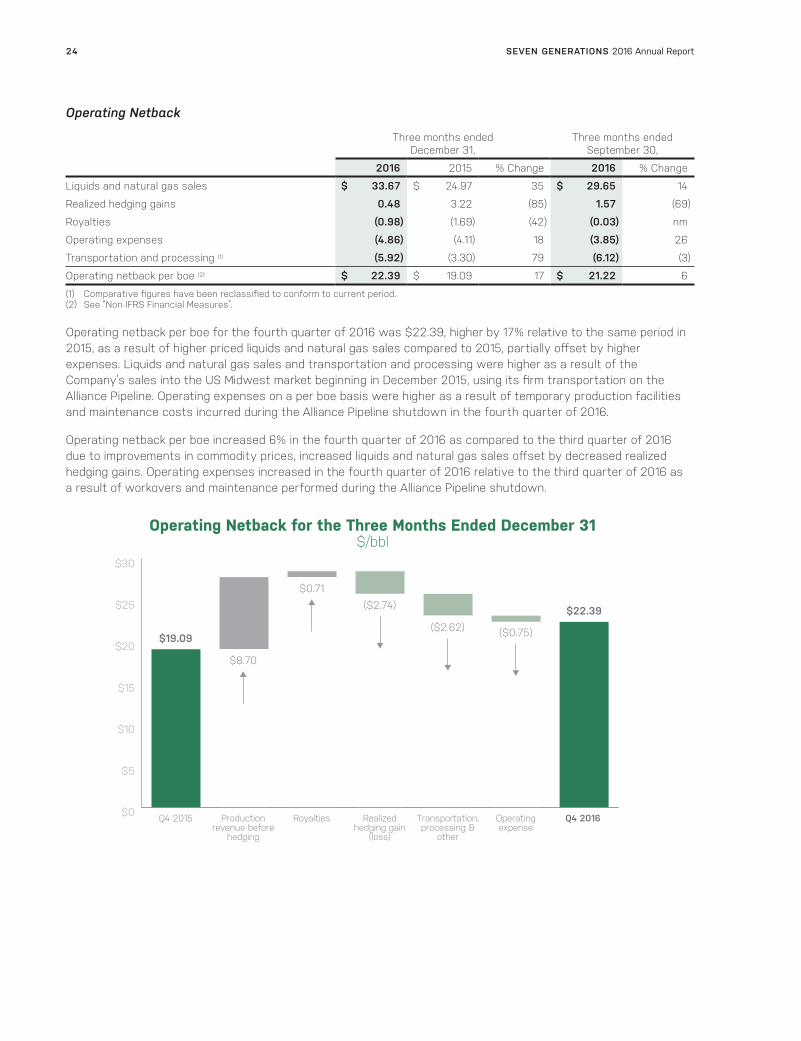
Operating netback per boe for the fourth quarter of 2016 was $22.39, higher by 17% relative to the same period in 2015, as a result of higher priced liquids and natural gas sales compared to 2015, partially offset by higher expenses. Liquids and natural gas sales and transportation and processing were higher as a result of the Company’s sales into the US Midwest market beginning in December 2015, using its firm transportation on the Alliance Pipeline. Operating expenses on a per boe basis were higher as a result of temporary production facilities and maintenance costs incurred during the Alliance Pipeline shutdown in the fourth quarter of 2016.
Operating netback per boe increased 6% in the fourth quarter of 2016 as compared to the third quarter of 2016 due to improvements in commodity prices, increased liquids and natural gas sales offset by decreased realized hedging gains. Operating expenses increased in the fourth quarter of 2016 relative to the third quarter of 2016 as a result of workovers and maintenance performed during the Alliance Pipeline shutdown.
$0
$5
$10
$15
$20
$25
$30
Operating Netback for the Three Months Ended December 31$/bbl
Q4 2015 Production revenue before
hedging
Royalties Realized hedging gain
(loss)
Transportation,processing &
other
Operating expense
Q4 2016
$19.09
$8.70
$0.71($2.74)
($2.62) ($0.75)
$22.39
SEVEN GENERATIONS 2016 Annual Report24

Years ended December 31,
2016 2015 % Change
Liquids and natural gas sales $ 28.92 $ 26.84 8
Realized hedging gains 2.11 6.83 (69)
Royalties (1) (0.16) (2.63) (94)
Operating expenses (4.22) (4.59) (8)
Transportation and processing (2) (5.53) (2.68) 106
Operating netback per boe (3) $ 21.12 $ 23.77 (11)
(1) Includes $27.4 million ($20.0 million after tax) of prior period royalty recoveries for the year ended December 31, 2016.(2) Certain comparative figures have been reclassified to conform to current period.(3) See “Non-IFRS Financial Measures”.
For the year ended December 31, 2016, operating netback per boe was $21.12, a decrease of 11% from the same period in 2015, due to lower realized hedging gains as the Company hedged its liquids at an average price of $70/bbl in 2016 compared to $102/bbl in 2015. Despite lower benchmark commodity prices compared to fiscal 2015, the Company benefited from higher realized natural gas and NGL prices due to its firm transportation on the Alliance Pipeline into the US Midwest market, which commenced in December 2015, offset by increased pipeline tariffs for liquids rich natural gas transportation. Royalties decreased as a result of one-time adjustments for Gas Cost Allowance (“GCA”) and lower royalty rates attributable to a field reporting change for condensate production. On a per boe basis, operating expenses decreased due to higher volumes.
$0
$5
$10
$15
$20
$25
$30
Operating Netback for the Year Ended December 31$/bbl
2015 Realized hedging gain
(loss)
Transportation,processing &
other
Royalties Production revenue before
hedging
Operating expense
2016
$23.77
($4.72)
($2.85) $2.47
$2.08
$0.37
$21.12
SEVEN GENERATIONS 2016 Annual Report 25
Funds from Operations
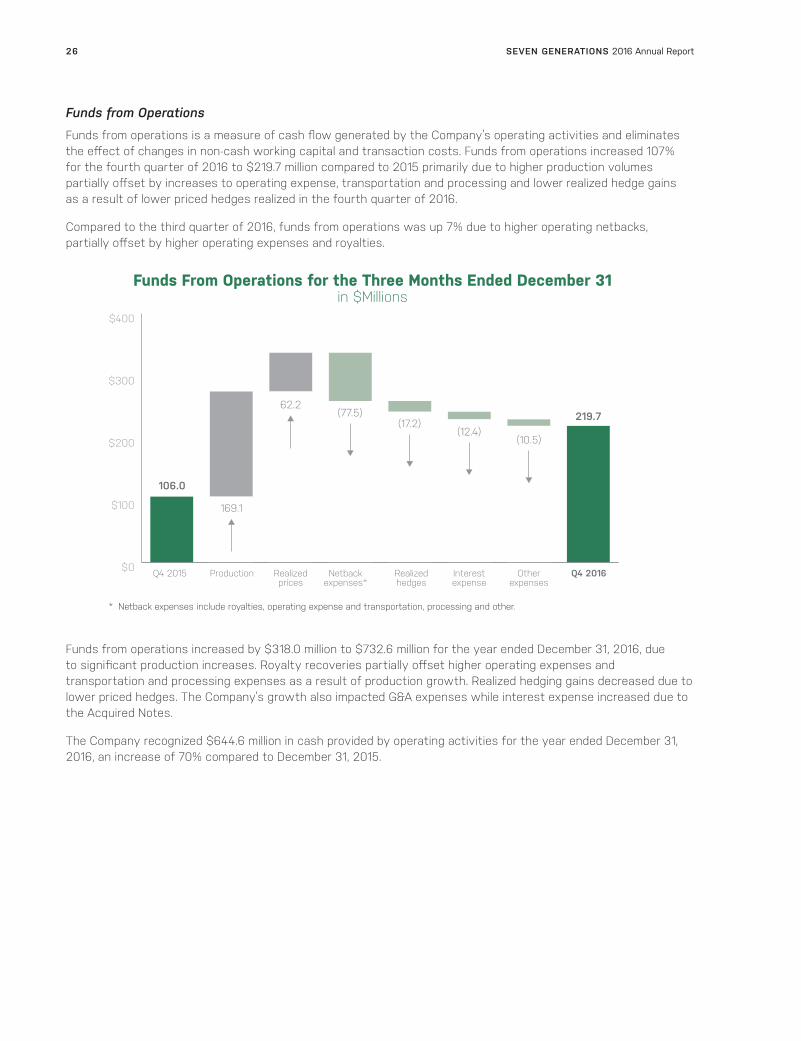
Funds from operations is a measure of cash flow generated by the Company’s operating activities and eliminates the effect of changes in non-cash working capital and transaction costs. Funds from operations increased 107% for the fourth quarter of 2016 to $219.7 million compared to 2015 primarily due to higher production volumes partially offset by increases to operating expense, transportation and processing and lower realized hedge gains as a result of lower priced hedges realized in the fourth quarter of 2016.
Compared to the third quarter of 2016, funds from operations was up 7% due to higher operating netbacks, partially offset by higher operating expenses and royalties.
$0
$100
$200
$300
$400
Funds From Operations for the Three Months Ended December 31in $Millions
Q4 2015 Production Realizedprices
Netback expenses*
Realizedhedges
Interestexpense
Otherexpenses
Q4 2016
106.0
169.1
62.2(77.5)
(17.2)(10.5)
219.7(12.4)
* Netback expenses include royalties, operating expense and transportation, processing and other.
Funds from operations increased by $318.0 million to $732.6 million for the year ended December 31, 2016, due to significant production increases. Royalty recoveries partially offset higher operating expenses and transportation and processing expenses as a result of production growth. Realized hedging gains decreased due to lower priced hedges. The Company’s growth also impacted G&A expenses while interest expense increased due to the Acquired Notes.
The Company recognized $644.6 million in cash provided by operating activities for the year ended December 31, 2016, an increase of 70% compared to December 31, 2015.
SEVEN GENERATIONS 2016 Annual Report26

$0
$100
$200
$300
$400
$500
$600
$700
$800
$900
$1,000
$1,100
Funds From Operations for the Year Ended December 31in $Millions
2015 Production Realizedprices
Netback expenses*
Realizedhedges
Interestexpense
Otherexpenses
2016
414.6
47.6
732.6
607.3
(207.8)(59.8)
(34.4)(34.9)
* Netback expenses include royalties (which includes $27.4 million of prior period royalty recoveries), operating expense and transportation, processing and other.
Operating Income
Operating income is net income excluding tax affected unrealized risk management and foreign exchange gains and losses. Seven Generations increased operating income to $47.6 million for the quarter ended December 31, 2016 from a loss of $14.2 million in the same period of 2015 due to significant production increases and low royalty rates on new wells. Higher liquids and natural gas sales were partially offset by increases in operating expenses and transportation and processing expenses related to growing activity and volumes. Realized hedging gains were lower as WTI increased by 17% and NYMEX by 43% compared to the fourth quarter of 2015.
Operating income of $47.6 million was consistent with the third quarter of $47.7 million.
Operating income for the year ended December 31, 2016 was $160.6 million compared to $52.1 million for the same period in 2015, primarily due to production growth and lower royalties.
Net Loss
The Company reported a net loss of $104.9 million for the fourth quarter of 2016 compared to a net loss of $28.9 million for the same period in 2015 primarily due to unrealized losses on risk management contracts related to commodity prices strengthening. On a diluted basis, the Company reported a net loss per share of $0.30 for the fourth quarter of 2016.
The Company’s net loss in the fourth quarter of 2016 increased from a net loss of $2.2 million in the third quarter of 2016 due to a 2% weakening of the Canadian dollar translating into higher unrealized hedging losses.
For the year ended December 31, 2016, the Company reported a net loss of $26.2 million compared to a net loss of $187.3 million in 2015, a decrease of 86% due to higher operating income and unrealized foreign exchange gains on the senior notes due to a 3% strengthening in the Canadian dollar. On a diluted per share basis, the Company reported net loss of $0.09 per share for fiscal 2016.
SEVEN GENERATIONS 2016 Annual Report 27
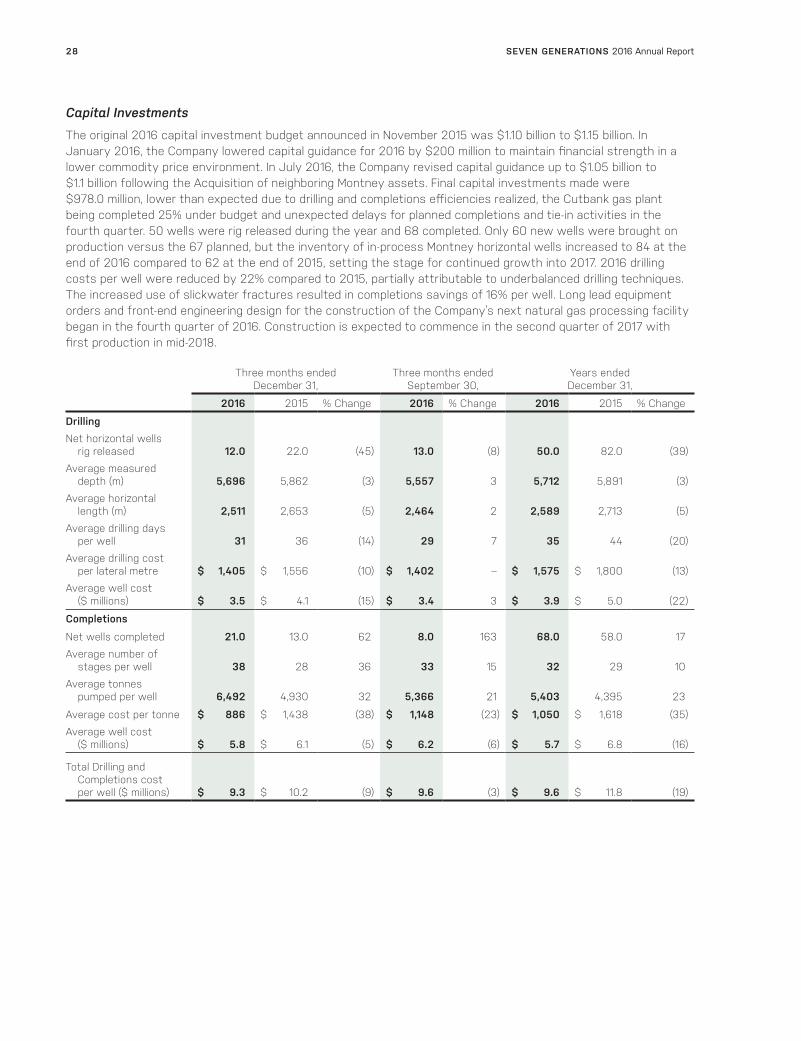
Capital Investments
The original 2016 capital investment budget announced in November 2015 was $1.10 billion to $1.15 billion. In January 2016, the Company lowered capital guidance for 2016 by $200 million to maintain financial strength in a lower commodity price environment. In July 2016, the Company revised capital guidance up to $1.05 billion to $1.1 billion following the Acquisition of neighboring Montney assets. Final capital investments made were $978.0 million, lower than expected due to drilling and completions efficiencies realized, the Cutbank gas plant being completed 25% under budget and unexpected delays for planned completions and tie-in activities in the fourth quarter. 50 wells were rig released during the year and 68 completed. Only 60 new wells were brought on production versus the 67 planned, but the inventory of in-process Montney horizontal wells increased to 84 at the end of 2016 compared to 62 at the end of 2015, setting the stage for continued growth into 2017. 2016 drilling costs per well were reduced by 22% compared to 2015, partially attributable to underbalanced drilling techniques. The increased use of slickwater fractures resulted in completions savings of 16% per well. Long lead equipment orders and front-end engineering design for the construction of the Company’s next natural gas processing facility began in the fourth quarter of 2016. Construction is expected to commence in the second quarter of 2017 with first production in mid-2018.
Three months ended December 31,
Three months ended September 30,
Years ended December 31,
2016 2015 % Change 2016 % Change 2016 2015 % Change
DrillingNet horizontal wells rig released 12.0 22.0 (45) 13.0 (8) 50.0 82.0 (39)
Average measured depth (m) 5,696 5,862 (3) 5,557 3 5,712 5,891 (3)
Average horizontal length (m) 2,511 2,653 (5) 2,464 2 2,589 2,713 (5)
Average drilling days per well 31 36 (14) 29 7 35 44 (20)
Average drilling cost per lateral metre $ 1,405 $ 1,556 (10) $ 1,402 – $ 1,575 $ 1,800 (13)
Average well cost ($ millions) $ 3.5 $ 4.1 (15) $ 3.4 3 $ 3.9 $ 5.0 (22)
Completions
Net wells completed 21.0 13.0 62 8.0 163 68.0 58.0 17
Average number of stages per well 38 28 36 33 15 32 29 10
Average tonnes pumped per well 6,492 4,930 32 5,366 21 5,403 4,395 23
Average cost per tonne $ 886 $ 1,438 (38) $ 1,148 (23) $ 1,050 $ 1,618 (35)
Average well cost ($ millions) $ 5.8 $ 6.1 (5) $ 6.2 (6) $ 5.7 $ 6.8 (16)
Total Drilling and Completions cost per well ($ millions) $ 9.3 $ 10.2 (9) $ 9.6 (3) $ 9.6 $ 11.8 (19)
SEVEN GENERATIONS 2016 Annual Report28

Available Funding
On February 24, 2016, the Company completed a private placement of 21.4 million Common Shares at a price of $14.00 per share for gross proceeds of $300.0 million. Net proceeds after commissions and expenses were approximately $287.0 million.
On July 26, 2016, Seven Generations closed a bought-deal financing issuing 30.7 million subscription receipts at $24.35 per subscription receipt for gross proceeds of $747.7 million (net proceeds of $717.7 million). Each holder of Subscription Receipts received one Common Share for each Subscription Receipt held.
In August, the Company’s lenders increased the maximum available amount under the credit facility from $850.0 million to $1.1 billion.
The Company ended fiscal 2016 in a strong financial position with available funding of approximately $1.6 billion, comprised of $585.9 million of adjusted working capital, $1.1 billion of undrawn credit capacity and net of $59.2 million of cash held in collateral accounts.
Selected Annual Financial Information
($ millions, except per share and volume data) 2016 2015 2014
Revenue (1) 1,064.1 675.4 639.4
Net income (loss) and comprehensive income (loss) (26.2) (187.3) 144.2
Per share – diluted (0.09) (0.75) 0.64
Total capital investments (2) 978.0 1,309.0 1,120.3
Total assets 6,602.4 3,758.9 3,114.8
Total long-term debt 2,111.9 1,546.8 813.9
(1) Represents the total of liquids and natural gas sales, net of royalties, and includes net gains/losses on risk management contracts and other income.
(2) Total capital investments before acquisitions and equity investments.
Since 2014, Seven Generations’ revenues increased by $424.7 million, an increase of more than 65%, attributable to significant production growth from the Kakwa River Project increasing from 31.1 mboe/d in 2014 to 117.8 mboe/d in 2016. Capital investments include more than 155 gross wells brought on stream over the last three years: 60 gross wells in 2016, 61 gross wells in 2015, and 34 gross wells in 2014.
In 2014, the Company had net income of $144.2 million mostly attributable to the higher commodity price environment, which started to see a decline in the fourth quarter of 2014. In 2015, the Company recorded a net loss of $187.3 million, largely impacted by a low commodity price environment and unrealized foreign exchange losses on US dollar denominated debt. In 2016, the Company had a net loss of $26.2 million as a result of changes to benchmark prices.
At December 31, 2016, capital development of the Kakwa River Project invested by Seven Generations was more than $4 billion, excluding acquisitions.
SEVEN GENERATIONS 2016 Annual Report 29
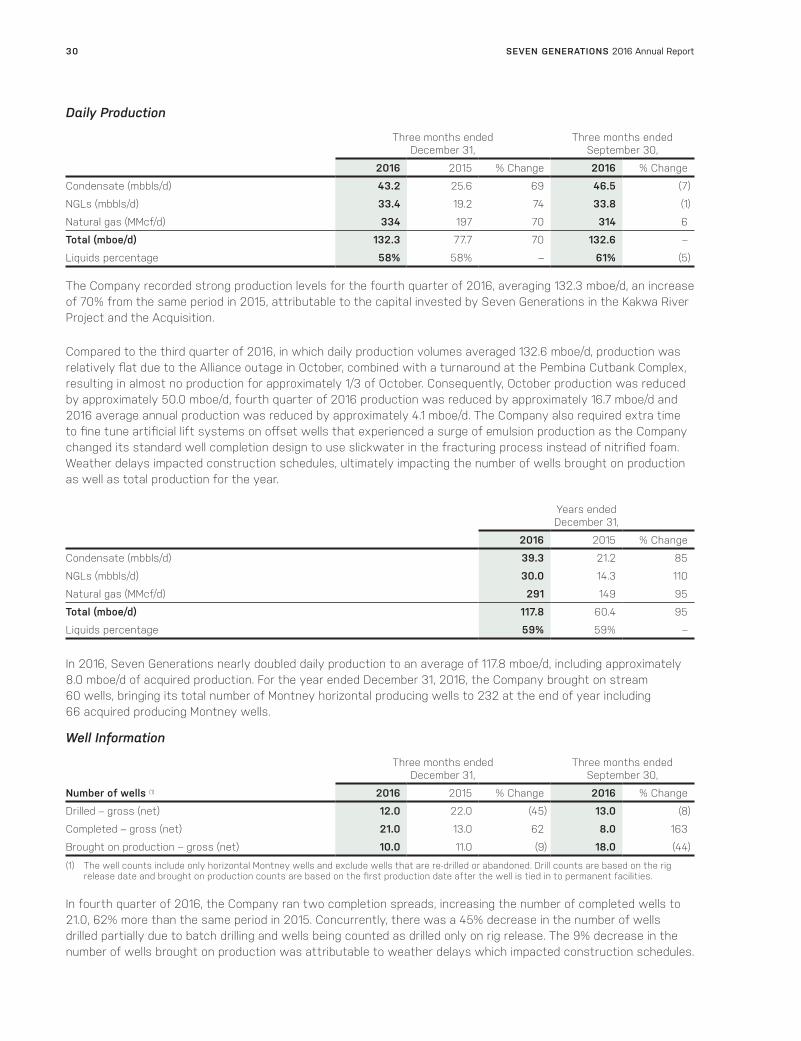
Daily Production
Three months ended December 31,
Three months ended September 30,
2016 2015 % Change 2016 % Change
Condensate (mbbls/d) 43.2 25.6 69 46.5 (7)
NGLs (mbbls/d) 33.4 19.2 74 33.8 (1)
Natural gas (MMcf/d) 334 197 70 314 6
Total (mboe/d) 132.3 77.7 70 132.6 –
Liquids percentage 58% 58% – 61% (5)
The Company recorded strong production levels for the fourth quarter of 2016, averaging 132.3 mboe/d, an increase of 70% from the same period in 2015, attributable to the capital invested by Seven Generations in the Kakwa River Project and the Acquisition.
Compared to the third quarter of 2016, in which daily production volumes averaged 132.6 mboe/d, production was relatively flat due to the Alliance outage in October, combined with a turnaround at the Pembina Cutbank Complex, resulting in almost no production for approximately 1/3 of October. Consequently, October production was reduced by approximately 50.0 mboe/d, fourth quarter of 2016 production was reduced by approximately 16.7 mboe/d and 2016 average annual production was reduced by approximately 4.1 mboe/d. The Company also required extra time to fine tune artificial lift systems on offset wells that experienced a surge of emulsion production as the Company changed its standard well completion design to use slickwater in the fracturing process instead of nitrified foam. Weather delays impacted construction schedules, ultimately impacting the number of wells brought on production as well as total production for the year.
Years ended December 31,
2016 2015 % Change
Condensate (mbbls/d) 39.3 21.2 85
NGLs (mbbls/d) 30.0 14.3 110
Natural gas (MMcf/d) 291 149 95
Total (mboe/d) 117.8 60.4 95
Liquids percentage 59% 59% –
In 2016, Seven Generations nearly doubled daily production to an average of 117.8 mboe/d, including approximately 8.0 mboe/d of acquired production. For the year ended December 31, 2016, the Company brought on stream 60 wells, bringing its total number of Montney horizontal producing wells to 232 at the end of year including 66 acquired producing Montney wells.
Well Information
Three months ended December 31,
Three months ended September 30,
Number of wells (1) 2016 2015 % Change 2016 % Change
Drilled – gross (net) 12.0 22.0 (45) 13.0 (8)
Completed – gross (net) 21.0 13.0 62 8.0 163
Brought on production – gross (net) 10.0 11.0 (9) 18.0 (44)
(1) The well counts include only horizontal Montney wells and exclude wells that are re-drilled or abandoned. Drill counts are based on the rig release date and brought on production counts are based on the first production date after the well is tied in to permanent facilities.
In fourth quarter of 2016, the Company ran two completion spreads, increasing the number of completed wells to 21.0, 62% more than the same period in 2015. Concurrently, there was a 45% decrease in the number of wells drilled partially due to batch drilling and wells being counted as drilled only on rig release. The 9% decrease in the number of wells brought on production was attributable to weather delays which impacted construction schedules.
SEVEN GENERATIONS 2016 Annual Report30
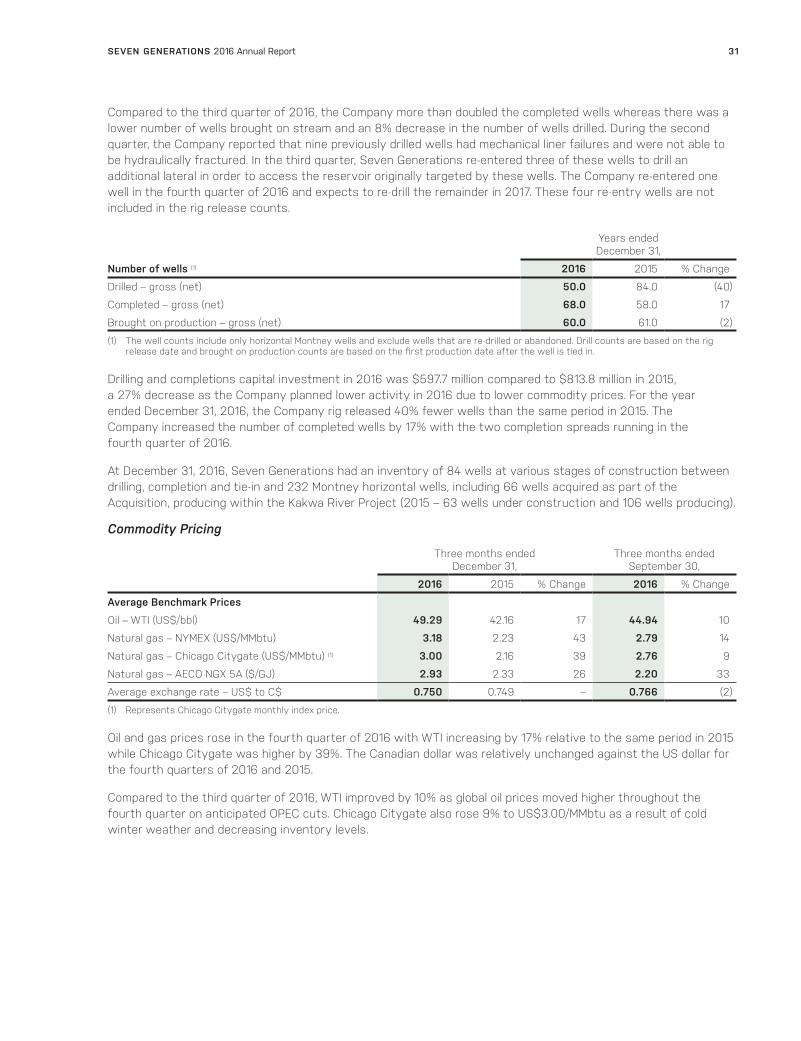
Compared to the third quarter of 2016, the Company more than doubled the completed wells whereas there was a lower number of wells brought on stream and an 8% decrease in the number of wells drilled. During the second quarter, the Company reported that nine previously drilled wells had mechanical liner failures and were not able to be hydraulically fractured. In the third quarter, Seven Generations re-entered three of these wells to drill an additional lateral in order to access the reservoir originally targeted by these wells. The Company re-entered one well in the fourth quarter of 2016 and expects to re-drill the remainder in 2017. These four re-entry wells are not included in the rig release counts.
Years ended December 31,
Number of wells (1) 2016 2015 % Change
Drilled – gross (net) 50.0 84.0 (40)
Completed – gross (net) 68.0 58.0 17
Brought on production – gross (net) 60.0 61.0 (2)
(1) The well counts include only horizontal Montney wells and exclude wells that are re-drilled or abandoned. Drill counts are based on the rig release date and brought on production counts are based on the first production date after the well is tied in.
Drilling and completions capital investment in 2016 was $597.7 million compared to $813.8 million in 2015, a 27% decrease as the Company planned lower activity in 2016 due to lower commodity prices. For the year ended December 31, 2016, the Company rig released 40% fewer wells than the same period in 2015. The Company increased the number of completed wells by 17% with the two completion spreads running in the fourth quarter of 2016.
At December 31, 2016, Seven Generations had an inventory of 84 wells at various stages of construction between drilling, completion and tie-in and 232 Montney horizontal wells, including 66 wells acquired as part of the Acquisition, producing within the Kakwa River Project (2015 – 63 wells under construction and 106 wells producing).
Commodity Pricing
Three months ended December 31,
Three months ended September 30,
2016 2015 % Change 2016 % Change
Average Benchmark Prices
Oil – WTI (US$/bbl) 49.29 42.16 17 44.94 10
Natural gas – NYMEX (US$/MMbtu) 3.18 2.23 43 2.79 14
Natural gas – Chicago Citygate (US$/MMbtu) (1) 3.00 2.16 39 2.76 9
Natural gas – AECO NGX 5A ($/GJ) 2.93 2.33 26 2.20 33
Average exchange rate – US$ to C$ 0.750 0.749 – 0.766 (2)
(1) Represents Chicago Citygate monthly index price.
Oil and gas prices rose in the fourth quarter of 2016 with WTI increasing by 17% relative to the same period in 2015 while Chicago Citygate was higher by 39%. The Canadian dollar was relatively unchanged against the US dollar for the fourth quarters of 2016 and 2015.
Compared to the third quarter of 2016, WTI improved by 10% as global oil prices moved higher throughout the fourth quarter on anticipated OPEC cuts. Chicago Citygate also rose 9% to US$3.00/MMbtu as a result of cold winter weather and decreasing inventory levels.
SEVEN GENERATIONS 2016 Annual Report 31

Years ended December 31,
2016 2015 % Change
Average Benchmark Prices
Oil – WTI (US$/bbl) 43.47 48.76 (11)
Natural gas – NYMEX (US$/MMbtu) 2.55 2.63 (3)
Natural gas – Chicago Citygate (US$/MMbtu) (1) 2.49 2.73 (9)
Natural gas – AECO NGX 5A ($/GJ) 2.05 2.55 (20)
Average exchange rate – US$ to C$ 0.755 0.782 (3)
(1) Represents Chicago Citygate monthly index price.
For the year ended December 31, 2016, WTI fell by 11% to US$43.47/bbl while Chicago Citygate decreased by 9% to US$2.49/MMbtu, as compared to the same period in 2015. The Canadian dollar declined by 3% as compared to the US dollar for 2016.
Seven Generations realized the following commodity prices (before hedging):
Three months ended December 31,
Three months ended September 30,
2016 2015 % Change 2016 % Change
Condensate and oil ($/bbl) 56.96 46.72 22 49.93 14
NGLs ($/bbl) 18.23 12.35 48 11.23 62
Natural gas ($/Mcf) 4.15 2.57 61 3.92 6
Total ($/boe) 33.67 24.97 35 29.65 14
For the fourth quarter of 2016, the Company realized a condensate and oil price of $56.96/boe, an increase of 22% compared to the same period in 2015 due to an increase in WTI of 17% and improved differentials for condensate.
The Company realized $18.23/bbl for its NGL product stream for the fourth quarter of 2016, higher than the same period in 2015 by 48% mainly due to higher propane, butane and WTI denominated pentanes plus sales in Alberta.
As of December 1, 2015, Seven Generations began transporting liquids rich gas volumes out of the Alberta market and into the US Midwest market, realizing higher prices benchmarked off of the Chicago Citygate index. The change in market also increased pipeline tariffs, included in transportation and processing expenses for 2016, previously netted against the realized price received based on the point of title transfer for the Company. On a per boe basis, the pipeline tariffs impact realized gas pricing by almost 35% for 2016. The Company’s average natural gas realized price was $4.35/Mcf in the 2016 fourth quarter for the component of natural gas sales in the US Midwest market.
Prior to the third quarter of 2016, the Company had no exposure to the AECO market. Following the closing of the Acquisition on August 18, 2016, the Company’s acquired production realized a natural gas price of $3.28/Mcf for the fourth quarter of 2016, accounting for nearly 20% of natural gas volumes.
Compared to the third quarter of 2016, the Company’s realized condensate and oil price was higher by 14% primarily attributable to improvements in WTI of 10%. NGL realized prices were higher than the third quarter of 2016 by 62% due to a 2016 fourth quarter strengthening of WTI and increased prices in the propane market. US Market Natural gas prices of $4.35/Mcf were higher compared to the third quarter of 2016, which was $4.15/Mcf, mostly due to increases in Chicago Citygate benchmark pricing where US sales made up approximately 81% of the Company’s natural gas sales volumes. AECO natural gas prices of $3.28/Mcf were up from a realized price of $2.08/Mcf in the 2016 third quarter as a result of a rally in the AECO market, which increased by approximately 33% per GJ in the last quarter of 2016.
SEVEN GENERATIONS 2016 Annual Report32
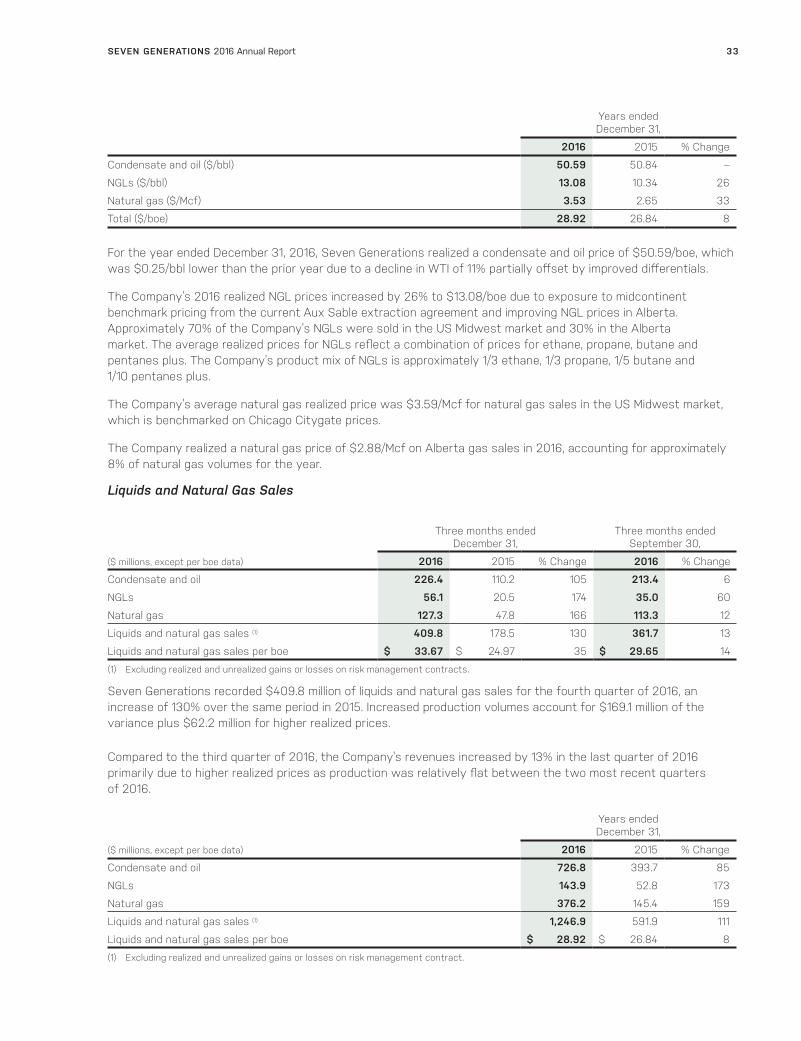
Years ended December 31,
2016 2015 % Change
Condensate and oil ($/bbl) 50.59 50.84 –
NGLs ($/bbl) 13.08 10.34 26
Natural gas ($/Mcf) 3.53 2.65 33
Total ($/boe) 28.92 26.84 8
For the year ended December 31, 2016, Seven Generations realized a condensate and oil price of $50.59/boe, which was $0.25/bbl lower than the prior year due to a decline in WTI of 11% partially offset by improved differentials.
The Company’s 2016 realized NGL prices increased by 26% to $13.08/boe due to exposure to midcontinent benchmark pricing from the current Aux Sable extraction agreement and improving NGL prices in Alberta. Approximately 70% of the Company’s NGLs were sold in the US Midwest market and 30% in the Alberta market. The average realized prices for NGLs reflect a combination of prices for ethane, propane, butane and pentanes plus. The Company’s product mix of NGLs is approximately 1/3 ethane, 1/3 propane, 1/5 butane and 1/10 pentanes plus.
The Company’s average natural gas realized price was $3.59/Mcf for natural gas sales in the US Midwest market, which is benchmarked on Chicago Citygate prices.
The Company realized a natural gas price of $2.88/Mcf on Alberta gas sales in 2016, accounting for approximately 8% of natural gas volumes for the year.
Liquids and Natural Gas Sales
Three months ended
December 31,Three months ended
September 30,
($ millions, except per boe data) 2016 2015 % Change 2016 % Change
Condensate and oil 226.4 110.2 105 213.4 6
NGLs 56.1 20.5 174 35.0 60
Natural gas 127.3 47.8 166 113.3 12
Liquids and natural gas sales (1) 409.8 178.5 130 361.7 13
Liquids and natural gas sales per boe $ 33.67 $ 24.97 35 $ 29.65 14
(1) Excluding realized and unrealized gains or losses on risk management contracts.
Seven Generations recorded $409.8 million of liquids and natural gas sales for the fourth quarter of 2016, an increase of 130% over the same period in 2015. Increased production volumes account for $169.1 million of the variance plus $62.2 million for higher realized prices.
Compared to the third quarter of 2016, the Company’s revenues increased by 13% in the last quarter of 2016 primarily due to higher realized prices as production was relatively flat between the two most recent quarters of 2016.
Years ended December 31,
($ millions, except per boe data) 2016 2015 % Change
Condensate and oil 726.8 393.7 85
NGLs 143.9 52.8 173
Natural gas 376.2 145.4 159
Liquids and natural gas sales (1) 1,246.9 591.9 111
Liquids and natural gas sales per boe $ 28.92 $ 26.84 8
(1) Excluding realized and unrealized gains or losses on risk management contract.
SEVEN GENERATIONS 2016 Annual Report 33

For the year ended December 31, 2016, the Company’s liquids and natural gas sales increased 111% to $1.2 billion boosted by record production that made up $609.0 million of the increase. The remainder of $46.0 million was due to higher realized commodity prices.
Risk Management Contracts
Seven Generations continued to execute its mechanistic risk management program in 2016. The Company hedges oil and natural gas production and exchange rates to support funds from operations through a three year, rolling hedging program. Price targets are established at levels that are expected to provide a threshold rate of return on capital investment based on a combination of benchmark oil and natural gas prices, projected well performance and capital efficiencies. The Company is authorized to hedge up to 65% of forecasted condensate and natural gas production volumes (net of royalties) for the upcoming four quarters, up to 35% of forecasted volumes for the subsequent four quarters and up to 20% for the four quarters following.
The Company’s risk management program resulted in the following:
Three months ended December 31,
Three months ended September 30,
($ millions, except per boe data) 2016 2015 % Change 2016 % Change
Realized gain (1) 5.8 23.0 (75) 19.2 (70)
Unrealized (loss) gain (2) (142.8) 53.7 nm (8.7) nm
Risk management (loss) gain (137.0) 76.7 nm 10.5 nm
Realized gain per boe $ 0.48 $ 3.22 (85) $ 1.57 (69)
(1) Represents actual cash settlements or receipts under the respective contracts. (2) Represents the change in fair value of the contracts during the period.
Realized gains were $5.8 million for the fourth quarter of 2016, 75% lower than the previous year due to higher priced hedging contracts in the same period of 2015.
Fourth quarter realized gains were 70% lower than the third quarter of 2016 as a result of strengthening commodity prices.
Years ended December 31,
($ millions, except per boe data) 2016 2015 % Change
Realized gain (1) 90.8 150.6 (40)
Unrealized (loss) (2) (271.6) (15.9) nm
Risk management (loss) gain (180.8) 134.7 nm
Realized gain per boe $ 2.11 $ 6.83 (69)
(1) Represents actual cash settlements or receipts under the respective contracts. (2) Represents the change in fair value of the contracts during the period.
For the year ended December 31, 2016, the Company recorded realized gains of $90.8 million, a decrease of 40% attributable to lower hedged liquids prices in 2016.
As at December 31, 2016, the fair value of the risk management contracts decreased to a net liability position of $149.4 million (December 31, 2015 – net asset position of $123.3 million) due to higher commodity prices since the beginning of 2016 and the realization in 2016 of higher priced hedges entered in during 2014. The fair value of unsettled derivatives is recorded as an asset or liability with the change in the mark-to-market position of contracts recorded as an unrealized gain or loss in the statements of income (loss) and comprehensive income (loss).
SEVEN GENERATIONS 2016 Annual Report34
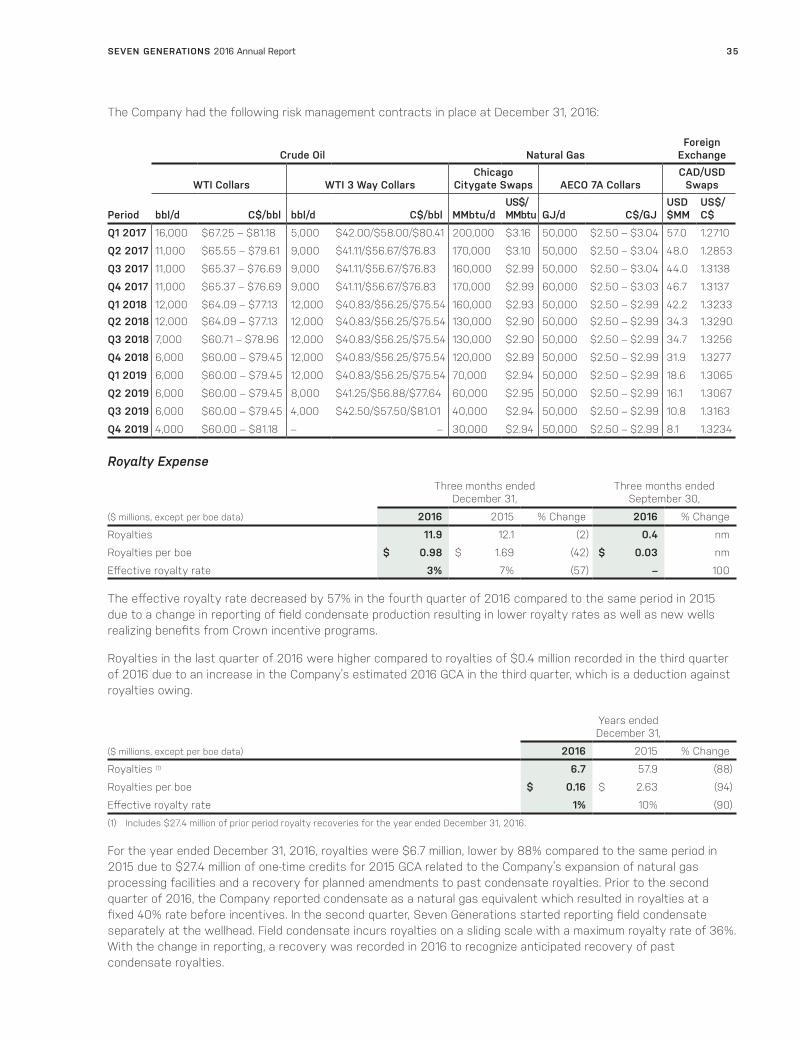
The Company had the following risk management contracts in place at December 31, 2016:
Period
Crude Oil Natural GasForeign
Exchange
WTI Collars WTI 3 Way CollarsChicago
Citygate Swaps AECO 7A CollarsCAD/USD
Swaps
bbl/d C$/bbl bbl/d C$/bbl MMbtu/dUS$/MMbtu GJ/d C$/GJ
USD $MM
US$/C$
Q1 2017 16,000 $67.25 – $81.18 5,000 $42.00/$58.00/$80.41 200,000 $3.16 50,000 $2.50 – $3.04 57.0 1.2710
Q2 2017 11,000 $65.55 – $79.61 9,000 $41.11/$56.67/$76.83 170,000 $3.10 50,000 $2.50 – $3.04 48.0 1.2853
Q3 2017 11,000 $65.37 – $76.69 9,000 $41.11/$56.67/$76.83 160,000 $2.99 50,000 $2.50 – $3.04 44.0 1.3138
Q4 2017 11,000 $65.37 – $76.69 9,000 $41.11/$56.67/$76.83 170,000 $2.99 60,000 $2.50 – $3.03 46.7 1.3137
Q1 2018 12,000 $64.09 – $77.13 12,000 $40.83/$56.25/$75.54 160,000 $2.93 50,000 $2.50 – $2.99 42.2 1.3233Q2 2018 12,000 $64.09 – $77.13 12,000 $40.83/$56.25/$75.54 130,000 $2.90 50,000 $2.50 – $2.99 34.3 1.3290
Q3 2018 7,000 $60.71 – $78.96 12,000 $40.83/$56.25/$75.54 130,000 $2.90 50,000 $2.50 – $2.99 34.7 1.3256
Q4 2018 6,000 $60.00 – $79.45 12,000 $40.83/$56.25/$75.54 120,000 $2.89 50,000 $2.50 – $2.99 31.9 1.3277
Q1 2019 6,000 $60.00 – $79.45 12,000 $40.83/$56.25/$75.54 70,000 $2.94 50,000 $2.50 – $2.99 18.6 1.3065
Q2 2019 6,000 $60.00 – $79.45 8,000 $41.25/$56.88/$77.64 60,000 $2.95 50,000 $2.50 – $2.99 16.1 1.3067
Q3 2019 6,000 $60.00 – $79.45 4,000 $42.50/$57.50/$81.01 40,000 $2.94 50,000 $2.50 – $2.99 10.8 1.3163
Q4 2019 4,000 $60.00 – $81.18 – – 30,000 $2.94 50,000 $2.50 – $2.99 8.1 1.3234
Royalty Expense
Three months ended December 31,
Three months ended September 30,
($ millions, except per boe data) 2016 2015 % Change 2016 % Change
Royalties 11.9 12.1 (2) 0.4 nm
Royalties per boe $ 0.98 $ 1.69 (42) $ 0.03 nm
Effective royalty rate 3% 7% (57) – 100
The effective royalty rate decreased by 57% in the fourth quarter of 2016 compared to the same period in 2015 due to a change in reporting of field condensate production resulting in lower royalty rates as well as new wells realizing benefits from Crown incentive programs.
Royalties in the last quarter of 2016 were higher compared to royalties of $0.4 million recorded in the third quarter of 2016 due to an increase in the Company’s estimated 2016 GCA in the third quarter, which is a deduction against royalties owing.
Years ended December 31,
($ millions, except per boe data) 2016 2015 % Change
Royalties (1) 6.7 57.9 (88)
Royalties per boe $ 0.16 $ 2.63 (94)
Effective royalty rate 1% 10% (90)
(1) Includes $27.4 million of prior period royalty recoveries for the year ended December 31, 2016.
For the year ended December 31, 2016, royalties were $6.7 million, lower by 88% compared to the same period in 2015 due to $27.4 million of one-time credits for 2015 GCA related to the Company’s expansion of natural gas processing facilities and a recovery for planned amendments to past condensate royalties. Prior to the second quarter of 2016, the Company reported condensate as a natural gas equivalent which resulted in royalties at a fixed 40% rate before incentives. In the second quarter, Seven Generations started reporting field condensate separately at the wellhead. Field condensate incurs royalties on a sliding scale with a maximum royalty rate of 36%. With the change in reporting, a recovery was recorded in 2016 to recognize anticipated recovery of past condensate royalties.
SEVEN GENERATIONS 2016 Annual Report 35

Excluding the one-time adjustments for GCA and condensate royalty rates, for the year ended December 31, 2016 the effective royalty rate as a percentage of revenues would have been approximately 3% of revenues.
All of the Company’s royalties are paid to the Province of Alberta. In September 2015, the Alberta government established a panel to conduct a review of the royalty framework and on January 29, 2016, the recommendations of the Royalty Review Advisory Panel were finalized. With the new royalty framework known as the Modernized Royalty Framework coming into effect in 2017, the economics of drilling in the Kakwa River Montney play, within expected price ranges, is relatively consistent with the previous Alberta Royalty Framework. Production from wells drilled prior to January 1, 2017 will continue on the previous Alberta Royalty Framework for ten years before transitioning to the Modernized Royalty Framework.
Operating Expenses
Three months ended December 31,
Three months ended September 30,
($ millions, except per boe data) 2016 2015 % Change 2016 % Change
Trucking and disposal 23.5 8.5 176 18.6 26
Equipment rental and maintenance 15.7 9.0 74 13.2 19
Chemicals and fuel 6.7 5.3 26 6.1 10
Staff and contractor costs 9.6 5.0 92 6.8 41
Other 3.6 1.6 125 2.3 57
Operating expenses 59.1 29.4 101 47.0 26
Operating expenses per boe $ 4.86 $ 4.11 18 $ 3.85 26
Operating expenses increased to $59.1 million in the fourth quarter of 2016 mostly due to the growth in production. Production increases impacted trucking and disposal costs as well as chemicals and fuel used to manage wax production and stabilization of increased volumes. Equipment rentals were higher in part due to the 10.0 wells brought on stream in the fourth quarter of 2016 as well as workover costs associated with integrating the acquired Montney wells, and planned field maintenance performed during the Alliance Pipeline outage in October 2016.
Fourth quarter equipment rental and maintenance increased operating expenses by $2.5 million from the third quarter of 2016 as a result of temporary production facilities, used to flow new production and conserve gas volumes while wells waited to be tied-in to permanent facilities. The operating expenses per boe in the fourth quarter of 2016 were abnormally high due to maintenance work performed during the Alliance Pipeline outage and lower production volumes due to the field shutdown.
Years ended December 31,
($ millions, except per boe data) 2016 2015 % Change
Trucking and disposal 56.6 31.4 80
Equipment rental and maintenance 62.0 30.5 103
Chemicals and fuel 25.4 15.0 69
Staff and contractor costs (1) 25.7 16.0 61
Other 12.2 8.3 47
Operating expenses 181.9 101.2 80
Operating expenses per boe $ 4.22 $ 4.59 (8)
(1) The Company incurred $31.5 million of field staff and contractor costs for the year ended December 31, 2016 (2015 – $22.1 million), of which $25.7 million (2015 – $16.0 million) was recorded as staff and contractor costs in operating expense and $5.8 million was capitalized to oil and natural gas assets (2015 – $6.1 million). Staff and contractor costs include salaries, benefits and contractor costs.
SEVEN GENERATIONS 2016 Annual Report36

The record production levels achieved in the year ended December 31, 2016 resulted in operating expenses of $181.9 million, an increase of 80% compared to the same period in 2015. Increased field activity and road restrictions in effect for much of the second quarter of 2016 contributed to higher trucking costs. Other operating costs that contributed to the increase year-over-year include higher property taxes and Alberta Energy Regulator administrative fees. For the year ended December 31, 2016, operating expenses per boe were $4.22, down 8% from the same period in 2015 due to higher production and some costs being fixed.
Transportation and Processing Expenses
Three months ended December 31,
Three months ended September 30,
($ millions, except per boe data) 2016 2015 % Change 2016 % Change
Pipeline tariffs 49.9 10.2 nm 45.6 9
Trucking and other 16.1 13.8 17 22.2 (27)
Processing 11.0 – 100 10.1 9
Marketing gains (1) (5.0) (1.3) 285 (3.2) 56
Transportation, processing and other 72.0 22.7 217 74.7 (4)
Transportation, processing and other per boe $ 5.92 $ 3.30 79 $ 6.12 (3)
(1) Comparative figures have been reclassified to conform to current period presentation.
Transportation expense was $72.0 million for the fourth quarter of 2016, an increase of $49.3 million from 2015, mostly due to the Alliance and TransCanada Pipeline Company (“TCPL”) pipeline tariffs. Pipeline tariffs paid to Alliance commenced in December 2015 and payments to TCPL commenced in August 2016 in conjunction with the Acquisition. Processing expenses relate to fees charged on volumes processed through the Pembina Cutbank Complex. The Acquisition included the Company assuming a take or pay commitment at the Kakwa River Complex.
Transportation and processing expenses decreased by 4% in the fourth quarter of 2016 relative to third quarter 2016 primarily due to a decrease in trucking rates. Fourth quarter marketing gains increased by 56% to $5.0 million as a result of the Company’s optimization agreement to mitigate unused take away capacity on the Alliance Pipeline.
Years ended December 31,
($ millions, except per boe data) 2016 2015 % Change
Pipeline tariffs 164.2 10.2 nm
Trucking and other 66.9 50.1 34
Processing 21.2 – nm
Marketing gains (1) (13.7) (1.3) nm
Transportation, processing and other 238.6 59.0 304
Transportation, processing and other per boe $ 5.53 $ 2.68 106
(1) Comparative figures have been reclassified to conform to current period presentation.
As of December 1, 2015, the Company began transporting and marketing its natural gas directly into the US Midwest market and started recognizing the associated pipeline tariffs in transportation, processing and other expenses. Prior to December 1, 2015, natural gas pipeline tariffs were netted against revenue as title change occurred in the field. As of November 1, 2016, the Company extended its transporting and marketing for a portion of its natural gas from Chicago to the Gulf Coast.
For the year ended December 31, 2016, transportation and processing expense increased to $238.6 million primarily due to the inclusion of pipeline tariffs, processing charges of $21.2 million related to volumes sent through Pembina’s Cutbank Complex and increased trucking costs due to higher production as well as increased truck rates during most of the second quarter when road restrictions were in effect.
Marketing gains, which relate to a margin earned from optimizing Seven Generations’ capacity on the Alliance Pipeline, began in December 2015 when the Company began shipments into the US Midwest market.
SEVEN GENERATIONS 2016 Annual Report 37
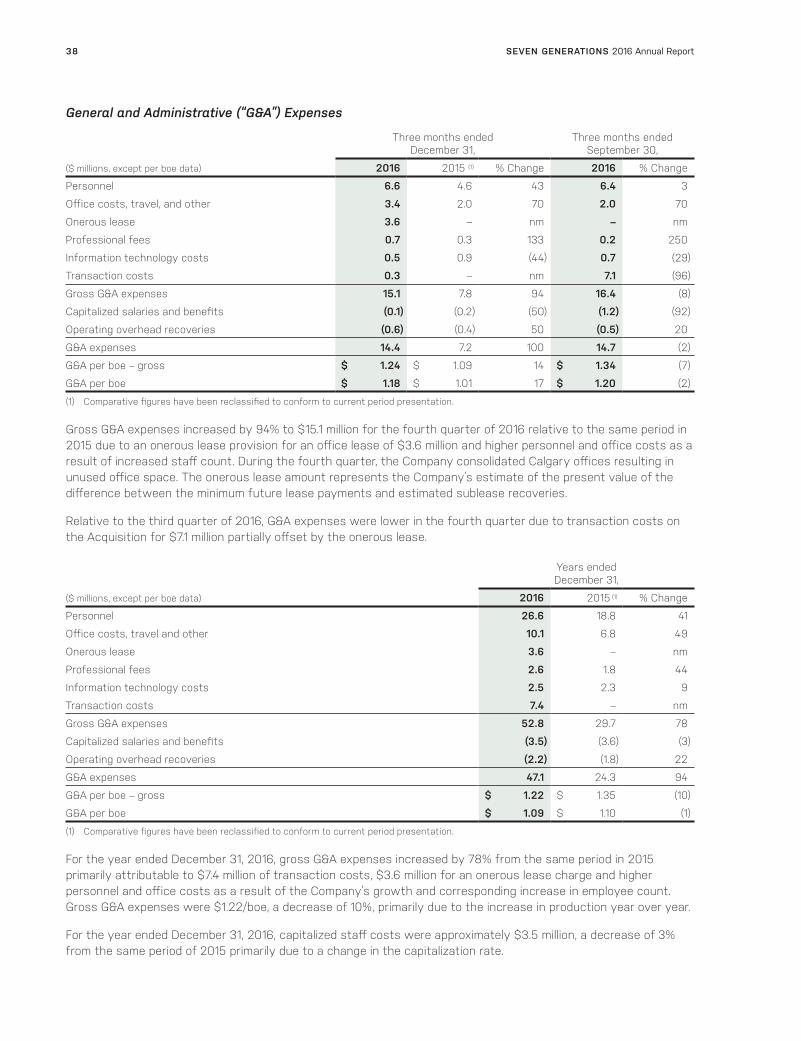
General and Administrative (“G&A”) Expenses
Three months ended December 31,
Three months ended September 30,
($ millions, except per boe data) 2016 2015 (1) % Change 2016 % Change
Personnel 6.6 4.6 43 6.4 3
Office costs, travel, and other 3.4 2.0 70 2.0 70
Onerous lease 3.6 – nm – nm
Professional fees 0.7 0.3 133 0.2 250
Information technology costs 0.5 0.9 (44) 0.7 (29)
Transaction costs 0.3 – nm 7.1 (96)
Gross G&A expenses 15.1 7.8 94 16.4 (8)
Capitalized salaries and benefits (0.1) (0.2) (50) (1.2) (92)
Operating overhead recoveries (0.6) (0.4) 50 (0.5) 20
G&A expenses 14.4 7.2 100 14.7 (2)
G&A per boe – gross $ 1.24 $ 1.09 14 $ 1.34 (7)
G&A per boe $ 1.18 $ 1.01 17 $ 1.20 (2)
(1) Comparative figures have been reclassified to conform to current period presentation.
Gross G&A expenses increased by 94% to $15.1 million for the fourth quarter of 2016 relative to the same period in 2015 due to an onerous lease provision for an office lease of $3.6 million and higher personnel and office costs as a result of increased staff count. During the fourth quarter, the Company consolidated Calgary offices resulting in unused office space. The onerous lease amount represents the Company’s estimate of the present value of the difference between the minimum future lease payments and estimated sublease recoveries.
Relative to the third quarter of 2016, G&A expenses were lower in the fourth quarter due to transaction costs on the Acquisition for $7.1 million partially offset by the onerous lease.
Years ended December 31,
($ millions, except per boe data) 2016 2015 (1) % Change
Personnel 26.6 18.8 41
Office costs, travel and other 10.1 6.8 49
Onerous lease 3.6 – nm
Professional fees 2.6 1.8 44
Information technology costs 2.5 2.3 9
Transaction costs 7.4 – nm
Gross G&A expenses 52.8 29.7 78
Capitalized salaries and benefits (3.5) (3.6) (3)
Operating overhead recoveries (2.2) (1.8) 22
G&A expenses 47.1 24.3 94
G&A per boe – gross $ 1.22 $ 1.35 (10)
G&A per boe $ 1.09 $ 1.10 (1)
(1) Comparative figures have been reclassified to conform to current period presentation.
For the year ended December 31, 2016, gross G&A expenses increased by 78% from the same period in 2015 primarily attributable to $7.4 million of transaction costs, $3.6 million for an onerous lease charge and higher personnel and office costs as a result of the Company’s growth and corresponding increase in employee count. Gross G&A expenses were $1.22/boe, a decrease of 10%, primarily due to the increase in production year over year.
For the year ended December 31, 2016, capitalized staff costs were approximately $3.5 million, a decrease of 3% from the same period of 2015 primarily due to a change in the capitalization rate.
SEVEN GENERATIONS 2016 Annual Report38

Depletion, Depreciation and Amortization
Three months ended December 31,
Three months ended September 30,
($ millions, except per boe data) 2016 2015 % Change 2016 % Change
Depletion, depreciation and amortization 139.1 80.3 73 138.7 –
Depletion, depreciation and amortization per boe $ 11.43 $ 11.23 2 $ 11.37 1
Depletion, depreciation and amortization was $139.1 million for the fourth quarter of 2016, up 73% over the same period in 2015, primarily due to increased production volumes. The Company’s natural gas processing facilities at Lator and Cutbank are depreciated over their estimated useful life and included in the total depletion, depreciation and amortization. The Lator 2 Plant became operational at the end of 2015 while the Cutbank Plant was commissioned at the end of the first quarter of 2016. $2.1 million of depreciation expense was recorded on these plants for the fourth quarter of 2016.
Depletion, depreciation and amortization per barrel for the three months ended December 31, 2016 increased by 2% to $11.43/boe due to the Acquisition.
Fourth quarter of 2016 depletion, depreciation, and amortization was higher relative to the 2016 third quarter due to recognizing a full quarter of the Acquisition, partially offset by increases to reserves.
Years ended December 31,
($ millions, except per boe data) 2016 2015 % Change
Depletion, depreciation and amortization 483.6 283.5 71
Depletion, depreciation and amortization per boe $ 11.22 $ 12.86 (13)
For the year ended December 31, 2016, depletion, depreciation and amortization was $483.6 million, up 71% from the same period in 2015 due primarily to the significant increase in production as well as $7.9 million of depreciation expense on the Lator and Cutbank natural gas processing facilities. In the fourth quarter of 2015, the depletion rate decreased as a result of higher reserves and lower estimated future development costs in the McDaniel report. The lower rate was used for the full year of 2016.
Stock Based Compensation
Three months ended December 31,
Three months ended September 30,
($ millions, except per boe data) 2016 2015 % Change 2016 % Change
Gross stock based compensation 8.3 4.6 80 5.1 63
Capitalized stock based compensation (2.5) (1.4) 79 (1.5) 67
Stock based compensation expense 5.8 3.2 81 3.6 61
Stock based compensation per boe $ 0.48 $ 0.45 7 $ 0.30 60
Stock based compensation is a non-cash expense. The fair value of stock based compensation is calculated using the Black-Scholes pricing model using estimates including the expected life of the instruments, stock price volatility and interest rates. The value of a stock option is calculated on the date of grant and that value is applied throughout the life of the instrument. Values are not restated for subsequent changes in estimated volatility rates, interest rates or underlying market values of the Company’s shares. Capitalized stock based compensation is attributable to personnel involved with the capital and infrastructure development of the Kakwa River Project.
Stock based compensation expense for the fourth quarter of 2016 increased by 81% to $5.8 million due to increased fair values with a higher stock price and new grants as compared to the same period in 2015.
Fourth quarter of 2016 stock based compensation expense was higher than the third quarter of 2016 by 61% attributable to the annual expense associated with compensation grants calculated in the middle of the third quarter.
SEVEN GENERATIONS 2016 Annual Report 39

Years ended December 31,
($ millions, except per boe data) 2016 2015 % Change
Gross stock based compensation 25.7 20.0 29
Capitalized stock based compensation (7.7) (6.0) 28
Stock based compensation expense 18.0 14.0 29
Stock based compensation per boe $ 0.42 $ 0.63 (33)
Stock based compensation for the year ended December 31, 2016 was $18.0 million, an increase of 29%, mostly attributable to increased value per award in 2016 as a result of the Company’s higher stock price.
Finance Expense
Three months ended December 31,
Three months ended September 30,
($ millions, except per boe data) 2016 2015 % Change 2016 % Change
Interest on senior notes 39.5 29.2 35 34.9 13
Revolving credit facility fees and other 1.9 1.8 6 2.7 (30)
Amortization of premium and debt issue costs – 0.2 nm 0.5 nm
Accretion 1.5 0.5 200 0.5 200
Total finance costs 42.9 31.7 35 38.6 11
Capitalized borrowing costs – (2.2) (100) – –
Finance expense 42.9 29.5 45 38.6 11
Finance expense – per boe $ 3.53 $ 4.13 (15) $ 3.17 11
Finance expense for the fourth quarter of 2016 increased 45% to $42.9 million primarily attributable to $14.0 million (US$10.5 million) of interest on the Acquired Notes. Finance expense per boe decreased with increasing production.
2016 fourth quarter finance expense was 11% higher than the third quarter of 2016 due to a pro-rated quarter of interest expense on the Acquired Notes, which were assumed at the closing of the Acquisition on August 18, 2016.
Years ended December 31,
($ millions, except per boe data) 2016 2015 % Change
Interest on senior notes 131.3 98.9 33
Revolving credit facility fees and other 7.5 5.5 36
Amortization of premium and debt issue costs 0.8 0.4 100
Accretion 2.8 1.7 65
Total finance costs 142.4 106.5 34
Capitalized borrowing costs (3.7) (4.4) (16)
Finance expense 138.7 102.1 36
Finance expense – per boe $ 3.22 $ 4.63 (30)
For the year ended December 31, 2016, finance expense increased 36% to $138.7 million, due to the additional interest obligation on the Acquired Notes, which bear interest at 6.875% per annum and higher standby fees calculated on the increased $1.1 billion credit facility. The average debt balance outstanding in 2016 was also higher as a result of the Company’s issue of US$425.0 million of 6.75% senior notes in April 2015.
The Company capitalized interest and financing costs of $3.7 million for the year ended December 31, 2016, related to the Cutbank natural gas processing facility, which came on-stream at the end of March 2016. Borrowing costs incurred for the construction of qualifying assets are capitalized during the period of time that is required to complete and prepare the assets for their intended use.
SEVEN GENERATIONS 2016 Annual Report40
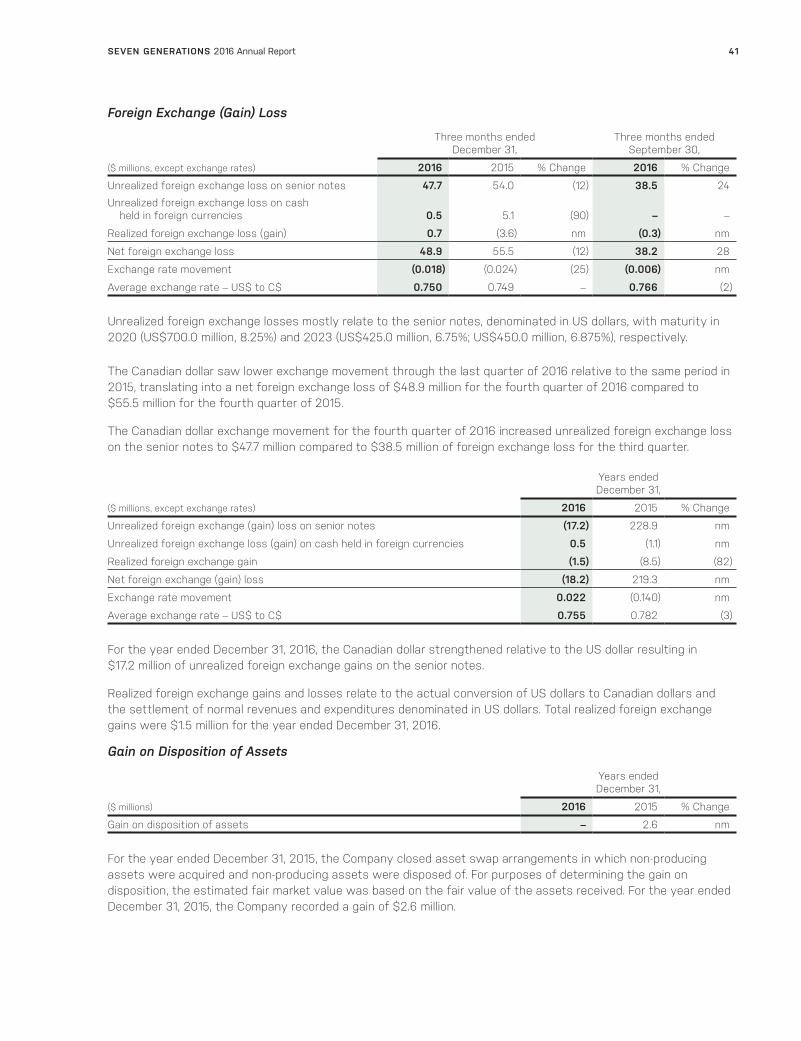
Foreign Exchange (Gain) Loss
Three months ended December 31,
Three months ended September 30,
($ millions, except exchange rates) 2016 2015 % Change 2016 % Change
Unrealized foreign exchange loss on senior notes 47.7 54.0 (12) 38.5 24
Unrealized foreign exchange loss on cash held in foreign currencies 0.5 5.1 (90) – –
Realized foreign exchange loss (gain) 0.7 (3.6) nm (0.3) nm
Net foreign exchange loss 48.9 55.5 (12) 38.2 28
Exchange rate movement (0.018) (0.024) (25) (0.006) nm
Average exchange rate – US$ to C$ 0.750 0.749 – 0.766 (2)
Unrealized foreign exchange losses mostly relate to the senior notes, denominated in US dollars, with maturity in 2020 (US$700.0 million, 8.25%) and 2023 (US$425.0 million, 6.75%; US$450.0 million, 6.875%), respectively.
The Canadian dollar saw lower exchange movement through the last quarter of 2016 relative to the same period in 2015, translating into a net foreign exchange loss of $48.9 million for the fourth quarter of 2016 compared to $55.5 million for the fourth quarter of 2015.
The Canadian dollar exchange movement for the fourth quarter of 2016 increased unrealized foreign exchange loss on the senior notes to $47.7 million compared to $38.5 million of foreign exchange loss for the third quarter.
Years ended December 31,
($ millions, except exchange rates) 2016 2015 % Change
Unrealized foreign exchange (gain) loss on senior notes (17.2) 228.9 nm
Unrealized foreign exchange loss (gain) on cash held in foreign currencies 0.5 (1.1) nm
Realized foreign exchange gain (1.5) (8.5) (82)
Net foreign exchange (gain) loss (18.2) 219.3 nm
Exchange rate movement 0.022 (0.140) nm
Average exchange rate – US$ to C$ 0.755 0.782 (3)
For the year ended December 31, 2016, the Canadian dollar strengthened relative to the US dollar resulting in $17.2 million of unrealized foreign exchange gains on the senior notes.
Realized foreign exchange gains and losses relate to the actual conversion of US dollars to Canadian dollars and the settlement of normal revenues and expenditures denominated in US dollars. Total realized foreign exchange gains were $1.5 million for the year ended December 31, 2016.
Gain on Disposition of Assets
Years ended December 31,
($ millions) 2016 2015 % Change
Gain on disposition of assets – 2.6 nm
For the year ended December 31, 2015, the Company closed asset swap arrangements in which non-producing assets were acquired and non-producing assets were disposed of. For purposes of determining the gain on disposition, the estimated fair market value was based on the fair value of the assets received. For the year ended December 31, 2015, the Company recorded a gain of $2.6 million.
SEVEN GENERATIONS 2016 Annual Report 41
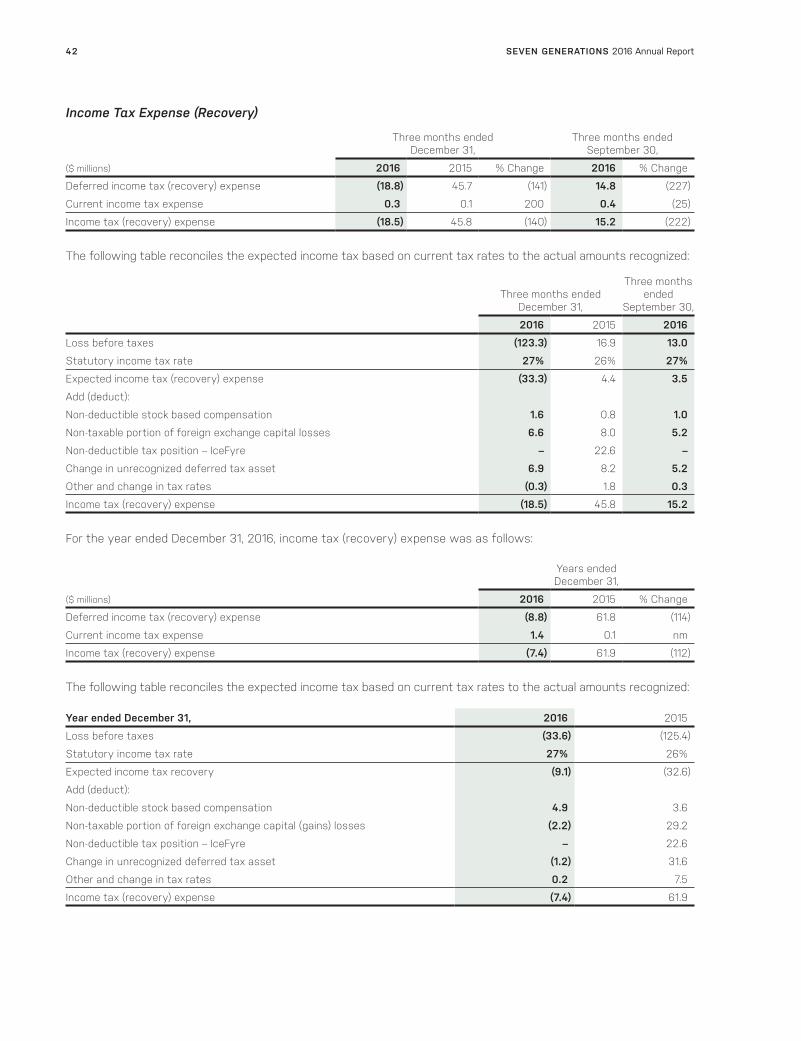
Income Tax Expense (Recovery)
Three months ended December 31,
Three months ended September 30,
($ millions) 2016 2015 % Change 2016 % Change
Deferred income tax (recovery) expense (18.8) 45.7 (141) 14.8 (227)
Current income tax expense 0.3 0.1 200 0.4 (25)
Income tax (recovery) expense (18.5) 45.8 (140) 15.2 (222)
The following table reconciles the expected income tax based on current tax rates to the actual amounts recognized:
Three months ended December 31,
Three months ended
September 30,
2016 2015 2016
Loss before taxes (123.3) 16.9 13.0
Statutory income tax rate 27% 26% 27%
Expected income tax (recovery) expense (33.3) 4.4 3.5
Add (deduct):
Non-deductible stock based compensation 1.6 0.8 1.0
Non-taxable portion of foreign exchange capital losses 6.6 8.0 5.2
Non-deductible tax position – IceFyre – 22.6 –
Change in unrecognized deferred tax asset 6.9 8.2 5.2
Other and change in tax rates (0.3) 1.8 0.3
Income tax (recovery) expense (18.5) 45.8 15.2
For the year ended December 31, 2016, income tax (recovery) expense was as follows:
Years ended December 31,
($ millions) 2016 2015 % Change
Deferred income tax (recovery) expense (8.8) 61.8 (114)
Current income tax expense 1.4 0.1 nm
Income tax (recovery) expense (7.4) 61.9 (112)
The following table reconciles the expected income tax based on current tax rates to the actual amounts recognized:
Year ended December 31, 2016 2015
Loss before taxes (33.6) (125.4)
Statutory income tax rate 27% 26%
Expected income tax recovery (9.1) (32.6)
Add (deduct):
Non-deductible stock based compensation 4.9 3.6
Non-taxable portion of foreign exchange capital (gains) losses (2.2) 29.2
Non-deductible tax position – IceFyre – 22.6
Change in unrecognized deferred tax asset (1.2) 31.6
Other and change in tax rates 0.2 7.5
Income tax (recovery) expense (7.4) 61.9
SEVEN GENERATIONS 2016 Annual Report42

For the year ended December 31, 2016, the Company recorded $1.4 million of current income tax expense relating to foreign sourced income earned from the Company’s subsidiary activity in the US compared to the prior year. The Company’s US activity commenced in December 2015.
Total tax pools in Canada at December 31, 2016 were $5.0 billion. Of this amount, $0.9 billion is available in 2016 for deduction in computing taxable income.
Acquisition
On July 6, 2016, the Company announced an agreement to acquire 155 net sections of additional Montney assets in the Kakwa River area valued at $1.9 billion. The Acquisition closed on August 18, 2016 and had an effective date of June 1, 2016. Total consideration for the Acquisition included $505.1 million in cash (including closing adjustments), the issuance of 33.5 million Common Shares valued at $965.1 million (based on the closing share price on August 18, 2016), the assumption of the Acquired Notes that are due in 2023 and the right, title and interest of certain oil and natural gas properties valued at $6.0 million. Transaction costs on the Acquisition were $7.4 million.
For the fourth quarter of 2016, acquired production contributed approximately 21.1 mboe/d. The acquisition increased Seven Generations’ total Montney acreage to more than 0.5 million net acres. The Company also assumed the processing and transportation commitments relating to the acquired Montney assets, resulting in a combined 55 MMcf/d of sweet gas processing and 200 MMcf/d of sour gas processing capacity.
Investment in Steelhead LNG
In the third quarter of 2016, the Company invested $25.8 million in Steelhead LNG (“Steelhead LNG”) for a 34% equity interest, which is reported in the consolidated financial statements using the equity method of accounting given the judgment that Seven Generations has significant influence.
Steelhead LNG also granted Seven Generations an option to increase its ownership interest to 50%, subject to certain conditions, which terminates upon the earlier of (i) one year from the Company’s investment in Steelhead LNG and (ii) thirty days from Steelhead LNG signing a binding offtake agreement that meets certain thresholds.
Steelhead LNG is a Vancouver-based energy company focused on the development of LNG projects in British Columbia.
For the year ended December 31, 2016, the Company’s share of Steelhead LNG Limited Partnership’s net loss was $3.9 million, which is recognized in market access initiatives expense in the Consolidated Statement of Operations.
Market Access Initiatives with Steelhead LNG
Concurrent with the investment in Steelhead LNG, the Company entered into a development arrangement with Steelhead LNG, in which the Company agreed to contribute $3.0 million in cash and committed to spend up to $9.0 million to participate in the pre-development of transportation alternatives to the West Coast of British Columbia. At December 31, 2016, the Company had incurred $1.1 million of the $9.0 million committed capital. Subsequent to year end, the Company was issued an additional 3.0 million units in Steelhead LNG for the $3.0 million cash contributed for the development arrangement.
Steelhead LNG and Seven Generations have also entered into an option agreement under which Seven Generations has an option to supply natural gas to any LNG facility developed by Steelhead LNG on the West Coast of British Columbia upon fulfillment of certain terms and conditions.
Due to common directorships and certain significant shareholders, these transactions were considered related party transactions and measured at the exchange value. Azimuth Capital Management (“Azimuth”) has a majority ownership in Steelhead LNG. Three of Seven Generations’ directors have professional ties to Azimuth.
At the end of each reporting period, the Company reviews for impairment indicators to ensure that the carrying value of its investments in associates is recoverable. At December 31, 2016, there were no indicators of impairment.
For the year ended December 31, 2016, the Company recorded $4.1 million included in market access initiatives expense in the Consolidated Statement of Operations for the costs incurred on pre-development of transportation alternatives.
SEVEN GENERATIONS 2016 Annual Report 43

Capital Investments
Three months ended December 31,
Three months ended September 30,
($ millions) 2016 2015 % Change 2016 % Change
Land and other (1) (2) 2.0 5.8 (66) 3.9 (49)
Drilling and completions (1) 186.7 181.1 3 133.4 40
Facilities and equipment 94.9 114.2 (17) 70.5 35
Total capital investments before acquisitions 283.6 301.1 (6) 207.8 36
(1) Certain comparative figures have been reclassified to conform to current period presentation. (2) Other includes capitalized salaries and benefits, capitalized interest and office investments.
For the fourth quarter of 2016, capital investments in the Kakwa River Project were $283.6 million, 6% lower than the same period in 2015 due to lower facilities and equipment investments. Two natural gas plants were under construction in the fourth quarter of 2015 accounting for a significant portion of the higher investment amount during that period.
The Company continued to innovate and optimize the drilling and completions of its Montney horizontal wells by drilling longer wells in a shorter time period and applying higher intensity completions. The Company’s well count included 12 rig released wells and 21 wells completed in the fourth quarter of 2016, lower by 45% and higher by 62%, respectively, compared to the same period in 2015. Metrics for 2016 fourth quarter wells drilled include an average cost of $1,405 per lateral meter, a decrease of 10% from 2015 due partially to shorter drilling days, with an average depth of 5,696 meters and an average horizontal length of 2,511 meters. Average proppant density of 2.9 tonnes per meter was used in the completion of the wells in the fourth quarter of 2016, up from 1.8 tonnes per meter for the same period in 2015. Drilling and completion per well costs were $9.3 million (drilling – $3.5 million; completions – $5.8 million), 9% lower than the fourth quarter of 2015 which averaged $10.2 million per well.
In the fourth quarter, Seven Generations invested $94.9 million in facilities and equipment attributable to the installation of the second Karr Stabilizer and work on the expansion of Super Pad 6. The expansion was 70% complete at year end. The Company began long lead equipment orders and front-end engineering design for the construction of the Company’s new natural gas processing plant, which is planned to have one train of 250 MMcf/d of processing capacity. Construction is expected to commence in the second quarter of 2017 with first production in mid-2018.
Compared to the third quarter of 2016, capital investments increased 36% in the fourth quarter due to the completion of more wells and an increase in facilities infrastructure related to advancements in the planning of the new natural gas processing plant.
Years ended December 31,
($ millions) 2016 2015 % Change
Land and other (1) (2) 16.6 17.2 (3)
Drilling and completions (1) 597.7 813.8 (27)
Facilities and equipment 363.7 478.0 (24)
Total capital investments before acquisitions 978.0 1,309.0 (25)
(1) Certain comparative figures have been reclassified to conform to current period presentation. (2) Other includes capitalized salaries and benefits, capitalized interest and office investments.
Total capital investment for the year ended December 31, 2016 decreased by 25% to $978.0 million partially attributable to lower activity but also cost savings of 19% in drilling and completing of wells compared to the same period in 2015. The Cutbank natural gas plant was commissioned ahead of schedule at the end of March 2016 and under budget by 25%. The Company constructed and commissioned three Super Pads in 2016 compared to six Super Pads in 2015. Seven Generations’ Super Pads are designed to facilitate raw gas dehydration and free liquid separation from the liquids rich natural gas, enabling a steady flow of production. The Company is adapting its field facility designs for the properties that were acquired as part of the Acquisition to incorporate some of the proven technology and design concepts that have been effective elsewhere in the Kakwa River Project.
SEVEN GENERATIONS 2016 Annual Report44

Seven Generations controls approximately 514,000 net acres of Montney land (over 544,000 net acres of land overall) with an average working interest of 96% on approximately 800 net Montney sections. At December 31, 2016, McDaniel estimated the Company’s Montney land to support approximately 1,195 net wells on a proved plus probable basis (2015 – 693), 79% of which are undrilled (2015 – 83% undrilled), and gross proved and probable reserves of 1,535 MMboe (2015 – 859 MMboe), an increase of 79% from 2015.
Liquidity and Capital Resources
The capital structure of the Company is as follows:
As at December 31,
($ millions) 2016 2015
Net debt (1) 1,528.8 1,251.0
Market capitalization (2) 10,968.7 3,429.5
Total capitalization 12,497.5 4,680.5
(1) See “Non-IFRS Financial Measures”. (2) Market capitalization is calculated using the total Common Shares outstanding at December 31, 2016 multiplied by the closing share price of
$31.31 at December 31, 2016 (closing share price of $13.48 at December 31, 2015).
The Company manages capital by maintaining a strong liquidity position and by focusing on financial strength through a prudent balance of debt and equity in its capital structure and by taking into account the level of risk being incurred in its capital investments. Due to the high quality, large size and long life of its assets, the Company aligns its goals and strategic objectives with investors that share a longer-term time horizon. The Company’s business plan targets a trailing ratio of net debt to funds from operations of less than 2.0; the ratio was 2.1 for the year ended December 31, 2016.
In February 2016, the Company completed a private placement of 21.4 million Common Shares at a price of $14.00 per share for net proceeds of approximately $287.0 million. In the third quarter of 2016, the Company’s lenders agreed to increase the borrowing capacity of the senior secured revolving credit arrangement from $850.0 million to $1.1 billion. At December 31, 2016, the credit facility was undrawn.
In August 2016, the Company closed the Acquisition with consideration comprised of $505.1 million in cash (including closing adjustments), the issuance of 33.5 million Common Shares ($965.1 million based on the closing share price on August 18, 2016), the assumption of the Acquired Notes (US$450 million) and the transfer of right, title and interest of certain oil and gas natural gas properties valued at $6.0 million. Concurrent with the Acquisition, the Company completed a bought-deal financing with the issuance of 30.7 million Subscription Receipts, which were converted to Common Shares automatically upon closing of the Acquisition, for net proceeds of $717.7 million. Net proceeds from the financing were used to fund the cash portion of the Acquisition and the remainder to the 2016 capital investment program.
The Company also has US$425.0 million of 6.75% senior notes, due in 2023 and US$700 million of 8.25% senior notes, due in 2020. Subject to certain exceptions and qualifications, the senior notes have no financial covenants but limit the Company’s ability to, among other things: make payments and distributions; incur additional indebtedness; issue disqualified or preferred stock; create or permit liens to exist; make certain dispositions; transfer assets; and engage in amalgamations, mergers or consolidations. At December 31, 2016, the Company was in compliance with the covenants on the senior notes.
Financial Instrument Classification and Measurement
The Company’s financial instruments include cash and cash equivalents, accounts receivable, deposits, risk management contracts, accounts payable and accrued liabilities, the credit facility and senior notes.
The Company’s financial instruments that are carried at fair value on the balance sheets include cash and cash equivalents and risk management contracts. The senior notes are carried at amortized cost, net of transaction costs and accrete to the principal balance on maturity using the effective interest rate method.
SEVEN GENERATIONS 2016 Annual Report 45

Seven Generations classifies the fair value of these instruments according to the following hierarchy based on the amount of observable inputs used to value the instrument.
• Level 1 – Quoted prices are available in active markets for identical assets or liabilities as of the reporting date. Active markets are those in which transactions occur in sufficient frequency and volume to provide pricing information.
• Level 2 – Pricing inputs are other than quoted prices in active markets included in Level 1. Prices in Level 2 are either directly or indirectly observable as of the reporting date. Level 2 valuations are based on inputs, including quoted forward prices for commodities, time value and volatility factors, which can be substantially observed in the marketplace.
• Level 3 – Valuations in this level are those inputs for the asset or liability that are not based on observable market data.
Cash and cash equivalents are classified as Level 1 measurements. Risk management contracts and fair value disclosure for the senior notes are classified as Level 2 measurements. Assessment of the significance of a particular input to the fair value measurement requires judgment and may affect the placement within the fair value hierarchy level. Seven Generations does not have any fair value measurements classified as Level 3. There were no transfers within the hierarchy in the years ended December 31, 2016 and 2015. The carrying value of the Company’s accounts receivable, deposits, accounts payable and accrued liabilities approximate their fair values due to the short-term maturity of these instruments.
The classification, carrying values and fair values of the Company’s financial instruments are as follows:
2016 2015
As at December 31, Carrying Value Fair Value Carrying Value Fair Value
Financial Assets
Fair Value Through Profit and Loss
Cash and cash equivalents 630.8 630.8 405.0 405.0
Risk management contracts – – 151.6 151.6
Loans and Receivables
Accounts receivable 181.9 181.9 76.4 76.4
Deposits 11.9 11.9 8.9 8.9
Financial Liabilities
Fair Value Through Profit and Loss
Risk management contracts 149.4 149.4 28.3 28.3
Other Financial Liabilities
Accounts payable and accrued liabilities 244.5 244.5 187.8 187.8
Senior notes 2,111.9 2,254.0 1,546.8 1,354.0
SEVEN GENERATIONS 2016 Annual Report46
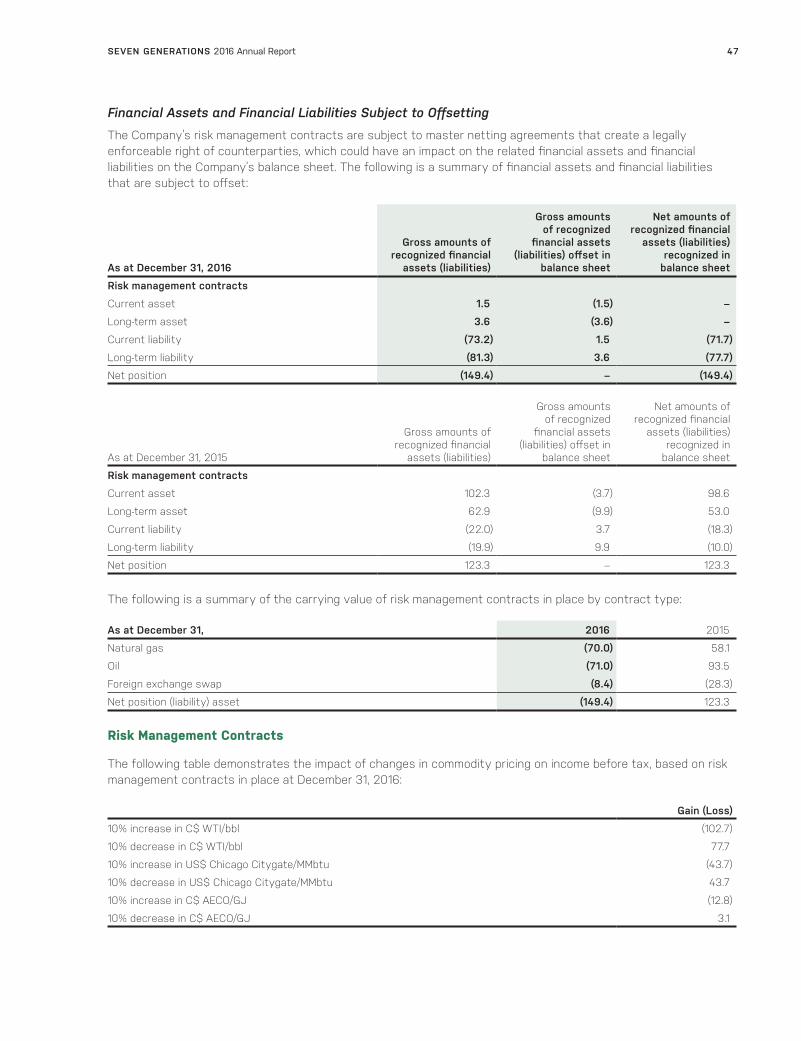
Financial Assets and Financial Liabilities Subject to Offsetting
The Company’s risk management contracts are subject to master netting agreements that create a legally enforceable right of counterparties, which could have an impact on the related financial assets and financial liabilities on the Company’s balance sheet. The following is a summary of financial assets and financial liabilities that are subject to offset:
As at December 31, 2016
Gross amounts of recognized financial
assets (liabilities)
Gross amounts of recognized
financial assets (liabilities) offset in
balance sheet
Net amounts of recognized financial
assets (liabilities) recognized in
balance sheet
Risk management contracts
Current asset 1.5 (1.5) –
Long-term asset 3.6 (3.6) –
Current liability (73.2) 1.5 (71.7)
Long-term liability (81.3) 3.6 (77.7)
Net position (149.4) – (149.4)
As at December 31, 2015
Gross amounts of recognized financial
assets (liabilities)
Gross amounts of recognized
financial assets (liabilities) offset in
balance sheet
Net amounts of recognized financial
assets (liabilities) recognized in
balance sheet
Risk management contracts
Current asset 102.3 (3.7) 98.6
Long-term asset 62.9 (9.9) 53.0
Current liability (22.0) 3.7 (18.3)
Long-term liability (19.9) 9.9 (10.0)
Net position 123.3 – 123.3
The following is a summary of the carrying value of risk management contracts in place by contract type:
As at December 31, 2016 2015
Natural gas (70.0) 58.1
Oil (71.0) 93.5
Foreign exchange swap (8.4) (28.3)
Net position (liability) asset (149.4) 123.3
Risk Management Contracts
The following table demonstrates the impact of changes in commodity pricing on income before tax, based on risk management contracts in place at December 31, 2016:
Gain (Loss)
10% increase in C$ WTI/bbl (102.7)
10% decrease in C$ WTI/bbl 77.7
10% increase in US$ Chicago Citygate/MMbtu (43.7)
10% decrease in US$ Chicago Citygate/MMbtu 43.7
10% increase in C$ AECO/GJ (12.8)
10% decrease in C$ AECO/GJ 3.1
SEVEN GENERATIONS 2016 Annual Report 47
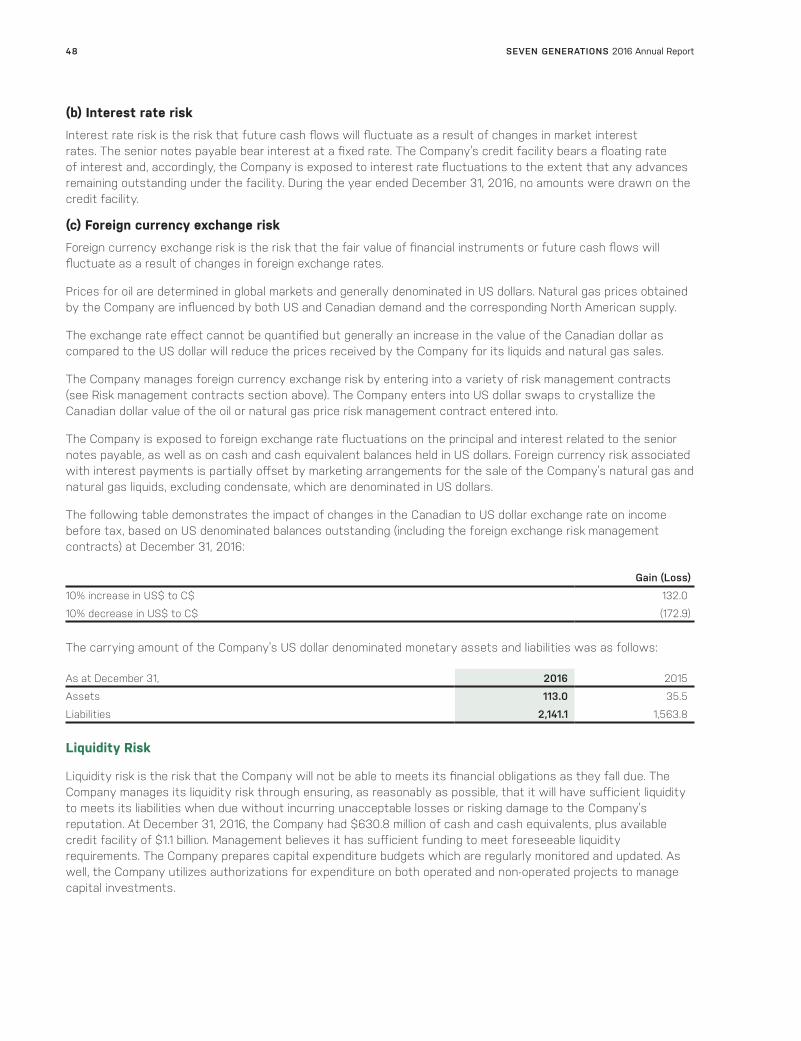
(b) Interest rate risk
Interest rate risk is the risk that future cash flows will fluctuate as a result of changes in market interest rates. The senior notes payable bear interest at a fixed rate. The Company’s credit facility bears a floating rate of interest and, accordingly, the Company is exposed to interest rate fluctuations to the extent that any advances remaining outstanding under the facility. During the year ended December 31, 2016, no amounts were drawn on the credit facility.
(c) Foreign currency exchange risk
Foreign currency exchange risk is the risk that the fair value of financial instruments or future cash flows will fluctuate as a result of changes in foreign exchange rates.
Prices for oil are determined in global markets and generally denominated in US dollars. Natural gas prices obtained by the Company are influenced by both US and Canadian demand and the corresponding North American supply.
The exchange rate effect cannot be quantified but generally an increase in the value of the Canadian dollar as compared to the US dollar will reduce the prices received by the Company for its liquids and natural gas sales.
The Company manages foreign currency exchange risk by entering into a variety of risk management contracts (see Risk management contracts section above). The Company enters into US dollar swaps to crystallize the Canadian dollar value of the oil or natural gas price risk management contract entered into.
The Company is exposed to foreign exchange rate fluctuations on the principal and interest related to the senior notes payable, as well as on cash and cash equivalent balances held in US dollars. Foreign currency risk associated with interest payments is partially offset by marketing arrangements for the sale of the Company’s natural gas and natural gas liquids, excluding condensate, which are denominated in US dollars.
The following table demonstrates the impact of changes in the Canadian to US dollar exchange rate on income before tax, based on US denominated balances outstanding (including the foreign exchange risk management contracts) at December 31, 2016:
Gain (Loss)
10% increase in US$ to C$ 132.0
10% decrease in US$ to C$ (172.9)
The carrying amount of the Company’s US dollar denominated monetary assets and liabilities was as follows:
As at December 31, 2016 2015
Assets 113.0 35.5
Liabilities 2,141.1 1,563.8
Liquidity Risk
Liquidity risk is the risk that the Company will not be able to meets its financial obligations as they fall due. The Company manages its liquidity risk through ensuring, as reasonably as possible, that it will have sufficient liquidity to meets its liabilities when due without incurring unacceptable losses or risking damage to the Company’s reputation. At December 31, 2016, the Company had $630.8 million of cash and cash equivalents, plus available credit facility of $1.1 billion. Management believes it has sufficient funding to meet foreseeable liquidity requirements. The Company prepares capital expenditure budgets which are regularly monitored and updated. As well, the Company utilizes authorizations for expenditure on both operated and non-operated projects to manage capital investments.
SEVEN GENERATIONS 2016 Annual Report48

The following are the contractual maturities of financial liabilities at December 31, 2016:
Less than 1 year 2-3 years 4-5 years Thereafter Total
Accounts payable and accrued liabilities 244.5 – – – 244.5
Risk management contracts 71.7 76.0 1.7 – 149.4
Senior notes (1) – – 939.9 1,174.9 2,114.8
Interest on senior notes (1) 157.6 315.2 189.2 113.7 775.7
Total 473.8 391.2 1,130.8 1,288.6 3,284.4(1) Balances denominated in US dollars have been translated at the December 31, 2016, US dollar to Canadian dollar exchange rate of 0.745.
Off-Balance Sheet Arrangements
The Company has certain fixed lease arrangements which were entered into in the normal course of operations. All material leases are classified as operating leases and the lease payments are included in operating expenses or G&A expenses depending on the nature of the lease. These arrangements are disclosed in Note 25 to the consolidated financial statements of the Company. No asset or liability has been recorded for these leases on the balance sheet at December 31, 2016 or 2015.
The Company enters into physical delivery contracts at the terminus of the Alliance Pipeline in Chicago and at the AECO hub in Alberta on a month-to-month and term contract basis. Pricing of the physical delivery contracts is based on published North American natural gas indices and fixed prices.
The following table illustrates the average daily volumes the Company has committed to deliver on a term contract basis as at December 31, 2016:
Alliance ChicagoExchange(MMBtu/d)
AECO Hub(GJ/d)Contracts expiring in the year ended December 31,
2017 207,500 22,600
2018 16,667 21,600
2019 – 19,800
Outstanding Share Data
The Company is authorized to issue an unlimited number of Class A Common Voting Shares and an unlimited number of Class B Common Non-Voting Shares without nominal or par value. As of the date of this MD&A, Seven Generations had 350,489,536 Class A Common Voting Shares, Nil Class B Common Non-Voting Shares, 11,054,709 stock options, 11,388,160 performance warrants, 337,891 Performance Share Units (“PSUs”), 224,775 Restricted Share Units and 95,970 Deferred Share Units outstanding.
The number of PSUs that vest on the applicable vesting date is the number of PSUs that are scheduled to vest on that vesting date, as specified in the applicable grant agreements, multiplied by the applicable adjustment factor. The adjustment factor, which may range from 0.0 to 2.0, is based on the achievement of certain performance criteria, including the performance of the Company relative to a performance peer group consisting of companies determined by the Board of Directors’ Human Resources and Compensation Committee. In calculating stock based compensation for the PSUs in 2015, the Company used an adjustment factor of 1.0, which assumes that the Company will be within the 50% percentile of its relative peer group, based on total shareholder return at the respective vesting dates. Upon vesting in May 2016, the performance criteria for the first tranche of vested PSUs met the highest adjustment factor of 2.0 for total shareholder return relative to the Company’s peer group. Assuming the highest adjustment factor, the maximum number of Common Shares issuable pursuant to the outstanding PSUs is 675,782.
SEVEN GENERATIONS 2016 Annual Report 49

Contractual Obligations
Seven Generations enters into contractual obligations in the ordinary course of conducting its business. The following table lists the Company’s estimated material contractual obligations at December 31, 2016:
TotalLess than
1 year 1-3 years 4-5 years Thereafter
Senior notes (1) 2,114.7 – – 939.9 1,174.8
Interest on senior notes 775.7 157.6 315.2 189.2 113.7
Firm transportation and processing agreements (2) 4,172.0 364.0 848.2 912.3 2,047.5
Operating leases (3) 26.0 3.8 7.6 6.6 8.0
Estimated contractual obligations 7,088.4 525.4 1,171.0 2,048.0 3,344.0
(1) Balance represents US$1.6 billion principal converted to Canadian dollars at the closing exchange rate for the period end. (2) Subject to completion of certain pipeline and facility upgrades by a counterparty transportation company. (3) The Company is committed under operating leases for office premises.
The following table outlines the take or pay obligations, on average over the next five years under the Company’s significant transportation and processing agreements:
2017 2018 2019 2020 2021 Expiring (1)
Transportation
Condensate and oil
Pembina (mbbls/d) 28.7 42.2 42.4 49.0 55.3 June 30, 2030
Natural gas
Alliance (MMcf/d) 435 467 500 500 500 October 31, 2022
NGTL (MMcf/d) 158 293 368 363 349 June 30, 2026 (2)
NGPL (dth/d) (4) 100 83 – – – October 31, 2018
NGLs
Pembina (mbbls/d) 15.8 19.8 19.8 22.3 24.8 June 30, 2030 (3)
Processing
Natural gas (MMcf/d) 154 174 194 200 200 April 20, 2036
NGLs (mbbls/d) 35.5 34.9 33.8 33.8 33.8 March 31, 2028 (3)
(1) When lines include multiple contracts of various expiration dates, the latest expiration date has been referenced. (2) The timing of the firm commitments under the agreement with Nova Gas Transmission Ltd. (“NGTL”), a wholly owned subsidiary of
TransCanada Corporation, is dependent upon the completion of NGTL system expansion, which is expected mid-2018.(3) The timing of the firm commitments under the agreement with Pembina is dependent upon the completion of the Phase 3 expansion, which is
expected July 1, 2017. (4) Natural Gas Pipeline Company of America LLC (“NGPL”).
Critical Accounting Policies and Estimates
A summary of the Company’s significant accounting policies can be found in Notes 3 and 4 to the audited consolidated financial statements for the years ended December 31, 2016 and 2015. The preparation of consolidated financial statements in accordance with IFRS requires management to make judgments, estimates and assumptions that affect the reported amounts of assets, liabilities, income and expenses. The financial and operating results of Seven Generations incorporate certain estimates including:
• estimated revenues, royalties and operating expenses on production as at a specific reporting date but for which actual revenues and costs have not yet been received;
• estimated capital expenditures on projects that are in progress;
• estimated depletion, depreciation and amortization charges that are based on estimates of oil and natural gas reserves, and future costs to develop those reserves, that Seven Generations expects to recover in the future;
• estimated fair values of financial instruments that are subject to fluctuation depending on the underlying commodity prices, foreign exchange rates and interest rates, volatility curves and the risk of non-performance;
SEVEN GENERATIONS 2016 Annual Report50

• estimated value of decommissioning obligations that are dependent upon estimates of future costs and timing of expenditures;
• estimated future recoverable value of oil and natural gas properties and goodwill and any associated impairment charges or recoveries; and
• estimated compensation expense under Seven Generations’ share-based compensation plans.
Seven Generations employs individuals who have the skills required to make such estimates and ensures that individuals or departments with the most knowledge of the activity are responsible for the estimates. Further, past estimates are reviewed and compared to actual results, and actual results are compared to budgets in order to make more informed decisions on future estimates. For further information on the determination of certain estimates inherent in the consolidated financial statements, refer to Note 5 “Significant Accounting Judgments, Estimates and Assumptions” in the audited consolidated financial statements for the years ended December 31, 2016 and 2015.
Risk Assessment
The acquisition, exploration and development of oil and natural gas properties and the production, transportation and marketing of oil and natural gas involves many risks, which may influence the ultimate success of the Company. While the management of Seven Generations realizes these risks cannot be eliminated, they are committed to monitoring and mitigating these risks. These risks include, but are not limited to the following:
• volatility in market prices and demand for oil, NGLs and natural gas and hedging activities related thereto;
• general economic, business and industry conditions;
• variance of the Company’s actual capital costs, operating costs and economic returns from those anticipated;
• the ability to find, develop or acquire additional reserves and the availability of the capital or financing necessary to do so on satisfactory terms;
• risks related to the exploration, development and production of oil and natural gas reserves and resources;
• negative public perception of oil sands development, oil and natural gas development and transportation, hydraulic fracturing and fossil fuels;
• actions by governmental authorities, including changes in government regulation, royalties and taxation;
• potential legislative and regulatory changes, including changes that may be implemented following the 2016 US presidential election;
• the rescission, or amendment to the conditions of, groundwater licenses of the Company;
• management of the Company’s growth;
• the ability to successfully identify and make attractive acquisitions, joint ventures or investments, or successfully integrate future acquisitions or businesses;
• the availability, cost or shortage of rigs, equipment, raw materials, supplies or qualified personnel;
• adoption or modification of climate change legislation by governments;
• the absence or loss of key employees;
• uncertainty associated with estimates of oil, NGLs and natural gas reserves and resources and the variance of such estimates from actual future production;
• dependence upon compressors, gathering lines, pipelines and other facilities, certain of which the Company does not control;
• the ability to satisfy obligations under the Company’s firm commitment transportation arrangements;
• the uncertainties related to the Company’s identified drilling locations;
• the high-risk nature of successfully stimulating well productivity and drilling for and producing oil, NGLs and natural gas;
SEVEN GENERATIONS 2016 Annual Report 51
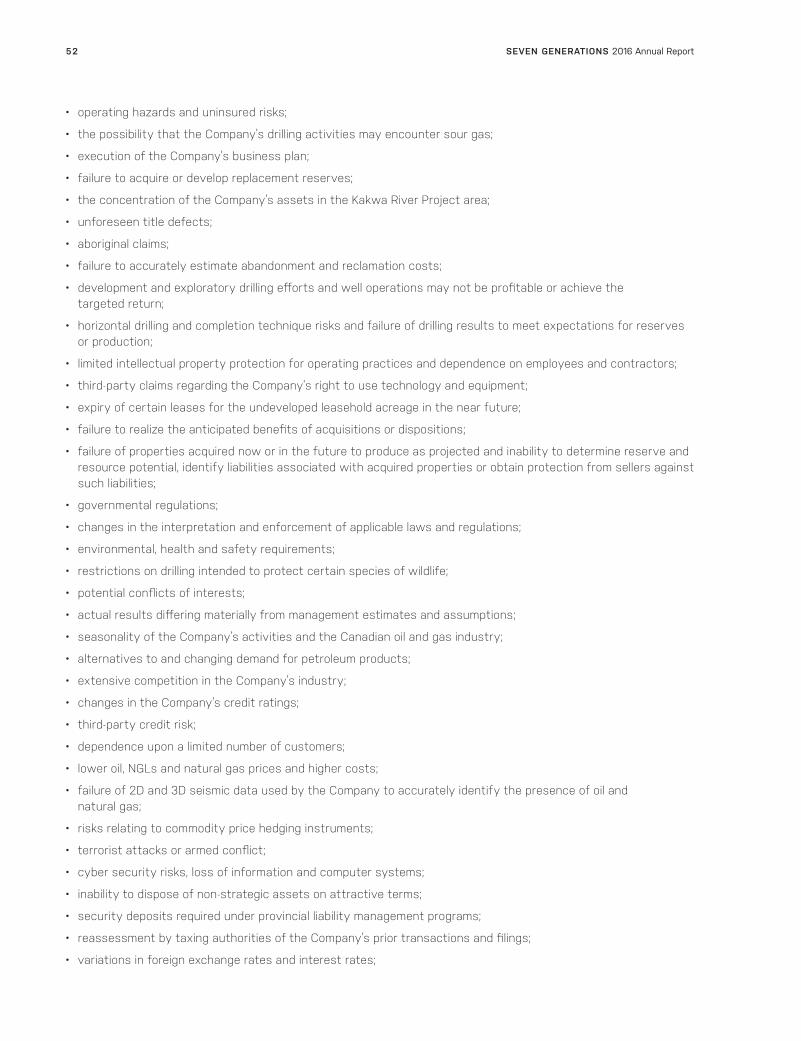
• operating hazards and uninsured risks;
• the possibility that the Company’s drilling activities may encounter sour gas;
• execution of the Company’s business plan;
• failure to acquire or develop replacement reserves;
• the concentration of the Company’s assets in the Kakwa River Project area;
• unforeseen title defects;
• aboriginal claims;
• failure to accurately estimate abandonment and reclamation costs;
• development and exploratory drilling efforts and well operations may not be profitable or achieve the targeted return;
• horizontal drilling and completion technique risks and failure of drilling results to meet expectations for reserves or production;
• limited intellectual property protection for operating practices and dependence on employees and contractors;
• third-party claims regarding the Company’s right to use technology and equipment;
• expiry of certain leases for the undeveloped leasehold acreage in the near future;
• failure to realize the anticipated benefits of acquisitions or dispositions;
• failure of properties acquired now or in the future to produce as projected and inability to determine reserve and resource potential, identify liabilities associated with acquired properties or obtain protection from sellers against such liabilities;
• governmental regulations;
• changes in the interpretation and enforcement of applicable laws and regulations;
• environmental, health and safety requirements;
• restrictions on drilling intended to protect certain species of wildlife;
• potential conflicts of interests;
• actual results differing materially from management estimates and assumptions;
• seasonality of the Company’s activities and the Canadian oil and gas industry;
• alternatives to and changing demand for petroleum products;
• extensive competition in the Company’s industry;
• changes in the Company’s credit ratings;
• third-party credit risk;
• dependence upon a limited number of customers;
• lower oil, NGLs and natural gas prices and higher costs;
• failure of 2D and 3D seismic data used by the Company to accurately identify the presence of oil and natural gas;
• risks relating to commodity price hedging instruments;
• terrorist attacks or armed conflict;
• cyber security risks, loss of information and computer systems;
• inability to dispose of non-strategic assets on attractive terms;
• security deposits required under provincial liability management programs;
• reassessment by taxing authorities of the Company’s prior transactions and filings;
• variations in foreign exchange rates and interest rates;
SEVEN GENERATIONS 2016 Annual Report52

• third-party credit risk including risk associated with counterparties in risk management activities related to commodity prices and foreign exchange rates;
• sufficiency of insurance policies;
• potential for litigation;
• variation in future calculations of non-IFRS measures;
• sufficiency of internal controls;
• breach of agreements by third parties;
• impact of expansion into new activities on risk exposure;
• inability of the Company to respond quickly to competitive pressures; and
• the risks related to the Common Shares that are publicly traded and the senior notes and other indebtedness.
For additional information regarding the risks that the Company is exposed to, see the disclosure provided under the heading “Risk Factors” in the AIF, which is available on the SEDAR website at www.sedar.com.
Changes In Accounting Policies
Changes in Accounting Policies
There were no material new or amended accounting standards adopted during the year ended December 31, 2016.
Future Accounting Policy Changes
In February 2014, the International Accounting Standards Board (“IASB”) issued IFRS 9 “Financial Instruments”, which replaces IAS 39, “Financial Instruments: Recognition and Measurement” for annual periods beginning on or after January 1, 2018, with earlier adoption permitted. IFRS 9 includes a principle-based approach for classification and measurement of financial assets, a single expected loss impairment model and a substantially-reformed approach to hedge accounting. The impact of the standard has been evaluated and is expected to have no material impact on the Company’s consolidated financial statements.
In May 2014, the IASB issued IFRS 15 “Revenue from Contracts with Customers”, which replaces IAS 18 “Revenue”, IAS 11 “Construction Contracts” and related interpretations. In July 2015, the IASB issued an amendment to IFRS 15, deferring the effective date by one year. IFRS 15 provides clarification for recognizing revenue from contracts with customers and establishes a single revenue recognition and measurement framework. The standard is required to be adopted either retrospectively or using a modified transition approach for annual periods beginning on or after January 1, 2018, with earlier adoption permitted. The impact of the standard has been evaluated and is expected to have no material impact on the Company’s consolidated financial statements. Additional disclosure may be required upon implementation of IFRS 15 that help provide sufficient information to enable users to understand the nature, amount, timing, and uncertainty of revenue and cash flows arising from the contracts with customers.
In January 2016, the IASB issued IFRS 16 “Leases” which replaces IAS 17 “Leases” for annual periods beginning on or after January 1, 2019, with earlier application permitted if IFRS 15 “Revenue from Contracts with Customers” is also applied. Under IFRS 16, lessees are required to recognize a lease liability reflecting future lease payments and a ‘right-of-use asset’ for virtually all lease contracts. The Company is currently evaluating the impact of the standard on the consolidated financial statements.
In April 2016, the IASB issued amendments to IAS 7 “Statement of Cash Flows” and IAS 12 “Income Taxes” for annual periods beginning on or after January 1, 2017, with earlier application permitted. IAS 7 and IAS 12 have been revised to incorporate amendments issued by the IASB in January 2016. The amendments to IAS 7 require entities to provide disclosures that enable users of financial statements to evaluate changes in liabilities arising from financing activities. The impact of the standard has been evaluated and is not expected to have material impact on the Company’s consolidated financial statements. Additional disclosure will be required on implementation of IAS 7 that provides a reconciliation between the opening and closing balances in the statement of financial position for liabilities arising from financing activities. The amendments to IAS 12 clarify how to account for deferred tax assets related to debt instruments measured at fair value. As the Company measures its debt instruments at amortized cost, the standard has no material impact on the Company’s consolidated financial statements.
SEVEN GENERATIONS 2016 Annual Report 53
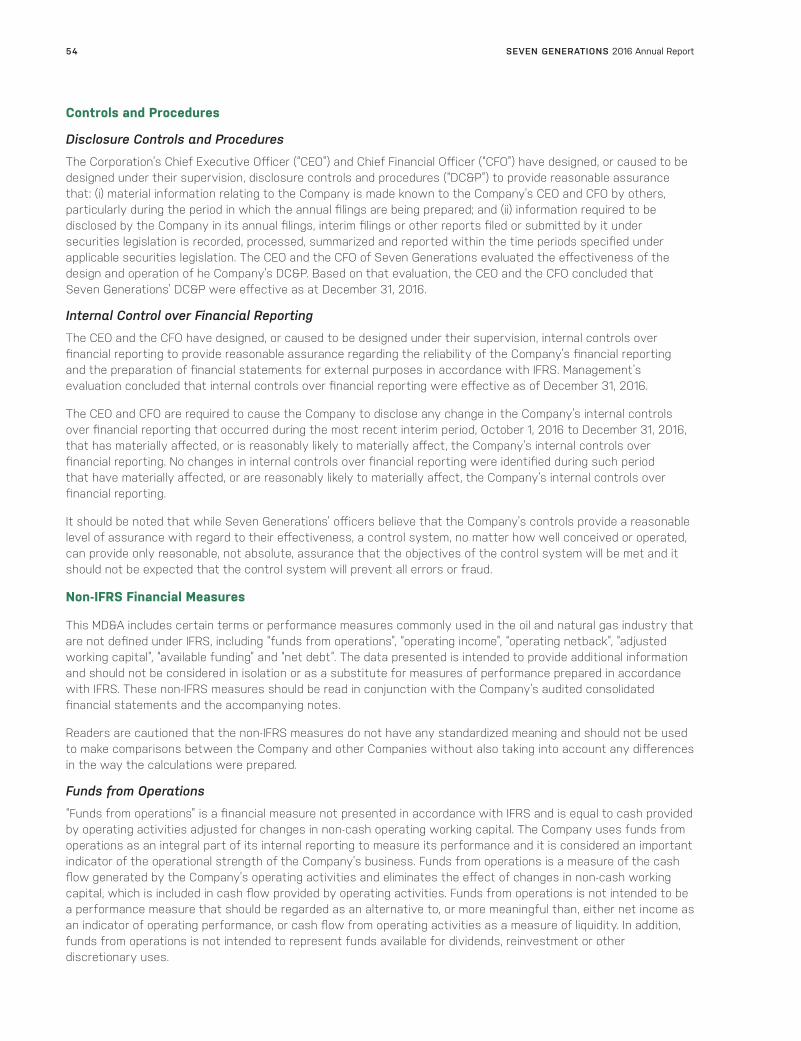
Controls and Procedures
Disclosure Controls and Procedures
The Corporation’s Chief Executive Officer (“CEO”) and Chief Financial Officer (“CFO”) have designed, or caused to be designed under their supervision, disclosure controls and procedures (“DC&P”) to provide reasonable assurance that: (i) material information relating to the Company is made known to the Company’s CEO and CFO by others, particularly during the period in which the annual filings are being prepared; and (ii) information required to be disclosed by the Company in its annual filings, interim filings or other reports filed or submitted by it under securities legislation is recorded, processed, summarized and reported within the time periods specified under applicable securities legislation. The CEO and the CFO of Seven Generations evaluated the effectiveness of the design and operation of he Company’s DC&P. Based on that evaluation, the CEO and the CFO concluded that Seven Generations’ DC&P were effective as at December 31, 2016.
Internal Control over Financial Reporting
The CEO and the CFO have designed, or caused to be designed under their supervision, internal controls over financial reporting to provide reasonable assurance regarding the reliability of the Company’s financial reporting and the preparation of financial statements for external purposes in accordance with IFRS. Management’s evaluation concluded that internal controls over financial reporting were effective as of December 31, 2016.
The CEO and CFO are required to cause the Company to disclose any change in the Company’s internal controls over financial reporting that occurred during the most recent interim period, October 1, 2016 to December 31, 2016, that has materially affected, or is reasonably likely to materially affect, the Company’s internal controls over financial reporting. No changes in internal controls over financial reporting were identified during such period that have materially affected, or are reasonably likely to materially affect, the Company’s internal controls over financial reporting.
It should be noted that while Seven Generations’ officers believe that the Company’s controls provide a reasonable level of assurance with regard to their effectiveness, a control system, no matter how well conceived or operated, can provide only reasonable, not absolute, assurance that the objectives of the control system will be met and it should not be expected that the control system will prevent all errors or fraud.
Non-IFRS Financial Measures
This MD&A includes certain terms or performance measures commonly used in the oil and natural gas industry that are not defined under IFRS, including “funds from operations”, “operating income”, “operating netback”, “adjusted working capital”, “available funding” and “net debt”. The data presented is intended to provide additional information and should not be considered in isolation or as a substitute for measures of performance prepared in accordance with IFRS. These non-IFRS measures should be read in conjunction with the Company’s audited consolidated financial statements and the accompanying notes.
Readers are cautioned that the non-IFRS measures do not have any standardized meaning and should not be used to make comparisons between the Company and other Companies without also taking into account any differences in the way the calculations were prepared.
Funds from Operations
“Funds from operations” is a financial measure not presented in accordance with IFRS and is equal to cash provided by operating activities adjusted for changes in non-cash operating working capital. The Company uses funds from operations as an integral part of its internal reporting to measure its performance and it is considered an important indicator of the operational strength of the Company’s business. Funds from operations is a measure of the cash flow generated by the Company’s operating activities and eliminates the effect of changes in non-cash working capital, which is included in cash flow provided by operating activities. Funds from operations is not intended to be a performance measure that should be regarded as an alternative to, or more meaningful than, either net income as an indicator of operating performance, or cash flow from operating activities as a measure of liquidity. In addition, funds from operations is not intended to represent funds available for dividends, reinvestment or other discretionary uses.
SEVEN GENERATIONS 2016 Annual Report54
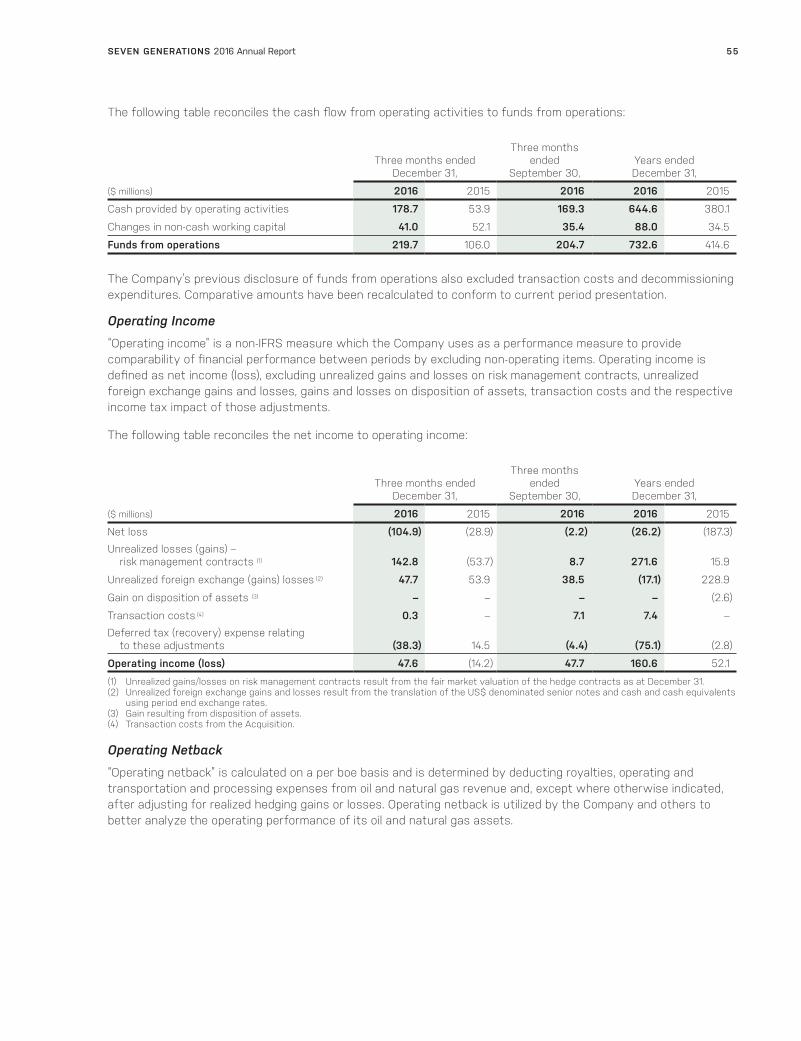
The following table reconciles the cash flow from operating activities to funds from operations:
Three months ended December 31,
Three monthsended
September 30,Years ended December 31,
($ millions) 2016 2015 2016 2016 2015
Cash provided by operating activities 178.7 53.9 169.3 644.6 380.1
Changes in non-cash working capital 41.0 52.1 35.4 88.0 34.5
Funds from operations 219.7 106.0 204.7 732.6 414.6
The Company’s previous disclosure of funds from operations also excluded transaction costs and decommissioning expenditures. Comparative amounts have been recalculated to conform to current period presentation.
Operating Income
“Operating income” is a non-IFRS measure which the Company uses as a performance measure to provide comparability of financial performance between periods by excluding non-operating items. Operating income is defined as net income (loss), excluding unrealized gains and losses on risk management contracts, unrealized foreign exchange gains and losses, gains and losses on disposition of assets, transaction costs and the respective income tax impact of those adjustments.
The following table reconciles the net income to operating income:
Three months ended December 31,
Three monthsended
September 30,Years ended December 31,
($ millions) 2016 2015 2016 2016 2015
Net loss (104.9) (28.9) (2.2) (26.2) (187.3)
Unrealized losses (gains) – risk management contracts (1) 142.8 (53.7) 8.7 271.6 15.9
Unrealized foreign exchange (gains) losses (2) 47.7 53.9 38.5 (17.1) 228.9
Gain on disposition of assets (3) – – – – (2.6)
Transaction costs (4) 0.3 – 7.1 7.4 –
Deferred tax (recovery) expense relating to these adjustments (38.3) 14.5 (4.4) (75.1) (2.8)
Operating income (loss) 47.6 (14.2) 47.7 160.6 52.1
(1) Unrealized gains/losses on risk management contracts result from the fair market valuation of the hedge contracts as at December 31. (2) Unrealized foreign exchange gains and losses result from the translation of the US$ denominated senior notes and cash and cash equivalents
using period end exchange rates. (3) Gain resulting from disposition of assets. (4) Transaction costs from the Acquisition.
Operating Netback
“Operating netback” is calculated on a per boe basis and is determined by deducting royalties, operating and transportation and processing expenses from oil and natural gas revenue and, except where otherwise indicated, after adjusting for realized hedging gains or losses. Operating netback is utilized by the Company and others to better analyze the operating performance of its oil and natural gas assets.
SEVEN GENERATIONS 2016 Annual Report 55
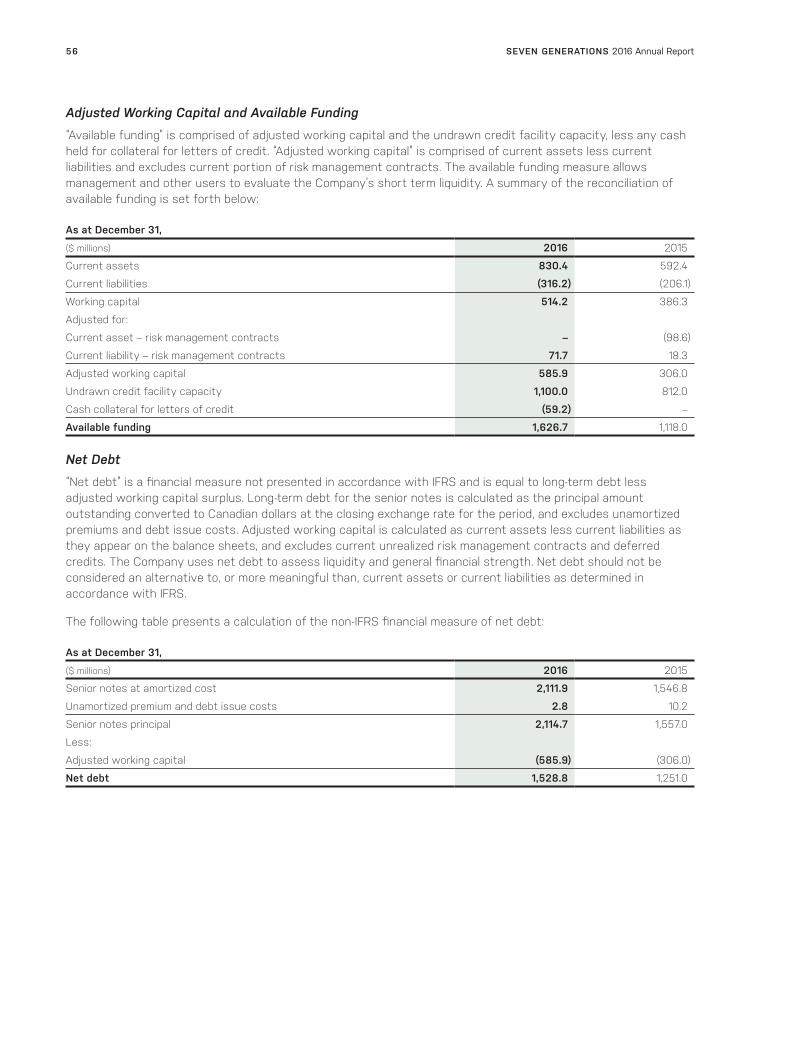
Adjusted Working Capital and Available Funding
“Available funding” is comprised of adjusted working capital and the undrawn credit facility capacity, less any cash held for collateral for letters of credit. “Adjusted working capital” is comprised of current assets less current liabilities and excludes current portion of risk management contracts. The available funding measure allows management and other users to evaluate the Company’s short term liquidity. A summary of the reconciliation of available funding is set forth below:
As at December 31,
($ millions) 2016 2015
Current assets 830.4 592.4
Current liabilities (316.2) (206.1)
Working capital 514.2 386.3
Adjusted for:
Current asset – risk management contracts – (98.6)
Current liability – risk management contracts 71.7 18.3
Adjusted working capital 585.9 306.0
Undrawn credit facility capacity 1,100.0 812.0
Cash collateral for letters of credit (59.2) –
Available funding 1,626.7 1,118.0
Net Debt
“Net debt” is a financial measure not presented in accordance with IFRS and is equal to long-term debt less adjusted working capital surplus. Long-term debt for the senior notes is calculated as the principal amount outstanding converted to Canadian dollars at the closing exchange rate for the period, and excludes unamortized premiums and debt issue costs. Adjusted working capital is calculated as current assets less current liabilities as they appear on the balance sheets, and excludes current unrealized risk management contracts and deferred credits. The Company uses net debt to assess liquidity and general financial strength. Net debt should not be considered an alternative to, or more meaningful than, current assets or current liabilities as determined in accordance with IFRS.
The following table presents a calculation of the non-IFRS financial measure of net debt:
As at December 31,
($ millions) 2016 2015
Senior notes at amortized cost 2,111.9 1,546.8
Unamortized premium and debt issue costs 2.8 10.2
Senior notes principal 2,114.7 1,557.0
Less:
Adjusted working capital (585.9) (306.0)
Net debt 1,528.8 1,251.0
SEVEN GENERATIONS 2016 Annual Report56
Selected Quarterly InformationFor the 2016 and 2015 comparative quarter periods, the Company’s total production has steadily increased over the past eight quarters due to a successful drilling program with added production from the Acquisition. The Company has continued to see positive funds from operations despite a volatile commodity price environment.
Total capital investments have fluctuated primarily due to the timing of investments in drilling and infrastructure development. The Company’s balance sheet has remained strong with total assets continuing to increase proportionately higher in comparison to debt outstanding.
Changes to comparative quarter periods for 2016 and 2015, net income (loss) are attributable to variations in operating income as the Company’s operations grow and mature as well as unrealized hedging fluctuations and the impact of foreign exchange changes on the US dollar denominated senior notes.
SEVEN GENERATIONS 2016 Annual Report 57

Selected Quarterly Information($ millions, except per share amounts, production rates and unit prices) Q4 2016 Q3 2016 Q2 2016 Q1 2016 YE 2016
FINANCIAL
Liquids and natural gas sales 409.8 361.7 287.4 188.0 1,246.9
Realized hedging gains 5.8 19.2 29.5 36.3 90.8
Interest, processing and third party income 1.3 1.5 1.1 0.8 4.7
Royalties (2) (11.9) (0.4) 18.6 (13.0) (6.7)
Operating expenses (59.1) (47.0) (44.8) (31.0) (181.9)
Transportation and processing (3) (72.0) (74.7) (56.2) (35.7) (238.6)
General and administrative (4) (10.8) (14.7) (10.0) (8.0) (43.5)
Interest expense (4) (41.3) (37.7) (29.2) (26.9) (135.1)
Foreign exchange loss (4) (0.7) 0.3 1.7 0.2 1.5
Other (1.4) (3.5) (0.5) (0.1) (5.5)
Funds from operations (1) 219.7 204.7 197.6 110.6 732.6
Per share – diluted 0.60 0.62 0.66 0.40 2.30
Operating income (1) 47.6 47.7 56.0 9.3 160.6
Per share – diluted 0.13 0.15 0.19 0.03 0.50
Net income (loss) (104.9) (2.2) (57.5) 138.4 (26.2)
Per share – diluted (0.30) (0.01) (0.21) 0.50 (0.09)
Capital investments:
Land and other 2.0 3.9 3.6 7.1 16.6
Drilling and completions 186.7 133.4 125.0 152.6 597.7
Facilities and equipment 94.9 70.5 90.7 107.6 363.7
Total capital investments (before acquisitions) 283.6 207.8 219.3 267.3 978.0
Total assets 6,602.4 6,401.2 4,004.5 4,126.2 6,602.4
Available funding (1) 1,626.7 1,673.4 1,246.1 1,260.4 1,626.7
Net debt (1) 1,528.8 1,436.6 1,020.1 1,013.4 1,528.8
Debt outstanding 2,111.9 2,063.0 1,443.9 1,451.5 2,111.9
OPERATING
Average daily production
Oil and condensate (mbbls/d) 43.2 46.5 38.8 28.4 39.3
NGLs (mbbls/d) 33.4 33.8 30.2 22.6 30.0
Natural gas (MMcf/d) 334 314 290 225 291
Total (mboe/d) 132.3 132.6 117.4 88.5 117.8
Realized prices
Oil and condensate ($/bbl) 56.96 49.93 52.05 39.92 50.59
NGLs ($/bbl) 18.23 11.23 12.49 8.96 13.08
Natural gas ($/Mcf) 4.15 3.92 2.62 3.24 3.53
OPERATING NETBACK (1) ($/boe)
Liquids and natural gas revenues $ 33.67 $ 29.65 $ 26.91 $ 23.34 $ 28.92
Realized hedging gain 0.48 1.57 2.77 4.51 2.11
Royalties (0.98) (0.03) 1.74 (1.61) (0.16)
Operating expenses (4.86) (3.85) (4.20) (3.85) (4.22)
Transportation and processing (5.92) (6.12) (5.26) (4.43) (5.53)
Operating netback after hedging $ 22.39 $ 21.22 $ 21.96 $ 17.96 $ 21.12
(1) See “Non-IFRS Financial Measures”. (2) Includes $27.4 million ($20.0 million after tax) of prior period royalty recoveries for the year ended December 31, 2016, recognized in Q2 2016. (3) Certain comparative figures have been reclassified to conform to current period presentation. (4) Excludes non-cash items.
SEVEN GENERATIONS 2016 Annual Report58
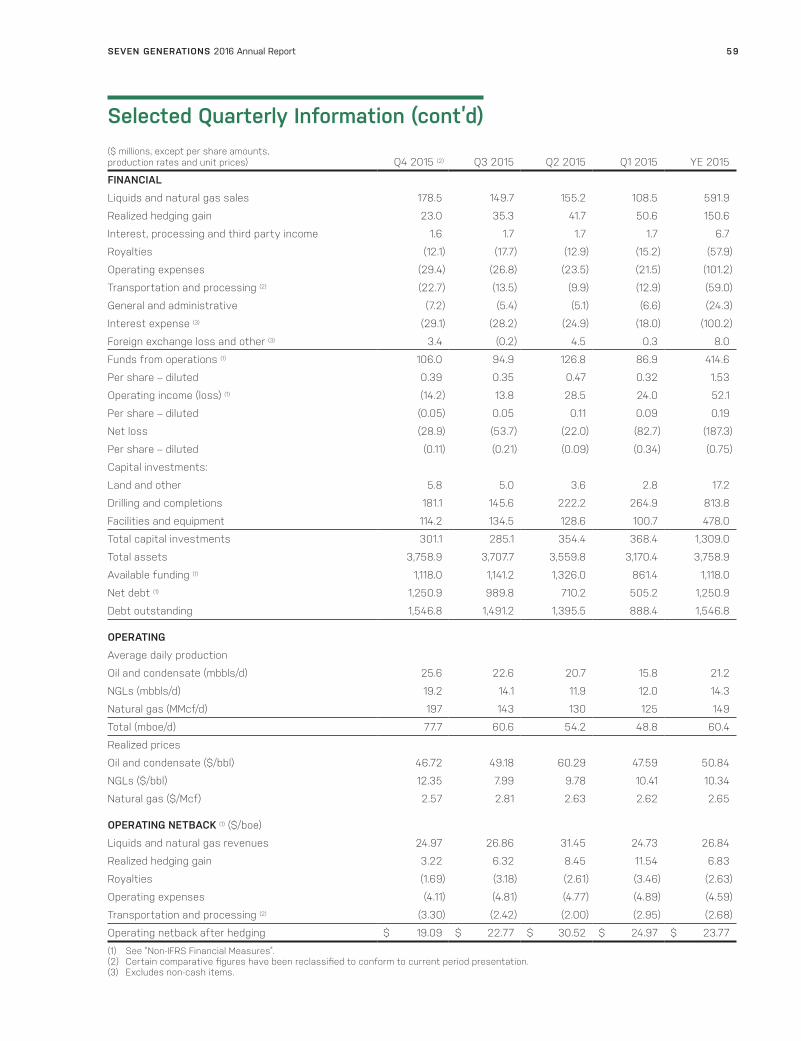
Selected Quarterly Information (cont’d)($ millions, except per share amounts, production rates and unit prices) Q4 2015 (2) Q3 2015 Q2 2015 Q1 2015 YE 2015
FINANCIAL
Liquids and natural gas sales 178.5 149.7 155.2 108.5 591.9
Realized hedging gain 23.0 35.3 41.7 50.6 150.6
Interest, processing and third party income 1.6 1.7 1.7 1.7 6.7
Royalties (12.1) (17.7) (12.9) (15.2) (57.9)
Operating expenses (29.4) (26.8) (23.5) (21.5) (101.2)
Transportation and processing (2) (22.7) (13.5) (9.9) (12.9) (59.0)
General and administrative (7.2) (5.4) (5.1) (6.6) (24.3)
Interest expense (3) (29.1) (28.2) (24.9) (18.0) (100.2)
Foreign exchange loss and other (3) 3.4 (0.2) 4.5 0.3 8.0
Funds from operations (1) 106.0 94.9 126.8 86.9 414.6
Per share – diluted 0.39 0.35 0.47 0.32 1.53
Operating income (loss) (1) (14.2) 13.8 28.5 24.0 52.1
Per share – diluted (0.05) 0.05 0.11 0.09 0.19
Net loss (28.9) (53.7) (22.0) (82.7) (187.3)
Per share – diluted (0.11) (0.21) (0.09) (0.34) (0.75)
Capital investments:
Land and other 5.8 5.0 3.6 2.8 17.2
Drilling and completions 181.1 145.6 222.2 264.9 813.8
Facilities and equipment 114.2 134.5 128.6 100.7 478.0
Total capital investments 301.1 285.1 354.4 368.4 1,309.0
Total assets 3,758.9 3,707.7 3,559.8 3,170.4 3,758.9
Available funding (1) 1,118.0 1,141.2 1,326.0 861.4 1,118.0
Net debt (1) 1,250.9 989.8 710.2 505.2 1,250.9
Debt outstanding 1,546.8 1,491.2 1,395.5 888.4 1,546.8
OPERATING
Average daily production
Oil and condensate (mbbls/d) 25.6 22.6 20.7 15.8 21.2
NGLs (mbbls/d) 19.2 14.1 11.9 12.0 14.3
Natural gas (MMcf/d) 197 143 130 125 149
Total (mboe/d) 77.7 60.6 54.2 48.8 60.4
Realized prices
Oil and condensate ($/bbl) 46.72 49.18 60.29 47.59 50.84
NGLs ($/bbl) 12.35 7.99 9.78 10.41 10.34
Natural gas ($/Mcf) 2.57 2.81 2.63 2.62 2.65
OPERATING NETBACK (1) ($/boe)
Liquids and natural gas revenues 24.97 26.86 31.45 24.73 26.84
Realized hedging gain 3.22 6.32 8.45 11.54 6.83
Royalties (1.69) (3.18) (2.61) (3.46) (2.63)
Operating expenses (4.11) (4.81) (4.77) (4.89) (4.59)
Transportation and processing (2) (3.30) (2.42) (2.00) (2.95) (2.68)
Operating netback after hedging $ 19.09 $ 22.77 $ 30.52 $ 24.97 $ 23.77
(1) See “Non-IFRS Financial Measures”. (2) Certain comparative figures have been reclassified to conform to current period presentation. (3) Excludes non-cash items.
SEVEN GENERATIONS 2016 Annual Report 59

Selected Quarterly Information (cont’d)($ millions, except per share amounts, production rates and unit prices) Q4 2014 Q3 2014 Q2 2014 Q1 2014 YE 2014
FINANCIAL
Liquids and natural gas sales 155.4 160.0 120.7 98.7 534.8
Realized hedging gain 22.2 (0.1) (6.9) (5.4) 9.8
Interest, processing and third party income 2.0 1.1 1.0 0.9 5.0
Royalties (16.1) (20.9) (9.4) (5.4) (51.8)
Operating expenses (19.0) (14.2) (9.7) (11.4) (54.3)
Transportation expenses (13.2) (7.3) (7.7) (6.6) (34.8)
General and administrative (7.4) (4.5) (5.2) (3.2) (20.3)
Interest expense (2) (16.9) (16.0) (16.3) (13.7) (62.9)
Foreign exchange (gain) loss and other (2) (5.5) 8.2 (0.5) 0.2 2.4
Funds from operations (1) (3) 101.5 106.3 66.0 54.1 327.9
Per share – diluted 0.41 0.48 0.31 0.25 1.46
Operating income (1) 34.8 41.9 18.3 24.5 119.5
Per share – diluted 0.14 0.19 0.09 0.11 0.53
Net income 68.6 30.5 43.9 1.2 144.2
Per share – diluted 0.28 0.14 0.20 0.01 0.64
Capital investments:
Land and other 10.1 3.1 31.6 10.4 55.2
Drilling and completions 227.6 234.9 155.3 124.3 742.1
Facilities and equipment 132.6 90.4 34.2 65.8 323.0
Total capital investments (before dispositions) 370.3 328.4 221.1 200.5 1,120.3
Total assets 3,114.8 2,019.1 1,844.2 1,818.6 3,114.8
Total revenue 247.6 165.5 123.0 103.3 639.4
Available funding (1) 1,133.8 547.7 427.2 574.6 1,133.8
Net debt (1) 158.3 716.3 469.7 349.3 158.3
Debt outstanding 813.9 785.8 748.6 775.8 813.9
OPERATING
Average daily production
Oil and condensate (mbbls/d) 14.7 12.6 9.3 7.6 11.1
NGLs (mbbls/d) 10.8 8.3 4.7 4.1 7.0
Natural gas (MMcf/d) 112 90 60 52 79
Total (mboe/d) 44.2 35.8 24.0 20.2 31.1
Realized prices
Oil and condensate ($/bbl) 69.93 90.41 97.32 92.61 85.34
NGLs ($/bbl) 21.50 25.46 24.15 28.25 24.10
Natural gas ($/Mcf) 3.81 4.35 5.18 5.47 4.50
OPERATING NETBACK (1) ($/boe)
Liquids and natural gas revenues 38.23 48.54 55.29 54.23 47.06
Realized hedging gain 5.45 (0.04) (3.15) (2.97) 0.86
Royalties (3.97) (6.35) (4.32) (2.96) (4.57)
Operating expenses (4.67) (4.32) (4.42) (6.26) (4.77)
Transportation and processing (3.26) (2.21) (3.52) (3.64) (3.06)
Operating netback after hedging 31.78 35.62 39.88 38.40 35.52
(1) See “Non-IFRS Financial Measures”. (2) Excludes non-cash items. (3) Excludes liquidity event expense.
SEVEN GENERATIONS 2016 Annual Report60

Forward-Looking Information Advisory
This document contains certain forward-looking information and statements that involve various risks, uncertainties and other factors. The use of any of the words “anticipate”, “continue”, “estimate”, “expect”, “may”, “will”, “should”, “believe”, “plans”, and similar expressions are intended to identify forward-looking information or statements. In particular, but without limiting the foregoing, this document contains forward-looking information and statements pertaining to the following: the Company’s strategies, objectives and competitive strengths; the ability to remain as one of North America’s lowest supply-cost unconventional natural gas developers and to maintain growth through innovation, the application of technology and increased efficiency, low-supply costs and market access; the generation of positive free cash flow, the achievement of cash flow self-sufficiency and full-cycle returns on capital employed across the entire commodity cycle; the pursuit of market access opportunities; the ability to capture premium markets for the Company’s production; achievement of the Company’s high growth objectives; forecast production, capital investment, and the anticipated number of wells to be drilled and brought on production in 2017; plans to re-drill the lateral sections of wells that the Company was not able to hydraulically fracture in 2016 due to mechanical liner failures; anticipated transportation and processing capacity; expectation that the Company’s hedging program will provide for threshold rates of return on the Company’s capital investments; plans to begin the construction of a new gas plant in the second quarter of 2017, the expected processing capacity of that facility and the anticipated commissioning of that facility in mid-2018; the Company’s targeted low debt to funds flow ratio of less than 2.0 times; the expected completion of the planned NGTL system expansion in mid-2018 and the Pembina Phase 3 expansion in July of 2017; hedging targets; the Company’s estimates of its future obligations under the heading “Contractual Obligations”; anchoring major infrastructure investments by pledging a portion of the company’s low-cost supply to new market opportunities; the expectation that the company has decades of potential drilling locations in its drilling inventory; the expected allocation of 40 percent of the company’s drilling and capital investment in 2017 to the properties that were acquired in 2016; the long-term potential of the Kakwa River Project; lowering the company’s debt ratios to achieve investment grade credit ratings, and lower the Company’s cost of capital. In addition, references to reserves and resources are deemed to be forward-looking information, as they involve the implied assessment, based on certain estimates and assumptions, that the reserves and resources described exist in the quantities predicted or estimated.
With respect to forward-looking information contained in this document, assumptions have been made regarding, among other things: future oil, NGLs and natural gas prices being consistent with current commodity price forecasts (including McDaniel’s price forecasts that are included in the AIF) after factoring in quality adjustments at the Company’s points of sale; the Company’s continued ability to obtain qualified staff and equipment in a timely and cost-efficient manner; infrastructure and facility design concepts that have been applied by the Company elsewhere in its Kakwa River Project may be successfully applied to the properties that were acquired as part of the Acquisition; the consistency of the regulatory regime and framework governing royalties, taxes and environmental matters in the jurisdictions in which the Company conducts its business and any other jurisdictions in which the Company may conduct its business in the future; the Company’s ability to market production of oil, NGLs and natural gas successfully to customers; the described mechanical liner failures in 2016 will not have a significant impact on 2017 production; the Company’s future production levels and amount of future capital investment will be consistent with the Company’s current development plans and budget; the applicability of new technologies for recovery and production of the Company’s reserves and resources may improve capital and operational efficiencies in the future; the recoverability of the Company’s reserves and resources; sustained future capital investment by the Company; future cash flows from production; the future sources of funding for the Company’s capital program; the Company’s future debt levels; geological and engineering estimates in respect of the Company’s reserves and resources; the geography of the areas in which the Company is conducting exploration and development activities, and the access, economic, regulatory and physical limitations to which the Company may be subject from time to time; the impact of competition on the Company; and the Company’s ability to obtain financing on acceptable terms. For the forward-looking statements regarding the company’s ability to achieve positive free cash flow and full-cycle returns on the capital that is deployed, key assumptions were made, including: the anticipated impact of the Acquisition on the Company and its reserves, production and financial and operating results; the Company’s ability to successfully integrate the assets acquired into its Kakwa River Project; that the tax regimes and bi-lateral and international trade arrangements that are applicable to the Company will not be significantly revised in a way that will have adverse impacts on the Company. With respect to statements regarding the Company’s ability to secure premium markets for the Company’s production, assumptions have been made regarding the laws and regulations governing such initiatives pertaining to taxation, the environment, aboriginal peoples, Crown royalty rates and incentive programs relating to the oil and gas industry.
Actual results could differ materially from those anticipated in the forward-looking information that is contained herein as a result of the risks and risk factors that are set forth in the AIF, which is available on SEDAR at www.sedar.com, including, but not limited to: volatility in market prices and demand for oil, NGLs and natural gas and hedging activities related thereto; general economic, business and industry conditions; variance of the Company’s actual capital costs, operating costs and economic returns from those anticipated; the ability to find, develop or acquire additional reserves and the availability of the capital or financing necessary to do so on satisfactory terms; risks related to the exploration, development and production of oil and natural gas reserves and resources; negative public perception of oil sands development, oil and natural gas development and transportation, hydraulic fracturing and fossil fuels; actions by governmental authorities, including changes in government regulation, royalties and taxation; potential legislative and regulatory changes, including changes that may be implemented following the 2016 US presidential election; the rescission, or amendment to the conditions of, groundwater licenses of the Company; management of the Company’s growth; the ability to successfully identify and make attractive acquisitions, joint ventures or investments, or successfully integrate future acquisitions or businesses; the availability, cost or shortage of rigs, equipment, raw materials, supplies or qualified personnel; adoption or modification of climate change legislation by governments; the absence or loss of key employees; uncertainty associated with estimates of oil, NGLs and natural gas reserves and resources and the variance of such estimates from actual future production; dependence upon compressors, gathering lines, pipelines and other facilities, certain of which the Company does not control; the ability to satisfy obligations
SEVEN GENERATIONS 2016 Annual Report 61

under the Company’s firm commitment transportation arrangements; the uncertainties related to the Company’s identified drilling locations; the high-risk nature of successfully stimulating well productivity and drilling for and producing oil, NGLs and natural gas; operating hazards and uninsured risks; the possibility that the Company’s drilling activities may encounter sour gas; execution risks associated with the Company’s business plan; failure to acquire or develop replacement reserves; the concentration of the Company’s assets in the Kakwa River Project area; unforeseen title defects; aboriginal claims; failure to accurately estimate abandonment and reclamation costs; development and exploratory drilling efforts and well operations may not be profitable or achieve the targeted return; horizontal drilling and completion technique risks and failure of drilling results to meet expectations for reserves or production; limited intellectual property protection for operating practices and dependence on employees and contractors; third-party claims regarding the Company’s right to use technology and equipment; expiry of certain leases for the undeveloped leasehold acreage in the near future; failure to realize the anticipated benefits of acquisitions (including the Acquisition) or dispositions; failure of properties acquired now or in the future to produce as projected and inability to determine reserve and resource potential, identify liabilities associated with acquired properties or obtain protection from sellers against such liabilities; changes in the application, interpretation and enforcement of applicable laws and regulations; restrictions on drilling intended to protect certain species of wildlife; potential conflicts of interests; actual results differing materially from management estimates and assumptions; seasonality of the Company’s activities and the Canadian oil and gas industry; alternatives to and changing demand for petroleum products; extensive competition in the Company’s industry; changes in the Company’s credit ratings; third party credit risk; dependence upon a limited number of customers; lower oil, NGLs and natural gas prices and higher costs; failure of 2D and 3D seismic data used by the Company to accurately identify the presence of oil and natural gas; risks relating to commodity price hedging instruments; terrorist attacks or armed conflict; cyber security risks, loss of information and computer systems; inability to dispose of non-strategic assets on attractive terms; security deposits required under provincial liability management programs; reassessment by taxing authorities of the Company’s prior transactions and filings; variations in foreign exchange rates and interest rates; third-party credit risk including risk associated with counterparties in risk management activities related to commodity prices and foreign exchange rates; sufficiency of insurance policies; potential litigation; variation in future calculations of non-IFRS measures; sufficiency of internal controls; breach of agreements by counterparties and potential enforceability issues in contracts; impact of expansion into new activities on risk exposure; inability of the Company to respond quickly to competitive pressures; and the risks related to the Common Shares that are publicly traded and the Company’s senior notes and other indebtedness.
Any financial outlook and future-oriented financial information contained in this document regarding prospective financial performance, financial position or cash flows is based on assumptions about future events, including economic conditions and proposed courses of action based on management’s assessment of the relevant information that is currently available. Projected operational information contains forward-looking information and is based on a number of material assumptions and factors, as are set out above. These projections may also be considered to contain future oriented financial information or a financial outlook. The actual results of the Company’s operations for any period will likely vary from the amounts set forth in these projections and such variations may be material. Actual results will vary from projected results. Readers are cautioned that any such financial outlook and future-oriented financial information contained herein should not be used for purposes other than those for which it is disclosed herein. The forward-looking information and statements contained in this document speak only as of the date hereof and the Company does not assume any obligation to publicly update or revise them to reflect new events or circumstances, except as may be required pursuant to applicable laws.
Independent Reserves Evaluation
Estimates of the Company’s reserves and contingent resources and the net present value of future net revenue attributable to the Company’s reserves and contingent resources as at December 31, 2016, are based upon the reports that were prepared by McDaniel, dated March 7, 2017. Estimates of the Company’s reserves and contingent resources and the net present value of future net revenue attributable to the Company’s reserves and contingent resources, as at December 31, 2015, are based upon the reports that were prepared by McDaniel dated March 7, 2016. The estimates of reserves and contingent resources provided in this document are estimates only and there is no guarantee that the estimated reserves or contingent resources will be recovered. Actual reserves and contingent resources may be greater than or less than the estimates provided in this in this document and the differences may be material. The estimates of reserves and future net revenue for individual properties may not reflect the same confidence level as estimates of reserves and future net revenue for all properties, due to the effects of aggregation. Estimates of net present value of future net revenue attributable to the Company’s reserves and contingent resources do not represent the fair market value of the Company’s reserves and contingent resources and there is uncertainty that the net present value of future net revenue will be realized. There is no assurance that the forecast price and cost assumptions applied by McDaniel in evaluating Seven Generations’ reserves and contingent resources will be attained and variances could be material. There is uncertainty that it will be commercially viable to produce any portion of the contingent resources that are described herein. For important additional information regarding the independent reserves and resources evaluations that were conducted by McDaniel, please refer to the AIF and the annual information form for the year ended December 31, 2015, dated March 8, 2016 which are available on the SEDAR website at www.sedar.com.
SEVEN GENERATIONS 2016 Annual Report62

Oil and Gas Definitions
Terms that are used in this document that are not otherwise defined herein are provided below:
best estimate is a classification of estimated resources described in the Canadian Oil and Gas Evaluation Handbook, which is considered to be the best estimate of the quantity that will actually be recovered. It is equally likely that the actual quantities recovered will be greater or less than the best estimate. Resources in the best estimate case have a 50% probability that the actual quantities recovered will equal or exceed the estimate.
COGE handbook means the Canadian Oil and Gas Evaluation Handbook maintained by the Society of Petroleum Evaluation Engineers (Calgary Chapter), as amended from time to time.
contingent resources are the quantities of petroleum estimated, as of a given date, to be potentially recoverable from known accumulations using established technology or technology under development, but which are not currently considered to be commercially recoverable due to one or more contingencies. Contingencies are conditions that must be satisfied for a portion of contingent resources to be classified as reserves that are: (a) specific to the project being evaluated; and (b) expected to be resolved within a reasonable timeframe. Contingencies may include factors such as economic, legal, environmental, political and regulatory matters or a lack of markets. It is also appropriate to classify as contingent resources the estimated discovered recoverable quantities associated with a project in the early evaluation stage.
developed non-producing reserves are those reserves that either have not been on production, or have previously been on production, but are shut in, and the date of resumption of production is unknown.
developed producing reserves are those reserves that are expected to be recovered from completion intervals open at the time of the estimate. These reserves may be currently producing or, if shut in, they must have previously been on production, and the date of resumption of production must be known with reasonable certainty.
developed reserves are those reserves that are expected to be recovered from existing wells and installed facilities or, if facilities have not been installed, that would involve a low expenditure (for example, when compared to the cost of drilling a well) to put the reserves on production. The developed category may be subdivided into producing and non-producing.
development pending is a project maturity subclass that is described in the COGE Handbook for contingent resources when the resolution of the final conditions for development are being actively pursued and there is a high chance of development.
gross means:
• in relation to reserves or contingent resources, the applicable working interest (operating or non-operating) share before deduction of royalties and without including any royalty interests;
• in relation to wells, the total number of wells in which the Company has an interest; and
• in relation to properties, the total area of properties in which the Company has an interest.
net means:
• in relation to the Company’s interest in wells, the number of wells obtained by aggregating the Company’s working interest in each of its gross wells; and
• in relation to the Company’s interest in a property, the total area in which the Company has an interest multiplied by the working interest owned by the Company.
probable reserves are those additional reserves that are less certain to be recovered than proved reserves. It is equally likely that the actual remaining quantities recovered will be greater or less than the sum of the estimated proved plus probable reserves.
proved reserves are those reserves that can be estimated with a high degree of certainty to be recoverable. It is likely that the actual remaining quantities recovered will exceed the estimated proved reserves.
reserves are estimated remaining quantities of oil and natural gas and related substances anticipated to be recoverable from known accumulations, as of a given date, based on: (i) analysis of drilling, geological, geophysical and engineering data; (ii) the use of established technology; and (iii) specified economic conditions, which are generally accepted as being reasonable. Reserves are classified according to the degree of certainty associated with the estimates.
risked best estimate contingent resources means the gross development pending best estimate contingent resources to which McDaniel attributed a 95 percent chance of development.
SEVEN GENERATIONS 2016 Annual Report 63
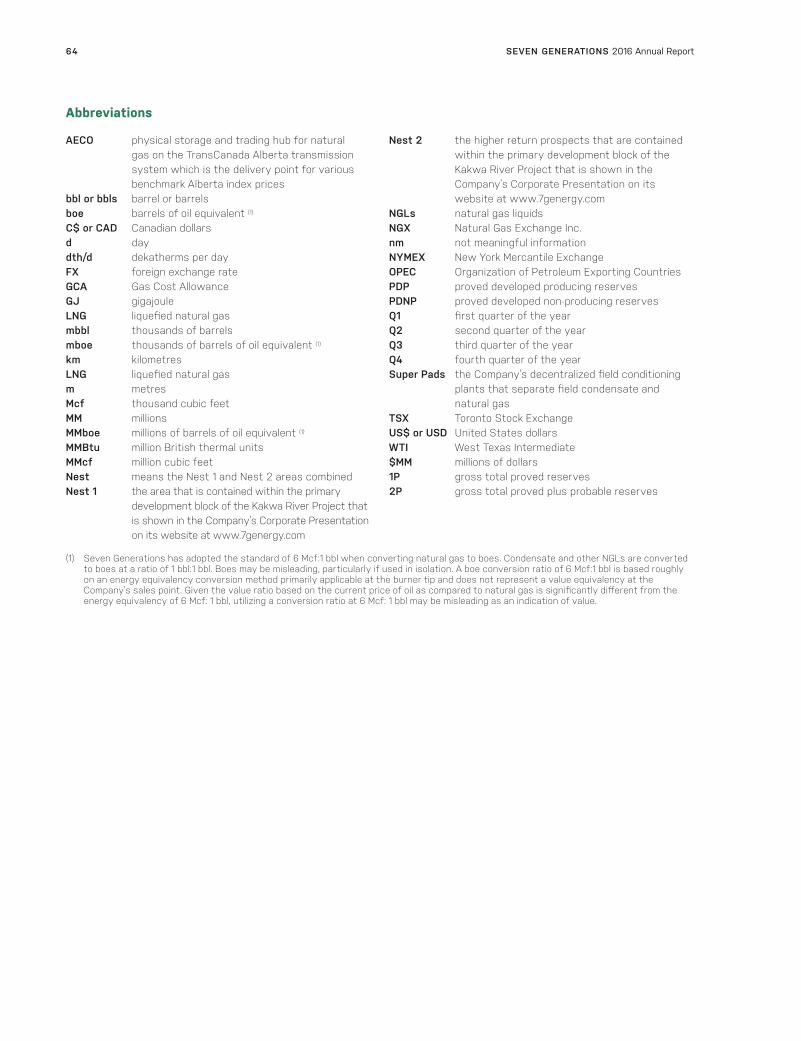
Abbreviations
AECO physical storage and trading hub for natural gas on the TransCanada Alberta transmission system which is the delivery point for various benchmark Alberta index prices
bbl or bbls barrel or barrelsboe barrels of oil equivalent (1)
C$ or CAD Canadian dollarsd daydth/d dekatherms per dayFX foreign exchange rateGCA Gas Cost AllowanceGJ gigajouleLNG liquefied natural gasmbbl thousands of barrelsmboe thousands of barrels of oil equivalent (1)
km kilometresLNG liquefied natural gasm metresMcf thousand cubic feetMM millionsMMboe millions of barrels of oil equivalent (1)
MMBtu million British thermal unitsMMcf million cubic feetNest means the Nest 1 and Nest 2 areas combinedNest 1 the area that is contained within the primary
development block of the Kakwa River Project that is shown in the Company’s Corporate Presentation on its website at www.7genergy.com
Nest 2 the higher return prospects that are contained within the primary development block of the Kakwa River Project that is shown in the Company’s Corporate Presentation on its website at www.7genergy.com
NGLs natural gas liquidsNGX Natural Gas Exchange Inc.nm not meaningful informationNYMEX New York Mercantile ExchangeOPEC Organization of Petroleum Exporting CountriesPDP proved developed producing reservesPDNP proved developed non-producing reservesQ1 first quarter of the yearQ2 second quarter of the yearQ3 third quarter of the yearQ4 fourth quarter of the yearSuper Pads the Company’s decentralized field conditioning
plants that separate field condensate and natural gas
TSX Toronto Stock ExchangeUS$ or USD United States dollarsWTI West Texas Intermediate$MM millions of dollars1P gross total proved reserves2P gross total proved plus probable reserves
(1) Seven Generations has adopted the standard of 6 Mcf:1 bbl when converting natural gas to boes. Condensate and other NGLs are converted to boes at a ratio of 1 bbl:1 bbl. Boes may be misleading, particularly if used in isolation. A boe conversion ratio of 6 Mcf:1 bbl is based roughly on an energy equivalency conversion method primarily applicable at the burner tip and does not represent a value equivalency at the Company’s sales point. Given the value ratio based on the current price of oil as compared to natural gas is significantly different from the energy equivalency of 6 Mcf: 1 bbl, utilizing a conversion ratio at 6 Mcf: 1 bbl may be misleading as an indication of value.
SEVEN GENERATIONS 2016 Annual Report64

Independent Auditor’s ReportMarch 7, 2017
TO THE SHAREHOLDERS OF SEVEN GENERATIONS ENERGY LTD.
We have audited the accompanying consolidated financial statements of Seven Generation Energy Ltd. and its subsidiaries, which comprise the consolidated balance sheets as at December 31, 2016 and December 31, 2015 and the consolidated statements of operations and comprehensive loss, consolidated statements of changes in equity, and consolidated statements of cash flows for the years then ended, and the related notes, which comprise a summary of significant accounting policies and other explanatory information.
Management’s Responsibility for the Consolidated Financial Statements
Management is responsible for the preparation and fair presentation of these consolidated financial statements in accordance with International Financial Reporting Standards, and for such internal control as management determines is necessary to enable the preparation of consolidated financial statements that are free from material misstatement, whether due to fraud or error.
Auditor’s Responsibility
Our responsibility is to express an opinion on these consolidated financial statements based on our audits. We conducted our audits in accordance with Canadian generally accepted auditing standards. Those standards require that we comply with ethical requirements and plan and perform the audit to obtain reasonable assurance about whether the consolidated financial statements are free from material misstatement.
An audit involves performing procedures to obtain audit evidence about the amounts and disclosures in the consolidated financial statements. The procedures selected depend on the auditor’s judgment, including the assessment of the risks of material misstatement of the consolidated financial statements, whether due to fraud or error. In making those risk assessments, the auditor considers internal control relevant to the entity’s preparation and fair presentation of the consolidated financial statements in order to design audit procedures that are appropriate in the circumstances, but not for the purpose of expressing an opinion on the effectiveness of the entity’s internal control. An audit also includes evaluating the appropriateness of accounting policies used and the reasonableness of accounting estimates made by management, as well as evaluating the overall presentation of the consolidated financial statements.
We believe that the audit evidence we have obtained in our audit is sufficient and appropriate to provide a basis for our audit opinion.
Opinion
In our opinion, the consolidated financial statements present fairly, in all material respects, the financial position of Seven Generations Energy Ltd. and its subsidiaries as at December 31, 2016 and December 31, 2015 and their financial performance and their cash flows for the years then ended in accordance with International Financial Reporting Standards.
Chartered Professional Accountants
SEVEN GENERATIONS 2016 Annual Report 65
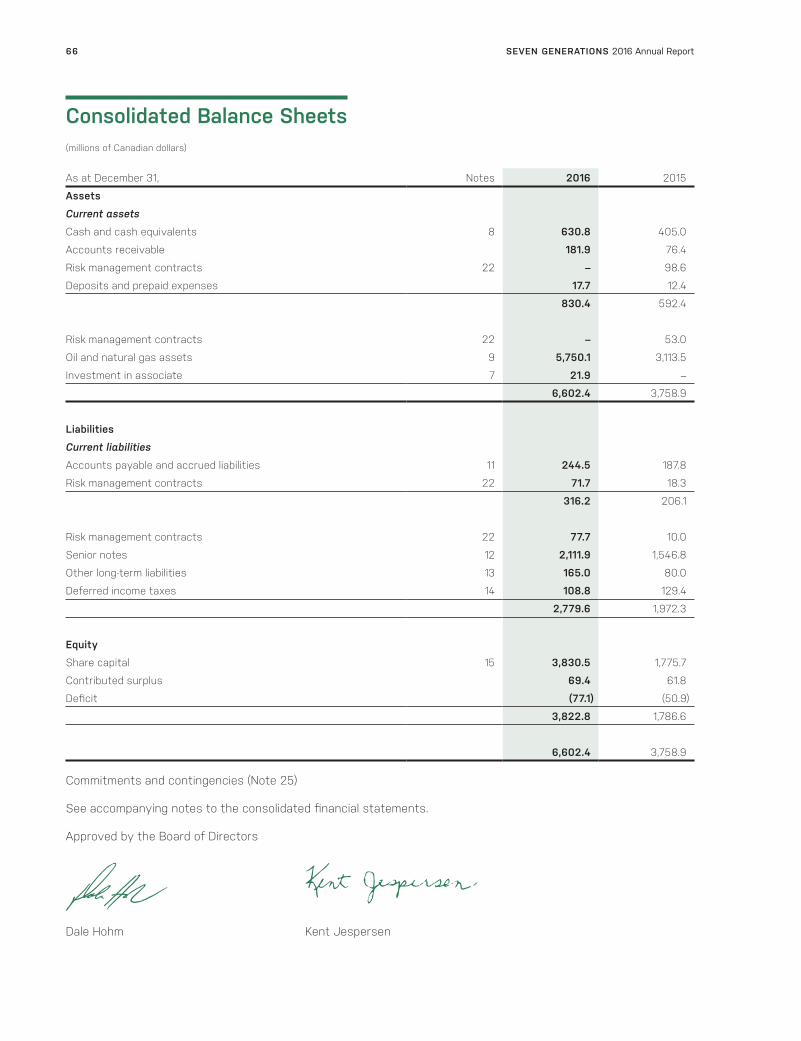
Consolidated Balance Sheets(millions of Canadian dollars)
As at December 31, Notes 2016 2015
Assets
Current assets
Cash and cash equivalents 8 630.8 405.0
Accounts receivable 181.9 76.4
Risk management contracts 22 – 98.6
Deposits and prepaid expenses 17.7 12.4
830.4 592.4
Risk management contracts 22 – 53.0
Oil and natural gas assets 9 5,750.1 3,113.5
Investment in associate 7 21.9 –
6,602.4 3,758.9
Liabilities
Current liabilities
Accounts payable and accrued liabilities 11 244.5 187.8
Risk management contracts 22 71.7 18.3
316.2 206.1
Risk management contracts 22 77.7 10.0
Senior notes 12 2,111.9 1,546.8
Other long-term liabilities 13 165.0 80.0
Deferred income taxes 14 108.8 129.4
2,779.6 1,972.3
Equity
Share capital 15 3,830.5 1,775.7
Contributed surplus 69.4 61.8
Deficit (77.1) (50.9)
3,822.8 1,786.6
6,602.4 3,758.9
Commitments and contingencies (Note 25)
See accompanying notes to the consolidated financial statements.
Approved by the Board of Directors
Dale Hohm Kent Jespersen
SEVEN GENERATIONS 2016 Annual Report66

Consolidated Statements of Operations and Comprehensive Loss(millions of Canadian dollars, except per share amounts)
Years ended December 31, Notes 2016 2015
Revenues
Liquids and natural gas sales 1,246.9 591.9
Royalties expense 5 (6.7) (57.9)
1,240.2 534.0
Risk management contracts
Realized gain 22 90.8 150.6Unrealized loss 22 (271.6) (15.9)
Other income 4.7 6.7
1,064.1 675.4
Expenses
Operating 18 181.9 101.2
Transportation, processing and other 19 238.6 59.0
General and administrative 20 47.1 24.3
Depletion, depreciation and amortization 9 483.6 283.5
Stock based compensation 16 18.0 14.0
Finance expense 21 138.7 102.1
Foreign exchange (gain) loss (18.2) 219.3
Gain on disposition of assets – (2.6)
Market access initiatives 7 8.0 –
1,097.7 800.8
Loss before taxes (33.6) (125.4)
Income Taxes
Deferred income tax (recovery) expense (8.8) 61.8
Current income tax expense 1.4 0.1
14 (7.4) 61.9
Net loss and comprehensive loss (26.2) (187.3)
Net loss per share
Basic 17 (0.09) (0.75) Diluted 17 (0.09) (0.75)
See accompanying notes to the consolidated financial statements.
SEVEN GENERATIONS 2016 Annual Report 67
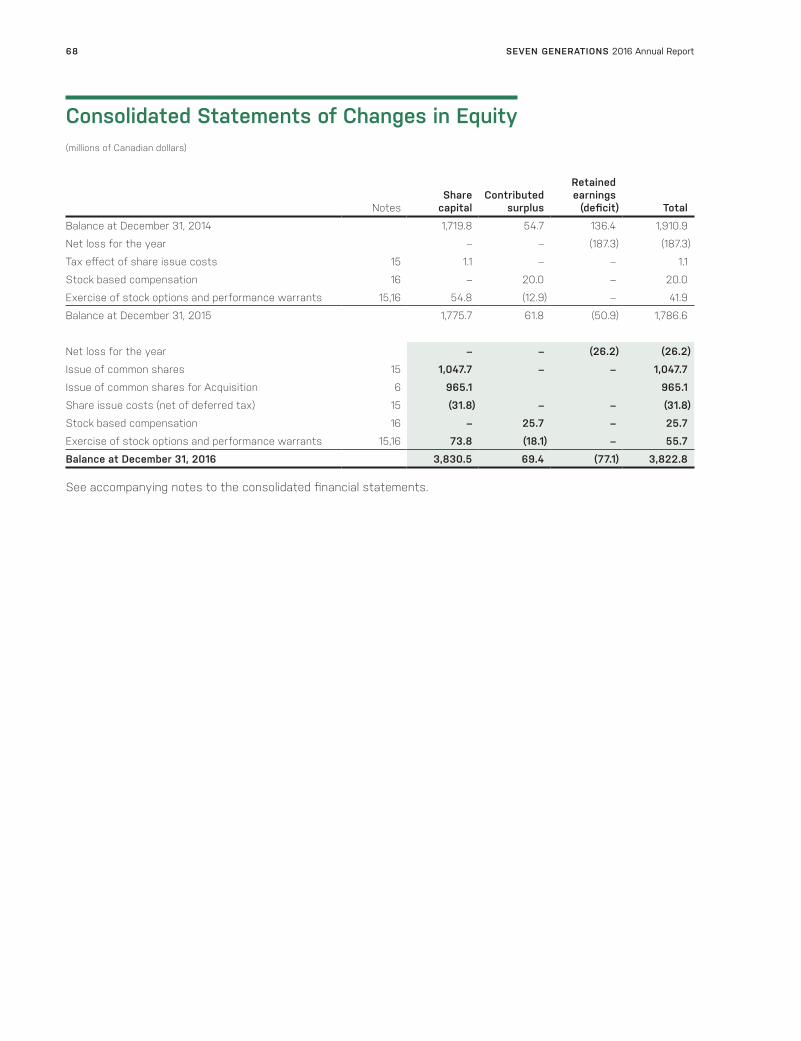
Consolidated Statements of Changes in Equity(millions of Canadian dollars)
NotesShare
capitalContributed
surplus
Retained earnings
(deficit) Total
Balance at December 31, 2014 1,719.8 54.7 136.4 1,910.9
Net loss for the year – – (187.3) (187.3)
Tax effect of share issue costs 15 1.1 – – 1.1
Stock based compensation 16 – 20.0 – 20.0
Exercise of stock options and performance warrants 15,16 54.8 (12.9) – 41.9
Balance at December 31, 2015 1,775.7 61.8 (50.9) 1,786.6
Net loss for the year – – (26.2) (26.2)
Issue of common shares 15 1,047.7 – – 1,047.7
Issue of common shares for Acquisition 6 965.1 965.1
Share issue costs (net of deferred tax) 15 (31.8) – – (31.8)
Stock based compensation 16 – 25.7 – 25.7
Exercise of stock options and performance warrants 15,16 73.8 (18.1) – 55.7
Balance at December 31, 2016 3,830.5 69.4 (77.1) 3,822.8
See accompanying notes to the consolidated financial statements.
SEVEN GENERATIONS 2016 Annual Report68

Consolidated Statements of Cash Flows(millions of Canadian dollars)
Years ended December 31, Notes 2016 2015
Operating activities
Net loss for the year (26.2) (187.3)
Items not affecting cash:
Deferred income tax (recovery) expense (8.8) 61.8
Depletion, depreciation and amortization 9 483.6 283.5
Unrealized loss on risk management contracts 22 271.6 15.9
Stock based compensation 16 18.0 14.0
Non-cash finance expenses 21 3.6 2.1
Gain on disposition of assets – (2.6)
Equity loss from investment 7 3.9 –
Unrealized foreign exchange loss (gain) (16.7) 227.2
Onerous lease provision 20, 13 3.6 –
Changes in non-cash working capital 24 (88.0) (34.5)
Cash provided by operating activities 644.6 380.1
Financing activities
Issue of shares for cash 15 1,047.7 –
Issue of shares on equity compensation exercises 15,16 55.7 41.9
Share issue costs 15 (43.7) –
Issue of debt 12 – 515.1
Debt issue costs 12 – (11.3)
Cash provided by financing activities 1,059.7 545.7
Investing activities
Oil and natural gas asset additions 9 (978.0) (1,309.0)
Acquisitions 6 (505.1) –
Investments 7 (25.8) –
Changes in non-cash working capital 24 30.9 (61.0)
Cash used in investing activities (1,478.0) (1,370.0)
Unrealized foreign exchange (gain) loss on cash held in foreign currencies (0.5) 1.1
Increase (decrease) in cash and cash equivalents 225.8 (443.1)
Cash and cash equivalents, beginning of year 405.0 848.1
Cash and cash equivalents, end of year 630.8 405.0
Supplementary disclosure of cash flow information (Note 24)
See accompanying notes to the consolidated financial statements.
SEVEN GENERATIONS 2016 Annual Report 69

Notes to the Consolidated Financial StatementsAS AT AND FOR THE YEARS ENDED DECEMBER 31, 2016 AND 2015
(all tabular amounts in millions of Canadian dollars, except share, per share and price information)
Financial Statement Note Page1 Nature of business 702 Basis of preparation 703 Significant accounting policies 714 New accounting policies 765 Significant judgments, estimates and assumptions 776 Acquisition 797 Investments 808 Cash and cash equivalents 809 Oil and natural gas assets 8110 Bank debt 8211 Accounts payable and accrued liabilities 8212 Senior notes 8213 Other long-term liabilities 8314 Income taxes 8415 Share capital 8516 Stock based compensation 8617 Per share amounts 8818 Operating expenses 8819 Transportation, processing and other 8920 General and administrative expenses 8921 Finance expense 8922 Financial instruments and risk management contracts 9023 Capital management 9424 Supplemental cash flow information 9525 Commitments and contingencies 9526 Related party transactions 96
1. NATURE OF BUSINESS
Seven Generations Energy Ltd. (“Seven Generations” or the “Company”) is incorporated under the Canada Business Corporations Act and commenced operations in 2008. Seven Generations is a Canadian company focused on the exploration, development and production of oil and natural gas properties in western Canada. Seven Generations’ principal place of business is located at 4400, 525 – 8 Avenue SW Calgary, AB T2P 1G1. The Company’s Class A common shares (“Common Shares”) are publicly traded on the Toronto Stock Exchange under the symbol “VII”.
2. BASIS OF PREPARATION
These consolidated financial statements have been prepared in accordance with International Financial Reporting Standards (“IFRS”) as issued by the International Accounting Standards Board (“IASB”).
These consolidated financial statements have been prepared on a historical cost basis, except for certain financial instruments which are measured at fair value as explained in Note 22. The consolidated financial statements are presented in Canadian dollars, which is Seven Generations’ functional currency.
SEVEN GENERATIONS 2016 Annual Report70
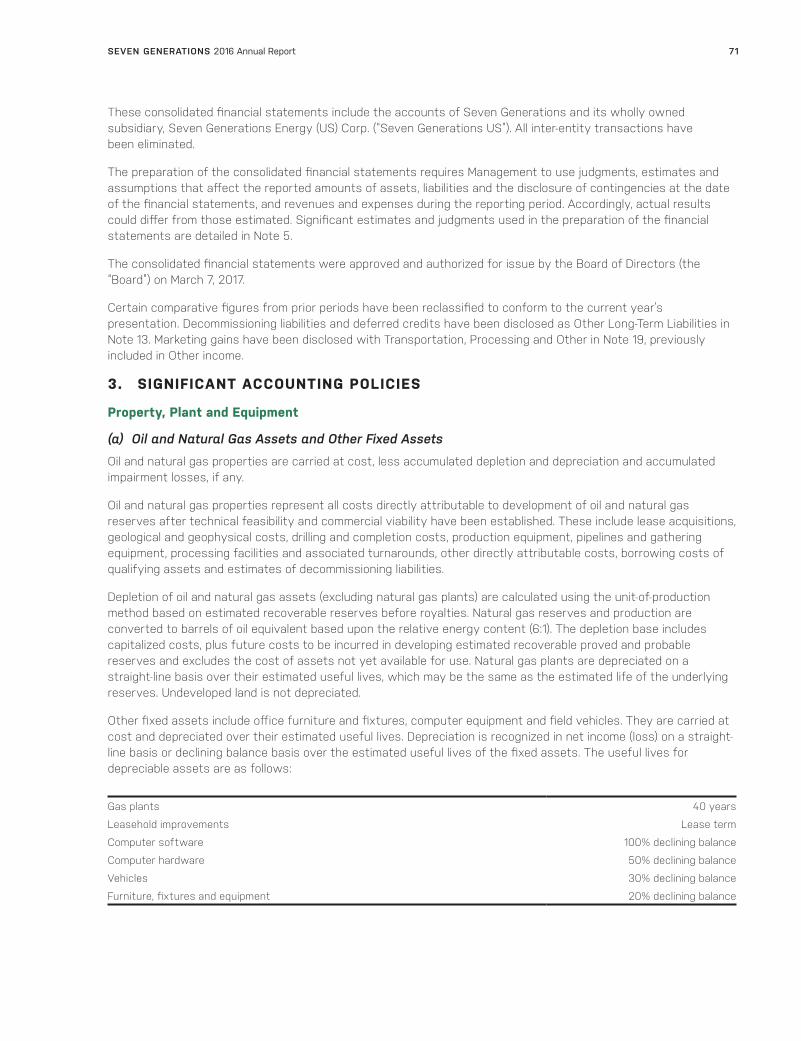
These consolidated financial statements include the accounts of Seven Generations and its wholly owned subsidiary, Seven Generations Energy (US) Corp. (“Seven Generations US”). All inter-entity transactions have been eliminated.
The preparation of the consolidated financial statements requires Management to use judgments, estimates and assumptions that affect the reported amounts of assets, liabilities and the disclosure of contingencies at the date of the financial statements, and revenues and expenses during the reporting period. Accordingly, actual results could differ from those estimated. Significant estimates and judgments used in the preparation of the financial statements are detailed in Note 5.
The consolidated financial statements were approved and authorized for issue by the Board of Directors (the “Board”) on March 7, 2017.
Certain comparative figures from prior periods have been reclassified to conform to the current year’s presentation. Decommissioning liabilities and deferred credits have been disclosed as Other Long-Term Liabilities in Note 13. Marketing gains have been disclosed with Transportation, Processing and Other in Note 19, previously included in Other income.
3. SIGNIFICANT ACCOUNTING POLICIES
Property, Plant and Equipment
(a) Oil and Natural Gas Assets and Other Fixed Assets
Oil and natural gas properties are carried at cost, less accumulated depletion and depreciation and accumulated impairment losses, if any.
Oil and natural gas properties represent all costs directly attributable to development of oil and natural gas reserves after technical feasibility and commercial viability have been established. These include lease acquisitions, geological and geophysical costs, drilling and completion costs, production equipment, pipelines and gathering equipment, processing facilities and associated turnarounds, other directly attributable costs, borrowing costs of qualifying assets and estimates of decommissioning liabilities.
Depletion of oil and natural gas assets (excluding natural gas plants) are calculated using the unit-of-production method based on estimated recoverable reserves before royalties. Natural gas reserves and production are converted to barrels of oil equivalent based upon the relative energy content (6:1). The depletion base includes capitalized costs, plus future costs to be incurred in developing estimated recoverable proved and probable reserves and excludes the cost of assets not yet available for use. Natural gas plants are depreciated on a straight-line basis over their estimated useful lives, which may be the same as the estimated life of the underlying reserves. Undeveloped land is not depreciated.
Other fixed assets include office furniture and fixtures, computer equipment and field vehicles. They are carried at cost and depreciated over their estimated useful lives. Depreciation is recognized in net income (loss) on a straight-line basis or declining balance basis over the estimated useful lives of the fixed assets. The useful lives for depreciable assets are as follows:
Gas plants 40 years
Leasehold improvements Lease term
Computer software 100% declining balance
Computer hardware 50% declining balance
Vehicles 30% declining balance
Furniture, fixtures and equipment 20% declining balance
SEVEN GENERATIONS 2016 Annual Report 71

(b) Exploration and Evaluation Assets
Exploration and evaluation (“E&E”) assets are those investments for an area or project for which technical feasibility and commercial viability have not yet been determined. The Company capitalizes all E&E costs after the right to explore has been obtained, including geological and geophysical costs, land acquisition costs and costs for drilling, completion and testing of exploration wells. When technical feasibility and commercial viability is established, the associated E&E assets are tested for impairment at the lower of cost and the estimated recoverable amount and are transferred to property, plant and equipment. Any costs in excess of the estimated recoverable amount are charged to expense.
E&E assets are not amortized.
Farm-in and farm-out arrangements for E&E properties are accounted for at cost. No gain or loss is recognized on the disposition of a working interest through a farm-out arrangement.
Financial Instruments
Financial assets and liabilities are recognized when the Company becomes party to the contractual provisions of the instrument and are initially measured at fair value. Transaction costs, other than for financial instruments at fair value through profit and loss, are added to or deducted from the fair value of the financial instrument on recognition. Transaction costs for financial instruments at fair value through profit and loss are recognized immediately in net income (loss).
Measurement in subsequent periods is dependent upon whether the financial instrument has been classified as fair value through profit and loss, available for sale, held to maturity, loans and receivables or other financial liabilities. The classification is determined at the time of initial recognition depending upon of the nature and purpose of the financial instrument.
Financial instruments designated as fair value through profit and loss are subsequently measured at fair value with changes to those fair values recognized immediately in net income (loss). Available for sale financial assets are subsequently measured at fair value with changes in fair value recognized in other comprehensive income (loss), net of tax. Amounts recognized in other comprehensive income (loss) for available for sale financial assets are transferred to net income (loss) when realized through disposal or impairment. Held to maturity investments, loans and receivables and other financial liabilities are subsequently measured at amortized cost using the effective interest method less any impairment.
An embedded derivative is a component of a contract that modifies the cash flows of the contract. These hybrid contracts are considered to consist of a host contract plus an embedded derivative. The embedded derivative is separated from the host contract and accounted for as a derivative unless the economic characteristics and risks of the embedded derivative are closely related to the host contract. The Company has no material embedded derivatives.
Impairment
(a) Financial Assets
A financial asset is assessed at each reporting date to determine whether there is any objective evidence that it is impaired. A financial asset is considered to be impaired if objective evidence indicates that one or more events have had a negative impact on the estimated future cash flows of that asset.
An impairment loss in respect of a financial asset measured at amortized cost is calculated as the difference between its carrying amount and the present value of the estimated future cash flows discounted at the original effective interest rate.
SEVEN GENERATIONS 2016 Annual Report72
Individually significant financial assets are tested for impairment on an individual basis. The remaining financial assets are assessed collectively in groups that share similar credit risk characteristics.
All impairment losses are recognized in net income (loss). An impairment loss is reversed if the reversal can be related objectively to an event occurring after the impairment loss was recognized. The impairment reversal is recognized in net income (loss).
(b) Non-financial Assets
The carrying amount of property, plant and equipment is reviewed at each reporting date to determine whether there is any indication of impairment. If such indication exists, then the asset’s recoverable amount is estimated. For goodwill, an impairment test is completed each year, or when indicators of impairment exist. E&E assets are assessed for impairment when they are reclassified to property, plant and equipment and also if facts and circumstances suggest that the carrying amount exceeds the recoverable amount.
Oil and natural gas assets
For the purpose of impairment testing, assets are grouped together into the smallest group of assets that generates cash inflows that are largely independent of the cash inflows of other assets or groups of assets (the “cash-generating unit” or “CGU”). The recoverable amount of a CGU is the greater of its value in use and its fair value less costs to sell. In assessing value in use, the estimated future cash flows are discounted to their present value using a discount rate that reflects current market assessments of the time value of money and the risks specific to the asset. Value in use is generally computed by reference to the present value of the future cash flows expected to be derived from production of proved plus probable reserves.
For the purpose of impairment testing, the goodwill acquired in a business combination is allocated to the CGUs that are expected to benefit from the synergies of the combination. E&E assets are allocated to related CGUs when they are assessed for impairment, both at the time of any triggering facts and circumstances as well as upon their eventual reclassification to property, plant and equipment.
An impairment loss is recognized if the carrying amount of an asset or its CGU exceeds its estimated recoverable amount. Impairment losses are recognized in net income (loss). Impairment losses recognized in respect of CGUs are allocated first to reduce the carrying amount of any goodwill allocated to the units and then to reduce the carrying amount of the other assets in the unit (or group of units) on a prorata basis.
Investment in associate
The Company determines at each reporting date whether there is any objective evidence that the investment in the associate is impaired. If this is the case, the Company calculates the amount of impairment as the difference between the recoverable amount of the associate and its carrying value and recognizes the amount in net income (loss). Upon loss of significant influence over the associate, the Company measures and recognizes any remaining investment at its fair value. Any difference between the carrying amount of the associate upon loss of significant influence and the fair value of the remaining investment and proceeds from disposal is recognized in net income (loss).
SEVEN GENERATIONS 2016 Annual Report 73

Provisions
(a) General
Provisions are recognized when the Company has a present obligation (legal or constructive) as a result of a past event, it is probable that the Company will be required to settle the obligation and a reliable estimate can be made of the amount of the obligation. The amount recognized as a provision is the best estimate of the consideration required to settle the present obligation at the end of the reporting period, taking into account the risks and uncertainties surrounding the obligation. When a provision is measured using the cash flows estimated to settle the obligation, its carrying amount is the present value of those cash flows where the effect of the time value of money is material.
(b) Decommissioning Liabilities
The Company records a liability for obligations associated with the decommissioning of its oil and natural gas assets in the period in which they are incurred, normally when the asset is purchased or developed. On recognition of the liability, there is a corresponding increase in the carrying amount of the related asset, which is depleted on a unit-of-production basis over the life of the reserves. The liability is adjusted each reporting period to reflect the passage of time, with the accretion charged to earnings. Estimates used are evaluated on a periodic basis and any adjustments are applied prospectively. Actual costs incurred upon settlement of the obligations are charged against the liability.
(c) Onerous Contracts
A provision for an onerous contract is recognized when the unavoidable cost of meeting the obligations under the contract exceed the economic benefits expected to be derived from the contract. The provision is initially recorded at the present value of the estimated future cash flows associated with the contract and is subsequently adjusted at the end of each period to reflect the passage of time and changes in the estimated cash flows underlying the obligation as well as any changes in the discount rate. The net amount of actual costs incurred and sublease recoveries earned are charged against the onerous contract provision.
Income Taxes
Income tax comprises current and deferred taxes. Income tax is recognized in net income (loss), except when it relates to items that are recognized in other comprehensive income (loss) or directly in equity, in which case the related tax expense or recovery is also recognized in other comprehensive income (loss) or equity, respectively.
Current income tax expense is the expected cash tax payable on the taxable income for the period, using tax rates that have been enacted or substantively enacted at the reporting date, and any adjustment to tax payable in respect of previous years.
Deferred tax is recognized on temporary differences between the carrying amount of assets and liabilities for financial reporting purposes and the amounts used for taxation purposes. Deferred tax liabilities are generally recognized for all temporary differences, except for temporary differences arising from goodwill or from the initial recognition (other than in a business combination) of other assets and liabilities in a transaction that affects neither taxable income nor accounting net income (loss). Deferred income tax is determined on a non-discounted basis using tax rates that have been enacted or substantively enacted at the reporting date and that are expected to apply in the periods that the temporary differences reverse. A deferred tax asset is recognized to the extent that it is probable that future taxable profits will be available against which the temporary differences can be utilized. Deferred tax assets are reviewed at each reporting date and are reduced to the extent that it is no longer probable that the related tax benefit will be realized.
SEVEN GENERATIONS 2016 Annual Report74

Stock Based Compensation
Compensation cost attributable to stock options, performance warrants, deferred share units (“DSUs”) and performance and restricted share units (“PRSUs”) granted to employees, officers, and directors of Seven Generations is measured at fair value at the date of grant and expensed over the vesting period with a corresponding increase in contributed surplus. Fair value is determined using the Black-Scholes option pricing model. A forfeiture rate is estimated on the grant date and is adjusted to reflect the actual number of stock options, performance warrants and PRSUs that vest, whereas DSUs vest immediately. The performance share units (“PSUs”) may be granted with certain market conditions, specified at the grant date as determined by the Company’s Board of Directors. If the Company satisfies the market conditions, a pre-determined adjustment factor is applied to PSUs eligible to vest at the end of the performance period, based upon the relative share price performance of the Company compared to a peer group over the performance period. The expense recognized over the vesting period of PSUs is the fair value of the PSUs with an estimated adjustment factor. If the actual final adjustment factor is higher than estimated at grant, additional expense is recognized on vesting for the incremental fair value.
Upon the exercise of the stock options, performance warrants, DSUs, PSUs and Restricted Share Units (“RSUs”), consideration paid together with the amount previously recognized in contributed surplus is recorded as an increase to share capital. The Company’s DSU and PRSU plans allow the holder of a DSU or PRSU to receive a cash payment or its equivalent in fully-paid common shares, at the Company’s discretion, equal to the fair market value of the Company’s Common Shares calculated at the date of such payment. The Company does not intend to make cash payments under the DSU or PRSU plans and, as such, the units are accounted for within equity.
Foreign Currency Translation
Monetary assets and liabilities denominated in a foreign currency are translated at the rate of exchange in effect at the balance sheet date. Non-monetary assets and liabilities are translated at the historical exchange rate in effect when the asset was acquired or the liability was incurred. Revenues and expenses are translated at average exchange rates for the period. Translation gains and losses are recognized in net income (loss) in the period in which they are incurred and are reported on a net basis.
Cash and Cash Equivalents
Cash and cash equivalents include cash on hand, deposits held with financial institutions and other short-term highly liquid investments that are readily convertible to known amounts of cash and which are subject to an insignificant risk of changes in value, with a maturity of 90 days or less.
Revenue Recognition
Revenue from the sale of oil and natural gas is recognized when risk and rewards of ownership are transferred from the Company to its customers.
Borrowing Costs
Borrowing costs incurred for the construction of qualifying assets are capitalized during the period of time that is required to complete and prepare the assets for their intended use. A qualifying asset is an asset that requires a period of one year or greater to complete or prepare for its intended use. All other borrowing costs are recognized in net income (loss) using the effective interest method. The capitalization rate used to determine the amount of borrowing costs to be capitalized is the weighted average interest rate applicable to the Company’s outstanding borrowings during the period.
Jointly Operated Assets
The Company’s oil and natural gas activities may involve jointly operated assets. The consolidated financial statements of the Company include the Company’s share of these jointly operated assets and a proportionate share of the related revenue and costs.
SEVEN GENERATIONS 2016 Annual Report 75
Per Share Information
Basic per share information is calculated on the basis of the weighted average number of common shares outstanding during the period. For diluted per share information, the weighted average number of shares outstanding is adjusted for the potential number of shares which may have a dilutive effect on net income (loss). Diluted per share information is calculated using the treasury stock method which assumes that proceeds received from the exercise of in-the-money stock options plus the unamortized stock based compensation expense would be used to buy back common shares at the average market price for the period.
Business Combinations and Goodwill
Business combinations are accounted for using the acquisition method. Determining whether an acquisition meets the definition of a business combination or represents an asset purchase requires judgment on a case-by-case basis. If the acquisition meets the definition of a business combination, the assets and liabilities are recognized based on the contractual terms, economic conditions, the Company’s operating and accounting policies and other factors that exist on the acquisition date, which is the date on which control is transferred to the Company. The identifiable assets and liabilities are measured at their fair values on the acquisition date with limited exceptions. Any additional consideration payable, contingent upon the occurrence of a future event, is recognized at fair value on the acquisition date; subsequent changes in the fair value of the liability are recognized in net income (loss).
Any excess of the cost of acquisition over the fair value of the net identifiable assets acquired is recognized as goodwill. Goodwill is subsequently carried at cost less accumulated impairment losses, if any. Any difference in the cost of acquisition below the fair value of the net identifiable assets acquired is credited to net income (loss) in the period of acquisition. Associated transaction costs are expensed when incurred and included in general and administrative expenses in the Consolidated Statements of Operations.
Investment In Associate
An associate is an entity for which the Company has significant influence and thereby has the power to participate in the financial and operational decisions but does not control or jointly control the investee. Investments in associates are accounted for using the equity method of accounting and are recognized at cost and adjusted thereafter for the post-acquisition change in the Company’s share of the investee’s net assets. Where there has been a change recognized directly in the equity of the associate, the Company recognizes its share of any changes.
Market Access Initiatives / Internally Generated Intangible Assets
The amount initially recognized for internally-generated intangible assets is the sum of the expenditure incurred from the date when the intangible asset first meets the recognition criteria listed above. Where no internally-generated intangible asset can be recognized, development expenditure is recognized in net income (loss) in the period in which it is incurred. Subsequent to initial recognition, internally-generated intangible assets are reported at cost less accumulated amortization and accumulated impairment losses, on the same basis as intangible assets that are acquired separately.
4. NEW ACCOUNTING POLICIES
Changes In Accounting Policies
There were no material new or amended accounting standards adopted during the year ended December 31, 2016.
Future Accounting Policy Changes
In February 2014, the IASB issued IFRS 9 “Financial Instruments”, which replaces IAS 39, “Financial Instruments: Recognition and Measurement” for annual periods beginning on or after January 1, 2018, with earlier adoption permitted. IFRS 9 includes a principle-based approach for classification and measurement of financial assets, a single expected loss impairment model and a substantially-reformed approach to hedge accounting. The impact of the standard has been evaluated and is expected to have no material impact on the Company’s consolidated financial statements.
SEVEN GENERATIONS 2016 Annual Report76

In May 2014, the IASB issued IFRS 15 “Revenue from Contracts with Customers”, which replaces IAS 18 “Revenue”, IAS 11 “Construction Contracts” and related interpretations. In July 2015, the IASB issued an amendment to IFRS 15, deferring the effective date by one year. IFRS 15 provides clarification for recognizing revenue from contracts with customers and establishes a single revenue recognition and measurement framework. The standard is required to be adopted either retrospectively or using a modified transition approach for annual periods beginning on or after January 1, 2018, with earlier adoption permitted. The impact of the standard has been evaluated and is expected to have no material impact on the Company’s consolidated financial statements. Additional disclosure may be required upon implementation of IFRS 15 that help provide sufficient information to enable users to understand the nature, amount, timing, and uncertainty of revenue and cash flows arising from the contracts with customers.
In January 2016, the IASB issued IFRS 16 “Leases” which replaces IAS 17 “Leases” for annual periods beginning on or after January 1, 2019, with earlier application permitted if IFRS 15 “Revenue from Contracts with Customers” is also applied. Under IFRS 16, lessees are required to recognize a lease liability reflecting future lease payments and a ‘right-of-use asset’ for virtually all lease contracts. The Company is currently evaluating the impact of the standard on the consolidated financial statements.
In April 2016, the IASB issued amendments to IAS 7 “Statement of Cash Flows” and IAS 12 “Income Taxes” for annual periods beginning on or after January 1, 2017, with earlier application permitted. IAS 7 and IAS 12 have been revised to incorporate amendments issued by the IASB in January 2016. The amendments to IAS 7 require entities to provide disclosures that enable users of financial statements to evaluate changes in liabilities arising from financing activities. The impact of the standard has been evaluated and is not expected to have material impact on the Company’s consolidated financial statements. Additional disclosure will be required on implementation of IAS 7 that provides a reconciliation between the opening and closing balances in the statement of financial position for liabilities arising from financing activities. The amendments to IAS 12 clarify how to account for deferred tax assets related to debt instruments measured at fair value. As the Company measures its debt instruments at amortized cost, the standard has no material impact on the Company’s consolidated financial statements.
5. SIGNIFICANT ACCOUNTING JUDGMENTS, ESTIMATES AND ASSUMPTIONS
(a) Judgments
The preparation of financial statements in accordance with IFRS requires management to make judgments, estimates and assumptions that affect the reported amounts of assets, liabilities, income and expenses. Actual results may differ from these estimates. The estimates and associated assumptions are based on historical experience and management’s judgment regarding other factors that are considered to be relevant and reasonable in the circumstances. Anticipating future events involves uncertainty and consequently the estimates used by management in the preparation of financial statements may change as future events unfold, additional experience is acquired or the Company’s operating environment changes.
IFRS requires that the Company’s oil and natural gas properties be aggregated into CGUs, based on their ability to generate largely independent cash flows, which are used to assess the properties for impairment. The determination of the Company’s CGUs is subject to management’s judgment. The Company’s assets are currently held in one CGU.
The Company applies judgment in determining the transfer of risks and rewards of ownership from the Company to its customers. Oil and natural gas revenues are recognized in accordance with this transfer, which typically occurs upon title of asset transfer, at which point cash consideration is receivable, or as products are taken in kind as consideration and the Company has no continuing involvement with the goods or services provided.
The Company assesses revenue agreements using specific criteria to determine whether it is acting as an agent or principal. The Company recognizes revenue on a gross basis when the Company is acting in a principal capacity and on a net basis when the Company is acting in an agent capacity. The Company has concluded it acts in an agent capacity for all revenue transactions whereby third party oil and natural gas volumes are purchased and sold and the Company recognizes the net revenues and net losses in transportation, processing expenses and other separately from liquids and natural gas sales in the Consolidated Statement of Operations.
SEVEN GENERATIONS 2016 Annual Report 77

The determination of the Company’s income tax and royalty liabilities requires interpretation of complex laws and regulations. As such, income taxes and royalties are subject to measurement uncertainty. All tax filings are subject to audit and potential reassessment after the lapse of considerable time. In addition, the recoverability of loss carryforwards and investment tax credits is uncertain. The Company records deferred income tax assets and liabilities using income tax rates substantively enacted at the balance sheet date.
(b) Estimates and Assumptions
The amounts recorded for depletion and depreciation of oil and natural gas properties are based on estimated recoverable reserves and future costs. The level of estimated recoverable reserves and associated future cash flows are also key determinants in assessing whether the carrying values of the Company’s oil and natural gas assets and goodwill have been impaired. By their nature, these estimates of reserves and future cash flows are subject to measurement uncertainty. Reserve estimates are determined in accordance with the standards contained in the Canadian Oil and Gas Evaluation Handbook. The determination of reserve estimates involves the exercise of judgment and the use of estimates for oil and natural gas volumes in place, recovery factors, production rates, future commodity prices and future royalty, operating and capital costs.
The Company’s provisions for decommissioning liabilities are based on judgments regarding interpretation of current legal and constructive requirements and estimates of future costs and expected timing for remediation. Actual costs may differ from estimated costs because of changes in laws and regulations, reserves, market conditions, discovery and analysis of site conditions and changes in technology.
The Company uses the Black-Scholes model to estimate the fair value of stock options and performance warrants granted. This requires assumptions regarding interest rates, dividend rates, the underlying volatility of the shares and the expected life and forfeitures of the stock options and performance warrants.
The estimated fair values of financial instruments, by their very nature, are subject to measurement uncertainty. Fair value of financial instruments, where active market quotes are not available, are estimated using the Company’s assessment of available market inputs and other assumptions. These estimates may vary from the actual prices that will be achieved upon settlement of the financial instruments.
Changes in Royalty Estimates
During the year ended December 31, 2016, the Company recognized $27.4 million in royalty recoveries for Gas Cost Allowance (“GCA”) credits and for planned amendments to past condensate royalties. The portion relating to GCA is a reduction of royalties payable to Alberta Energy to recognize capital and operating expenditures incurred in the gathering and processing of the Crown’s share of natural gas production. The majority of the GCA recoveries relate to 2015 actual eligible costs compared to estimates of those amounts previously used. The GCA adjustments were received from Alberta Energy in June 2016. During the year ended December 31, 2016, Seven Generations began reporting field condensate separately at the wellhead. Field condensate incurs royalties on a sliding scale basis whereas previously, the Company reported condensate as a natural gas equivalent which resulted in royalties at a fixed 40% rate before incentives. With the change in reporting, the Company recorded an estimate for planned amendments and anticipated refunds of past condensate royalties. The Company has accounted for all of these royalty adjustments as changes in estimates and accordingly reported the decrease to royalties expense for the year ended December 31, 2016.
Changes in Decommissioning Estimates
During the preparation of the fourth quarter 2016 estimates, management consulted an external engineering firm to assist with determining appropriate abandonment and reclamation estimates for the Company’s wholly owned facilities. The engineering firm considered recent experience dismantling similar facilities in the area. The results provided a more detailed inventory of the work to be performed and a $27.9 million increase was recognized as a change in estimate in other long term liabilities.
SEVEN GENERATIONS 2016 Annual Report78
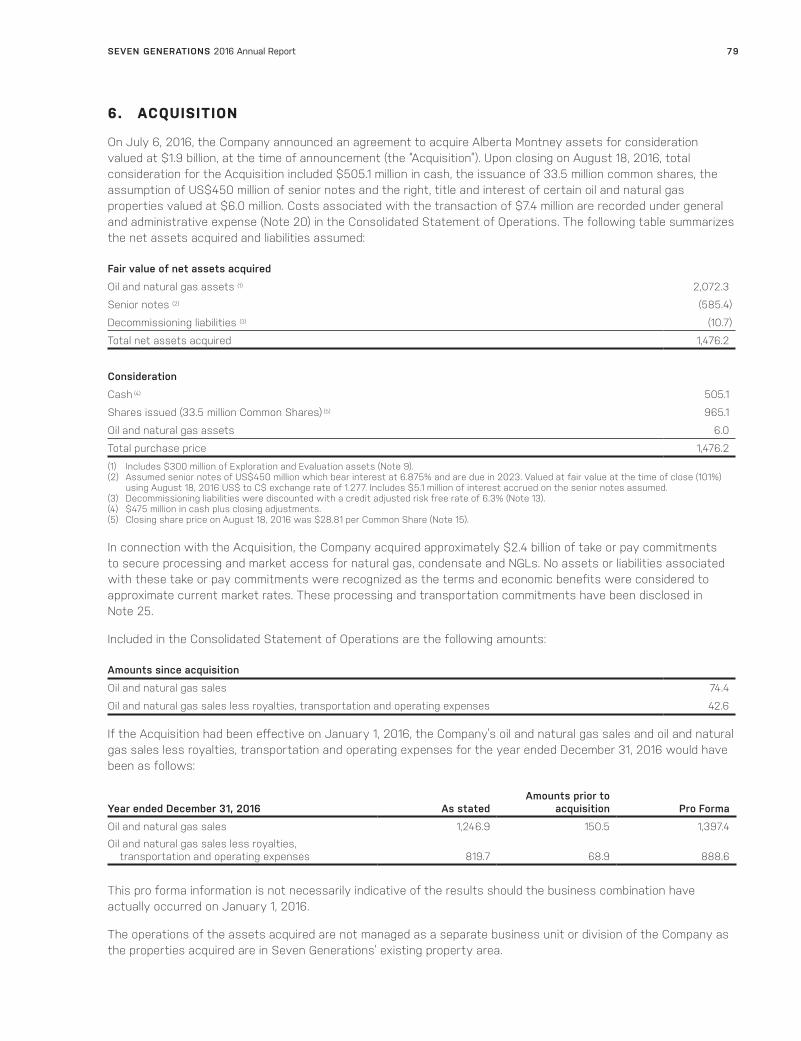
6. ACQUISITION
On July 6, 2016, the Company announced an agreement to acquire Alberta Montney assets for consideration valued at $1.9 billion, at the time of announcement (the “Acquisition”). Upon closing on August 18, 2016, total consideration for the Acquisition included $505.1 million in cash, the issuance of 33.5 million common shares, the assumption of US$450 million of senior notes and the right, title and interest of certain oil and natural gas properties valued at $6.0 million. Costs associated with the transaction of $7.4 million are recorded under general and administrative expense (Note 20) in the Consolidated Statement of Operations. The following table summarizes the net assets acquired and liabilities assumed:
Fair value of net assets acquired
Oil and natural gas assets (1) 2,072.3
Senior notes (2) (585.4)
Decommissioning liabilities (3) (10.7)
Total net assets acquired 1,476.2
Consideration
Cash (4) 505.1
Shares issued (33.5 million Common Shares) (5) 965.1
Oil and natural gas assets 6.0
Total purchase price 1,476.2
(1) Includes $300 million of Exploration and Evaluation assets (Note 9). (2) Assumed senior notes of US$450 million which bear interest at 6.875% and are due in 2023. Valued at fair value at the time of close (101%)
using August 18, 2016 US$ to C$ exchange rate of 1.277. Includes $5.1 million of interest accrued on the senior notes assumed. (3) Decommissioning liabilities were discounted with a credit adjusted risk free rate of 6.3% (Note 13). (4) $475 million in cash plus closing adjustments. (5) Closing share price on August 18, 2016 was $28.81 per Common Share (Note 15).
In connection with the Acquisition, the Company acquired approximately $2.4 billion of take or pay commitments to secure processing and market access for natural gas, condensate and NGLs. No assets or liabilities associated with these take or pay commitments were recognized as the terms and economic benefits were considered to approximate current market rates. These processing and transportation commitments have been disclosed in Note 25.
Included in the Consolidated Statement of Operations are the following amounts:
Amounts since acquisition
Oil and natural gas sales 74.4
Oil and natural gas sales less royalties, transportation and operating expenses 42.6
If the Acquisition had been effective on January 1, 2016, the Company’s oil and natural gas sales and oil and natural gas sales less royalties, transportation and operating expenses for the year ended December 31, 2016 would have been as follows:
Year ended December 31, 2016 As statedAmounts prior to
acquisition Pro Forma
Oil and natural gas sales 1,246.9 150.5 1,397.4
Oil and natural gas sales less royalties, transportation and operating expenses 819.7 68.9 888.6
This pro forma information is not necessarily indicative of the results should the business combination have actually occurred on January 1, 2016.
The operations of the assets acquired are not managed as a separate business unit or division of the Company as the properties acquired are in Seven Generations’ existing property area.
SEVEN GENERATIONS 2016 Annual Report 79

7. INVESTMENT IN ASSOCIATE
Investment in Steelhead LNG
In the third quarter of 2016, the Company invested $25.8 million in Steelhead LNG (“Steelhead LNG”) for a 34% equity interest, which is reported in the consolidated financial statements using the equity method of accounting given the judgment that Seven Generations has significant influence.
Steelhead LNG also granted Seven Generations an option to increase its ownership interest to 50%, subject to certain conditions, which terminates upon the earlier of (i) one year from the Company’s investment in Steelhead LNG and (ii) thirty days from Steelhead LNG signing a binding offtake agreement that meets certain thresholds.
Steelhead LNG is a Vancouver-based energy company focused on the development of LNG projects in British Columbia.
For the year ended December 31, 2016, the Company’s share of Steelhead LNG Limited Partnership’s net loss was $3.9 million recognized in market access initiatives expense in the Consolidated Statement of Operations.
Market Access Initiatives with Steelhead LNG
Concurrent with the investment in Steelhead LNG, the Company entered into a development arrangement with Steelhead LNG, in which the Company agreed to contribute $3.0 million in cash and committed to invest up to $9.0 million to participate in the pre-development of transportation alternatives to the West Coast of British Columbia. At December 31, 2016, the Company had incurred $1.1 million of the $9.0 million committed capital. Subsequent to year end, the Company was issued an additional 3.0 million units in Steelhead LNG for the $3.0 million cash contributed for the development arrangement.
Steelhead LNG and Seven Generations have also entered into an option agreement under which Seven Generations has an option to supply natural gas to any LNG facility developed by Steelhead LNG on the West Coast of British Columbia upon fulfillment of certain terms and conditions.
Due to common directorships and certain significant shareholders, these transactions were considered related party transactions and measured at the exchange value. Azimuth Capital Management (“Azimuth”) has a majority ownership in Steelhead LNG. Three of Seven Generations’ directors have professional ties to Azimuth.
At the end of each reporting period, the Company reviews for impairment indicators to ensure that the carrying value of its investments in associates is recoverable. At December 31, 2016, there were no indicators of impairment.
For the year ended December 31, 2016, the Company recorded $4.1 million included in market access initiatives expense in the Consolidated Statement of Operations for the costs incurred on pre-development of transportation alternatives.
8. CASH AND CASH EQUIVALENTS
As at December 31, 2016 2015
Cash 325.5 77.1
GIC collateral accounts, bearing interest at a weighted average rate of 0.9% (1) 59.2 –
Short term investments, bearing interest at a weighted average rate of 0.8% (December 31, 2015 – 0.7%) 246.1 327.9
Cash and cash equivalents 630.8 405.0
(1) Cash and cash equivalents includes two unrestricted interest-bearing, cash collateral Guaranteed Investment Certificates (“GIC collateral accounts”) into which the Company is required to deposit cash to secure letters of credit issued under the Company’s $1.1 billion revolving credit facility that was entered into on November 30, 2016 (Note 10). As at December 31, 2016, the GIC Collateral accounts included $35.3 million as Canadian dollar GIC collateral and $23.9 million as US dollar GIC collateral (US$17.8 million).
SEVEN GENERATIONS 2016 Annual Report80

9. OIL AND NATURAL GAS ASSETS
Exploration andevaluation
Developed andproducing Other (1) Total
Cost
Balance at December 31, 2014 214.5 2,089.7 10.3 2,314.5
Additions 13.5 1,293.6 1.9 1,309.0
Dispositions (5.4) 2.0 – (3.4)
Non-cash capitalized costs (2) – 37.7 – 37.7
Balance at December 31, 2015 222.6 3,423.0 12.2 3,657.8
Acquisition (Note 6) 300.0 1,772.3 – 2,072.3
Additions – 976.1 1.9 978.0
Dispositions (Note 6) – (6.0) – (6.0)
Transfers (11.0) 11.0 – –
Non-cash capitalized costs (2) – 75.9 – 75.9
Balance at December 31, 2016 511.6 6,252.3 14.1 6,778.0
Accumulated depletion, depreciation and amortization
Balance at December 31, 2014 – 259.0 1.8 260.8
Depletion, depreciation and amortization expense – 282.0 1.5 283.5
Balance at December 31, 2015 – 541.0 3.3 544.3
Depletion, depreciation and amortization expense – 481.5 2.1 483.6
Balance at December 31, 2016 – 1,022.5 5.4 1,027.9
Net book value
Balance at December 31, 2015 222.6 2,882.0 8.9 3,113.5
Balance at December 31, 2016 511.6 5,229.8 8.7 5,750.1
(1) Comparative figures have been reclassified to conform to current period presentation. (2) For year ended December 31, 2016, non-cash capitalized costs include $68.0 million of decommissioning obligation assets (year ended
December 31, 2015 – $25.3 million) and $0.1 million of borrowing costs.
As at December 31, 2016, the calculation for depletion included an estimated $10.7 billion (December 31, 2015 – $6.4 billion) for future development capital associated with undeveloped estimated recoverable proved plus probable reserves and excluded $459.7 million (December 31, 2015 – $149.0 million) for the cost of undeveloped land for which no recoverable reserves have been assigned and $383.9 million for tangible oil and natural gas assets depreciated and other capital projects not yet in use (December 31, 2015 – $392.0 million).
During the year ended December 31, 2016, the Company capitalized $17.0 million (year ended December 31, 2015 – $15.8 million) of general and administrative expenses based on direct salaries and benefits paid to development personnel specifically related to capital activities, including $7.7 million (year ended December 31, 2015 – $6.0 million) related to stock based compensation.
During the year ended December 31, 2016, the Company capitalized $3.7 million of borrowing costs (year ended December 31, 2015 – $4.4 million).
During the year ended December 31, 2015, the Company closed asset swap arrangements in which non-producing assets were acquired and non-producing assets were disposed of. For purposes of determining the gain on disposition, the estimated fair market value was based on the fair value of the assets received. The Company recorded a gain of $2.6 million for the year ended December 31, 2015.
At the end of each reporting period, the Company reviews for indicators of impairment to ensure that the carrying value of its oil and natural gas properties and associated goodwill is recoverable. At December 31, 2016 and 2015, there were no indicators of impairment.
SEVEN GENERATIONS 2016 Annual Report 81
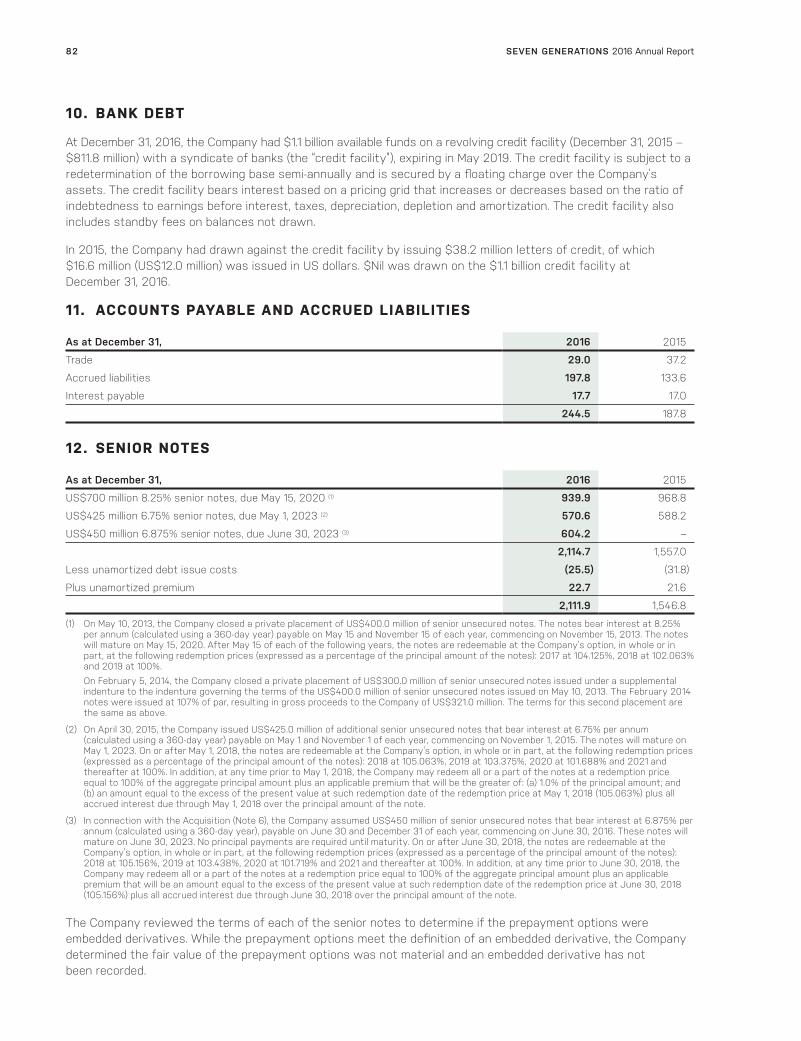
10. BANK DEBT
At December 31, 2016, the Company had $1.1 billion available funds on a revolving credit facility (December 31, 2015 – $811.8 million) with a syndicate of banks (the “credit facility”), expiring in May 2019. The credit facility is subject to a redetermination of the borrowing base semi-annually and is secured by a floating charge over the Company’s assets. The credit facility bears interest based on a pricing grid that increases or decreases based on the ratio of indebtedness to earnings before interest, taxes, depreciation, depletion and amortization. The credit facility also includes standby fees on balances not drawn.
In 2015, the Company had drawn against the credit facility by issuing $38.2 million letters of credit, of which $16.6 million (US$12.0 million) was issued in US dollars. $Nil was drawn on the $1.1 billion credit facility at December 31, 2016.
11. ACCOUNTS PAYABLE AND ACCRUED LIABILITIES
As at December 31, 2016 2015
Trade 29.0 37.2
Accrued liabilities 197.8 133.6
Interest payable 17.7 17.0
244.5 187.8
12. SENIOR NOTES
As at December 31, 2016 2015
US$700 million 8.25% senior notes, due May 15, 2020 (1) 939.9 968.8
US$425 million 6.75% senior notes, due May 1, 2023 (2) 570.6 588.2
US$450 million 6.875% senior notes, due June 30, 2023 (3) 604.2 –
2,114.7 1,557.0
Less unamortized debt issue costs (25.5) (31.8)
Plus unamortized premium 22.7 21.6
2,111.9 1,546.8
(1) On May 10, 2013, the Company closed a private placement of US$400.0 million of senior unsecured notes. The notes bear interest at 8.25% per annum (calculated using a 360-day year) payable on May 15 and November 15 of each year, commencing on November 15, 2013. The notes will mature on May 15, 2020. After May 15 of each of the following years, the notes are redeemable at the Company’s option, in whole or in part, at the following redemption prices (expressed as a percentage of the principal amount of the notes): 2017 at 104.125%, 2018 at 102.063% and 2019 at 100%.
On February 5, 2014, the Company closed a private placement of US$300.0 million of senior unsecured notes issued under a supplemental indenture to the indenture governing the terms of the US$400.0 million of senior unsecured notes issued on May 10, 2013. The February 2014 notes were issued at 107% of par, resulting in gross proceeds to the Company of US$321.0 million. The terms for this second placement are the same as above.
(2) On April 30, 2015, the Company issued US$425.0 million of additional senior unsecured notes that bear interest at 6.75% per annum (calculated using a 360-day year) payable on May 1 and November 1 of each year, commencing on November 1, 2015. The notes will mature on May 1, 2023. On or after May 1, 2018, the notes are redeemable at the Company’s option, in whole or in part, at the following redemption prices (expressed as a percentage of the principal amount of the notes): 2018 at 105.063%, 2019 at 103.375%, 2020 at 101.688% and 2021 and thereafter at 100%. In addition, at any time prior to May 1, 2018, the Company may redeem all or a part of the notes at a redemption price equal to 100% of the aggregate principal amount plus an applicable premium that will be the greater of: (a) 1.0% of the principal amount; and (b) an amount equal to the excess of the present value at such redemption date of the redemption price at May 1, 2018 (105.063%) plus all accrued interest due through May 1, 2018 over the principal amount of the note.
(3) In connection with the Acquisition (Note 6), the Company assumed US$450 million of senior unsecured notes that bear interest at 6.875% per annum (calculated using a 360-day year), payable on June 30 and December 31 of each year, commencing on June 30, 2016. These notes will mature on June 30, 2023. No principal payments are required until maturity. On or after June 30, 2018, the notes are redeemable at the Company’s option, in whole or in part, at the following redemption prices (expressed as a percentage of the principal amount of the notes): 2018 at 105.156%, 2019 at 103.438%, 2020 at 101.719% and 2021 and thereafter at 100%. In addition, at any time prior to June 30, 2018, the Company may redeem all or a part of the notes at a redemption price equal to 100% of the aggregate principal amount plus an applicable premium that will be an amount equal to the excess of the present value at such redemption date of the redemption price at June 30, 2018 (105.156%) plus all accrued interest due through June 30, 2018 over the principal amount of the note.
The Company reviewed the terms of each of the senior notes to determine if the prepayment options were embedded derivatives. While the prepayment options meet the definition of an embedded derivative, the Company determined the fair value of the prepayment options was not material and an embedded derivative has not been recorded.
SEVEN GENERATIONS 2016 Annual Report82

The US dollar denominated senior notes were translated into Canadian dollars at the year end exchange rate of US$1=C$1.34 (December 31, 2015 – US$1=C$1.38).
Subject to certain exceptions and qualifications, the senior unsecured notes have no financial covenants but limit the Company’s ability to, among other things: make certain payments and distributions; incur additional indebtedness; issue disqualified or preferred stock; create or permit liens to exist; make certain dispositions; transfers of assets; and engage in amalgamations, mergers or consolidations. At December 31, 2016, the Company was in compliance with the covenants of the senior notes.
The notes are carried at amortized cost, net of transaction costs. The notes accrete up to the principal balance on maturity using the effective interest rate method and an effective interest rate of 6.6%, 7.0%, 7.3% and 8.6% for the 2016 assumed notes and the 2015, 2014 and 2013 issuances, respectively. Canadian dollar to US dollar exchange rates at the time of the assumption of the 6.875% 2016 notes was 0.783 and for the 2015, 2014 and 2013 issuances were 0.825, 0.901 and 0.940, respectively.
13. OTHER LONG-TERM LIABILITIES
As at December 31, 2016 2015
Decommissioning liabilities 160.7 79.1
Onerous lease 3.6 –
Deferred credits (1) 0.7 0.9
Total other long-term liabilities 165.0 80.0
(1) At December 31, 2016, the Company held $0.7 million of deferred credits for lease inducements (December 31, 2015 – $0.9 million).
Decommissioning Liabilities
2016 2015
Balance, beginning of year 79.1 52.2
Liabilities incurred 21.3 25.2
Liabilities acquired through Acquisition (Note 6) 10.7 –
Changes in estimates 27.9 (1.1)
Changes in discount rates (1) 18.9 1.1
Accretion 2.8 1.7
Balance, end of year 160.7 79.1
(1) Changes in discount rates includes a $20.5 million increase to acquired liabilities for the decrease from the 6.3% credit adjusted risk free rate at acquisition to a risk free rate of 2.3% at period end.
The total future decommissioning liability was estimated based on the Company’s net ownership interest in all wells and facilities, the estimated costs to abandon and reclaim the wells and facilities and the estimated timing of the costs to be incurred in future periods. The total undiscounted amount of the estimated cash flows required to settle the decommissioning liabilities at December 31, 2016 is approximately $310.6 million (December 31, 2015 – $139.1 million) which is expected to be incurred over the next 35 years with the majority of costs incurred between 2041 and 2051. At December 31, 2016, a risk free rate of 2.3% (December 31, 2015 – 2.2%) and an inflation rate of 2.0% (December 31, 2015 – 2.0%) were used to calculate the provision for decommissioning liabilities.
Onerous Lease
During the year ended December 31, 2016, the Company recorded a $3.6 million provision related to one of the Company’s office leases, which has been determined to be an onerous contract. The provision represents the present value of the difference between the minimum future lease payments that the Company is obligated to make under the non-cancellable operating lease contract and estimated sublease recoveries. The undiscounted amount of estimated future cash flows to settle the obligations was $4.8 million. These cashflows have been discounted using a risk-free rate of 1.6%. The onerous contract provision is estimated to be settled in periods up to the year 2023.
SEVEN GENERATIONS 2016 Annual Report 83

14. INCOME TAXES
The provision for income tax expense is different from the amount computed by applying the combined Canadian federal and provincial income tax rate to income (loss) before income taxes. The reasons for the differences are as follows:
Years ended December 31, 2016 2015
Loss before taxes (33.6) (125.4)
Statutory income tax rate 27% 26%
Expected income tax recovery (9.1) (32.6)
Add (deduct):
Non-deductible stock based compensation 4.9 3.6
Non-taxable portion of foreign exchange capital (gains) losses (2.2) 29.2
Non-deductible tax position – IceFyre – 22.6
Change in unrecognized deferred tax asset (1.2) 31.6
Other and change in tax rates 0.2 7.5
Income tax (recovery) expense (7.4) 61.9
During the year ended December 31, 2015, the Canada Revenue Agency challenged tax losses utilized by the Company which were derived from the Company’s predecessor entity, IceFyre Semiconductor Corporation and resulted in a $22.6 million tax effected decrease to the Company’s tax pools.
For the year ended December 31, 2016, $1.4 million was recorded for current income tax expense relating to foreign sourced income earned from the Company’s subsidiary in the United States. Total tax pools in Canada at December 31, 2016 were $5.0 billion (December 31, 2015 – $2.7 billion). Of this amount, $0.9 billion is available for deduction against taxable income for the current fiscal year. Non-capital losses begin expiring in 2034. Included in the unrecognized deferred tax asset are foreign exchange capital losses of $37.9 million and $1.0 million related to investments in associates.
Changes in the components of the deferred tax liability are as follows:
January 1, 2016 Movement December 31, 2016
Property, plant and equipment 193.0 142.3 335.3
Mark-to-market financial instruments 33.3 (73.6) (40.3)
Non-capital losses (63.1) (61.6) (124.7)
Decommissioning liabilities (21.4) (22.0) (43.4)
Financing costs (10.9) (4.9) (15.8)
Unrealized foreign exchange losses (40.0) 2.1 (37.9)
Other (1.3) (1.6) (2.9)
89.6 (19.3) 70.3
Unrecognized deferred tax asset 39.8 (1.3) 38.5
129.4 (20.6) 108.8
SEVEN GENERATIONS 2016 Annual Report84

January 1, 2015 Movement December 31, 2015
Property, plant and equipment 79.1 113.9 193.0
Mark-to-market financial instruments 34.8 (1.5) 33.3
Investment tax credits (9.1) 9.1 –
Non-capital losses (4.7) (58.4) (63.1)
Decommissioning liabilities (13.0) (8.4) (21.4)
Financing costs (12.5) 1.6 (10.9)
Unrealized foreign exchange losses (8.9) (31.1) (40.0)
Other (5.3) 4.0 (1.3)
60.4 29.2 89.6
Unrecognized deferred tax asset 8.2 31.6 39.8
68.6 60.8 129.4
The changes in the deferred tax liability were allocated to:
Years ended December 31, 2016 2015
Income statement (8.8) 61.8
Share capital (11.8) (1.0)
(20.6) 60.8
15. SHARE CAPITAL
The Company’s authorized share capital consists of an unlimited number of Class A Common Voting Shares, Class B Common Non-Voting Shares, Preferred A, B, C and D Shares and Special Voting Shares. There are no Class B Common Non-Voting Shares, Preferred Shares or Special Voting Shares issued and outstanding.
The following tables summarize changes to the Company’s Common Share capital:
2016 2015
Years ended December 31, Number (millions) Amount ($) Number (millions) Amount ($)
Class A Common Voting SharesBalance, beginning of year 254.4 1,775.7 244.7 1,716.1
Issued for cash (a) (b) 52.1 1,047.7 – –
Issued for Acquisition (c) 33.5 965.1 – –
Share issue costs, net of deferred tax (1) – (31.8) – 1.1
Issued on exercise of stock options and performance warrants 10.3 55.7 8.7 41.9
Transfer from contributed surplus on exercise of stock options – 18.1 – 12.9
Conversion of Class B Common Non-voting Shares (2) – – 1.0 3.7
Balance, end of year 350.3 3,830.5 254.4 1,775.7
(1) Gross share issue costs were $43.8 million for the year ended December 31, 2016 (2015 – $Nil). (2) On conversion of Class B Non-Voting Shares into Class A Common Voting Shares, holders received two Class A Common Voting Shares for
each Class B Non-Voting Share converted.
(a) On February 24, 2016, the Company completed a private placement of 21.4 million Common Shares at a price of $14.00 per share for gross proceeds of $300.0 million. Net proceeds after commissions and expenses were approximately $287.0 million.
(b) On July 26, 2016, the Company closed a bought-deal financing issuing 30.7 million Subscription Receipts at $24.35 per Subscription Receipt for gross proceeds of $747.7 million. Each holder of Subscription Receipts received one Common Share for each Subscription Receipt held upon the closing of the Acquisition. Net proceeds after commissions and expenses were approximately $717.7 million.
SEVEN GENERATIONS 2016 Annual Report 85

(c) On August 18, 2016, the Company closed the Acquisition and as part of the consideration, issued 33.5 million Common Shares (Note 6). The closing price of the Common Shares on August 18, 2016 was $28.81 per share.
Class B Non-Voting Shares
During the year ended December 31, 2016, the two thousand remaining Class B Non-Voting Shares were converted into Class A Common Voting Shares, where holders received two Class A Common Voting Shares for each Class B Non-Voting Share (December 31, 2015 – 526 thousand Class B Non-Voting Shares converted). At December 31, 2016, Nil Class B Non-Voting were issued and outstanding (December 31, 2015, two thousand).
16. STOCK BASED COMPENSATION
Stock Options
The Company’s stock option plan allows for the granting of options to directors, officers, employees and service providers of the Company. Options granted are generally fully exercisable for Class A Common Voting Shares after three years and expire 10 years after the grant date.
The following table sets forth a reconciliation of stock options exercisable into Class A Common Voting Shares:
Year ended December 31, 2016 Year ended December 31, 2015
Number (millions) Exercise price ($) Number (millions) Exercise price ($)
Balance, beginning of year 12.0 8.43 12.4 6.71
Granted 2.6 29.81 2.3 13.19
Exercised (3.2) 5.62 (2.4) 3.74
Forfeited (0.2) 19.35 (0.3) 12.58
Balance, end of year 11.2 13.95 12.0 8.43
A summary of stock options outstanding and exercisable into Common Shares at December 31, 2016 is as follows:
Options outstanding Options exercisable
Exercise price ($)Number of
options (millions)Weighted average
remaining life (years)Number of
options (millions)Weighted average
remaining life (years)
2.50 – 5.49 2.4 1.1 2.4 1.1
5.50 – 12.49 3.6 5.4 2.6 4.0
12.50 – 17.49 0.5 7.1 0.1 6.1
17.50 – 20.00 2.3 4.8 1.4 4.6
20.00 – 30.90 2.4 9.7 0.0 9.8
11.2 5.4 6.4 3.1
The fair value of stock options granted was estimated using the Black-Scholes pricing model with the following weighted average assumptions:
Years ended December 31, 2016 2015
Fair value of options granted ($/option) 12.92 6.67
Risk-free interest rate (%) 0.82 0.79
Expected life (years) 6.0 5.0
Expected forfeiture rate (%) 4.4 4.0
Expected volatility (%) (1) 45.2 60.0
Expected dividend yield (%) – –
(1) Expected volatility is estimated by using the historical price movements of the Company’s common shares.
SEVEN GENERATIONS 2016 Annual Report86

Performance Warrants
Prior to the Company’s Initial Public Offering (“IPO”) that was completed on November 5, 2014, Seven Generations issued performance warrants to its directors, officers, and employees. These performance warrants were granted pursuant to the Amended and Restated Shareholder Agreement effective while Seven Generations was a private company. After the November 5, 2014 closing of the IPO, no additional performance warrants may be granted.
The following table sets forth a reconciliation of performance warrants exercisable into Common Shares:
2016 2015
Number (millions) Exercise price ($) Number (millions) Exercise price ($)
Balance, beginning of year 18.5 6.14 25.9 5.99
Exercised (7.1) 5.37 (6.2) 5.27
Forfeited – 9.12 (1.2) 7.30
Balance, end of year 11.4 6.62 18.5 6.14
A summary of performance warrants outstanding and exercisable into Common Shares at December 31, 2016 is as follows:
Warrants outstanding Warrants exercisableWeighted average exercise price ($)
Number of warrants (millions)
Weighted averageremaining life (years)
Number of warrants (millions)
Weighted averageremaining life (years)
3.75 – 5.25 3.8 1.1 3.8 1.1
5.26 – 5.85 1.8 3.0 1.1 2.9
5.86 – 12.50 4.9 1.5 4.4 1.3
12.50 – 17.50 1.0 4.4 0.3 4.4
11.4 1.9 9.6 1.5
Share Units
The Performance and Restricted Share Unit Plan (“PRSU Plan”) allows for the granting of RSUs and PSUs to officers and employees of the Company. RSUs and PSUs represent the right for the holder to receive Common Voting Shares or, at the election of the holder and the Company, a cash payment equal to the fair market value of the Common Shares calculated at the date of such payment. RSUs and PSUs granted to date under the PRSU Plan generally vest annually over a three year period.
The vesting of PSUs are conditional on the satisfaction of certain performance criteria as determined by the Company’s Board of Directors. If the Company satisfies the performance criteria, PSUs become eligible to vest and a pre-determined multiplier is applied to eligible PSUs. In calculating stock based compensation for the PSUs the Company used an adjustment factor of 1.0, which assumed that the Company will be within the 50% percentile of its relative peer group, based on total shareholder return at the respective vesting dates. Upon vest date in the second quarter of 2016, the performance criteria for the first tranche of vested PSUs met the highest performance multiplier of 2.0 for total shareholder return criteria relative to the Company’s peer group resulting in an additional issue of 48,817 PSUs. For the year ended December 31, 2016, share based compensation expense relating to the PSUs was $2.8 million (for the year ended December 31, 2015 – $0.8 million). Assuming the highest performance multiplier, as at December 31, 2016, the maximum number of Common Shares issuable pertaining to the outstanding PSUs is 0.7 million.
SEVEN GENERATIONS 2016 Annual Report 87

The following table sets forth a reconciliation of PSUs and RSUs exercisable into Common Shares:
2016 2015
Years ended December 31, Number (millions) Number (millions)
Balance, beginning of year 0.4 –
Granted 0.2 0.4
Balance, end of year 0.6 0.4
As at December 31, 2016, the outstanding balance was comprised of 0.4 million PSUs and 0.2 million RSUs, with a weighted average remaining life of 8.9 years. The fair value of PRSUs granted for the year ended December 31, 2016 was $21.54 per unit (year ended December 31, 2015 – $12.11) using a 4% forfeiture rate (December 31, 2015 – 4%).
The Deferred Share Unit Plan (“DSU Plan”) allows for granting of DSUs to directors of the Company. DSUs represent the right for the holder to receive Common Shares or, at the election of the holder and the Company, a cash payment equal to the fair market value of the Common Shares calculated at the date of such payment. DSUs granted under the DSU Plan generally vest immediately upon grant.
The following table sets forth a reconciliation of DSUs exercisable into Class A Common Voting Shares:
2016 2015
Years ended December 31, Number (millions) Number (millions)
Balance, beginning of year 0.1 –
Granted – 0.1
Balance, end of year 0.1 0.1
The weighted average fair value of DSUs for the year ended December 31, 2016 was $27.80 per unit (year ended December 31, 2015 – $13.63) using a nil% forfeiture rate (December 31, 2015 – nil%).
17. PER SHARE AMOUNTS
Basic and diluted per share amounts have been calculated based on the following:
Years ended December 31, 2016 2015
(millions)
Weighted average number of Common Shares – basic 299.8 249.6
Effect of outstanding stock options, performance warrants and equity compensation units (1) – –
Weighted average number of Common Shares – diluted 299.8 249.6
(1) For the year ended December 31, 2016, 6.5 million stock options and 12.1 million performance warrants (December 31, 2015 – 6.8 million stock options and 13.9 million performance warrants) have been excluded from the diluted earnings per share calculation since these are anti-dilutive as the Company was in a net loss position.
18. OPERATING EXPENSES
Years ended December 31, 2016 2015
Equipment rental and maintenance 62.0 30.5
Trucking and disposal 56.6 31.4
Staff and contractor costs (1) 25.7 16.0
Chemicals and fuel 25.4 15.0
Other 12.2 8.3
Operating expenses 181.9 101.2
(1) The Company incurred $31.5 million of field staff and contractor costs for the year ended December 31, 2016 (2015 – $22.1 million), of which $25.7 million (2015 – $16.0 million) was recorded as staff and contractor costs in operating expense and $5.8 million was capitalized to oil and natural gas assets (2015 – $6.1 million). Staff and contractor costs include salaries, benefits and contractor costs.
SEVEN GENERATIONS 2016 Annual Report88
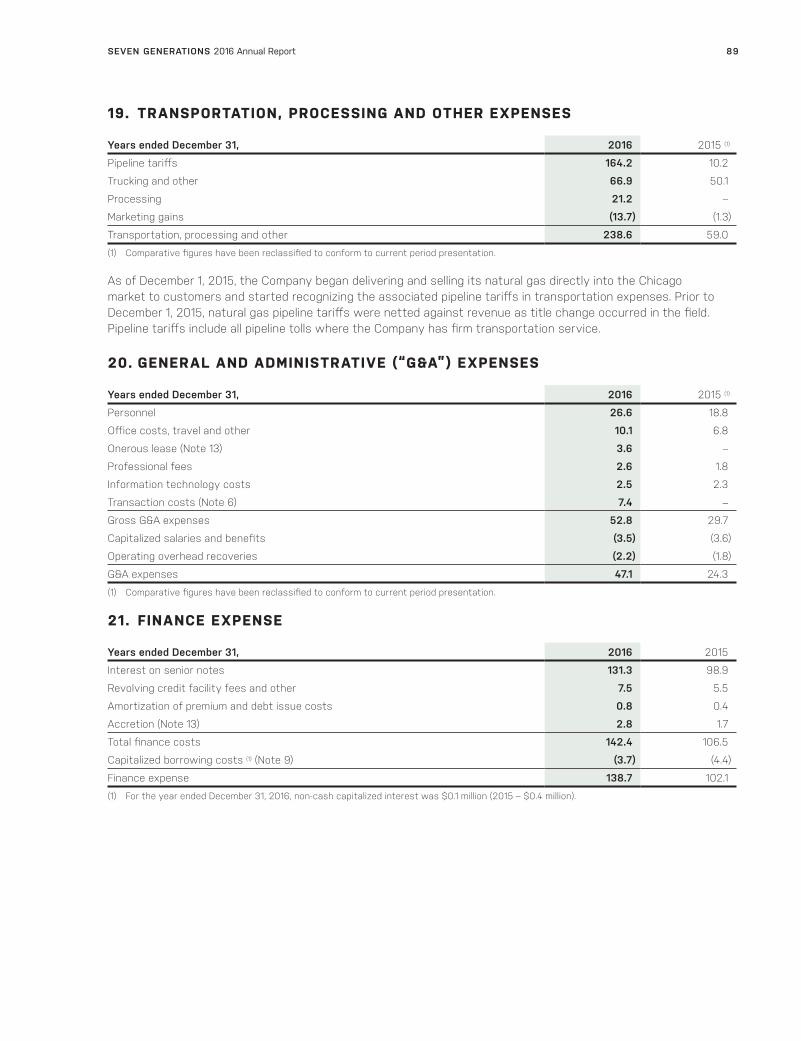
19. TRANSPORTATION, PROCESSING AND OTHER EXPENSES
Years ended December 31, 2016 2015 (1)
Pipeline tariffs 164.2 10.2
Trucking and other 66.9 50.1
Processing 21.2 –
Marketing gains (13.7) (1.3)
Transportation, processing and other 238.6 59.0
(1) Comparative figures have been reclassified to conform to current period presentation.
As of December 1, 2015, the Company began delivering and selling its natural gas directly into the Chicago market to customers and started recognizing the associated pipeline tariffs in transportation expenses. Prior to December 1, 2015, natural gas pipeline tariffs were netted against revenue as title change occurred in the field. Pipeline tariffs include all pipeline tolls where the Company has firm transportation service.
20. GENERAL AND ADMINISTRATIVE (“G&A”) EXPENSES
Years ended December 31, 2016 2015 (1)
Personnel 26.6 18.8
Office costs, travel and other 10.1 6.8
Onerous lease (Note 13) 3.6 –
Professional fees 2.6 1.8
Information technology costs 2.5 2.3
Transaction costs (Note 6) 7.4 –
Gross G&A expenses 52.8 29.7
Capitalized salaries and benefits (3.5) (3.6)
Operating overhead recoveries (2.2) (1.8)
G&A expenses 47.1 24.3
(1) Comparative figures have been reclassified to conform to current period presentation.
21. FINANCE EXPENSE
Years ended December 31, 2016 2015
Interest on senior notes 131.3 98.9
Revolving credit facility fees and other 7.5 5.5
Amortization of premium and debt issue costs 0.8 0.4
Accretion (Note 13) 2.8 1.7
Total finance costs 142.4 106.5
Capitalized borrowing costs (1) (Note 9) (3.7) (4.4)
Finance expense 138.7 102.1
(1) For the year ended December 31, 2016, non-cash capitalized interest was $0.1 million (2015 – $0.4 million).
SEVEN GENERATIONS 2016 Annual Report 89
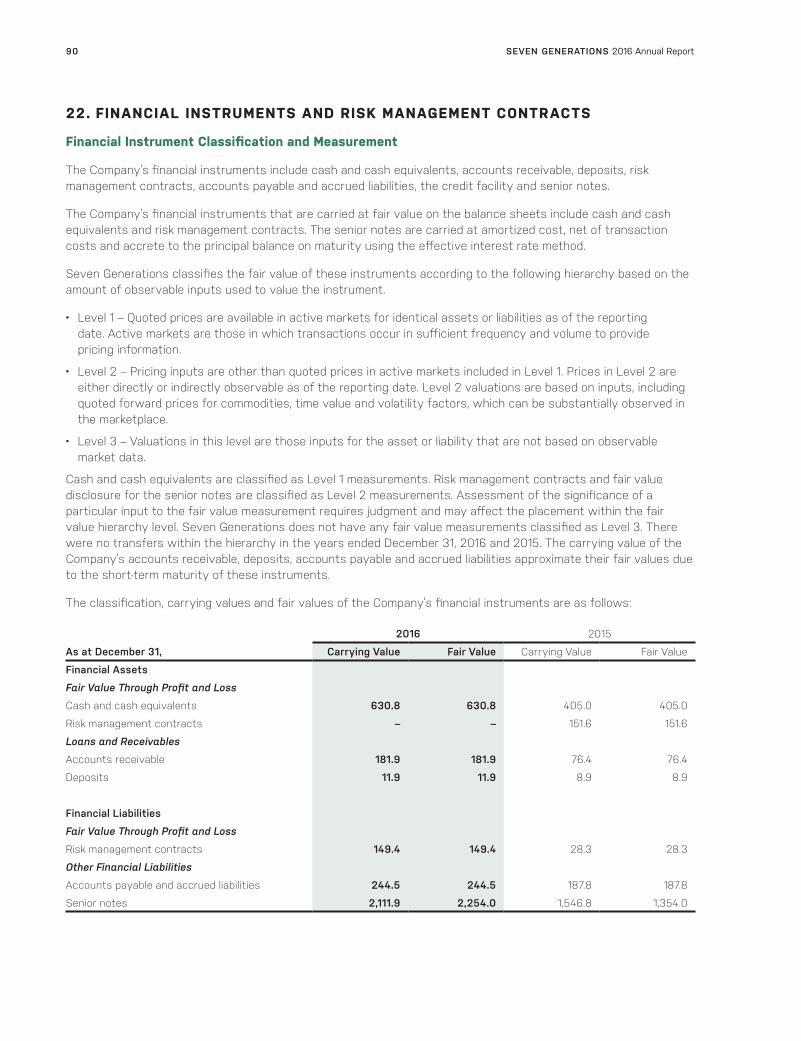
22. FINANCIAL INSTRUMENTS AND RISK MANAGEMENT CONTRACTS
Financial Instrument Classification and Measurement
The Company’s financial instruments include cash and cash equivalents, accounts receivable, deposits, risk management contracts, accounts payable and accrued liabilities, the credit facility and senior notes.
The Company’s financial instruments that are carried at fair value on the balance sheets include cash and cash equivalents and risk management contracts. The senior notes are carried at amortized cost, net of transaction costs and accrete to the principal balance on maturity using the effective interest rate method.
Seven Generations classifies the fair value of these instruments according to the following hierarchy based on the amount of observable inputs used to value the instrument.
• Level 1 – Quoted prices are available in active markets for identical assets or liabilities as of the reporting date. Active markets are those in which transactions occur in sufficient frequency and volume to provide pricing information.
• Level 2 – Pricing inputs are other than quoted prices in active markets included in Level 1. Prices in Level 2 are either directly or indirectly observable as of the reporting date. Level 2 valuations are based on inputs, including quoted forward prices for commodities, time value and volatility factors, which can be substantially observed in the marketplace.
• Level 3 – Valuations in this level are those inputs for the asset or liability that are not based on observable market data.
Cash and cash equivalents are classified as Level 1 measurements. Risk management contracts and fair value disclosure for the senior notes are classified as Level 2 measurements. Assessment of the significance of a particular input to the fair value measurement requires judgment and may affect the placement within the fair value hierarchy level. Seven Generations does not have any fair value measurements classified as Level 3. There were no transfers within the hierarchy in the years ended December 31, 2016 and 2015. The carrying value of the Company’s accounts receivable, deposits, accounts payable and accrued liabilities approximate their fair values due to the short-term maturity of these instruments.
The classification, carrying values and fair values of the Company’s financial instruments are as follows:
As at December 31,
2016 2015
Carrying Value Fair Value Carrying Value Fair Value
Financial Assets
Fair Value Through Profit and Loss
Cash and cash equivalents 630.8 630.8 405.0 405.0
Risk management contracts – – 151.6 151.6
Loans and Receivables
Accounts receivable 181.9 181.9 76.4 76.4
Deposits 11.9 11.9 8.9 8.9
Financial Liabilities
Fair Value Through Profit and Loss
Risk management contracts 149.4 149.4 28.3 28.3
Other Financial Liabilities
Accounts payable and accrued liabilities 244.5 244.5 187.8 187.8
Senior notes 2,111.9 2,254.0 1,546.8 1,354.0
SEVEN GENERATIONS 2016 Annual Report90
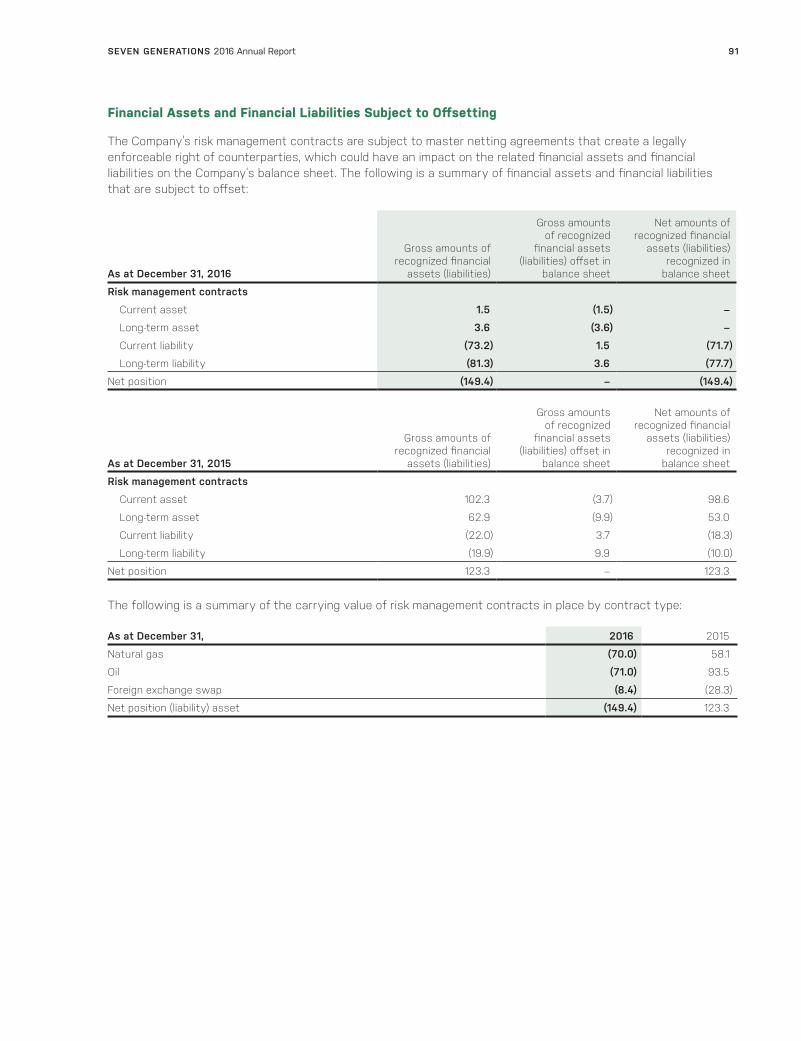
Financial Assets and Financial Liabilities Subject to Offsetting
The Company’s risk management contracts are subject to master netting agreements that create a legally enforceable right of counterparties, which could have an impact on the related financial assets and financial liabilities on the Company’s balance sheet. The following is a summary of financial assets and financial liabilities that are subject to offset:
As at December 31, 2016
Gross amounts of recognized financial
assets (liabilities)
Gross amounts of recognized
financial assets (liabilities) offset in
balance sheet
Net amounts of recognized financial
assets (liabilities) recognized in
balance sheet
Risk management contracts
Current asset 1.5 (1.5) –
Long-term asset 3.6 (3.6) –
Current liability (73.2) 1.5 (71.7)
Long-term liability (81.3) 3.6 (77.7)
Net position (149.4) – (149.4)
As at December 31, 2015
Gross amounts of recognized financial
assets (liabilities)
Gross amounts of recognized
financial assets (liabilities) offset in
balance sheet
Net amounts of recognized financial
assets (liabilities) recognized in
balance sheet
Risk management contracts
Current asset 102.3 (3.7) 98.6
Long-term asset 62.9 (9.9) 53.0
Current liability (22.0) 3.7 (18.3)
Long-term liability (19.9) 9.9 (10.0)
Net position 123.3 – 123.3
The following is a summary of the carrying value of risk management contracts in place by contract type:
As at December 31, 2016 2015
Natural gas (70.0) 58.1
Oil (71.0) 93.5
Foreign exchange swap (8.4) (28.3)
Net position (liability) asset (149.4) 123.3
SEVEN GENERATIONS 2016 Annual Report 91
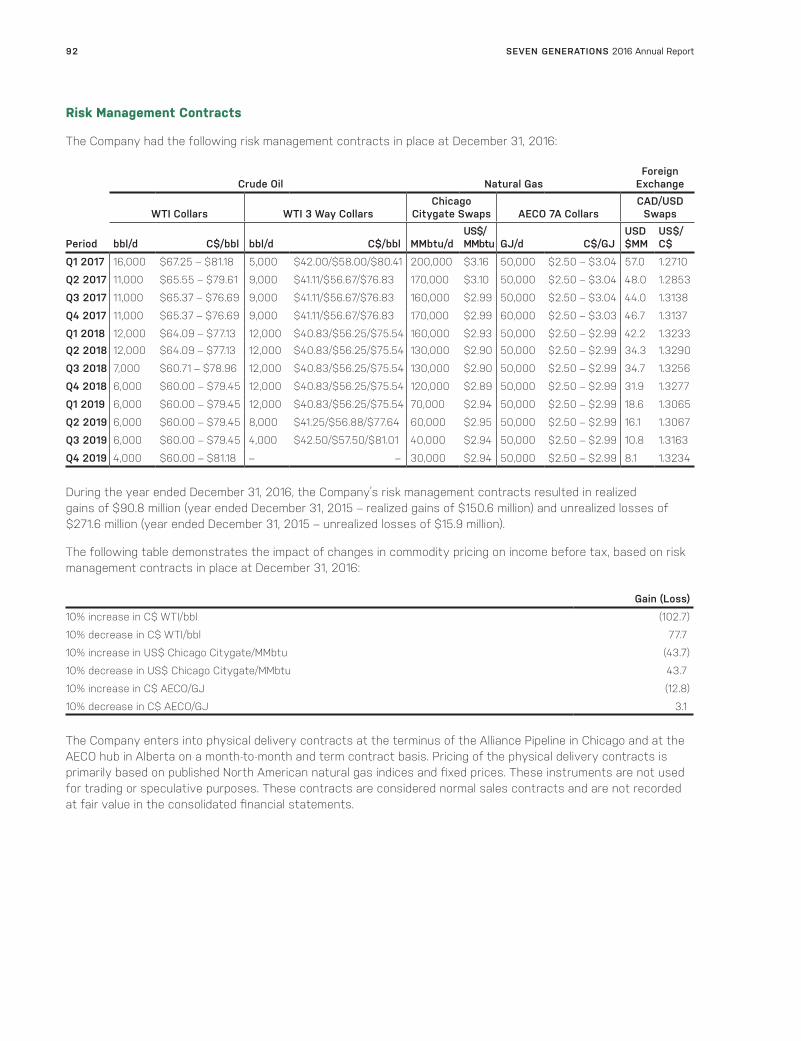
Risk Management Contracts
The Company had the following risk management contracts in place at December 31, 2016:
Period
Crude Oil Natural GasForeign
Exchange
WTI Collars WTI 3 Way CollarsChicago
Citygate Swaps AECO 7A CollarsCAD/USD
Swaps
bbl/d C$/bbl bbl/d C$/bbl MMbtu/dUS$/MMbtu GJ/d C$/GJ
USD $MM
US$/C$
Q1 2017 16,000 $67.25 – $81.18 5,000 $42.00/$58.00/$80.41 200,000 $3.16 50,000 $2.50 – $3.04 57.0 1.2710
Q2 2017 11,000 $65.55 – $79.61 9,000 $41.11/$56.67/$76.83 170,000 $3.10 50,000 $2.50 – $3.04 48.0 1.2853
Q3 2017 11,000 $65.37 – $76.69 9,000 $41.11/$56.67/$76.83 160,000 $2.99 50,000 $2.50 – $3.04 44.0 1.3138
Q4 2017 11,000 $65.37 – $76.69 9,000 $41.11/$56.67/$76.83 170,000 $2.99 60,000 $2.50 – $3.03 46.7 1.3137
Q1 2018 12,000 $64.09 – $77.13 12,000 $40.83/$56.25/$75.54 160,000 $2.93 50,000 $2.50 – $2.99 42.2 1.3233Q2 2018 12,000 $64.09 – $77.13 12,000 $40.83/$56.25/$75.54 130,000 $2.90 50,000 $2.50 – $2.99 34.3 1.3290
Q3 2018 7,000 $60.71 – $78.96 12,000 $40.83/$56.25/$75.54 130,000 $2.90 50,000 $2.50 – $2.99 34.7 1.3256
Q4 2018 6,000 $60.00 – $79.45 12,000 $40.83/$56.25/$75.54 120,000 $2.89 50,000 $2.50 – $2.99 31.9 1.3277
Q1 2019 6,000 $60.00 – $79.45 12,000 $40.83/$56.25/$75.54 70,000 $2.94 50,000 $2.50 – $2.99 18.6 1.3065
Q2 2019 6,000 $60.00 – $79.45 8,000 $41.25/$56.88/$77.64 60,000 $2.95 50,000 $2.50 – $2.99 16.1 1.3067
Q3 2019 6,000 $60.00 – $79.45 4,000 $42.50/$57.50/$81.01 40,000 $2.94 50,000 $2.50 – $2.99 10.8 1.3163
Q4 2019 4,000 $60.00 – $81.18 – – 30,000 $2.94 50,000 $2.50 – $2.99 8.1 1.3234
During the year ended December 31, 2016, the Company’s risk management contracts resulted in realized gains of $90.8 million (year ended December 31, 2015 – realized gains of $150.6 million) and unrealized losses of $271.6 million (year ended December 31, 2015 – unrealized losses of $15.9 million).
The following table demonstrates the impact of changes in commodity pricing on income before tax, based on risk management contracts in place at December 31, 2016:
Gain (Loss)
10% increase in C$ WTI/bbl (102.7)
10% decrease in C$ WTI/bbl 77.7
10% increase in US$ Chicago Citygate/MMbtu (43.7)
10% decrease in US$ Chicago Citygate/MMbtu 43.7
10% increase in C$ AECO/GJ (12.8)
10% decrease in C$ AECO/GJ 3.1
The Company enters into physical delivery contracts at the terminus of the Alliance Pipeline in Chicago and at the AECO hub in Alberta on a month-to-month and term contract basis. Pricing of the physical delivery contracts is primarily based on published North American natural gas indices and fixed prices. These instruments are not used for trading or speculative purposes. These contracts are considered normal sales contracts and are not recorded at fair value in the consolidated financial statements.
SEVEN GENERATIONS 2016 Annual Report92

The following table illustrates the average daily volumes the Company has committed to deliver on a term contract basis as at December 31, 2016:
Alliance ChicagoExchange AECO Hub
Contracts expiring in the year ended December 31, (MMBtu/d) (GJ/d)
2017 207,500 22,600
2018 16,667 21,600
2019 – 19,800
(b) Interest rate risk
Interest rate risk is the risk that future cash flows will fluctuate as a result of changes in market interest rates. The senior notes payable bear interest at a fixed rate. The Company’s credit facility bears a floating rate of interest and, accordingly, the Company is exposed to interest rate fluctuations to the extent that any advances remaining outstanding under the facility. During the year ended December 31, 2016, no amounts were drawn on the credit facility.
(c) Foreign currency exchange risk
Foreign currency exchange risk is the risk that the fair value of financial instruments or future cash flows will fluctuate as a result of changes in foreign exchange rates.
Prices for oil are determined in global markets and generally denominated in US dollars. Natural gas prices obtained by the Company are influenced by both US and Canadian demand and the corresponding North American supply.
With respect to exchange rate impacts to the Company, an increase in the value of the Canadian dollar as compared to the US dollar will generally reduce the prices received by the Company for its liquids and natural gas sales. The Company manages foreign currency exchange risk by entering into a variety of risk management contracts (see Risk management contracts section above). The Company enters into US dollar swaps to crystallize the Canadian dollar value of risk management contract entered into.
The Company is exposed to foreign exchange rate fluctuations on the principal and interest related to the senior notes payable, as well as on cash and cash equivalent balances held in US dollars. Foreign currency risk associated with interest payments is partially offset by marketing arrangements for the sale of the Company’s natural gas and natural gas liquids, excluding condensate, which are denominated in US dollars.
The following table demonstrates the impact of changes in the Canadian to US dollar exchange rate on income before tax, based on US denominated balances outstanding (including the foreign exchange risk management contracts) at December 31, 2016:
Gain (Loss)
10% increase in US$ to C$ 131.6
10% decrease in US$ to C$ (172.5)
The carrying amount of the Company’s US dollar denominated monetary assets and liabilities was as follows:
As at December 31, 2016 2015
Assets 113.0 35.5
Liabilities 2,136.9 1,563.8
SEVEN GENERATIONS 2016 Annual Report 93

Liquidity Risk
Liquidity risk is the risk that the Company will not be able to meets its financial obligations as they fall due. The Company manages its liquidity risk through ensuring, as reasonably as possible, that it will have sufficient liquidity to meets its liabilities when due without incurring unacceptable losses or risking damage to the Company’s reputation. At December 31, 2016, the Company had $630.8 million of cash and cash equivalents, plus available credit facility of $1.1 billion. Management believes it has sufficient funding to meet foreseeable liquidity requirements. The Company prepares capital expenditure budgets which are regularly monitored and updated. As well, the Company utilizes authorizations for expenditure on both operated and non-operated projects to manage capital investments.
The following are the contractual maturities of financial liabilities at December 31, 2016:
Less than 1 year 2-3 years 4-5 years Thereafter Total
Accounts payable and accrued liabilities 244.5 – – – 244.5
Risk management contracts 71.7 76.0 1.7 – 149.4
Senior notes (1) – – 939.9 1,174.9 2,114.8
Interest on senior notes (1) 157.6 315.2 189.2 113.7 775.7
Total 473.8 391.2 1,130.8 1,288.6 3,284.4
(1) Balances denominated in US dollars have been translated at the December 31, 2016, US dollar to Canadian dollar exchange rate of 0.745.
23. CAPITAL MANAGEMENT
The capital structure of the Company is as follows:
As at December 31, 2016 2015
Total debt (1) 2,111.9 1,546.7
Total equity (2) 3,822.8 1,786.7
Total capital 5,934.7 3,333.4
(1) Senior unsecured notes. (2) Equity is defined as share capital plus contributed surplus plus any deficit and other comprehensive deficit.
The Company’s objective for managing capital continues to be to maintain a strong balance sheet and capital base to provide financial flexibility to position the Company for growth and development. The Company strives to grow and maximize long-term shareholder value by ensuring it has the financing capacity to fund projects that are expected to add value to shareholders. Near-term major acquisitions and capital development will be funded by funds from operations, cash or cash equivalents, equity financings, the credit facility (Note 10) and debt financings (Note 12). The Company endeavors to balance the proportion of debt and equity in its capital structure to take into account the level of risk being incurred in its capital investments.
The Company had adjusted working capital of $585.9 million (current assets less current liabilities excluding the current portion of risk management contracts and deferred credits) plus $1.1 billion of credit facility less $59.2 million of letters of credit, creating available funding of $1.6 billion at December 31, 2016. The Company plans to use these funds, along with funds from operations for the execution of its 2017 capital program. Refer to Note 12 for non-financial covenants on the senior unsecured notes.
SEVEN GENERATIONS 2016 Annual Report94

24. SUPPLEMENTAL CASH FLOW INFORMATION
Change In Non-Cash Working Capital
Years ended December 31, 2016 2015
Accounts receivable (105.5) (13.2)
Deposits and prepaid expenses (5.3) (3.1)
Accounts payable and accrued liabilities (1) 53.7 (79.2)
(57.1) (95.5)
Relating to:
Operating activities (1) (88.0) (34.5)
Financing activities – –
Investing activities 30.9 (61.0)
(1) Adjusts for interest payment from the Acquisition of $5.1 million (Note 6).
Other Cash Flow Information
Years ended December 31, 2016 2015
Cash interest paid 139.9 94.1
Cash taxes paid 1.5 –
25. COMMITMENTS AND CONTINGENCIES
The following table lists the Company’s estimated material contractual commitments at December 31, 2016:
TotalLess than
1 year 2-3 years 4-5 years Thereafter
Senior notes (1) 2,114.7 – – 939.9 1,174.8
Interest on senior notes 775.7 157.6 315.2 189.2 113.7
Firm transportation and processing agreements (2) 4,172.0 364.0 848.2 912.3 2,047.5
Operating leases (3) 26.0 3.8 7.6 6.6 8.0
Estimated contractual obligations 7,088.4 525.4 1,171.0 2,048.0 3,344.0
(1) Balance represents US$1.6 billion principal converted to Canadian dollars at the closing exchange rate for the period end. (2) Subject to completion of certain pipeline and facility upgrades by a counterparty transportation company. (3) The Company is committed under operating leases for office premises.
SEVEN GENERATIONS 2016 Annual Report 95

The following table outlines the take or pay obligations, on average over the next five years under the Company’s significant transportation and processing agreements:
2017 2018 2019 2020 2021 Expiring (1)
Transportation
Condensate and oil
Pembina (mbbls/d) 28.7 42.2 42.4 49.0 55.3 June 30, 2030
Natural gas
Alliance (MMcf/d) 435 467 500 500 500 October 31, 2022
NGTL (MMcf/d) 158 293 368 363 349 June 30, 2026 (2)
NGPL (Dth/d) (4) 100 83 – – – October 31, 2018
NGLs
Pembina (mbbls/d) 15.8 19.8 19.8 22.3 24.8 June 30, 2030 (3)
Processing
Natural gas (MMcf/d) 154 174 194 200 200 April 20, 2036
NGLs (mbbls/d) 35.5 34.9 33.8 33.8 33.8 March 31, 2028 (3)
(1) When lines include multiple contracts of various expiration dates, the latest expiration date has been referenced. (2) The timing of the firm commitments under the agreement with Nova Gas Transmission Ltd. (“NGTL”), a wholly owned subsidiary of
TransCanada Corporation, is dependent upon the completion of NGTL system expansion, which is expected mid-2018.(3) The timing of the firm commitments under the agreement with Pembina is dependent upon the completion of the Phase 3 expansion, which is
expected July 1, 2017. (4) Natural Gas Pipeline Company of America LLC (“NGPL”).
26. RELATED PARTY TRANSACTIONS
Except as disclosed elsewhere in these consolidated financial statements, the Company had the following related party transactions. Key management personnel are comprised of all directors and officers of the Company. Amounts paid to directors and officers are disclosed in the table below:
Years ended December 31, 2016 2015
Salaries, benefits and other short-term compensation 7.9 8.8
Stock based compensation 10.7 8.9
Retention expense (1) 1.1 1.3
19.7 19.0
(1) In November 2014, the Board of Directors approved a retention bonus plan for management and employees. The retention bonuses were payable in four equal installments payable every six months starting on May 5, 2015. Each installment payment was contingent upon the individual being employed by the Company on the date of payment. The maximum retention bonuses was $6.0 million, payable over the two-year period starting November 5, 2014.
SEVEN GENERATIONS 2016 Annual Report96
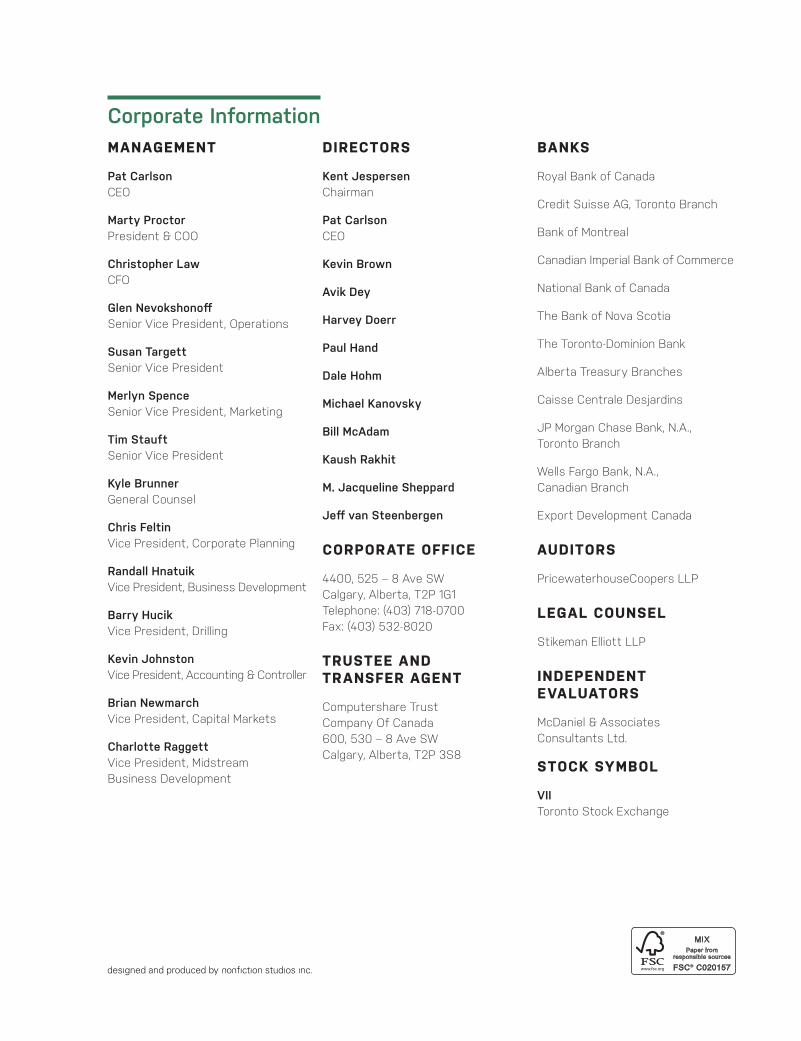
Corporate InformationMANAGEMENT
Pat CarlsonCEO
Marty ProctorPresident & COO
Christopher LawCFO
Glen Nevokshonoff Senior Vice President, Operations
Susan TargettSenior Vice President
Merlyn SpenceSenior Vice President, Marketing
Tim StauftSenior Vice President
Kyle BrunnerGeneral Counsel
Chris FeltinVice President, Corporate Planning
Randall HnatuikVice President, Business Development
Barry HucikVice President, Drilling
Kevin JohnstonVice President, Accounting & Controller
Brian NewmarchVice President, Capital Markets
Charlotte RaggettVice President, Midstream Business Development
DIRECTORS
Kent JespersenChairman
Pat CarlsonCEO
Kevin Brown
Avik Dey
Harvey Doerr
Paul Hand
Dale Hohm
Michael Kanovsky
Bill McAdam
Kaush Rakhit
M. Jacqueline Sheppard
Jeff van Steenbergen
CORPORATE OFFICE
4400, 525 – 8 Ave SWCalgary, Alberta, T2P 1G1Telephone: (403) 718-0700Fax: (403) 532-8020
TRUSTEE AND TRANSFER AGENT
Computershare Trust Company Of Canada600, 530 – 8 Ave SWCalgary, Alberta, T2P 3S8
BANKS
Royal Bank of Canada
Credit Suisse AG, Toronto Branch
Bank of Montreal
Canadian Imperial Bank of Commerce
National Bank of Canada
The Bank of Nova Scotia
The Toronto-Dominion Bank
Alberta Treasury Branches
Caisse Centrale Desjardins
JP Morgan Chase Bank, N.A., Toronto Branch
Wells Fargo Bank, N.A., Canadian Branch
Export Development Canada
AUDITORS
PricewaterhouseCoopers LLP
LEGAL COUNSEL
Stikeman Elliott LLP
INDEPENDENT EVALUATORS
McDaniel & Associates Consultants Ltd.
STOCK SYMBOL
VIIToronto Stock Exchange
2016 At a Glance
Seven Generations Energy Ltd. is an independent, publicly-traded energy company focused on the acquisition, development and value optimization of high-quality, tight rock, natural gas resource plays.
Seven Generations diff erentiates itself through its core attributes: the quality of its liquids-rich asset, large resource size, desirable location and market access, a high degree of operational control, proven and innovative technical execution and unique operating approaches.
We are committed to protecting the natural beauty of the environment and preserving its capacity for current and future generations. While we recognize that our activity and operations impact the air, water, land and natural life, we believe it is vital that we work with all our stakeholders to reduce and minimize our environmental impacts.
Environment Employees
Communities
Supply & ServiceProviders
Government &Regulators
Partners
Shareholders
IN BUSINESS TO SERVE OUR STAKEHOLDERS.
DRIVEN TO SERVE THEM IN DIFFERENTIATED WAYS.
See page 7 for our Level 1 Corporate Policy, our Code of Conduct.
Table of Contents
CEO’s Message .............................................. 2
Level 1 Corporate Policy ...............................7
President’s Message .................................... 8
Financial Strength .......................................10
Optimizing Assets .......................................12
Serving Stakeholders inDiff erent, Better Ways ...............................14
Highlights Summary ....................................18
Management’s Discussion and Analysis ................................................20
Independent Auditor’s Report ..................65
Consolidated Financial Statements ........66
Notes to the Consolidated Financial Statements ................................. 70
Corporate Information ... Inside Back Cover
For important additional information, please refer to the reader advisories on page 61 and to the “Non-IFRS Financial Measures” advisory on page 54.
On the cover: Kakwa River Project, Lator natural gas plant in the distance.

4400, 525 – 8th Ave SWEighth Avenue Place EastCalgary, AB T2P 1G1
T: (403) 718-0700E: [email protected]
www.7genergy.com Kakwa River Project Annual Report 2016
AN
NU
AL R
EPOR
T 2016
SEVEN
GEN
ERATIO
NS EN
ERGY LTD
.