Embed Size (px)
Citation preview
MASTER'S THESISIN PRODUCTION ENGINEERING
Settingup an ERPfree production system
Benoît Rousseau
SupervisorAnders Hansson
KTH IIPSeptember 2010
In collaboration with
1
Abstract
Efficient information systems can nowadays be used in order to manage production lines, for all the aspects of the thing: planning, running the operations, quality management, cost control etc. During the last century, computer tools have allowed the creation of more and more complex systems, from basic systems to ERP (Enterprise Resource Planning) that are today the spinal column of most big companies.
At the same time as the development of such systems, new philosophies in term of production management have emerged, especially from Japan: the Lean. Whereas ERP systems aim at being predictive, the Lean philosophy focuses on reactivity. It is a really different approach, even though in the last years ERP systems have evolved in order to integrate the tools coming from the Lean.
This paper aims at study the possibility to run a production line without a system like an a ERP, with the modern standards in terms of performance. The study has been made between January and September 2010 within the framework of a factory from the Groupe Atlantic, a French company that had opened a new site in 2009 in Izmir (Turkey) for the production of towel radiators.
The thesis focuses on three areas:• the planning of the production, i.e. the whole process that transform a customer order into a
production order. This parts presents the kind of process and the tools (based on Excel and Visual Basic macros) that can be used for those operations.
• The management of the physical operations. This part focuses on how to deal with the flow of information and material on the production floor, from raw material to expedition.
• The management of material consumption: it is a sidetopic, yet critical in terms of cost control, and we show what methods and tools we can introduce in order to control this parameter.
The main conclusions are that, if an ERP system is not absolutely necessary to run the daily operations, it might appear very useful in order to get the best from the production tool. An ERP allows the collection of a wide range of data that can greatly help in order to optimize the operations.
2
Table of Contents 1 Introduction ...........................................................................................................................................7 2 Different models for the management of industrial flows .....................................................................9
2.1 Evolution of flow management....................................................................................................9 2.1.1 The different factors that made the evolution possible......................................................9 2.1.2 Issues of the production flow management.......................................................................9
2.2 Historical perspective................................................................................................................10 2.2.1 The first age.....................................................................................................................10
2.2.1.i Stock replenishment ..............................................................................................10 2.2.1.ii Reorder point........................................................................................................10
2.2.2 Maturity..........................................................................................................................12 2.2.2.i Material Resource Planning (MRP)......................................................................12 2.2.2.ii Manufacturing Resource Planning (MRP2).........................................................15
2.2.3 Enterprise Resource Planning (ERP)..............................................................................16 2.2.3.i Distribution Resource Planning (DRP).................................................................16
2.2.4 The reassessment...........................................................................................................16 2.2.4.i JustinTime...........................................................................................................17 2.2.4.ii Synchronous flow................................................................................................19 2.2.4.iii Theory of Constraints.........................................................................................19
3 Background .........................................................................................................................................21 3.1 Company presentation................................................................................................................21 3.2 The product................................................................................................................................22 3.3 The process................................................................................................................................24 3.4 Synthesis....................................................................................................................................26
4 Scheduling the production. ..................................................................................................................27 4.1 Defining the exact constraints....................................................................................................27 4.2 The scheduling of the production in details..............................................................................28
4.2.1 Launch proposal from logistics department....................................................................30 4.2.2 Weekly production scheduling........................................................................................34 4.2.3 Daily scheduling: Adige, optimization...........................................................................37
4.2.3.i Need for a tube cutting optimization?...................................................................38 4.2.3.ii Profile cutting scheduling....................................................................................40 4.2.3.iii Running the algorithm........................................................................................45
4.2.4 Conclusion on the profile cutting scheduling.................................................................50 4.3 Conclusion on the whole scheduling ........................................................................................51
5 Physical management of the flow .......................................................................................................52 5.1 Organization of the whole flow.................................................................................................52 5.2 Control of the evolution of the pushed flow..............................................................................53
5.2.1 Display of production programs within the workshop....................................................54 5.2.2 Implementation of a card system for missing material...................................................55 5.2.3 Implementation of a card system for following the packaging of the products..............56 5.2.4 Visual performance indicators........................................................................................58
3
5.3 Introduction of pulled flows for the tubes.................................................................................60 5.3.1 Issue................................................................................................................................60 5.3.2 Solution...........................................................................................................................60 5.3.3 Deployment of the kanban system..................................................................................62
5.4 Management of the physical flow: conclusion..........................................................................64 6 Material consumption management ....................................................................................................65
6.1 The issue....................................................................................................................................65 6.2 Identifying the sources of waste................................................................................................66
6.2.1 Interview anybody that has any connection with the workshop.....................................66 6.2.2 Go and check yourself on the field.................................................................................67 6.2.3 Results of the investigation: where is the material actually disappearing?.....................68
6.3 The procedures in order to achieve a good control of the waste ..............................................70 6.3.1 Losses linked to the nature of the process.......................................................................70
6.3.1.i The cutting step: how to get the right data............................................................70 6.3.1.ii Data processing for estimation on the loss at the tube cutting step......................71
6.3.2 Material waste along the manufacturing lines................................................................74 6.4 Managing the consumption.......................................................................................................77
6.4.1 A visual management of the waste..................................................................................77 6.4.2 Drawing an action plan up..............................................................................................78
6.5 Conclusion on the control of the material consumption............................................................78 7 Overall conclusion ...............................................................................................................................80 8 Bibliography ........................................................................................................................................82
4
Illustration IndexIllustration 1: Reordering cycle................................................................................................................11Illustration 2: MRP Structure...................................................................................................................13Illustration 3: MRP Scheduling................................................................................................................14Illustration 4: MRP2 structure..................................................................................................................15Illustration 5: A pull system.....................................................................................................................18Illustration 6: Flow management around the bottleneck..........................................................................20Illustration 7: A painted towel dryer.........................................................................................................22Illustration 8: Structure of the flow..........................................................................................................24Illustration 9: Flow of information...........................................................................................................29Illustration 10: Input for production capacities........................................................................................32Illustration 11: Visualization of the constraints........................................................................................33Illustration 12: Visualization of the constraints.......................................................................................33Illustration 13: Output for tube cutting.....................................................................................................34Illustration 14: Tube changeovers organization........................................................................................36Illustration 15: Production planning output..............................................................................................37Illustration 16: Scrap percentage per kind of tube....................................................................................39Illustration 17: Average scrap ratios.........................................................................................................39Illustration 18: Material flow for profiles.................................................................................................42Illustration 19: Structure of the scheduling macro...................................................................................44Illustration 20: Start data..........................................................................................................................46Illustration 21: User interface...................................................................................................................46Illustration 22: User interface...................................................................................................................47Illustration 23: User interface...................................................................................................................47Illustration 24: Raw output from the macro.............................................................................................47Illustration 25: Raw output from the macro.............................................................................................48Illustration 26: Cutting possibilities database..........................................................................................49Illustration 27: Final planning for profile cutting.....................................................................................50Illustration 28: Card attached to a batch...................................................................................................53Illustration 29: Pushed flow.....................................................................................................................53Illustration 30: Daily program (test station, week 35, day 2)...................................................................54Illustration 31: Card system in case of quantity discrepancy...................................................................55Illustration 32: Followup board at the packaging lines...........................................................................57Illustration 33: Following board at the packaging line.............................................................................57Illustration 34: Card in the red zone.........................................................................................................57Illustration 35: Card in the green zone.....................................................................................................57Illustration 36: Performance display........................................................................................................58Illustration 37: Board for following the performance of the oven............................................................59Illustration 38: Tube cutting organization.................................................................................................61Illustration 39: Kanban card.....................................................................................................................62Illustration 40: Safety buffer (3 out 4 boxes were present at the moment)..............................................62Illustration 41: Two kinds of order (at the bottom)..................................................................................63Illustration 42: Sources of material loss...................................................................................................68
5

Illustration 43: Counter............................................................................................................................71Illustration 44: Scrap box at drilling station.............................................................................................74Illustration 45: Scrap box at drilling stations...........................................................................................74Illustration 46: Scrap box at assembly stations........................................................................................75Illustration 47: Sources of scrap of tubes..................................................................................................76Illustration 48: Sources of scrap of profiles.............................................................................................76Illustration 49: Distribution of the cost of material scrap........................................................................77Illustration 50: Daily scrap display...........................................................................................................78Illustration 51: Weekly scrap display........................................................................................................78
6
1 Introduction
The very beginning of this master thesis was in the fall of 2009 when I applied for an internship offer in production engineering in a factory in Turkey. Involved in the doubledegree program between École Centrale Paris and KTH, it was time for me to start working on the thesis after three semesters of courses in Stockholm.
Studying in the master called Integrated Production, I wanted to continue this way by acquiring a first real experience in the field of industrial production. I applied for this offer whose title was “Flow optimization”, and I got to start after a few interviews in France.
Towards the problematic
I have been working on this thesis in the company Groupe Atlantic. Created in 1968, it is one of the European leaders in the field of heating products. Largely developed in Western Europe, it is starting to grow in Eastern Europe and MiddleEast for a few years. In the beginning of 2009, the company opened a new factory located in Torbali, 50 km from Izmir on the West Coast of Turkey. The aim is this factory would be to manufacture towelradiators, especially for the European lowcost market.
The first year was mostly dedicated to the start of the machines, the building of the team and the stabilization of the process. Indeed, some parts of the process were new among the group (like a new of painting, which generated up to a 40% default rate in the first months), and required a lot of energy from the team. Once those issues were more or less stabilized, the focus was now to be set on the organization of the production. From the beginning, a production manager was working already working on that subject, but with mixed results. He was actually fired a few weeks after I arrived in the company. My mission was then to help building the production system, first in cooperation with the factory manager and the team leaders, and then also with the new production manager later. After two weeks training in France in the factories of the group, I spent 8 months in Turkey from January to August 2010.
The interesting point for me is that I could take part in the construction of many aspects of this new system. I participated in the reflection, the development and the actual adoption of those new tools and methods. This thesis will therefore aim at describing: how to build an efficient ERPfree production system?
Borders of the topic
Of course this paper doesn't intend to be the reference model for similar production configurations. It is just for the reader of what can be done in such configurations.
The paper focuses on how to organize the production, so it covers most topic that are encountered on the workshop, except the process themselves. Therefore, topics such as process or quality management won't be tackled here. Also, topics concerning the logistics side, like material supply or customer orders management won't be developed here.
The matter of this paper is to illustrate how to manage a flow from customer orders from customer orders to delivery. It is therefore about a flow of material, but more than that, a flow of information. That information is of different kinds: orders, stock, launches, workinprocess, material consumption, etc. There is in the industry different ways of managing a flow. I will describe the different alternatives, then which choices have been made in the practical case of the towelradiators factory, why they have been made this way, their pros and cons, how much they are applicable to other configurations, some potential future improvements etc.
The first part makes a review of the different ways industrials have been managing their flows throughout the history and which models are used today. Then is described the background of this paper (the company, the product and its process). After the analyze of the making of the system can start. It is divided into three main modules:
• The global organization of the flow and how to schedule it
• Then how to manage physically the flow in the field?
• Finally, an example of the treatment of the information concerning a sideissue for the production: the control of raw material consumption.
2 Different models for the management of industrial flows
The idea of flow management has evolved throughout the industrial history. It is used to designate all kind of tools and methods for the optimization of the whole activities from the manufacturing of a product till the customer.
2.1 Evolution of flow management
2.1.1 The different factors that made the evolution possibleWe can say that the idea of flow management really starts after the second world war, with the simultaneity of different factors: [1]
• The first one was a big need for productivity. The period after the war led to a strong demand for the consumers, whereas production capacities were limited and cannot answer all the needs. Industrials had then to organize the production tools in order to provide as much products as possible to the market. It became the priority for them.
• The other phenomenon was the emergence of computers. Those machines were able to process a huge amount of data in short times, opening new horizons. It would allow new production management ways.
2.1.2 Issues of the production flow managementIn broad outline, the flow management can be divided into two subprocesses: [1]
• Piloting manufacturing operations: selling a products means that a process of transformation has taken place, from buying the raw materials and components to the realization of subassemblies, that would be combined to eventually become a finished product. It takes a certain time to go through this whole process. The lead time is defined as the period of time between ordering a product and its actual delivery. The target is to reduce this lead time in order to serve the customer as fast as possible.
• Supply the work stations: no matter the solution used for the flow (pulled, pushed etc), it is always necessary to make the articles needed for the production available at the right time at the right place, trying to minimize the buffers at the same time. This problem seems simple at first sight, but it is the major challenge that have to face the management systems, that are trying, through more are less complex approaches, to bring the best solution.
9
2.2 Historical perspective
This part aims at showing the historical process, from the beginning of the XXth century till nowadays, that led to the current models used to manage the industrial flows. It will thus present the different characteristics and use of the major ones.
2.2.1 The first age
2.2.1.i Stock replenishment
Historically, the first approach for stock management basically consisted in restore a stock level that had been beforehand defined. A periodical visual check of the stock would show that some products have been consumed, and then an order (for manufacturing or buying) would be placed. Quickly, this method will be reproached not to adapt the levels to variations of the demand that can easily be forecast.[2]
In an industrial company willing to have the right quantities of products at the right time, this method will quickly appear inappropriate. The appearance of new tools such as computers has made this method definitely out of date, because too slow and costly in an industrial environment.
However, the replacement of consumed material is still used in some retail businesses, that replenish their stocks on the basis of visual checks or using boxes.
2.2.1.ii Reorder point
This method is considered as an improved version of the previous one, it consists in taking advantage of the new capacities in term of treatment of information made possible by computers.
It consists in estimating the evolution of the stock of a given article from the forecast of the consumption of this article, and then establishing a reorder cycle. [3]
10
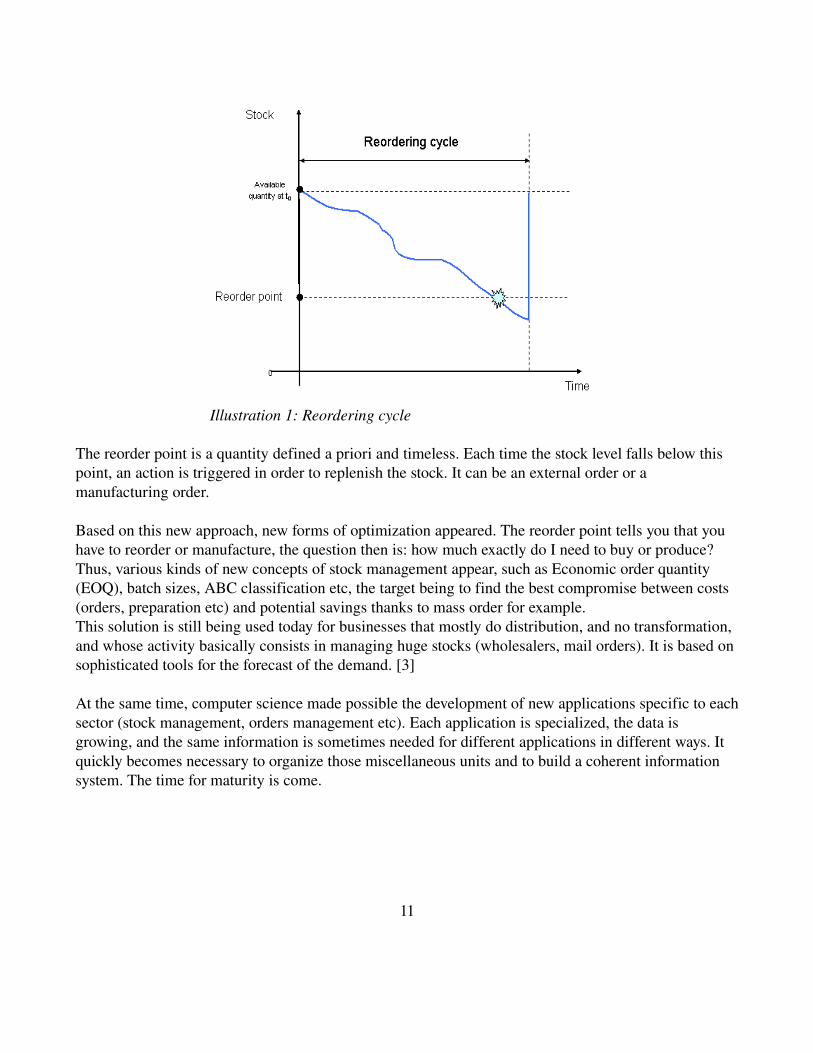
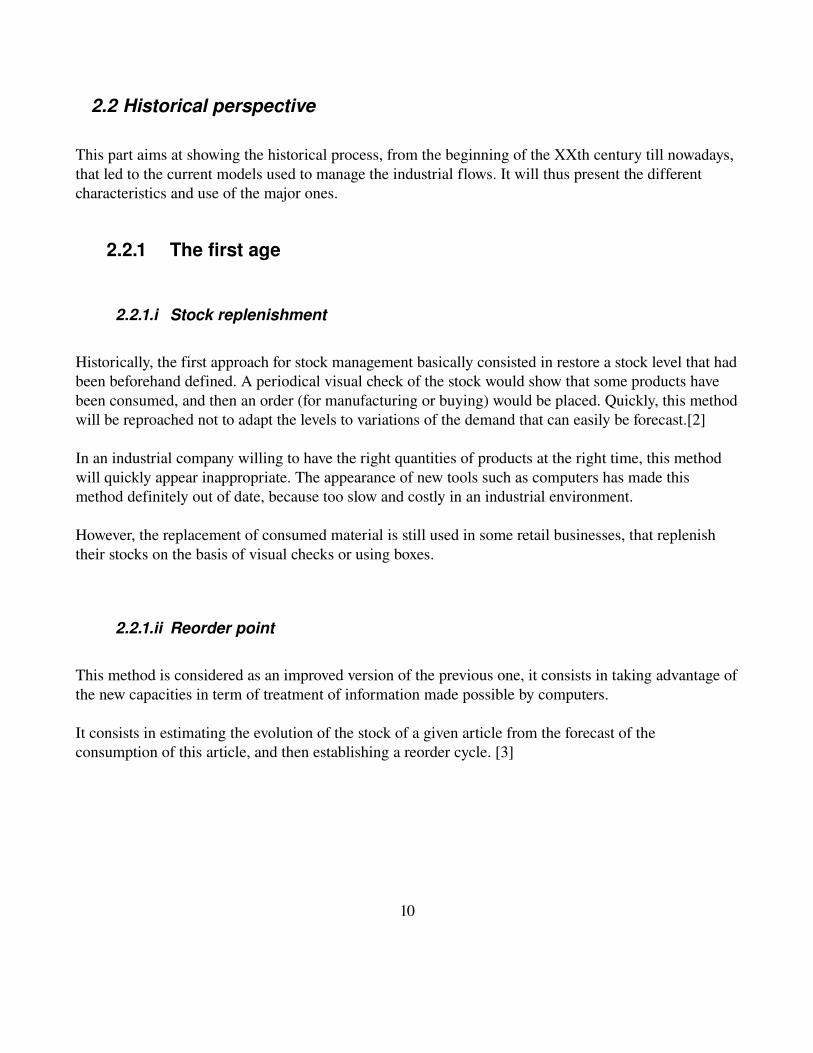
Illustration 1: Reordering cycle
The reorder point is a quantity defined a priori and timeless. Each time the stock level falls below this point, an action is triggered in order to replenish the stock. It can be an external order or a manufacturing order.
Based on this new approach, new forms of optimization appeared. The reorder point tells you that you have to reorder or manufacture, the question then is: how much exactly do I need to buy or produce? Thus, various kinds of new concepts of stock management appear, such as Economic order quantity (EOQ), batch sizes, ABC classification etc, the target being to find the best compromise between costs (orders, preparation etc) and potential savings thanks to mass order for example.This solution is still being used today for businesses that mostly do distribution, and no transformation, and whose activity basically consists in managing huge stocks (wholesalers, mail orders). It is based on sophisticated tools for the forecast of the demand. [3]
At the same time, computer science made possible the development of new applications specific to each sector (stock management, orders management etc). Each application is specialized, the data is growing, and the same information is sometimes needed for different applications in different ways. It quickly becomes necessary to organize those miscellaneous units and to build a coherent information system. The time for maturity is come.
11
2.2.2 Maturity
2.2.2.i Material Resource Planning (MRP)
The MRP was a true revolution in terms of production management, it can be considered as the first standard model. For the first time in the industrial history, an information system would be able to take advantage of the computer capacities, and would allow making a calculation of the needs of materials, components, subassemblies etc.The innovations brought by MRP and its evolutions are numerous and forced the users to a large change in the way they work. [4]
The logic
The basic principle is quite simple: from a production masterplan is calculated the supply of needed components, at the right time, in the right quantity. This calculation is based on the following databases: [4]
• The production masterplan: it represents the projected production plan, usually in terms if finished products. It is guessed from the commercial forecast.
• Independent external needs (that don't result from the production plan)• Structure of products: description of the products, relations between them (components,
assembly etc.)• A model of the production system describes through different parameters (available stock,
manufacturing cycles, supply cycles, safety levels, efficiency, transportation times etc). Those data are treated in order to find out the net needs (= raw needs – available stocks – current orders) and thus suggest a supply plan that will allow to satisfy those needs. After the analyze, the recommendations are turned into a buying order or a manufacturing order.
12
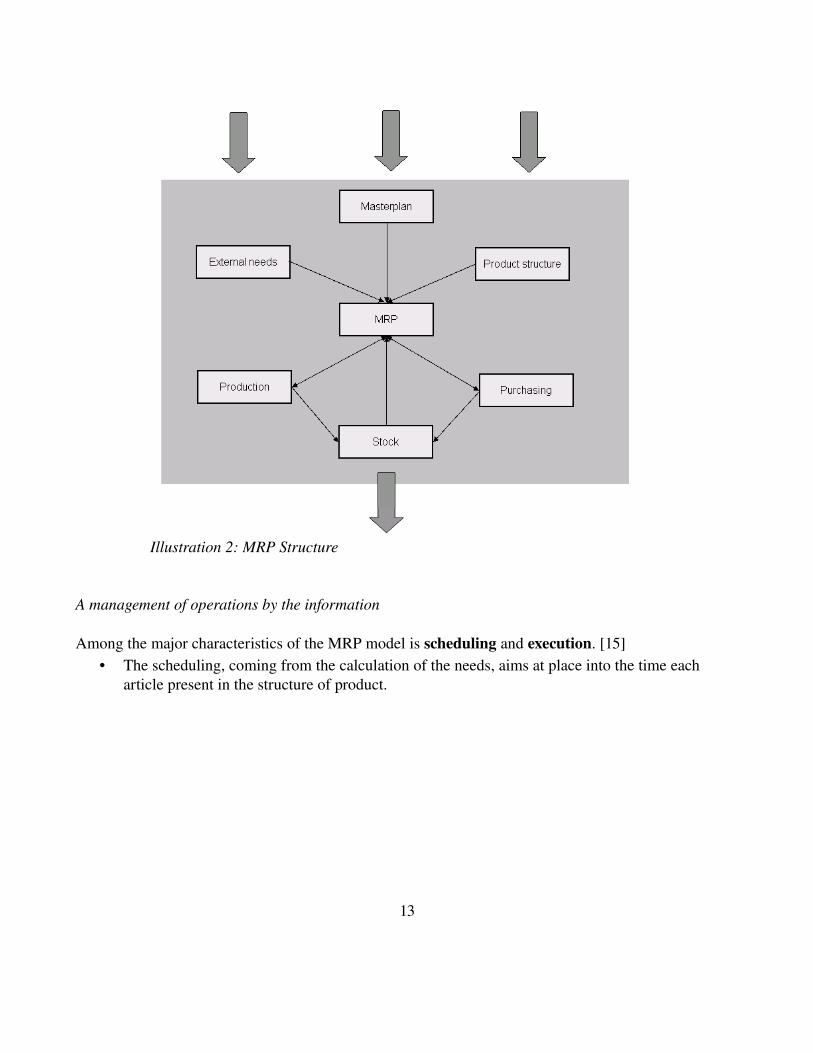
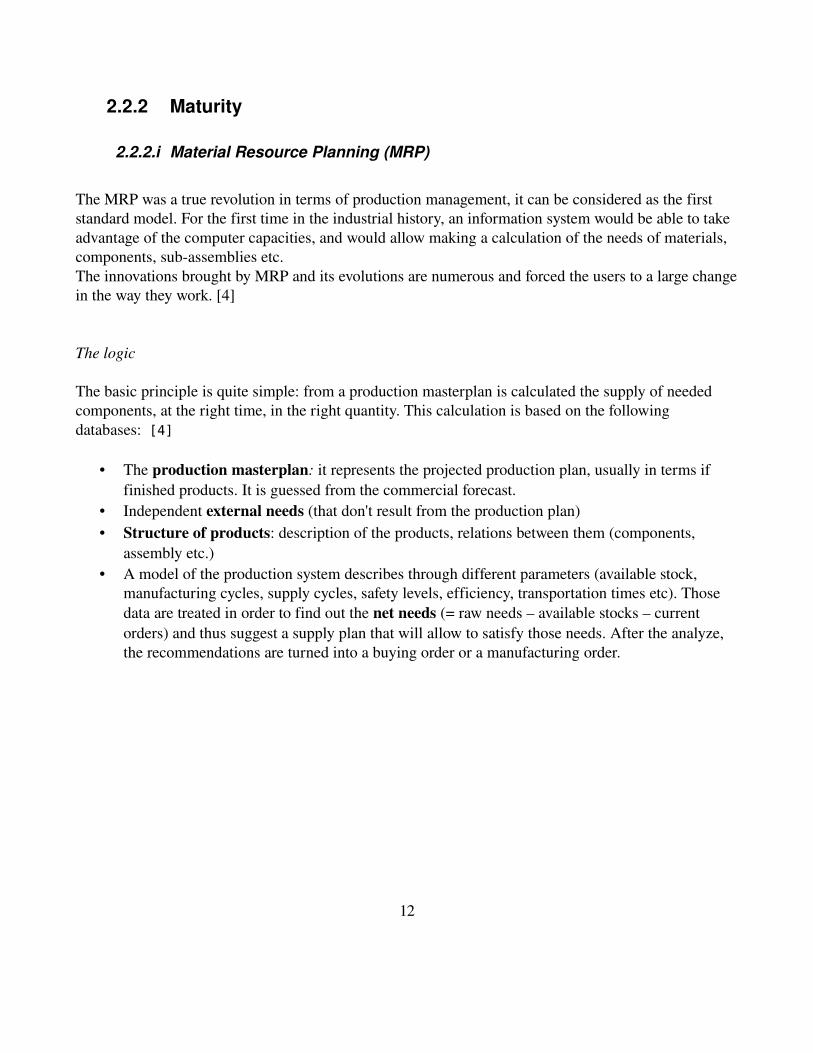
Illustration 2: MRP Structure
A management of operations by the information
Among the major characteristics of the MRP model is scheduling and execution. [15]• The scheduling, coming from the calculation of the needs, aims at place into the time each
article present in the structure of product.
13
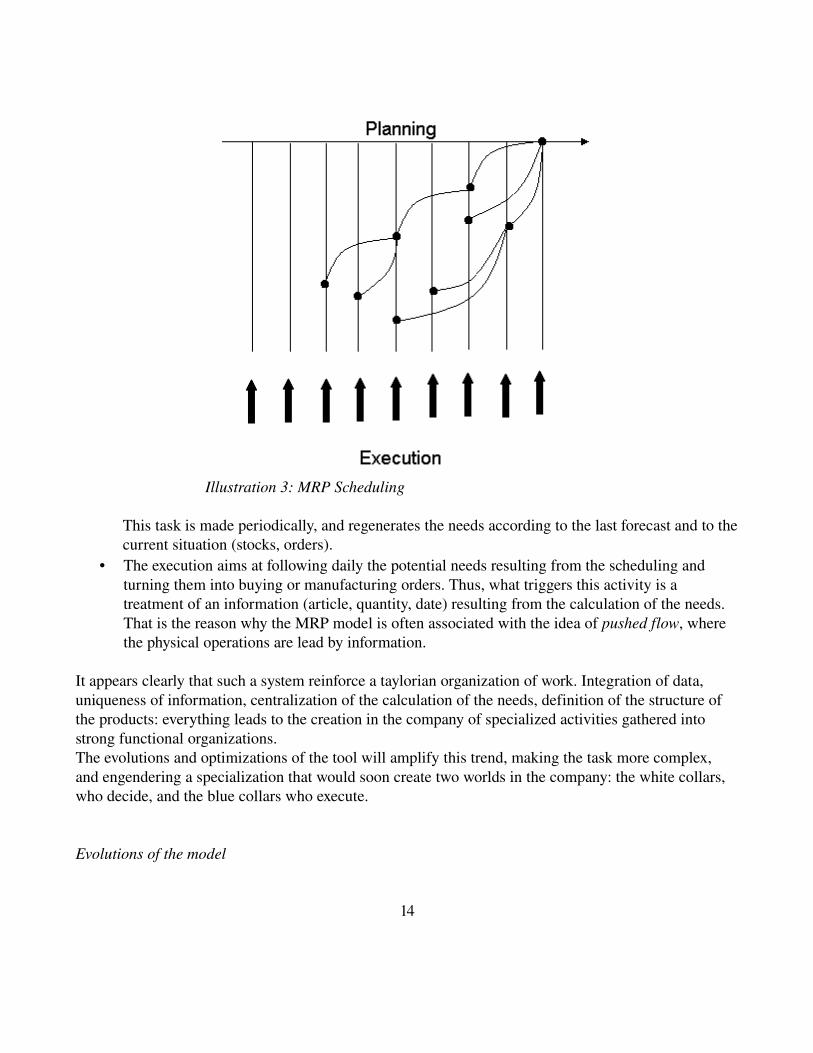
Illustration 3: MRP Scheduling
This task is made periodically, and regenerates the needs according to the last forecast and to the current situation (stocks, orders).
• The execution aims at following daily the potential needs resulting from the scheduling and turning them into buying or manufacturing orders. Thus, what triggers this activity is a treatment of an information (article, quantity, date) resulting from the calculation of the needs. That is the reason why the MRP model is often associated with the idea of pushed flow, where the physical operations are lead by information.
It appears clearly that such a system reinforce a taylorian organization of work. Integration of data, uniqueness of information, centralization of the calculation of the needs, definition of the structure of the products: everything leads to the creation in the company of specialized activities gathered into strong functional organizations.The evolutions and optimizations of the tool will amplify this trend, making the task more complex, and engendering a specialization that would soon create two worlds in the company: the white collars, who decide, and the blue collars who execute.
Evolutions of the model
14
Developed in the early 60's, the MRP model is quickly becoming the reference in terms of production management. The biggest companies, most of them American companies, have first adopted this model that is today the basis of the computer aided prod management philosophy.From this basis, two major evolutions will appear: the MRP2, and the ERP.
2.2.2.ii Manufacturing Resource Planning (MRP2)
First evolution from the MRP, this version appears in the early 70's. It is the consequences from new needs expressed by the users, and as well of new capacities in terms on information treatment. [5]
The number “2” indicates that it is a logical evolution of the MRP. The letter “M” doesn't stand for Material any more, but for Manufacturing. It means that, for the calculation of the needs, we are now not only interested in the treatment of the articles themselves, but to the capacities of the company. The first version of the MRP was supposing an infinite capacity, while this new approach introduces a loop on the production program with the analysis of the material needs and the company capacities. [5]
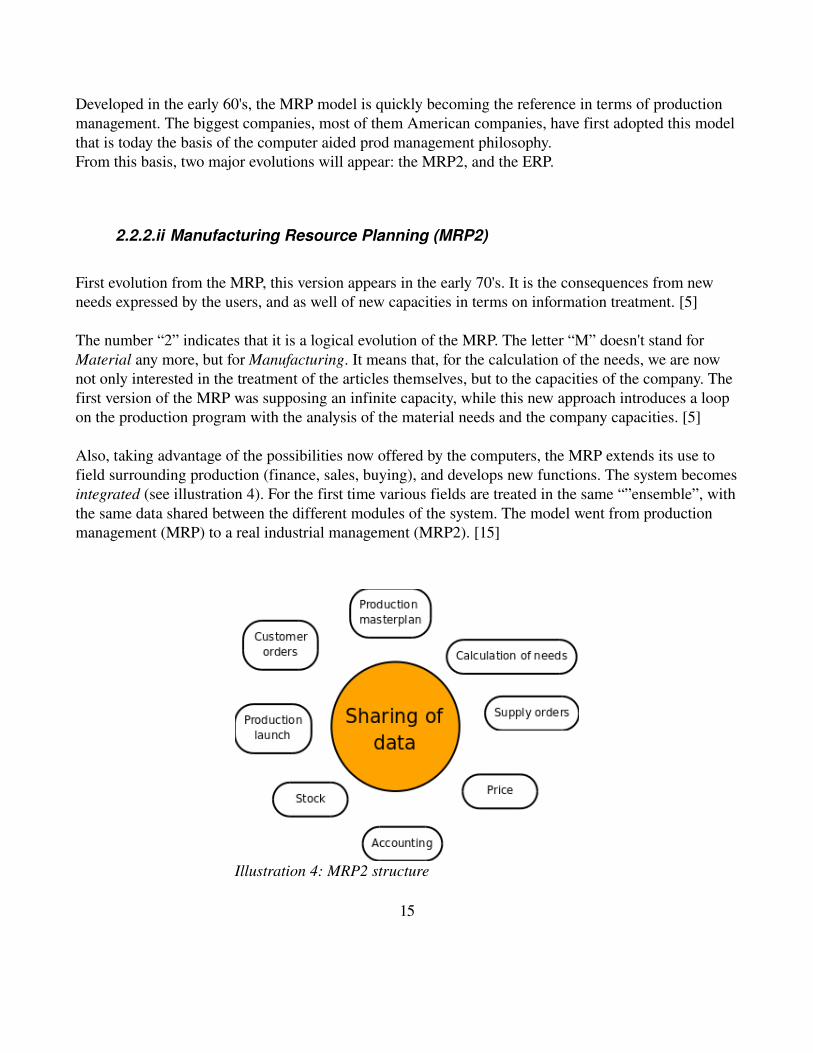
Also, taking advantage of the possibilities now offered by the computers, the MRP extends its use to field surrounding production (finance, sales, buying), and develops new functions. The system becomes integrated (see illustration 4). For the first time various fields are treated in the same “”ensemble”, with the same data shared between the different modules of the system. The model went from production management (MRP) to a real industrial management (MRP2). [15]
15
Illustration 4: MRP2 structure
2.2.3 Enterprise Resource Planning (ERP)
This evolution appeared much later, in the early 90's, so actually after the introduction of reactive models like JIT or OPT. This model was thus created in order to help the industrials with the issues they were facing in this last decade of the XXth century, which changed from the time when the MRP was thought. [14]
The ERP aims at being the ultimate system that includes every aspect of the company, not only the fields surrounding production like the MRP, but also research, strategy, human resources, supply chain etc. The ERP gives priority to the scheduling to the execution, when both of them were closely linked with the MRP model. [14]
Finally, the ERP can be considered as a global model, that builds coherence between all the aspects of a company through a reinforced scheduling. It also allows the integrations of solutions like JIT or synchronous flows that will be introduced later (see 2.2.4)
2.2.3.i Distribution Resource Planning (DRP)
It is the direct adaptation of the MRP to the field of products supply. Actually, the DRP is used in order to determinate the supply orders of the different warehouses present along the flow of products between the manufacturing factory and the customers. [6]For example, if we have a system made of a manufacturing factory, a national warehouse and some regional warehouses, the DRP will be able to treat the needs of each one of these elements independently. From the delivery forecast to the different customers, the regional warehouse will express their needs to the national warehouse, which will then send its own forecast to the factory that will consider this information as the main input for its own calculation of needs.
2.2.4 The reassessment
From the first production management systems till the beginning f the 80's, the economical environment has changed a lot. The market has become worldwide, industrials want to offer more and more personalized products in order gain more market shares, and the competition is getting harder. As the uncertainty is getting more important, the production management has to evolve to become more reactive, and the management of the stocks is getting more and more difficult due to the fact that every product might become (obsolete) in a very short period of time. [13]
16
Therefore, all the industrials are trying to use their MRP at their best in order to overcome this challenge. They already spent a lot of energy for setting and mastering those systems, and different solutions are developed in order to make the procedures more complex, without however greatly improving the results. However everyone is fighting with the same tools... until the revolution that was the “JustinTime” approach in its time. It is the second reference in terms of “production management”.
2.2.4.i JustinTime
Introducing such an approach is not easy, there are a lot terms usable to describe it. You can hear about "pull flow", "justintime", "kanban", "zero stock", "zero lead time", "zero default", "zero paper" etc.The JustinTime appears in the Western world after a series of innovations thought by Japanese companies in the field of work organization and production management.It appeared quickly that this new approach matches really well the new constraints presented above, and therefore it became the new way of thinking of many companies, that were trying to introduce those new methods that seemed simple in a first approach. But it is important to first understand the underlying concepts. [7]
The search for reactivityContrary to the MRP approach, that manages the uncertainty through an improvement of forecasts, the JIT approach tackles the same problem with the search for reactivity. Indeed, as the manufacturer doesn't know exactly what the demand to satisfy is, the company has to organize itself and react to satisfy this demand as fast as possible.
The fundamental concept lies on the fact that the target is now to reduce the time necessary to produce one piece. Conversely, the Taylor approach was promoting the idea of “batch”, i.e. producing several similar pieces at the same time in order to reduce the production costs. The JIT approach thus promotes concepts like: [7]
• the optimization of the flow inside the factory• a productionline approach• the tracking of every kind of waste (muda)• the elimination of transits between operations• the reduction of changeover times• a focus on quality (analyze of defaults, preventive actions etc)• etc
It appears that JIT requires a global approach, and not just introducing a Kanban cards system for 17
example.
A physical management of operations
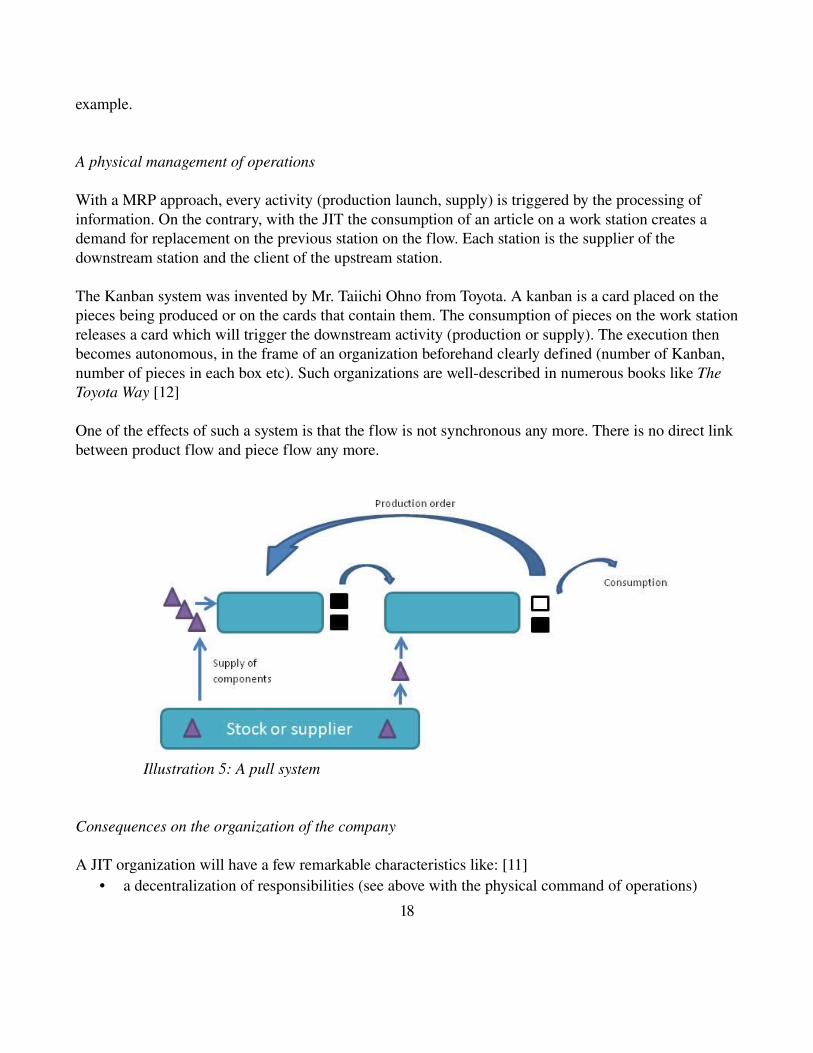
With a MRP approach, every activity (production launch, supply) is triggered by the processing of information. On the contrary, with the JIT the consumption of an article on a work station creates a demand for replacement on the previous station on the flow. Each station is the supplier of the downstream station and the client of the upstream station.
The Kanban system was invented by Mr. Taiichi Ohno from Toyota. A kanban is a card placed on the pieces being produced or on the cards that contain them. The consumption of pieces on the work station releases a card which will trigger the downstream activity (production or supply). The execution then becomes autonomous, in the frame of an organization beforehand clearly defined (number of Kanban, number of pieces in each box etc). Such organizations are welldescribed in numerous books like The Toyota Way [12]
One of the effects of such a system is that the flow is not synchronous any more. There is no direct link between product flow and piece flow any more.
Consequences on the organization of the company
A JIT organization will have a few remarkable characteristics like: [11]• a decentralization of responsibilities (see above with the physical command of operations)
18
Illustration 5: A pull system
• the operator is made responsible for the quality of its products• a continuous improvement philosophy is to be adopted into the group, each one has the ability to
suggest improvements in order to reduce the production times and improve the reactivity of the company
• Visual management: display of indicators visible from everyone, used as a source of motivation and animation.
2.2.4.ii Synchronous flow
This model of management can be especially found with car manufacturers. It can be at first sight considered as an application of JIT. The point is that some industries can't afford to keep within reach a big number of components due to their characteristics: great variety of finished products, bulk of the pieces, high production cadency etc. [10]
If it is impossible to keep close to the lines all the components that are supposed to be used in the production, it becomes necessary to make match the supply flow with the consumption of the components delivered on the line. This way is seducing in some of its aspects (reduction of the stocks, save of space etc), it required though a lot of rigor, and a high level pf performance from both partners. Indeed, once a supply order has been emitted, nothing should bother the flow in any way or it will generate big troubles where the component is supposed to be used. [10]
At first sight this method may look like JIT, it is however quite different in some aspects. It generates rigidity and a kind of submissiveness between partners. The spirit of JIT is to desynchronize the flows pieces and products, each actor having to optimize its operations depending on its own constraints. On the contrary, the (flux synchronous) approach reduces the degrees of freedom concerning the management of operations, it impose a strong and accurate scheduling.
2.2.4.iiiTheory of Constraints
The theory of constraints (TOC), also called Optimized Production Technology (OPT), was first introduced (or at least advertised) by Dr Eliyahu Goldratt which describes this new approach in his book The Goal, a book that was a great success in libraries.
It is a novel, that introduces a company which owns modern machines, employs qualified operators, manufactures products with a good demand, but which is about to go bankrupt. From this first observation, Dr Goldratt analyses the dysfunctions he encountered and then develops the theory of constraints whose major is to get the company earn money. [8]
19
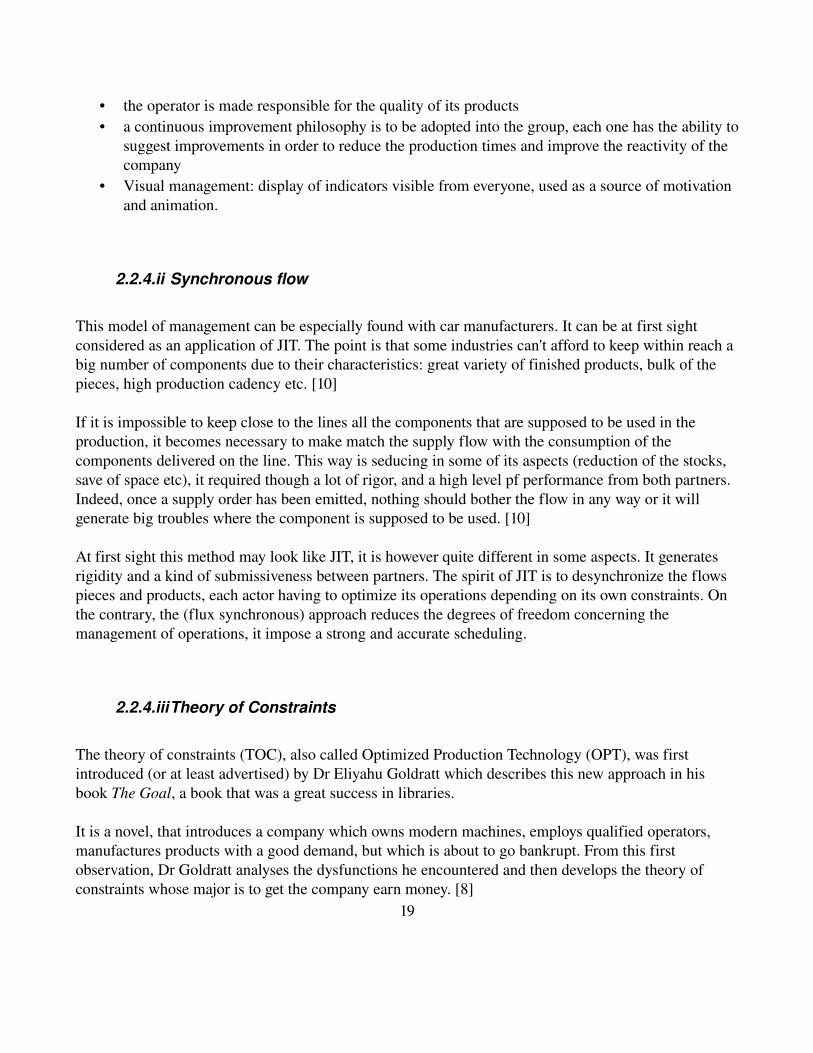
Considering that every production line has as a weak point its lowest cadency work station (the bottleneck), the theory suggests to focus first and foremost on the improvement of this station which the performance of the whole factory. The management of the bottleneck summarized with different principles:
• the bottleneck set the flow of the production and the stock level• every gain on productivity on a nonconstrained resource is waste• every hour saved on a bottleneck is an hour saved for the whole system• etc
As a consequence, a bottleneck should never stop producing, and the flow has to be organized so that it always has a stock of pieces to manufacture upstream.
A mixed management of operations
The management of operations in the TOC model is the perfect illustration of the synthesis targeted by this model. It is a combination of pulled and pushed flows. Thus, the planning tasks are concentrated on the bottleneck, the upstream flow is pulled by its consumption, and the downstream stations are managed in a push flow.
Illustration 6: Flow management around the bottleneck
Consequences on the organization of the whole factory
Contrary to the MRP and JIT approaches, the OPT does not really lead to any significant evolution in the structure of responsibilities in the company. However, it can be remarked that it focuses the attention on the profitability of the company, it puts the emphasis on a financial vision of the industrial performance.
20
3 Background
3.1 Company presentation
The Atlantic Group is a French company created in 1968 in La RochesurYon on the French west coast. It is today the leading French company in climate control engineering. In the 70s, the oil crisis threw France into the reign of nuclear power, electricity became therefore the primary technology for heating, and the group used this fact by basing its early development on electric convectors.
Over the last 40 years, it went from a small company to a group having a 900 million euros turnover in 2008. The shareholding is still family owned.
The group today designs and sells products for the domestic, commercial and industrial markets. The different categories are:− Electric water heaters: they are the products which started the company. They are ranging from 10 to 3000 liters (for professional use), including a number of innovations such as anticorrosion technologies− Electric heaters and bathroom products: the customer has a choice between different technologies (convection, radiant panel heaters etc), a wide range of aesthetics, size and functionality. Towel dryers are part of this category.− Domestic and commercial boilers, for domestic heating domestic water for both individual houses and industrial buildings.− Air conditioning− Ventilation: thermomechanical systems for homes and commercial sector premises.− Renewable energies: solar panels, woodfired boilers and heat pumps.
Originally based in France, one of the main targets of the group is currently to develop internationally. The strategy is to reach significant market positions under its own brands. After western and eastern Europe, the group is now stepping forward to MiddleEast particularly. Its products are today being distributed in over 100 countries.
21
3.2 The product
A towelradiator is a relatively simple product, and its manufacturing doesn't require any highly complex step. However, the marketing offers a wide range of options, which then requires a great number of references to be sold. Indeed, the customer has the choice between different sizes, power, designs, functionalities etc. I will now describe shortly what a towel radiator really is, and all the possible different variations in this same product.
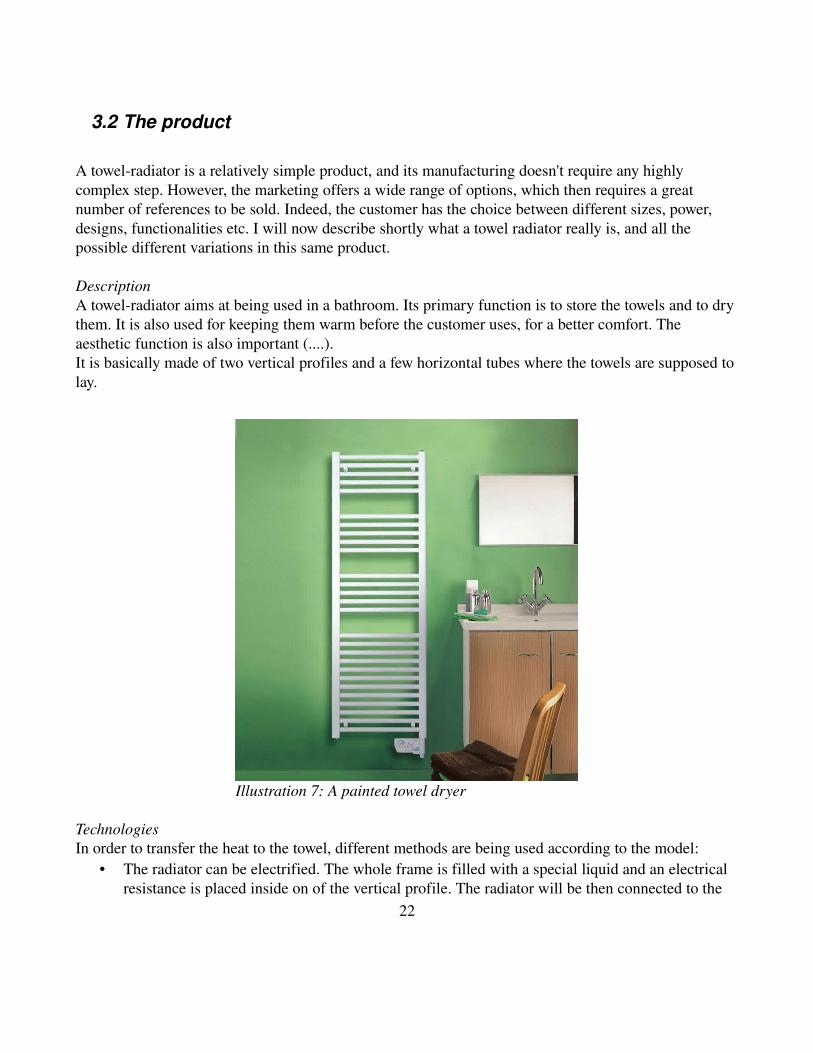
DescriptionA towelradiator aims at being used in a bathroom. Its primary function is to store the towels and to dry them. It is also used for keeping them warm before the customer uses, for a better comfort. The aesthetic function is also important (....).It is basically made of two vertical profiles and a few horizontal tubes where the towels are supposed to lay.
Illustration 7: A painted towel dryer
TechnologiesIn order to transfer the heat to the towel, different methods are being used according to the model:
• The radiator can be electrified. The whole frame is filled with a special liquid and an electrical resistance is placed inside on of the vertical profile. The radiator will be then connected to the
22
electricity. A control box, more or less sophisticated (LCD display etc), allows the user to control it. Most of the products sold on the French market are of this kind.
• The radiator can be “empty”. It is not connected to any source of electricity, but to the domestic network of hot water. During the production the radiator is left empty, it will be connected to the hot water during the installation.
• Some other solutions are being developed. For instance some references are sold with a fan placed on it. The target is for the towel radiator to fully replace the radiator in a bathroom. The issue is that the presence of towels on the product might create a [court circuit thermique] and prevent it from efficiently warming the room. Such a fan aims at bypass this limitation.
DesignIn terms of design, there are two major categories: “tube in” radiators, and “tube on”.As said before, a radiator is basically of two profiles and some horizontal tubes. The difference between those two groups is in the way those two parts are connected. On the tubein radiators, the profiles are drilled and the tubes are clamped in those holes. With the tubeon radiators, the tubes are welded above the profiles. This aesthetic difference actually creates a major difference in terms of process. The way both groups are manufactured are really different, and thus, as we will see later, it creates two distinct flows on the workshop.
SurfaceThe aspect of the surface of the radiator can be: either painted, either chromed. Most painted radiators are white, a few of them are black but painted outside the factory.
Shape and dimensionsOnce those characteristics have been described, the customer still has the choice between a large range of sizes. The height of a radiator varies between 40cm and 2m, while the width ranges from 30cm to 1m.The tubes can be:
• Round tubes: most tubes have a round section. The existing diameters are 16, 20, 22 and 25mm. he thickness of the tubes varies from 1.0 to 1.2 mm.
• Flat tubes • Square tubes
The profiles can also be:• Dshape profiles (85% of the production)• square profiles• Round profiles
All those characteristics have for consequence a great number of different references: over the year 2009, 600 different kinds of radiators have been produced. Each one of these variation create constraints in terms of organization, flow and control.
23
3.3 The process
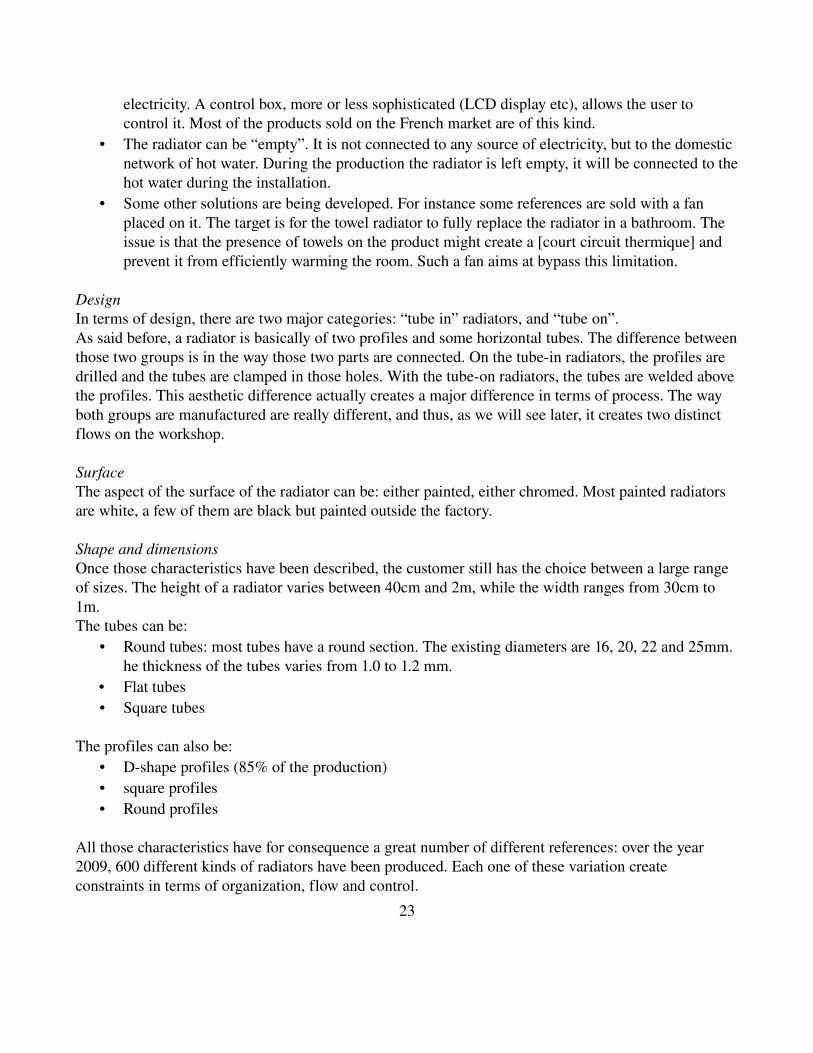
How is towelradiator manufactured? The main steps basically are:
• Cutting: the raw materials are metal bars (most of them are 6 meters long). Different machines cut these bars into tubes and profiles.• Assembly: after cutting, the different parts of the radiator will be assembled together. This can be done in different ways, according to the kind of product.• Surface finishing: either chroming, either painting.• Electrification, accessories and packaging.
Now some more details about the process:
• CuttingBoth profiles and tubes have to be cut in the first step of the process. Three different machines can perform this operation: the socalled Adige, the Borsatto, and the manual cutting machine. Those machines have different characteristics for different uses.
o The Borsatto: they are 3, they are for cutting tubes. They can cut different diameters: 20mm, 22mm and 25mm. In terms of feeding, the operator just has to (poser) a faggot of bars at the back of the machines. The tubes which have been cut are falling into a box, same for the end of the bar which is going to the trash. Besides the cutting, the machine also performs a forming of the extremities of the tubes.
o The Adige machine: another cutting machine, which can cut two lengths in the same bar. 24
Illustration 8: Structure of the flow
We'll see in part X.X.X that this specification is very important in terms of optimization of the waste of material. This machine is mostly used for cutting profiles of different sizes, but also some tubes.
o Manual cutting: besides those two kinds of cutting machines is placed another machine. It is simpler, it is called “manual” because there is no system for automatic feeding of the parts.
• PolishingBefore being used, the tubes that are supposed to be part of chromed radiators (around 20% of the total quantity of tubes) have to be polished. For painted products, the quality of the surface of the raw material isn't really crucial, but for the chroming operation it is. Thus, right after cutting the tubes for chromed products will be polished.
• DrillingAfter cutting, the profiles are moving to the drilling station. The 3 drilling machines can each one drill up to 4 profiles at a time.
• AssemblyThis is the step where tubes and profiles gather. Three similar machines are used for this purpose.
• OvenAfter the assembly, some pasta is placed on each joint that is supposed to be welded. The radiator is then placed into an oven that allows the pasta to melt. The pasta is made of copper (among other things, it melts at a temperature of 913°C, and then the capillarity action allow an uniform spreading out of the pasta and a good welding). There are two ovens,
• PaintingRight after the oven, the radiators are held to track that is going through an electrostatic painting line. The whole process lasts around two hours.
• ChromingThe chroming operation consists in dipping the radiators in a series of different baths. The radiators are hung top a bar moved by robots. The radiators are placed inside several tanks that contain different technical products. Different programs are input into the robot controller, depending on the characteristics of the radiator, and the overall throughput time for the chroming step is around 60 minutes.
• Filling and packaging linesAfter the metal line and the surface treatment lines, this is the last step.
o The radiator can be filled: if the toweldryer is to be used connected to the electricity, it is filled with a thermodynamic liquid and a resistance.
25

o Then the packaging can start: it consists in assembling accessories (like electrical boxes and plugs or device for hanging to walls) and placing the radiator into its box.
3.4 Synthesis
All of this might seem a bit complex, but what is the most important for you to know if you work on production planning and control? The technical details won't really matter to you actually. You won't have to know how the PLC is controlling such feeder, or the chemical characteristics of the different baths at the chroming station.
What really matters is that you have a perfect knowledge of the constraints on the field. On one side you have a lot of products with their own characteristics, and on the other side you have machines and people. In order to achieve a good flow, you need to have in mind how each product is manufactured, what are the possibilities and the limits of each one of your resource.
With this background being settled, we can now really start looking at how to build an efficient system that use those resources in order to manufacture the product.
26
4 Scheduling the production.
This part will focus on the treatment of the information upstream the workshop: how can we make the link between the customer orders and the workshop?As said before, this part will not focus on the material supply issue, even if it is of course a very important matter in the organization.
When the factory was designed ans started, for some reasons the emphasis was not put on having a smooth flow. It was rather put on the process, since a part of it was really new in the company. Thus when the real production started, the production department basically had to get organized the machines and the men with its experience and a few computers.
I will now explain what tools and procedures have been developed in order to achieve such a goal, the way they work and perspectives for future improvements.
4.1 Defining the exact constraints
According to the theory of constraints, the scheduling point should be the bottleneck; the point is now to try to find it out. The process is not a single flow, it is made of many different machines, and there are different kinds of products that follow very different paths. However, it is possible to make a rough estimation based on the most frequent products, and the major steps of the process.
600 different kinds of radiators are being manufactured, but it appears that most of them are:• tubein radiators• Dshape profiles• Round tubes: 20, 22 or 25mm diameter.• Chromed or painted
Therefore we will estimate the capacity of the tube cutting (Borsatto machines), profile cutting (Adige machine), drilling, assembly, oven and then the chroming and painting steps.
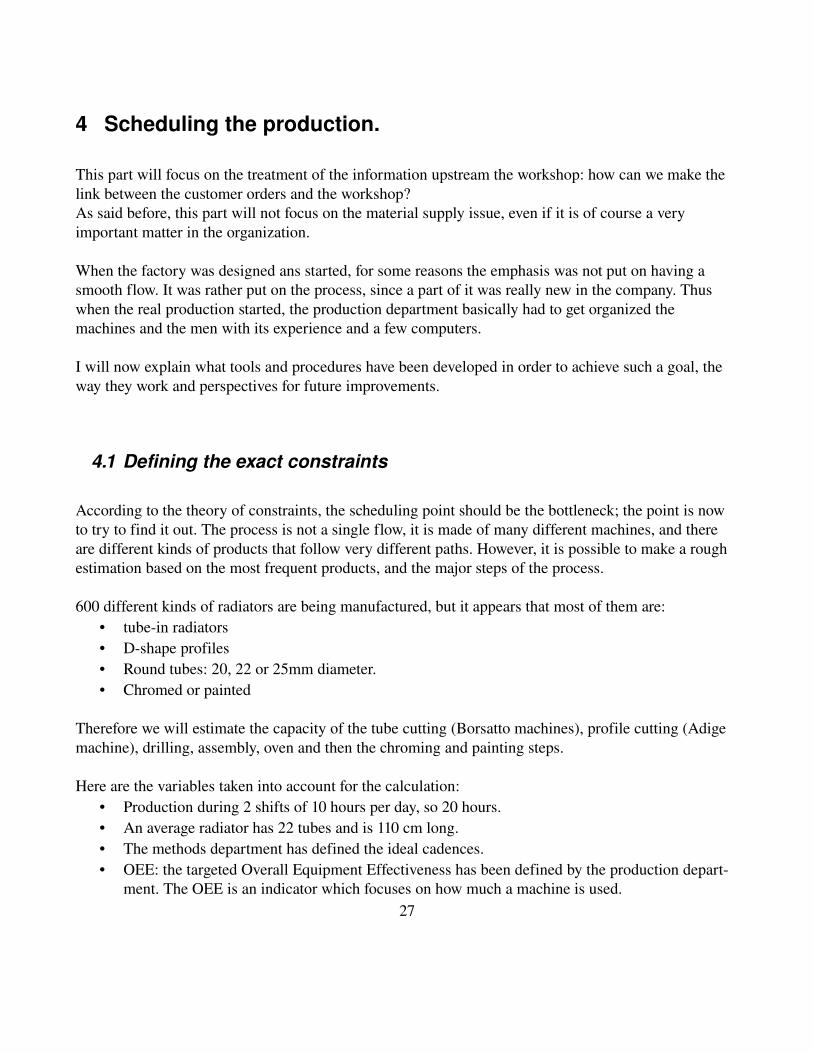
Here are the variables taken into account for the calculation:• Production during 2 shifts of 10 hours per day, so 20 hours.• An average radiator has 22 tubes and is 110 cm long.• The methods department has defined the ideal cadences.• OEE: the targeted Overall Equipment Effectiveness has been defined by the production depart
ment. The OEE is an indicator which focuses on how much a machine is used.27
[I can make here a short description of how an OEE is calculated]
Machine Number of machines Theoretical cadency Expected OEE Radiators/dayTube cutting 3 783 tubes/hour 85% 1815
Profile cutting 1 710 profiles/hour 88% 6250Drilling 3 93 profies/hour 85% 2370
Assembly 3 49 frames/hour 85% 2500Oven 2 60 m/hour 95% 2180
Chrome 1 90% >2000
For the chroming and painting lines, the capacities have been estimated according to the constraints described in the presentation of the process (part 3.3). Those are rough estimation, but we know anyway that those lines are much faster than the rest (they usually work only one shift per day).
It appears from the table that the tube cutting step, i.e. the first step of the process, is the bottleneck. This operation will set the capacity of the whole line (of the products concerned by this step actually, so the majority).
4.2 The scheduling of the production in details
We have just decided to schedule the first step of the line, the cutting operation, that give the pace of the rest of the line through a push flow. Let's see now how to make the link between a customer order and an actual production launch.
From the customer orders to the production scheduling, the production launch is made in three different steps.
• The first one is directly connected to the customers, and is therefore performed by the logistics department. According to parameters such as the orders, the stock levels, the targeted stock levels or the production constraints, the logistics will make a first draft of what they would like the factory to produce for the next days.
• The logistics then sends the proposal to the production department that will validate and then start planning the production on a daily basis.
• We will see that a final scheduling is necessary, driven by machine constraints, so on the most local level.
Why are the two first launches separate? Can't we just make one launch from customer orders to manufacturing orders?The reason is that those two activities require quite different skills. The first part is very customer
28
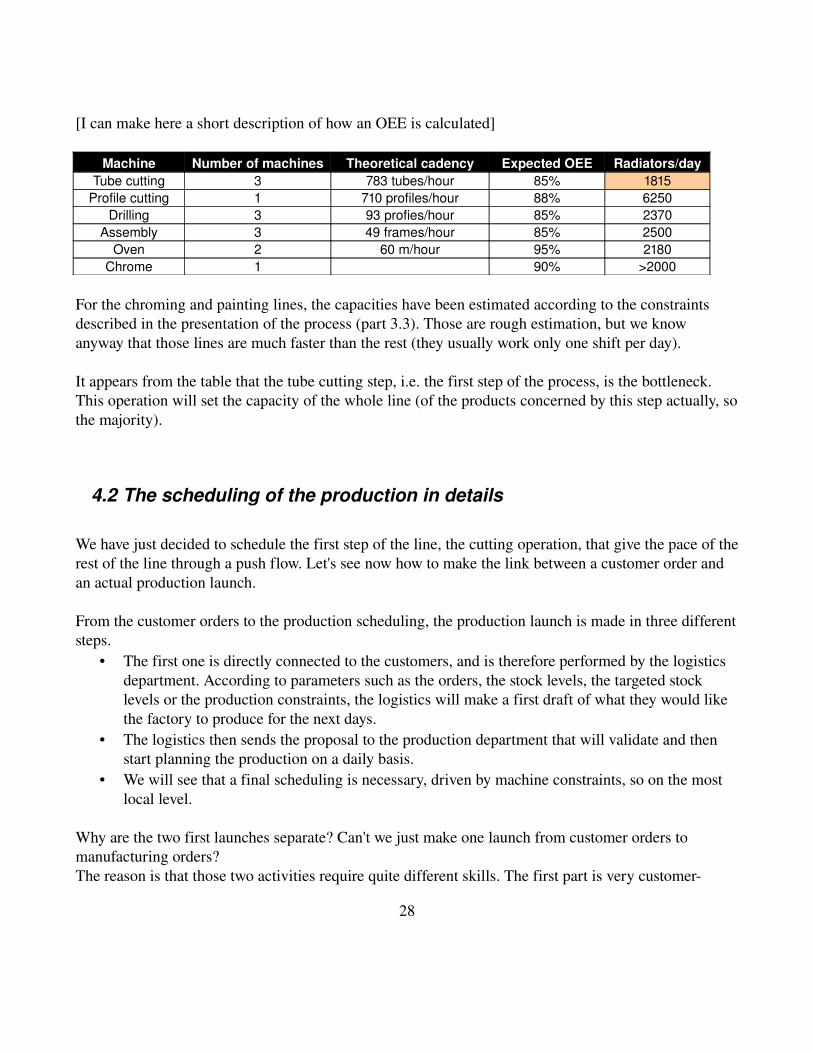
oriented. It requires an extensive knowledge of the customers, their expectations and needs etc. The second part of the launch is much more related to production, and requires a good knowledge of all the constraints on the field. Also, those launches are not oneshot activities. It requires work upstream for the preparation and downstream for the monitoring. All those reasons make it necessary (for the moment) to split the scheduling into two main parts.
How often shall the production launch be made?
As often as possible. When I first arrived in the company, the launch was being made weekly. It means that every week, the logistics was sending a program for the next five days. Some work has been done in order to reduce this number, after a few months we were launching every two days.Launching frequently provides a lot of benefits:
• it reduces the lead time. If the logistics makes one launch every 5 days, an order will wait an average of 2.5 days between the logistics launch and the actual production launch. If logistics makes a launch every day, this average time drops to one day. But a simple change in the organization, you reduced therefore the average lead time by 1.5 days.
• More flexibility for the management of customer orders. If you make a launch every 5 days and get an order right after you made the launch, you have wait one more week in order to include this order in the production launch. If you make more frequent launches, this duration drops.
29
Illustration 9: Flow of information
• When making the launch, the logistics department takes into account the expected products that are being manufactured at the moment. The bigger the launch, the more products there are in the pipe to consider. This variability affects the customer satisfaction, and it might be necessary to increase the stocks in order to fight this variability.
It has also a few drawbacks:• It takes more time. Of course making one launch instead of two or three takes more time than
only one. Such an argument might seem stupid, but many companies encounters resistance when they want to change the workload of their organization.
• Frequent launches means that the visibility is reduced for production. In the factory, some machines required a few hours for a changeover, and therefore the settings were planned several days in advance. If you don't have this visibility, it might be difficult to anticipate, and your optimization might be not perfect.
I will now describe how the different steps of the launched were made practically, which methods and tools were used, and some conclusions about it.
4.2.1 Launch proposal from logistics department
The first step of the process is made by the logistics department. They are the link between the customers and the production. The main criteria they use for the launch are:
• the orders from customers: reference, quantity, shipment date• the current stock levels in terms of finished products• the raw material stock (metal, accessories, box etc)• The targeted stock levels. They have been defined in the production masterplan according to the
customer forecasts.• The workinprocess: references that have already been launched but have not reached the
finished products stock yet.• And finally, the constraints on the production floor. Instructions are being given before each
launch by the production. The global organization of the workshop is being decided according to the production masterplan, and also according to some more local constraints (if some part of the process is late, is specific products are to be launched etc). From this organization is calculated a capacity (for example: 2000m per day in the ovens, 500 electrified products per day etc).
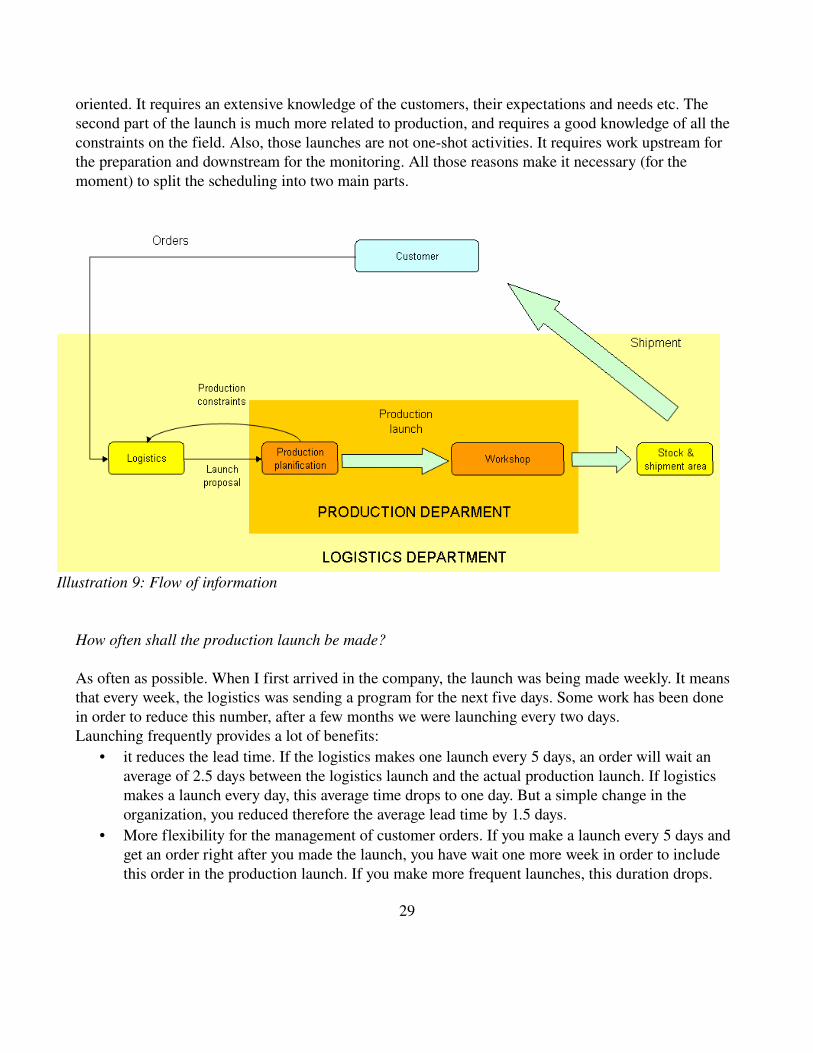
Now here is an overview of how this optimization work can be made. Here is a sample one of the file used for such a launch.
30
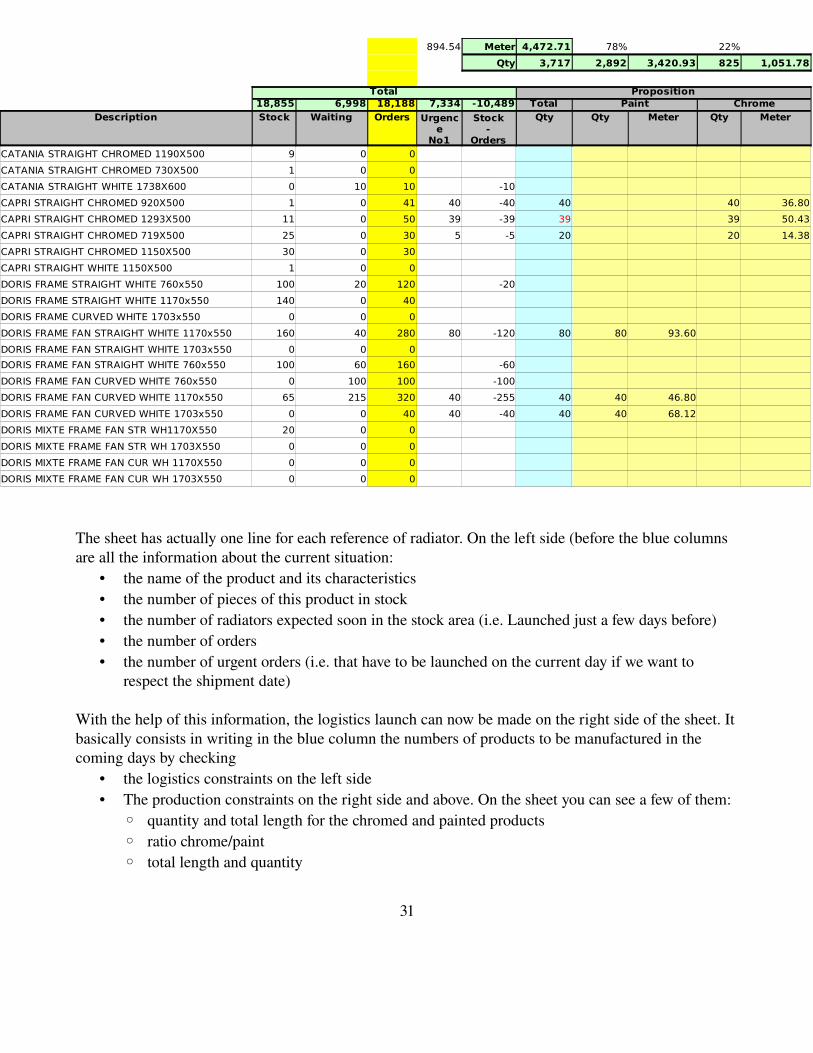
The sheet has actually one line for each reference of radiator. On the left side (before the blue columns are all the information about the current situation:
• the name of the product and its characteristics• the number of pieces of this product in stock• the number of radiators expected soon in the stock area (i.e. Launched just a few days before)• the number of orders• the number of urgent orders (i.e. that have to be launched on the current day if we want to
respect the shipment date)
With the help of this information, the logistics launch can now be made on the right side of the sheet. It basically consists in writing in the blue column the numbers of products to be manufactured in the coming days by checking
• the logistics constraints on the left side• The production constraints on the right side and above. On the sheet you can see a few of them:
◦ quantity and total length for the chromed and painted products◦ ratio chrome/paint◦ total length and quantity
31
894.54 Meter 4,472.71 78% 22%
Qty 3,717 2,892 3,420.93 825 1,051.78
Total Proposition18,855 6,998 18,188 7,334 -10,489 Total Paint Chrome
Description Stock Waiting Orders Qty Qty Meter Qty Meter
CATANIA STRAIGHT CHROMED 1190X500 9 0 0
CATANIA STRAIGHT CHROMED 730X500 1 0 0
CATANIA STRAIGHT WHITE 1738X600 0 10 10 -10
CAPRI STRAIGHT CHROMED 920X500 1 0 41 40 -40 40 40 36.80
CAPRI STRAIGHT CHROMED 1293X500 11 0 50 39 -39 39 39 50.43
CAPRI STRAIGHT CHROMED 719X500 25 0 30 5 -5 20 20 14.38
CAPRI STRAIGHT CHROMED 1150X500 30 0 30
CAPRI STRAIGHT WHITE 1150X500 1 0 0
DORIS FRAME STRAIGHT WHITE 760x550 100 20 120 -20
DORIS FRAME STRAIGHT WHITE 1170x550 140 0 40
DORIS FRAME CURVED WHITE 1703x550 0 0 0
DORIS FRAME FAN STRAIGHT WHITE 1170x550 160 40 280 80 -120 80 80 93.60
DORIS FRAME FAN STRAIGHT WHITE 1703x550 0 0 0
DORIS FRAME FAN STRAIGHT WHITE 760x550 100 60 160 -60
DORIS FRAME FAN CURVED WHITE 760x550 0 100 100 -100
DORIS FRAME FAN CURVED WHITE 1170x550 65 215 320 40 -255 40 40 46.80
DORIS FRAME FAN CURVED WHITE 1703x550 0 0 40 40 -40 40 40 68.12
DORIS MIXTE FRAME FAN STR WH1170X550 20 0 0
DORIS MIXTE FRAME FAN STR WH 1703X550 0 0 0
DORIS MIXTE FRAME FAN CUR WH 1170X550 0 0 0
DORIS MIXTE FRAME FAN CUR WH 1703X550 0 0 0
Urgence
No1
Stock-
Orders
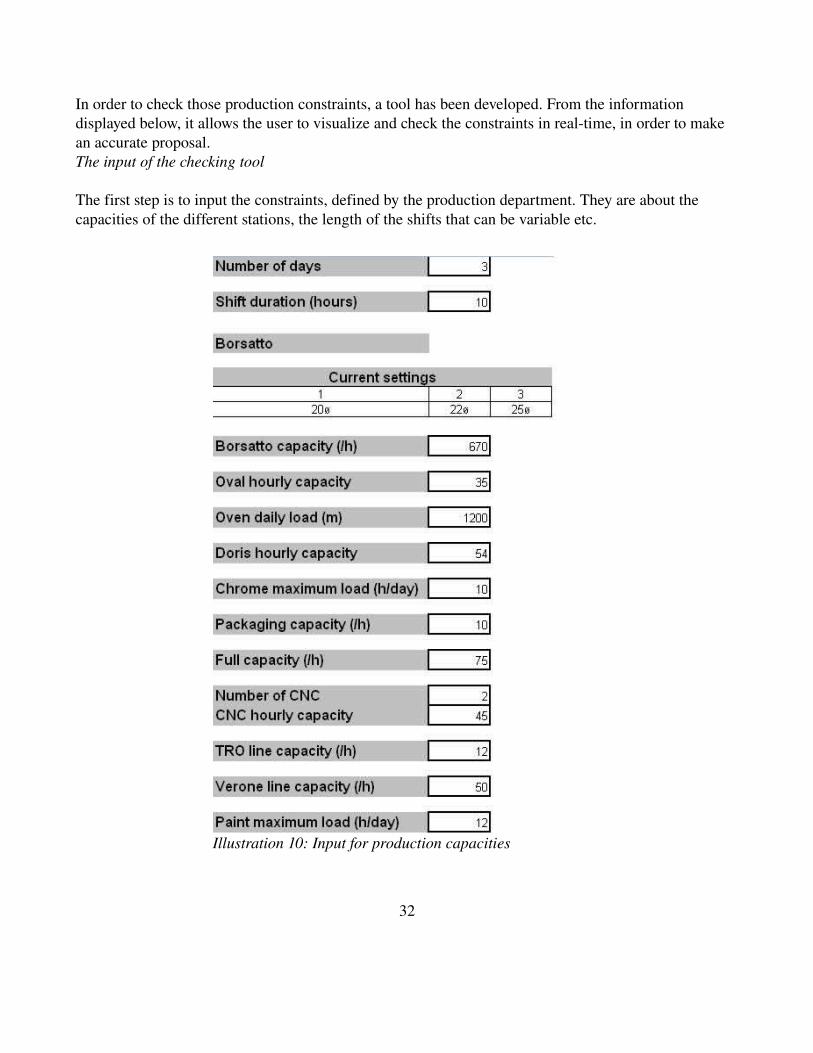
In order to check those production constraints, a tool has been developed. From the information displayed below, it allows the user to visualize and check the constraints in realtime, in order to make an accurate proposal.The input of the checking tool
The first step is to input the constraints, defined by the production department. They are about the capacities of the different stations, the length of the shifts that can be variable etc.
32
Illustration 10: Input for production capacities
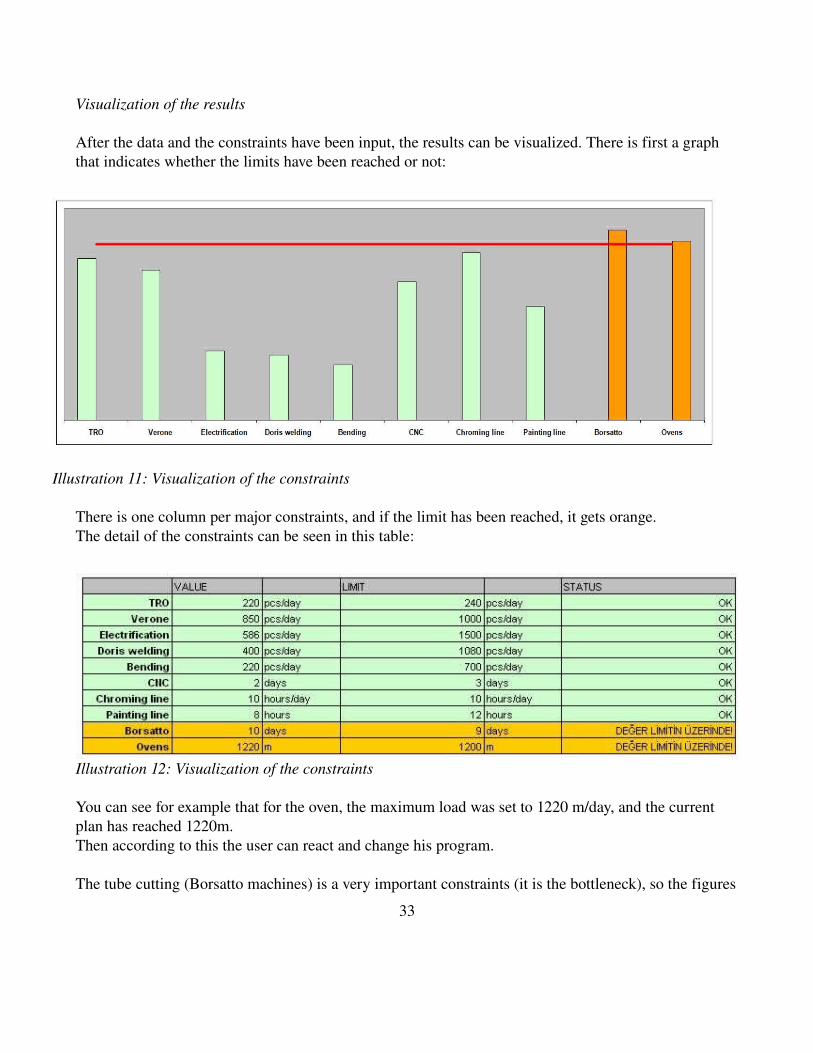
Visualization of the results
After the data and the constraints have been input, the results can be visualized. There is first a graph that indicates whether the limits have been reached or not:
There is one column per major constraints, and if the limit has been reached, it gets orange.The detail of the constraints can be seen in this table:
You can see for example that for the oven, the maximum load was set to 1220 m/day, and the current plan has reached 1220m. Then according to this the user can react and change his program.
The tube cutting (Borsatto machines) is a very important constraints (it is the bottleneck), so the figures
33
Illustration 11: Visualization of the constraints
Illustration 12: Visualization of the constraints
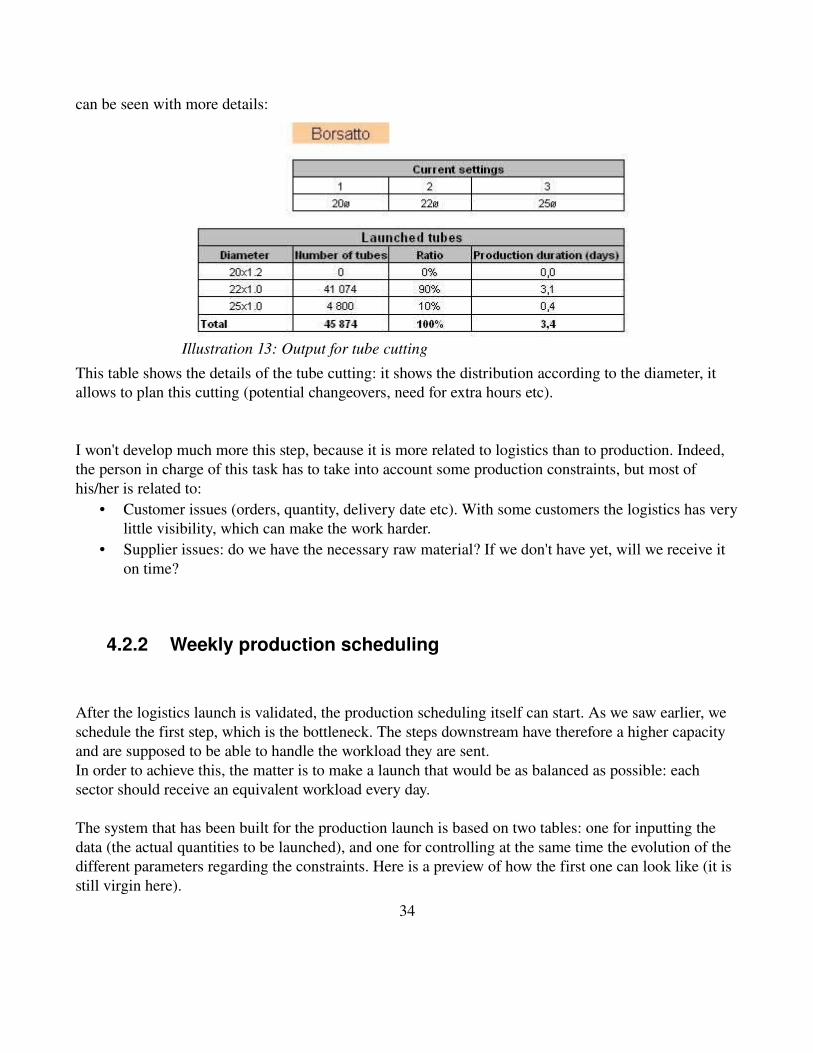
can be seen with more details:
This table shows the details of the tube cutting: it shows the distribution according to the diameter, it allows to plan this cutting (potential changeovers, need for extra hours etc).
I won't develop much more this step, because it is more related to logistics than to production. Indeed, the person in charge of this task has to take into account some production constraints, but most of his/her is related to:
• Customer issues (orders, quantity, delivery date etc). With some customers the logistics has very little visibility, which can make the work harder.
• Supplier issues: do we have the necessary raw material? If we don't have yet, will we receive it on time?
4.2.2 Weekly production scheduling
After the logistics launch is validated, the production scheduling itself can start. As we saw earlier, we schedule the first step, which is the bottleneck. The steps downstream have therefore a higher capacity and are supposed to be able to handle the workload they are sent.In order to achieve this, the matter is to make a launch that would be as balanced as possible: each sector should receive an equivalent workload every day.
The system that has been built for the production launch is based on two tables: one for inputting the data (the actual quantities to be launched), and one for controlling at the same time the evolution of the different parameters regarding the constraints. Here is a preview of how the first one can look like (it is still virgin here).
34
Illustration 13: Output for tube cutting
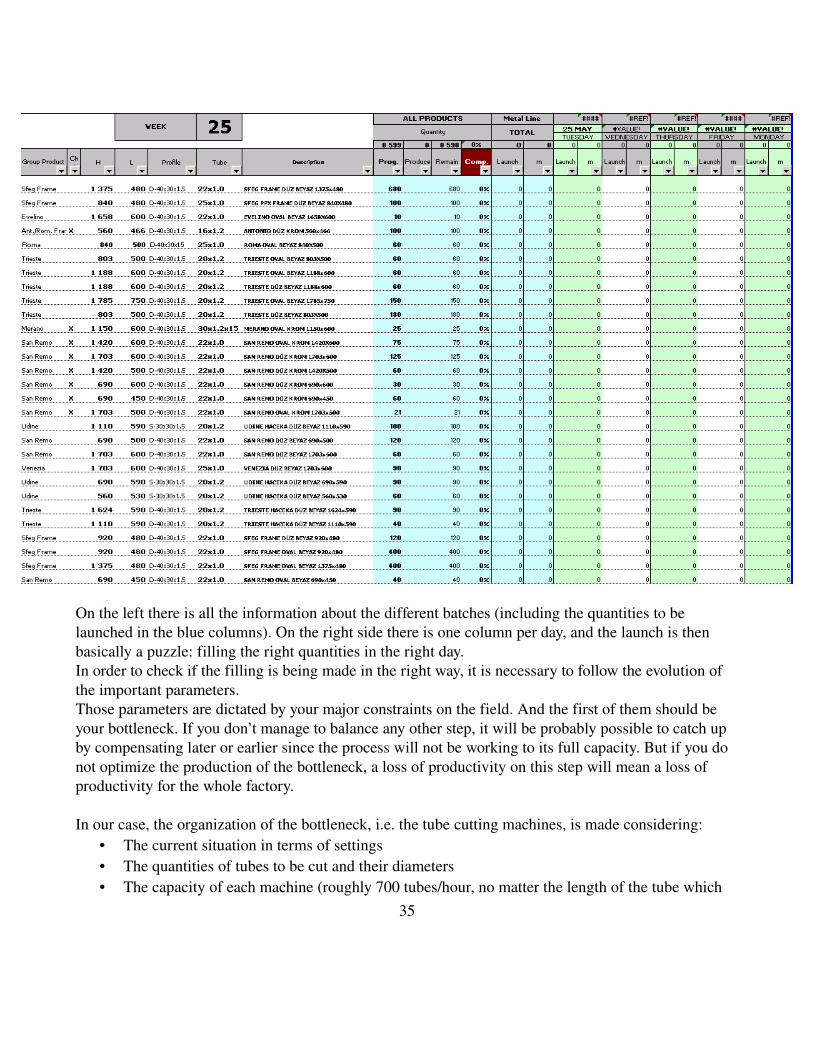
On the left there is all the information about the different batches (including the quantities to be launched in the blue columns). On the right side there is one column per day, and the launch is then basically a puzzle: filling the right quantities in the right day.In order to check if the filling is being made in the right way, it is necessary to follow the evolution of the important parameters.Those parameters are dictated by your major constraints on the field. And the first of them should be your bottleneck. If you don’t manage to balance any other step, it will be probably possible to catch up by compensating later or earlier since the process will not be working to its full capacity. But if you do not optimize the production of the bottleneck, a loss of productivity on this step will mean a loss of productivity for the whole factory.
In our case, the organization of the bottleneck, i.e. the tube cutting machines, is made considering:• The current situation in terms of settings• The quantities of tubes to be cut and their diameters• The capacity of each machine (roughly 700 tubes/hour, no matter the length of the tube which
35
actually has little influence).
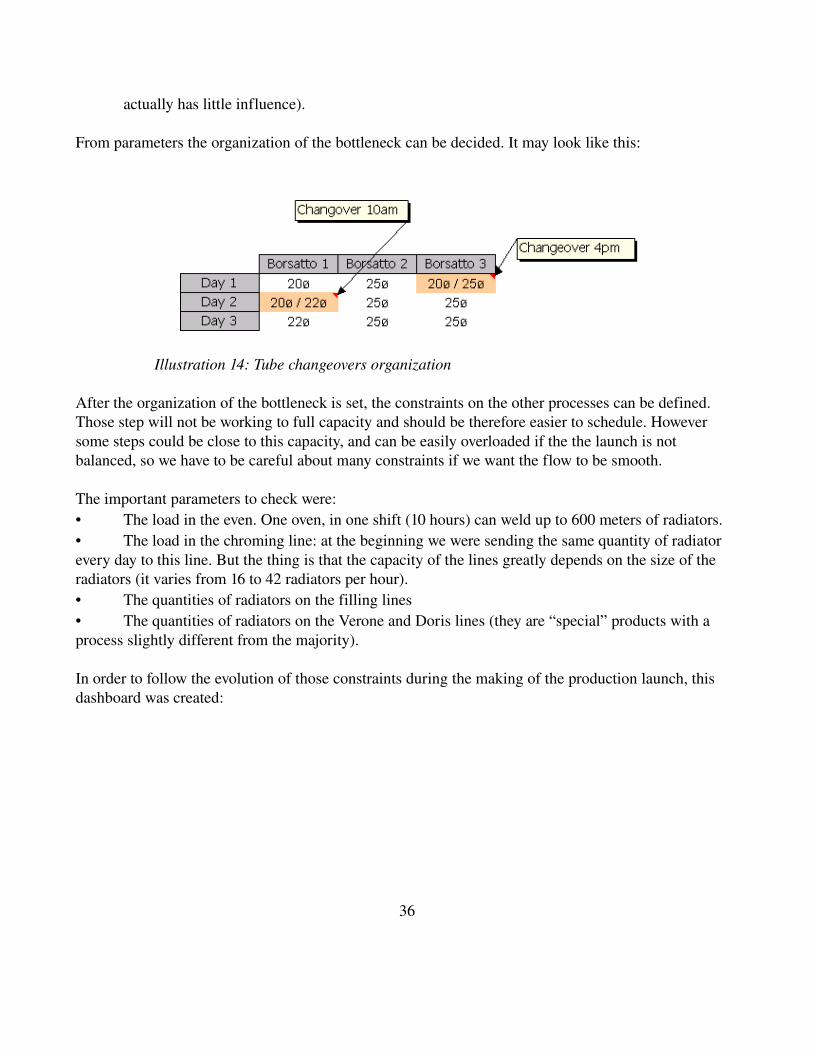
From parameters the organization of the bottleneck can be decided. It may look like this:
Illustration 14: Tube changeovers organization
After the organization of the bottleneck is set, the constraints on the other processes can be defined. Those step will not be working to full capacity and should be therefore easier to schedule. However some steps could be close to this capacity, and can be easily overloaded if the the launch is not balanced, so we have to be careful about many constraints if we want the flow to be smooth.
The important parameters to check were:• The load in the even. One oven, in one shift (10 hours) can weld up to 600 meters of radiators.• The load in the chroming line: at the beginning we were sending the same quantity of radiator every day to this line. But the thing is that the capacity of the lines greatly depends on the size of the radiators (it varies from 16 to 42 radiators per hour).• The quantities of radiators on the filling lines• The quantities of radiators on the Verone and Doris lines (they are “special” products with a process slightly different from the majority).
In order to follow the evolution of those constraints during the making of the production launch, this dashboard was created:
36
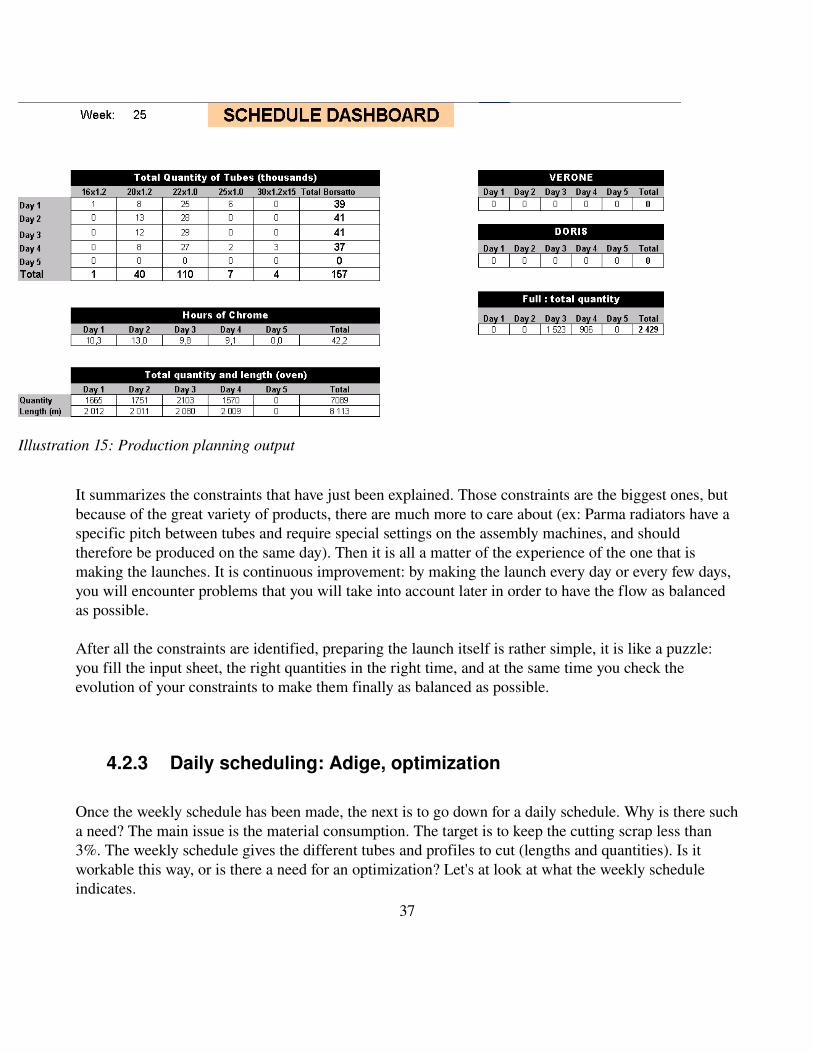
It summarizes the constraints that have just been explained. Those constraints are the biggest ones, but because of the great variety of products, there are much more to care about (ex: Parma radiators have a specific pitch between tubes and require special settings on the assembly machines, and should therefore be produced on the same day). Then it is all a matter of the experience of the one that is making the launches. It is continuous improvement: by making the launch every day or every few days, you will encounter problems that you will take into account later in order to have the flow as balanced as possible.
After all the constraints are identified, preparing the launch itself is rather simple, it is like a puzzle: you fill the input sheet, the right quantities in the right time, and at the same time you check the evolution of your constraints to make them finally as balanced as possible.
4.2.3 Daily scheduling: Adige, optimization
Once the weekly schedule has been made, the next is to go down for a daily schedule. Why is there such a need? The main issue is the material consumption. The target is to keep the cutting scrap less than 3%. The weekly schedule gives the different tubes and profiles to cut (lengths and quantities). Is it workable this way, or is there a need for an optimization? Let's at look at what the weekly schedule indicates.
37
Illustration 15: Production planning output
4.2.3.i Need for a tube cutting optimization?
The scheduling point is the cutting stations: Borsatto (for the tubes) and Adige (for the profiles).
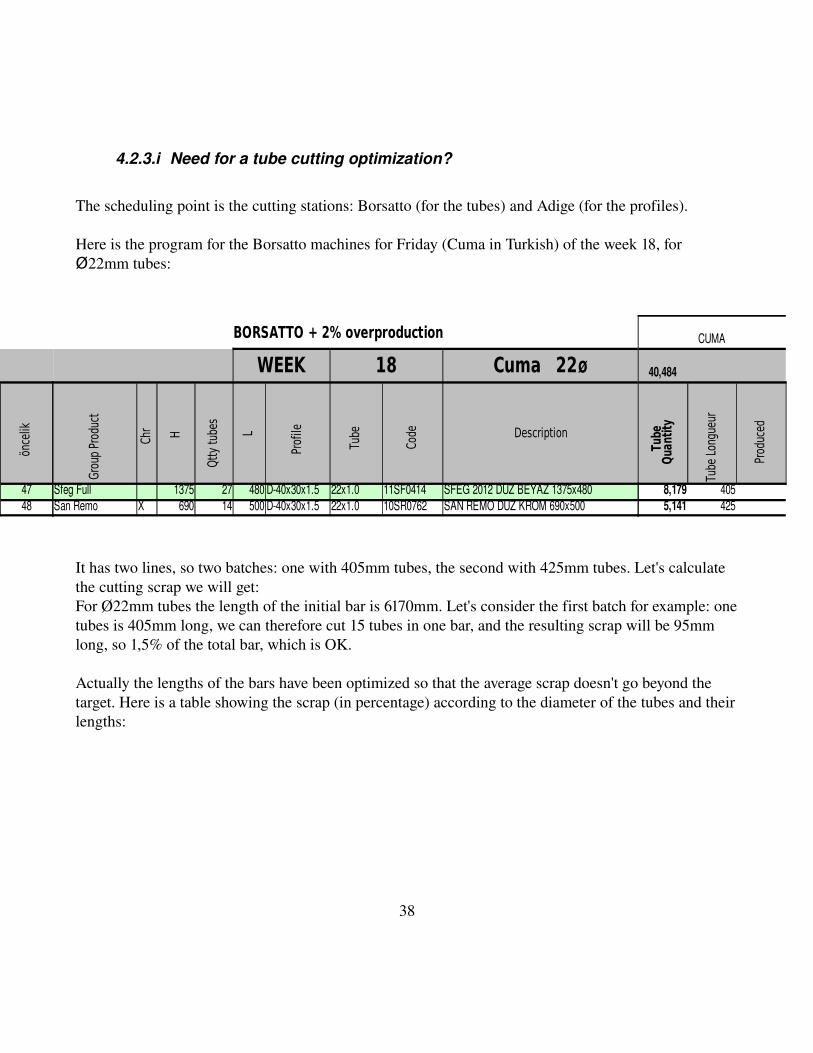
Here is the program for the Borsatto machines for Friday (Cuma in Turkish) of the week 18, for Ø22mm tubes:
It has two lines, so two batches: one with 405mm tubes, the second with 425mm tubes. Let's calculate the cutting scrap we will get:For Ø22mm tubes the length of the initial bar is 6170mm. Let's consider the first batch for example: one tubes is 405mm long, we can therefore cut 15 tubes in one bar, and the resulting scrap will be 95mm long, so 1,5% of the total bar, which is OK.
Actually the lengths of the bars have been optimized so that the average scrap doesn't go beyond the target. Here is a table showing the scrap (in percentage) according to the diameter of the tubes and their lengths:
38
BORSATTO + 2% overproduction CUMA
WEEK 18 40,484 Pazar
önce
lik
Grou
p Pr
oduc
t
Chr H
Qtty
tube
s
L
Prof
ile
Tube
Code Description
Tube
Lon
gueu
r
Prod
uced
47 Sfeg Full 1375 27 480 D40x30x1.5 22x1.0 11SF0414 SFEG 2012 DÜZ BEYAZ 1375x480 8,179 40548 San Remo X 690 14 500 D40x30x1.5 22x1.0 10SR0762 SAN REMO DÜZ KROM 690x500 5,141 425
Cuma 22ø
Tube
Q
uant
ity
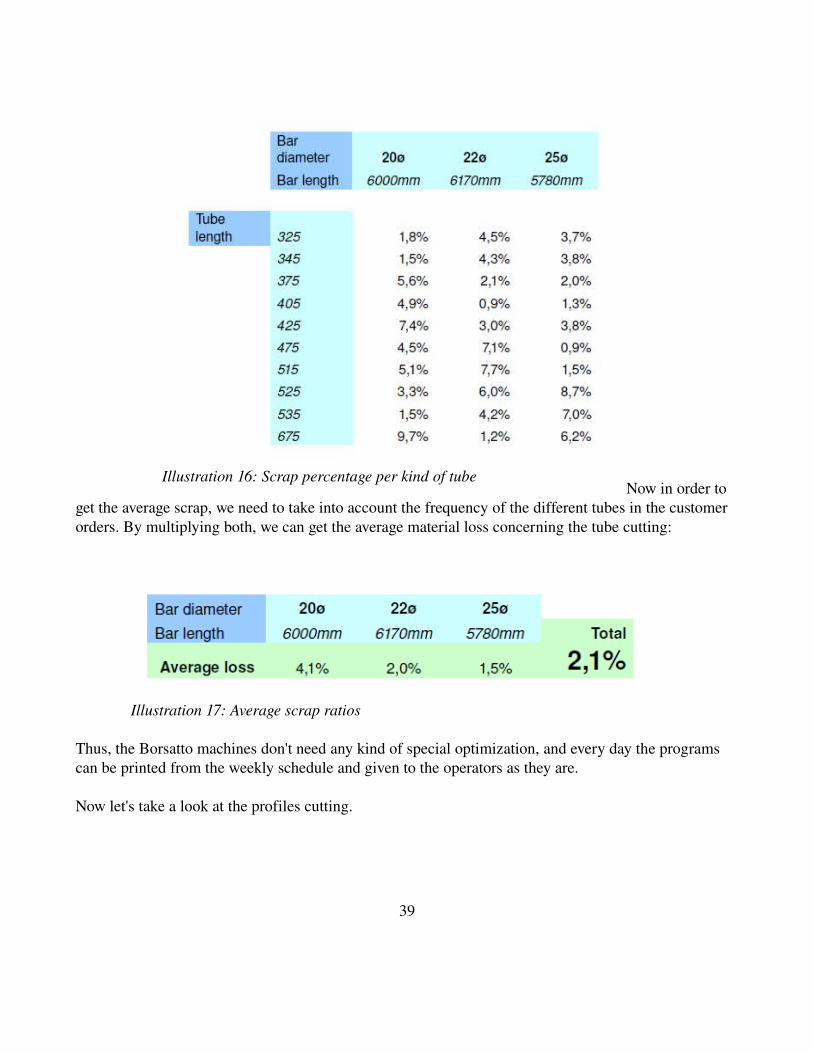
Now in order to get the average scrap, we need to take into account the frequency of the different tubes in the customer orders. By multiplying both, we can get the average material loss concerning the tube cutting:
Thus, the Borsatto machines don't need any kind of special optimization, and every day the programs can be printed from the weekly schedule and given to the operators as they are.
Now let's take a look at the profiles cutting.
39
Illustration 16: Scrap percentage per kind of tube
Illustration 17: Average scrap ratios
4.2.3.ii Profile cutting scheduling
▪ The issue
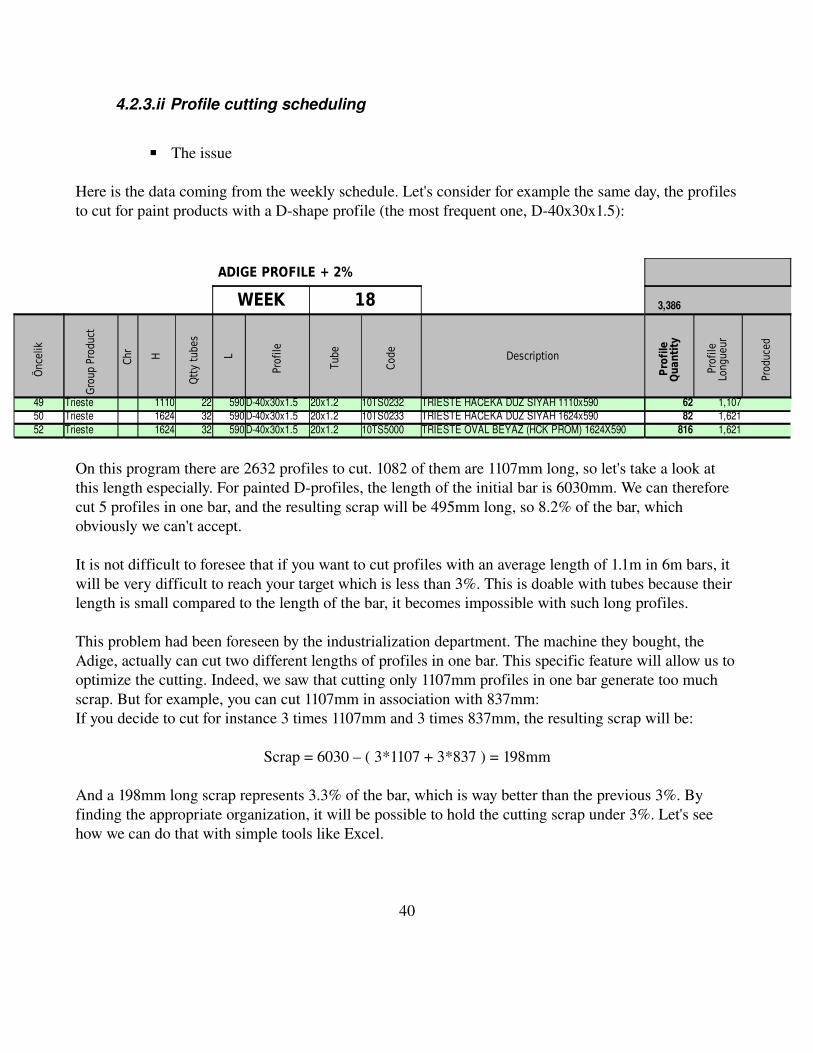
Here is the data coming from the weekly schedule. Let's consider for example the same day, the profiles to cut for paint products with a Dshape profile (the most frequent one, D40x30x1.5):
On this program there are 2632 profiles to cut. 1082 of them are 1107mm long, so let's take a look at this length especially. For painted Dprofiles, the length of the initial bar is 6030mm. We can therefore cut 5 profiles in one bar, and the resulting scrap will be 495mm long, so 8.2% of the bar, which obviously we can't accept.
It is not difficult to foresee that if you want to cut profiles with an average length of 1.1m in 6m bars, it will be very difficult to reach your target which is less than 3%. This is doable with tubes because their length is small compared to the length of the bar, it becomes impossible with such long profiles.
This problem had been foreseen by the industrialization department. The machine they bought, the Adige, actually can cut two different lengths of profiles in one bar. This specific feature will allow us to optimize the cutting. Indeed, we saw that cutting only 1107mm profiles in one bar generate too much scrap. But for example, you can cut 1107mm in association with 837mm:If you decide to cut for instance 3 times 1107mm and 3 times 837mm, the resulting scrap will be:
Scrap = 6030 – ( 3*1107 + 3*837 ) = 198mm
And a 198mm long scrap represents 3.3% of the bar, which is way better than the previous 3%. By finding the appropriate organization, it will be possible to hold the cutting scrap under 3%. Let's see how we can do that with simple tools like Excel.
40
ADIGE PROFILE + 2% Thursday
WEEK 18 3,386 Monday
Önc
elik
Gro
up P
rodu
ct
Chr
H
Qtt
y tu
bes
L
Prof
ile
Tube
Code Description
Prod
uced
49 Trieste 1110 22 590D40x30x1.5 20x1.2 10TS0232 TRIESTE HACEKA DÜZ SİYAH 1110x590 62 1,10750 Trieste 1624 32 590D40x30x1.5 20x1.2 10TS0233 TRIESTE HACEKA DÜZ SİYAH 1624x590 82 1,62152 Trieste 1624 32 590D40x30x1.5 20x1.2 10TS5000 TRIESTE OVAL BEYAZ (HCK PROM) 1624X590 816 1,621
Pro
file
Q
uant
ity
Prof
ile
Long
ueur
• Defining the strategy
We saw that it is possible to cut 2 kinds of profiles together. But the problem is then: each time we want to cut a quantity of a given length, you will have to cut another length that will go in a buffer... That way is going against the justintime philosophy, which advises to cut only and exactly what is needed at a given time.Anyway, material consumption is a very costly issue, it is then worth having some buffers in order to keep the raw material loss under the target.
Before I arrive in the company, the operators themselves were managing that kind of issue. They had one paper where was written a list of some possible couples to cut, and they were mixing the production planned of the week. For example, they were cutting all the 1372mm of the week, together with the 837mm because it is a high runner that would surely be used soon. This way of doing creates several problems:• Actually, only one operator was able to handle this kind of optimization. He was working there since the start of the machine, and was the one who had the biggest knowledge about it in the company. This kind of situation should be avoided. First because an operator is not recruited for this kind of things. He was the only holder of the knowledge, and was aware about it, which can create some tensions on a human resources point of view. In a lean perspective, the knowledge has to be shared as much as possible. A lean manager always looks for standardization of the tasks, which is obviously not the case when you let an operator solving problems and you have no idea about what he is doing.• On a JIT perspective, this way of doing was not good. The operator was trying to optimize the cut on a weekly base. It means that we were cutting some profiles several days before we needed them, while others were cut too late. The consequence of this was big buffers after the cutting step, long lead times, and difficulties to find out where we were in terms of planning completion.
The target was then to try to build a daily cutting program which would• minimize the buffer• minimize the scrapOnce the tool would be stable, the next step would be to make it standard and userfriendly so many people can understand it and use it.The flow would look like this:
41
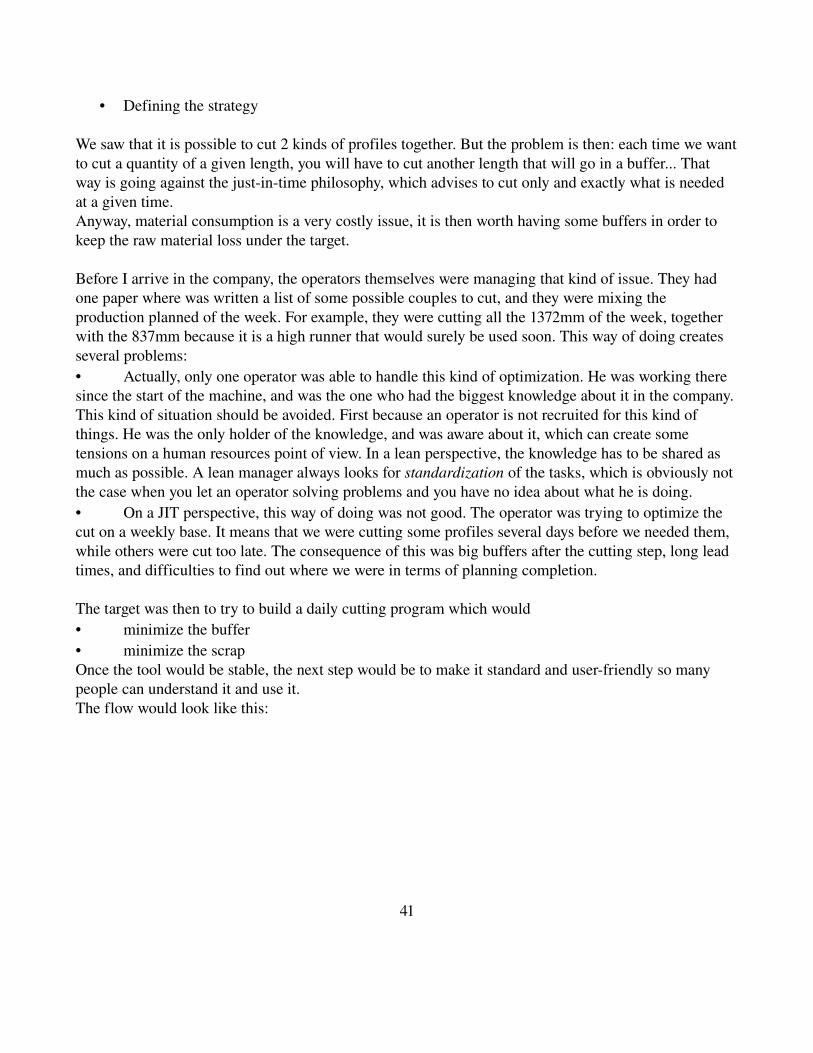
Illustration 18: Material flow for profiles
Daily the Adige will transform bars into profiles that will go in the workinprocess. The particular constraints on this machine will force us to put some profiles on the side in a buffer, and they will be used a few days later.
Now the question is: how do build such a cutting program practically?
• Developing the algorithm
Before making any program, it is critical to know exactly what the constraints on this machine are. This question might seem awkward, but it actually took weeks before we found out exactly what were the exact constraints. This is due to several reasons: language issues, as well as the fact that the operators that had the knowledge were not so willing to share the knowledge they had (due to social issues in the factory).
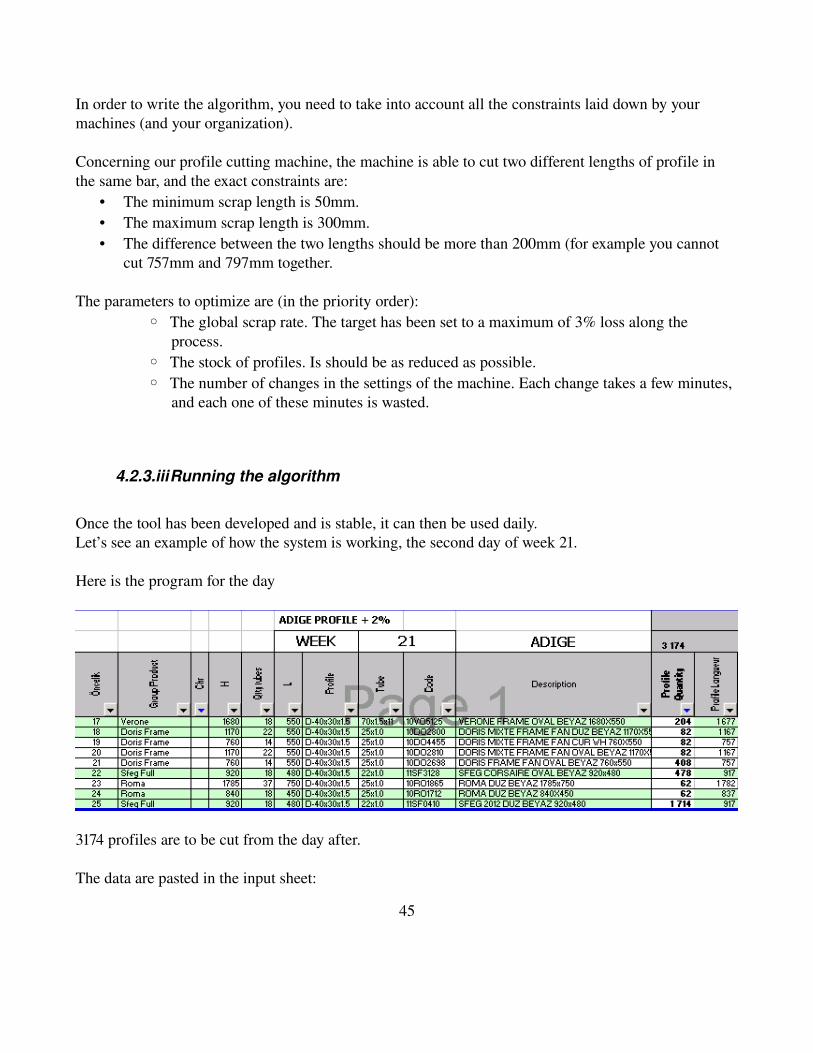
So here is an example of a planning resulting from the weekly schedule. It says what is to be cut on the program n°2 of the week 21 (so on the 18th of May), for painted products Dprofile:
42
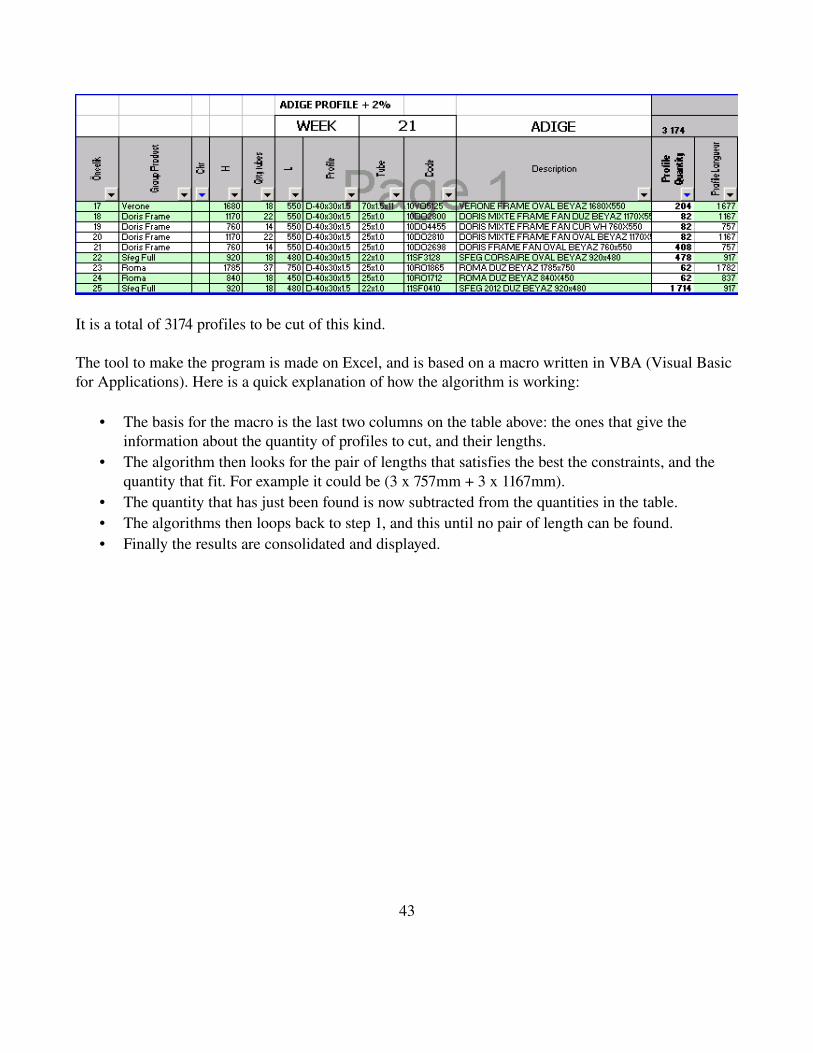
It is a total of 3174 profiles to be cut of this kind.
The tool to make the program is made on Excel, and is based on a macro written in VBA (Visual Basic for Applications). Here is a quick explanation of how the algorithm is working:
• The basis for the macro is the last two columns on the table above: the ones that give the information about the quantity of profiles to cut, and their lengths.
• The algorithm then looks for the pair of lengths that satisfies the best the constraints, and the quantity that fit. For example it could be (3 x 757mm + 3 x 1167mm).
• The quantity that has just been found is now subtracted from the quantities in the table.• The algorithms then loops back to step 1, and this until no pair of length can be found.• Finally the results are consolidated and displayed.
43
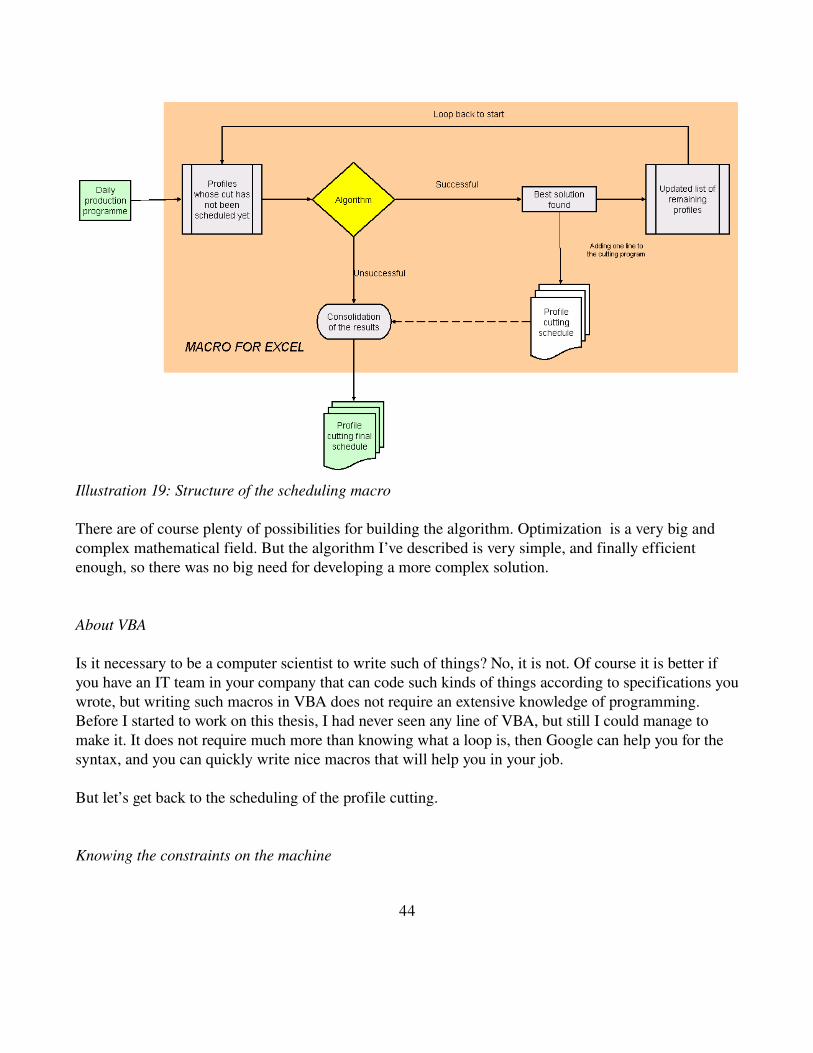
Illustration 19: Structure of the scheduling macro
There are of course plenty of possibilities for building the algorithm. Optimization is a very big and complex mathematical field. But the algorithm I’ve described is very simple, and finally efficient enough, so there was no big need for developing a more complex solution.
About VBA
Is it necessary to be a computer scientist to write such of things? No, it is not. Of course it is better if you have an IT team in your company that can code such kinds of things according to specifications you wrote, but writing such macros in VBA does not require an extensive knowledge of programming.Before I started to work on this thesis, I had never seen any line of VBA, but still I could manage to make it. It does not require much more than knowing what a loop is, then Google can help you for the syntax, and you can quickly write nice macros that will help you in your job.
But let’s get back to the scheduling of the profile cutting.
Knowing the constraints on the machine
44
In order to write the algorithm, you need to take into account all the constraints laid down by your machines (and your organization).
Concerning our profile cutting machine, the machine is able to cut two different lengths of profile in the same bar, and the exact constraints are:
• The minimum scrap length is 50mm.• The maximum scrap length is 300mm.• The difference between the two lengths should be more than 200mm (for example you cannot
cut 757mm and 797mm together.
The parameters to optimize are (in the priority order):◦ The global scrap rate. The target has been set to a maximum of 3% loss along the
process.◦ The stock of profiles. Is should be as reduced as possible.◦ The number of changes in the settings of the machine. Each change takes a few minutes,
and each one of these minutes is wasted.
4.2.3.iiiRunning the algorithm
Once the tool has been developed and is stable, it can then be used daily.Let’s see an example of how the system is working, the second day of week 21.
Here is the program for the day
3174 profiles are to be cut from the day after.
The data are pasted in the input sheet:
45
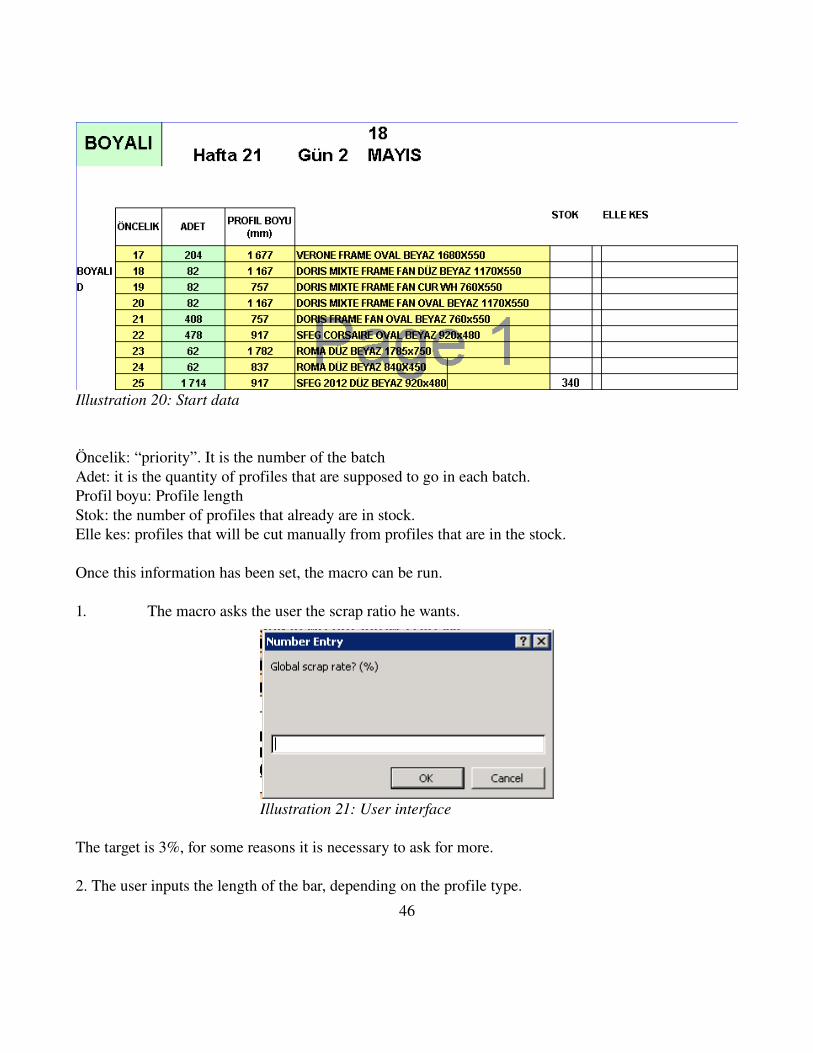
Illustration 20: Start data
Öncelik: “priority”. It is the number of the batchAdet: it is the quantity of profiles that are supposed to go in each batch.Profil boyu: Profile lengthStok: the number of profiles that already are in stock.Elle kes: profiles that will be cut manually from profiles that are in the stock.
Once this information has been set, the macro can be run.
1. The macro asks the user the scrap ratio he wants.
Illustration 21: User interface
The target is 3%, for some reasons it is necessary to ask for more.
2. The user inputs the length of the bar, depending on the profile type.
46
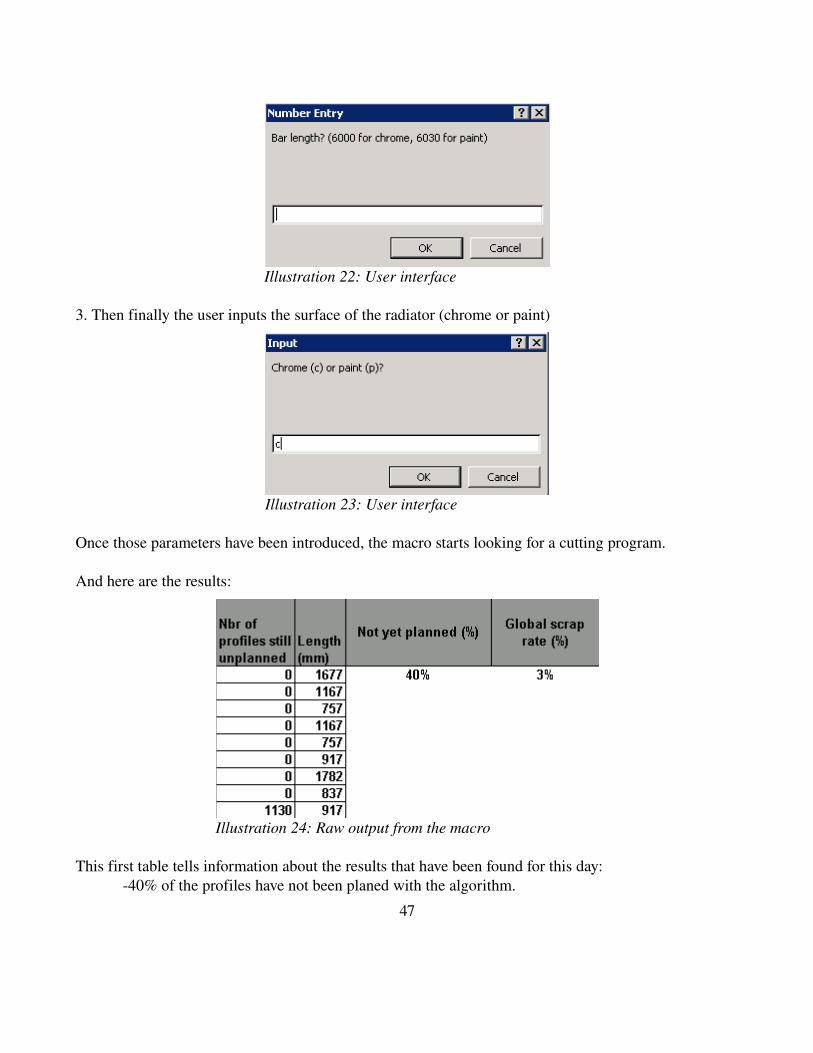
Illustration 22: User interface
3. Then finally the user inputs the surface of the radiator (chrome or paint)
Illustration 23: User interface
Once those parameters have been introduced, the macro starts looking for a cutting program.
And here are the results:
Illustration 24: Raw output from the macro
This first table tells information about the results that have been found for this day:40% of the profiles have not been planed with the algorithm.
47
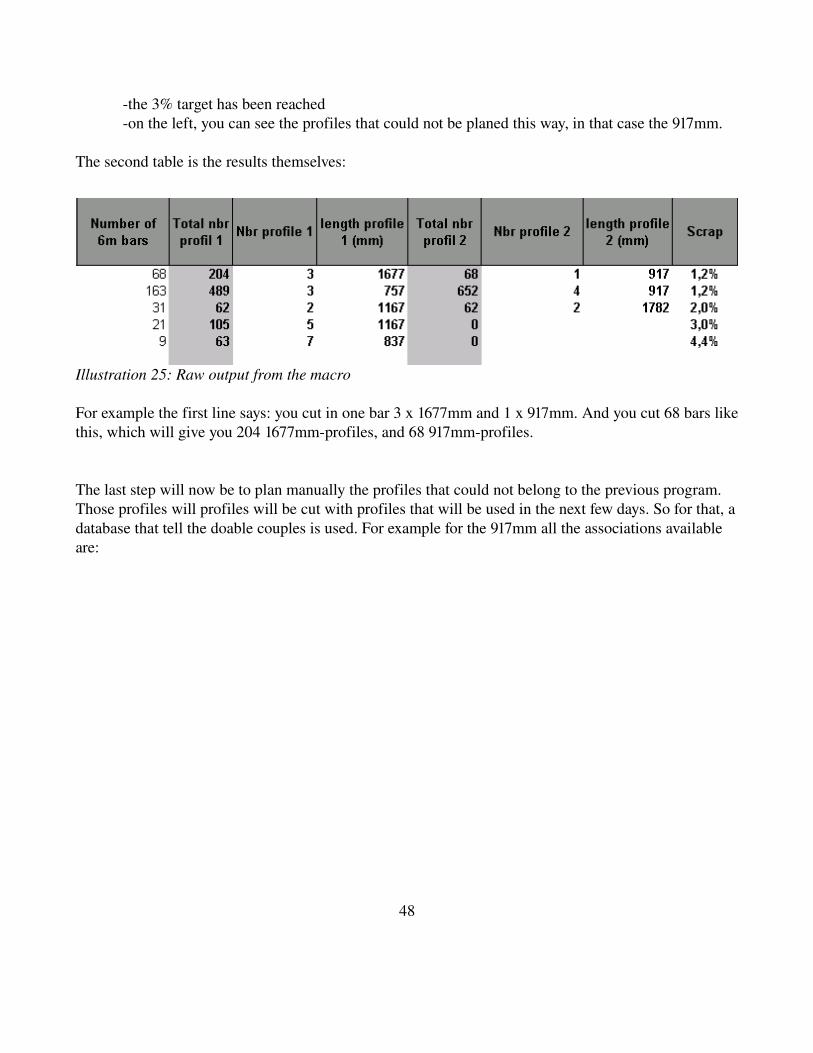
the 3% target has been reachedon the left, you can see the profiles that could not be planed this way, in that case the 917mm.
The second table is the results themselves:
Illustration 25: Raw output from the macro
For example the first line says: you cut in one bar 3 x 1677mm and 1 x 917mm. And you cut 68 bars like this, which will give you 204 1677mmprofiles, and 68 917mmprofiles.
The last step will now be to plan manually the profiles that could not belong to the previous program. Those profiles will profiles will be cut with profiles that will be used in the next few days. So for that, a database that tell the doable couples is used. For example for the 917mm all the associations available are:
48
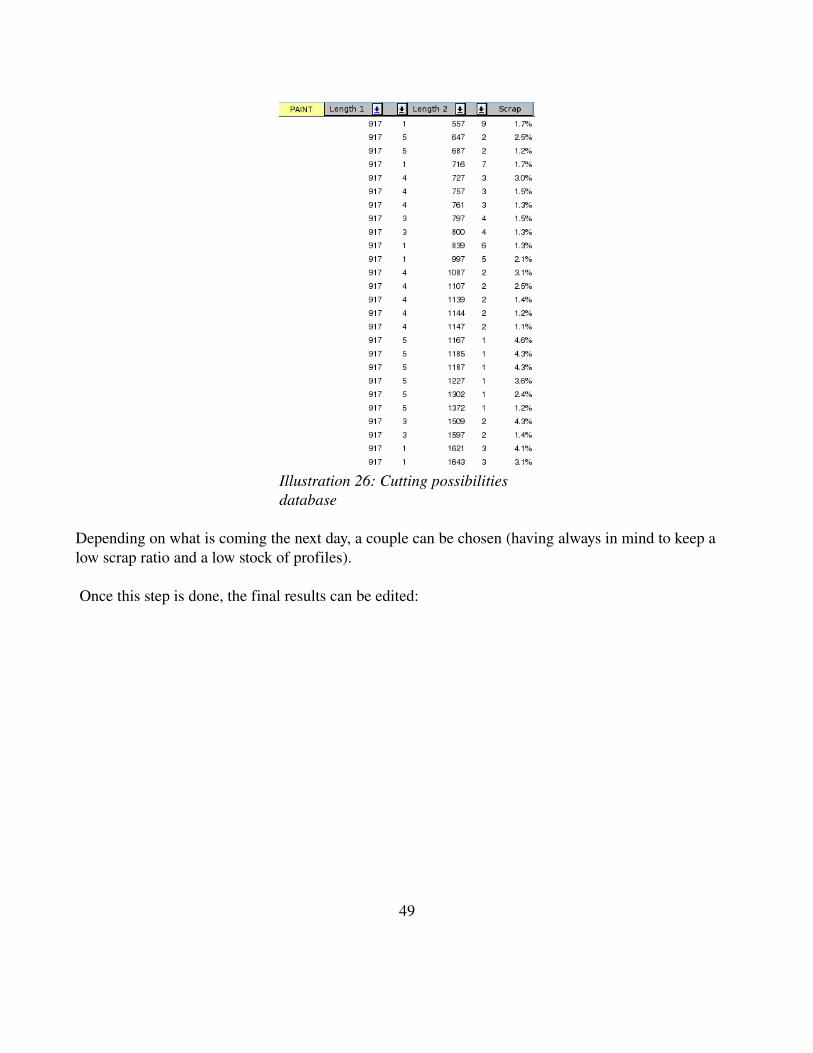
Depending on what is coming the next day, a couple can be chosen (having always in mind to keep a low scrap ratio and a low stock of profiles).
Once this step is done, the final results can be edited:
49
Illustration 26: Cutting possibilities database
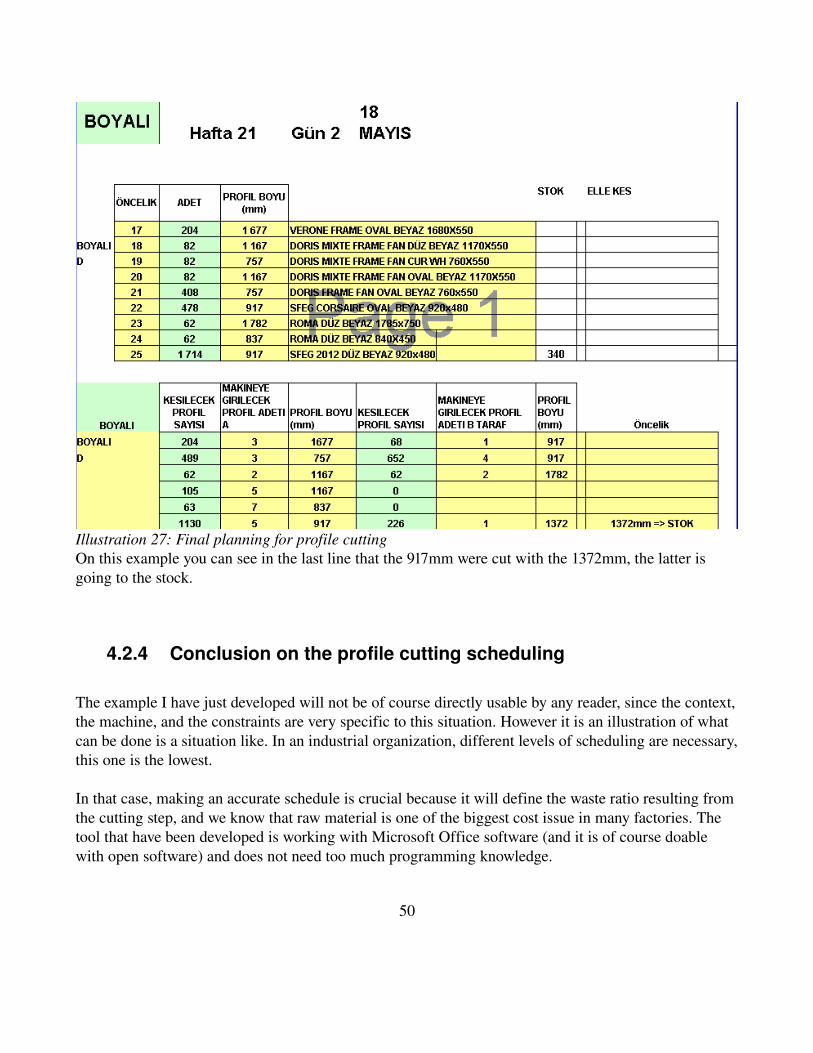
Illustration 27: Final planning for profile cuttingOn this example you can see in the last line that the 917mm were cut with the 1372mm, the latter is going to the stock.
4.2.4 Conclusion on the profile cutting scheduling
The example I have just developed will not be of course directly usable by any reader, since the context, the machine, and the constraints are very specific to this situation. However it is an illustration of what can be done is a situation like. In an industrial organization, different levels of scheduling are necessary, this one is the lowest.
In that case, making an accurate schedule is crucial because it will define the waste ratio resulting from the cutting step, and we know that raw material is one of the biggest cost issue in many factories. The tool that have been developed is working with Microsoft Office software (and it is of course doable with open software) and does not need too much programming knowledge.
50
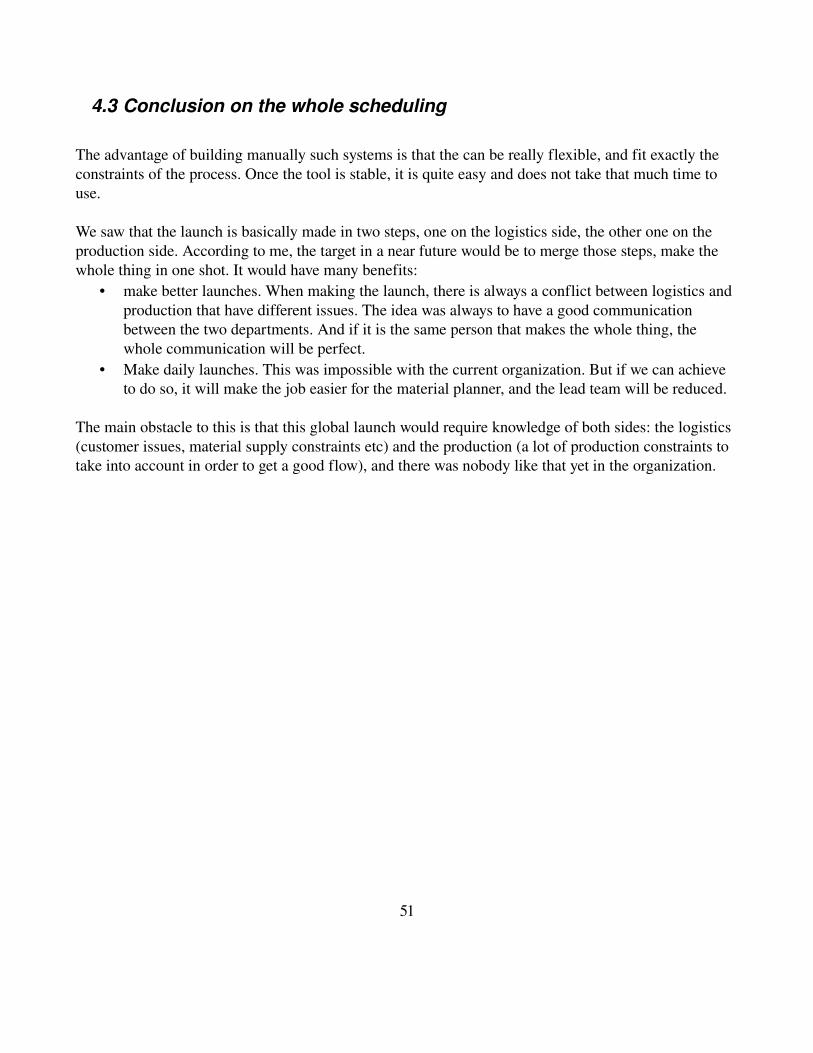
4.3 Conclusion on the whole scheduling
The advantage of building manually such systems is that the can be really flexible, and fit exactly the constraints of the process. Once the tool is stable, it is quite easy and does not take that much time to use.
We saw that the launch is basically made in two steps, one on the logistics side, the other one on the production side. According to me, the target in a near future would be to merge those steps, make the whole thing in one shot. It would have many benefits:
• make better launches. When making the launch, there is always a conflict between logistics and production that have different issues. The idea was always to have a good communication between the two departments. And if it is the same person that makes the whole thing, the whole communication will be perfect.
• Make daily launches. This was impossible with the current organization. But if we can achieve to do so, it will make the job easier for the material planner, and the lead team will be reduced.
The main obstacle to this is that this global launch would require knowledge of both sides: the logistics (customer issues, material supply constraints etc) and the production (a lot of production constraints to take into account in order to get a good flow), and there was nobody like that yet in the organization.
51
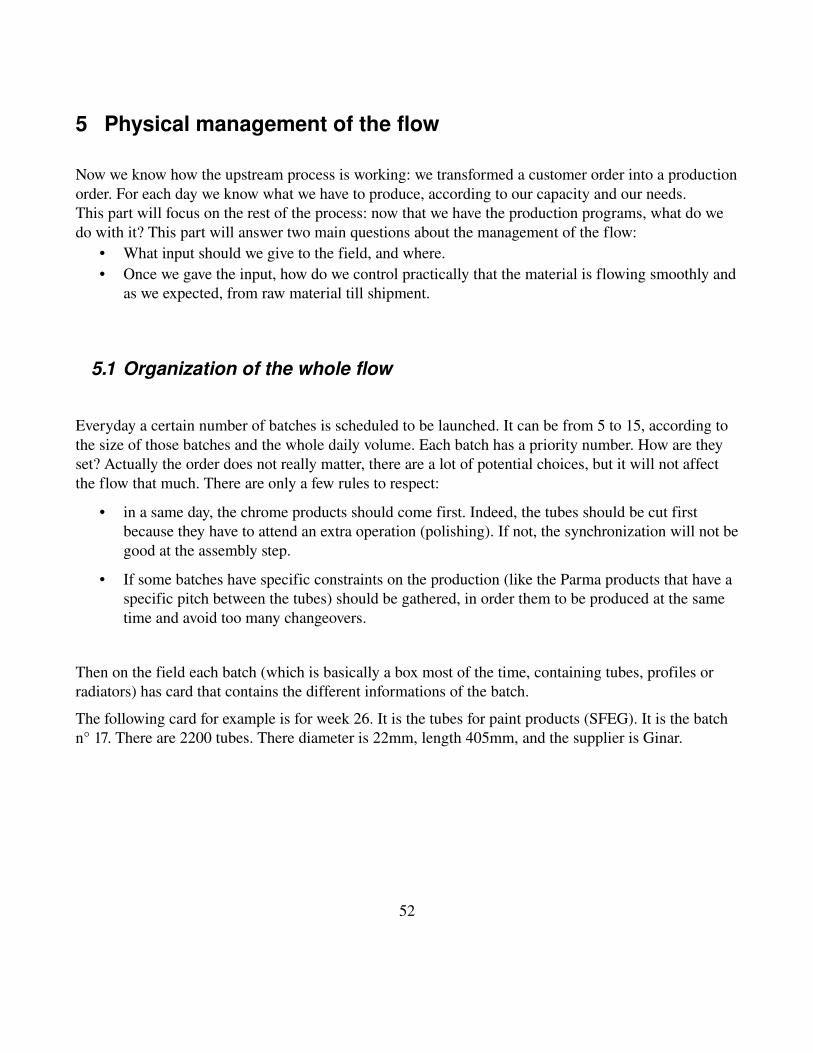
5 Physical management of the flow
Now we know how the upstream process is working: we transformed a customer order into a production order. For each day we know what we have to produce, according to our capacity and our needs.This part will focus on the rest of the process: now that we have the production programs, what do we do with it? This part will answer two main questions about the management of the flow:
• What input should we give to the field, and where.• Once we gave the input, how do we control practically that the material is flowing smoothly and
as we expected, from raw material till shipment.
5.1 Organization of the whole flow
Everyday a certain number of batches is scheduled to be launched. It can be from 5 to 15, according to the size of those batches and the whole daily volume. Each batch has a priority number. How are they set? Actually the order does not really matter, there are a lot of potential choices, but it will not affect the flow that much. There are only a few rules to respect:
• in a same day, the chrome products should come first. Indeed, the tubes should be cut first because they have to attend an extra operation (polishing). If not, the synchronization will not be good at the assembly step.
• If some batches have specific constraints on the production (like the Parma products that have a specific pitch between the tubes) should be gathered, in order them to be produced at the same time and avoid too many changeovers.
Then on the field each batch (which is basically a box most of the time, containing tubes, profiles or radiators) has card that contains the different informations of the batch.
The following card for example is for week 26. It is the tubes for paint products (SFEG). It is the batch n° 17. There are 2200 tubes. There diameter is 22mm, length 405mm, and the supplier is Ginar.
52
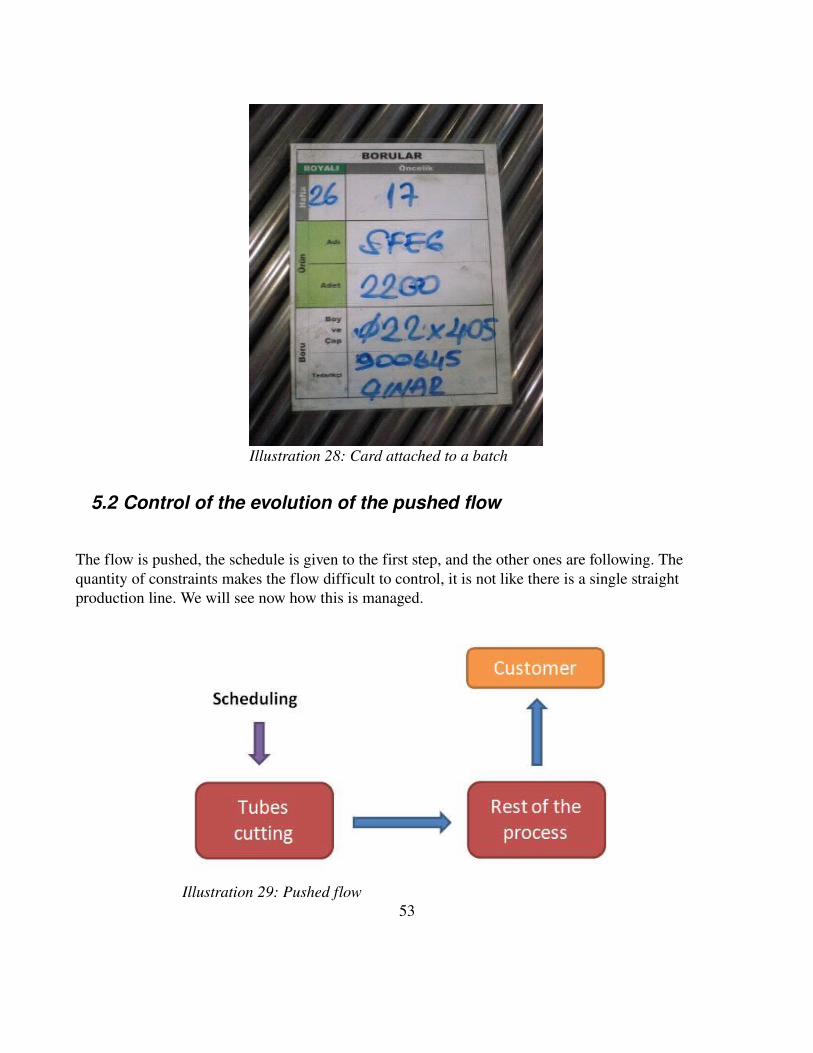
5.2 Control of the evolution of the pushed flow
The flow is pushed, the schedule is given to the first step, and the other ones are following. The quantity of constraints makes the flow difficult to control, it is not like there is a single straight production line. We will see now how this is managed.
53
Illustration 28: Card attached to a batch
Illustration 29: Pushed flow
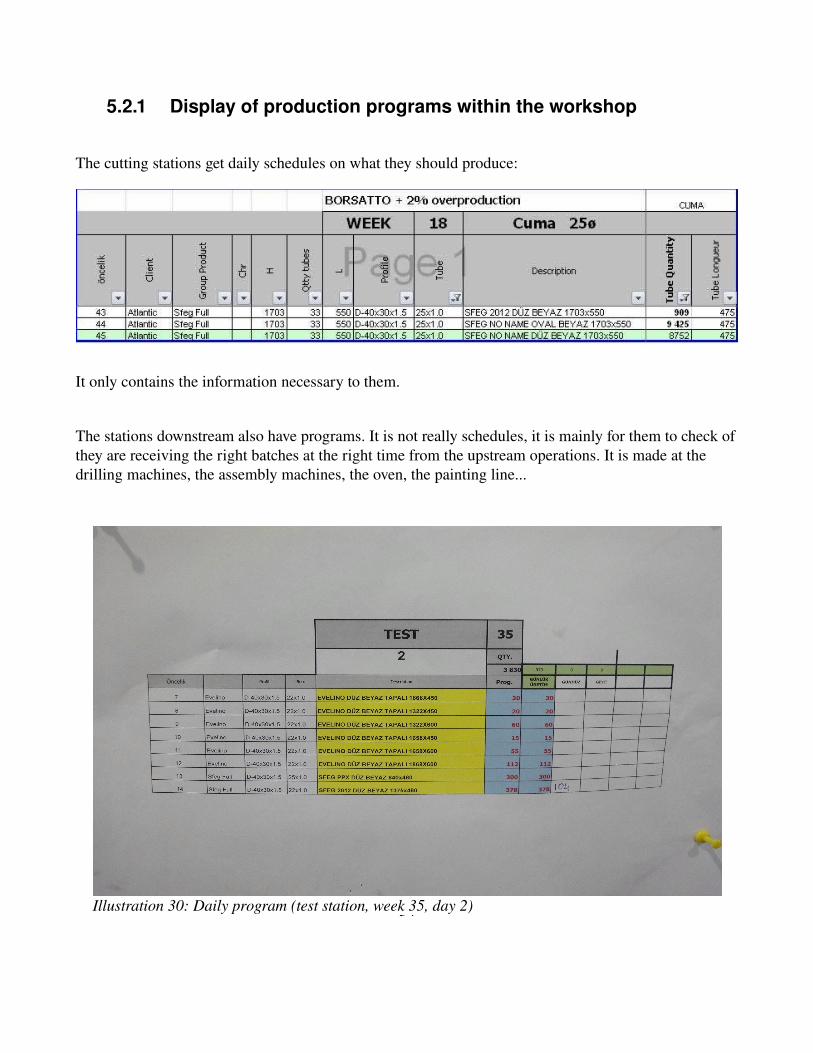
5.2.1 Display of production programs within the workshop
The cutting stations get daily schedules on what they should produce:
It only contains the information necessary to them.
The stations downstream also have programs. It is not really schedules, it is mainly for them to check of they are receiving the right batches at the right time from the upstream operations. It is made at the drilling machines, the assembly machines, the oven, the painting line...
54Illustration 30: Daily program (test station, week 35, day 2)
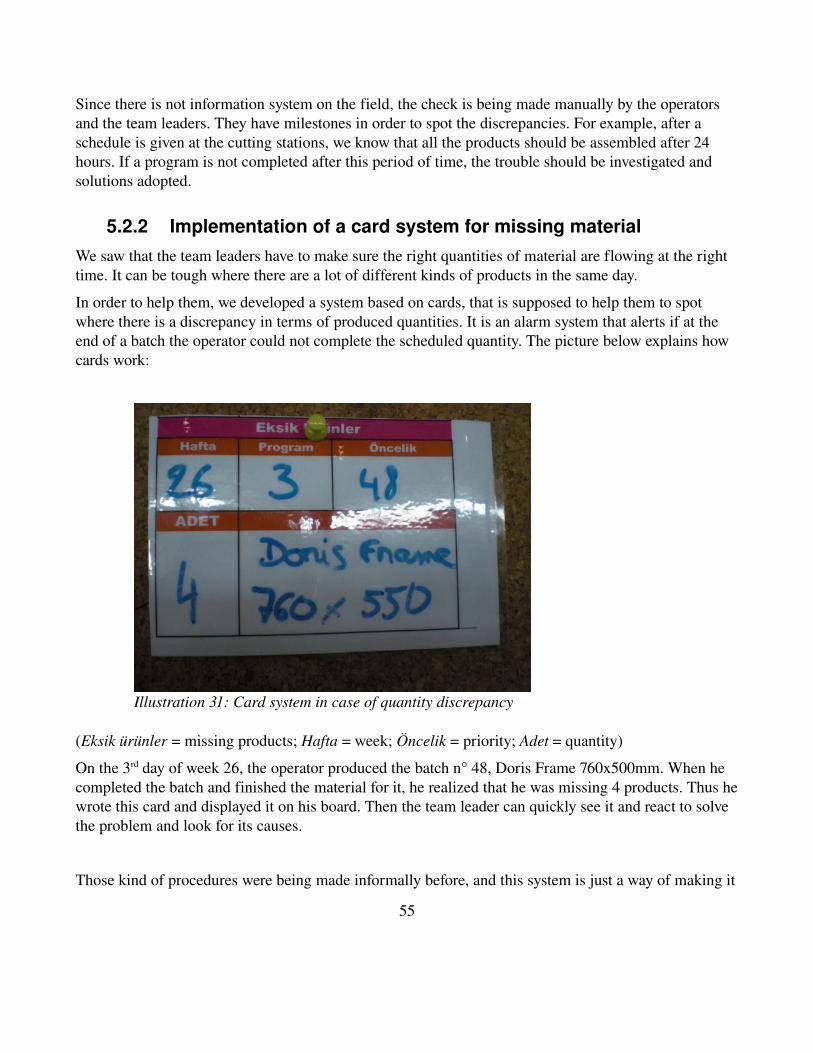
Since there is not information system on the field, the check is being made manually by the operators and the team leaders. They have milestones in order to spot the discrepancies. For example, after a schedule is given at the cutting stations, we know that all the products should be assembled after 24 hours. If a program is not completed after this period of time, the trouble should be investigated and solutions adopted.
5.2.2 Implementation of a card system for missing materialWe saw that the team leaders have to make sure the right quantities of material are flowing at the right time. It can be tough where there are a lot of different kinds of products in the same day.
In order to help them, we developed a system based on cards, that is supposed to help them to spot where there is a discrepancy in terms of produced quantities. It is an alarm system that alerts if at the end of a batch the operator could not complete the scheduled quantity. The picture below explains how cards work:
(Eksik ürünler = missing products; Hafta = week; Öncelik = priority; Adet = quantity)
On the 3rd day of week 26, the operator produced the batch n° 48, Doris Frame 760x500mm. When he completed the batch and finished the material for it, he realized that he was missing 4 products. Thus he wrote this card and displayed it on his board. Then the team leader can quickly see it and react to solve the problem and look for its causes.
Those kind of procedures were being made informally before, and this system is just a way of making it
55
Illustration 31: Card system in case of quantity discrepancy
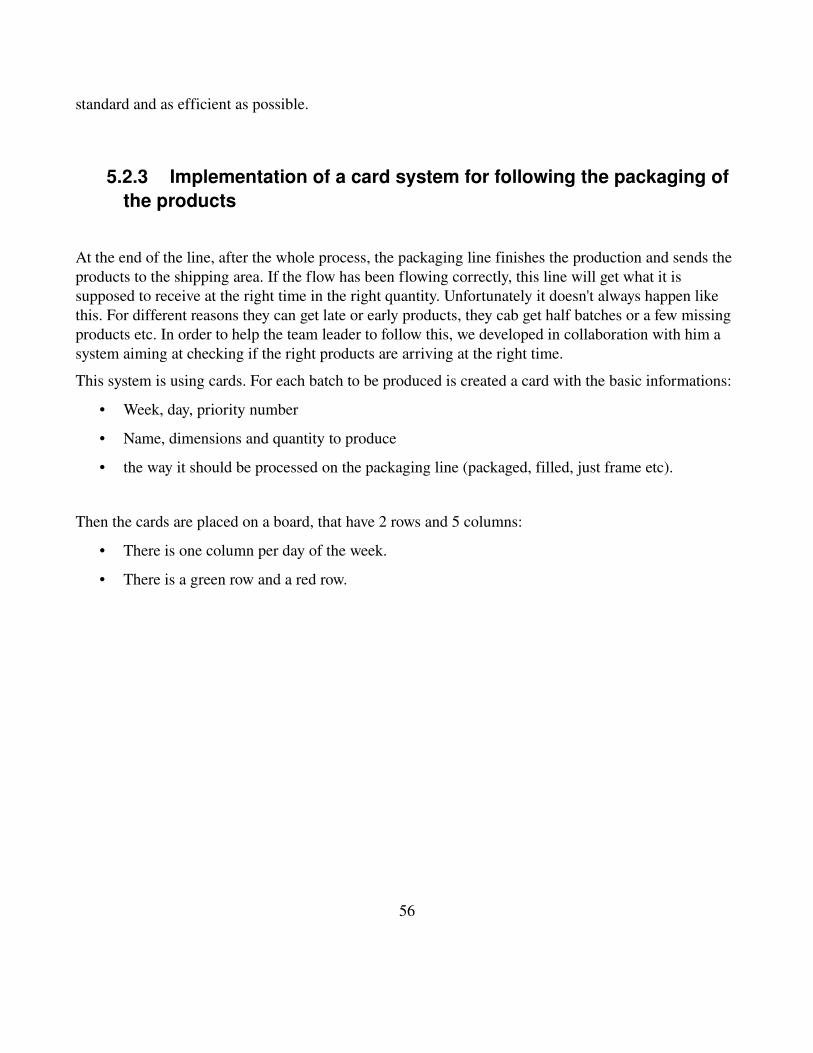
standard and as efficient as possible.
5.2.3 Implementation of a card system for following the packaging of the products
At the end of the line, after the whole process, the packaging line finishes the production and sends the products to the shipping area. If the flow has been flowing correctly, this line will get what it is supposed to receive at the right time in the right quantity. Unfortunately it doesn't always happen like this. For different reasons they can get late or early products, they cab get half batches or a few missing products etc. In order to help the team leader to follow this, we developed in collaboration with him a system aiming at checking if the right products are arriving at the right time.
This system is using cards. For each batch to be produced is created a card with the basic informations:
• Week, day, priority number
• Name, dimensions and quantity to produce
• the way it should be processed on the packaging line (packaged, filled, just frame etc).
Then the cards are placed on a board, that have 2 rows and 5 columns:
• There is one column per day of the week.
• There is a green row and a red row.
56
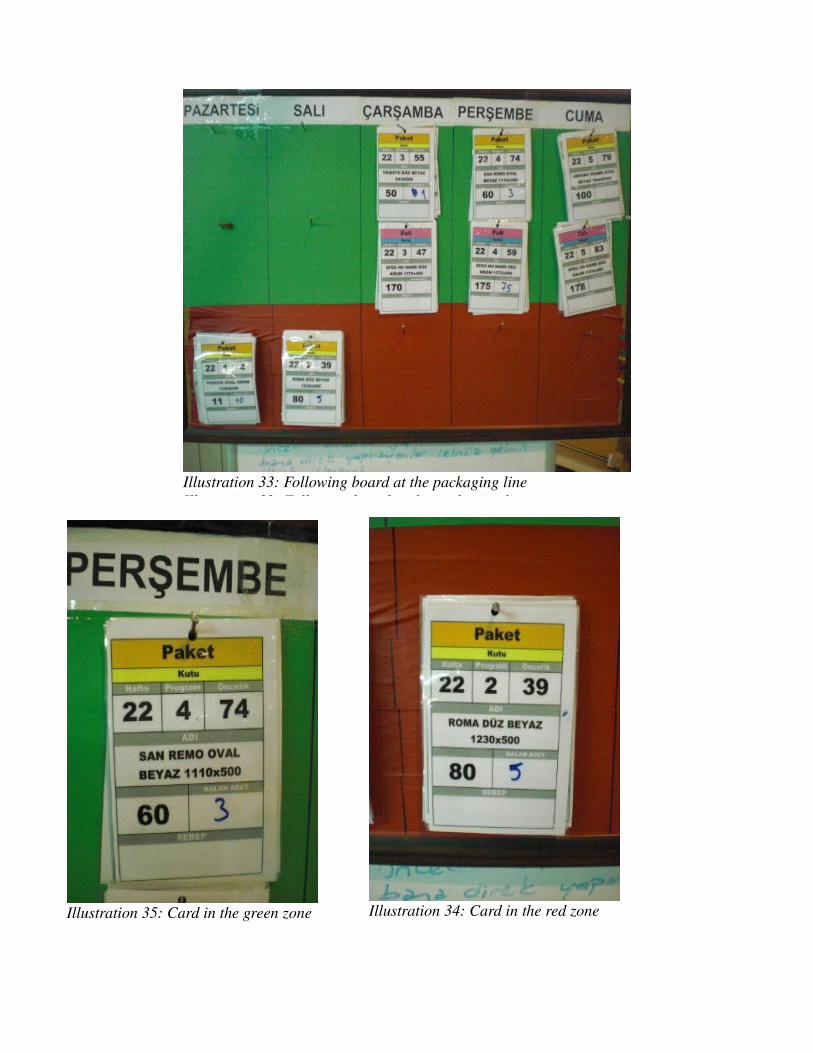
Illustration 33: Following board at the packaging lineIllustration 32: Followup board at the packaging lines
57Illustration 35: Card in the green zone Illustration 34: Card in the red zone
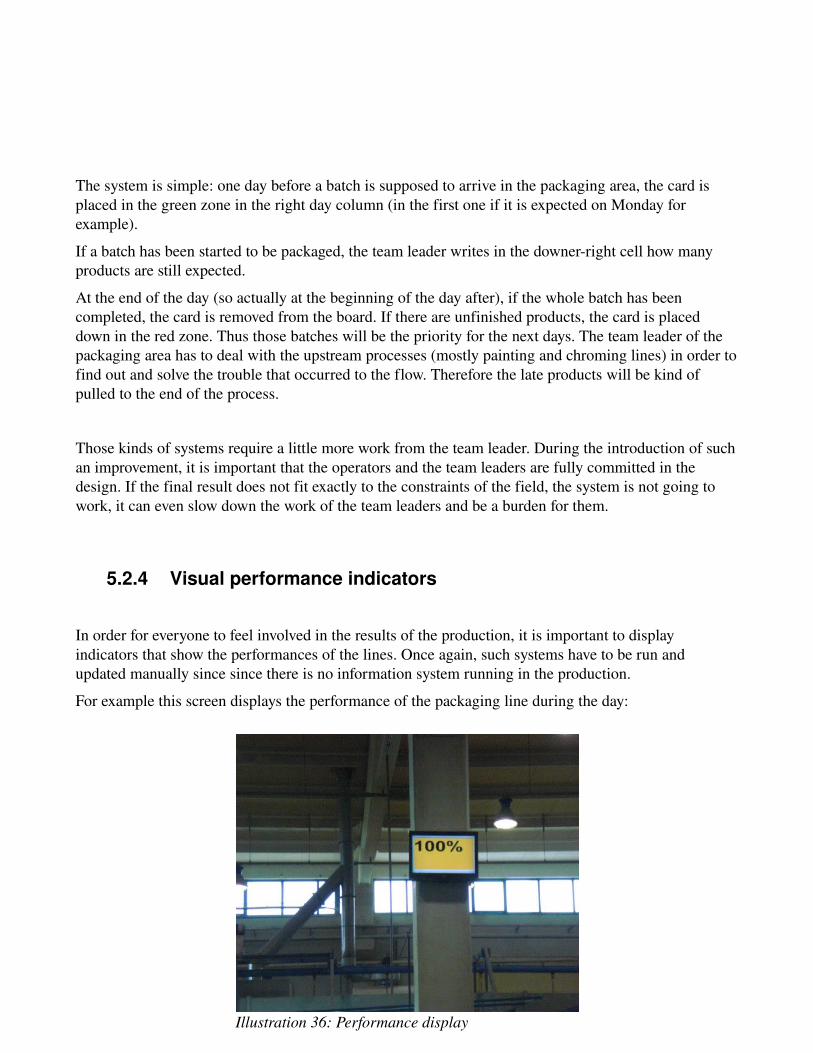
The system is simple: one day before a batch is supposed to arrive in the packaging area, the card is placed in the green zone in the right day column (in the first one if it is expected on Monday for example).
If a batch has been started to be packaged, the team leader writes in the downerright cell how many products are still expected.
At the end of the day (so actually at the beginning of the day after), if the whole batch has been completed, the card is removed from the board. If there are unfinished products, the card is placed down in the red zone. Thus those batches will be the priority for the next days. The team leader of the packaging area has to deal with the upstream processes (mostly painting and chroming lines) in order to find out and solve the trouble that occurred to the flow. Therefore the late products will be kind of pulled to the end of the process.
Those kinds of systems require a little more work from the team leader. During the introduction of such an improvement, it is important that the operators and the team leaders are fully committed in the design. If the final result does not fit exactly to the constraints of the field, the system is not going to work, it can even slow down the work of the team leaders and be a burden for them.
5.2.4 Visual performance indicators
In order for everyone to feel involved in the results of the production, it is important to display indicators that show the performances of the lines. Once again, such systems have to be run and updated manually since since there is no information system running in the production.
For example this screen displays the performance of the packaging line during the day:
58
Illustration 36: Performance display
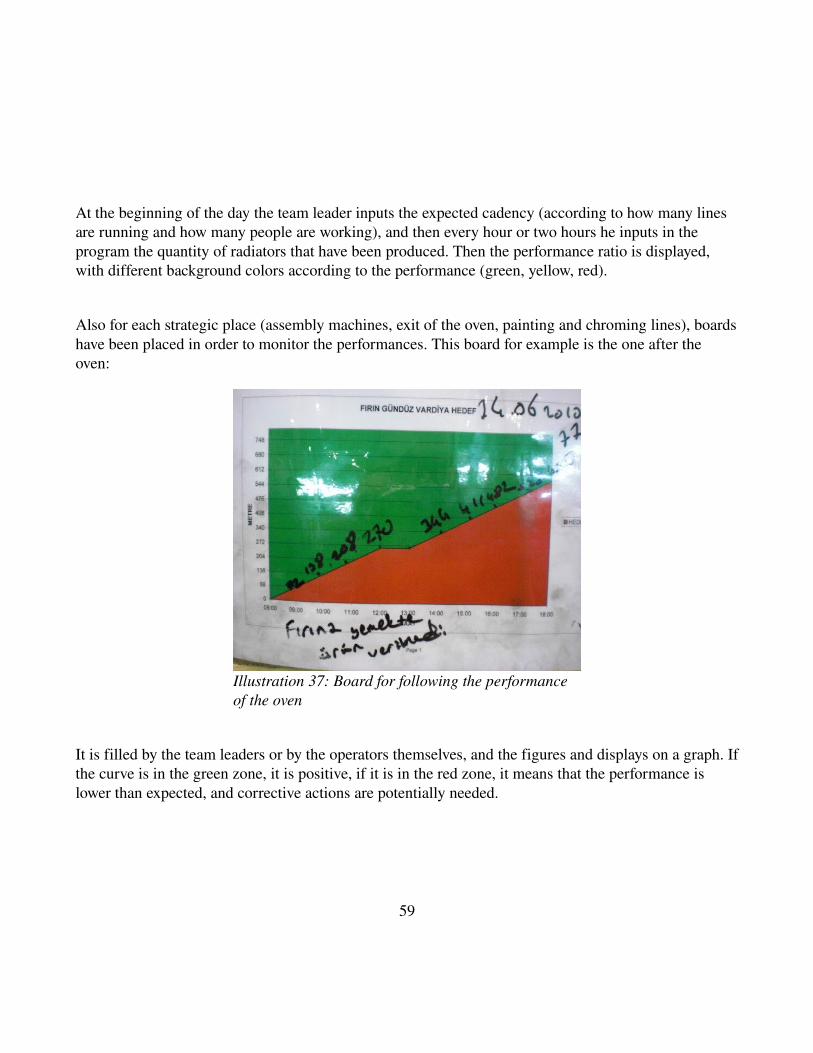
At the beginning of the day the team leader inputs the expected cadency (according to how many lines are running and how many people are working), and then every hour or two hours he inputs in the program the quantity of radiators that have been produced. Then the performance ratio is displayed, with different background colors according to the performance (green, yellow, red).
Also for each strategic place (assembly machines, exit of the oven, painting and chroming lines), boards have been placed in order to monitor the performances. This board for example is the one after the oven:
Illustration 37: Board for following the performance of the oven
It is filled by the team leaders or by the operators themselves, and the figures and displays on a graph. If the curve is in the green zone, it is positive, if it is in the red zone, it means that the performance is lower than expected, and corrective actions are potentially needed.
59
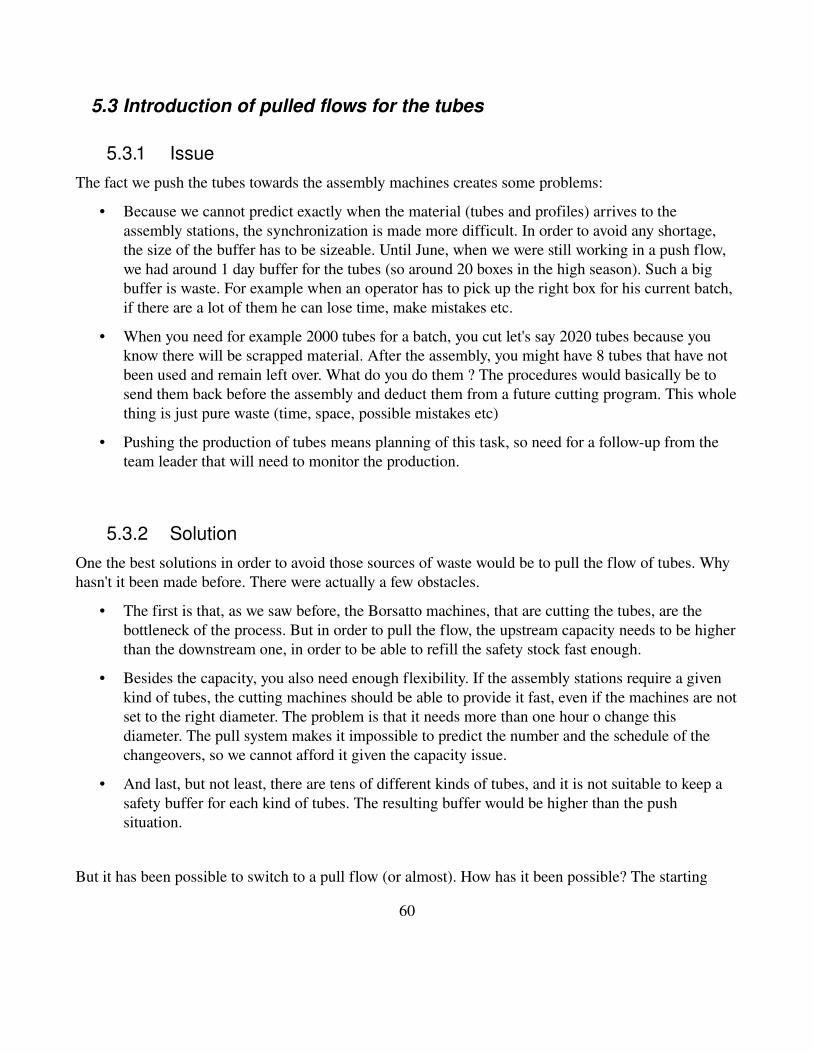
5.3 Introduction of pulled flows for the tubes
5.3.1 IssueThe fact we push the tubes towards the assembly machines creates some problems:
• Because we cannot predict exactly when the material (tubes and profiles) arrives to the assembly stations, the synchronization is made more difficult. In order to avoid any shortage, the size of the buffer has to be sizeable. Until June, when we were still working in a push flow, we had around 1 day buffer for the tubes (so around 20 boxes in the high season). Such a big buffer is waste. For example when an operator has to pick up the right box for his current batch, if there are a lot of them he can lose time, make mistakes etc.
• When you need for example 2000 tubes for a batch, you cut let's say 2020 tubes because you know there will be scrapped material. After the assembly, you might have 8 tubes that have not been used and remain left over. What do you do them ? The procedures would basically be to send them back before the assembly and deduct them from a future cutting program. This whole thing is just pure waste (time, space, possible mistakes etc)
• Pushing the production of tubes means planning of this task, so need for a followup from the team leader that will need to monitor the production.
5.3.2 SolutionOne the best solutions in order to avoid those sources of waste would be to pull the flow of tubes. Why hasn't it been made before. There were actually a few obstacles.
• The first is that, as we saw before, the Borsatto machines, that are cutting the tubes, are the bottleneck of the process. But in order to pull the flow, the upstream capacity needs to be higher than the downstream one, in order to be able to refill the safety stock fast enough.
• Besides the capacity, you also need enough flexibility. If the assembly stations require a given kind of tubes, the cutting machines should be able to provide it fast, even if the machines are not set to the right diameter. The problem is that it needs more than one hour o change this diameter. The pull system makes it impossible to predict the number and the schedule of the changeovers, so we cannot afford it given the capacity issue.
• And last, but not least, there are tens of different kinds of tubes, and it is not suitable to keep a safety buffer for each kind of tubes. The resulting buffer would be higher than the push situation.
But it has been possible to switch to a pull flow (or almost). How has it been possible? The starting
60
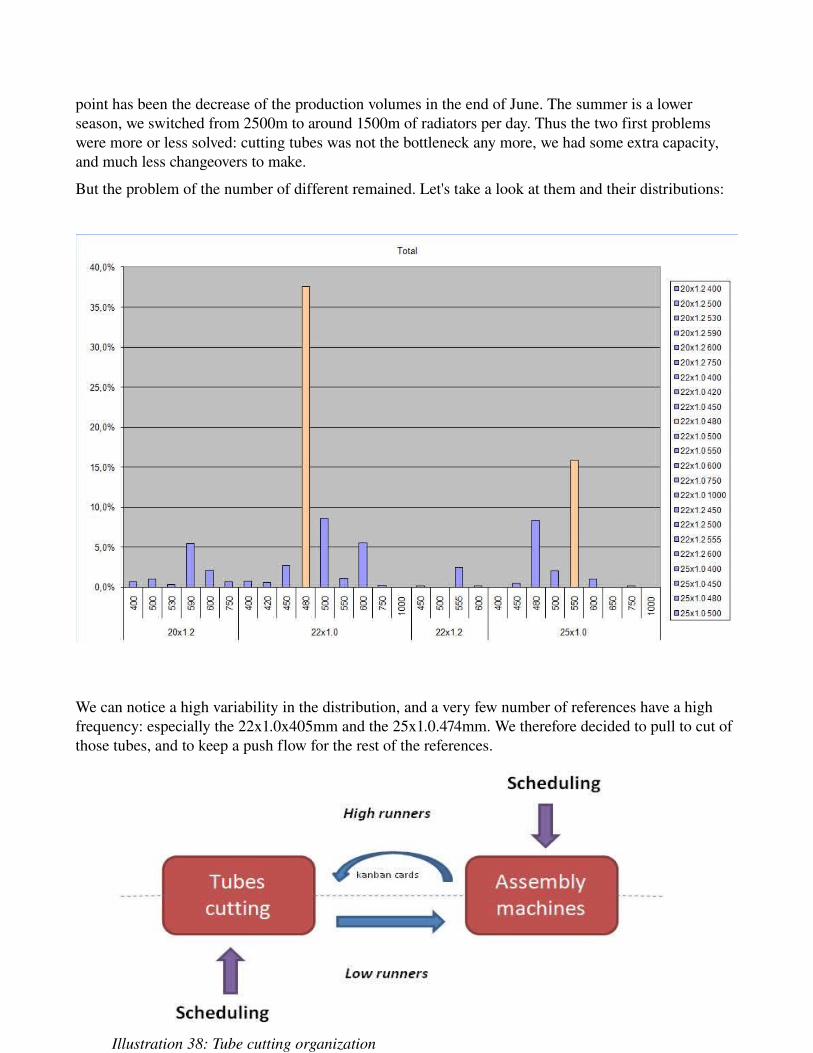
point has been the decrease of the production volumes in the end of June. The summer is a lower season, we switched from 2500m to around 1500m of radiators per day. Thus the two first problems were more or less solved: cutting tubes was not the bottleneck any more, we had some extra capacity, and much less changeovers to make.
But the problem of the number of different remained. Let's take a look at them and their distributions:
We can notice a high variability in the distribution, and a very few number of references have a high frequency: especially the 22x1.0x405mm and the 25x1.0.474mm. We therefore decided to pull to cut of those tubes, and to keep a push flow for the rest of the references.
61
Illustration 38: Tube cutting organization
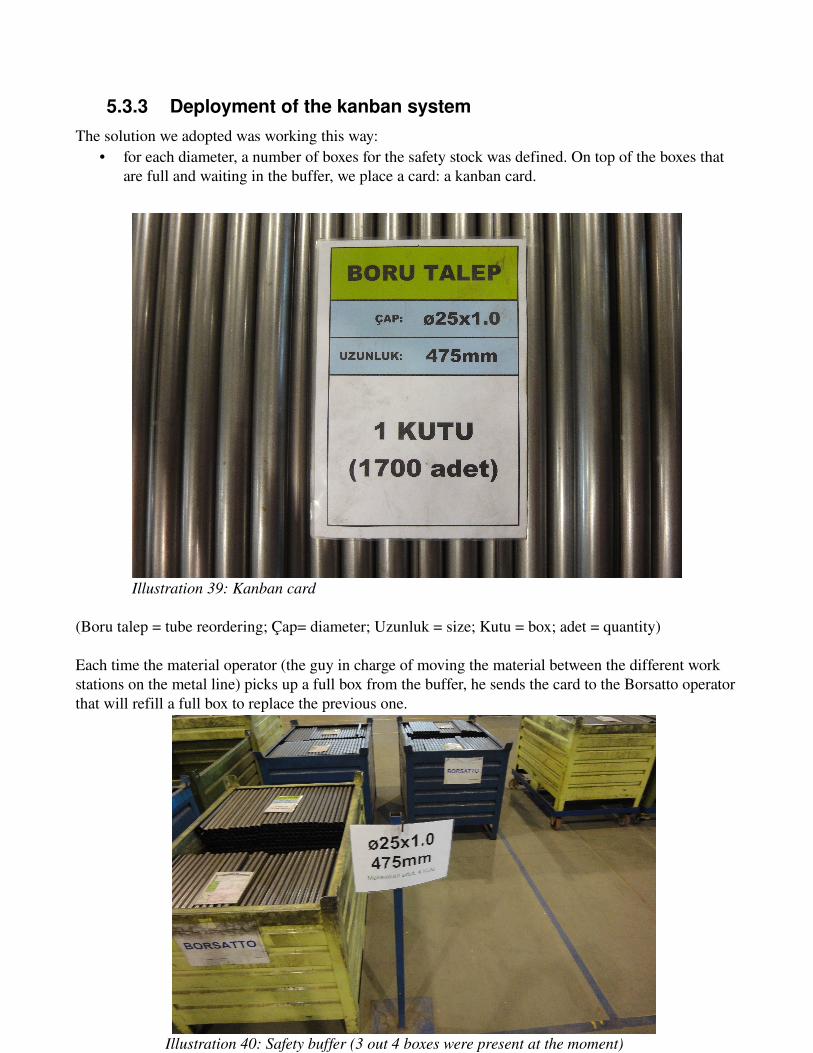
5.3.3 Deployment of the kanban systemThe solution we adopted was working this way:
• for each diameter, a number of boxes for the safety stock was defined. On top of the boxes that are full and waiting in the buffer, we place a card: a kanban card.
(Boru talep = tube reordering; Çap= diameter; Uzunluk = size; Kutu = box; adet = quantity)
Each time the material operator (the guy in charge of moving the material between the different work stations on the metal line) picks up a full box from the buffer, he sends the card to the Borsatto operator that will refill a full box to replace the previous one.
62
Illustration 40: Safety buffer (3 out 4 boxes were present at the moment)
Illustration 39: Kanban card
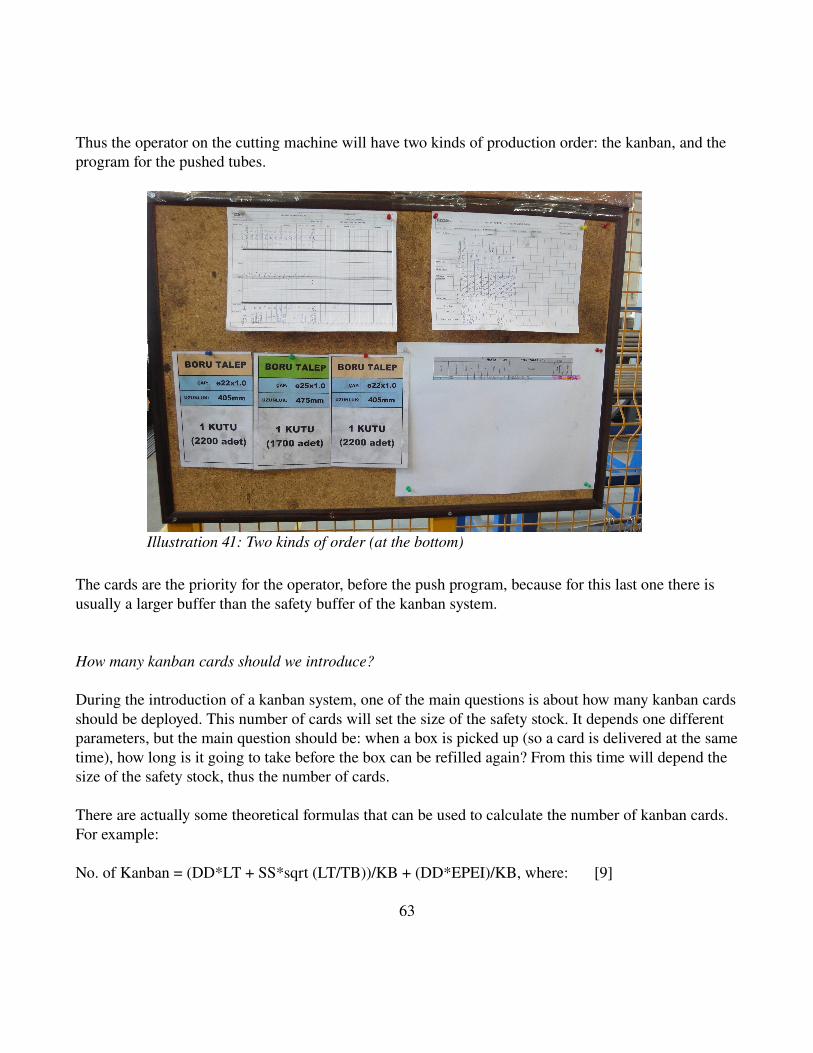
Thus the operator on the cutting machine will have two kinds of production order: the kanban, and the program for the pushed tubes.
The cards are the priority for the operator, before the push program, because for this last one there is usually a larger buffer than the safety buffer of the kanban system.
How many kanban cards should we introduce?
During the introduction of a kanban system, one of the main questions is about how many kanban cards should be deployed. This number of cards will set the size of the safety stock. It depends one different parameters, but the main question should be: when a box is picked up (so a card is delivered at the same time), how long is it going to take before the box can be refilled again? From this time will depend the size of the safety stock, thus the number of cards.
There are actually some theoretical formulas that can be used to calculate the number of kanban cards. For example:
No. of Kanban = (DD*LT + SS*sqrt (LT/TB))/KB + (DD*EPEI)/KB, where: [9]
63
Illustration 41: Two kinds of order (at the bottom)
• DD = Daily Demands (units)• LT = Replenishment Lead Time (days)• SS = Statistically calculated safety stock (units)• sqrt = square root• TB = Time Bucket of the safety stock data points (days)• KB = Quantity per kanban (units)• EPEI = Supplier's replenishment interval (days)
But such formulas were difficult to apply in our case, so the numbers of cards have been estimated roughly, then adjusted if needed.For example for the 22x1.0x405mm: there can be maximum two assembly machines set on this diameter (so two machines that will consummate such tubes). Those machines will consummate up to 2000 tubes per hour, so one box per hour.At the same time, when a card is delivered, it can take ½ hour before the cutting start, and then it needs 3 hours to fill the box (if there is only one machine set on this diameter). Set it can take up to 3.5 hours before the box is replaced. According to those information, we decided to set the number of kanban cards to 4.And then on the field we realized that it was the right quantity: the number of boxes was moving between 0 and 4, but we've never had any shortage.
5.4 Management of the physical flow: conclusion
The nature of the product, the great variety in terms of references and the nature of the process impose a pushed flow. Also, the number of constraints makes it difficult to have a perfect straight forward flow, different products have slightly different tracks. Pushing the flow require a lot of work to control everything is going alright, especially when there is no efficient information system available on the field.
We saw that some procedures and systems were developed in order to make the control easier (for the team leaders for example).
Another solution would be of course to try to pull the flow, as much as possible. It has started with the tubes supply for the assembly. If we would like to go further in this direction, it would require to work with other departments: with process department (in order to decrease the changeovers times for example), and with R&D (in order to standardize the manufacturing process of the different products).
64
6 Material consumption management
Those last two parts were devoted to the heart of the production control field, the flow of information from the customer order to the shipment through the workshop.Now we will tackle a more peripheral issue, among others: the control of the material consumption. It is an important issue in many industries, and we will approach this topic with a description of the different aspects of the problem and of basic procedures that can be set in order to control it.
6.1 The issue
In terms of cost, the consumption of raw material is a key issue. It's of course more or less important depending on the product and its process, but most factories have to manage this consumption very rigorously if they want to master their cost.
I started working on that subject in March. The factory manager planned a meeting for all the team in order to present the results for the month of February. The manager presented all the facts in terms of cost control: how much money we earned during the month, how much did we spend, and where ? The most problematic cost item was raw materials. In the structure of the cost of a towelradiator, raw materials represent 50% of the total cost. Most of it is actually metal.
When the control cost department made the budget for the year 2010, it considered that the overall over consumption of raw materials should be less than 3%. Those 3% would include the loss at the different steps of the process (cutting, welding, painting etc). This figure has actually been arbitrary chosen, since they didn't really know the reality of the process.
So one of the goals of the meeting was: did we reach this 3% target? The answer was a NO, and by far. The cost control department made its calculation from the consumption of raw materials, the count of finished product and from monthly inventories. The calculations have been made for the two main categories of profile we consume: profiles and tubes. The results revealed that:
for the tubes, the unexpected over consumption reached 4% over the months of January and February.
for the profiles, this over consumption topped to 11%!
And when I say unexpected, I mean that the 3% initially planned already have been included in the reference and therefore are not taken into account in those 4 and 11%.
65
Now let's try to make those figures more eloquent. For the tubes, 3% plus 4% makes 7% waste. January and February are located in the low seasons, when we cut around 25 000 tubes every day (from Monday to Friday). So the equivalent of 1700 tubes is going to the trash every day. 1100 radiators are being produced daily in the low season, so an average of 2200 profiles is cut everyday. 11% waste(plus the 3% already planned) represent an equivalent of 300 profiles going to the trash every day!Of course the waste is sold for recycling afterwards, but still it's a big loss of money.
From then my mission was simple: identify the sources of waste, introduce tools so we are able to measure and reduce the daily over consumption. My primary target was basically to match my conclusions with the data coming from cost control, which would mean we would have completely identified and controlled the sources of waste.
I will now introduce the method I used, the procedures and tools that were set up, and the results. Of course the reader has to keep in mind that the description the case is of course related to a specific process and situation. Depending on the product the overproduction might not have the same importance, but in world where raw material is getting more and more expensive, it probably is a major issue for most factories.
6.2 Identifying the sources of waste
So where does this waste come from? If you ever wonder this question, you might already have a few ideas. There are some sources that we know already, some that we guess, and finally some that we have no idea about.
6.2.1 Interview anybody that has any connection with the workshop
In a factory, except in a few departments like accounting or human resources, most people will have an interaction with the product and the materials. So anyone of them might have an influence on the problem we are trying to understand.
In my case, the person that provided me significant information where:• the factory manager and production manager: they are the ones who started the project of
working on this subject. From their experience they already have some insights about what is going on in terms of consumption of raw material.
• the team leaders. They are the conductors on the workshop, and probably your most valuable partners in this task. They are the ones that maybe have the most experience about all the local mechanisms that are going on around the flow, the machines, the operators etc. They were
66
especially important for me given that the language issue: they were one of the very few I could directly interact with (either in English or French).
• the process department: they have a good knowledge about how the machines work, what are the constraints and the possibilities for each station.
• the quality department• the maintenance• and of course: the operators themselves. In order to fully understand what happens on the field,
you have to spend time with the operators, see them working, see how well they respect the procedures, how they handle the material etc.
So basically, you should interact with as many people as you can. The waste of material happens during the whole production process, and even besides the flow, so the more you investigate, the more accurate your understanding will be.
6.2.2 Go and check yourself on the field
But talking to people is not enough. The information you can get from them are crucial, but there's something you should not forget: don't trust anybody! (or almost). I just mean that there is always a difference between what people tell you, the data they give you, and what they really do and what happens in reality on the field. This gap can be negligible, but sometimes much more important.
Why would someone not tell the truth about it? Why would the data they give you be not accurate? There can be different reasons for this. First, concerning the people. You will ask them about the way they work, their methods, their procedures, their feelings about your subject. Keep in mind that the information you get won't be complete nor completely accurate. Your interlocutor might understand exactly your point, he would not want to give you every details of the way he's doing, or your questioning would not be accurate enough etc.
Language might also be an issue. It can be likely to happen that you have to visit a factory abroad in a country whose language you don't master, but that shouldn't prevent you from going on the workshop. I was working in a Turkishspeaking environment, and my Turkish is very basic. It of course made things more difficult than if I was in France for example, but still I could achieve a lot of things. First you can get a translator who is going to help you communicate. It's better if he has a technical background, in order to minimize the misunderstandings that you won't be able to avoid anyway. But even if you don't have any translator at the moment you can still watch, communicate basically, ask questions, talk with your hands etc.
This was for the communication part. Another kind of information you can get is data. It will often be quantities, measures, percentages and all kind of statistics. If you are working on decreasing the waste
67
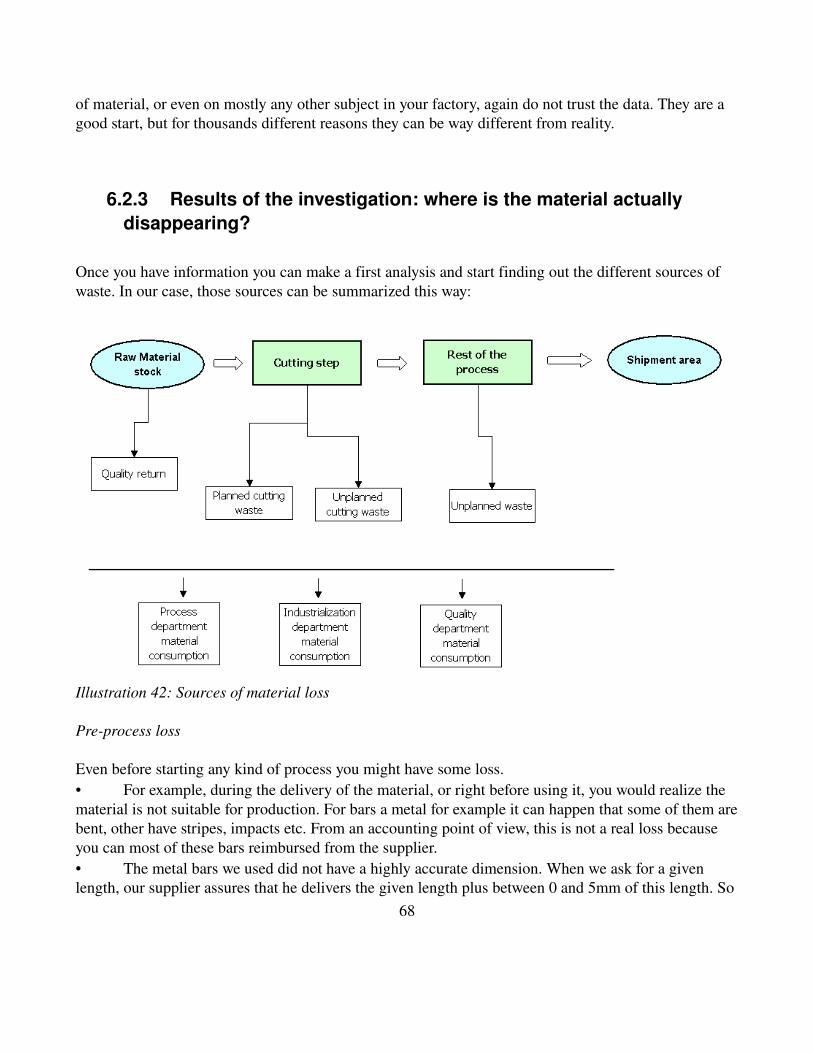
of material, or even on mostly any other subject in your factory, again do not trust the data. They are a good start, but for thousands different reasons they can be way different from reality.
6.2.3 Results of the investigation: where is the material actually disappearing?
Once you have information you can make a first analysis and start finding out the different sources of waste. In our case, those sources can be summarized this way:
Illustration 42: Sources of material loss
Preprocess loss
Even before starting any kind of process you might have some loss. • For example, during the delivery of the material, or right before using it, you would realize the material is not suitable for production. For bars a metal for example it can happen that some of them are bent, other have stripes, impacts etc. From an accounting point of view, this is not a real loss because you can most of these bars reimbursed from the supplier.• The metal bars we used did not have a highly accurate dimension. When we ask for a given length, our supplier assures that he delivers the given length plus between 0 and 5mm of this length. So
68
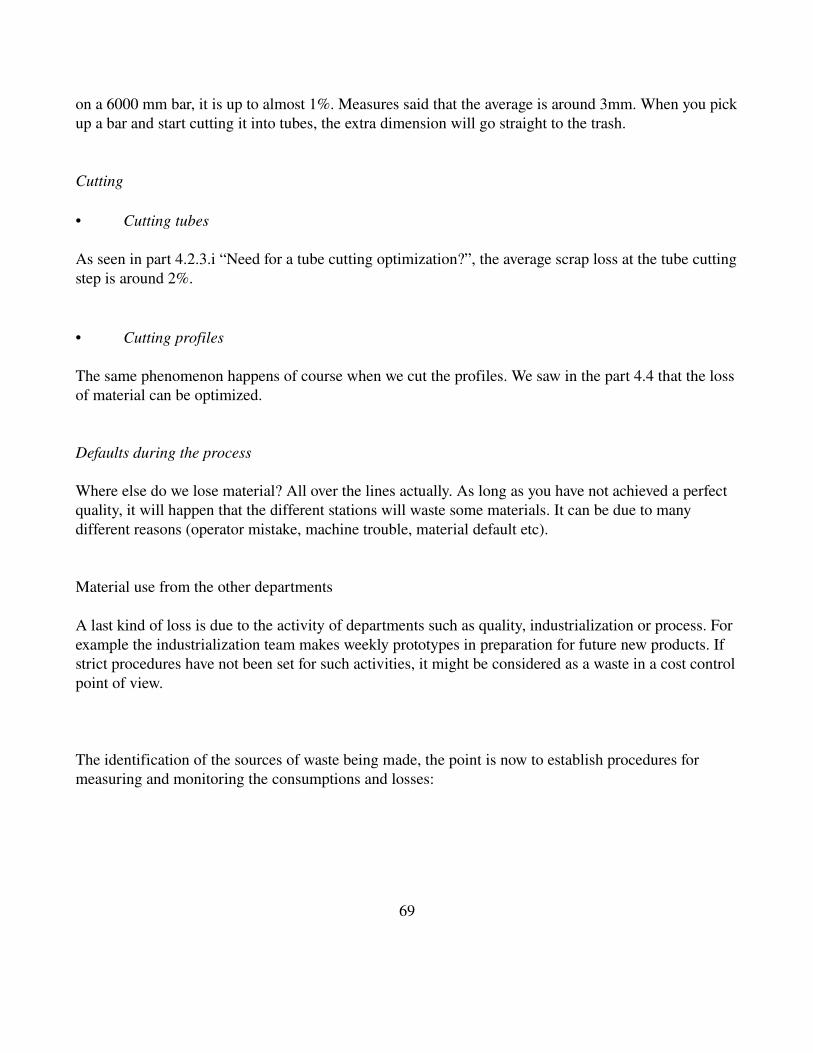
on a 6000 mm bar, it is up to almost 1%. Measures said that the average is around 3mm. When you pick up a bar and start cutting it into tubes, the extra dimension will go straight to the trash.
Cutting
• Cutting tubes
As seen in part 4.2.3.i “Need for a tube cutting optimization?”, the average scrap loss at the tube cutting step is around 2%.
• Cutting profiles
The same phenomenon happens of course when we cut the profiles. We saw in the part 4.4 that the loss of material can be optimized.
Defaults during the process
Where else do we lose material? All over the lines actually. As long as you have not achieved a perfect quality, it will happen that the different stations will waste some materials. It can be due to many different reasons (operator mistake, machine trouble, material default etc).
Material use from the other departments
A last kind of loss is due to the activity of departments such as quality, industrialization or process. For example the industrialization team makes weekly prototypes in preparation for future new products. If strict procedures have not been set for such activities, it might be considered as a waste in a cost control point of view.
The identification of the sources of waste being made, the point is now to establish procedures for measuring and monitoring the consumptions and losses:
69
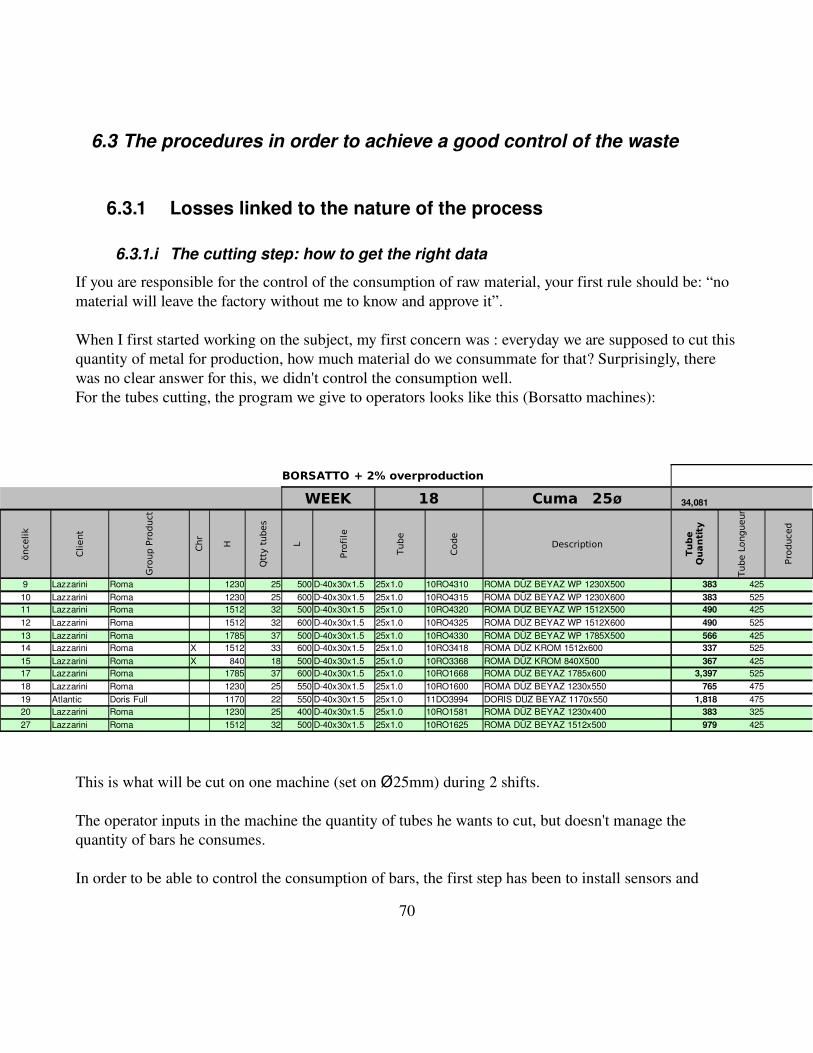
6.3 The procedures in order to achieve a good control of the waste
6.3.1 Losses linked to the nature of the process
6.3.1.i The cutting step: how to get the right data
If you are responsible for the control of the consumption of raw material, your first rule should be: “no material will leave the factory without me to know and approve it”.
When I first started working on the subject, my first concern was : everyday we are supposed to cut this quantity of metal for production, how much material do we consummate for that? Surprisingly, there was no clear answer for this, we didn't control the consumption well.For the tubes cutting, the program we give to operators looks like this (Borsatto machines):
This is what will be cut on one machine (set on Ø25mm) during 2 shifts.
The operator inputs in the machine the quantity of tubes he wants to cut, but doesn't manage the quantity of bars he consumes.
In order to be able to control the consumption of bars, the first step has been to install sensors and
70
BORSATTO + 2% overproduction
WEEK 18 34,081 Cuma
önce
lik
Client
Gro
up P
roduct
Chr
H
Qtt
y t
ubes
L
Pro
file
Tube
Code
Description
Tube L
ongueur
Pro
duce
d
9 Lazzarini Roma 1230 25 500 D40x30x1.5 25x1.0 10RO4310 ROMA DÜZ BEYAZ WP 1230X500 383 42510 Lazzarini Roma 1230 25 600 D40x30x1.5 25x1.0 10RO4315 ROMA DÜZ BEYAZ WP 1230X600 383 52511 Lazzarini Roma 1512 32 500 D40x30x1.5 25x1.0 10RO4320 ROMA DÜZ BEYAZ WP 1512X500 490 42512 Lazzarini Roma 1512 32 600 D40x30x1.5 25x1.0 10RO4325 ROMA DÜZ BEYAZ WP 1512X600 490 52513 Lazzarini Roma 1785 37 500 D40x30x1.5 25x1.0 10RO4330 ROMA DÜZ BEYAZ WP 1785X500 566 42514 Lazzarini Roma X 1512 33 600 D40x30x1.5 25x1.0 10RO3418 ROMA DÜZ KROM 1512x600 337 52515 Lazzarini Roma X 840 18 500 D40x30x1.5 25x1.0 10RO3368 ROMA DÜZ KROM 840X500 367 42517 Lazzarini Roma 1785 37 600 D40x30x1.5 25x1.0 10RO1668 ROMA DÜZ BEYAZ 1785x600 3,397 52518 Lazzarini Roma 1230 25 550 D40x30x1.5 25x1.0 10RO1600 ROMA DÜZ BEYAZ 1230x550 765 47519 Atlantic Doris Full 1170 22 550 D40x30x1.5 25x1.0 11DO3994 DORIS DÜZ BEYAZ 1170x550 1,818 47520 Lazzarini Roma 1230 25 400 D40x30x1.5 25x1.0 10RO1581 ROMA DÜZ BEYAZ 1230x400 383 32527 Lazzarini Roma 1512 32 500 D40x30x1.5 25x1.0 10RO1625 ROMA DÜZ BEYAZ 1512x500 979 425
Cuma 25ø
Tu
be
Qua
nti
ty
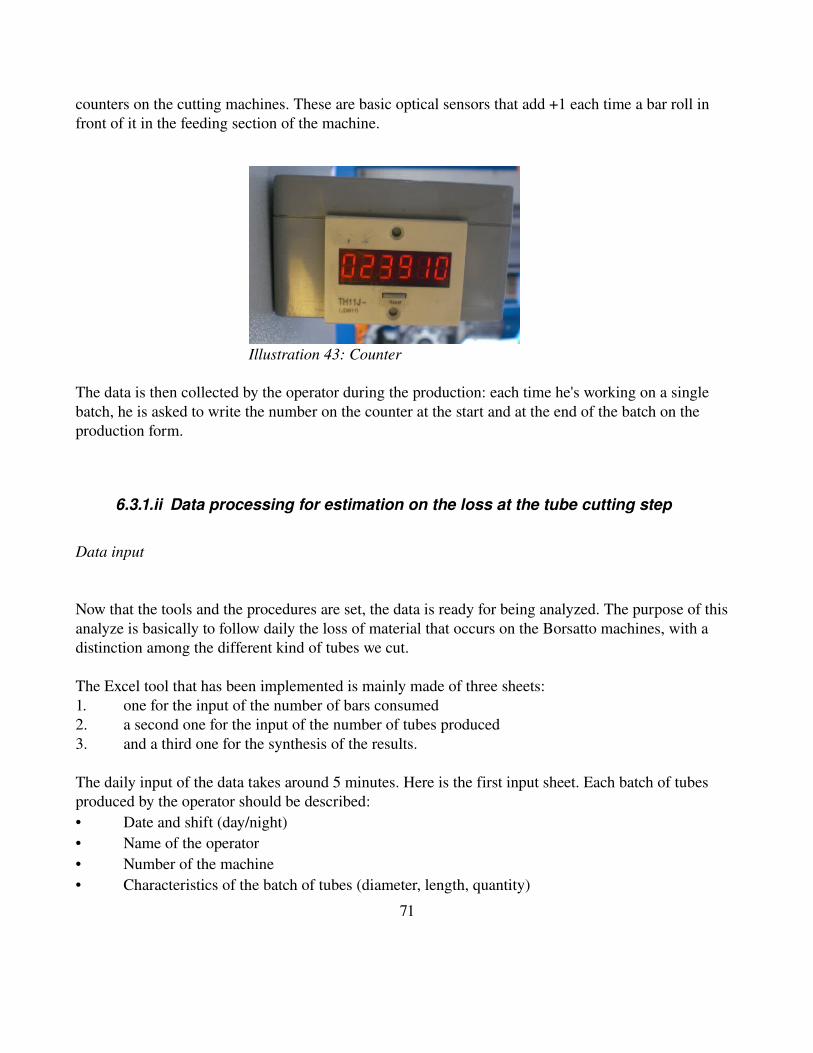
counters on the cutting machines. These are basic optical sensors that add +1 each time a bar roll in front of it in the feeding section of the machine.
The data is then collected by the operator during the production: each time he's working on a single batch, he is asked to write the number on the counter at the start and at the end of the batch on the production form.
6.3.1.ii Data processing for estimation on the loss at the tube cutting step
Data input
Now that the tools and the procedures are set, the data is ready for being analyzed. The purpose of this analyze is basically to follow daily the loss of material that occurs on the Borsatto machines, with a distinction among the different kind of tubes we cut.
The Excel tool that has been implemented is mainly made of three sheets:1. one for the input of the number of bars consumed2. a second one for the input of the number of tubes produced3. and a third one for the synthesis of the results.
The daily input of the data takes around 5 minutes. Here is the first input sheet. Each batch of tubes produced by the operator should be described:• Date and shift (day/night)• Name of the operator• Number of the machine• Characteristics of the batch of tubes (diameter, length, quantity)
71
Illustration 43: Counter
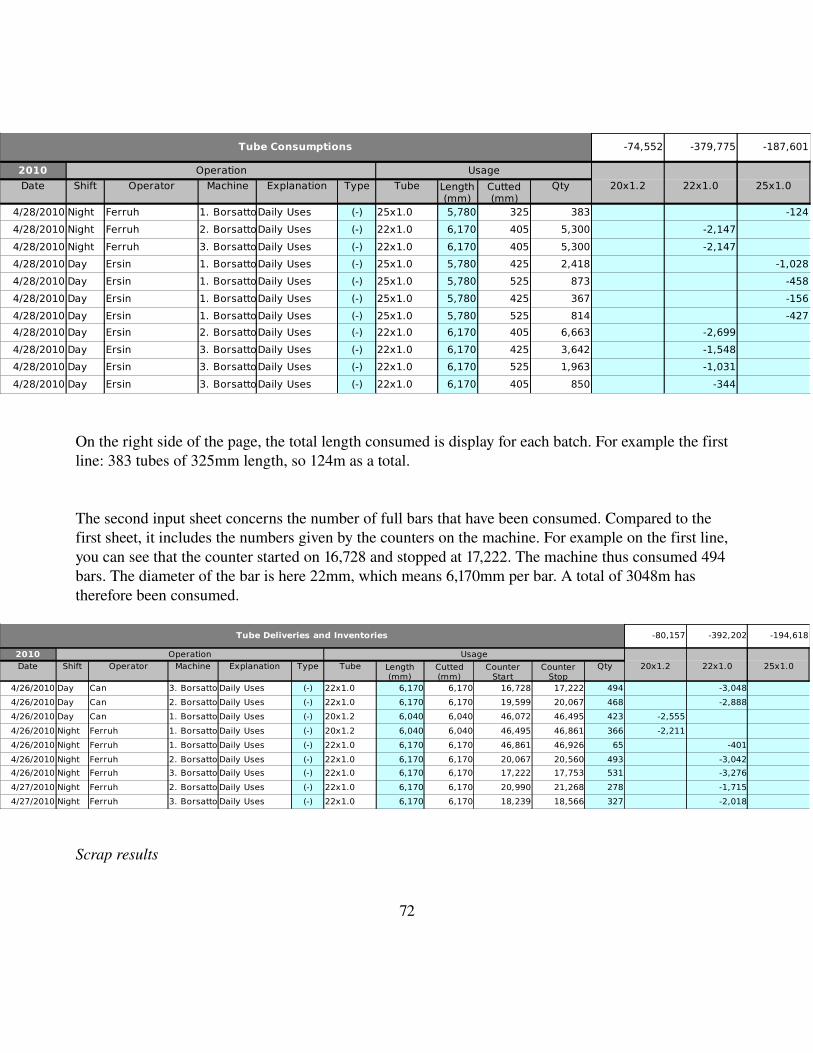
On the right side of the page, the total length consumed is display for each batch. For example the first line: 383 tubes of 325mm length, so 124m as a total.
The second input sheet concerns the number of full bars that have been consumed. Compared to the first sheet, it includes the numbers given by the counters on the machine. For example on the first line, you can see that the counter started on 16,728 and stopped at 17,222. The machine thus consumed 494 bars. The diameter of the bar is here 22mm, which means 6,170mm per bar. A total of 3048m has therefore been consumed.
Scrap results
72
Tube Consumptions -74,552 -379,775 -187,601
2010 Operation Usage
Date Shift Operator Machine Explanation Type Tube Qty 20x1.2 22x1.0 25x1.0
4/28/2010 Night Ferruh 1. BorsattoDaily Uses (-) 25x1.0 5,780 325 383 -124
4/28/2010 Night Ferruh 2. BorsattoDaily Uses (-) 22x1.0 6,170 405 5,300 -2,147
4/28/2010 Night Ferruh 3. BorsattoDaily Uses (-) 22x1.0 6,170 405 5,300 -2,147
4/28/2010 Day Ersin 1. BorsattoDaily Uses (-) 25x1.0 5,780 425 2,418 -1,028
4/28/2010 Day Ersin 1. BorsattoDaily Uses (-) 25x1.0 5,780 525 873 -458
4/28/2010 Day Ersin 1. BorsattoDaily Uses (-) 25x1.0 5,780 425 367 -156
4/28/2010 Day Ersin 1. BorsattoDaily Uses (-) 25x1.0 5,780 525 814 -427
4/28/2010 Day Ersin 2. BorsattoDaily Uses (-) 22x1.0 6,170 405 6,663 -2,699
4/28/2010 Day Ersin 3. BorsattoDaily Uses (-) 22x1.0 6,170 425 3,642 -1,548
4/28/2010 Day Ersin 3. BorsattoDaily Uses (-) 22x1.0 6,170 525 1,963 -1,031
4/28/2010 Day Ersin 3. BorsattoDaily Uses (-) 22x1.0 6,170 405 850 -344
Length(mm)
Cutted(mm)
Tube Deliveries and Inventories -80,157 -392,202 -194,618
2010 Operation UsageDate Shift Operator Machine Explanation Type Tube Qty 20x1.2 22x1.0 25x1.0
4/26/2010 Day Can 3. Borsatto Daily Uses (-) 22x1.0 6,170 6,170 16,728 17,222 494 -3,048
4/26/2010 Day Can 2. Borsatto Daily Uses (-) 22x1.0 6,170 6,170 19,599 20,067 468 -2,888
4/26/2010 Day Can 1. Borsatto Daily Uses (-) 20x1.2 6,040 6,040 46,072 46,495 423 -2,555
4/26/2010 Night Ferruh 1. Borsatto Daily Uses (-) 20x1.2 6,040 6,040 46,495 46,861 366 -2,211
4/26/2010 Night Ferruh 1. Borsatto Daily Uses (-) 22x1.0 6,170 6,170 46,861 46,926 65 -401
4/26/2010 Night Ferruh 2. Borsatto Daily Uses (-) 22x1.0 6,170 6,170 20,067 20,560 493 -3,042
4/26/2010 Night Ferruh 3. Borsatto Daily Uses (-) 22x1.0 6,170 6,170 17,222 17,753 531 -3,276
4/27/2010 Night Ferruh 2. Borsatto Daily Uses (-) 22x1.0 6,170 6,170 20,990 21,268 278 -1,715
4/27/2010 Night Ferruh 3. Borsatto Daily Uses (-) 22x1.0 6,170 6,170 18,239 18,566 327 -2,018
Length(mm)
Cutted(mm)
CounterStart
CounterStop
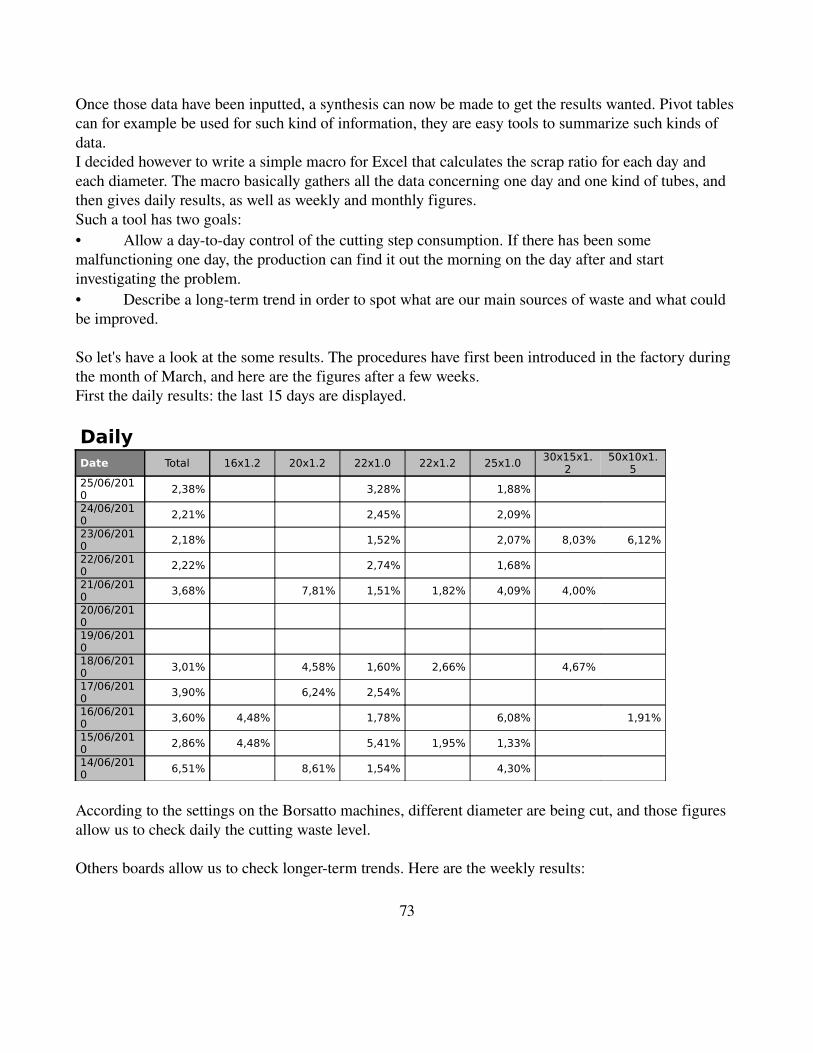
Once those data have been inputted, a synthesis can now be made to get the results wanted. Pivot tables can for example be used for such kind of information, they are easy tools to summarize such kinds of data.I decided however to write a simple macro for Excel that calculates the scrap ratio for each day and each diameter. The macro basically gathers all the data concerning one day and one kind of tubes, and then gives daily results, as well as weekly and monthly figures.Such a tool has two goals:• Allow a daytoday control of the cutting step consumption. If there has been some malfunctioning one day, the production can find it out the morning on the day after and start investigating the problem.• Describe a longterm trend in order to spot what are our main sources of waste and what could be improved.
So let's have a look at the some results. The procedures have first been introduced in the factory during the month of March, and here are the figures after a few weeks.First the daily results: the last 15 days are displayed.
DailyDate Total 16x1.2 20x1.2 22x1.0 22x1.2 25x1.0
30x15x1.2
50x10x1.5
25/06/2010 2,38% 3,28% 1,88%
24/06/2010 2,21% 2,45% 2,09%
23/06/2010 2,18% 1,52% 2,07% 8,03% 6,12%
22/06/2010 2,22% 2,74% 1,68%
21/06/2010 3,68% 7,81% 1,51% 1,82% 4,09% 4,00%
20/06/2010
19/06/2010
18/06/2010 3,01% 4,58% 1,60% 2,66% 4,67%
17/06/2010 3,90% 6,24% 2,54%
16/06/2010 3,60% 4,48% 1,78% 6,08% 1,91%
15/06/2010 2,86% 4,48% 5,41% 1,95% 1,33%
14/06/2010 6,51% 8,61% 1,54% 4,30%
According to the settings on the Borsatto machines, different diameter are being cut, and those figures allow us to check daily the cutting waste level.
Others boards allow us to check longerterm trends. Here are the weekly results:
73
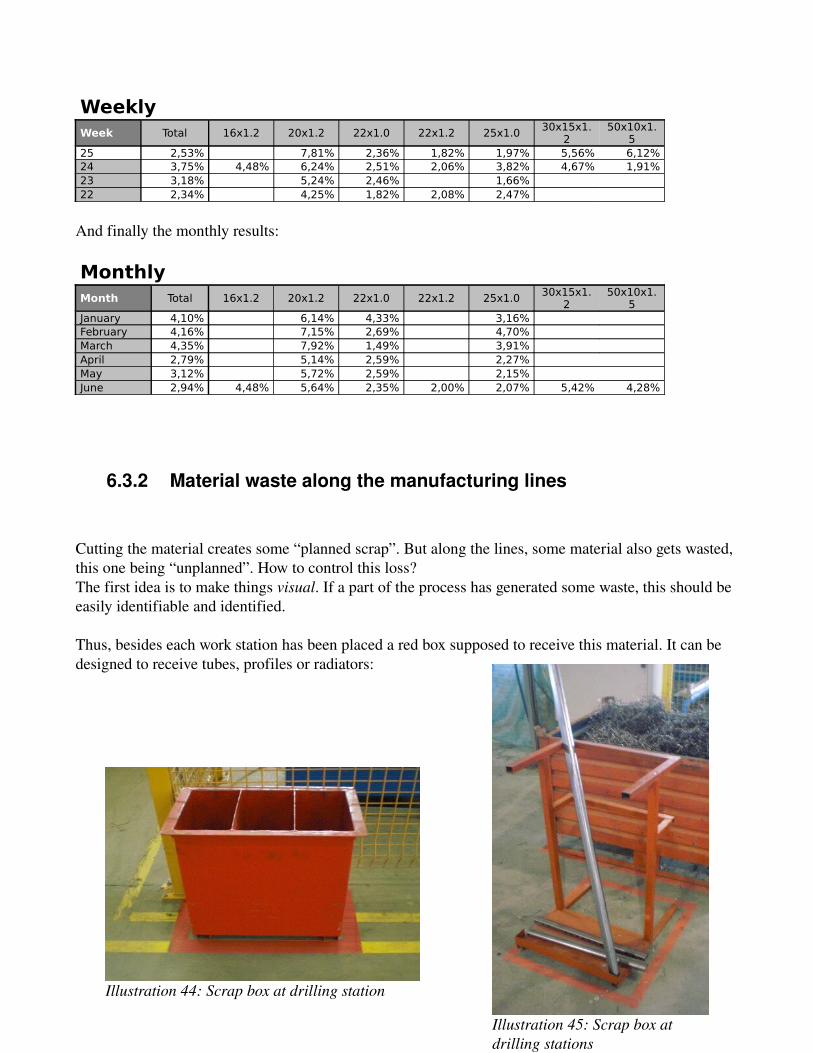
WeeklyWeek Total 16x1.2 20x1.2 22x1.0 22x1.2 25x1.0 30x15x1.
250x10x1.
525 2,53% 7,81% 2,36% 1,82% 1,97% 5,56% 6,12%24 3,75% 4,48% 6,24% 2,51% 2,06% 3,82% 4,67% 1,91%23 3,18% 5,24% 2,46% 1,66% 22 2,34% 4,25% 1,82% 2,08% 2,47%
And finally the monthly results:
MonthlyMonth Total 16x1.2 20x1.2 22x1.0 22x1.2 25x1.0 30x15x1.
250x10x1.
5January 4,10% 6,14% 4,33% 3,16% February 4,16% 7,15% 2,69% 4,70% March 4,35% 7,92% 1,49% 3,91% April 2,79% 5,14% 2,59% 2,27% May 3,12% 5,72% 2,59% 2,15% June 2,94% 4,48% 5,64% 2,35% 2,00% 2,07% 5,42% 4,28%
6.3.2 Material waste along the manufacturing lines
Cutting the material creates some “planned scrap”. But along the lines, some material also gets wasted, this one being “unplanned”. How to control this loss? The first idea is to make things visual. If a part of the process has generated some waste, this should be easily identifiable and identified.
Thus, besides each work station has been placed a red box supposed to receive this material. It can be designed to receive tubes, profiles or radiators:
74
Illustration 44: Scrap box at drilling station
Illustration 45: Scrap box at drilling stations
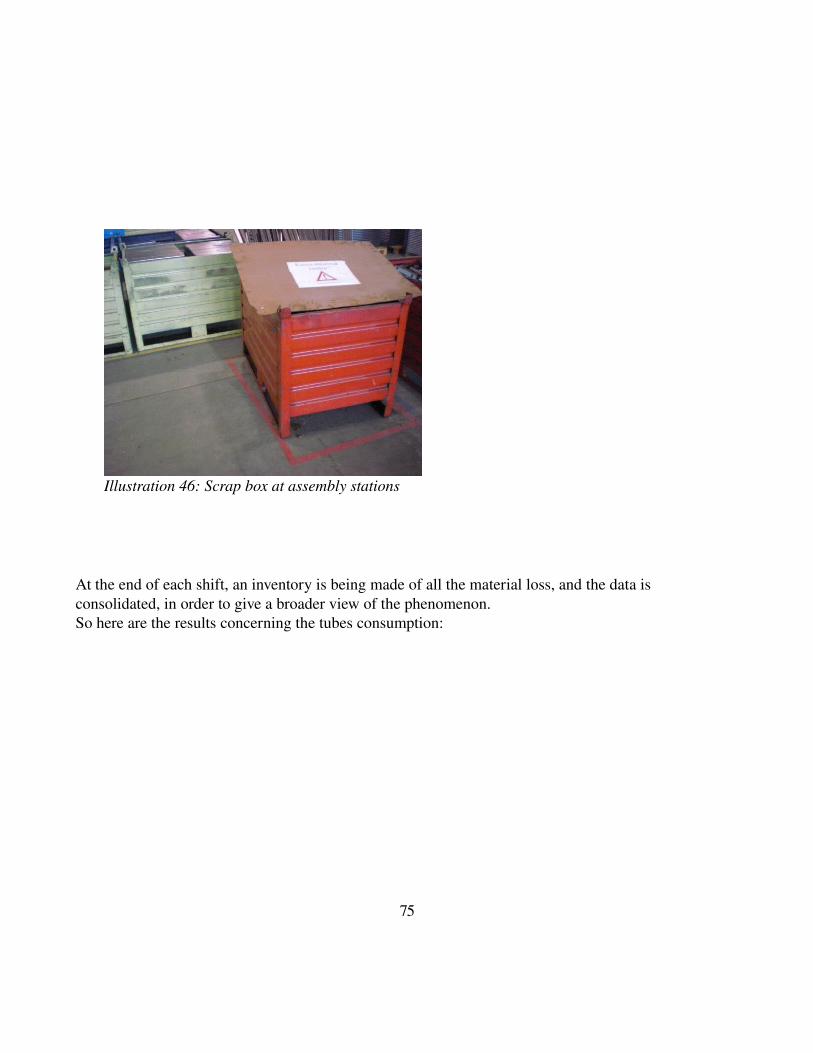
At the end of each shift, an inventory is being made of all the material loss, and the data is consolidated, in order to give a broader view of the phenomenon.So here are the results concerning the tubes consumption:
75
Illustration 46: Scrap box at assembly stations
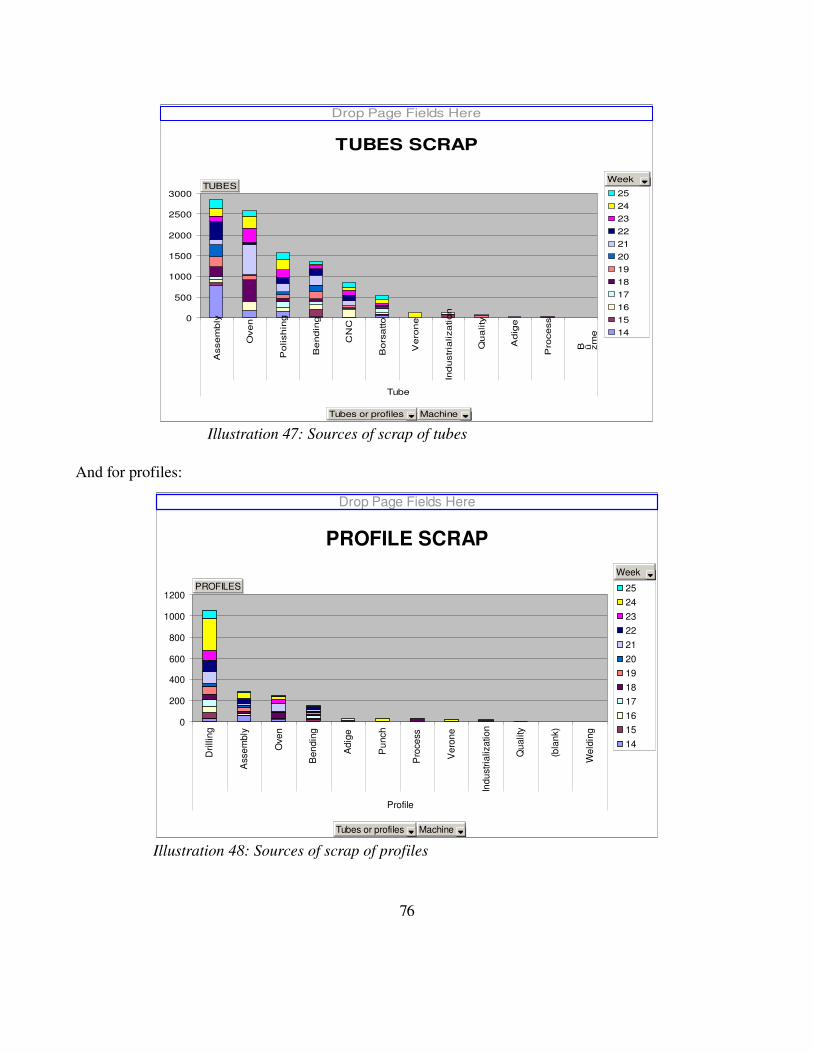
Illustration 47: Sources of scrap of tubes
And for profiles:
Illustration 48: Sources of scrap of profiles
76
TUBES SCRAP
0
500
1000
1500
2000
2500
3000
Ass
em
bly
Ove
n
Po
lish
ing
Be
nd
ing
CN
C
Bors
atto
Vero
ne
Ind
ust
ria
liza
tion
Qu
alit
y
Adig
e
Pro
cess
B ü zme
Tube
252423222120191817161514
Drop Page Fields Here
TUBES
Tubes or profiles Machine
Week
PROFILE SCRAP
0
200
400
600
800
1000
1200
Dril
ling
Ass
embl
y
Ove
n
Ben
ding
Adi
ge
Pun
ch
Pro
cess
Ver
one
Indu
stria
lizat
ion
Qua
lity
(bla
nk)
Wel
ding
Profile
252423222120191817161514
Drop Page Fields Here
PROFILES
Tubes or profiles Machine
Week
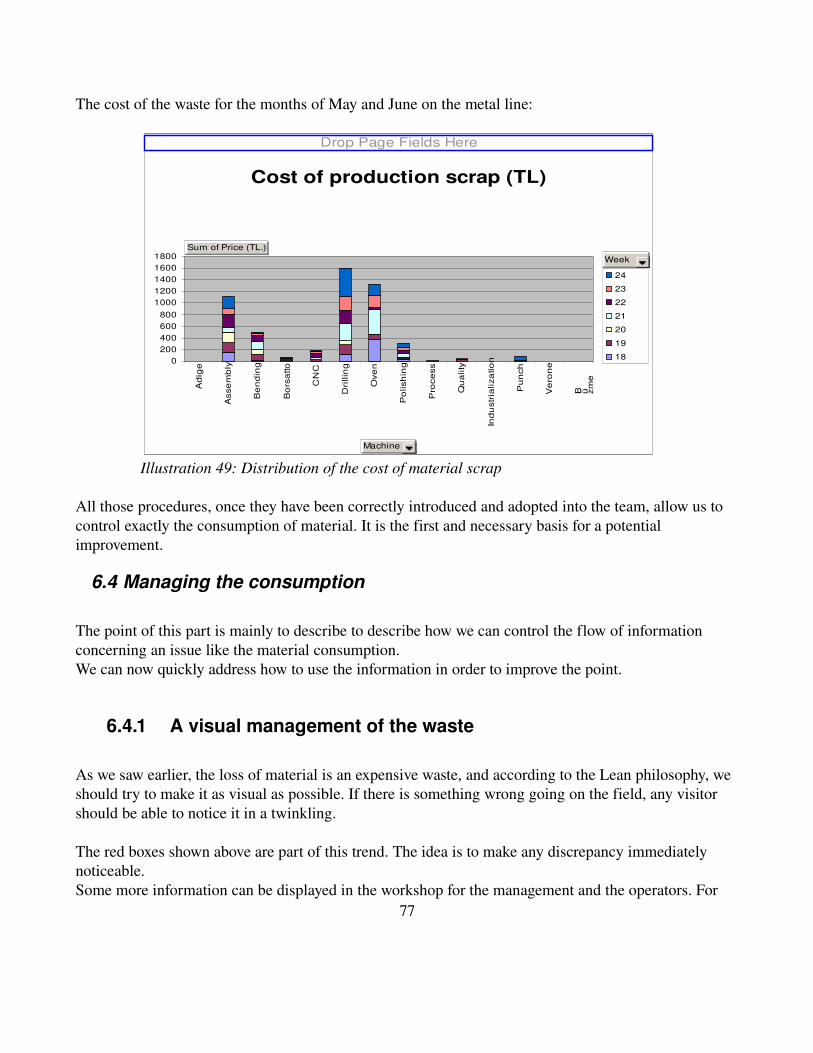
The cost of the waste for the months of May and June on the metal line:
All those procedures, once they have been correctly introduced and adopted into the team, allow us to control exactly the consumption of material. It is the first and necessary basis for a potential improvement.
6.4 Managing the consumption
The point of this part is mainly to describe to describe how we can control the flow of information concerning an issue like the material consumption.We can now quickly address how to use the information in order to improve the point.
6.4.1 A visual management of the waste
As we saw earlier, the loss of material is an expensive waste, and according to the Lean philosophy, we should try to make it as visual as possible. If there is something wrong going on the field, any visitor should be able to notice it in a twinkling.
The red boxes shown above are part of this trend. The idea is to make any discrepancy immediately noticeable.Some more information can be displayed in the workshop for the management and the operators. For
77
Illustration 49: Distribution of the cost of material scrap
Cost of production scrap (TL)
0200400600800
10001200140016001800
Ad
ige
Ass
em
bly
Be
nd
ing
Bo
rsa
tto
CN
C
Dri
llin
g
Ove
n
Po
lish
ing
Pro
cess
Qu
alit
y
Ind
ust
ria
liza
tion
Pu
nch
Ve
ron
e
B ü zme
24
23
22
21
20
19
18
Drop Page Fields Here
Sum of Price (TL.)
Machine
Week
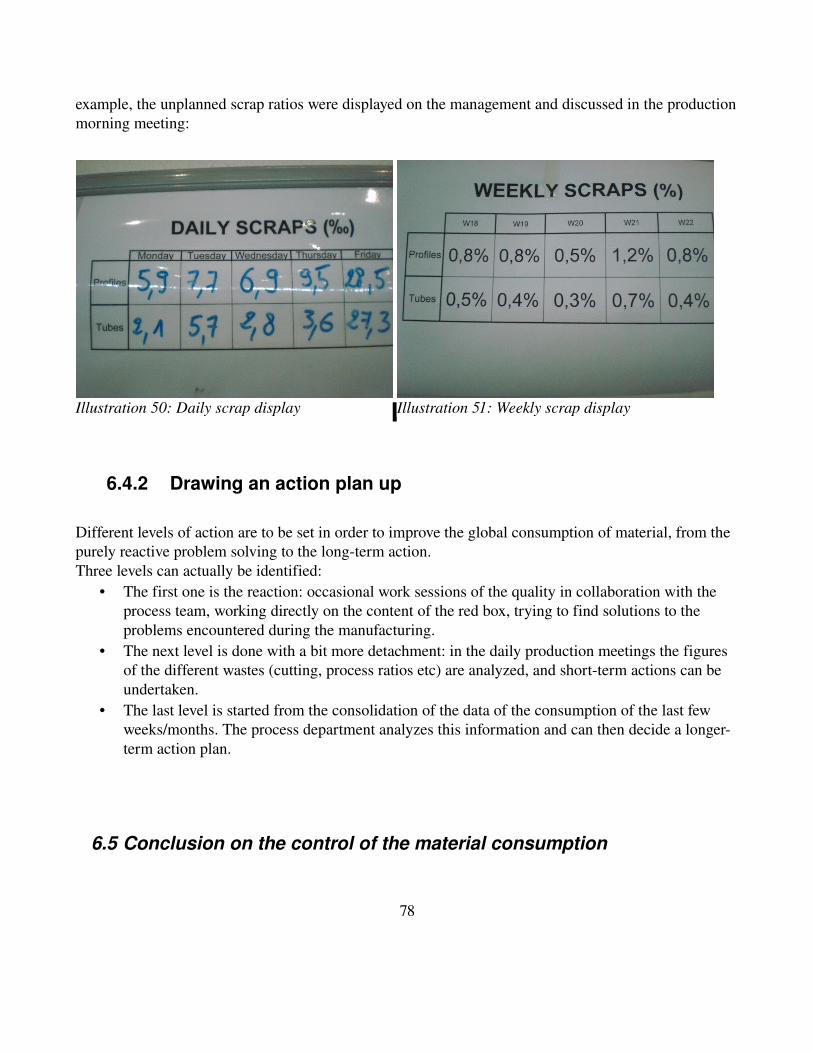
example, the unplanned scrap ratios were displayed on the management and discussed in the production morning meeting:
Illustration 50: Daily scrap display Illustration 51: Weekly scrap display
6.4.2 Drawing an action plan up
Different levels of action are to be set in order to improve the global consumption of material, from the purely reactive problem solving to the longterm action.Three levels can actually be identified:
• The first one is the reaction: occasional work sessions of the quality in collaboration with the process team, working directly on the content of the red box, trying to find solutions to the problems encountered during the manufacturing.
• The next level is done with a bit more detachment: in the daily production meetings the figures of the different wastes (cutting, process ratios etc) are analyzed, and shortterm actions can be undertaken.
• The last level is started from the consolidation of the data of the consumption of the last few weeks/months. The process department analyzes this information and can then decide a longerterm action plan.
6.5 Conclusion on the control of the material consumption
78

The consumption of raw material is an example of a sideissue that a production engineer has to follow closely. The waste itself is costly, but the loss also has broader consequences. Thus, it can disturb the flow, since the quantities you launch at the beginning of the process will not be the same as what you will get at the end of the manufacturing.
79
7 Overall conclusion
After a few months of thinking, trying and experimenting, finally the whole system was stable and working. This report gave an insight of how we can build a system (almost) from scratch: the scheduling process, the management of the flow on the workshop, and an example of a sideissue in a production department, the raw material consumption management.Finally, was it working well? It is difficult for me to say how well it was running, because of a lack of comparison points, but it was actually running better than at the beginning.
Difficulties to get the information
As an engineer working on a production floor, you need to work from data you collect from the field. Those data can come from people, machines, visual check etc. But there are a lot of information that are not easy to reach. If you are working on the flow for example, you might you to know: what is the average time for this changeover on the last month? How long did it take to produce this batch on this machine? What is the workinprocess after the oven? How many radiators did we scrap on the painting line today? How many metal bars did we consummate on this shift? On many more questions. Having no computer information system on the field means that if you want an information, you have to get it manually (teaching procedures to the operators so they give you the information you want about what they are doing). Such procedures take everybody a lot of time (operators, team leaders, engineers): the information has to be gathered, checked, input and consolidate with computers etc. Also, it happens that different departments (quality and production for example) sometimes want to pick up the same information from the field, and if the cooperation is not perfect, there will be a big waste of time and energy, a lot of muda.
So is the solution to buy an ERP? For many people inside the company, the ERP was seen as a sort of Messiah, that would solve all our problems (or at least help us solving them). The reality is more complicated. An ERP takes a lot of time to configure, it requires hundreds of hours of consultants coming to define the right parameters for the tool, it is expensive, it might not fit your true needs etc. It is an important choice to make, and the manager of the plant decided not to get any ERP for the production yet. His philosophy was: “An ERP allows you to manage the complexity, but what we want actually is to get rid of this complexity and to make things simple”. And this opinion is perfectly understandable. For example, the leaner your flow is, the easier it is to manage. The thing is that this simplicity was not easy to reach, for different reasons.
Towards a simple flow
The problem with the plant I worked in is that it was not really designed for the flow. When they
80

thought about the product or the process, the priority was not put on achieving a lean flow. It is only once the machines were placed and once the products were ready for mass production that it became an important topic. But it was sort of too late. The main obstacle we have been struggling with was the very wide range of references. In August, we already had produced almost 500 different kinds of radiators since the beginning of the year. And the problem was that the differentiation was being made very early in the process. And the process itself was not ready at all for a lean flow: long changeover times, imperfect position of the machines, a lot of useless steps (like washing) etc.
In my opinion, the system I have been describing, though not perfect, has taken most most benefits from the current system, and the biggest room for improvement is located in the points I have just mentioned. It would require a strong cooperation between production, process, industrialization and logistics. But there is nothing surprising in it, since reaching a good flow is a common and transverse goal for the whole factory.
81
8 Bibliography
[1]Modeles de gestion des flux : presentation et choix, by René BALMES and Guy BALMANAhttp://www.techniquesingenieur.fr/basedocumentaire/genieindustrielth6/logistiqueti082/modelesdegestiondesfluxpresentationetchoixag5100/[2] Practical Production Control, by Kenneth N. McKay. Page 27 ISBN 1932159304[3] An analytical framework for comparing material requirements planning to reorder point systemshttp://cat.inist.fr/?aModele=afficheN&cpsidt=4211621[4] Practical Production Control, by Kenneth N. McKay. Page 97 ISBN 1932159304[5] Les étapes de la logique MRP2 http://gpr.insalyon.fr/supgedem/Home/Le_monde_industriel/L_entreprise/La_gestion_de_production/Le_pilotage_du_flux_des_produits/Le_MRP/etapesmrp2.htm[6] Distribution and Distribution Requirements Planning http://www.referenceforbusiness.com/management/DeEle/DistributionandDistributionRequirementsPlanning.html[7] The Toyota Way: 14 Management Principles from the World's Greatest Manufacturer, by Jeffrey K. Liker. Page 118. ISBN:0071392319[8] The Goal. A process of ongoing improvement, by Eliyahu M. Goldratt ISBN: 0884271781[9] Kanban Calculation http://www.resourcesystemsconsulting.com/blog/archives/58[10] Synchronous Flow Manufacturing Implementation Insights http://www.rbvollum.com/whpaper.htm[11] Lean Manufacturing and JustinTime Production http://www.referenceforbusiness.com/management/IntLoc/LeanManufacturingandJustinTimeProduction.html [12] The Toyota Way: 14 Management Principles from the World's Greatest Manufacturer, by Jeffrey K. Liker. Page 182. ISBN:0071392319[13] Womack, James P.; Daniel T. Jones, and Daniel Roos (1990). The Machine That Changed the World.ISBN: 0060974176 [14] Waldner, JeanBaptiste (1990). Les nouvelles perspectives de la production. Paris: DUNOD BORDAS. ISBN 9782040198206. [15] MRP Software http://comsoft.org/mrpsoftware/
82


![[plan politika] Youth movement nowadays](https://img.pdfslide.us/doc/110x75/54628c5faf7959b92a8b6efc/plan-politika-youth-movement-nowadays.jpg)