Embed Size (px)
Citation preview
Setting a New Pace:How Punjab, Pakistan, achieved unprecedented improvements in public health outcomes
By:
Fenton WhelanApril 2018

2
Executive Summary
Between 2014 and 2017, Punjab achieved unprecedented improvements in its health system:
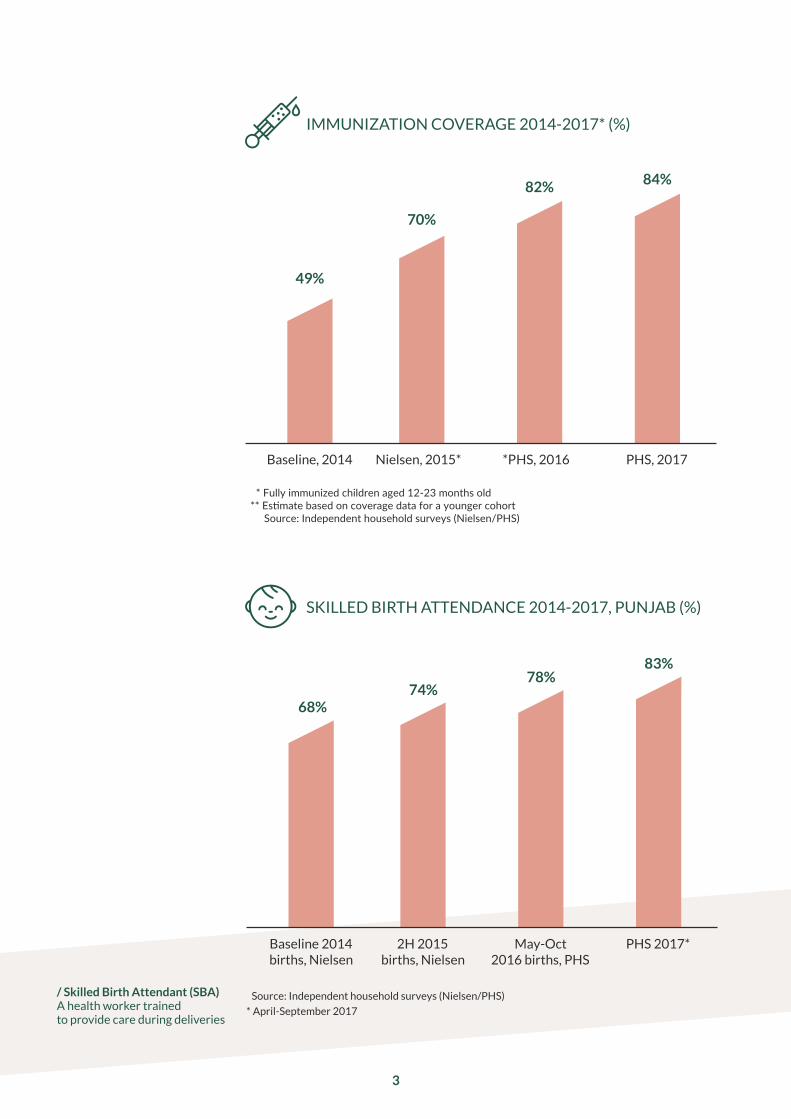
› Immunisation coverage increased by 35 percentage points,1 a rate of im-provement unheard of in a large health system. By 2017, almost one mil-lion more children were being fully immunised each year against a range of deadly childhood diseases, saving thousands of lives.2
› The proportion of women giving birth in the health system increased by 15 percentage points,3 meaning that 350,000 more children were born each year with medical care during their first moments of life, again saving thousands of lives.
› A new ambulance service was launched handling roughly 25,000 pa-tient transfers a month by December 2017.
› Additional vaccines, including rotavirus, were rolled out.
› A new referral system for complicated cases was established.
› The performance of primary health facilities rose, with substantial improvements in staffing, medicine availability, facility outlook and patient care.4
› Behind the scenes, new data systems, management routines and processes were implemented.
The improvements targeted and disproportionately benefited the poor-est communities in the province.5 Every indicator improved most among the poorest quarter of the population. The health service was extended to large numbers of previously unreached or underserved communities.
The improvements were the result of a simple set of techniques and pro-cesses that could be applied elsewhere. The Punjab Health Reforms Road-map focused on improving management and implementing simple but effec-tive solutions to problems on the ground. The strategy focused on:
› Agreeing priorities based on what would make the most difference.
› Using cost-effective and innovative new technologies.
› Getting good data to understand what works and to manage performance.
› Building capacity throughout the system.
› Creating routines to solve problems and drive progress.
› Engaging political leadership.
Punjab’s success demonstrates that the key to saving lives in the develop-ing world lies not in complex development theories or massive injections of funding, but rather in the application of good management and innova-tive technology to improve the delivery of services on the frontline.
This report is the story of that transformation.
/ Skilled Birth Attendant (SBA) A health worker trained to provide care during deliveries
SKILLED BIRTH ATTENDANCE 2014-2017, PUNJAB (%)
70%
82% 84%
49%
Nielsen, 2015* *PHS, 2016Baseline, 2014 PHS, 2017
3
IMMUNIZATION COVERAGE 2014-2017* (%)
74%78%
83%
68%
Source: Independent household surveys (Nielsen/PHS)
* April-September 2017
2H 2015births, Nielsen
May-Oct 2016 births, PHS
PHS 2017*Baseline 2014births, Nielsen
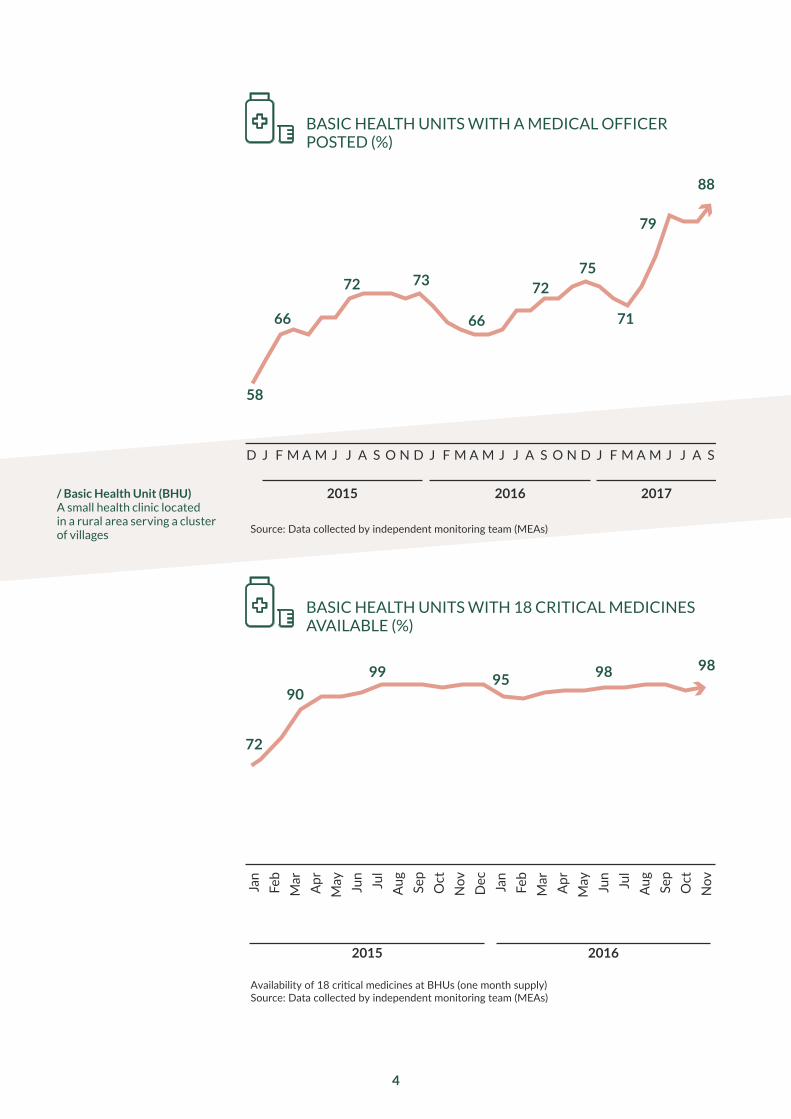
Availability of 18 critical medicines at BHUs (one month supply) Source: Data collected by independent monitoring team (MEAs)
20162015
72
9099 95 98 98
Jan
Feb
Mar
Apr
May Jun Jul
Aug
Sep
Oct
Nov Dec Jan
Feb
Mar
Apr
May Jun Jul
Aug
Sep
Oct
Nov
Source: Data collected by independent monitoring team (MEAs)
58
66
72 73
66
7275
71
79
88
20162015 2017
D J F M A M J J A S O N D J F M A M J J A S O N D J F M A M J J A S
/ Basic Health Unit (BHU) A small health clinic located in a rural area serving a cluster of villages
BASIC HEALTH UNITS WITH A MEDICAL OFFICER POSTED (%)
BASIC HEALTH UNITS WITH 18 CRITICAL MEDICINES AVAILABLE (%)
4
Lowest Second Middle HighestFourth
2014 2016
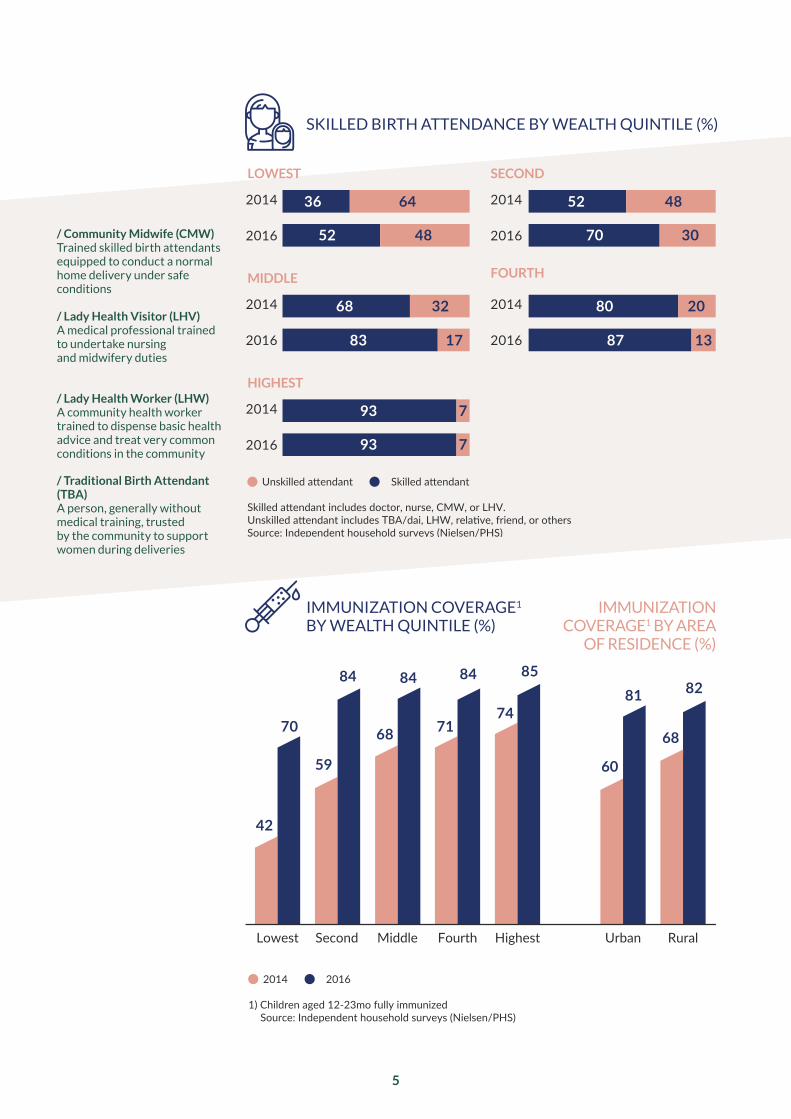
1) Children aged 12-23mo fully immunizedSource: Independent household surveys (Nielsen/PHS)
42
59
68 7174
70
84 84 84 85
RuralUrban
60
68
81 82
Unskilled attendant Skilled attendant
Skilled attendant includes doctor, nurse, CMW, or LHV. Unskilled attendant includes TBA/dai, LHW, relative, friend, or othersSource: Independent household surveys (Nielsen/PHS)
2014
2016
36
52
64
48
2014
2016
52
70
48
30
68
83
32
17
80
87
20
13
LOWEST SECOND
2014
2016
2014
2016
MIDDLE
2014
2016
93 7
93 7
FOURTH
HIGHEST
/ Community Midwife (CMW) Trained skilled birth attendants equipped to conduct a normal home delivery under safe conditions / Lady Health Visitor (LHV) A medical professional trained to undertake nursing and midwifery duties
/ Lady Health Worker (LHW) A community health worker trained to dispense basic health advice and treat very common conditions in the community
/ Traditional Birth Attendant (TBA) A person, generally without medical training, trusted by the community to support women during deliveries
SKILLED BIRTH ATTENDANCE BY WEALTH QUINTILE (%)
IMMUNIZATION COVERAGE1 BY WEALTH QUINTILE (%)
IMMUNIZATION COVERAGE1 BY AREA
OF RESIDENCE (%)
5

6
Achievements
Vaccination› Increased vaccination coverage
from 49% to 84% (fully immunized age 12-23 months)
› Introduced rotavirus vaccine for 2.5 million children each year
› Increased coverage of polio vaccine (OPV3) from 68% to 91%
› Increased on-time measles-1 coverage from 48% to 81%
› Ensured that 95% of communities in Punjab are visited by a vaccinator each month
› Introduced digital child-level monitoring of immunization, collecting data on 200,000 new children each month
› Hired 550 new vaccinators and supervisors
Safe Deliveries› Increased skilled birth
attendance from 68% to 83%
› Increased the number of public sector deliveries by 500,000 each year
› Increased skilled birth attendance among the bottom three wealth quintiles by 16%, 18% and 15% respectively
› Increased the number of BHUs offering 24/7 maternal health services from 77 to 1,000
› Procured 60 ultrasound machines for use in primary facilities, with 1,000 more on the way
› Introduced new systems to improve management of delivery complications
› Ensured consistent provision of supplies to community midwives
Facilities › Doubled the number of medical
officers in primary facilities from 1,445 to 2,995
› Increased availability of medical officers at BHUs from 34% to 74%
› Increased patient visits per quarter to primary health facilities from 2.67m to 3.62m
› Increased dispensation of free medicine from 13.4m to 29.5m units per quarter
› Introduced a range of diagnostic tests in all BHUs
› Increased the proportion of BHUs and RHCs with:
› a medical officer posted from 62% to 90%
› a medical officer present from 55% to 82%
› critical medicines available from 72% to 95%
› electricity from 64% to 99%
› water systems from 58% to 98%
› sewage systems from 58% to 97%
› supplies available from 69% to 98%
› contraceptives available from 42% to 98%
› functional equipment from 64% to 93%
› a facility sign from 85% to 97%
› adequate lighting from 22% to 72%
› working fans from 34% to 80%
› drinking water available from 17% to 92%
› a separate female toilet from 84% to 98%

7
› good whitewash condition from 72% to 96%
› good waiting area condition from 91% to 98%
› good toilet condition from 60% to 91%
› good labour room condition from 66% to 95%
Ambulances › Established a new free,
outsourced maternal ambulance fleet with 454 ambulances
› Increased successful transfers to more than 27,000 per month
› Reduced average transfer time from 150 minutes to 83 minutes
› Increased emergency calls being answered from 48% to 100%
› Reduced average call waiting time from 140 seconds to 3 seconds
› Reduced average emergency call duration time from 251 seconds to 114 seconds
Quality of care› Introduced patient care checklists
in facilities
› Increased patient temperature checks from 31% to 48%
› Increased patient pulse checks
from 51% to 69%
› Increased patient blood pressure checks from 43% to 72%
› Trained 45,000 Community Health Workers
Leadership and management› Established a routine of stocktakes
to review progress at the highest levels
› Established a routine of monthly meetings of all district health officials
› Introduced mobile applications for monitoring facilities by district staff
› Created an independent monitoring force of 170 monitors to collect data on health facilities
› Established a routine of annual household surveys to track health outcomes

8
Punjab is the largest province in Pakistan, home to 111 million people,6 more than half of the population of Pakistan and four times the population of Australia. A province of wide, fertile plains along the banks of the large rivers that descend from the Himalayas, it takes its name from the Persian words panj and ab, ‘five waters,’ or perhaps, ‘five rivers’.
In 2012, a major survey of families in Punjab was conducted,7 in which thou-sands of mothers and fathers were asked more than 100 questions about their families. The survey found that one in 11 children died before their fifth birthday, compared with one in 24 in India,8 one in 30 in Bangladesh9 and one in 125 in Sri Lanka.10 Worse, since 1990, the number had improved only marginally, from one in 10 to one in 11.11 Roughly half of all children who died before the age of five died within the first week of life.12 Almost all died of preventable causes.
There were three main opportunities to reduce child and maternal mor-tality. The first was improving care around the time of delivery. The survey showed that roughly one third of births occurred at home.13 Childbirth is inherently a risky moment. A complication that can lead to the death of the child or mother develops in around 15% of deliveries. These complications are well understood, and there are clear treatment protocols. In a good hospital, the risk of maternal death is close to zero. But at home in a village, far from the nearest road, the chances of obtaining care in time to ensure the survival of both mother and child are severely compromised.
The second was improving immunisation coverage. Pakistan’s routine im-munisation program was established in 1978.14 By 1996, coverage in Punjab province had increased to 49%.15 From 1996, the data is noisy, with surveys in the same year in the same province often having different results. Coverage rates improved in some years and fell in others. In 2012, the survey showed that coverage was the same as it had been in 1996.16 The low coverage meant that thousands of children died each year from preventable diseaes.
The third was transforming primary care facilities, the main source of healthcare for anyone unable to afford or access private care.17 Punjab had a network of around 2,780 government health clinics in rural areas. In 2014, these were poorly resourced and poorly performing. Only 27 of them had all of the essential medicines they were supposed to.18 The chances of find-ing a doctor present in one on any given day were just one on three. Critical supplies were missing, equipment broken, and the condition of the facilities poor. Thousands of children suffered or died each year from illnesses which could be cured or prevented if the health facilities were in better condition.
The Starting Point
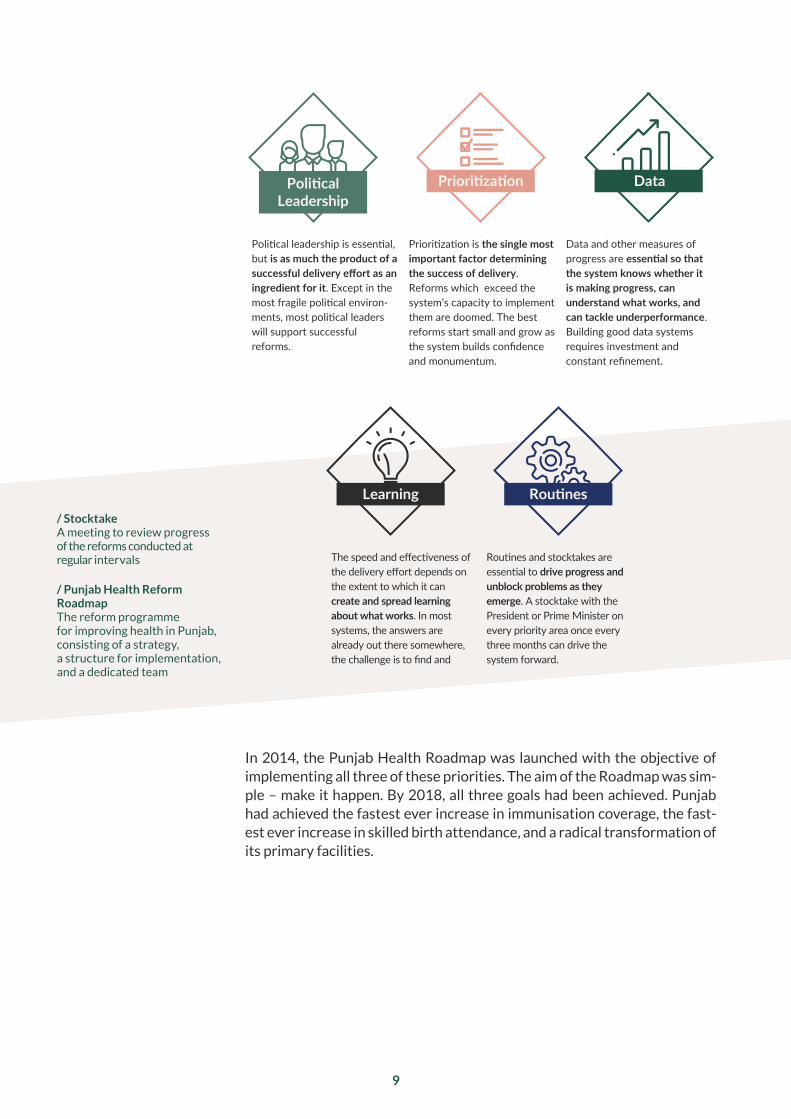
Political leadership is essential, but is as much the product of a successful delivery effort as an ingredient for it. Except in the most fragile political environ-ments, most political leaders will support successful reforms.
Prioritization is the single most important factor determining the success of delivery. Reforms which exceed the system’s capacity to implement them are doomed. The best reforms start small and grow as the system builds confidence and monumentum.
Data and other measures of progress are essential so that the system knows whether it is making progress, can understand what works, and can tackle underperformance. Building good data systems requires investment and constant refinement.
The speed and effectiveness of the delivery effort depends on the extent to which it can create and spread learning about what works. In most systems, the answers are already out there somewhere, the challenge is to find and
Routines and stocktakes are essential to drive progress and unblock problems as they emerge. A stocktake with the President or Prime Minister on every priority area once every three months can drive the system forward.
PoliticalLeadership
Prioritization Data
Learning Routines
› Population Council
GOVERNMENT OFFICIALS
DONORS
ROADM
AP TEAM & DELIVERY UNIT (SMU)
/ Stocktake A meeting to review progress of the reforms conducted at regular intervals
/ Punjab Health Reform Roadmap The reform programme for improving health in Punjab, consisting of a strategy, a structure for implementation, and a dedicated team
9
In 2014, the Punjab Health Roadmap was launched with the objective of implementing all three of these priorities. The aim of the Roadmap was sim-ple – make it happen. By 2018, all three goals had been achieved. Punjab had achieved the fastest ever increase in immunisation coverage, the fast-est ever increase in skilled birth attendance, and a radical transformation of its primary facilities.

10
Shahbaz Sharif became Chief Minister of Punjab in June 2008, having returned to Pakistan seven months earlier. A highly experienced politician and adminis-trator, he is known for his strong work ethic, commitment to transforming his province, fast-paced management style and occasional severity when dealing with officials who are not performing.
Sharif had always shown a strong interest in the health sector. However, he also was sceptical about the chances of dramatically improving the govern-ment system. Every presentation given to him about the state of the sys-tem described a wide range of deep challenges and problems. Thousands of pages had been written on problems and deficiencies in the system. Many pilots and reforms had been launched without a discernible impact. Donors and experts counselled that improvement would require decades of deter-mined efforts and funding, which, even then, might prove ineffective. He needed to be convinced that the system was worth the effort.
On the 15th of April 2014, Sharif convened the first meeting of the Health Roadmap. The presentation included comparisons with the Indian state of Punjab, a region with the same name just across the border. Immunisation coverage was 82% in the Indian state of Punjab compared to 47% in the Pakistani province of Punjab.19 The number of deliveries occurring in the presence of a medical professional was 85% compared to 68%.20 Children on the Pakistani side of the border were more than twice as likely to die be-fore their fifth birthday as those on the Indian side of the border.21 If Punjab, Pakistan, had the same child survival rate as Punjab, India, 100,000 lives a year would be saved.
The comparison illustrated both that it could be done and that it had to be done. Visibly moved, the Chief Minister approved a raft of actions for im-mediate implementation, and set targets for improvement on every indica-tor. He committed to chairing a routine of stocktakes to review progress.
Engaging the Chief Minister

› Mem
ber P
rovinc
ial Assem
bly
› Mem
ber P
rovinc
ial Assem
bly
› Mem
ber P
rovinc
ial Assem
bly
› Min
ister
for P
opul
ation
Wel
fare
› Min
ister
for P
rimar
y &
Second
ary Hea
lth› Ch
ief M
inister
› Associate SMU
› Team Leader SMU
› Head of SMU
› Associate Roadmap Team
Roadmap Team
› Project Manager
Roadmap
› Director
› Donor Techn
ical exper
t
› UNFPA represen
tative
› UNICEF repres
entative
› WHO represen
tative
represen
tative
› World Ban
k
representa
tives
› DFID
› CEO Punjab H
ealth Care Comm
ission
› Director IRM
NCH
› Project Director PITB
› Secretary Population Welfare
› Secretary Pri mary
& Secondary Health
› Chairman Planning
& Development
› Population Council › Director EPI
› Special Secretary Primary & Secondary Health› Secretary Specialized Healthcare & Medical Education› Chairman PITB
› Secretary Finance
› Chief Secretary Punjab
POLI
TICI
ANS
GOVERNMENT OFFICIALS
DONORSRO
ADMAP TEAM & DELIVERY UNIT (SMU)
stocktakes
/ Punjab Information Technology Board (PITB) An autonomous body of the Government of Punjab dedicated to using technology to improve government in Punjab and beyond
/ Expanded Programme on Immunization (EPI) The Health Department office responsible for vaccination
/ Integrated Reproductive Maternal Newborn Child Health & Nutrition Programme (IRMNCH) Health Department programme to reduce maternal and newborn child morbidity and mortality, promote family planning and improve the nutritional status of women and children
/ Department for International Development (DFID) British Government Department managing the UK aid programme
/ World Health Organisation (WHO) An organisation whose goal is to build a better, healthier future for people all over the world. Their primary role is to direct and coordinate international health within the United Nations systems
/ United Nations Children’s Fund (UNICEF) A fund mandated by the United Nations General Assembly to advocate for the protection of children’s rights, to help meet their basic needs and to expand their opportunities to reach their full potential
/ United Nations Population Fund (UNFPA) The United Nations reproductive health and rights agency which aims to deliver a world where every pregnancy is wanted, every childbirth is safe and every young person’s potential is fulfilled
/ Special Monitoring Unit (SMU) A unit of the Chief Minister’s office in Punjab charged with overseeing reforms across several priority sectors
TYPICAL LAYOUT OF STOCKTAKES WITH THE CHIEF MINISTER
11
The stocktakes became one of the key drivers of progress. Every two to three months, everyone involved would gather for a meeting to review progress. A dedicated independent Roadmap team staffed by Acasus col-lected evidence and produced a candid assessment of progress in each area. A set of up to 100 ‘traffic lights’ showed the status of every agreed action and a collection of heatmaps showed progress in each of the 36 districts. Additional pages highlighted achievements, flagged problems, or suggested additional actions for approval.
The stocktakes became infamous for their sometimes harsh accountabili-ty. In one where progress was lagging, several people were fired during the course of the meeting. More often, however, they were a forum for solving problems, making decisions and congratulating those working hard to reform the system. During one meeting, three midwives from remote regions who had delivered more than 100 babies each during the previous month were honoured. In another, the team responsible for turning around a previously failing district was congratulated.

12
One of the key priorities was improving immunization coverage. For the most part, Punjab had the staff, vaccines and equipment to immunise every child.22 However, to vaccinate children on time, the government had to ensure that a health worker actually visited every community, every month, to immunise children. It was in this final step that the challenge lay.
Arfa Tower is a modern glass office block in the east of Lahore, a build-ing that would not be out of place in Dubai or Singapore. It is home to the Punjab Information Technology Board (PITB). Under the leadership of the charismatic and highly effective Dr Umar Saif, PITB has become a leader in the application of technology to support and drive reforms in government. When the Roadmap was launched, PITB assigned some of its top develop-ers and managers to work with the Department and the Acasus team.
During the second half of 2014, each of the 4,000 health workers responsible for vaccination was given a low-cost smartphone by PITB (initially funded by the World Bank). The phones included an application that enabled vaccina-tors to report their exact location every time they vaccinated a child. Within months, they were submitting hundreds of thousands of reports every month.23 The data from the phones meant that the government knew in real time exact-ly which communities were being visited and which were not.
The way in which the data were used evolved over time, but ultimately, the team designed an online map in which 17,700 regions – each representing a small village or cluster of hamlets – were shaded either green or red, depend-ing on whether the community had been visited by a vaccinator that month.24 The map was based on automated analysis of recent satellite imagery, ensur-ing that no community – official or unofficial – was missed. Separate pages showed the performance of individual vaccinators and data on the individual vaccination status of the two million children completing a course of vaccina-tions at any one time. Monthly performance reports were created for individ-uals, districts and the province as a whole.
4,000 Phones
As the Roadmap became more established, the discussion on primary care reduced to roughly 30 minutes every three months. The routines of pre-meetings, careful preparation by officials, and the stocktakes’ reputa-tion for brutal honesty on progress and the consequences that sometimes accompanied a lack of it meant that almost every problem was solved or action implemented in advance. The Roadmap converted a small amount of political leadership time focused on primary health - in later stages, only two or three hours a year – into a powerful and constant force for reform across the entire system.

Oct 2015 Nov 2015 Dec 2015 Jan 2016
Feb 2016
Aug 2016 Sep 2016
Oct 2016 Nov 2016 Dec 2016
Mar 2016 Apr 2016 May 2016
Jun 2016 Jul 2016
VACCINATOR COVERAGE IN FAISALABAD DISTRICT
13
The map was used to identify missed communities, and then the Health De-partment, district staff and the Acasus team developed solutions to address the coverage gaps. The Chief Minister approved the hiring of 550 new vacci-nators and supervisors to fill empty posts, including a large number of posts that became vacant after the new system revealed that some vaccinators were not visiting any communities at all.
14
Transport allowances were consistently released every month once it became clear that some vaccinators were not travelling to communities because the allowances that they needed to pay for petrol had not been provided. A new approach to managing special campaigns was developed to ensure that vac-cinators could focus on routine immunisation. Missed villages were assigned to vaccinators, and the maps allowed district staff to develop more efficient coverage plans. New plans were developed to ensure that communities did not get missed because of holidays or special events. Best practices for man-aging immunisation were created based on investigations of top-performing districts and disseminated across the province.
Within two years, immunisation coverage improved dramatically. A November 2016 survey of 30,000 households found that coverage was 82%, 35 percent-age points higher than in December 2014.25 The results were so strong that the government and donors commissioned four separate independent household surveys to check that the improvement was real, all of which confirmed the same results. Vaccination of children against polio reached an all-time high, as a result of the process of systematically covering every community in the prov-ince, rather than undertaking ad hoc campaigns. With the vaccination delivery system performing, in 2017, Punjab began introducing new vaccines, including Rotavirus, a vaccine to address one of the main causes of infant mortality. The higher coverage put Punjab well on the path to transforming health outcomes.
1,300 Delivery Centres
Roughly 2.5 million children are born in Punjab each year.26 In 2014, there was almost no effective government provision for deliveries in rural areas.27 Expectant mothers either had to travel to a town with a government hos-pital (many of which were in poor condition), use a private clinic or deliver at home. Among the poorest 20% of the population, two-thirds chose to deliver at home.28 This, in turn, led to some of the worst neonatal and ma-ternal mortality figures in the region.29 Every community could tell stories of newborns and mothers dying during failed deliveries.
Punjab had 305 Rural Health Centres – small rural hospitals that could, in theory, handle deliveries. However, most lacked the equipment and resourc-es to do so,30 and the 305 facilities were not nearly enough to cover a rural population of 70 million people. The province also had 2,470 Basic Health

15
Units, smaller facilities that were only open in the morning, but which could be upgraded to provide round-the-clock care. In a pilot program, 77 of these had been converted to 24/7 operations, and despite significant resource gaps, the results were promising.31
Between 2014 and 2018, the number of Basic Health Units offering 24/7 maternal health services increased from 77 to almost 1,000.32 Data from the vaccinator-tracking application was used to create a geo-tagged map of home deliveries that, in turn, was used to identify optimal locations for the 1,000 upgraded facilities.33 In parallel, the 305 Rural Health Centres were made fully operational, creating a network of 1,300 rural facilities where deliveries could take place. A multi-year effort aimed to ensure 100% up-time of these facilities – that regardless of when a patient arrived, each fa-cility would always have the staff, equipment, medicine and electricity to conduct a delivery. If a single item on the critical list was missing, the facility failed the readiness test. Initially, only 50% of facilities passed the test.34 By 2019, results were close to 100%.35
EXPANSION OF 24/7 BASIC HEALTH UNITS IN PUNJAB
2014 2015
2017 2018
2016
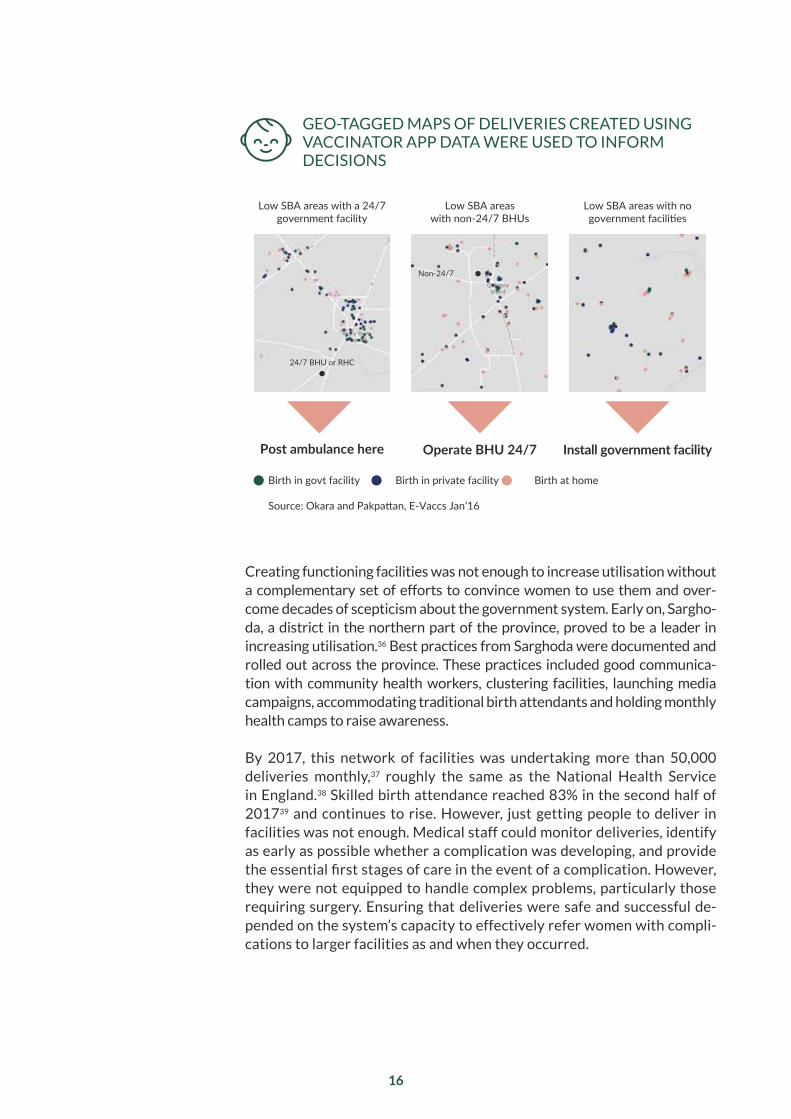
Post ambulance here Operate BHU 24/7 Install government facility
Low SBA areas with a 24/7 government facility
Low SBA areas with non-24/7 BHUs
Low SBA areas with no government facilities
Birth in govt facility Birth in private facility Birth at home
Source: Okara and Pakpattan, E-Vaccs Jan’16
24/7 BHU or RHC
Non-24/7
16
Creating functioning facilities was not enough to increase utilisation without a complementary set of efforts to convince women to use them and over-come decades of scepticism about the government system. Early on, Sargho-da, a district in the northern part of the province, proved to be a leader in increasing utilisation.36 Best practices from Sarghoda were documented and rolled out across the province. These practices included good communica-tion with community health workers, clustering facilities, launching media campaigns, accommodating traditional birth attendants and holding monthly health camps to raise awareness.
By 2017, this network of facilities was undertaking more than 50,000 deliveries monthly,37 roughly the same as the National Health Service in England.38 Skilled birth attendance reached 83% in the second half of 201739 and continues to rise. However, just getting people to deliver in facilities was not enough. Medical staff could monitor deliveries, identify as early as possible whether a complication was developing, and provide the essential first stages of care in the event of a complication. However, they were not equipped to handle complex problems, particularly those requiring surgery. Ensuring that deliveries were safe and successful de-pended on the system’s capacity to effectively refer women with compli-cations to larger facilities as and when they occurred.
GEO-TAGGED MAPS OF DELIVERIES CREATED USING VACCINATOR APP DATA WERE USED TO INFORM DECISIONS
17
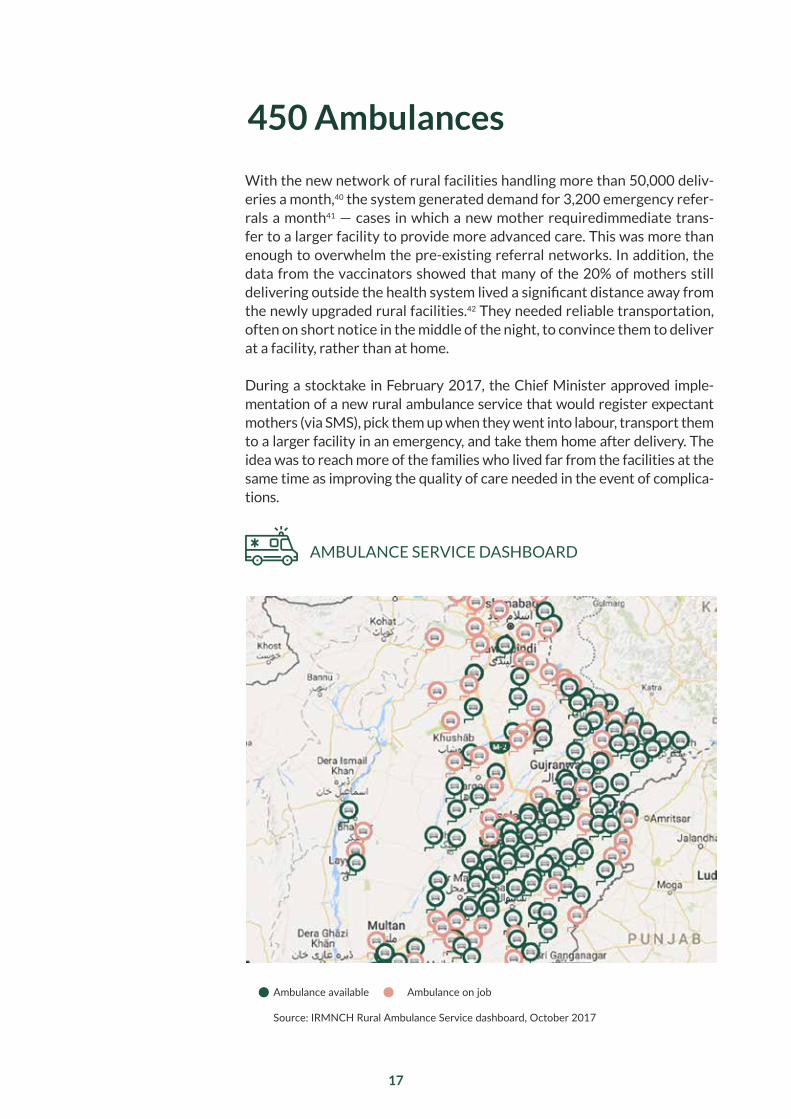
With the new network of rural facilities handling more than 50,000 deliv-eries a month,40 the system generated demand for 3,200 emergency refer-rals a month41 — cases in which a new mother requiredimmediate trans-fer to a larger facility to provide more advanced care. This was more than enough to overwhelm the pre-existing referral networks. In addition, the data from the vaccinators showed that many of the 20% of mothers still delivering outside the health system lived a significant distance away from the newly upgraded rural facilities.42 They needed reliable transportation, often on short notice in the middle of the night, to convince them to deliver at a facility, rather than at home.
During a stocktake in February 2017, the Chief Minister approved imple-mentation of a new rural ambulance service that would register expectant mothers (via SMS), pick them up when they went into labour, transport them to a larger facility in an emergency, and take them home after delivery. The idea was to reach more of the families who lived far from the facilities at the same time as improving the quality of care needed in the event of complica-tions.
450 Ambulances
AMBULANCE SERVICE DASHBOARD
Ambulance available Ambulance on job
Source: IRMNCH Rural Ambulance Service dashboard, October 2017
18
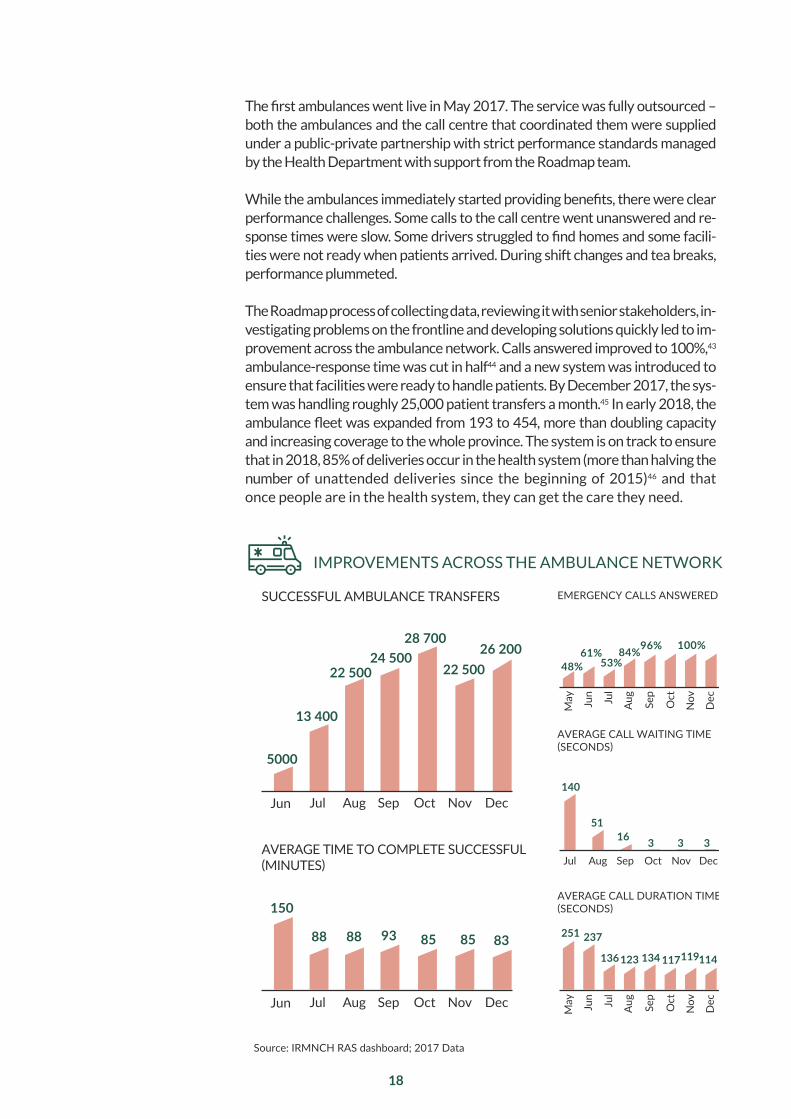
The first ambulances went live in May 2017. The service was fully outsourced – both the ambulances and the call centre that coordinated them were supplied under a public-private partnership with strict performance standards managed by the Health Department with support from the Roadmap team.
While the ambulances immediately started providing benefits, there were clear performance challenges. Some calls to the call centre went unanswered and re-sponse times were slow. Some drivers struggled to find homes and some facili-ties were not ready when patients arrived. During shift changes and tea breaks, performance plummeted.
The Roadmap process of collecting data, reviewing it with senior stakeholders, in-vestigating problems on the frontline and developing solutions quickly led to im-provement across the ambulance network. Calls answered improved to 100%,43 ambulance-response time was cut in half44 and a new system was introduced to ensure that facilities were ready to handle patients. By December 2017, the sys-tem was handling roughly 25,000 patient transfers a month.45 In early 2018, the ambulance fleet was expanded from 193 to 454, more than doubling capacity and increasing coverage to the whole province. The system is on track to ensure that in 2018, 85% of deliveries occur in the health system (more than halving the number of unattended deliveries since the beginning of 2015)46 and that once people are in the health system, they can get the care they need.
IMPROVEMENTS ACROSS THE AMBULANCE NETWORK
150
88 88 93 85 85 83
Source: IRMNCH RAS dashboard; 2017 Data
SUCCESSFUL AMBULANCE TRANSFERS
5000
13 400
22 50024 500
28 700
22 50026 200
Jun Jul Aug Sep Oct Nov Dec
AVERAGE TIME TO COMPLETE SUCCESSFUL (MINUTES)
EMERGENCY CALLS ANSWERED
48%61%
53%84%96% 100%
AVERAGE CALL WAITING TIME (SECONDS)
140
5116 3 3 3
Jul Aug Sep Oct Nov Dec
AVERAGE CALL DURATION TIME (SECONDS)
251 237
136123 134 117119114
Jun Jul
Aug
Sep
Oct
Nov
Dec
May
Jun Jul
Aug
Sep
Oct
Nov
Dec
May
Jun Jul Aug Sep Oct Nov Dec

19
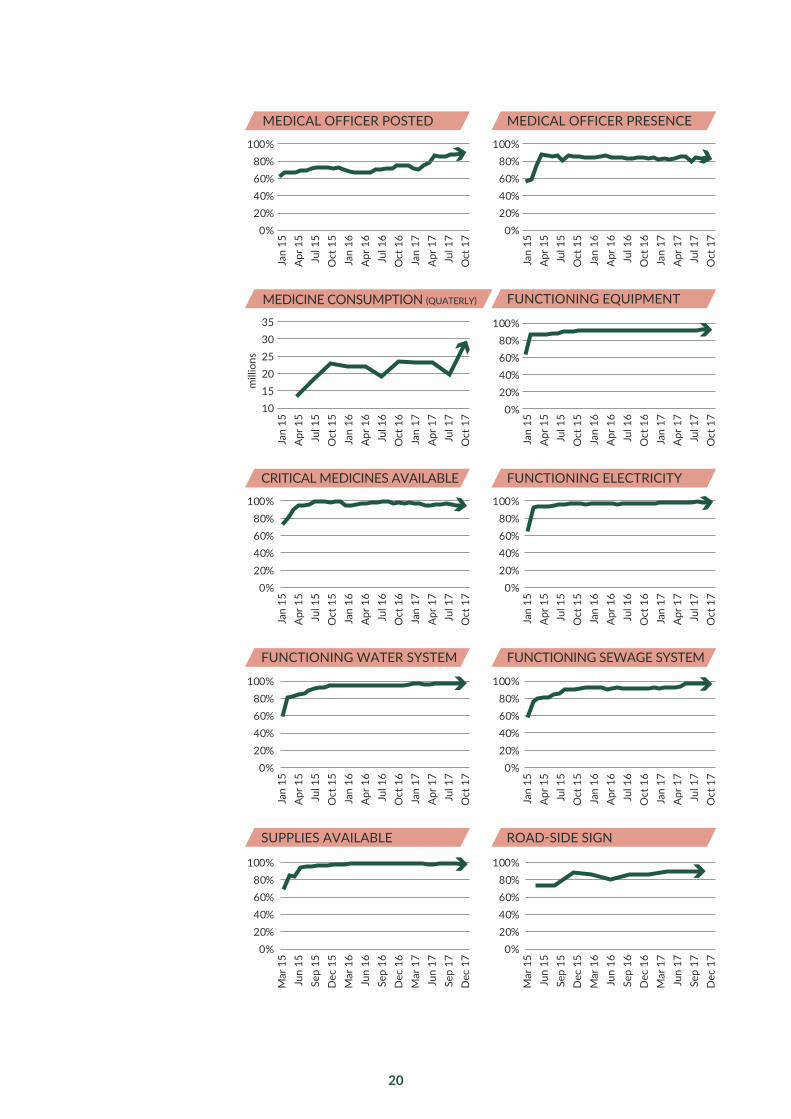
170 Independent Monitors
Punjab’s network of 2,780 rural health facilities was the main health service available to many of the poorest people in the province. However, in 2014, in many cases, it was barely functioning. The chances of finding a doctor in a Ba-sic Health Unit on any given day were just one-in-three.47 Basic Health Units were supposed to stock only 18 medicines – a small range. Only 27 facilities had all 18 in stock,48 and 44 facilities were found to have no staff at all.49
In the first Roadmap meeting, the Chief Minister approved the creation of an independent monitoring force, modelled on a similar force that moni-tored schools. The 170 monitors were former army officers, charged with visiting every health facility in the province at least once a month and re-porting objectively on its condition. The information they gathered was re-ported through a mobile application, giving the the Health Department and the Roadmap team real time information on the condition of the facilities.
Considerable effort was invested in ensuring that the data were accurate. The monitors, through their training, developed a strong sense of purpose around their work. They realised that accurate reporting would enable problems to be addressed and lives to be saved, and that false reporting put their fellow citizens’ lives in danger. A third of facilities were re-inspected each month by a different monitor, then results were compared. Statistical analyses identi-fied any anomalies in reporting. Independent evaluations confirmed that the data were highly reliable.50
The monitors started their work in December 2014. Each week, data were uploaded late on Saturday afternoons. On Sunday, the Acasus team checked the data and undertook a wide range of analyses. They then pro-duced individual reports for each of the 36 districts, with specific details on problems that were uncovered. The reports told districts which facilities needed medicines and the quantities to send. They indicated staff vacan-cies, unauthorised absences, broken toilets, failed electricity connections and a wide range of other problems. An algorithm prioritised issues to help districts focus on the items that would make the most difference first.
The team also produced a summary for the Minister and the Secretary, indicating overall provincial performance, specific problems, and a list of people to be called, either to congratulate them or to urge them to address particular problems. On Monday morning, 36 hours after the last data were collected, the minister and the secretary would start making phone calls.
20
Jan
15A
pr 1
5Ju
l 15
Oct
15
Jan
16A
pr 1
6Ju
l 16
Oct
16
Jan
17A
pr 1
7Ju
l 17
Oct
17
Jan
15A
pr 1
5Ju
l 15
Oct
15
Jan
16A
pr 1
6Ju
l 16
Oct
16
Jan
17A
pr 1
7Ju
l 17
Oct
17
Jan
15A
pr 1
5Ju
l 15
Oct
15
Jan
16A
pr 1
6Ju
l 16
Oct
16
Jan
17A
pr 1
7Ju
l 17
Oct
17
Jan
15A
pr 1
5Ju
l 15
Oct
15
Jan
16A
pr 1
6Ju
l 16
Oct
16
Jan
17A
pr 1
7Ju
l 17
Oct
17
Jan
15A
pr 1
5Ju
l 15
Oct
15
Jan
16A
pr 1
6Ju
l 16
Oct
16
Jan
17A
pr 1
7Ju
l 17
Oct
170%
20%40%60%80%
100%
MEDICAL OFFICER POSTED MEDICAL OFFICER PRESENCE
0%20%40%60%80%
100%
CRITICAL MEDICINES AVAILABLE FUNCTIONING ELECTRICITY
75%80%85%90%95%
WAITING AREA CONDITION GENERAL TOILET CONDITION
101520253035
mill
ions
MEDICINE CONSUMPTION (QUATERLY) FUNCTIONING EQUIPMENT
0%20%40%60%80%
100%
0%20%40%60%80%
100%
FUNCTIONING SEWAGE SYSTEMFUNCTIONING WATER SYSTEM
Jan
15A
pr 1
5Ju
l 15
Oct
15
Jan
16A
pr 1
6Ju
l 16
Oct
16
Jan
17A
pr 1
7Ju
l 17
Oct
17
0%20%40%60%80%
100%
Mar
15
Jun
15Se
p 15
Dec
15
Mar
16
Jun
16Se
p 16
Dec
16
Mar
17
Jun
17Se
p 17
Dec
17
0%20%40%60%80%
100%
ROAD-SIDE SIGN
Mar
15
Jun
15Se
p 15
Dec
15
Mar
16
Jun
16Se
p 16
Dec
16
Mar
17
Jun
17Se
p 17
Dec
17
0%20%40%60%80%
100%
Mar
15
Jun
15Se
p 15
Dec
15
Mar
16
Jun
16Se
p 16
Dec
16
Mar
17
Jun
17Se
p 17
Dec
17
0%20%40%60%80%
100%
Mar
15
Jun
15Se
p 15
Dec
15
Mar
16
Jun
16Se
p 16
Dec
16
Mar
17
Jun
17Se
p 17
Dec
17
100%
Jan
15A
pr 1
5Ju
l 15
Oct
15
Jan
16A
pr 1
6Ju
l 16
Oct
16
Jan
17A
pr 1
7Ju
l 17
Oct
17
0%20%40%60%80%
100%
SUPPLIES AVAILABLE
Mar
15
Jun
15Se
p 15
Dec
15
Mar
16
Jun
16Se
p 16
Dec
16
Mar
17
Jun
17Se
p 17
Dec
17
0%20%40%60%80%
100%
Mar
15
Jun
15Se
p 15
Dec
15
Mar
16
Jun
16Se
p 16
Dec
16
Mar
17
Jun
17Se
p 17
Dec
17
0%20%40%60%80%
100%
DRINKING WATER AVAILABLEWORKING FANS
75%80%85%90%95%
Mar
15
Jun
15Se
p 15
Dec
15
Mar
16
Jun
16Se
p 16
Dec
16
Mar
17
Jun
17Se
p 17
Dec
17
0%20%40%60%80%
100%
Mar
15
Jun
15Se
p 15
Dec
15
Mar
16
Jun
16Se
p 16
Dec
16
Mar
17
Jun
17Se
p 17
Dec
17
100%
75%80%85%90%95%
Mar
15
Jun
15Se
p 15
Dec
15
Mar
16
Jun
16Se
p 16
Dec
16
Mar
17
Jun
17Se
p 17
Dec
17
0%20%40%60%80%
100%
Mar
15
Jun
15Se
p 15
Dec
15
Mar
16
Jun
16Se
p 16
Dec
16
Mar
17
Jun
17Se
p 17
Dec
17
100%
WHITEWASH CONDITIONSEPARATE FEMALE TOILET
75%80%85%90%95%
Mar
15
Jun
15Se
p 15
Dec
15
Mar
16
Jun
16Se
p 16
Dec
16
Mar
17
Jun
17Se
p 17
Dec
17
0%20%40%60%80%
100%
Mar
15
Jun
15Se
p 15
Dec
15
Mar
16
Jun
16Se
p 16
Dec
16
Mar
17
Jun
17Se
p 17
Dec
17
100%
LABOR ROOM CONDITION AVERAGE OUTLOOK SCORE
ADEQUATE LIGHTINGFACILITY SIGN
Source: MEA data
Jan
15A
pr 1
5Ju
l 15
Oct
15
Jan
16A
pr 1
6Ju
l 16
Oct
16
Jan
17A
pr 1
7Ju
l 17
Oct
17
0%20%40%60%80%
100%

/ Average Outlook Score The average score of road-side sign, facility sign, adequate lighting, working fans, drinking water availability, separate female toilet, whitewash condition, general toilet condition and labor room condition.
21
Jan
15A
pr 1
5Ju
l 15
Oct
15
Jan
16A
pr 1
6Ju
l 16
Oct
16
Jan
17A
pr 1
7Ju
l 17
Oct
17
Jan
15A
pr 1
5Ju
l 15
Oct
15
Jan
16A
pr 1
6Ju
l 16
Oct
16
Jan
17A
pr 1
7Ju
l 17
Oct
17
Jan
15A
pr 1
5Ju
l 15
Oct
15
Jan
16A
pr 1
6Ju
l 16
Oct
16
Jan
17A
pr 1
7Ju
l 17
Oct
17
Jan
15A
pr 1
5Ju
l 15
Oct
15
Jan
16A
pr 1
6Ju
l 16
Oct
16
Jan
17A
pr 1
7Ju
l 17
Oct
17
Jan
15A
pr 1
5Ju
l 15
Oct
15
Jan
16A
pr 1
6Ju
l 16
Oct
16
Jan
17A
pr 1
7Ju
l 17
Oct
170%
20%40%60%80%
100%
MEDICAL OFFICER POSTED MEDICAL OFFICER PRESENCE
0%20%40%60%80%
100%
CRITICAL MEDICINES AVAILABLE FUNCTIONING ELECTRICITY
75%80%85%90%95%
WAITING AREA CONDITION GENERAL TOILET CONDITION
101520253035
mill
ions
MEDICINE CONSUMPTION (QUATERLY) FUNCTIONING EQUIPMENT
0%20%40%60%80%
100%
0%20%40%60%80%
100%
FUNCTIONING SEWAGE SYSTEMFUNCTIONING WATER SYSTEM
Jan
15A
pr 1
5Ju
l 15
Oct
15
Jan
16A
pr 1
6Ju
l 16
Oct
16
Jan
17A
pr 1
7Ju
l 17
Oct
17
0%20%40%60%80%
100%
Mar
15
Jun
15Se
p 15
Dec
15
Mar
16
Jun
16Se
p 16
Dec
16
Mar
17
Jun
17Se
p 17
Dec
17
0%20%40%60%80%
100%
ROAD-SIDE SIGN
Mar
15
Jun
15Se
p 15
Dec
15
Mar
16
Jun
16Se
p 16
Dec
16
Mar
17
Jun
17Se
p 17
Dec
17
0%20%40%60%80%
100%
Mar
15
Jun
15Se
p 15
Dec
15
Mar
16
Jun
16Se
p 16
Dec
16
Mar
17
Jun
17Se
p 17
Dec
17
0%20%40%60%80%
100%
Mar
15
Jun
15Se
p 15
Dec
15
Mar
16
Jun
16Se
p 16
Dec
16
Mar
17
Jun
17Se
p 17
Dec
17
100%
Jan
15A
pr 1
5Ju
l 15
Oct
15
Jan
16A
pr 1
6Ju
l 16
Oct
16
Jan
17A
pr 1
7Ju
l 17
Oct
17
0%20%40%60%80%
100%
SUPPLIES AVAILABLE
Mar
15
Jun
15Se
p 15
Dec
15
Mar
16
Jun
16Se
p 16
Dec
16
Mar
17
Jun
17Se
p 17
Dec
17
0%20%40%60%80%
100%M
ar 1
5Ju
n 15
Sep
15D
ec 1
5M
ar 1
6Ju
n 16
Sep
16D
ec 1
6M
ar 1
7Ju
n 17
Sep
17D
ec 1
7
0%20%40%60%80%
100%
DRINKING WATER AVAILABLEWORKING FANS
75%80%85%90%95%
Mar
15
Jun
15Se
p 15
Dec
15
Mar
16
Jun
16Se
p 16
Dec
16
Mar
17
Jun
17Se
p 17
Dec
17
0%20%40%60%80%
100%
Mar
15
Jun
15Se
p 15
Dec
15
Mar
16
Jun
16Se
p 16
Dec
16
Mar
17
Jun
17Se
p 17
Dec
17
100%
75%80%85%90%95%
Mar
15
Jun
15Se
p 15
Dec
15
Mar
16
Jun
16Se
p 16
Dec
16
Mar
17
Jun
17Se
p 17
Dec
17
0%20%40%60%80%
100%
Mar
15
Jun
15Se
p 15
Dec
15
Mar
16
Jun
16Se
p 16
Dec
16
Mar
17
Jun
17Se
p 17
Dec
17
100%
WHITEWASH CONDITIONSEPARATE FEMALE TOILET
75%80%85%90%95%
Mar
15
Jun
15Se
p 15
Dec
15
Mar
16
Jun
16Se
p 16
Dec
16
Mar
17
Jun
17Se
p 17
Dec
17
0%20%40%60%80%
100%
Mar
15
Jun
15Se
p 15
Dec
15
Mar
16
Jun
16Se
p 16
Dec
16
Mar
17
Jun
17Se
p 17
Dec
17
100%
LABOR ROOM CONDITION AVERAGE OUTLOOK SCORE
ADEQUATE LIGHTINGFACILITY SIGN
Source: MEA data
Jan
15A
pr 1
5Ju
l 15
Oct
15
Jan
16A
pr 1
6Ju
l 16
Oct
16
Jan
17A
pr 1
7Ju
l 17
Oct
17
0%20%40%60%80%
100%

22
These routines and the fast cycles of action and measurement led to rapid improvement in most indicators. Within months, medicine availability was 99%.51 Availability of contraceptives, basic equipment, electricity, drinking water, and a whole range of other supplies and inputs increased.52 Staff at-tendance was up, and vacant posts were being filled.53
Some indicators proved to be complicated. To meet the requirements of the new medicine-availability indicator, health facilities were required to have one month of stock available. However, in the first few months, as medicine availability increased, consumption doubled.54 Not only was more medicine being consumed, but the amount of stock required to be kept to meet needs increased. The vast amount of data now available meant relationships could be quickly understood, and the team built new models to help predict the effects of increased supply and accurately convey to districts the quantities they would need to supply to each facility.
Other indicators took a long time to improve. Medical officer posting, in particular, improved as the result of a set of initial actions, then plateaued at around 70%. The fundamentals of supply and demand in the market made it difficult to fill positions in the remaining third of facilities. Potential recruits perceived these facilities as dysfunctional, and the incentives to serve in rural areas were weak. The Department and the team began implementing a more long-term plan, changing incentives and improving conditions. The Health Secretary personally visited every medical school in the province to explain the changes being made, candidly answer questions and encourage young doctors to serve. New processes were introduced to better adver-tise vacancies and match potential candidates to suitable positions. By the end of 2017, 90% of posts were filled.55
Over time, the range of indicators expanded. An initial focus on inputs gave way to indicators on the condition of facilities. In 2017, the focus turned to the quality of care and patient satisfaction. The monitors started interview-ing 6,000 patients a month,56 ensuring they were getting good basic care and understanding what happened when they were treated in facilities. The quality of care slowly began to improve. Overall, the reforms transformed a system of failing clinics into one that consistently provides basic levels of care and has a system in place for future improvement.

23
Progress in all areas of the Roadmap was driven by routines. The routine of stocktakes with the Chief Minister in particular ensured a consistent focus on primary health during the first four years and provided a forum for setting direction and targets, checking progress, solving problems and increasing ac-countability.
Equally important were the monthly meetings of all 36 districts. On the first Sunday of every month, officials from all 36 districts travelled to Lahore to meet with the Secretary, Minister and provincial management teams. During each meeting progress was reviewd, top performers were congrat-ulated and officials invited to share with their colleagues the techniques and practices that they used to boost performance. With more than 1,000 years of experience between them, the collective wisdom of the group helped solve many problems and challenges as implementation progressed. At the same time, the meetings helped maintain focus and ensured a strong sense of accountability.
The routines, the capacity being built through the monthly meetings, the spread of knowledge about what works and the raised expectations formed the foundation for ensuring that the reforms were sustainable. As the sys-tem improved, the officials responsible for it collectively changed their ex-pectations of it.
For instance, previously, the lack of medicine had been accepted, by 2015, even a small dip in availability provoked concern and action. ‘We know we can do better than this’ the Secretary declared after several indicators dipped slightly from the previous month.
Routines

24
IMMUNIZATION PRIMARY FACILITIES SAFE DELIVERIES
Vac
cin
ato
r h
irin
g an
d m
anag
emen
t
Incr
easi
ng
cove
rage
Rea
chin
g ev
ery
com
mu
nit
y
Red
uci
ng
dro
po
ut
Staf
f po
stin
g
and
pre
sen
ce
Sup
plie
s, u
tilit
ies,
co
ntr
acep
tive
s
Fac
ility
qu
alit
y
24
/7 fa
cilit
y
rollo
ut
/ u
pgr
ades
Del
ivie
ries
(i
nc.
ver
ifica
tio
ns)
Fac
ility
fu
nct
ion
alit
y
Ref
erra
ls
Am
bu
lan
ce
serv
ice
May 14
Jun 14
Jul 14
Aug 14
Oct 14
Jan 15
Feb 15
Mar 15
Apr 15
May 15
Jul 15
Aug 15
Sep 15
Oct 15
Nov 15
Dec 15
Jan 16
Feb 16
Mar 16
Apr 16
May 16
Jun 16
Jul 16
Aug 16
Sep 16
Oct 16
Nov 16
Dec 16
Jan 17
Feb 17
Mar 17
Apr 17
May 17
Jun 17
Jul 17
Aug 17
Sep 17
FOCUS OF MONTHLY MEETINGS WITH DISTRICT OFFICIALS Major focus Minor focus
Source: Meetings with district officials

25
By late 2017, the health system in Punjab was improving rapidly. Each year, 300,000 more children were being born in the presence of medical pro-fessionals and almost one million additional children were being fully im-munised.57 Primary health facilities were being transformed, and parallel efforts were leading to substantial improvements in hospitals. All of these achievements were underpinned by improved management, new systems and routines, increased knowledge about what works, increased expecta-tions and reliable data.
At the same time, the transformation was incomplete. The Chief Minister and the Health Department continued to set new goals for improvement. Immu-nisation rates and skilled-birth attendance needed to increase further. While facilities were improving, there were gaps in the quality and effectiveness of care, and in some areas, access remained poor. Paradoxically, the rapid im-provements convinced many that the system needed to aim even higher. In early 2018, work began on a new and more ambitious phase of reforms.
The progress in Punjab began to be used as a model for others. In Pakistan, two other provinces – Baluchistan and Khyber Pakhtunkhwa – launched similar efforts modelled on the Punjab experience, which were already demonstrating success by the end of 2017. A number of other countries were beginning to launch new efforts based on the Punjab experience. Beyond learning from the specific interventions and systems which led to progress in Punjab, they embodied three more general lessons.
First, that big fast reforms are often easier to implement than small slow ones. The ambition and speed of the changes in Punjab energised and excited ev-eryone involved. The pace of weekly meetings created a sense of urgency and immediacy. The visible changes occurring week on week encouraged people to put in the hours and hard work necessary to improve the system. Meetings occurred long into the evening and often past midnight as officials and the Roadmap team grappled with the challenges of improving the system. The momentum encouraged everyone to aim higher. None of the changes would have been possible if the system had settled for a less ambitious set of goals over a longer time period.
Second, that implementation matters more than strategy and planning. None of the plans produced over the course of the Roadmap survived more than a few months. The system was learning so much so quickly about what worked, that the plans had to be constantly rewritten to incorporate the latest insights about solutions and challenges. Instead of long meetings and discussions to debate what might work or could be done, the system focused on learning about what did work and getting it done. A more tra-ditional approach of diagnostic analysis and planning could never have de-livered the same result.
Impact
26
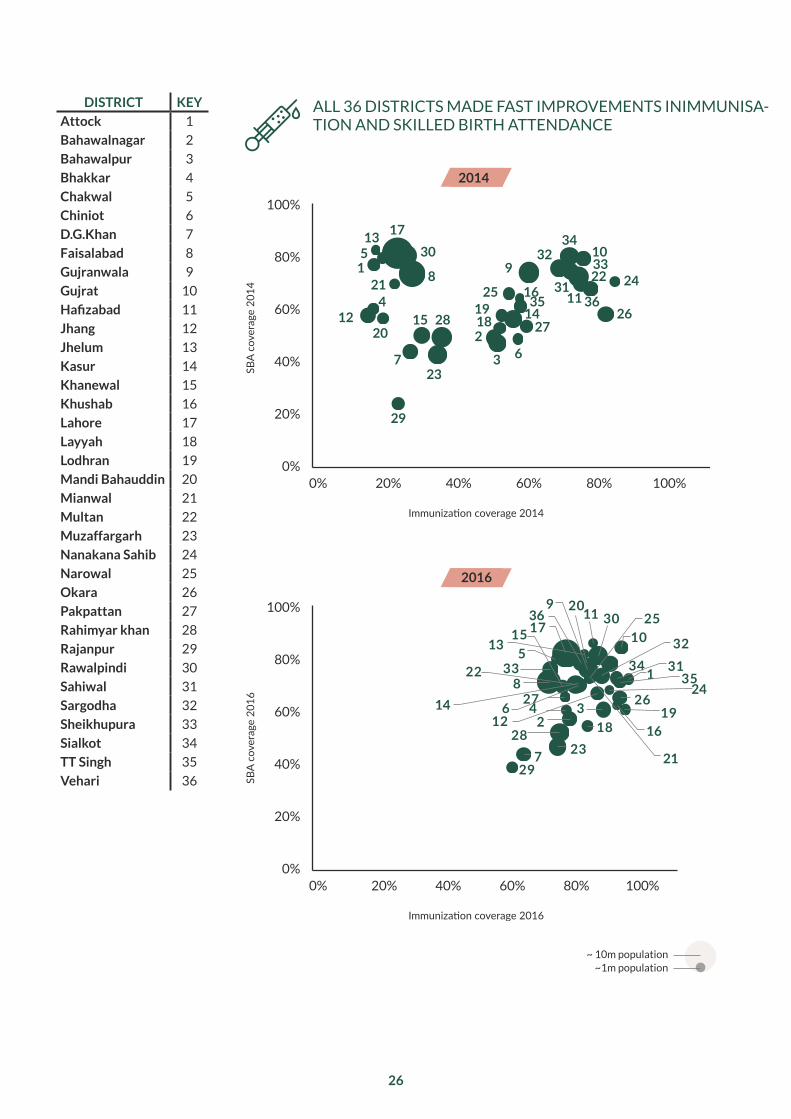
DISTRICT KEY
Attock 1
Bahawalnagar 2
Bahawalpur 3
Bhakkar 4
Chakwal 5
Chiniot 6
D.G.Khan 7
Faisalabad 8
Gujranwala 9
Gujrat 10
Hafizabad 11
Jhang 12
Jhelum 13
Kasur 14
Khanewal 15
Khushab 16
Lahore 17
Layyah 18
Lodhran 19
Mandi Bahauddin 20
Mianwal 21
Multan 22
Muzaffargarh 23
Nanakana Sahib 24
Narowal 25
Okara 26
Pakpattan 27
Rahimyar khan 28
Rajanpur 29
Rawalpindi 30
Sahiwal 31
Sargodha 32
Sheikhupura 33
Sialkot 34
TT Singh 35
Vehari 36
ALL 36 DISTRICTS MADE FAST IMPROVEMENTS INIMMUNISA-TION AND SKILLED BIRTH ATTENDANCE
2014
2016
SBA
cove
rage
201
4SB
A co
vera
ge 2
016
Immunization coverage 2014
0%
20%
40%
60%
80%
100%
0% 20% 40% 60% 80% 100%
1
2
3
4
5
67
8 910
12
13
1415
16
17
1819
2028
21 2211
23
2425
2627
29
30
31
3233
34
35 36
0%
20%
40%
60%
80%
100%
0% 20% 40% 60% 80% 100%
Immunization coverage 2016
1
234
513
14
7
8
9
10
126
15
16
1736
1819
2011
21
22
23
24
25
2627
28
29
30
3132
33 3435

27
Finally, strong support from political leaders and other stakeholders was critical, but it had to be earned and re-earned. The Roadmap process ul-timately had fantastic support from the Chief Minister, the senior poli-ticians and officials, and most of the international donors. That support was as much a result of the success of the Roadmap as it was an input to it. Early sceptics became supporters as they saw the process begin to work and deliver results. The widening and deepening of support ultimately be-came the biggest guarantee that the results would be sustained.

28
Credits
The Roadmap involved tens of thousands of people. The real work of im-proving the health system was done by a huge workforce of frontline health workers who vaccinated children, delivered babies, and provided frontline care in difficult settings. The credit for the success of the Roadmap goes primarily to them.
The Roadmap was a government-led effort. The Chief Minister personal-ly led implementation throughout. The Health Secretaries, particularly Ali Jan Khan and Jawad Rafique, led the day-to-day work of implementation. Both were exceptional in their dedication to improving the health system and their effectiveness in doing so. The Chief Minister’s Advisor on Health, Khawaja Salman Rafique and the Minister of Health, Khawaja Imran Na-zeer, were constantly engaged. A large number of officials in the Health Department made huge contributions. Among them, Dr Munir Ahmed led the immunisation program for the whole duration of the Roadmap and was responsible for some of the largest gains.
Many other parts of the government supported the Roadmap, particular-ly the Chief Secretary, the Finance Department and the Planning and De-velopment Department. The Punjab Information Technology Board, led by Dr Umar Saif, played a role in almost every aspect of the Roadmap provid-ing the technology to drive many of the reforms. The Special Monitoring Unit, led first by Aizaz Akhtar and then by Fatima Zaidi, were key players throughout and successfully replicated the Roadmap approach in a number of other areas.
The Roadmap was supported by the United Kingdom’s Department for In-ternational Development (DFID) as part of a larger assistance program to Pakistan. Many DFID officials were deeply and personally involved in work. Sir Michael Barber, initially in his role as DFID Special Representative in Pa-kistan, advised the Chief Minister, DFID, and the Roadmap team through-out and was present at every stocktake guiding the proceedings and key decisions. His work to establish the Roadmap process in education was the foundation for the Health Roadmap.
Finally, much of the day-to-day work was undertaken by a small Roadmap team of dedicated young consultants from Acasus who worked day and night to support the government in implementation. Their dedication and hard work through four long years of reform was the catalyst for transfor-mation as a whole.

29
About Acasus
Acasus is a consultancy dedicated to helping governments implement transformational reforms in health and education. We provide small teams of talented individuals who work alongside government officials to help them implement ambitious reforms in health and education systems. Our teams consist of consultants, sector experts, software engineers and de-signers who deliver results by combining intensive management support, innovative mobile applications, solid data, and regular engagement with se-nior politicians and officials.
More information is available at www.acasus.com

30
1 Nielsen Survey, December 2014; Punjab Health Survey (PHS) November 2016/17; Punjab Bureau of Statistics (PBS), 2017
2 Ibid.3 Ibid.4 Data from the Independent Monitoring Team (Government of Punjab)5 Nielsen Survey, December 2014; PHS, November 2016/176 PBS, 20177 Pakistan Demographic Health Survey (PDHS), 2012-20138 India Rural Development Statistics, 20099 Bangladesh Maternal Mortality and Health Care Survey, 201010 Population Council, 2013 (WHO estimates)11 PDHS 1990-91, PDHS, 2012-1312 PDHS, 2012-1313 Ibid. 14 World Health Organisation, Expanded Programme on Immunisation15 PDHS, 1995-616 PDHS, 2012-1317 Nielsen Survey, December 2014 18 Rural Health Centres and Basic Health Units (Government of Punjab) 19 MICS, 2011; PDHS, 2012-13; UNICEF CES, 2009; World Bank20 Nielsen Survey, December 2014; India SRS, 201221 India Rural Development Statistics, 2009; Punjab MICS, 201122 Roadmap team analysis, Acasus 23 EVACCS data24 Ibid.25 Nielsen Survey, December 2014; PHS, November 2016/1726 MICS, 2014; PBS, 201727 Nielson Survey, December 2014; Data from the Independent Monitoring Team
(Government of Punjab)28 MICS, 2014 29 PDHS, 2012-1330 MEA Data on Knockdown Criteria (October 2016, June 2017 and July 2017)31 Annual Report, Chief Minister’s Health Initiative for Attainment
and Realisation of MDGs, 201132 Data from the Independent Monitoring Team (Government of Punjab)33 EVACCS data 34 MEA data on Knockdown Criteria (October 2016, June 2017 and July 2017)35 Ibid.36 Roadmap team analysis, Acasus37 Ibid.38 Office for National Statistics, Births in England and Wales, 2016 39 PHS, 2016/2017 40 Ibid.41 Ibid.42 Roadmap team EVACCS analysis, Acasus43 IRMNCH & Nutrition Programme, regional Ambulance Service data, 201744 Ibid.45 Ibid.46 Ibid.47 Data from the Independent Monitoring Team (Government of Punjab)

31
48 Ibid.49 Ibid.50 IPOR independent evaluation51 Data from the Independent Monitoring Team (Government of Punjab)52 Ibid.53 Ibid.54 Ibid.55 Ibid.56 Ibid.57 PHS, 2017

32
Working together to improve public health and education for those who need it the most
By:
Fenton WhelanApril 2018