Embed Size (px)
Citation preview

Setter Capital Volume Report 1
Volume Report H1 2016
First In the Secondary Market.

Setter Capital Volume Report 2
Highlights
The Setter Capital Volume Report analyzes global secondary
market activity in H1 2016 and covers the following topics:
› Total Volume of Secondary Deals
› Secondary Volume H1 2016 vs. H1 2015
› Breakdown of Volume between Funds and Directs
› Breakdown of Volume by Type of Assets Purchased
› Breakdown of Volume by Geography of Assets Purchased
› Profile of Buyers
› Number of Deals and Average Deal Size
› Buyers’ Scope of Interest
› Profile of Sellers
› Percentage of Intermediated Deals
› Predicted Secondary Deal Volume for 2016
› Changes in the Level of Competition
› Changes in Debt Levels
› Expected Returns of Secondary Purchases
› Expected Distribution and NAV Changes in 2016
› General Partners’ Approach to the Secondary Market

Setter Capital Volume Report 3
The survey
As the secondary market continues to grow and evolve, we seek to
take a comprehensive and methodical approach to quantifying the
market and identifying trends. Using a survey approach, we asked
principals directly the same questions that buyers, sellers, agents
and secondary fund LPs often ask us. How much was completed
in H1 2016? How much was completed in LBO, venture, real estate,
infrastructure and hedge fund secondaries? What are the expected
returns and debt levels?
This report summarizes the results of our survey of the most active
buyers in the secondary market for alternative investment funds
conducted early July 2016. Volume is defined as total exposure
(NAV + unfunded in USD) purchased by the respondents, including
only deals where a binding agreement was entered into during
H1 2016.
We were pleased by the high response rate – of the 119 most active
and regular buyers in the secondary market, 83 agreed to share
their confidential results (see partial list of participants). Given the
high response rate and the fact that nine of the ten largest buyers
participated, the respondents to our survey represented 84.9% of the
transaction volume, making it the most reliable and detailed study
of the industry’s activities.
Being mindful of response bias, we compared the list of respondents
to those who had declined to respond, and did not find any meaningful
or obvious differences in the known and observed levels of activity
between the two groups. We then estimated and charted the total
volume, number of transactions, and other reported figures herein
by prorating the survey results based on the proportion of small,
medium and large buyers that participated.
We hope you find the results interesting and useful. We welcome
any questions and would be happy to provide further insights into
the results.

Setter Capital Volume Report 4
H1 2016 in review
After several years of breakneck growth, the secondary market took
a pause as the total volume of completed transactions decreased to
USD 18.6 billion in H1 2016, from USD 20.6 billion recorded in the
Setter Capital Volume Report H1 2015.
Although volume was down, the experience across different sectors
was far from uniform. The private equity secondary market (funds and
directs) decreased 7.3% year over year, to a total of $15.3 billion. Real
estate secondaries experienced the largest drop falling 36.7% to $1.8
billion and hedge fund secondaries were down 13.1% as side pocket
supply continued to evaporate. Energy fund secondaries were down
slightly from $350 million in H1 2015 to $335 million in H1 2016 as low
energy prices kept the ‘bids’ meaningfully apart from the ‘asks’. Some
noteworthy bright spots included infrastructure fund secondaries which
increased 40% ($614 million in H1 2015 to $860 million in H1 2016)
and venture fund secondaries which increased 55% ($773 million in
H1 2015 to $1.2 billion in H1 2016).
While traditional fund secondaries were down 18% from $15.3 billion
in H1 2015 to 12.5 billion in H1 2016, ‘direct secondaries’ acted as a
counterbalance, increasing 10.9% to $6.1 billion (private equity directs
were $5.3 billion and real estate directs were $800 million). Indeed,
49.3% of the survey respondents felt that more GPs attempted to
liquidate or restructure older funds in H1 2016 compared
to H1 2015 and 18.6% of respondents felt that a materially higher
number of GPs had sought staples in H1 2016 as compared to
H1 2015.
While the breadth and number of buyers continued to increase, the
most significant activity was driven by the large buyers in the market.
The ten largest buyers, defined as those that deployed more than $600
million in H1 2016, accounted for 57.1% of the market’s total volume
(up from their 49% share in H1 2015), while 32 mid-sized buyers
accounted for roughly 31.7% (vs. 35.2% in H1 2015) and 76 small
buyers represented roughly 11.1% (vs. 15.8% in H1 2015). From a
dollar perspective, small buyers had the most challenging first half with
their total purchases down 35% from $3.25 billion in H1 2015 to $2.1
billion in H1 2016. Buyers continued to diversify their secondary focus
with about 15% of participants buying other alternative investment
types for the first time (infrastructure, real estate, etc.).

Setter Capital Volume Report 5
Buyer competition for deals continued to heat up in H1 2016 as noted
by 95% of respondents who felt it was either similar or higher than last year. As a means to stay competitive, the use of debt to improve pricing and deal returns became even more prevalent as 15% of
respondents felt that buyers had used significantly more leverage in
H1 2016 as compared to the prior year.
Surprisingly, the level of intermediation decreased from 65.6% in H1
2015 to 56.2% of total secondary volume ($10.5 billion) in H1 2016.
This dip aside, we expect the level of intermediation to continue to rise
in response to the entrance of new agents and as sellers struggle to
stay on top of the ever growing buyer universe.
There were a total of 523 transactions in H1 2016, with an average
size of approximately $35.6 million. Although, the number of
transactions was down from the 586 transactions completed in H1
2015, the average deal size increased 1.4% year over year.
The ranks of opportunistic sellers continued to grow, given investors’
increasing familiarity and comfort with secondary sales along with the
disappearance of the stigma associated with selling. Although
pensions (34.5%) were the most active sellers in H1 2016, managers
of funds across buyout, VC, hedge funds, fund of funds and secondary
funds accounted for 28.9% of all sellers, as they continued to use the
market to drive liquidity in their funds. Looking forward, most buyers
expect pensions to be the most active sellers in H2 2016.
From a geographical perspective, North American sellers accounted
for the largest proportion of volume (55.7%) in H1 2016 selling $10.2
billion (vs. 54.2% in H1 2015), whereas Western European sellers sold
$5.7 billion (30.7% vs. 28.8% in H1 2015) and Asia-Pacific sellers
accounted for much of the balance.
Buyers, whose expertise is modeling near and midterm fund
performance, estimated NAV valuations would decrease 4% in H2
2016, while the pace of distributions would be flat. These forecasts are
less optimistic than those in the Setter Capital Volume Report H1
2015, where buyers expected distributions to be 0.38% higher and
NAV valuations to appreciate by 1.65%.
Looking forward, buyers expect full year 2016 volume to be $39.7
billion, which would be down 20% from the $49.6 billion transacted in
2015. This is much more pessimistic than what buyers expected in H1
2015 (Setter Capital Volume Report FY H1 2015), where they
expected the growth rate to be 14.5% in the coming year.

Setter Capital Volume Report 6
Information Advantage.
In the secondary market, knowledge is power. By providing granular custom portfolio analysis and
industry-leading market research, we empower our clients to make the most informed decisions.

Setter Capital Volume Report 7
Total volume
Total secondary market volume for H1 2016 was $18.6 billion. This is the volume estimate of the 119 secondary
buyers with dedicated secondary efforts and includes 67 secondary funds, 37 funds of funds, 8 hedge funds, 5
investment consultants, and 2 pensions. We believe this estimate is reliable as the 83 survey respondents
alone reported $15.8 billion in volume in their survey responses. The figure is also conservative, as it does not
include the activity of over 1000 opportunistic and non-traditional buyers, whose combined activity may be
significant. For instance, the activities of all sovereign funds (including ADIA, ADIC, GIC, Temasek, etc.) were
excluded entirely, even though some have built teams dedicated to secondary purchases.
Types of assets purchased Private Equity (Directs
1 & Funds): $15.3 billion
(7.3% decrease YoY) Real Estate (Directs & Funds): $1.8 billion (36.7% decrease YoY) Hedge Funds: $410 million (13.1% decrease YoY) Infrastructure Funds: $860 million (40.0% increase YoY) Agri/Timber Funds: $224 million (1.5% decrease YoY)
Directs include fund recapitalizations and restructurings, fund liquidations, and purchase of single minority stakes and co-investments.
H1 2016 volume vs. H1 2015 volume
H1 2016 volume decreased 9.7% compared to H1
2015, which was roughly $20.6 billion.
41.8% of survey respondents felt volume was similar to
H1 2015, while 43.6% said it was significantly higher and
14.6% felt it was significantly lower, showing buyers’ had
mixed success in H1 2016.
02,0004,0006,0008,000
10,00012,00014,00016,00018,000
Higher
Similar
Lower

Setter Capital Volume Report 8
Assets purchased
Funds vs. Directs
In H1 2016, $12.5 billion of funds (67.2%) and
$6.1 billion of directs (32.8%) were purchased.
Secondaries of direct investments1 increased from $5.5
billion in H1 2015 to $6.1 billion in H1 2016, which
represents a 10.9% increase. Private equity directs and
real estate directs accounted for 87% and 13% respectively
of the total directs volume.
Survey respondents estimated that the split between fund
and direct secondaries in 3 years would be 72% funds and
28% directs.
1 Secondaries of direct investments includes GP restructurings and purchases of single minority stakes and co-investments.
Breakdown of fund secondaries
Private equity fund purchases totaled $9.99 billion (13.9% decrease YoY) Real estate fund purchases totaled $1.04 billion (54.8% decrease YoY)
Hedge fund purchases totaled $410 million (13.1% decrease YoY) Infrastructure fund purchases totaled $860 million (40% increase YoY)
Agri/Timber fund purchases totaled $224 million (1.5% decrease YoY)
0
2,000
4,000
6,000
8,000
10,000
12,000
Total Funds by $ Volume
Total Directs by $ Volume

Setter Capital Volume Report 9
Types of funds purchased
Private Equity Funds
LBO – $7.8 billion (Down 17.9% YoY from $9.5 billion)
VC – $1.2 billion (Up 55.2% YoY from $773.3 million) Mezzanine – $557 million (Down 15.9% YoY from $662.3 million) Fund of Funds – $161 million (Down 44.3% YoY from $289.2 million) Energy – $335 million (Down 4.2% YoY from $349.7 million)
Real Estate Funds
Core – $314 million (Down 34.8% YoY from $481.7 million) Value-Add – $338 million (Down 52.4% YoY from $709.7 million) Opportunity – $384 million (Down 65.1% YoY from $1.1 billion)
Hedge Funds Purchased
Side Pockets – $393 million (Up 9.05% YoY from $360.4 million) Main Funds – $16 million (Down 85.6% YoY from $111.3 million)
78%
12%
5% 2% 3%
LBO
VC
Mezz
30%
33%
37% Core
Value-Add
Opportunity
4%
96%
Main Funds
Side Pocket

Setter Capital Volume Report 10
Geography of assets purchased
North American and Western European focused
funds/directs accounted for the vast majority of
assets purchased in H1 2016:
North America – $10.2 billion
(Down 17.7% YoY from $12.4 billion)
Western Europe - $4.8 billion
(Down 7.7% YoY from $5.2 billion)
Global – $2.4 billion
(Up 322% YoY from $.7 billion)
Asia-Pacific – $922 million
(Down 45.8% YoY from $1.7 billion)
In terms of percentage, North America focused funds and
direct investments accounted for 54.7% of total volume,
Western European assets accounted for
25.6% and global focused funds/directs accounted
for 12.9% of sales.
5%
55%
26%
1%
0.22%
0.12% 13%
Asia – Pacific North America
Western Europe CEE and Russia
MENA - Africa Latin America
Global
0.00
2000.00
4000.00
6000.00
8000.00
10000.00
12000.00

Setter Capital Volume Report 11
Profiles of buyers
Type of buyers
Secondary funds were the most active buyers in H1
2016, accounting for 82.2% ($15.3 billion) of total
purchases, while funds of funds accounted for 13.1%
($2.4 billion), and pensions accounted for 0.9% ($162
million).
Please note: over 1,000 non-traditional buyers were
not included in our survey and the resulting
estimates.
Location of buyers1
North American buyers transacted the most (60% of
total volume) in H1 2016, up from
59.1% of total volume in H1 2015.
European buyers accounted for 38.1% of total
volume in H1 2016, which was lower than H1 2015
(40.4%).
1 Location is based on head office location.
82%
3%
13%
1% 1%
Secondary Funds
Hedge Sec/FoFs
Funds of Funds
Inv. Consultants
Pensions
60.0%
38.1%
1.7% 0.2%
N.America
Europe
Asia
Other

Setter Capital Volume Report 12
Activity levels of small, medium and large buyers
Applying the survey respondents’ dollar volume and transaction numbers, while taking into consideration the
proportion of small, medium and large buyers that did not participate, we estimated the market share of small,
medium and large buyers as follows:
11 large buyers (defined as those that deployed $600 million or more in H1 2016) purchased $10.6 billion,
representing approximately 57.1% of total volume across 104 transactions with an average deal size of $102.9 million.
This was an increase from H1 2015, where large buyers accounted for 49.0%.
32 medium sized buyers (defined as those that deployed $100 to $599.9 million in H1 2016) purchased $5.9 billion,
representing approximately 31.7% of total volume across 171 transactions with an average deal size of $34.5 million.
This was a slight decrease from H1 2015, where they accounted for 35.2%.
76 small buyers (defined as those that deployed less than $100 million in H1 2016) purchased $2.1 billion,
representing approximately 11.1% of total volume across 248 transactions with an average deal size of $8.3 million.
This was a decrease from H1 2015, where they accounted for 15.8% of total volume.
0
500
1000
1500
2000
2500
3000
3500
4000
4500
5000
Vo
lum
e in
$M
M
Buyers Grouped by Their Volume $MM
0
2
4
6
8
10
12
14
16
Av.
Nu
mb
er o
f Tr
an
sact
ion
s
Buyers Grouped by Their Volume $MM
Volume distribution by size of buyer

Setter Capital Volume Report 13
Number of deals and average size deal
Respondents completed approximately 443 secondary deals in H1 2016, from which we extrapolated an estimate of
523 transactions across the entire secondary market for alternative assets, with an average size of approximately
$35.6 million. The number of transactions decreased 10.7% from 586 transactions in H1 2015 and the average deal
size increased 1.4% from $35.1 million in H1 2015.
Average deal size by size of buyer
0
50
100
150
200
250
300
350
400

Setter Capital Volume Report 14
Buyers’ scope of interest
Buyers that broadened their focus in H1 2016
Approximately 14.7% of participants broadened their
secondary focus in H1 2016 to include buying other
alternative investment types (e.g. infrastructure,
real estate, portfolios of directs, etc.).
Buyers that intend to broaden their focus in H2 2016
Coincidently, the same percentage of participants
(14.7%) plan to broaden their secondary focus in H2
2016 to include buying other alternative investment
types. This percentage represents a 32% decrease from
buyer’s expectations in H1 2015. This may represent a
levelling off of buyers diversifying their secondary
strategies.
15%
85%
Broadened Scope Did Not Broaden Scope
15%
85%
Broadened Scope Did Not Broaden Scope

Setter Capital Volume Report 15
Leverage and returns
Level of debt used by buyers in H1 2016 vs. H1 2015
15.3% of respondents believed the level of debt
used by buyers had increased significantly in H1 2016.
84.7% felt it was the same and no respondents felt
it was less.
Expected multiple for secondary deals completed in H1 2016
Respondents predicted that the average gross multiple
for secondary deals completed in H1 2016 would be
1.39x, which was slightly down from the 1.43x buyers
expected in H1 2015.
15%
85%
Higher Similar Lower
0
5
10
15
20
25
30

Setter Capital Volume Report 16
Seller profiles
Type of sellers in H1 2016
Pensions were the most active sellers in H1 2016 making up 34.5% of volume respectively. Most buyers expect pensions to be the biggest sellers again in H2 2016, with the remaining volume coming somewhat evenly from banks, funds of funds, secondary funds and sovereign funds.
Expected sellers in H2 2016
14%
6%
36% 10%
5%
6%
13%
1% 6%
3%
Banks Insurance Companies
Pensions Sovereign Funds
Family Offices Endowments / Charities
Fund of Funds / Secondary Funds Hedge Funds / Hedge Fund of Funds
Other Fund GPS (non FoF or Sec Funds) Corporate - Balance Sheet (non-financial)
13%
1%
35%
1% 17%
4%
11%
0%
17%
1%

Setter Capital Volume Report 17
Seller location
Geography of sellers
In terms of the location of sellers, North American and Western European sellers accounted for the vast majority of
volume in H1 2016. North American sellers sold $10.4 billion (55.7% vs. 54.2% in H1 2015), whereas Western
European sellers sold $5.7 billion (30.7% vs. 28.8% in H1 2015). Asia-Pacific sellers accounted for 9.8% of the total
volume down from 13.3% in H1 2015.
10%
55%
31%
1% 3%
Asia – Pacific
North America
Western Europe
CEE and Russia
MENA - Africa
Latin America
0
2000
4000
6000
8000
10000
12000

Setter Capital Volume Report 18
Intermediation and level of competition
Volume of intermediated transactions
Approximately 56.2% ($10.5 billion) of total
secondary volume involved an intermediary,
on either the buy or sell-side, as compared to
65.6% in H1 2015.
In terms of volume, agents intermediated
$3 billion less in deals, a decrease of
22.2% over H1 2015.
Buyer competition for deals in H1 2016 vs. H1 2015
73.1% of respondents felt buyer competition in H1 2016
was similar to H1 2015, while 21.8% felt buyer competition
in H1 2016 was significantly higher. Only 5.1% felt buyer
competition was lower in H1 2016.
22%
73%
5%
Higher Similar Lower
56%
44%
Total Volume Involving Intermediary
Total Volume Not Involving Intermediary

Setter Capital Volume Report 19
Projected volume for H2 2016
How H2 2016 volume will compare to H1 2016
78.4% of respondents felt that H2 2016 volume will be
similar to that of H1 2016, 15.18% of respondents felt that
it will be significantly higher and 6.4% felt that it will be
significantly lower. Given that H2 volume is usually
much higher than H1, this suggests buyers are less
optimistic about the second half.
Predicted volume for H2 2016
Respondents predicted total volume for 2016 to be
$39.7 billion, which would represent a 20% decrease
from the $49.6 billion transacted in 2015. Assuming
proportions do not change in 2016, this suggests private
equity volume will be $32.5 billion in 2016, real estate will
be $3.9 billion, hedge funds will be $0.87 billion,
infrastructure will be $1.8 billion and agriculture & timber
will be $0.48 billion.
15%
78%
7%
Higher Similar Lower
0
2000
4000
6000
8000
10000
12000

Setter Capital Volume Report 20
Expected distribution and NAV changes in H2 2016
Distribution Pace in H2 2016 vs. H1 2016
Most respondents expect the pace of distributions in H2
2016 to be the same as H1 2016.
On average, respondents expect the pace of
distributions to not change in H2 2016.
Respondents were more pessimistic than they were in
H1 2015, when they expected the pace of distributions
to be 0.38% higher.
Change in NAV in H2 2016 vs. H1 2016
On average respondents expect NAV valuations to
decrease 4% in H2 2016 compared to H1 2016.
Respondents were more pessimistic than they were in
H1 2015, when they expected the NAVs to increase by
1.62% in H2.
0
5
10
15
20
25
30
0
5
10
15
20
25
30
Setter Capital Volume Report 21
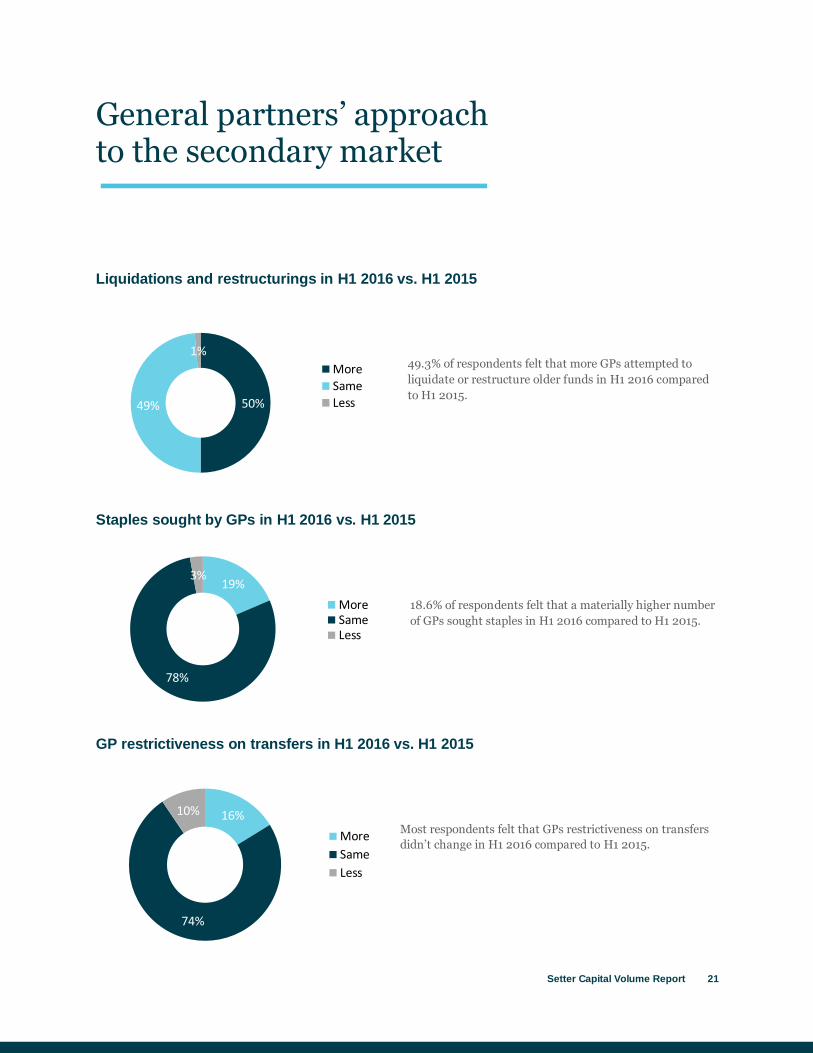
General partners’ approach to the secondary market
Liquidations and restructurings in H1 2016 vs. H1 2015
49.3% of respondents felt that more GPs attempted to
liquidate or restructure older funds in H1 2016 compared
to H1 2015.
Staples sought by GPs in H1 2016 vs. H1 2015
18.6% of respondents felt that a materially higher number
of GPs sought staples in H1 2016 compared to H1 2015.
GP restrictiveness on transfers in H1 2016 vs. H1 2015
Most respondents felt that GPs restrictiveness on transfers
didn’t change in H1 2016 compared to H1 2015.
50% 49%
1%
More
Same
Less
19%
78%
3%
MoreSameLess
16%
74%
10%
More
Same
Less

Setter Capital Volume Report 22
Select respondents
ACG Capital
Adams Street Partners
Adveq
AGC Equity Partners
Alpinvest
Arcano Group
Argentum
BEX Capital
Canada Pension Plan Investment Board
Capital Dynamics
Central Park Group
Cipio Partners
Coller Capital
Commonfund Capital
Corbin Capital Partners
Dakota Capital
DB Private Equity
Fondinvest
50South Capital
Golding Capital Partners
Greenspring Associates
Hamilton Lane Advisors
HarbourVest Partners
Headlands Capital
Hollyport Capital
HQ Capital
ICG Strategic Secondaries
Idinvest
Israel Secondary Funds
Jasper Ridge
International Woodland Company (IWC)
Klinehill Partners
Landmark Partners
LGT Capital Partners
Lothian Pension Fund
Neuberger Berman
NewGlobe Capital
NewQuest Capital Partners
North Sky Capital
Northleaf Capital
Pantheon
Partners Group
Permal
Pictet Alternative Advisors SA
PineBridge Investments
Pomona Capital
Portfolio Advisors
Private Advisors
Private Equity Investors – PEI Funds
RCP Advisors
ROC Partners
17Capital
SL Capital Partners
Stafford Capital Partners
Stepstone
Strategic Partners Fund Solutions
Sturbridge Capital
Top Tier Capital Partners
TR Capital
Tyrus Capital
UBS Global Asset Management
Unigestion
Vintage Ventures
Vision Capital
Willowridge Partners

Setter Capital Volume Report 23
About Setter
Established in 2006, Setter Capital is a leading independent
advisory firm specializing in providing liquidity solutions for
fund managers and institutional investors in the secondary
market for alternative investments. We serve a diverse
institutional client base including some of the world’s largest
pensions, endowments, investment consultants and fund
managers. To date, Setter Capital has completed over 400
transactions, representing more than $20 billion in liquidity
across venture capital, private equity, infrastructure, real estate,
real asset, and hedge fund investments.
Setter Capital’s mission is to make the secondary market
more transparent and efficient for all market participants.
To this end, Setter provides the market with complimentary
secondary market research and analytical tools such as:
The Setter Liquidity RatingTM
A unique rating system
that allows buyers, sellers and creditors to assess the
relative liquidity of over 7000 different fund families.
The Setter Volume ReportTM
and the Setter Price ReportTM
Two semi-annual reports that provide the most comprehensive
and accurate assessments of the secondary market. Data is
based on pricing of over 2000 funds and a survey of over two
thirds of the most active secondary buyers globally.
SecondaryLink.comTM
A professional network where
over 4000 institutional LPs and GPs connect on primary
due diligence and the secondary market.
Setter Capital Inc.
77 Bloor Street West, Ste 1220
Toronto, ON Canada M5S 1M2
+1 416 964 9555 Phone
+1 416 964 0699 Fax
settercapital.com