Embed Size (px)
Citation preview

SEtSim: A Modular Simulation Tool for Switched
Ethernet Networks
Mohammad Ashjaei, Moris Behnam, Thomas Nolte
Malardalen Real-Time Research Center (MRTC), Malardalen University, Vasteras,Sweden
P.O. Box 883, SE-721 23 Vasteras, Sweden
E-mail address: [email protected]
Corresponding author. Tel.:+46 21 101772; Fax:+46 21 103110
Abstract
Using high bandwidth network technologies in real-time applications, for ex-ample in automotive systems, is rapidly increasing. In this context, switchedEthernet-based protocols are becoming more popular due to their featuressuch as providing a collision-free domain for transmission of messages. More-over, switched Ethernet is a mature technology. Several protocols based onswitched Ethernet have been proposed over the years, tuned for time criticalapplications. However, research for improving the features and performanceof these protocols is still on-going. In order to evaluate the performanceof early stage proposed protocols, the mathematical analysis and/or experi-ments are required. However, performing an experiment for complex networktopologies with a large set of messages is not effortless. Therefore, using asimulation based approach for evaluating a protocol’s performance and/orproperties is highly useful. As a response to this we have developed a simu-lator, called SEtSim, for switched Ethernet networks. SEtSim is developedbased on Simulink, and it currently supports different network topologies ofthe FTT-SE protocol as well as Ethernet AVB protocol. However, the ker-nel of SEtSim is designed such that it is possible to add and integrate otherswitched Ethernet-based protocols. In this paper, we describe the design ofSEtSim and we show its scalability.
Keywords: Switched Ethernet, Real-Time Networks, Simulation,Evaluation, Simulink, FTT-SE Protocol, Ethernet AVB
Preprint submitted to Systems Architecture June 25, 2015
1. Introduction
Recently, there has been a growing interest in using Switched Ethernet forhard real-time distributed systems as it provides means to improve the globalthroughput of time-critical message transmissions compared with other real-time network technologies. Switched Ethernet provides traffic isolation andit eliminates the impact of the non-determinism due to the CSMA/CD ar-bitration, that the original Ethernet was suffering from. Nevertheless, us-ing Commercial Off-The-Shelf (COTS) switches in time-critical applicationsis not adequate as it has the following limitations: (i) the queues insidethe COTS switches are limited in size and may overflow due to an uncon-trolled packet arrival, which may lead to drop of some packets, and (ii) COTSswitches typically have FIFO queues, that can generate long blocking timesfor urgent packets. Normally, this problem can be solved using separatedVLANs for different priorities, however the number of priority levels still islimited to the number of parallel FIFO queues for each port.
There have been many works addressing the adequacy of switched Eth-ernet for real-time communication. Many solutions that have been proposedare using enhanced switches such as EtheReal [1] and the EDF ScheduledSwitch [2], both reserving a channel for traffic transmission. In addition, re-cent technologies optimized for quick forwarding have been proposed, such asEthernet AVB (Audio and Video Bridging) that has gained some momentumin the automotive industry.
Moreover, Avionics Full Duplex Switched Ethernet (AFDX) [3] is devel-oped as a network specification with enhanced forwarding which, unlike theEthernet AVB protocol, does not rely on a clock synchronization protocol.AFDX has been used mostly in avionics.
Despite the performance improvements offered by using these enhancedswitches, their usage result in a high cost and a lower availability comparedto COTS switches. Therefore, other protocols have been developed basedon overlay protocols that control the traffic loaded to COTS switches. Inthis context, Ethernet POWERLINK [4] and the FTT-SE protocol [5], bothusing a master-slave technique, were proposed.
In order to evaluate the performance of different switched Ethernet proto-cols mathematical analysis and/or experiments can be conducted. However,performing experiments for large scale network topologies, potentially withcomplex message sets, is not straightforward. Therefore, an approach basedon simulation is more effective in particular for the early stages of a protocol.
2

1.1. Goal of the tool
In this paper we present a modular simulation tool, which is called SEt-Sim1 (Switched Ethernet Simulator), that can be used to simulate Real-Time Ethernet (RTE) protocols. SEtSim is based on Simulink which makesit modular and allows us to create models of different components, e.g., nodesand switches. Moreover, it can be used for evaluation of real-time controlnetworks, where control nodes exist in the architecture. Using Simulink, asthe developing environment, makes the tool possible to use different alreadyimplemented control blocks as well as other Matlab toolboxes. Currently,SEtSim is designed and developed to support different architectures of theFTT-SE protocol and the Ethernet AVB protocol. However, once the coreis implemented it is easy to extend the simulator with other RTE protocols.Design decisions for developing the tool have been made according to thegoals of the simulator. The main goals of SEtSim are listed bellow.
1. Real-time control applications: the ultimate goal for the tool is to eval-uate distributed systems consisting of network components and nodes.Moreover, control applications, resource reservation and resource adap-tation are the applications we would like to deal with using the tool.Therefore, the environment where the tool is developed should supportcontrol functionalities and implementation space for different dunctionsin nodes, such as schedulers and control tasks.
2. Ability to connect to the world outside the simulation: it would behelpful for the researchers to evaluate newly developed protocols par-tially with hardware experiments. For instance, a simulation modelcan be connected to an Ethernet node via a computer Ethernet port.Therefore, the tool should support such an ability.
3. Modular tool: the functions of the simulator should be developed in away that they can be reused. Also, the new functions should be easilyreplaced by new developed ones with a small effort.
4. Response time measurement: it is important that the response timeof all messages is measured during run-time. Moreover, the measuredresponse time should be reported after finishing the simulation togetherwith important parameters, such as types of messages and number ofdeadline misses.
1SEtSim is available to download at: https://github.com/m-ashjaei/SEtSim
3

5. Visualization of messages: one of the goal is to visualize the transmis-sion in each link. The trace of signals is helpful to check the behaviorof newly developed protocols.
6. Graphical user interface: it should be easy for the user to maneuverin the tool, thus a graphical user interface is suitable instead of actualcoding for modeling an architecture. It significantly reduces the time ofevaluation as the user may require to change the architecture frequently.
1.2. Organization of the paper
The rest of the paper is organized in the following manner. The nextsection discusses some related work on modeling and simulation of real-timenetwork protocols. Section 3 describes three architectures of the FTT-SEprotocol. Section 4 presents some backgrounds on the Ethernet AVB pro-tocol. Then, Section 5 presents the SEtSim kernel design, while Section 6validates the simulator using some experiments. Finally, Section 7 shows thelimitations of the tool, and Section 8 concludes the paper.
2. Related work
Several techniques have been proposed to model and simulate the Eth-ernet protocol using different tools and modeling algorithms. In the workpresented in [6], models are proposed for nodes, switches and traffic accord-ing to the Switched Ethernet protocol. Moreover, an evaluation is performedto validate the performance of the modeling method by comparing the sim-ulation results with the collected data from a specific network application.
In the area of embedded avionics networks, a simulation model consider-ing the AFDX is proposed in [7]. The end systems (nodes), switches, differentqueue managements in the switch and nodes, and the measurement units tomeasure the latency of each flow were modeled. Moreover, the validationof the modeling algorithm is performed using a single-switch case-study byapplying the worst-case scenario for the flows configuration. However, thesimulator was developed only for a particular application and it is not im-plemented as a general simulator.
Furthermore, a simulation algorithm was proposed in [8] to evaluate theend-to-end upper bound delay in AFDX networks. Finding an upper boundend-to-end delay for each message using simulation, requires to investigate ahuge number of possible scenarios. Thus, an approach to reduce the number
4
of possible scenarios was proposed in [8]. It should be noted that two ap-proaches were presented in the literature to compute the end-to-end delay oftraffic in AFDX networks. These approaches include the analysis based onthe network calculus [9], and the analysis framework based on the trajectoryapproach [10].
In addition, different network simulation systems were designed basedon available simulation tools. For instance, a network simulator system forAFDX networks was designed and implemented in [11], in which NetworkSimulation (NS2) as a tool to simulate TCP, routing over wired and wirelessnetworks, was considered for the main platform. However, implementing aparticular model on an existing tool is straightforward, whereas extending atool for a general model is not an easy task. Also, the work presented in [12]proposed a component-based model for AFDX networks in order to verifythe behavior of the network model.
As the requirements in automotive industries have changed to supportnew functions using Ethernet, a simulation environment based on OMNeT++has been proposed in [13] to evaluate mixed CAN-Ethernet networks. Fur-thermore, there are many general tools developed for network simulation,such as TrueTime [14], NS2 [15], OMNET++ [16] and OPNET [17].
TrueTime is a toolbox developed based on Simulink. The switched Ether-net protocol as a network block has been supported by the TrueTime toolbox.However, adding new protocols, such as the FTT-SE protocol, needs a lot ofmodifications and changes to the kernel of the tool. Moreover, the outputresults that can be generated from the TrueTime blocks are limited and theyneed to be modified to allow for calculation of response time of messages.Another tool is called OPNET, that is used to evaluate the performanceof a network, specially for evaluation of Internet. However, this tool is acommercial tool, and its source code is not freely available to develop newprotocols. OMNET++ and NS2 are modular simulators mainly used forsensor networks, internet protocols and performance modeling. NS2 han-dles a lot of different network protocols, yet it supports limited number ofreal-time protocols. The core of these simulation tools should be completelychanged to cover an RTE protocol, such as the FTT-SE protocol. Basically,some of the RTE protocols require changing in the Ethernet frame (e.g., inboth the FTT-SE and the Ethernet AVB) and changing different networklayers. Therefore, implementing a new simulation tool, in particular for RTEprotocols, is useful in the real-time communication research area.
NS2 uses two programing languages, C and oTCL, where oTCL is an
5

object oriented language utilized for the graphical interface. Implementing auser-friendly interface in NS2 is very much dependent on oTCL language thatis not rich for this task. For instance, developing a block for a component(e.g., a node) with a feature of dragging and dropping is not easy in NS2.Note that, in NS3 oTCL is completely removed because of a big overheadfor large simulations [18], however it is not completely settled for extension.Also, in order to build a network example, a descriptive language is requiredto create nodes and connect them in a network. This increases the chanceof making mistake, even in the first stage, i.e., building a network model. Infact, one of the motivations to use Simulink as backbone is providing a user-friendly interface by drag and drop of components in a model. Moreover,NS2 is basically designed for Linux users. Although the installation guideis available for Windows users, there are many bugs reported as some extrapackages are required to be installed (e.g., Cygwin package).
As a result of the above survey, neither of the mentioned tools can be useddirectly to include RTE protocols (e.g., the FTT-SE protocol) along with cor-responding response time calculations for messages. Besides, one of the maingoals of the tool, except graphical interface and message trace visualization,is using that in control applications. Normally, in control applications differ-ent types of signals along with control tasks are used. These control blocksand signals are already designed and tested in Matlab toolboxes. Moreover,an ultimate goal is to use the tool for end-to-end evaluation of distributedembedded systems. Therefore, in this paper we present SEtSim which isdeveloped based on Simulink.
3. The FTT-SE protocol
The FTT-SE protocol is a bandwidth-efficient protocol, with respect tothe COTS switch [5], which uses the master-slave technique. This protocolwas initially presented in [5] for small size networks consisting of one switchand few nodes. In order to extend the protocol to support multi-hop com-munication, three different approaches were proposed, connecting multipleswitches in a tree topology. The first architecture [19] uses a single masterconnected to the top of the network tree in order to control the traffic trans-mission in the whole network. In the second architecture [20], each switchhas an attached master node, whereas in the third architecture [20] the mes-sages within a group of switches are controlled by one master node. In thissection, we briefly sketch these three architectures.
6

3.1. Single-master architecture
The single-master architecture is depicted in Figure 1, in which one mas-ter node is attached to the top of the network hierarchy, controlling thetraffic in the whole network. The master node is responsible to schedulemessages on-line according to any desired scheduling policy (e.g., Fixed Pri-ority Scheduling), on a cyclic basis. The basic cycle has a fixed duration oftime and it is called Elementary Cycle (EC). Each EC is partitioned amongtwo types of traffic, i.e., synchronous and asynchronous traffic, resulting ina design where the EC hosts one synchronous and one asynchronous win-dow (Figure 2). The scheduler in the master node checks the synchronousmessages, which are activated periodically, whether they can be transmit-ted during the associated window within EC (i.e., within the synchronouswindow). The scheduled messages are encoded into a Trigger Message (TM)that is transmitted to all slave nodes at the beginning of the next EC. TheTM transmission is based on the master-slave technique where the traffictransmission is controlled by a master node and triggering the transmissionwithin specific cycles.
Master SW1
SW3 SW2
SW5 SW4
S1
S5 S3
S7 S6
S2
S4
S8
Figure 1: The Single-Master Architecture
The activation of asynchronous messages is unknown in advance and canoccur at any time during the EC. Therefore, a signaling mechanism [21] allowsthe slave nodes to inform the master node about potential pending requestsusing a Signaling Message (SIG), which is transmitted after reception ofthe TM (e.g., A, B and C in Figure 2). The master then schedules theasynchronous messages adequately and inserts them into one of the upcoming
7

TMs. The slave nodes receive the TM, decode it and initiate the transmissionof the scheduled messages and in parallel initiate reception of data messagesfrom other slave nodes. Note that, decoding the TM takes an amount oftime called Turn Around Time (TRD) (Figure 2). The actual length of theTRD depends on the processing speed of the slave nodes. The response timeanalysis for the traffic transmitted through the switches in this architectureis developed and presented in [19].
Master Switch out
Switch In
S1
S4
S6
TRD Synchronous Window Asynchronous Window
Switch out
Switch In
Switch out
Switch In
Switch out
Switch In
Elementary Cycle
A
B
C
B C
TM
TM
TM
TM
A
X Y TM SIG
Figure 2: The Elementary Cycle in Single-Master Architecture
3.2. Multi-master architecture
Unlike the previous architecture, the traffic in the multi-master architec-ture is coordinated using multiple master nodes, each of which is connectedto one switch, as illustrated in Figure 3.
M1 M3
SW1
SW3 SW2
SW5 SW4
Cluster2
Cluster1
S1
S5 S3
S7 S6
S2
S4
M5
S8
M2
M4
Figure 3: The Multi-Master Architecture
8
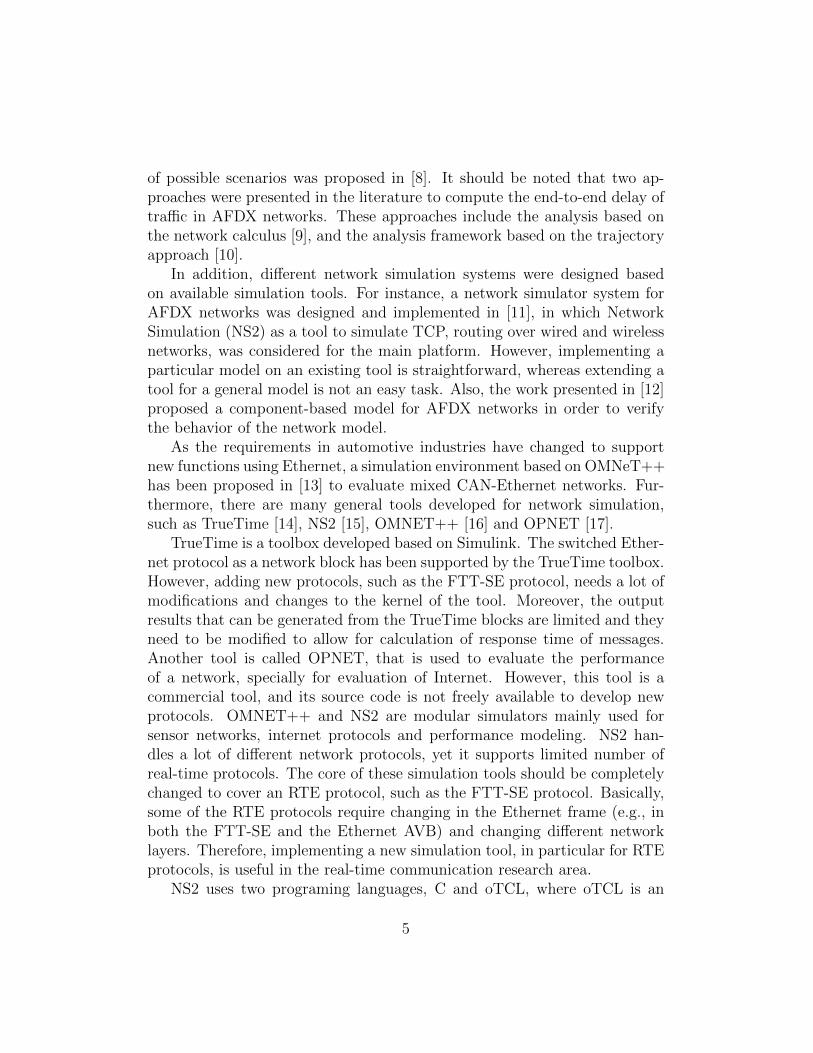
In this architecture, each switch along with all associated nodes that areconnected to it is called a sub-network (e.g., SW1, M1, S1 and S2). Moreover,each sub-network is a parent for lower level sub-networks in the tree topology.A group of sub-networks with the same parent sub-network is called a cluster(e.g., Cluster 2 in Figure 3). Note that, the root sub-network is included inits children cluster because it cannot be considered as a separate cluster.Also, the traffic is categorized into two types. A message that is transmittedwithin a sub-network is called local, whereas a message is called global if itis transmitted beyond a sub-network.
The EC, in this architecture, is divided among different traffic types, i.e.,local/global and synchronous/asynchronous. Also, the global asynchronouswindow is further split among clusters. The EC partitioning is illustrated inFigure 4.
X X TM asynchTM Local SIG Global SIG A B
M1 Switch out
Switch In
M3
S4
M4
S6
1
3
3
4
4
1
3
3
TRD Synchronous Window Asynchronous Window
Local Global Local Global
Cluster1 Cluster2
A B
A
B Switch out
Switch In
Switch out
Switch In
Switch out
Switch In
Switch out
Switch In
Elementary Cycle
Figure 4: The Elementary Cycle in Multi-Master Architecture
Each master node schedules its associated local synchronous and asyn-chronous traffic within the dedicated windows. The request for local asyn-chronous traffic is sent to the sub-network master node in order to be sched-uled for the next EC (e.g., message A from S6 to M4 in Figure 4). Theglobal synchronous traffic is scheduled by all master nodes in parallel to havea consistent scheduling in the entire network. The scheduled messages areencoded into the TM and transmitted to the slave nodes in the beginning ofthe EC. As there is no global view of the activation of global asynchronoustraffic, the master nodes cannot schedule them in parallel. Therefore, themaster of each cluster is responsible for scheduling them by receiving a sepa-rate SIG request from children slave nodes (e.g., message B from S6 to M3 inFigure 4). Then, the global asynchronous traffic is scheduled within a partic-ular dedicated window (e.g., cluster1 sub-window within the asynchronous
9
window) and the identifiers of the scheduled messages are encoded into adifferent TM, which is called asynchTM, to be transmitted after the regularTM (e.g., asynchTM3 that is sent from M3 to S6 in Figure 4).
Slave nodes receive both the TM and the asynchTM, they decode themand they initiate the message transmission. Moreover, the SIG requests,both for local and global asynchronous messages, are sent by the slave nodesconcurrently. Note that, the partitioning of the windows for message trans-mission is for scheduling purposes only. The slave nodes start to send theirscheduled messages immediately without considering the partitioning of thewindows.
In addition, this architecture requires that all master nodes are timelysynchronized. Therefore, a clock synchronization mechanism, used amongthe master nodes, is presented in [22]. The response time analysis of the traf-fic that is sent through multiple switches is developed and presented in [20].
3.3. Cluster-based architecture
The cluster-based architecture is a hybrid solution of single- and multi-master architectures. The topology is the same as the multi-master architec-ture, except having a single master for each cluster. The network exampleis depicted in Figure 3 considering M1 and M3 in the network. The formermaster schedules the traffic within cluster 1 and the latter master schedulesthe traffic within cluster 2.
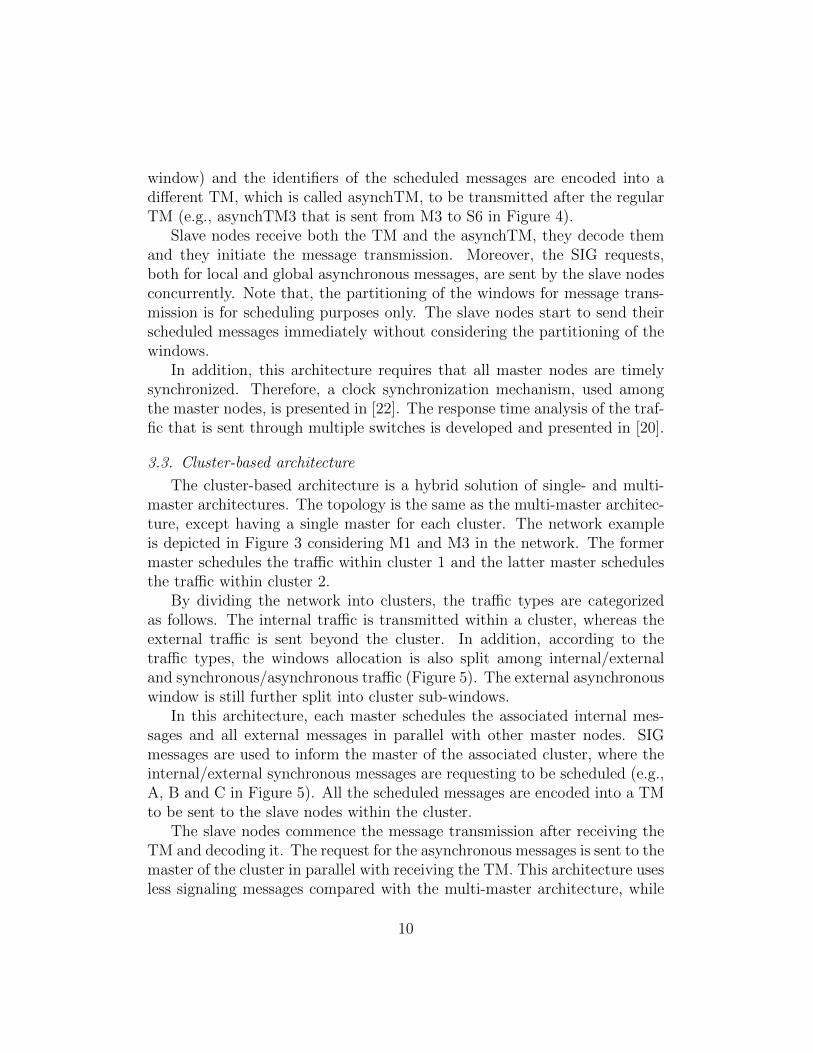
By dividing the network into clusters, the traffic types are categorizedas follows. The internal traffic is transmitted within a cluster, whereas theexternal traffic is sent beyond the cluster. In addition, according to thetraffic types, the windows allocation is also split among internal/externaland synchronous/asynchronous traffic (Figure 5). The external asynchronouswindow is still further split into cluster sub-windows.
In this architecture, each master schedules the associated internal mes-sages and all external messages in parallel with other master nodes. SIGmessages are used to inform the master of the associated cluster, where theinternal/external synchronous messages are requesting to be scheduled (e.g.,A, B and C in Figure 5). All the scheduled messages are encoded into a TMto be sent to the slave nodes within the cluster.
The slave nodes commence the message transmission after receiving theTM and decoding it. The request for the asynchronous messages is sent to themaster of the cluster in parallel with receiving the TM. This architecture usesless signaling messages compared with the multi-master architecture, while
10
having the benefits of a lower number of master nodes, i.e., using one TM pereach cluster and one SIG per slave node. This topology also requires to havetimely synchronized master nodes. Therefore, the same clock synchronizationmechanism [22] is used in the cluster-based architecture.
X TM SIG A
M1 Switch out
Switch In
S1
S3
M2
S6
TRD Synchronous Window Asynchronous Window
Internal External Internal External
Cluster1 Cluster2
Switch out
Switch In
Switch out
Switch In
Switch out
Switch In
Switch out
Switch In
Elementary Cycle
1
1
1
2
2
A
A
B
C
B C
Figure 5: The Elementary Cycle in Cluster-Based Architecture
4. The Ethernet AVB
Ethernet AVB protocol is a common name to a set of specifications thatincludes the following main amendments: (i) IEEE P802.1Qav - Forwardingand Queuing Enhancements for Time-Sensitive Streams, (ii) IEEE P802.1Qat- Stream Reservation Protocol, (iii) and IEEE P802.1AS - Timing and Syn-chronization.
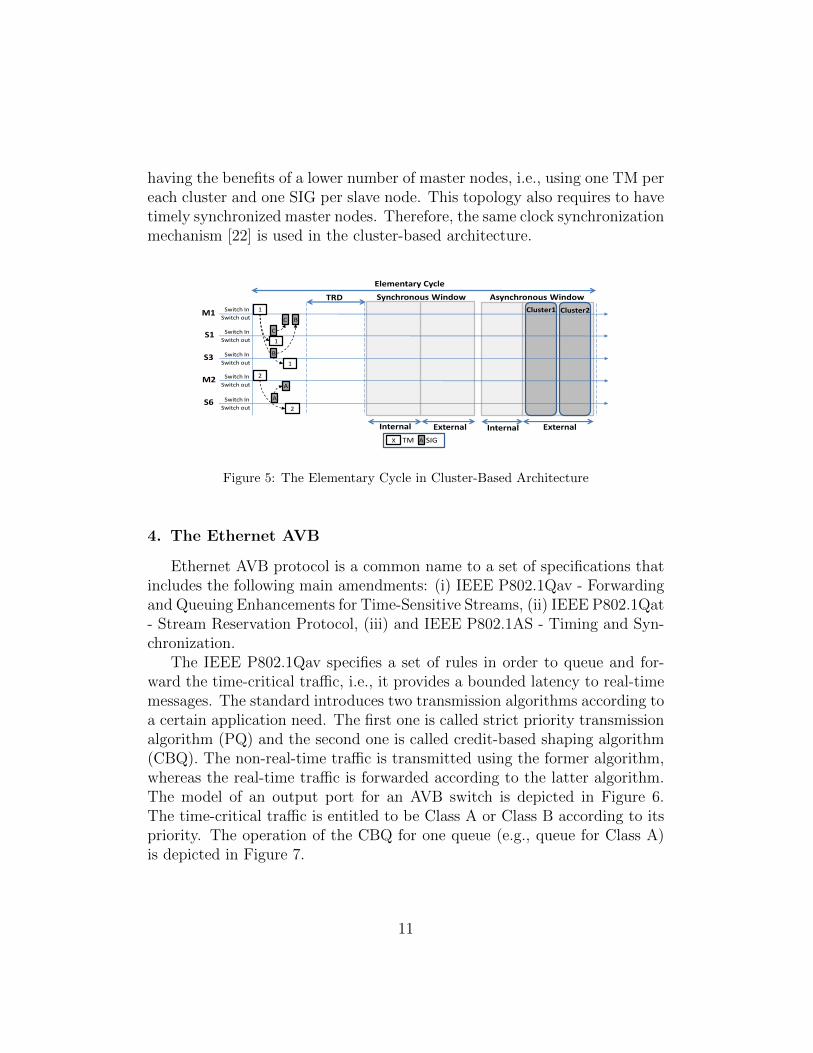
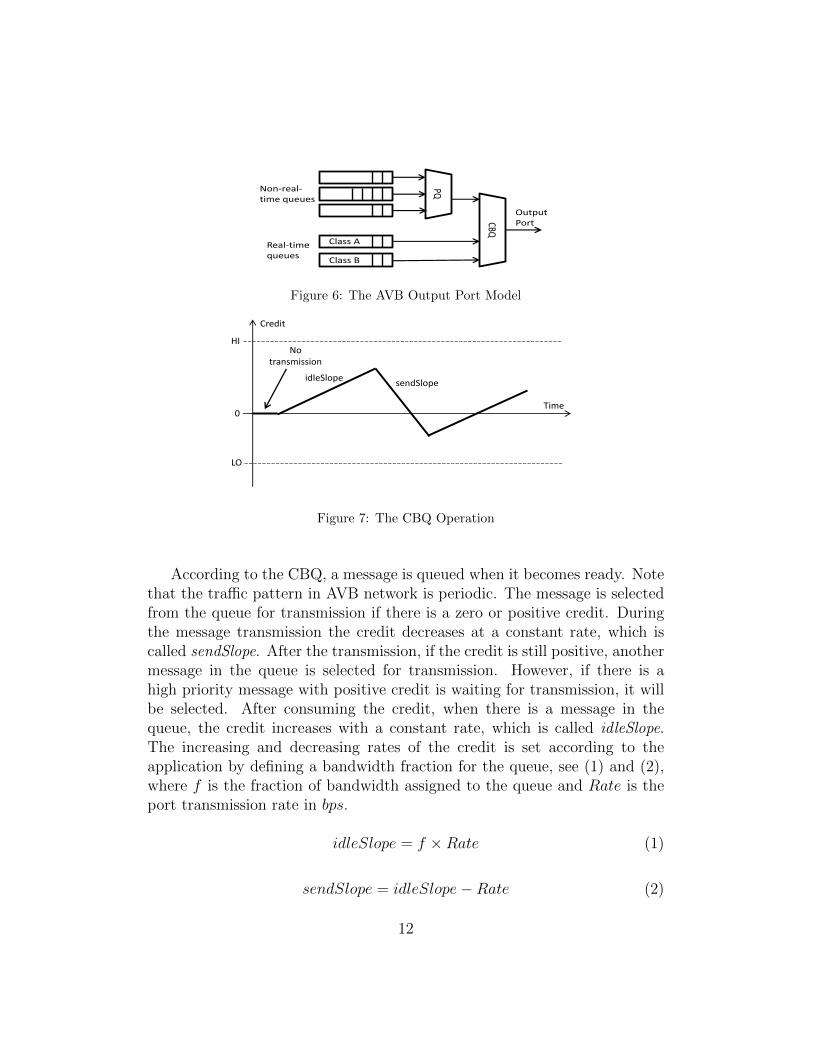
The IEEE P802.1Qav specifies a set of rules in order to queue and for-ward the time-critical traffic, i.e., it provides a bounded latency to real-timemessages. The standard introduces two transmission algorithms according toa certain application need. The first one is called strict priority transmissionalgorithm (PQ) and the second one is called credit-based shaping algorithm(CBQ). The non-real-time traffic is transmitted using the former algorithm,whereas the real-time traffic is forwarded according to the latter algorithm.The model of an output port for an AVB switch is depicted in Figure 6.The time-critical traffic is entitled to be Class A or Class B according to itspriority. The operation of the CBQ for one queue (e.g., queue for Class A)is depicted in Figure 7.
11
PQ
CBQ
Non-real-time queues
Real-time queues
Class A
Class B
Output Port
Figure 6: The AVB Output Port Model
HI
LO
0
Credit
idleSlopesendSlope
No transmission
Time
Figure 7: The CBQ Operation
According to the CBQ, a message is queued when it becomes ready. Notethat the traffic pattern in AVB network is periodic. The message is selectedfrom the queue for transmission if there is a zero or positive credit. Duringthe message transmission the credit decreases at a constant rate, which iscalled sendSlope. After the transmission, if the credit is still positive, anothermessage in the queue is selected for transmission. However, if there is ahigh priority message with positive credit is waiting for transmission, it willbe selected. After consuming the credit, when there is a message in thequeue, the credit increases with a constant rate, which is called idleSlope.The increasing and decreasing rates of the credit is set according to theapplication by defining a bandwidth fraction for the queue, see (1) and (2),where f is the fraction of bandwidth assigned to the queue and Rate is theport transmission rate in bps.
idleSlope = f ×Rate (1)
sendSlope = idleSlope−Rate (2)
12
If a given traffic class queue (e.g., Class A) does not have any messageavailable in the queue, the lower priority traffic class queue (Class B) canthen be sent. The unused bandwidth, i.e., when the credit is not positivefor both Class A and Class B, is available for transmission of non-real-timetraffic using the PQ algorithm.
Another draft of the standard is the IEEE P802.1Qat which specifies theadmission control in order to manage the resource to be reserved for thespecific streams. This is mostly done by the Stream Reservation Protocol(SRP) which introduces a producer-consumer model to negotiate for theresource reservation. The last part of the standard, the IEEE P802.1AS,specifies a clock synchronization protocol to ensure that the synchronizationrequirements are met.
5. Simulator design
Using Simulink/Matlab, we have developed SEtSim to evaluate the timingbehavior of messages in switched Ethernet networks. The main ideas ofSEtSim are to support RTE protocols and to have a user-friendly graphicalinterface in order to build a model easily. Simulink can fulfill the latter aimas it allows us to implement nodes and switches as a block to let the userbuild a network model by drag and drop of the blocks. This is achieved bydeveloping a component model (e.g., the switch) using custom blocks whichare available in Simulink. Moreover, there are many predefined blocks existin Simulink that can be directly used in SEtSim, such as scope blocks andsignal generators.
The core of SEtSim is based on a cycle-based approach, where executionof all functions are done within a fixed duration of time, known as time-slots.To simulate the parallel execution of blocks in a model, we have divided thetime into a number of small time slots in each of which all the functions areexecuted. The number of time slots shows the resolution of the simulationwhich is not fixed but can be changed in the configuration of the simulator.Changing the number of time slots does not affect the accuracy of the messageresponse time. In fact, in any resolution the response time of the traffic ina particular model is constant. However, it affects the accuracy of messagepassing visualization by a scope block in Simulink, i.e., the granularity ofshowing on the scope will be different. Note that, the function of blocksin Simulink executes in sequential order which is automatically specified byMatlab in advance. Therefore, the input data of each block is guaranteed
13
to be available before its execution. In addition, the kernel of SEtSim isdesigned to be modular. Each block, e.g., the master block, contains severalfunctions which can be replaced with a new function. For instance, thescheduler is a separate function that can be replaced with another schedulingstrategy, e.g., EDF Policy, without changing in the rest of the block. Thismodularity is applied to the main scheduler, reading the inputs, ready queuemanagement, scoping the output, measuring the traffic response time andqueue management in AVB switches. In this section we describe the designof the different blocks in SEtSim.
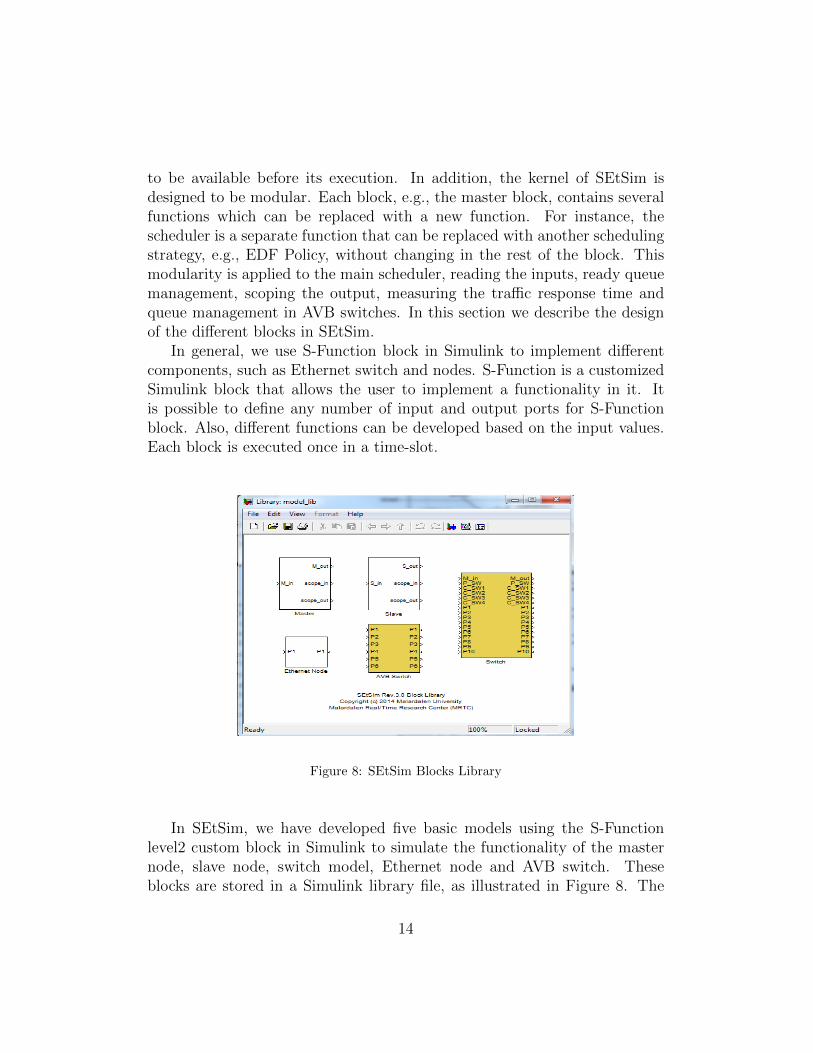
In general, we use S-Function block in Simulink to implement differentcomponents, such as Ethernet switch and nodes. S-Function is a customizedSimulink block that allows the user to implement a functionality in it. Itis possible to define any number of input and output ports for S-Functionblock. Also, different functions can be developed based on the input values.Each block is executed once in a time-slot.
Figure 8: SEtSim Blocks Library
In SEtSim, we have developed five basic models using the S-Functionlevel2 custom block in Simulink to simulate the functionality of the masternode, slave node, switch model, Ethernet node and AVB switch. Theseblocks are stored in a Simulink library file, as illustrated in Figure 8. The
14
user of SEtSim prepares a network model to evaluate by dragging the blocksfrom the library and dropping to the new model. Then, the connectionsbetween the input and output ports should be done. The further details forthe functions are given in this section.
5.1. Ready queues management
Each master contains four different ready queues to hold the activatedmessages of four different message types, including local/global / synchronous/ asynchronous in the multi-master architecture and internal/external / syn-chronous / asynchronous in the cluster-based architecture. The exceptionis the single-master architecture in which the master uses synchronous andasynchronous queues, only, as it has just two types of traffic. The readyqueues are sorted based on the priority of messages in which the highest pri-ority messages are inserted at the head of the queues. We have used the FixedPriority/Highest Priority First Scheduling Policy based on Rate Monotonicpriority assignment algorithm for on-line scheduling in SEtSim. Messageswith the same priority are sorted in the queues based on the First ComeFirst Serve (FCFS) policy. For management of the ready queues, we havedeveloped three functions to handle updating the queues before schedulingthe messages. These functions, which are implemented in Matlab m-files, arethe following:
Get head message. This function returns the first message in the readyqueue which is always the highest priority message among all messages in theready queue.
Remove a message. If the scheduler checks a message and it selects thatmessage to be transmitted in the current EC, the message should be removedfrom the ready queue. Therefore, this function removes a message defined byits id together with the ready queue in which the message is residing. Theoutput of this function is the updated ready queue sorted according to thepriorities of all messages in the queue.
Insert a message and sort in ascending format. Whenever a mes-sage becomes ready, it should be inserted in the correct ready queue. Thisfunction inserts a message in a queue according to its priority and it re-sortsthe queue according to the priorities of messages in which the highest prioritymessage is assigned at the head of the queue.
Note that, the ready queue management is not used in the EthernetAVB protocol simulation as there is no such ready queues in this protocol.
15
The output queues are managed with the PQ and CBQ algorithms in FIFOqueues.
5.2. Master block design
The master block is divided into two sub-blocks dealing with sender andreceiver functions. We have defined an array structure for the master nodeto store its variables and parameters. All master blocks in the model areconnected to a single m-file function, which is distinguished with a maskblock parameter number, i.e., the mask parameter in Simulink for each blockis set with a unique value.
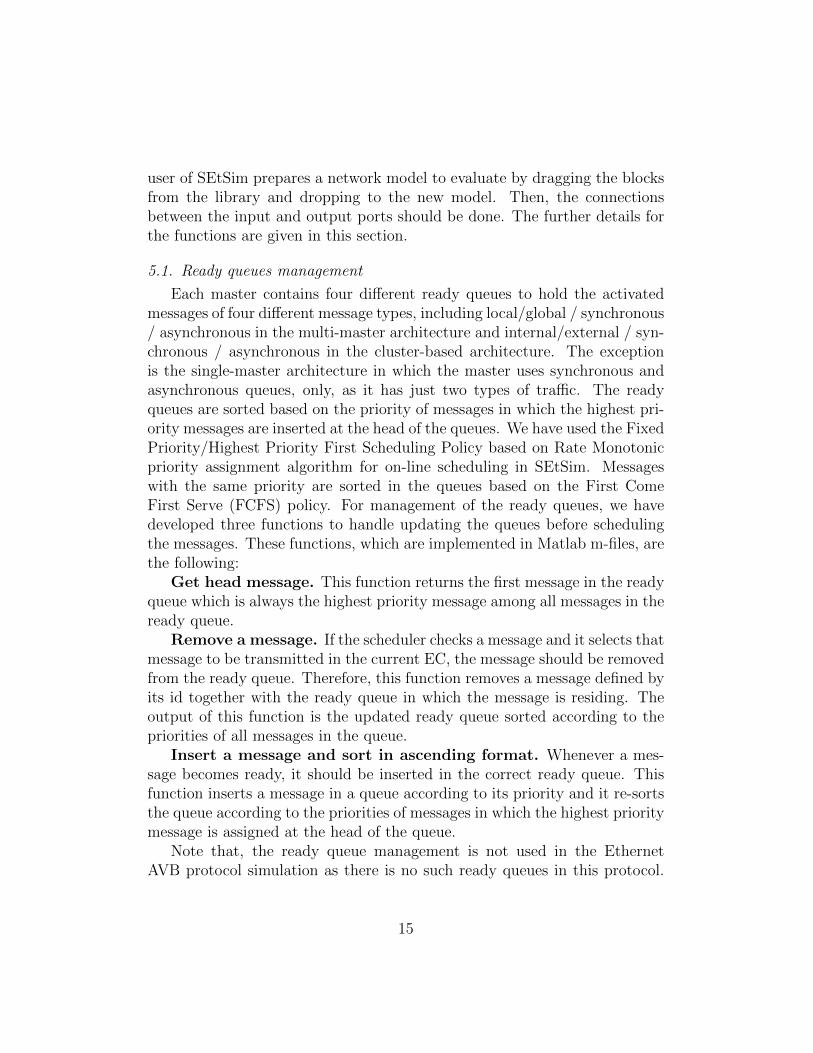
For each master input (receiver) and output (sender) blocks two separatefunctions are implemented. However, the master function is developed basedon a state flow such that each of them should run in order. The masterfunction has three states which are depicted in Figure 9-a. Each state isallowed to run when the previous state has executed, only. The first state isbroadcasting the TM (and asynchTM in case of multi-master architecture) tothe associated slave nodes. The next state (State 2) is receiving SIG requestsfrom the associated slave nodes during the TM window. The last state(State 3) is performing the scheduling function for all types of messages, andgenerating a TM (and asynchTM) for the next EC. State 1 and 3 are executedin the master sender function, whereas State 2 is executed in the receiverfunction. For input and output signals, we have implemented different scopefunctions (scope-in and scope-out), as shown in Figure 9-b.
State1: TM (& asynchTM)
transmitting
State2: Receiving SIG
request
State3: scheduling and
generating TM
(& asynchTM)
(a) Master Function State Flow (b) Master Block
Figure 9: Master Block
Depending on the architecture that has been chosen (i.e., single-/multi-master or cluster-based), the master collects the SIG requests from the as-sociated slave nodes in State 2 of the master function (e.g., collects from all
16
the slave nodes inside a cluster for the cluster-based architecture). This statefinishes and moves to the next state when all SIGs are received. The requestsare stored and the master schedules them for the next EC in State 3. In caseof the multi-master architecture, the scheduled global asynchronous messagesare encoded into a different TM (asynchTM) to be sent to the correspondingchildren slave nodes.
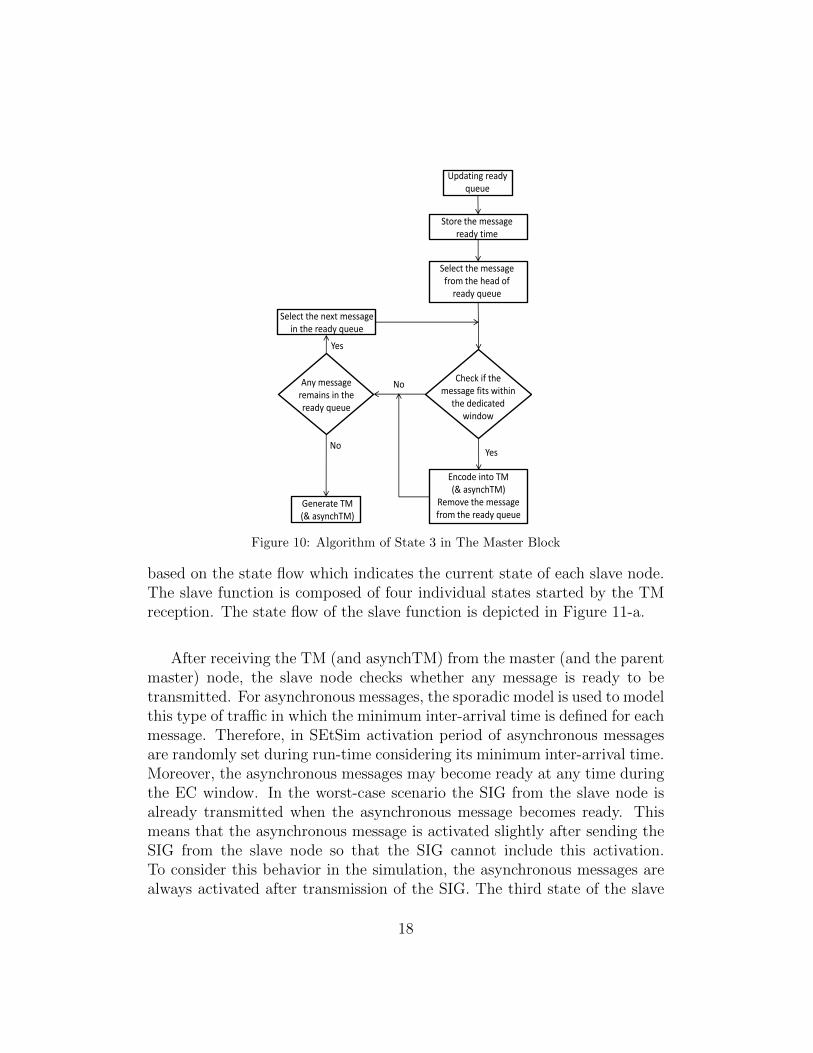
The algorithm of State 3 for the master block is depicted in Figure 10,which shows the scheduling of one (out of four) ready queue. However,scheduling the messages in the other ready queues is similar to the one pre-sented in Figure 10. The algorithm starts by updating the ready queue andrecording the ready time for the ready messages. The ready time is requiredwhen calculating the response time of the messages in the simulation. Af-terwards, the algorithm checks whether the messages in the ready queue canbe fitted in the dedicated window for each type of message according to theroute of the message. The remaining messages, which are not fitted in thededicated window, are kept in the ready queue for the next scheduling round(i.e., the next EC). Finally, the algorithm generates the TM (and asynchTMin case of a multi-master architecture) to be transmitted in State 1 of themaster function (Figure 9).
5.3. Switch model design
Similar to the master block, the switch is modeled with a Matlab S-Function using a particular m-file associated to that. Four kinds of connec-tions are defined for the switch model: (i) the master connection identifiedin port 1, (ii) the parent switch connection is dedicated to port 2, (iii) fourchildren connections for the children sub-networks, and finally (iv) ten con-nections for the slave nodes. Moreover, for each input and output ports aspecific buffer is assigned to store receiving and sending data. The buffersare sorted according to the FIFO policy, similarly to the COTS switches.The general structure of the switch model is to poll the input data and toprocess the destination address of them, and in turn, insert the data into therelated output buffer.
5.4. Slave block design
Similar to the master block, the slave block is divided into two sub-blocks,which are sender and receiver sub-blocks. The slave function is executed
17
Check if the message fits within
the dedicated window
Updating ready queue
Store the message ready time
Select the message from the head of
ready queue
Encode into TM (& asynchTM)
Remove the message from the ready queue
Generate TM (& asynchTM)
Any message remains in the ready queue
Select the next message in the ready queue
Yes
Yes
No
No
Figure 10: Algorithm of State 3 in The Master Block
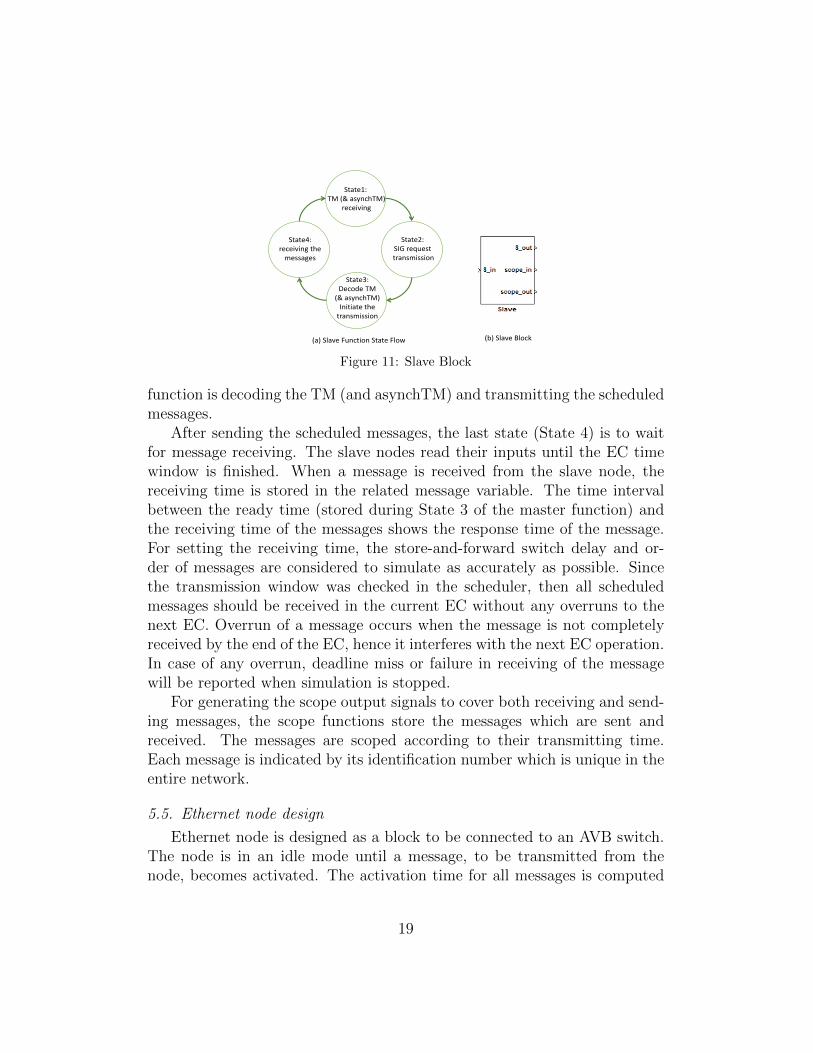
based on the state flow which indicates the current state of each slave node.The slave function is composed of four individual states started by the TMreception. The state flow of the slave function is depicted in Figure 11-a.
After receiving the TM (and asynchTM) from the master (and the parentmaster) node, the slave node checks whether any message is ready to betransmitted. For asynchronous messages, the sporadic model is used to modelthis type of traffic in which the minimum inter-arrival time is defined for eachmessage. Therefore, in SEtSim activation period of asynchronous messagesare randomly set during run-time considering its minimum inter-arrival time.Moreover, the asynchronous messages may become ready at any time duringthe EC window. In the worst-case scenario the SIG from the slave node isalready transmitted when the asynchronous message becomes ready. Thismeans that the asynchronous message is activated slightly after sending theSIG from the slave node so that the SIG cannot include this activation.To consider this behavior in the simulation, the asynchronous messages arealways activated after transmission of the SIG. The third state of the slave
18
State1: TM (& asynchTM)
receiving
State2: SIG requesttransmission
State4: receiving the
messages
(a) Slave Function State Flow (b) Slave Block
State3: Decode TM
(& asynchTM)Initiate the
transmission
Figure 11: Slave Block
function is decoding the TM (and asynchTM) and transmitting the scheduledmessages.
After sending the scheduled messages, the last state (State 4) is to waitfor message receiving. The slave nodes read their inputs until the EC timewindow is finished. When a message is received from the slave node, thereceiving time is stored in the related message variable. The time intervalbetween the ready time (stored during State 3 of the master function) andthe receiving time of the messages shows the response time of the message.For setting the receiving time, the store-and-forward switch delay and or-der of messages are considered to simulate as accurately as possible. Sincethe transmission window was checked in the scheduler, then all scheduledmessages should be received in the current EC without any overruns to thenext EC. Overrun of a message occurs when the message is not completelyreceived by the end of the EC, hence it interferes with the next EC operation.In case of any overrun, deadline miss or failure in receiving of the messagewill be reported when simulation is stopped.
For generating the scope output signals to cover both receiving and send-ing messages, the scope functions store the messages which are sent andreceived. The messages are scoped according to their transmitting time.Each message is indicated by its identification number which is unique in theentire network.
5.5. Ethernet node design
Ethernet node is designed as a block to be connected to an AVB switch.The node is in an idle mode until a message, to be transmitted from thenode, becomes activated. The activation time for all messages is computed
19
by the node where the messages belong to. Note that the messages in AVBnetworks are activated periodically. After activation, the node initiates themessage transmission. In order to record the response time of a messageduring run-time, we store the transmission time and the reception time ofthe message in the function block of the node.
5.6. AVB switch design
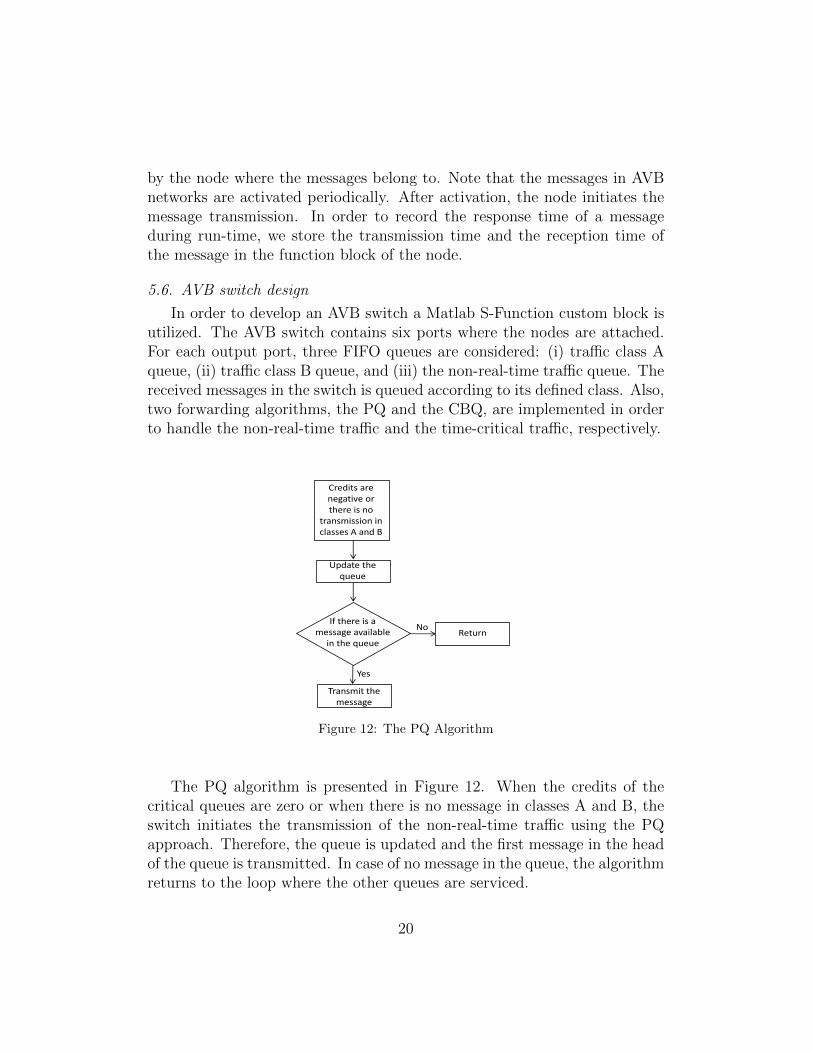
In order to develop an AVB switch a Matlab S-Function custom block isutilized. The AVB switch contains six ports where the nodes are attached.For each output port, three FIFO queues are considered: (i) traffic class Aqueue, (ii) traffic class B queue, and (iii) the non-real-time traffic queue. Thereceived messages in the switch is queued according to its defined class. Also,two forwarding algorithms, the PQ and the CBQ, are implemented in orderto handle the non-real-time traffic and the time-critical traffic, respectively.
Update the queue
Yes
NoIf there is a
message available in the queue
Transmit the message
Return
Credits arenegative or there is no
transmission in classes A and B
Figure 12: The PQ Algorithm
The PQ algorithm is presented in Figure 12. When the credits of thecritical queues are zero or when there is no message in classes A and B, theswitch initiates the transmission of the non-real-time traffic using the PQapproach. Therefore, the queue is updated and the first message in the headof the queue is transmitted. In case of no message in the queue, the algorithmreturns to the loop where the other queues are serviced.
20

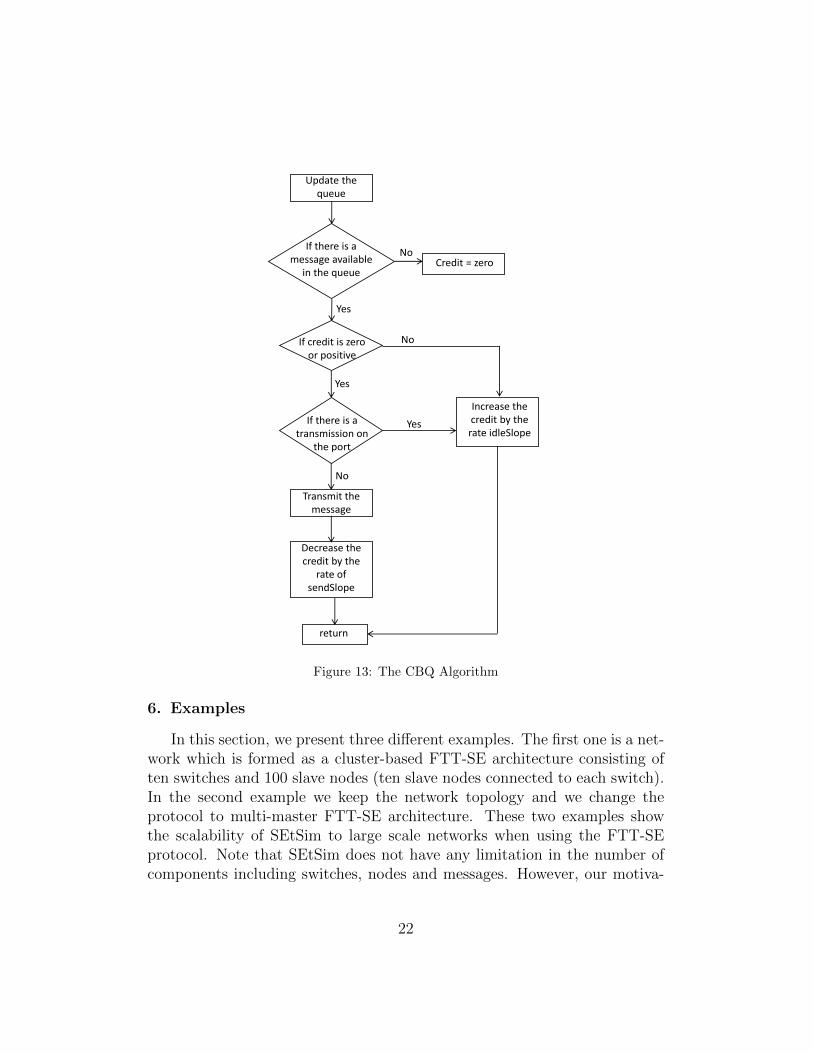
Furthermore, the algorithm for the CBQ approach is depicted in Fig-ure 13. Note that the algorithm shows one of the classes, however it is thesame for all classes of the traffic. The algorithm checks whether any messageis available in the queue. If so, the credit for that queue is examined to seeif there is a zero or positive credit. In case of zero or positive credit, themessage will be transmitted and at the same time the credit is decreased.In contrast, if the credit is negative there will be no transmission and thecredit will be increased. The rates of decreasing and increasing for the creditis defined in the configuration m.file, by setting the idleSlope and sendSlopeparameters. If there is still a message in the queue, it will start for trans-mission under two conditions. First, having a remained positive credit andsecond, no high priority traffic class is ready for transmission. It should benoted that if the queue is empty the credit becomes zero immediately.
5.7. Settings and configuration
In order to set the configuration of a network example, such as the ECsize, the windows allocation for the FTT-SE protocol and bandwidth set fordifferent classes in the Ethernet AVB protocol, a Matlab m-file is developed.For each network model, different configurations can be determined to assessthe performance of the example.
Besides the windows allocation for different message types, other config-urations such as number of slave and master nodes in the model, and themessage set declaration, should be set before running the simulation. Themessage set declaration includes the parameters such as transmission time,source node, destination node, period/minimum inter-arrival time, priorityand the routing information for the messages.
5.8. Output and reports
SEtSim generates two types of output for performance evaluation, (i)the message transmission in the scope block of Simulink, and (ii) a reportthat shows the response time of the messages. In order to check the messagetransmission, it is required that a scope block in Simulink is connected to anymaster or slave node to visualize the input and output messages. Moreover,the output report presents the minimum, average and maximum responsetime of all messages that are measured during the simulation. This can helpto compare the response time of messages to analytical results to figure outthe level of pessimism embodied in the analysis, for instance.
21
Update the queue
Yes
NoIf there is a
message available in the queue
Transmit the message
If credit is zero or positive
Decrease the credit by the
rate of sendSlope
Credit = zero
return
No
Yes
Increase the credit by the rate idleSlope
If there is atransmission on
the port
No
Yes
Figure 13: The CBQ Algorithm
6. Examples
In this section, we present three different examples. The first one is a net-work which is formed as a cluster-based FTT-SE architecture consisting often switches and 100 slave nodes (ten slave nodes connected to each switch).In the second example we keep the network topology and we change theprotocol to multi-master FTT-SE architecture. These two examples showthe scalability of SEtSim to large scale networks when using the FTT-SEprotocol. Note that SEtSim does not have any limitation in the number ofcomponents including switches, nodes and messages. However, our motiva-
22

tion in this section is to show the applicability of the tool in the area ofautomotive domains, where the generated examples are relatively large. Fi-nally, the third example is a small network using the Ethernet AVB protocol.
6.1. Cluster-based FTT-SE example
In this example, the network is composed of ten switches along with100 slave nodes. The parameters for this example are set as follows. TheElementary Cycle (EC) is set to 10ms, the synchronous window is 4400µsand the asynchronous window is 5500µs. Within the synchronous window,2000µs is dedicated to internal traffic, while 2400µs is assigned to externaltraffic. Moreover, the asynchronous window is divided between internal andexternal messages, 2000µs for the former and 3500µs for the latter window.The external asynchronous window is split among the three clusters equally,i.e., 1160µs for each of them. The transmission speed for this example isconsidered as 100Mbps and 3500 messages are generated randomly. Dueto the limited space in this paper, we illustrate a part of the network inFigure 14 and a part of the root sub-network in Figure 15.
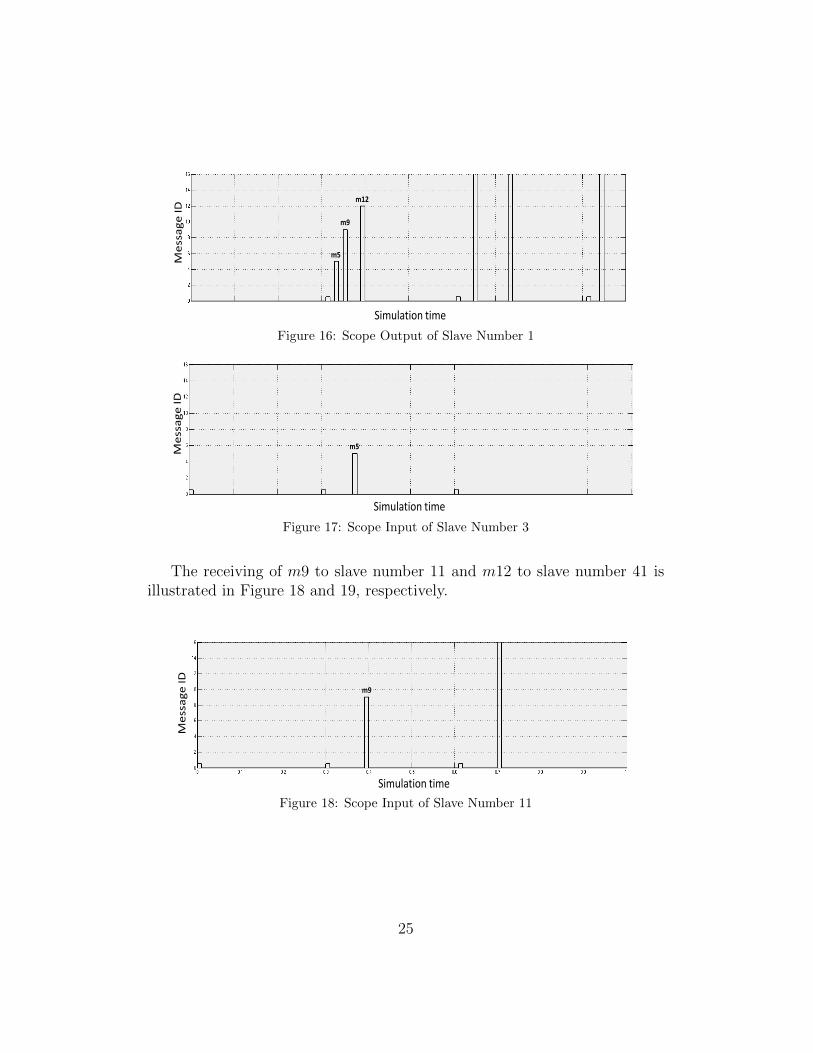
The simulation for this example is performed for a time duration of 10000ECs that took 10 minutes in real time using a computer with Intel Core(TM)i5-2540M CPU at 2.60GHz with 8GB RAM. Note that, using different com-puter configuration (e.g., different CPU speed) affects the simulation timeas the functions could execute faster in higher CPU capacity. However, forthis example with a large number of nodes and a large set of messages thesimulation time is reasonable. To visualize the message transmission, an or-dinary Scope block of Simulink is attached to the respective scope ports ofthe slave blocks in the model. In this paper, we illustrate three messagesamong 3500 messages due to the space limitation, which are m5, m9 andm12. The selected messages are synchronous with a period of 2 EC and areassigned the highest priority (priority equals to 1). Moreover, the messageshave different transmission times and all of them are transmitted from slavenode number 1. Figure 16 shows the output of slave number 1, in whichthe x-axis is the simulation time and the y-axis shows the message IDs. Theselected messages are transmitted sequentially and they are marked in thescope figure.
In addition, Figure 17 depicts the input of slave number 3, which is theslave that m5 is transmitted to. As it can be seen, m5 is received with adelay of its transmission time and the store-and-forward delay in the switch.
23

Figure 14: A Part of Network Example Model
Figure 15: A Part of Root Sub-Network Model
24
Simulation time
Me
ssa
ge
ID
m5
m9
m12
Figure 16: Scope Output of Slave Number 1
Simulation time
Me
ssa
ge
ID
m5
Figure 17: Scope Input of Slave Number 3
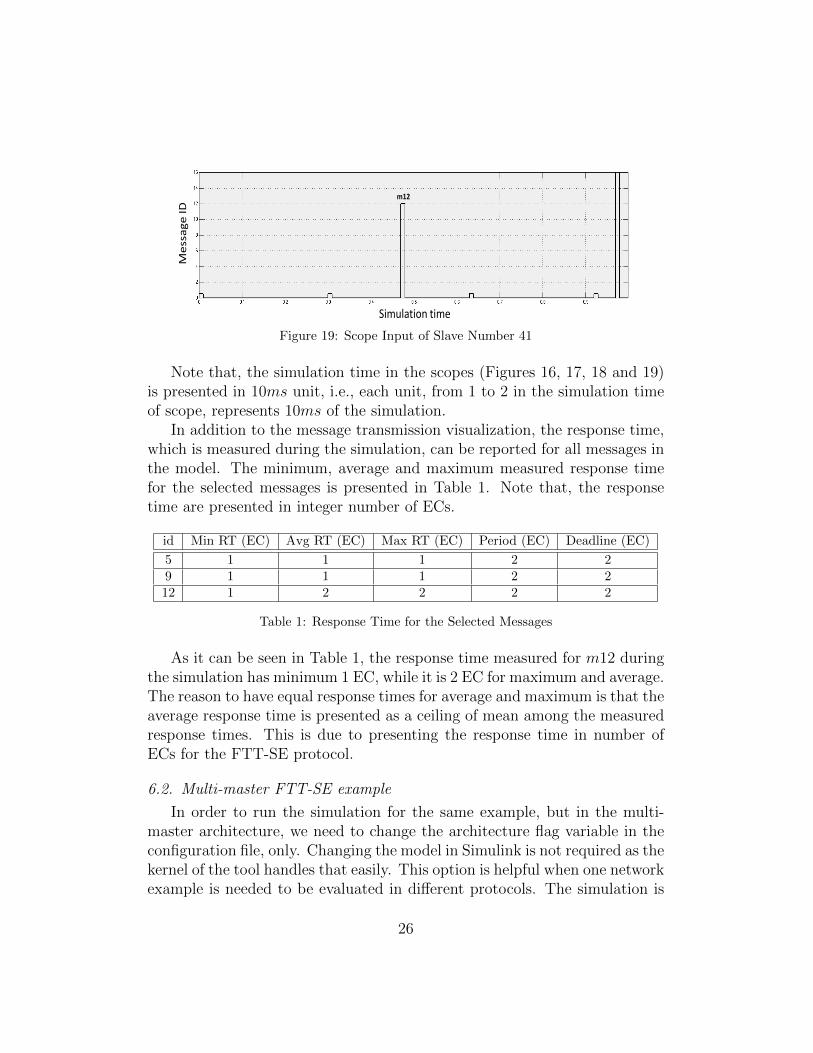
The receiving of m9 to slave number 11 and m12 to slave number 41 isillustrated in Figure 18 and 19, respectively.
Simulation time
Me
ssa
ge
ID
m9
Figure 18: Scope Input of Slave Number 11
25
Simulation time
Me
ssa
ge
ID
m12
Figure 19: Scope Input of Slave Number 41
Note that, the simulation time in the scopes (Figures 16, 17, 18 and 19)is presented in 10ms unit, i.e., each unit, from 1 to 2 in the simulation timeof scope, represents 10ms of the simulation.
In addition to the message transmission visualization, the response time,which is measured during the simulation, can be reported for all messages inthe model. The minimum, average and maximum measured response timefor the selected messages is presented in Table 1. Note that, the responsetime are presented in integer number of ECs.
id Min RT (EC) Avg RT (EC) Max RT (EC) Period (EC) Deadline (EC)
5 1 1 1 2 29 1 1 1 2 212 1 2 2 2 2
Table 1: Response Time for the Selected Messages
As it can be seen in Table 1, the response time measured for m12 duringthe simulation has minimum 1 EC, while it is 2 EC for maximum and average.The reason to have equal response times for average and maximum is that theaverage response time is presented as a ceiling of mean among the measuredresponse times. This is due to presenting the response time in number ofECs for the FTT-SE protocol.
6.2. Multi-master FTT-SE example
In order to run the simulation for the same example, but in the multi-master architecture, we need to change the architecture flag variable in theconfiguration file, only. Changing the model in Simulink is not required as thekernel of the tool handles that easily. This option is helpful when one networkexample is needed to be evaluated in different protocols. The simulation is
26

performed for the new architecture (i.e., the multi-master architecture) for1000EC. We present the response time of the three messages as m130, m232and m1156 in Table 2.
id Min RT (EC) Avg RT (EC) Max RT (EC) Period (EC) Deadline (EC)
130 4 4 4 5 5232 7 7 7 7 71156 1 2 3 6 6
Table 2: Response Time for the Selected Messages
6.3. Ethernet AVB example
In this example, we model a network composes of two AVB switches alongwith three nodes, as depicted in Figure 20. The transmission speed is con-sidered as 100Mbps. From this bandwidth, 40% is dedicated to the trafficclass A and 40% is allocated for traffic class B. The rest of the bandwidth isavailable for non-real-time traffic transmission, i.e., when there is no messagein traffic Class A and Class B queues. Moreover, ten messages are randomlygenerated, where their transmission times are set within [80, 120]µs and theirpriorities are selected as class A (high), class B (low) and non-real-time mes-sage, randomly.
The simulation is performed for 1 minute of simulation time. Table 3shows the minimum, average and maximum response time of three out of tenmessages, which is measured during the simulation. These three messagesare m1, m2 and m10, which are assigned as Class A, Class B and non-real-time types. Note that, the response times, perdiod and deadline of the trafficis shown in milliseconds in Table 3.
id Min RT (ms) Avg RT (ms) Max RT (ms) Period (ms) Deadline (ms)
1 0.25 0.26 0.35 20 202 0.25 0.25 0.25 30 3010 0.30 0.45 0.55 50 50
Table 3: Response Time for the Selected Messages
27
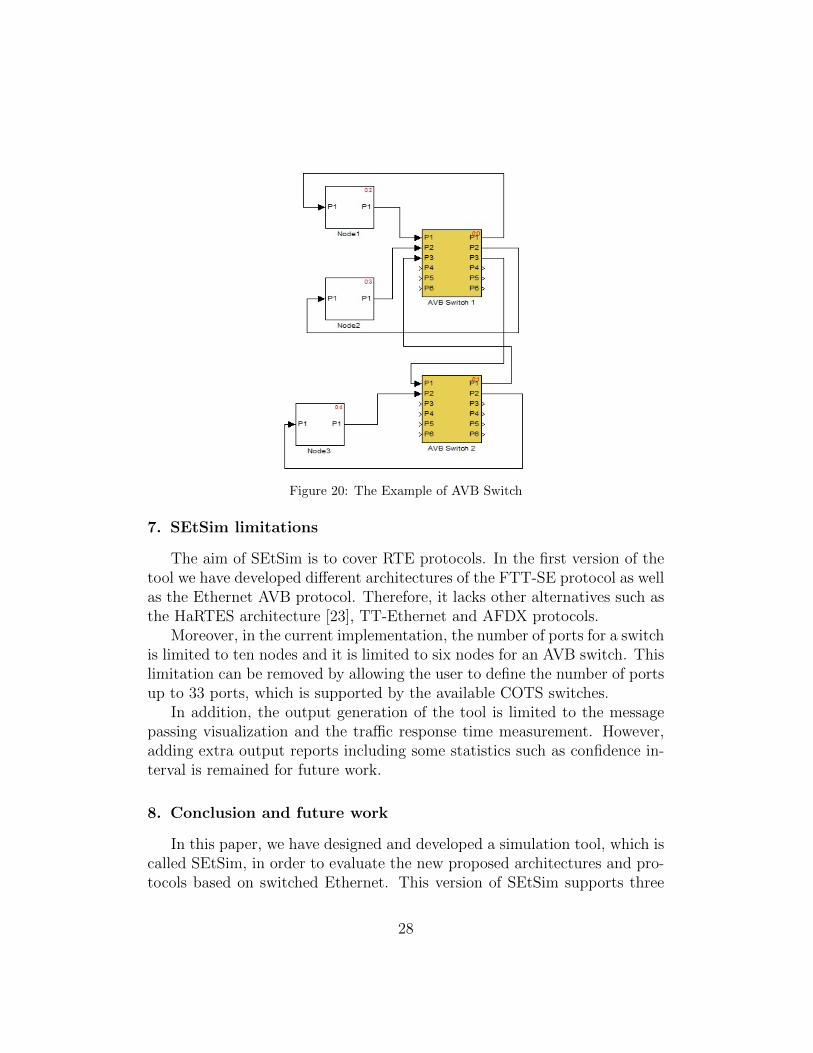
Figure 20: The Example of AVB Switch
7. SEtSim limitations
The aim of SEtSim is to cover RTE protocols. In the first version of thetool we have developed different architectures of the FTT-SE protocol as wellas the Ethernet AVB protocol. Therefore, it lacks other alternatives such asthe HaRTES architecture [23], TT-Ethernet and AFDX protocols.
Moreover, in the current implementation, the number of ports for a switchis limited to ten nodes and it is limited to six nodes for an AVB switch. Thislimitation can be removed by allowing the user to define the number of portsup to 33 ports, which is supported by the available COTS switches.
In addition, the output generation of the tool is limited to the messagepassing visualization and the traffic response time measurement. However,adding extra output reports including some statistics such as confidence in-terval is remained for future work.
8. Conclusion and future work
In this paper, we have designed and developed a simulation tool, which iscalled SEtSim, in order to evaluate the new proposed architectures and pro-tocols based on switched Ethernet. This version of SEtSim supports three
28
different architectures of the FTT-SE protocol, which are briefly introducedin this paper, and the Ethernet AVB protocol. Moreover, we presented thedesign of SEtSim, which contains five basic models for the master, the slave,the switch, the Ethernet node and the AVB switch, all implemented as Func-tion blocks in Simulink.
In addition, we demonstrated three network examples, two examples us-ing the FTT-SE protocol and one to show the Ethernet AVB functionalities.The FTT-SE examples consist of ten switches along with 100 slave nodeswith a set of 3500 messages to show the scalability of SEtSim. Differentoutput scopes of message transmissions are presented as well as the responsetime reports. Also, we illustrated an example of Ethernet AVB network com-prises one AVB switch with three nodes. We also showed the response timeof the traffic transmitted in the Ethernet AVB network. SEtSim allows usto perform a detailed analysis of the protocol before potentially making ahardware implementation of it, with all its associated complexity.
SEtSim is extensible in the sense that we can easily accommodate otherswitched Ethernet protocols, as the kernel is designed to be modular. The on-going work is to remove the limitations inside SEtSim such as the availabilityof a bounded number of supported protocols.
References
[1] S. Varadarajan, T. Chiueh, EtheReal: a host-transparent real-time fastEthernet switch, in: 6th International Conference on Network Protocols,1998.
[2] H. Hoang, M. Jonsson, Switched real-time Ethernet in industrial ap-plications - deadline partitioning, in: 9th Asia-Pacific Conference onCommunications, 2003.
[3] I. Land, J. Elliott, Architecting ARNIC 664 (AFDX) Solutions, 2011.
[4] Ethernet POWERLINK, available at http://www.ethernet-powerlink.org.
[5] R. Marau, L. Almeida, P. Pedreiras, Enhancing real-time communica-tion over COTS Ethernet switches, in: 6th IEEE International Work-shop on Factory Communication Systems, 2006.
29
[6] Z. Huang, Y. Zhang, H. Xiong, Modeling and simulation of switchedEthernet, in: 2nd International Conference on Computer Modeling andSimulation, 2010.
[7] H. Charara, C. Fraboul, Modeling and simulation of an avionics full du-plex switched Ethernet, in: Advanced industrial conference on telecom-munications/service assurance with partial and intermittent resourcesconference/e-learning on telecommunications workshop, 2005.
[8] J.-L. Scharbarg, C. Fraboul, Simulation for end-to-end delays distribu-tion on a switched Ethernet, in: 12th IEEE International Conference onEmerging Technologies and Factory Automation, 2007.
[9] H. Charara, J.-L. Scharbarg, J. Ermont, C. Fraboul, Methods for bound-ing end-to-end delays on an AFDX network, in: 18th Euromicro Con-ference on Real-Time Systems, 2006.
[10] H. Bauer, J.-L. Scharbarg, C. Fraboul, Applying and optimizing trajec-tory approach for performance evaluation of AFDX avionics network,in: The 14th IEEE Conference on Emerging Technologies Factory Au-tomation, 2009.
[11] S. Dong, Z. Xingxing, D. Lina, H. Qiong, The design and implementationof the AFDX network simulation system, in: International Conferenceon Multimedia Technology, 2010.
[12] A. Basu, S. Bensalem, M. Bozga, B. Delahaye, A. Legay, E. Sifakis,Verification of an AFDX infrastructure using simulations and probabili-ties, in: 1st International Conference on Runtime Verification, 2010, pp.330–344.
[13] J. Matsumura, Y. Matsubara, H. Takada, M. Oi, M. Toyoshima, A. Iwai,A simulation environment based on OMNeT++ for automotive CAN-Ethernet networks, in: 4th International Workshop on Analysis Toolsand Methodologies for Embedded and Real-Time Systems, 2013.
[14] D. Henriksson, A. Cervin, K.-E. Arzen, TrueTime: Real-time controlsystem simulation with MATLAB/Simulink, in: Proceedings of theNordic MATLAB Conference, Copenhagen, Denmark, 2003.
30
[15] The network simulator NS2, available athttp://www.isi.edu/nsnam/ns/.
[16] OMNET++: Component-based C++ simulation library, available athttp://www.omnetpp.org.
[17] OPNET: application and network performance, available athttp://www.opnet.com.
[18] Introduction to NS3, available at http://www.nsnam.org.
[19] R. Marau, M. Behnam, Z. Iqbal, P. Silva, L. Almeida, P. Portugal,Controlling multi-switch networks for prompt reconfiguration, in: 9thInternational Workshop on Factory Communication Systems, 2012.
[20] M. Ashjaei, M. Behnam, L. Almeida, T. Nolte, Performance analysisof master-slave multi-hop switched ethernet networks, in: 8th IEEEInternational Symposium on Industrial Embedded Systems, 2013.
[21] R. Marau, P. Pedreiras, L. Almeida, Asynchronous traffic signaling overmaster-slave switched Ethernet protocols, in: 6th International Work-shop on Real Time Networks, 2007.
[22] M. Ashjaei, M. Behnam, G. Rodriguez-Navas, T. Nolte, Implementinga clock synchronization protocol on a multi-master switched Ethernetnetwork, in: 18th IEEE International Conference on Emerging Tech-nologies and Factory Automation, 2013.
[23] M. Ashjaei, M. Behnam, P. Pedreiras, R. J. Bril, L. Almeida, T. Nolte,Reduced buffering solution for multi-hop HaRTES switched Ethernetnetworks, in: The 20th IEEE International Conference on embeddedand Real-Time Computing Systems and Applications, 2014.
31