Embed Size (px)
Citation preview
8/3/2019 Seth Root, Robert J. Hardy and David R. Swanson- Continuum predictions from molecular dynamics simulations: Shock waves
http://slidepdf.com/reader/full/seth-root-robert-j-hardy-and-david-r-swanson-continuum-predictions-from 1/5
Continuum predictions from molecular dynamics simulations:Shock waves
Seth Root and Robert J. Hardya)
Department of Physics and Astronomy, University of Nebraska, Lincoln, Nebraska 68588-0111
David R. Swanson Department of Computer Science, University of Nebraska, Lincoln, Nebraska 68588-0115
Received 5 August 2002; accepted 19 November 2002Techniques are investigated for obtaining continuously distributed local properties from thepositions and velocities of constituent atoms. A localization function is used to calculate the localdensity, temperature, and velocity from the results of molecular dynamics simulations of shockwaves in a two-dimensional model system. The two-dimensional spatial variations of the localproperties are found, and the width of the localization function is varied to optimize the presentation.A vector plot of the local velocity shows turbulence behind the shock with a resolution on the orderof a nanometer. Contour plots show the mass density and local temperature at a hot spot caused bya collapsed void. © 2003 American Institute of Physics. DOI: 10.1063/1.1537243
I. INTRODUCTION
The behavior of matter can be described in terms of continuously distributed local properties—such as density,temperature, and velocity—or in terms of the motion of at-oms and molecules. Experimental studies are often analyzedat the continuum level, while molecular dynamics simula-tions give an atomic level description. This paper investi-gates techniques for relating the continuum and atomic de-scriptions and applies them to the very inhomogeneousphenomena associated with shock waves.
A pioneering contribution to these techniques was madeby Irving and Kirkwood,1 but their use of Dirac delta func-tions is not convenient for computer simulations. Hardy ex-
tended their work by introducing a finite width localizationfunction,2 which has been used in an interesting two-dimensional presentation of the local properties at a col-lapsed void.3 Most calculations of properties show spatialvariations only in the direction of shock propagation. Plots of such one-dimensional calculations are informative, but areincapable of showing intrinsically multidimensional phe-nomena, such as nonplanar shock fronts and turbulence inthe reaction zone.
In this paper we calculate the two-dimensional spatialvariations of the mass density, temperature, and velocityfrom the results of molecular dynamics simulations of shockwaves in a two-dimensional model system. The resolution of the calculations is controlled by the width of the localizationfunction, which needs to be optimized for the phenomenabeing studied. A balance must be found between the maskingof interesting behavior by the large fluctuations that occurwith small widths and the smoothing that results with largewidths. Contour plots show the evolution of the estimatedtemperature in the vicinity of a void collapsed by the passageof a shock wave, revealing a significant localized increase. A
vector plot of the local velocity, with a resolution on the
order of a nanometer, shows turbulent motion in the reactionzone.
II. DENSITIES AND LOCALIZATION FUNCTIONS
A continuous local mass density (R) and local momen-tum density p(R) are defined for a collection of atoms atpositions ri by
Ri
m iriR 1
and
pRi
m iviriR. 2
R is the observation point, and m i and vi are the mass andvelocity of atom i. Since the atoms are represented by points,the value of any continuously varying property assigned to R
must be an average of the properties of the atoms in thevicinity. The localization function (riR) defines this av-erage. One approach is to weight equally the contributions of all atoms whose centers, ri , are within a fixed distance of R.A better approach is to let the weighting decrease smoothlyto zero as the distance between the atom and the observationpoint increases. The function (riR) can be associatedwith R and interpreted as defining the region averaged over.Alternately, it can be interpreted as assigning a shape thattravels with the atom; the contribution of atom i to a propertyat R is then proportional to (riR).
The following are desired characteristics of localizationfunctions:
a (riR) has its maximum at riR.b (riR)→0 as riR→.c (riR) is smooth and non-negative.d (riR)dV R1.aElectronic mail: [email protected]
JOURNAL OF CHEMICAL PHYSICS VOLUME 118, NUMBER 7 15 FEBRUARY 2003
31610021-9606/2003/118(7)/3161/5/$20.00 © 2003 American Institute of Physics
Downloaded 14 Oct 2005 to 130.237.41.116. Redistribution subject to AIP license or copyright, see http://jcp.aip.org/jcp/copyright.jsp
8/3/2019 Seth Root, Robert J. Hardy and David R. Swanson- Continuum predictions from molecular dynamics simulations: Shock waves
http://slidepdf.com/reader/full/seth-root-robert-j-hardy-and-david-r-swanson-continuum-predictions-from 2/5
dV R is a volume element in R space. Characteristic d isneeded so that the integral of a local property over the entiresystem equals the value of the property for the entire system.For momentum this means that
pRdV Ri m ivi riRdV Ri
m ivi.3
The localization function has units of volume1, which forour two-dimensional simulations becomes length2.
In addition to a through d it is desirable for (r) tobe isotropic, or an even function, when a product of one-dimensional functions is used for computational simplicity.Some choices for the localization function are a Gaussian,2 atruncated cosine,4 and a truncated polynomial. The latter isused here. We set (r)1( x)1( y), where the one-dimensional function 1( x) is
1 x 1516w 1
2 x / w
2
x / w
4
if xw .0 otherwise.
4
1( x) is plotted in Fig. 1. The parameter w determines thewidth of the localization and is approximately equal to itsfull width at half maximum.
The local velocity of the system is defined as the mo-mentum density divided by the mass density,
VRpR / R. 5
The equipartition theorem assigns 12k BT of energy to each
degree of freedom, where k B is the Boltzmann constant. Thelocal temperature T (R) is estimated from the kinetic energy
calculated in the frame of reference moving with the localvelocity. That is,
1
2k BT R
i 1
2m iuiR2 riR
f iriR, 6
where ui(R)viV(R). The right-hand side of this is thekinetic energy per degree of freedom obtained by dividingthe kinetic energy per unit volume by the number of degreesof freedom per unit volume. The latter quantity is equated tothe number of degrees of freedom per atom, f , times thenumber of atoms per unit volume. For our simulations f
2. It follows from Eqs. 1, 2, 5, and 6 that
T R2
f k B
i 1
2m ivi
2 riR1
2 RVR2
iriR.
7
III. SIMULATIONS AND RESULTS
Simulations were performed on a two-dimensional sys-tem that starts as a collection of AB diatomic molecules thatreact exothermically to form AA and BB diatomic molecules.The potential energy of the system is the sum over all atompairs of a reactive empirical bond order REBO potential,5,6
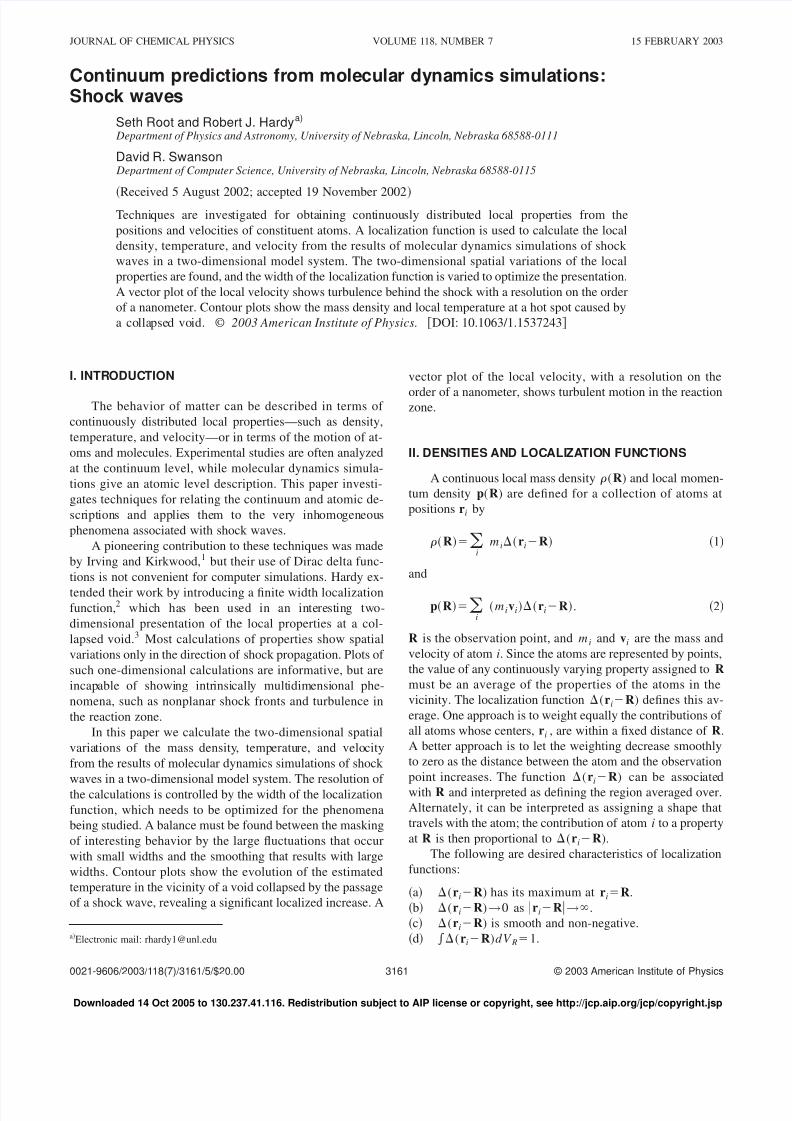
FIG. 2. Atomic positions 3.5 ps after flyer plate impact.
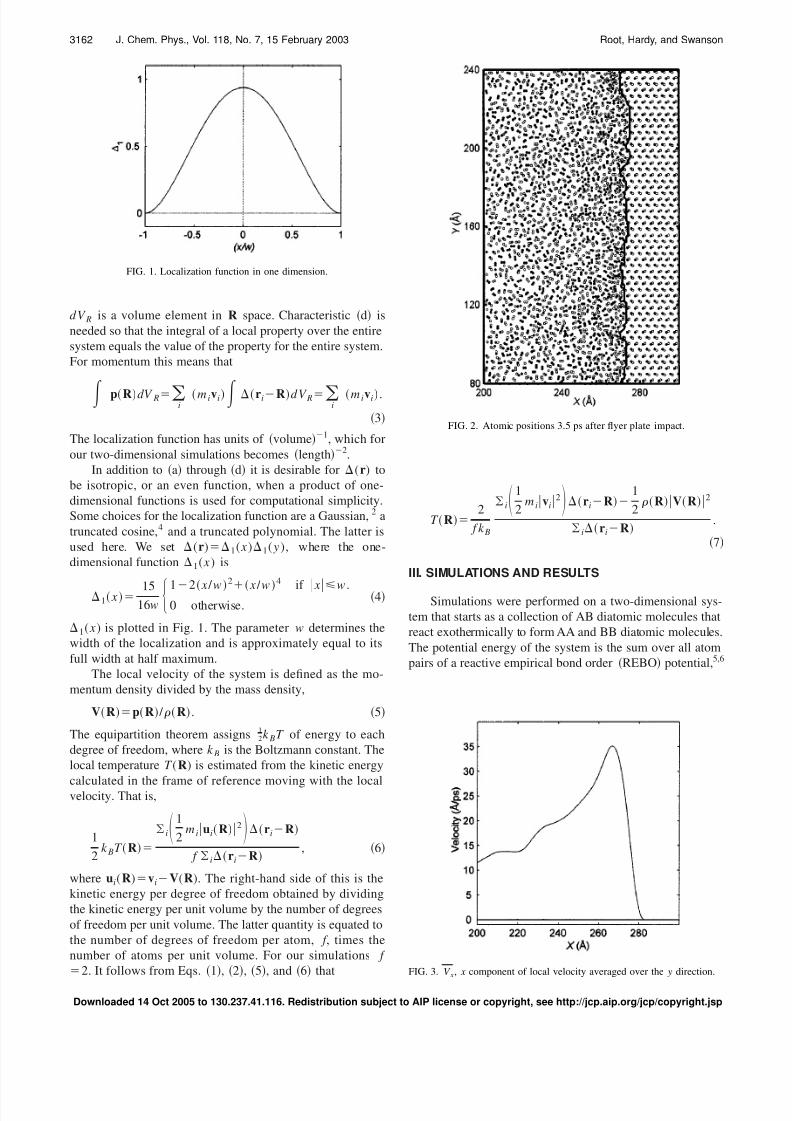
FIG. 3. V x, x component of local velocity averaged over the y direction.
FIG. 1. Localization function in one dimension.
3162 J. Chem. Phys., Vol. 118, No. 7, 15 February 2003 Root, Hardy, and Swanson
Downloaded 14 Oct 2005 to 130.237.41.116. Redistribution subject to AIP license or copyright, see http://jcp.aip.org/jcp/copyright.jsp
8/3/2019 Seth Root, Robert J. Hardy and David R. Swanson- Continuum predictions from molecular dynamics simulations: Shock waves
http://slidepdf.com/reader/full/seth-root-robert-j-hardy-and-david-r-swanson-continuum-predictions-from 3/5
8/3/2019 Seth Root, Robert J. Hardy and David R. Swanson- Continuum predictions from molecular dynamics simulations: Shock waves
http://slidepdf.com/reader/full/seth-root-robert-j-hardy-and-david-r-swanson-continuum-predictions-from 4/5
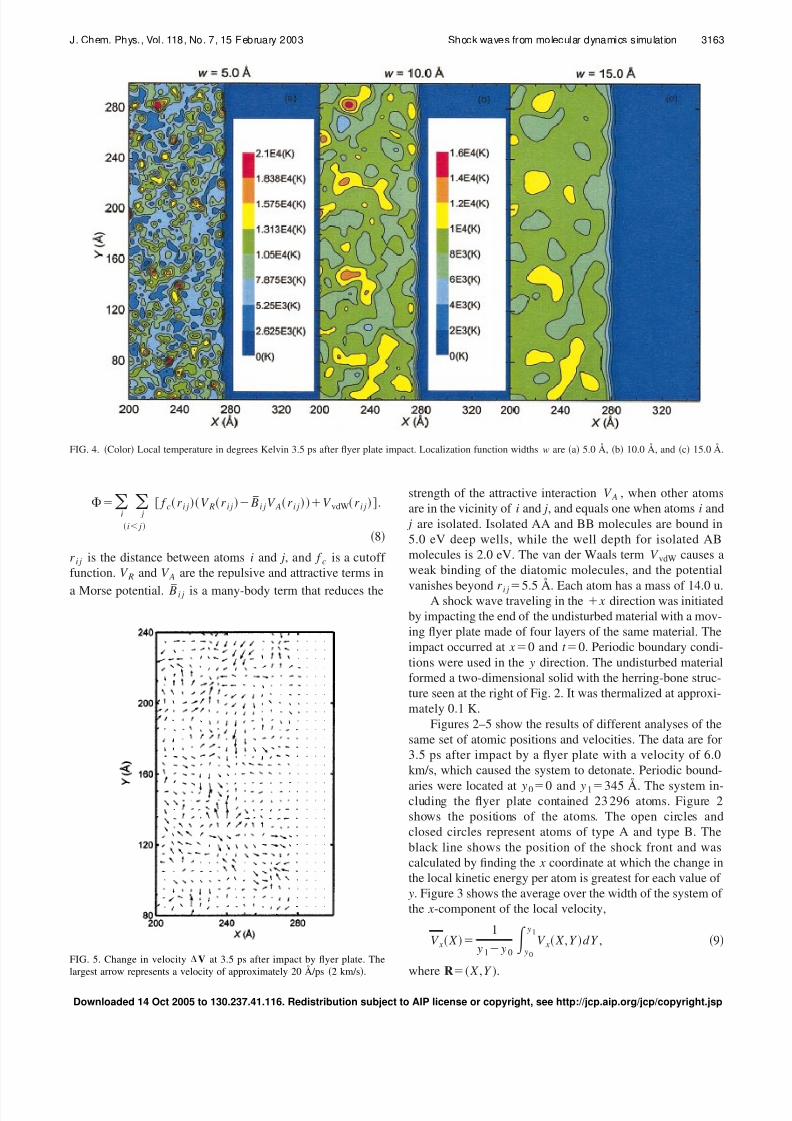
Figure 4 shows the effect on the estimated temperatureof variations in the width of the localization function. Thewidths w used were a 5 Å, b 10 Å, and c 15 Å. The localtemperatures in the contour plots were calculated on a squaregrid of R values with a spacing of 0.5 Å. Note that thetemperature scale for Fig. 4a is different than that for Figs.4b and 4c. This was necessary because of the large fluc-tuations that resulted from the small number of atoms in-
cluded in the averaging. Typical values for the numbers of atoms within a square of area w2 covered by the central partof the localization function are 5, 20, and 43 for Figs. 4a,4b, and 4c, respectively. The maximum temperatures cal-culated were 24 000, 15 000, and 12 000 K, respectively.
Figure 5 shows the difference between the local velocityand the average of its x component,
V X ,Y V X ,Y x̂V x X . 10
x̂ is a unit vector in the x direction. The average flow velocityin the x direction was subtracted off because the large x
component tends to obscure the transverse component of themotion. The longest arrow in Fig. 5 represents a velocity of
approximately 20 Å/ps 2 km/s. The results were plotted ona course grid of points spaced at 5.0 Å. The localizationfunction width was w10 Å.
Figures 6 and 7 show the atomic positions, mass density,and local temperature at 1.5 and 2.5 ps after flyer plate im-pact in a simulation that initially had a void with a radius of 25 Å. Periodic boundaries were located at y 00 and y 1148 Å, and the system contained 7742 atoms. The flyerplate had a velocity of 4.8 km/s. Inspecting the system at
later times indicated that a detonation did not occur. Themass density and temperature were calculated on a squaregrid of points spaced at 0.5 Å. The localization functionwidth was w10 Å.
IV. DISCUSSION AND CONCLUSIONS
The plot of atomic positions in Fig. 2 demonstrates thatshock fronts are not straight. The transverse irregularitiesseen there appear as a widening of the shock front in one-dimensional plots of local properties, such as that in Fig. 3.We find that properties that are in principle continuous—such as the density, velocity, and temperature defined by Eqs.1, 5, and 6—should be evaluated on a grid of points
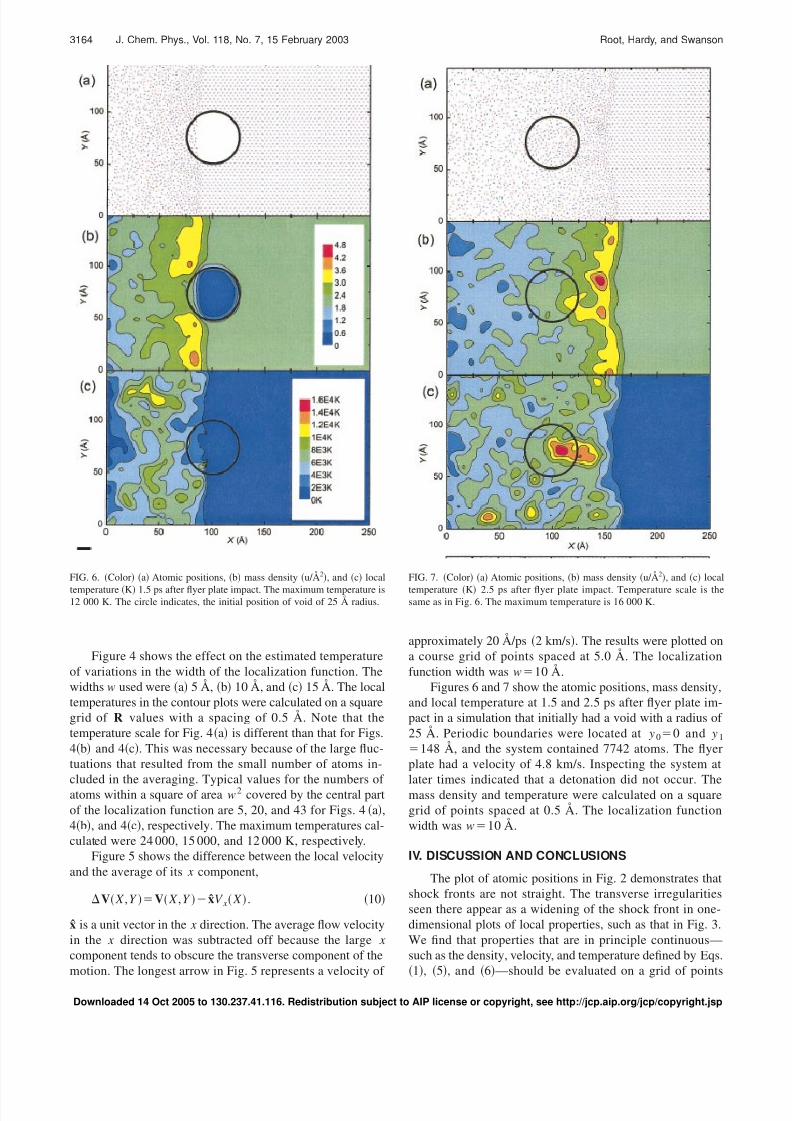
FIG. 6. Color a Atomic positions, b mass density u/Å2, and c local
temperature K 1.5 ps after flyer plate impact. The maximum temperature is12 000 K. The circle indicates, the initial position of void of 25 Å radius.
FIG. 7. Color a Atomic positions, b mass density u/Å2, and c local
temperature K 2.5 ps after flyer plate impact. Temperature scale is thesame as in Fig. 6. The maximum temperature is 16 000 K.
3164 J. Chem. Phys., Vol. 118, No. 7, 15 February 2003 Root, Hardy, and Swanson
Downloaded 14 Oct 2005 to 130.237.41.116. Redistribution subject to AIP license or copyright, see http://jcp.aip.org/jcp/copyright.jsp
8/3/2019 Seth Root, Robert J. Hardy and David R. Swanson- Continuum predictions from molecular dynamics simulations: Shock waves
http://slidepdf.com/reader/full/seth-root-robert-j-hardy-and-david-r-swanson-continuum-predictions-from 5/5
with a spacing significantly less than the width of the aver-aging. Otherwise the plots obtained have a jaggedness that isa computational artifact unrelated to the property illustrated.
The width of the region averaged over is determined bythe parameter w in the localization function. The differentestimates for local temperature in Fig. 4, which were ob-tained from the same data, indicate the problems encounteredwhen choosing w. The temperature estimates were obtained
from the kinetic energy of the small number of atoms in thevicinity of the point to which the estimate is assigned. Fromstatistical mechanics it is known that the fluctuations in thekinetic energy per degree of freedom for n atoms in thermalequilibrium at temperature T as measured by the standarddeviation are of the order of k BT / n . When w is small theeffective value of n is small, so that large fluctuationsoccur—fluctuations that are unrelated to the passage of ashock wave. This is seen in Fig. 4a where w5 Å and thetypical number of atoms in a square of area w2 is n5.When choosing a value for w, a balance must be found be-tween the masking of interesting phenomena by excessivefluctuations and the masking that results from the smoothing
associated with large widths. The width w should be variedin calculations of continuum properties and optimized for thephenomena being studied. A good choice for the simulationsreported here is w10 Å, as shown in Fig. 4b.
It is known from experimental studies that turbulent mo-tion exists behind shock fronts.7 To the best of our knowl-edge, Fig. 5 is the first published demonstration that it existson a nanometer length scale. The general flow in the propa-gation direction, which is plotted in Fig. 3, was subtractedfrom local velocity in Fig. 5. Both the typical value of V x inFig. 3 and the greatest magnitude of V in Fig. 5 are 20 Å/ps2.0 km/s. Nevertheless, the shock front was stable andpropagated at an essentially constant velocity. Care is neededwhen interpreting the vector plot in the immediate vicinity of the shock front, since the characteristic length of spatialvariations there is of the same order or less than the 10 Åwidth of the localization function.
The hot spot that results when a void is collapsed by ashock wave is graphically shown in the local temperaturesplotted in Figs. 6 and 7. As the wave moved to the right, theatoms at the left of the void, which were unconstrained byother material, moved rapidly across the void, and producedhigh estimated temperatures after colliding with the material
at the right. The maximum temperatures in the hot spot were12 000 and 16 000 K at 1.5 and 2.5 ps, respectively. Once theshock had passed over the void, the hot spot cooled to thetemperature of the surrounding material, which was less than10 000 K. Apparently this happened rapidly enough that adetonation did not result, which is somewhat surprising,since earlier work had found that the 4.8 km/s flyer platevelocity used was close to but less than the minimum ve-
locity for initiating detonations in the absence of a void inthe same material.6 Our results are similar to those found incontinuum simulations at much larger length scales.8,9
In summary, we have shown that calculations of con-tinuum properties from atomic data with location functionsof the type described are a powerful tool for analyzing veryanisotropic phenomena, such as that caused by the passageof a shock wave. It is important to vary the resolution of thecalculation by varying the width of the localization function.This method of analysis is currently being extended to in-clude the pressure tensor, energy density, and heat flux, andis being applied to more realistic model systems.
ACKNOWLEDGMENTS
The authors wish to thank Carter White at the NavalResearch Labs for the simulation program and Chad Petersenfor assistance. This work was completed utilizing the Re-search Computing Facility of the University of Nebraska–Lincoln and was supported by an NRL CHSSI grant.
1 J. H. Irving and J. G. Kirkwood, J. Chem. Phys. 18, 817 1950.2 R. J. Hardy, J. Chem. Phys. 76, 622 1982.3 J. W. Mintmire, D. H. Robertson, and C. T. White, Phys. Rev. B 49, 14859
1994.4 R. J. Hardy, S. Root, and D. R. Swanson, in Shock Compressions of
Condensed Matter-2001, edited by M. D. Furnish, N. N. Thadhani, and Y.
Horie AIP, Melville, NY, 2002, pp. 363–366.5 D. W. Brenner, D. H. Robertson, M. L. Elert, and C. T. White, Phys. Rev.Lett. 70, 2174 1993.
6 C. T. White, D. R. Swanson, and D. H. Robertson, in Molecular Dynamics
Simulations of Detonations, Chemical Dynamics in Extreme Environ-
ments, edited by R. A. Dressler World Scientific, Singapore, 2001, pp.546–592.
7 J. H. Lee, Bull. Am. Phys. Soc. 46, 11 2001.8 Z. P. Tang, W. Liu, and Y. Horie, in Shock Compressions of Condensed
Matter-1999, edited by M. D. Furnish, L. C. Chhabildas, and R. S. HixsonAIP, Melville, NY, 2000, pp. 309–312.
9 C. L. Mader, Numerical Modeling of Detonations University of Califor-nia Press, Berkeley, 1979, Chap. 3.
3165J. Chem. Phys., Vol. 118, No. 7, 15 February 2003 Shock waves from molecular dynamics simulat ion
Downloaded 14 Oct 2005 to 130.237.41.116. Redistribution subject to AIP license or copyright, see http://jcp.aip.org/jcp/copyright.jsp