Embed Size (px)
Citation preview
SETAC Europe – Glasgow- 12.05.2013Anne-Marie Boulay, PhD Candidate
Quantitative method comparison
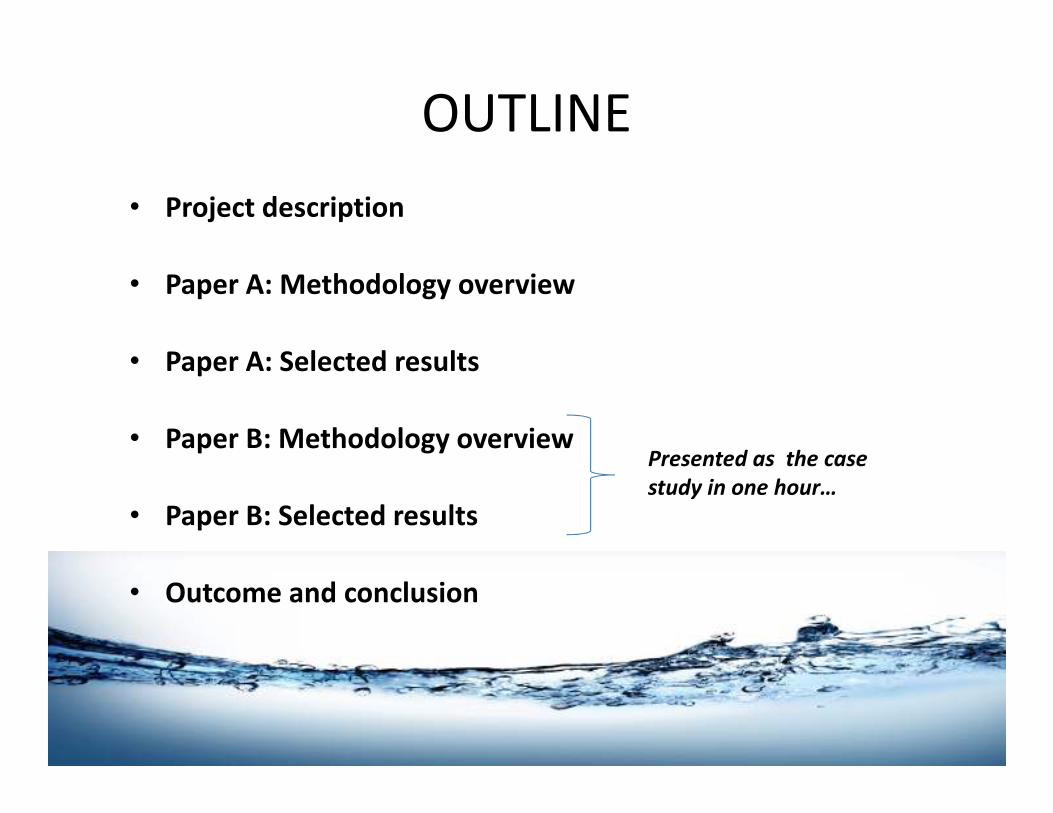
OUTLINE
• Project description
• Paper A: Methodology overview
• Paper A: Selected results
• Paper B: Methodology overview
• Paper B: Selected results
• Outcome and conclusion
Presented as the case
study in one hour…
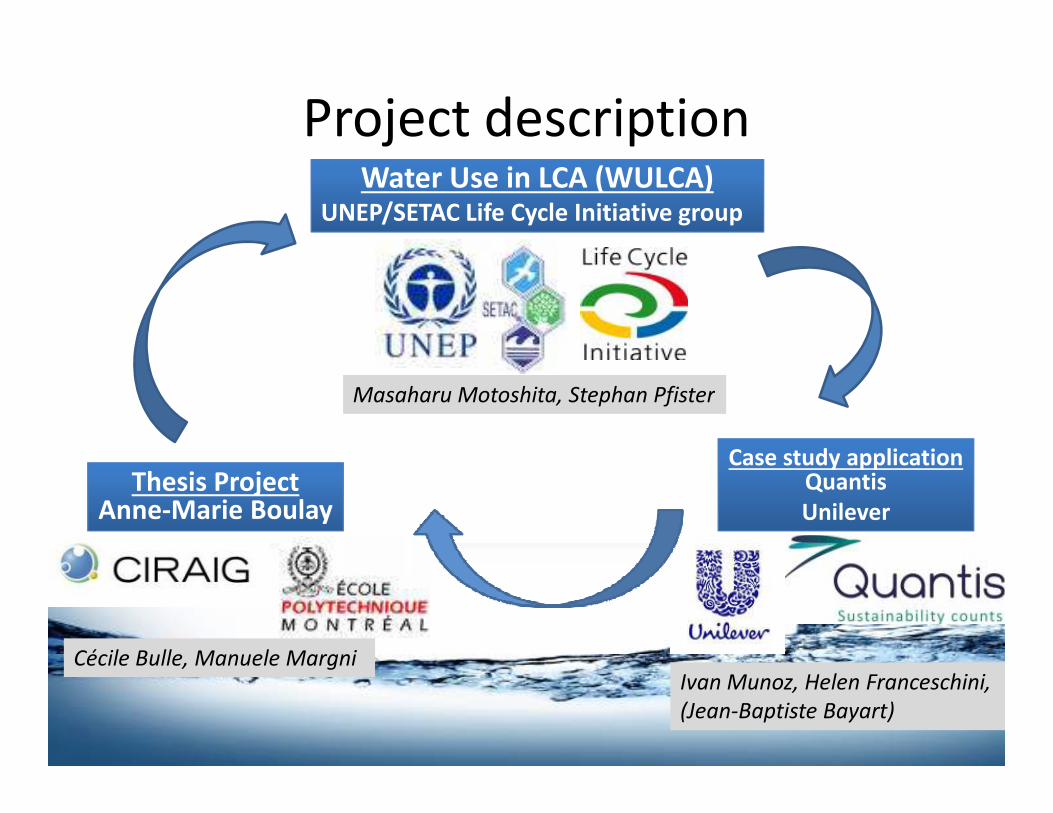
Project descriptionWater Use in LCA (WULCA)Water Use in LCA (WULCA)
UNEP/SETAC Life Cycle Initiative group
Masaharu Motoshita, Stephan Pfister
Thesis ProjectAnne-Marie Boulay
Case study applicationQuantisUnilever
Masaharu Motoshita, Stephan Pfister
Ivan Munoz, Helen Franceschini,
(Jean-Baptiste Bayart)
Cécile Bulle, Manuele Margni
Project Description- 2 papers
• Part A: identification of the relevant modeling choices analyzing the
main differences between water impact assessment methods (scarcity,
stress and impacts on human health), and assessing of their overall
spatial variability and model uncertainty
• Part B: illustration of applicability of water footprint methods through a• Part B: illustration of applicability of water footprint methods through a
case study on a load of laundry and discussion of methods
consistency, reliability and limitations for decision making. Sensitivity
analyses on the case study are chosen based on the relevant modeling
choices identified from part A.
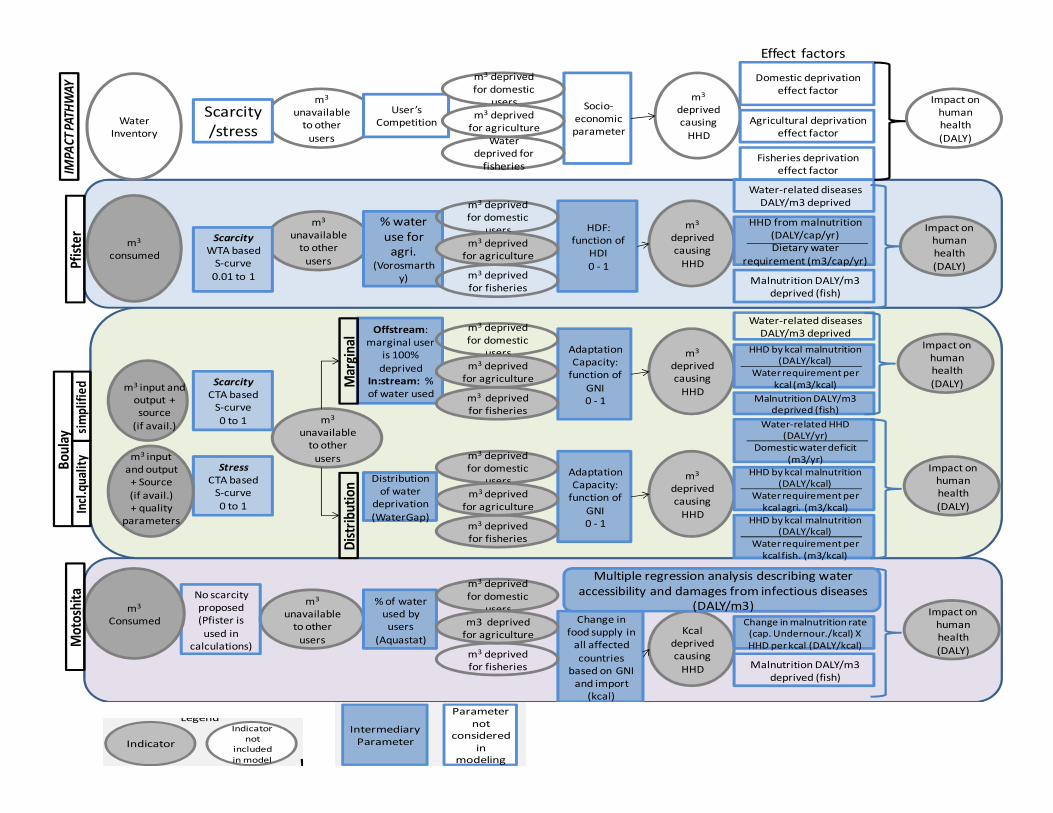
Part A: Methodology overview
• Methods compared:
• Scarcity: Swiss Ecoscarcity, Pfister et al WSI, Boulay et al
(simplfied), WFN Blue water scarcity
• Stress: Veolia Water Impact Index, Boulay et al.
• Human health: Boulay et al (marginal and distribution),
Motoshita et al (domestic and agriculture), Pfister et al.
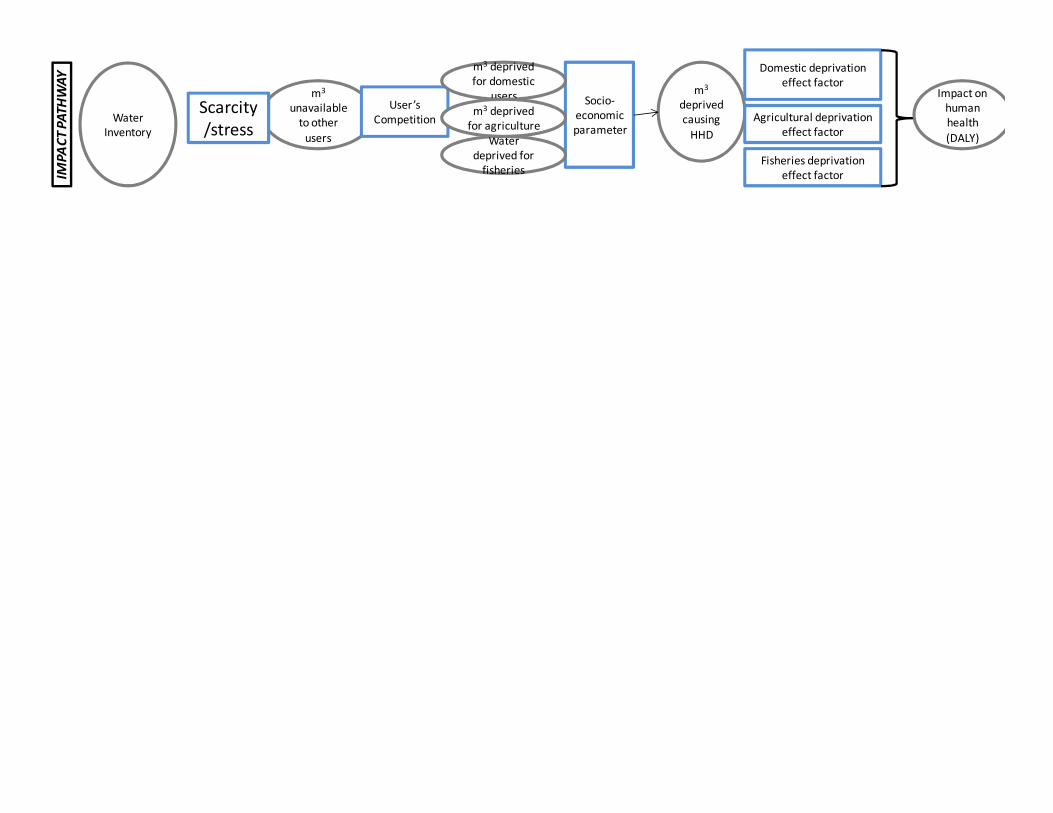
m3
unavailable
to other
users
m3
deprived
causing
HHD
Impact on
human
health
(DALY)
Scarcity
/stress
Socio-
economic
parameter
User’s
Competition
m3 deprived
for domestic
users
Water
deprived for
fisheries
m3 deprived
for agriculture
Domestic deprivation
effect factor
Agricultural deprivation
effect factor
Fisheries deprivation
effect factor
Water
Inventory
IMP
AC
T P
AT
HW
AY
m3
unavailable
to other
users
m3
deprived
causing
HHD
Impact on
human
health
(DALY)
Scarcity
WTA based
S-curve
0.01 to 1
HDF:
function of
HDI
0 - 1
% water
use for
agri.(Vorosmarth
y)
Water-related diseases
DALY/m3 deprived
HHD from malnutrition
(DALY/cap/yr)
Dietary water
requirement (m3/cap/yr)
Malnutrition DALY/m3
deprived (fish)
m3
deprived
causing
HHD
Impact on
human
health
(DALY)Scarcity
CTA based
S-curve
Adaptation
Capacity:
function of
GNI
0 - 1
Offstream:
marginal user
is 100%
deprived
In:stream: %
of water used
Water-related diseases
DALY/m3 deprived
Malnutrition DALY/m3
deprived (fish)
m3
consumed
Pfis
ter
Mar
gina
l
sim
plif
ied
m3 deprived
for domestic
users
m3 deprived
for fisheries
m3 deprived
for agriculture
m3 deprived
for domestic
users
m3 deprived
for fisheries
m3 deprived
for agriculture
m3
unavailable
to other
users
m3
deprived
causing
HHD
Impact on
human
health
(DALY)
Scarcity
/stress
Socio-
economic
parameter
User’s
Competition
m3 deprived
for domestic
users
Water
deprived for
fisheries
m3 deprived
for agriculture
Domestic deprivation
effect factor
Agricultural deprivation
effect factor
Fisheries deprivation
effect factor
Water
Inventory
HHD by kcal malnutrition
(DALY/kcal)
Water requirement per
kcal (m3/kcal)
IMPA
CT
PATH
WA
Y
m3 input and
output +
source
Effect factors
Legend
Indicator
Indicator
not
included
in model WTA
m3
unavailable
to other
users
S-curve
0 to 1deprived (fish)
m3
deprived
causing
HHD
Impact on
human
health
(DALY)
Adaptation
Capacity:
function of
GNI
0 - 1
m3 deprived
for domestic
users
m3 deprived
for fisheries
m3 deprived
for agriculture
Water-related HHD
(DALY/yr)
Domestic water deficit
(m3/yr)
HHD by kcal malnutrition
(DALY/kcal)
Water requirement per
kcal fish. (m3/kcal)
m3
unavailable
to other
usersKcal
deprived
causing
HHD
Impact on
human
health
(DALY)
No scarcity
proposed
(Pfister is
used in
calculations)
Change in
food supply in
all affected
countries
based on GNI
and import
(kcal)
% of water
used by
users
(Aquastat)
m3 deprived
for domestic
users
m3 deprived
for fisheries
m3 deprived
for agriculture
Water-related
diseases
DALY/m3
deprived
Change in malnutrition rate
(cap. Undernour./kcal) X
HHD per kcal (DALY/kcal)
Malnutrition DALY/m3
deprived (fish)
m3
Consumed
Boul
ayM
otos
hita
Stress
CTA based
S-curve
0 to 1
Dis
trib
utio
n
sim
plif
ied
Incl
.qua
lity
for fisheries
Distribution
of water
deprivation
(WaterGap)
Multiple regression analysis describing water
accessibility and damages from infectious diseases
(DALY/m3)
HHD by kcal malnutrition
(DALY/kcal)
Water requirement per
kcal agri. (m3/kcal)
source
(if avail.)
m3 input
and output
+ Source
(if avail.)
+ quality
parameters
Intermediary
Parameter
Parameter
not
considered
in
modeling
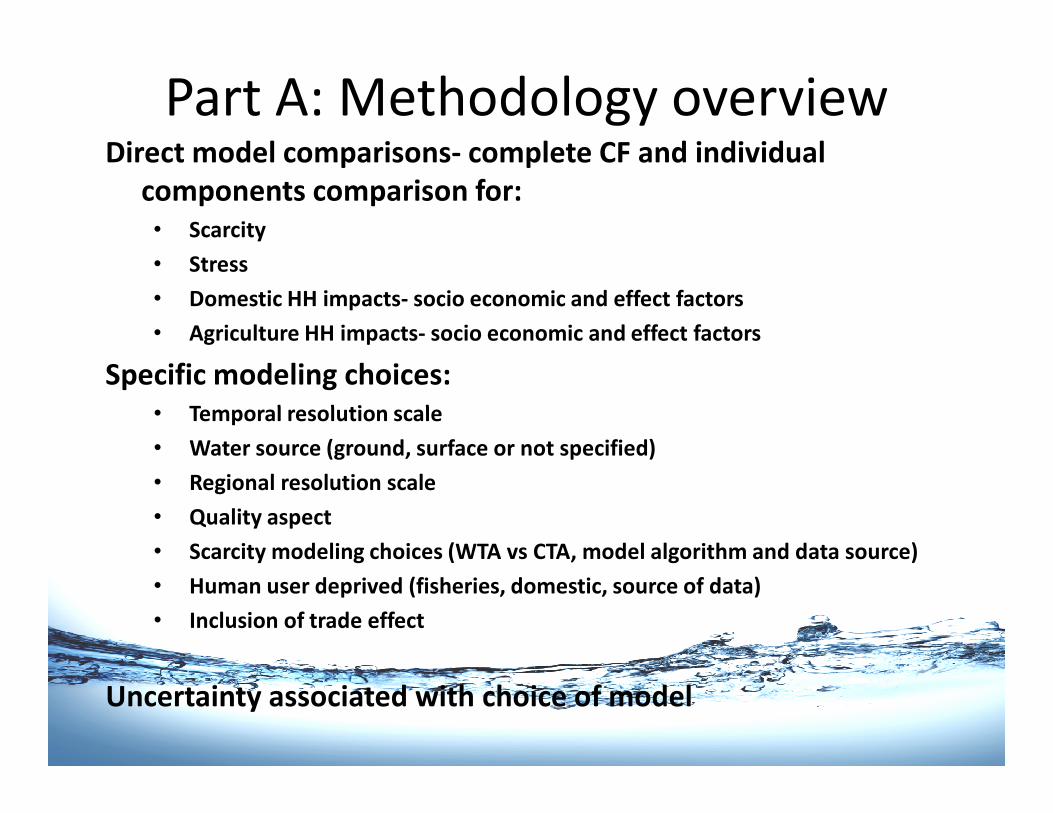
Part A: Methodology overviewDirect model comparisons- complete CF and individual
components comparison for:• Scarcity
• Stress
• Domestic HH impacts- socio economic and effect factors
• Agriculture HH impacts- socio economic and effect factors
Specific modeling choices:• Temporal resolution scale• Temporal resolution scale
• Water source (ground, surface or not specified)
• Regional resolution scale
• Quality aspect
• Scarcity modeling choices (WTA vs CTA, model algorithm and data source)
• Human user deprived (fisheries, domestic, source of data)
• Inclusion of trade effect
Uncertainty associated with choice of model
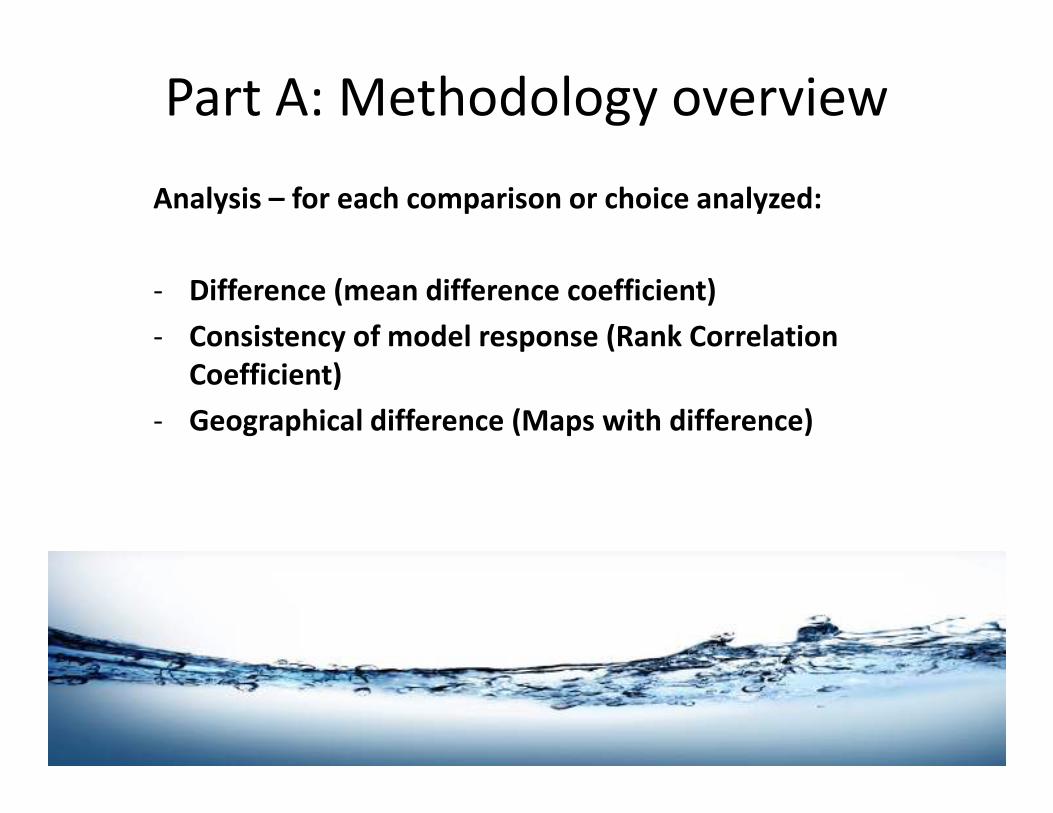
Part A: Methodology overview
Analysis – for each comparison or choice analyzed:
- Difference (mean difference coefficient)
- Consistency of model response (Rank Correlation Coefficient)
- Geographical difference (Maps with difference)- Geographical difference (Maps with difference)
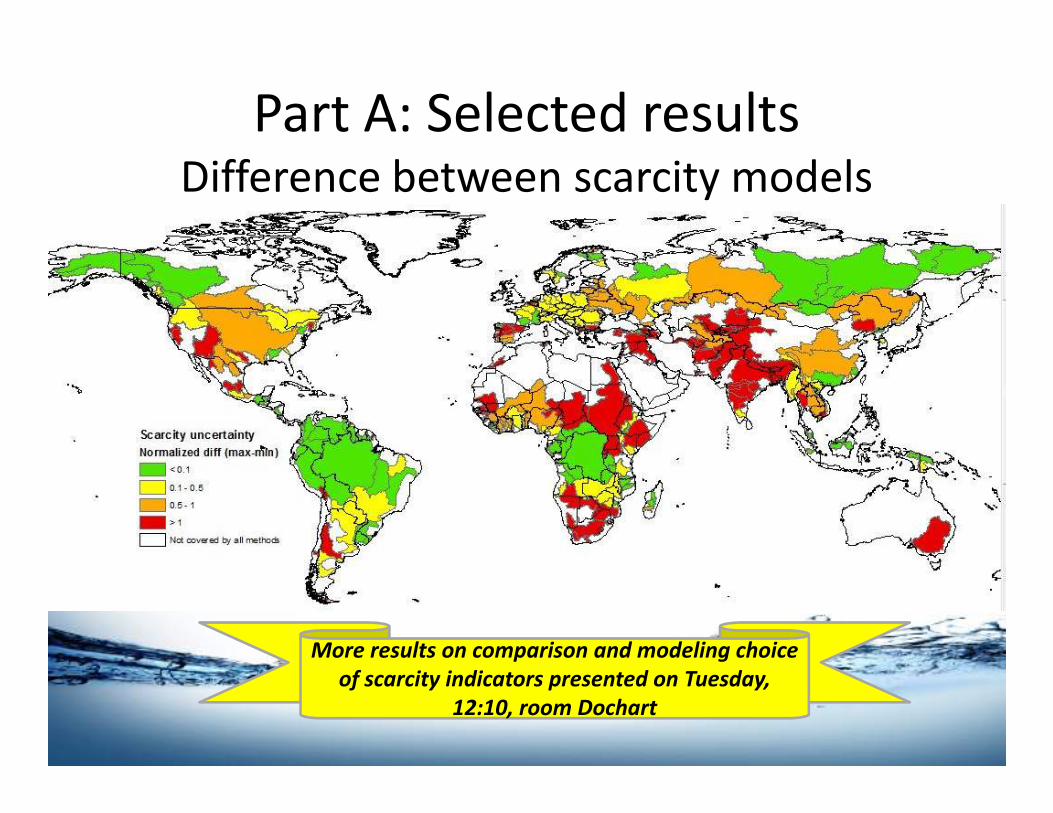
Part A: Selected resultsDifference between scarcity models
More results on comparison and modeling choice
of scarcity indicators presented on Tuesday,
12:10, room Dochart
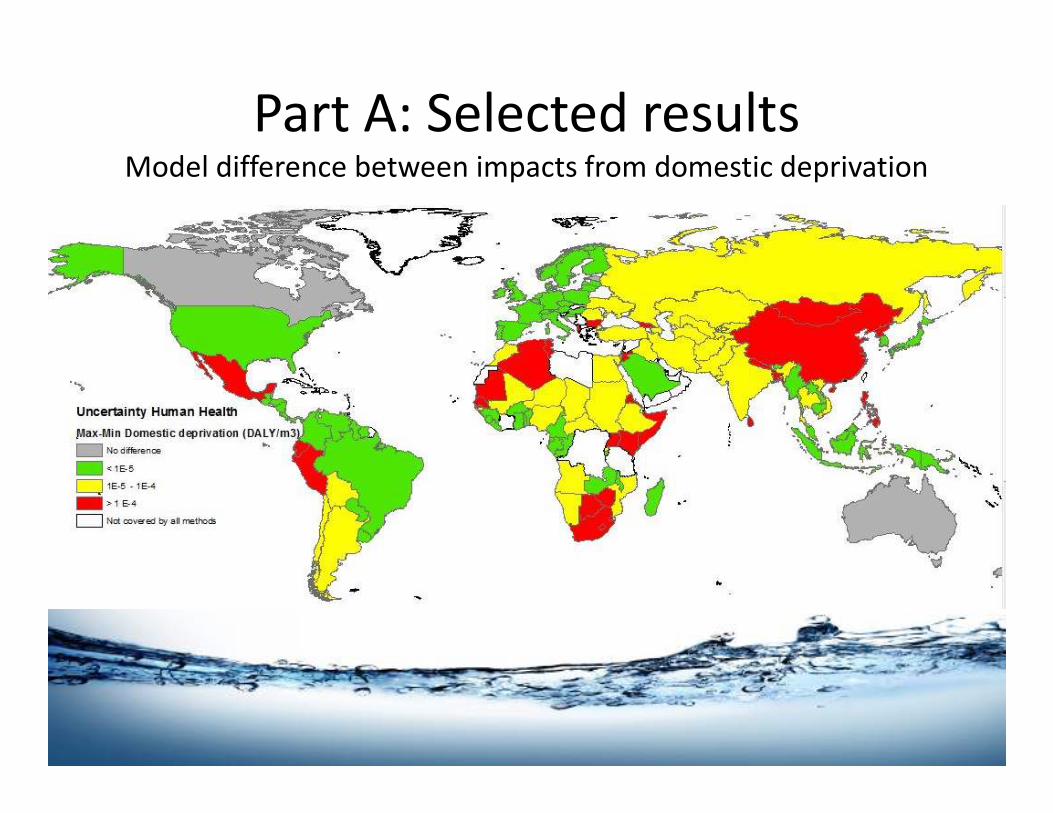
Part A: Selected resultsModel difference between impacts from domestic deprivation
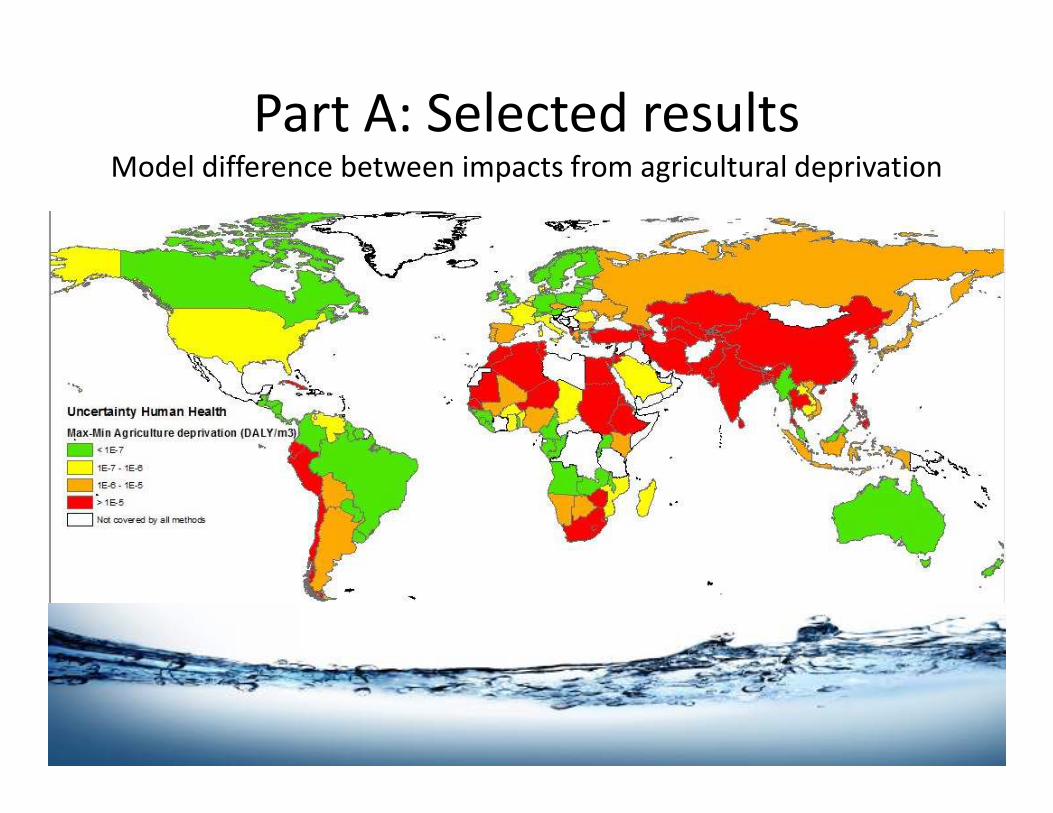
Part A: Selected resultsModel difference between impacts from agricultural deprivation
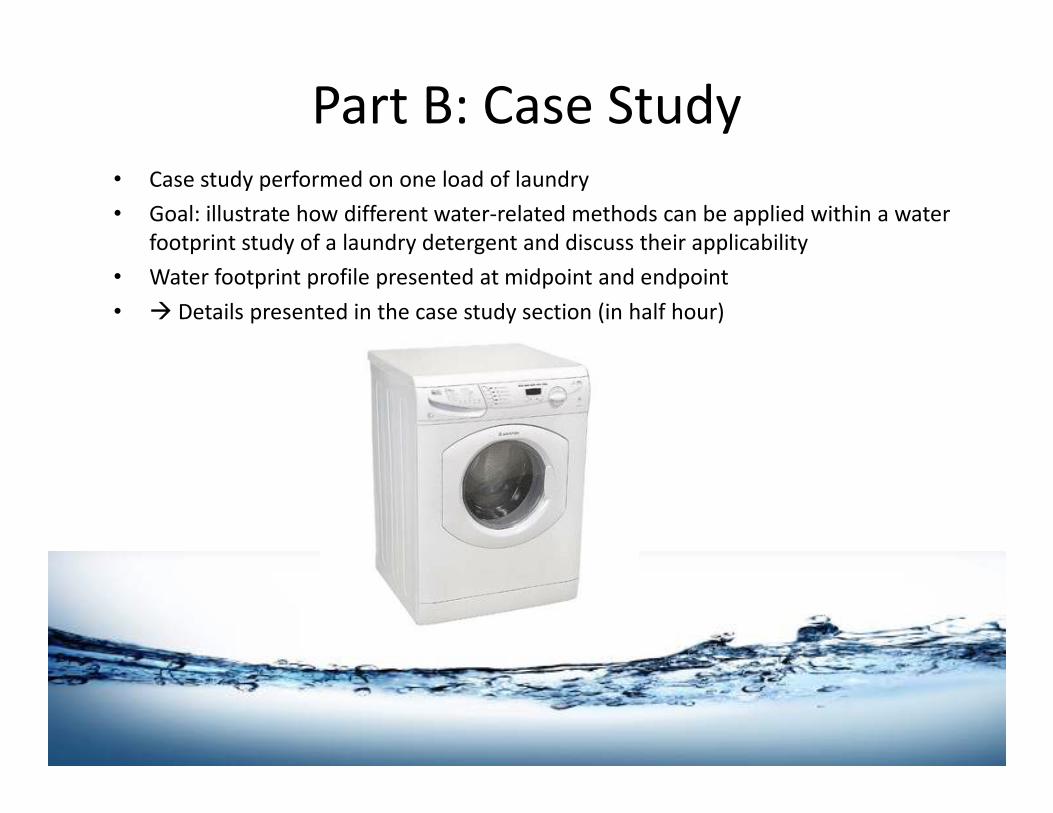
Part B: Case Study• Case study performed on one load of laundry
• Goal: illustrate how different water-related methods can be applied within a water
footprint study of a laundry detergent and discuss their applicability
• Water footprint profile presented at midpoint and endpoint
• � Details presented in the case study section (in half hour)
Outcome and conclusion
- Step towards harmonized methodology:
understanding of important modeling choices and
building blocks of indicators
- Case study in line with current ISO DIS 14046 on
Water Footprint and applicability discussion
- Papers submitted on May 6th (timelime limited by - Papers submitted on May 6th (timelime limited by
PhD)
- WULCA to approve the papers as WULCA papers, and
input from remaining model developers to occur
during review process


![DOC160315-20160315150713 · cooking] S 139 kcal (4 AB) • ltk .20g kicho-kicho.com 350 kcal 150g) ./J\äC4 *WÀJ] 475-6 0075-741-7138 17k 336 kcal](https://img.pdfslide.us/doc/110x75/5c68cadb09d3f2f5638c26b6/doc160315-cooking-s-139-kcal-4-ab-ltk-20g-kicho-kichocom-350-kcal.jpg)
![Chemo-enzymatic synthesis routes for the production of bio ... · -2 kcal/mol-8 kcal/mol - 3 kcal/mol - 5 kcal/mol ∆G0‘: [H] [H] 4-step formation of 1,4 butandiol from glucose](https://img.pdfslide.us/doc/110x75/5f094cee7e708231d4262ba3/chemo-enzymatic-synthesis-routes-for-the-production-of-bio-2-kcalmol-8-kcalmol.jpg)


![First breakfast – about 510 [kcal] -Cornflakes (two spoons) 24[kcal] -Some Milk (one glass) 88[kcal] -4 slices of graham bread 300[kcal] -A Cottage cheese](https://img.pdfslide.us/doc/110x75/5697bfe31a28abf838cb5184/first-breakfast-about-510-kcal-cornflakes-two-spoons-24kcal-some.jpg)