Embed Size (px)
Citation preview

USP Workshop on Particle Size:
Particle Detection and Measurement
December 8-10, 2010; USP Headquarters
Chair: Dr. Steven Byrn,
Purdue University
Session V, Track 2: Oral Formulations
and Components
Mansoor A. Khan, R.Ph., Ph.D.Director, Division of Product Quality Research
Center for Drug Evaluation and Research
Food and Drug Administration
Dec 9, 2010
USP Workshop on Particle Size: Particle Detection and Measurement
USP Headquarters, Rockville, MD
*Impact of particle size on product
performance: An FDA Perspective
*Views expressed are my own and doesn’t necessarily represent FDAs position

3
Outline
• Importance
• Some challenges
• Particle size in ICH Q6A
• Method selection
• Real time measurements

4
Particle size• Particle size is one of the most important
physico-chemical property.
• In the case of suspensions, particle size can affect dissolution, bioavailability, settling, physical and chemical stability, appearance, dose content uniformity etc.
• Particle size is very relevant for API and excipients, as well as other products such as nanoparticles, microspheres, liposomes

5
Which method to use?
Shah RB, Khan MA. In Nanotechnology in Drug Delivery, DeVilliers M et al (Editors), Springer, 2009
Shah RB, Khan MA.. In Nano-materials for Pharmaceutical Scientists, Yin S, et al (Editors), John Wiley & Sons, 2010

6
6
Particle Size Reduction
A change in cube size from 1 mm to 100 nms results in 10 12
particles with a total surface area change from 6 sq mm to 60,000 sq mm
Rate of dissolution : dM/dT = SA x D (Cs -C/)h
Rate of diffusion = dn/dt = P X SA X dC/dX
3434
34
24
19.3Same volumes and Dv but
different surface areas
7
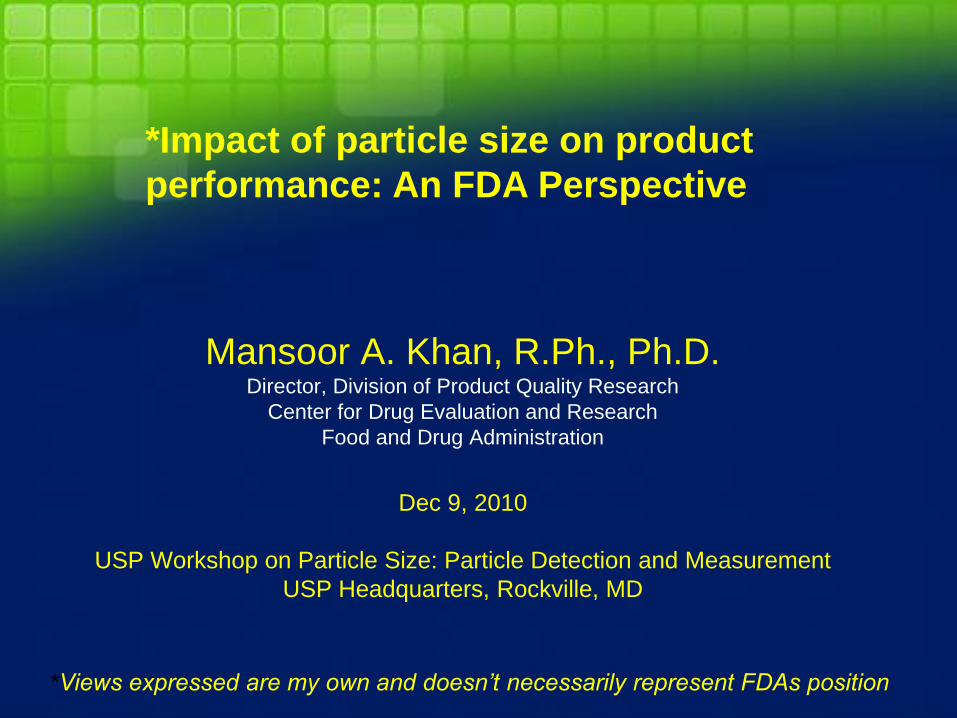
Challenges of particle size
• When is it important?
• Which method?
• How to validate?
• Consistency of results?
• What specs?
• What to expect when spec changes?
• How do we know what we are measuring in a mixture?

8
ICH Q6A
• A “specification” is defined as a list of tests,
reference to analytical procedures, and
appropriate acceptance criteria that are
numerical limits, ranges or other criteria
• Conformance to specifications means that the
drug substance and/or drug product, when
tested according to the listed analytical
procedure, will meet the listed acceptance
criteria

9
ICH Q6A
• Specifications are CRITICAL quality standards that are proposed and justified by the manufacturer and approved by regulatory authorities as conditions of approval.
• .. Should focus on those characteristics found to be useful in ensuring the safety and efficacy of the drug substance and the drug product.
10
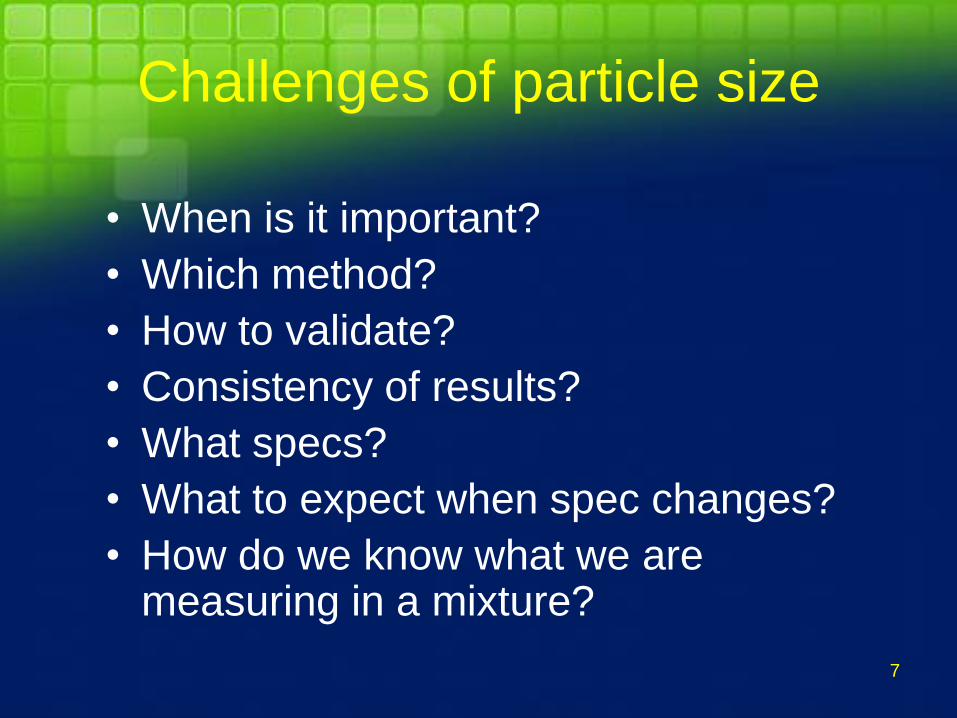
Design and Development
Consideration
• The experience and data obtained during development of a new drug substance or product should form the basis for setting the specifications. It may be possible to propose excluding or replacing certain tests on this basis
• Particle size may be performed as an in-process test, or may be performed as a release test, depending on its relevance to product performance
11
Suspensions – formulation
consideration• It has
– API + excipients that include wetting,
suspending, isotonicity, preservative,
buffer, color, flavor, and others as needed
• Processing variables
– Order of mixing, homogenization,
temperature, batch size etc.

12
Quality of suspension
• Assay and potency
• Viscosity
• Aggregation
• Settling
• Dissolution
• Bioavailability
• Other qualities, eg. pH, isotonicity etc.

13
Importance of particle size
• What is changing?
• Is the particle size critical for the in-process or
batch release?
• If critical, monitor it.
• If settling, explain the reasons, eg.
• Stoke‟s Equation, R = r2(ρs – ρ0) / 9 ŋ

14
ICH Q6A (Draft) Decision Tree #3
Is the drug product a solid dosage form or liquid containing undissolved drug substance?
1. Is the particle size critical to dissolution,
solubility, or bioavailability?
2. Is the particle size critical to drug product
processability?
3. Is the particle size critical to drug product stability?
4. Is the particle size critical to drug product
content uniformity?
5. Is particle size critical for maintaining
product appearance?
No drug substance particle size acceptance criterion required for solution
dosage forms.
NO
No Acceptance Criterion Required Set Acceptance
Criterion
If YES to any
YES
If NO to all

15
Method selection
• Some helpful considerations,– Is the method widely used/well understood?
– Are some standards available for validation? Gauge R&R, robustness, and other validation parameters
– Limitation wrt size, shape, agglomeration, cohesiveness, flowability, brittleness, availability, phase of development etc.
– Availability of the equipment for the life of the product.

16
One example from laboratory
data• Objective
– To measure and compare dissolution profiles of
various size fractions of a poorly soluble drug
substance to establish performance criteria
– To perform comparative evaluation of the same
sample lot by several measurement techniques
– To develop an approach to setting particle size
specifications

17
Nitrofurantoin Drug Substance
Low Solubility (0.2-0.4 mg/ml at pH 7.4)
Dissolution is dependent on particle size
Large Particle Size Range (d10=18 ; d90=300 )
Dissolution Testing
Apparatus 2: 50 rpm, 37oC
Rainbow Monitor: UV Fiber-Optic Probe
Particle Size Techniques
Sieving (ATM Sonic Sifter)
Laser Diffraction (Malvern Mastersizer)
Light Obscuration (AccuSizer)
Image analysis (Beckman Coulter RapidVue)
Methods

18
Nitrofurantoin Dissolution
Six Sized Fractions
0
20
40
60
80
100
0 30 60 90 120 150 180
Time (min)
% D
isso
lve
d
20-32 u
32-45 u
45-63 u
63-90 u
90-150 u
150-212 u

19
Dissolution Modeling to Determine Particle
Size
V
XC
r
XXDX
dt
dXd
s
dd
2
0
31
0
32
03

20
Nitrofurantoin Dissolution
Modeling Large Sized Fractions
150-212u fraction 90-150u fraction
0.0
20.0
40.0
60.0
80.0
100.0
0 50 100 150 200
Time (min)
% D
isso
lve
d
90-150 fit
90-150 exp
0.0
20.0
40.0
60.0
80.0
100.0
0 50 100 150 200
Time (min)
% D
isso
lve
d
150-212 fit
150-212 exp

21
Comparison of Median Particle Sizes
from Calculation and Measurement
DisFit 3 = Predicted from Dissolution using 3 point distribution
DisFit 1 = Predicted from Dissolution using 1 size only (no distribution)
C om parison of d 50 D iam eters ( )
S ize
Fraction
C alculated
D isFit 3
C alculated
D isFit 1
Laser
D iffraction
Im age
A nalysis
L ight
O bscuration
20-32 64 65 38 52 48
32-45 63 64 50 63 64
45-63 71 71 66 76 85
63-90 80 94 86 95 105
90-150 88 117 114 105 134
150-212 100 140 87 99 108

22
Photomicrographs of Nitrofurantoin
90-150 Fraction

media or description particle size (nm)
SUP-0.6 mL TiO2 in PBS 1050.9
TiO2 in PBS (pH 7.4) 553.6
mouse serum 857.3
mouse serum 1161.1
ethanol 910.6
buffered solution (pH 5) 926.7
buffered solution (pH 8) 1094.1
buffered solution (pH 7) 1004.2
buffered solution (pH 6) 2008.7
PS-50 PBS (pH7.4) 14
PS-500 PBS (pH7.4) 169.6
PS-500 PBS (pH7.4) 169.6media or description particle size (nm)
water 9.6
water 10
water 116.2
water 92.6
Old lot of samples from a
manufacturer- claimed
particle size below 50 nm
DPQR results
New lot of samples
DPQR results

24
Dissolution profile vancomycin SD
Dissolutinon profile of Vancomycin SD formulation
0
20
40
60
80
100
120
0 5 10 15 20 25 30 35 40 45
Time (min)
% V
ancom
ycin
D
issolv
ed
Initial
25 0C/60%RH-1 month R
40 0C/75%RH-1 month R
DPQR study 2009

25
XRD cryomilled
carbamazepine
DPQR study 2010

26
pK changes with crystallinity
Yamashita et al., IJP, 2003, 267, 79-91

27
Plackett Burman screening factors and response for liposomes
#
Phospholipid
wt
Cholesterol wt
Stearylamine wt
Drug conc.
Particle sizing
Washing cycles
Hydration time
Entrap. EFF
Release
rate constant Size
mg mg mg mg/mL nm No. min % hr-1 nm
1 100 25 5 5 50 0 20 24.06 0.15 134.3
2 100 25 15 2.5 50 1 10 37.18 0.12 105.5
3 100 25 15 2.5 100 1 20 33.44 0.16 44.65
4 100 50 5 2.5 100 0 20 22.64 0.17 160.35
5 100 50 5 5 100 1 10 26.69 0.10 153.05
6 100 50 15 5 50 0 10 40.75 0.17 44.35
7 150 25 5 2.5 100 0 10 31.04 0.15 98.35
8 150 25 5 5 50 1 20 20.06 0.11 70.4
9 150 25 15 5 100 0 10 41.19 0.16 158.5
10 150 50 5 2.5 50 1 10 20.67 0.13 91
11 150 50 15 2.5 50 0 20 58.95 0.13 129.45
12 150 50 15 5 100 1 20 30.68 0.11 112.7
Factors Responses

28
Particle size Pareto chart
Particle sizing(200,800)
Washing cycles[One]
Stearyl amine w t(5,15)
Cholesterol w t(25,50)
Drug conc.(5,10)
Phospholipid w t(100,150)
Hydration time(10,20)
Term
0.7778648
0.7544167
-0.5724391
0.4037149
0.2242860
0.0927729
0.0056072
t Ratio
DPQR Study, 2010

29
• It has never been challenged: the impact is unknown
• The particle size distribution specifications for the raw materials are sometimes wide
• This would allow batches with really different physical properties which may impact the process
• This is true for:– Lactose 200 mesh
– Crospovidone XL
– Lactose spray-dried
– Microcrystalline cellulose
– API (impact will be assessed in the follow-up DoE)
Understanding excipient variability: Why
challenge the particle size distribution ?
30
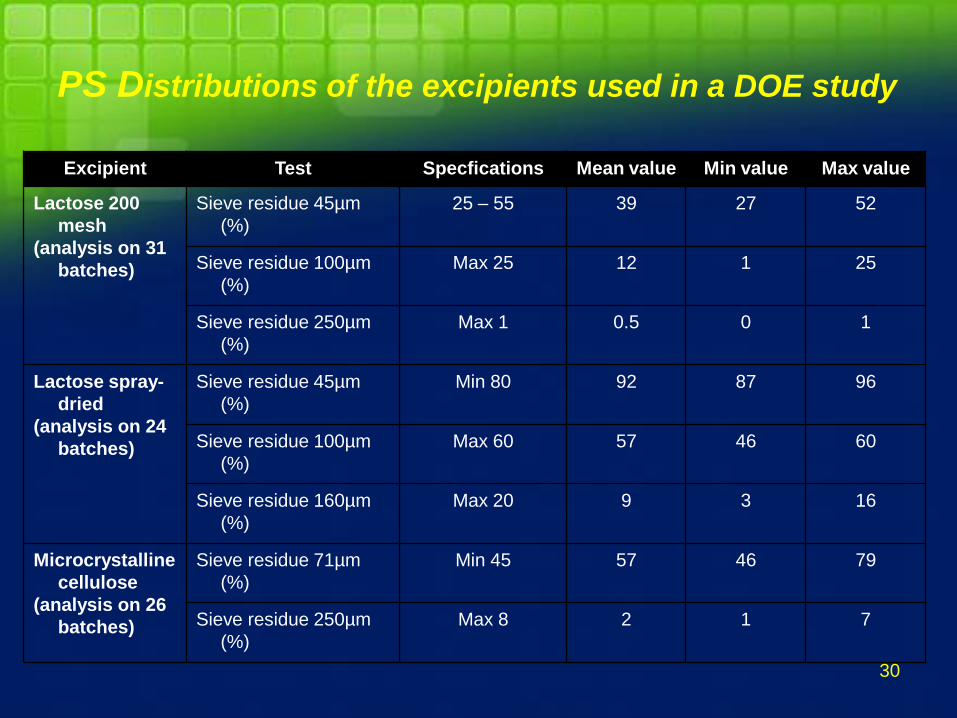
Excipient Test Specfications Mean value Min value Max value
Lactose 200
mesh
(analysis on 31
batches)
Sieve residue 45µm
(%)
25 – 55 39 27 52
Sieve residue 100µm
(%)
Max 25 12 1 25
Sieve residue 250µm
(%)
Max 1 0.5 0 1
Lactose spray-
dried
(analysis on 24
batches)
Sieve residue 45µm
(%)
Min 80 92 87 96
Sieve residue 100µm
(%)
Max 60 57 46 60
Sieve residue 160µm
(%)
Max 20 9 3 16
Microcrystalline
cellulose
(analysis on 26
batches)
Sieve residue 71µm
(%)
Min 45 57 46 79
Sieve residue 250µm
(%)
Max 8 2 1 7
PS Distributions of the excipients used in a DOE study
31
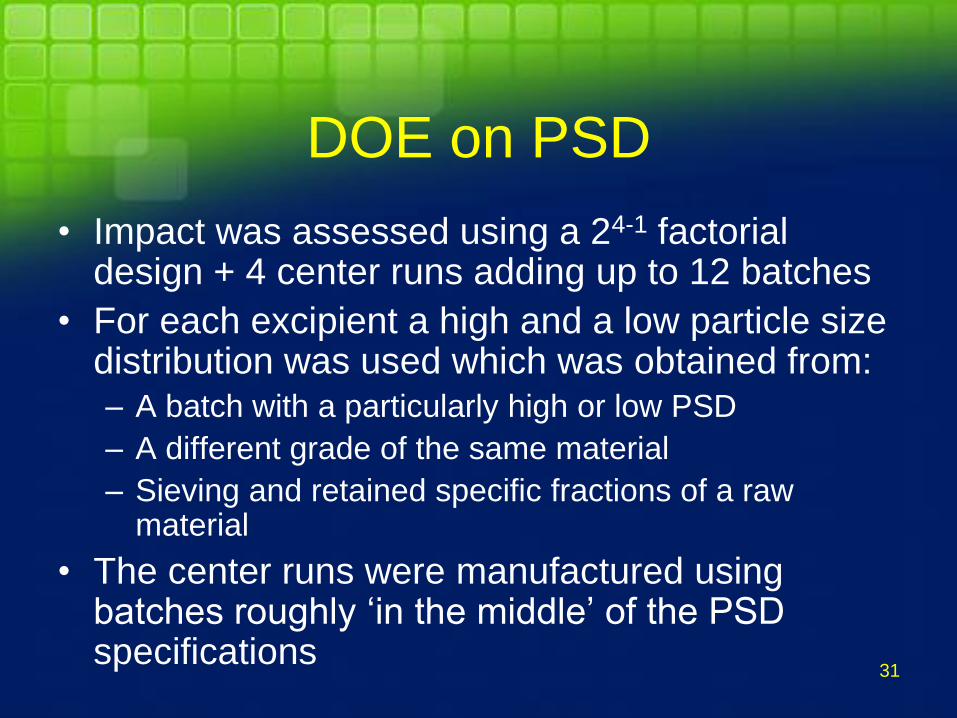
DOE on PSD
• Impact was assessed using a 24-1 factorial design + 4 center runs adding up to 12 batches
• For each excipient a high and a low particle size distribution was used which was obtained from:– A batch with a particularly high or low PSD
– A different grade of the same material
– Sieving and retained specific fractions of a raw material
• The center runs were manufactured using batches roughly „in the middle‟ of the PSD specifications

32
Responses measured for PSD
DOE
• CU
• Dissolution
• Power consumption profiles
• Drying profiles
• Compression parameters

33
Potential on-line monitoring? Near
Infrared (NIR) studies

34
Zidan et al., Spectral and spatial characterization of protein loaded PLGA nanoparticles, 2009.
J.Pharm. Sci.,

35

36
Schematic of Lasentec FBRM

37
On-line Microparticle formation
Monitoring by FBRM and PVM
Zidan AS., Rahman Z., Khan MA. Online Monitoring of PLGA Microparticles Formation Using Lasentec
Focused Beam Reflectance (FBRM) and Particle Video Microscope (PVM). AAPS J. 2010 Mar 30.

38
Offline product
characterization
Digital
Pump
ProbeProbe
Water
FBRM
system
PVM
system
Co-precipitation vessel
Case Study: PAT Approach to determine nucleation and
growth mechanisms of a dynamic co-precipitation process
-H. Wu & M. Khan, Accepted for publication by J. Pharm. Sci., Nov. 2010

39
In-situ Real-time Nucleation induction time
measurements: FBRM and NIR process trajectory
Wu and Khan, J. Pharm. Sci., 2010

40
Product characterization: PVM, Chemical Imager
Wu and Khan, J. Pharm. Sci., Nov. 2010

41
Nucleation and growth mechanisms
At low S, heterogeneous primary nucleation mechanism;
At high S, homogeneous primary nucleation mechanism.
-H. Wu & M. Khan, J. Pharm. Sci., 2010

42
Conclusions
• Challenges for particle size consistency
need to be addressed
• Processes and product compositions that
affect the particle size and its performance
need to be understood
• An integrated PAT approach is essential
for in-depth process and product
understanding

Impact of Particle Size on Content Uniformity and Dissolution
Brian Rohrs, Ph.D.
USP Workshop on Particle SizeDecember 8-10, 2010

Acknowledgements
• Greg Amidon
• Rich Meury
• Harry King
• David Best
• Pam Secreast
• Connie Skoug
General Approach
• Define problem
• Develop model based on theoretical concepts
• Generate data to test model and demonstrate its utility
• Use the model to explore impact of parameters (e.g., particle size)
• Develop guidelines for particle size ranges

Effect of Particle Size on Content Uniformity

Content Uniformity vs. Particle Size
0 1

Content Uniformity vs. Drug Load
0 1 2 3 4

Practical Question:
You have to design a new low dose formulation.
At what particle size do you have to start worrying about
content uniformity?

0 50 100 150 200 250 300 350 400
m icrons

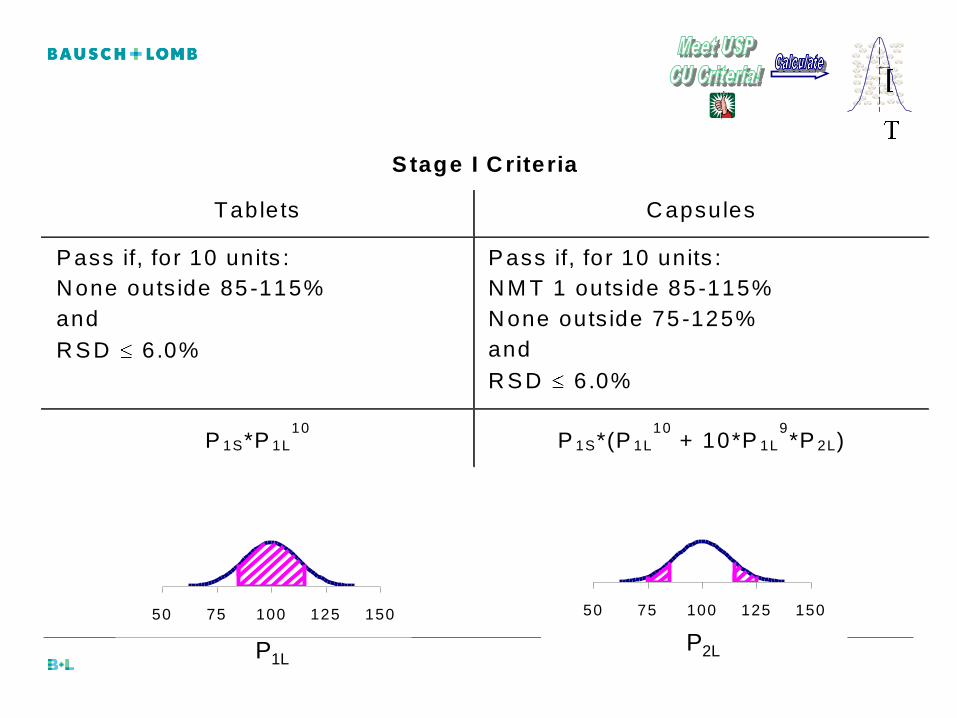
T esting T ablets Capsules
Stage I
T est 10
Pass if:
N one outside 85-115%
and
RSD 6 .0%
Pass if:
N M T 1 outside 85-115%
N one outside 75-125%
and
RSD 6 .0%
Stage II
T est 20
Pass if, for all 30 units:
N M T 1 outside 85-115%
N one outside 75-125%
and
RSD 7 .8%
Pass if, for all 30 units:
N M T 3 outside 85-115%
N one outside 75-125%
and
RSD 7 .8%
USP Content Uniformity Criteria

Define Probabilities
P1L = Probability for one unit that 85% x 115%
P2L = Probability for one unit that 75% x < 85% OR 115 < x 125%
P1S = Probability that RSD on 10 units 6.0%
P2S = Probability that RSD on 30 units 7.8%
50 75 100 125 150
P1L
50 75 100 125 150
P2L
S tage I C riteria
Tablets C apsules
P ass if, for 10 units :
N one outs ide 85 -115%
and
R S D 6.0%
P ass if, for 10 units :
N M T 1 outs ide 85 -115%
N one outs ide 75 -125%
and
R S D 6.0%
P 1S*P 1L
10 P 1S*(P 1L
10 + 10*P 1L
9*P 2L)
50 75 100 125 150
P1L
50 75 100 125 150
P2L

S tage II C riteria
Tablets C apsules
P ass if, for a ll 30 units :
N M T 1 outs ide 85 -115%
N one outs ide 75 -125%
and
R S D 7.8%
P ass if, for a ll 30 units :
N M T 3 outs ide 85 -115%
N one outs ide 75 -125%
and
R S D 7.8%
L2
19
L1
20
1L10
L1S1
L2
29
L1
S2
PP20
PPP1
PP10
P
3
L2
27
L1
2
L2
28
L1
L2
29
L1
30
L1
S1
3
L2
27
L1
2
L2
28
L1
S2
PP3040
PP390
PP30P
P1
PP1020PP45
P

50 75 100 125 150
50 75 100 125 150
P1L = Prob (85% x 115%)
P2L = Prob (75% x 85%) or
Prob (115% x 125%)
P1L = NORMDIST(115,100, cu,TRUE) NORMDIST(85,100, cu,TRUE)
P2L = NORMDIST(125,100, cu,TRUE) NORMDIST(75,100, cu,TRUE) – P1L
Need method to determine probabilities:
Use EXCEL function Normdist to calculate P1L & P2L

Sample and Population standard deviations related by 2 distribution:
Use EXCEL function Chidist to calculate P1S & P2S
For cu = 7.0%:
P1S = Prob RSD 6.0%
P2S = Prob RSD 7.8%
0 5 10 15 20 25 30
2
9
0 10 20 30 40 50 60
2
29
2
)1n(2
2s)1n(

Probability o f Passing Tablet C ontent U niform ity vs.
R ela tive S tandard D evia tion o f U nit D ose
0.50
0.55
0.60
0.65
0.70
0.75
0.80
0.85
0.90
0.95
1.00
3 3.5 4 4.5 5 5.5 6 6.5 7 7.5
S igm a
Fra
cti
on
al
Pro
ba
bil
ity
P ass a t S tage I Pass a t S tage II
Can now relate tablet population RSD to
the probability of passing USP CU criteria
Table 1. Population standard deviation (expressed as C v) to pass
U SP C U criteria at various p -va lues.
Tablets C apsules Probability
Pass C U Stage I S tage II S tage I S tage II
0 .900 4.64 6.33 4.70 6.86
0.950 4.33 6.03 4.38 6.59
0.990 3.84 5.46 3.87 6.12
0.999 3.39 4.84 3.41 5.65

0 50 100 150 200 250 300 350 400
m icrons
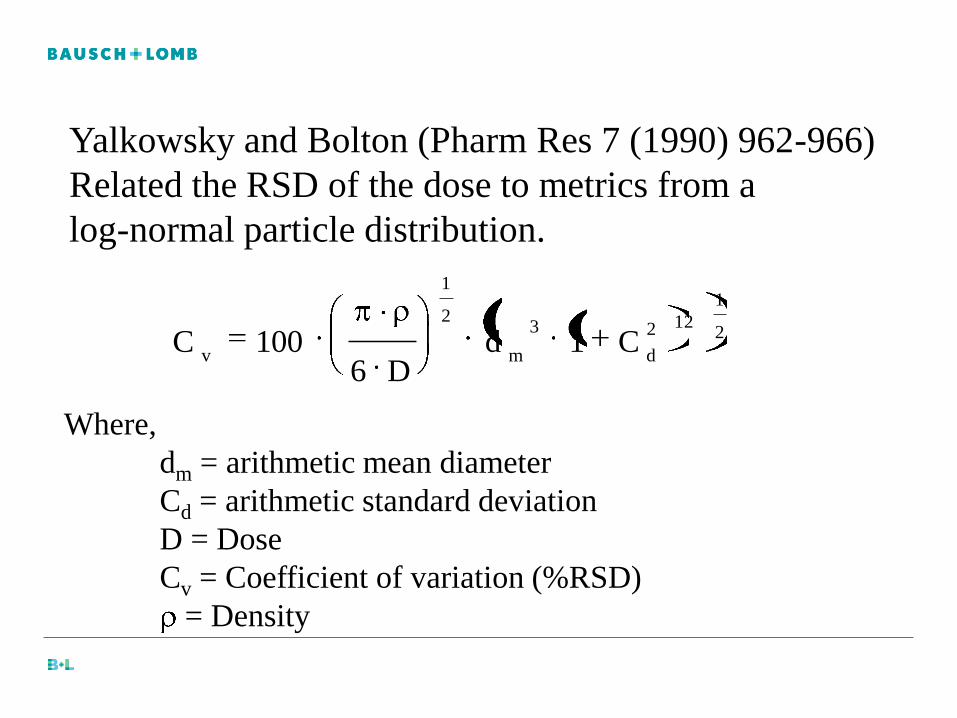
Yalkowsky and Bolton (Pharm Res 7 (1990) 962-966)
Related the RSD of the dose to metrics from a
log-normal particle distribution.
Where,
dm = arithmetic mean diameter
Cd = arithmetic standard deviation
D = Dose
Cv = Coefficient of variation (%RSD)
= Density
2
1
122
d
3
m
2
1
vC1d
D6100C

33
2
vln5.4
g10
100
Ce
D6d
g
2
Where,
dg’ = geometric mean diameter (d50)
σg = geometric standard deviation ~ (d84/d16)
D = Dose
Cv = Coefficient of variation of the dose (%RSD)
= Density of API
Use volume (weight) basis descriptors and rearrange
expression to estimate d50 as a function of Dose and
%RSD*
*Rohrs, et.al., J Pharm Sci 95:5 (2006) 1049-1059

Maximum Mean Volume Particle Diameter, d50
( m)
Predicted to Pass USP Content Uniformity Test (99% Confidence)
as a Function of Geometric Standard Deviation (g) and Dose (mg)
Dose, mg
0.1 1 10 100 1000
Max
imum
Geo
met
ric M
ean
Vol
ume
Par
ticle
Dia
met
er (
d50
),
m
1
10
100
1000
Mic
roni
zing
Mill
ing
Rohrs, Meury, Amidon, August 2002
g
1.0
1.5
2.0
2.5
3.0
3.5
4.0
d90
/d50
1.0
1.7
2.4
3.2
4.1
4.9
5.8
Nomograph for
passing USP Stage I
content uniformity
criteria with 99%
probability.
Maximum Mean
Volume Diameter as
a function of
Geometric Standard
Deviation and Dose

Two API lots with different particle size distributions
130 Lot 003
22.2 d50 29.2
53.0 d90 79.5
2.50 GSD 2.77
0
2
4
6
8
10
0.1 1 10 100 1000
Diameter (µm)
f(d
) in
%
Lot 130 Lot 003

Tablet API DOA Theor. Calc. Ave %RSD
Lot # Lot # dose µg dose(n=30)
55-1 130 July 03 360 343.1 1.27
55-2 130 July 03 90 85.30 2.18
55-3 130 July 03 33 31.40 3.39
55-4 130 July 03 8.2 7.70 4.75
55-5 130 July 03 3.6 3.50 12.27
55-5 130 Oct 03 3.6 3.55 6.60
63-1 130 Oct 03 90 86.20 2.29
63-2 003 Oct 03 1.3 1.55 30.54
63-3 003 Oct 03 5 4.92 5.23
63-4 003 Oct 03 15 14.22 2.35
63-5 003 Oct 03 15 14.33 3.25
CU Assay Results
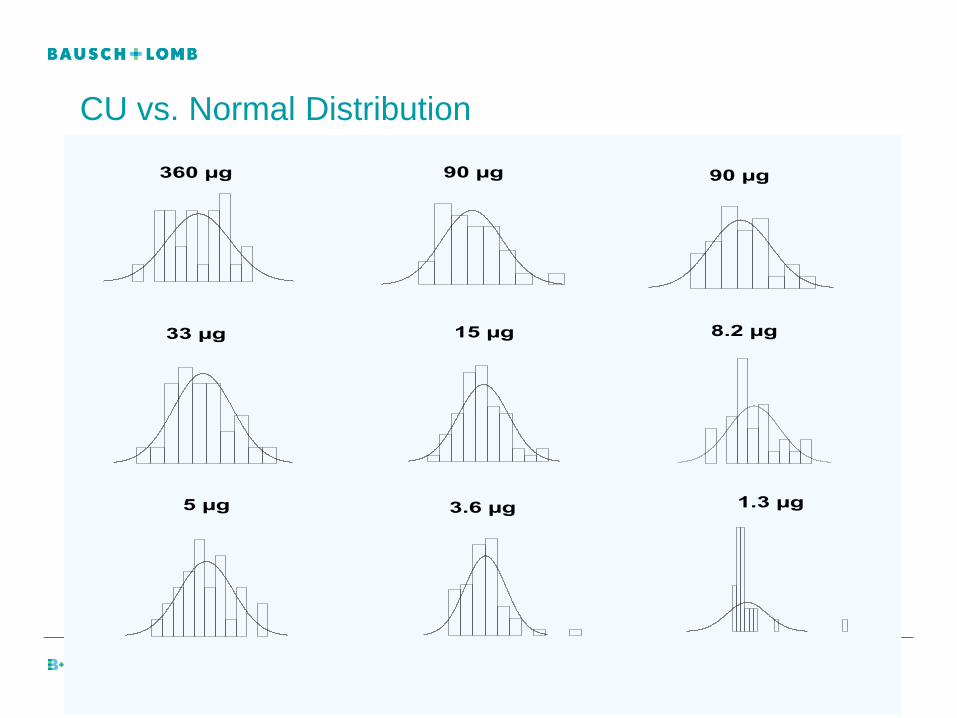
CU vs. Normal Distribution
8.2 µg
3.6 µg 1.3 µg5 µg
15 µg33 µg
90 µg90 µg360 µg

Mass of single spherical particle
(Density = 1.4 g/cc)
1.E-08
1.E-07
1.E-06
1.E-05
1.E-04
50 75 100 125 150
Diameter (µm)
Num
ber
Fra
ction
0
1
2
3
4
Mass (
µg)
003 130 Mass

29
21
i
3
ii
21
v10df
D6100C
w here,
C v = C oefficient of variation (relative standard deviation) of the dose (in % )
D = D ose (in m g)
= D ensity o f the drug (in g/cc)
f i = W eight fraction o f the ith
fraction of drug
d i = D iam eter of the ith
fraction of drug (in m )
MCR Johnson (Pharm Acta Helv 47 (1972) 546-559)
related the RSD of the dose to the particle size distribution

1 10 100 1000
Dose (µg)
0
5
10
15
20
25
30
35
% R
SD
Variation in Content Uniformity
Lot 130 Lot 003 MCJ 130 MCJ 003

Maximum Mean Volume Particle Diameter, d50
( m)
Predicted to Pass USP Content Uniformity Test (99% Confidence)
as a Function of Geometric Standard Deviation (g) and Dose (mg)
Dose, mg
0.1 1 10 100 1000
Max
imum
Geo
met
ric M
ean
Vol
ume
Par
ticle
Dia
met
er (
d50
),
m
1
10
100
1000
Mic
roni
zing
Mill
ing
Rohrs, Meury, Amidon, August 2002
g
1.0
1.5
2.0
2.5
3.0
3.5
4.0
d90
/d50
1.0
1.7
2.4
3.2
4.1
4.9
5.8
Use upper part of
distribution to estimate
GSD?
Lot 130 003
d84/d16 2.50 2.77
d84/d50 2.05 2.28
d90/d50 1.97 2.19
d97/d50 1.83 1.97
0
5
10
1 10 100 1000
Diameter (µm)
f(d)
in %
Lot 130 Lot 003

Effect of Particle Size on Dissolution

Dissolution vs. Particle Size
Dissolution Rate Surface Area
Time Time
% D
issolv
ed
% D
issolv
ed

Dissolution
Tablet Aggregates GranulesPowder
Tablet Dissolution

Practical Question:
You have to design a new solid oral formulation.
For what particle size is dissolution of the primary
particles not a significant factor in the overall dissolution
of the dosage form?

th
a1
CCD2aa 0bs2
0
ha
h
C(sat)
C(bulk)
Concentration Across
Diffusion Layer
Higuchi/Heistand model for dissolution*
*Higuchi WI and Hiestand EN. 1963. J Pharm Sci 52(1):67-71

Particles in a Powder
=
+
+
+
+
+
+
etc.

Compounds for Model Validation
PNU-number, Structure Saturated
Solubility
Diffusion
Coefficient
Density
3.08
mg/ml
8.1 x 10⁻⁶
cm2/sec
1.37
g/cm3
77.4
µg/ml
6.1 x 10⁻⁶
cm2/sec
1.36
g/cm3
PNU-10858
N 2H
N 2H
N
O
NN
PNU-78875
C 3H
C 3H
HC
O
NO
N
N
N
N

Minoxidil Particle Size
Distribution
0
0.1
0.2
0.3
0.4
1 10 100 1000
Radius (microns)
No
rma
lized
Dis
trib
uti
on
45.5 µm
184 µm
247 µm
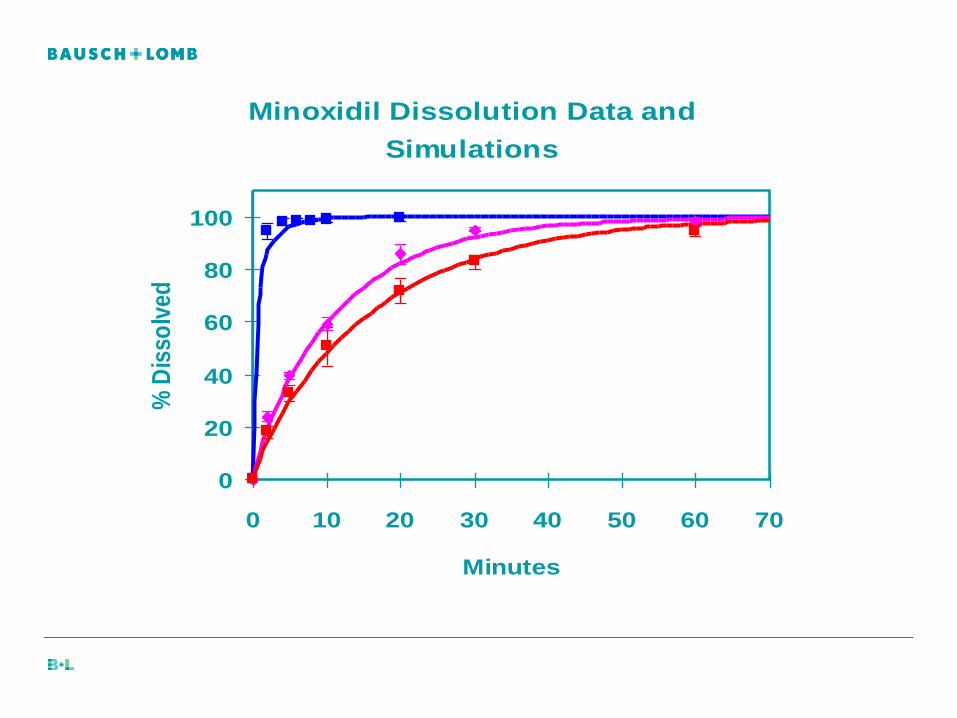
Minoxidil Dissolution Data and
Simulations
0
20
40
60
80
100
0 10 20 30 40 50 60 70
Minutes
% D
isso
lved

PNU-78875 Particle Size
Distribution
0
0.05
0.1
0.15
0.2
0.25
0.1 1 10 100
Radius (microns)
No
rmal
ized
Dis
trib
utio
n
1.55 µm
5.45 µm
12.05 µm
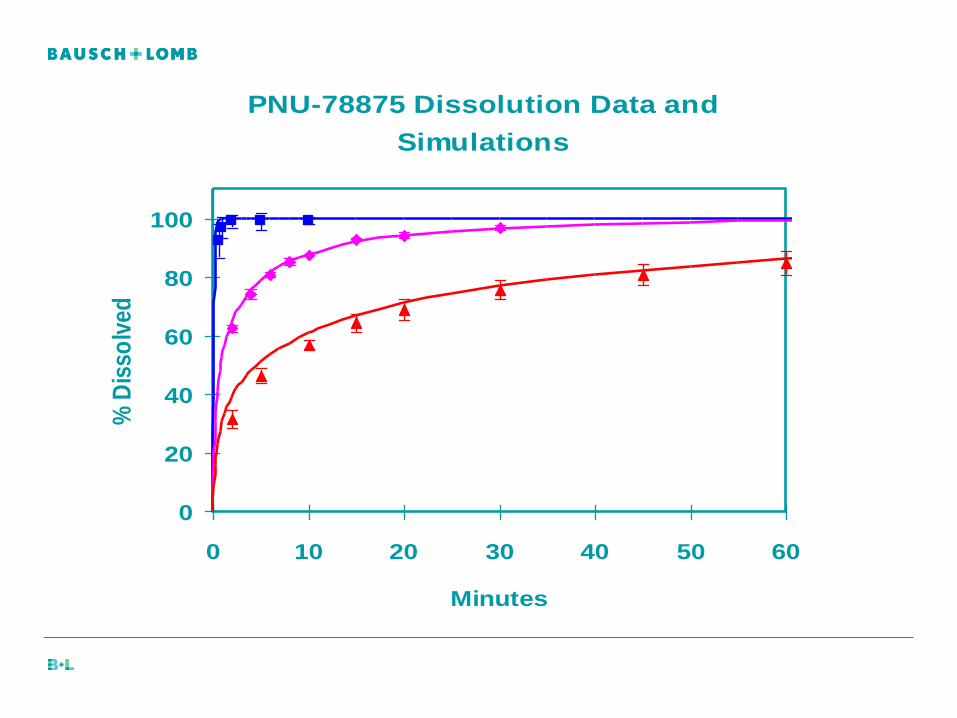
PNU-78875 Dissolution Data and
Simulations
0
20
40
60
80
100
0 10 20 30 40 50 60
Minutes
% D
isso
lved

Dose Number: Do
SC
VMDo
00
LRQ
rrCrDDn
S
2
3
0342
004
Q
LRPAn
eff
• Ratio of dose concentration (mass/volume) to
the saturation solubility (Cs)
• How much drug are you trying to dissolve over
how much drug you can actually get into solution
• As Do goes from 0 to 1, become more
saturated
• If Do > 1, incomplete dissolution (solids left)

PNU-78875 Dissolution vs.
Dose Number
0
20
40
60
80
100
0 10 20 30 40 50 60
Minutes
% D
isso
lved
0.09 Data
0.09 Sim
0.4 Data
0.4 Sim
0.8 Data
0.8 Sim

Powder Dissolution vs Width of Particle Size Distribution
0
20
40
60
80
100
0 15 30 45 60 75 90
M inutes
% D
iss
olv
ed
1 .5 2 3
Particle Size Distributions
d80 = 25 µm, varying σg
Dissolution (Do = 0.1)
t80 = 30 min for all σg
0
0.2
0.4
0.6
0.8
1
0.1 1 10 100 1000
M icrons
Fra
cti
on
d80 1.5 2 3
When modeled, dispersed particles dissolve
independently from one another
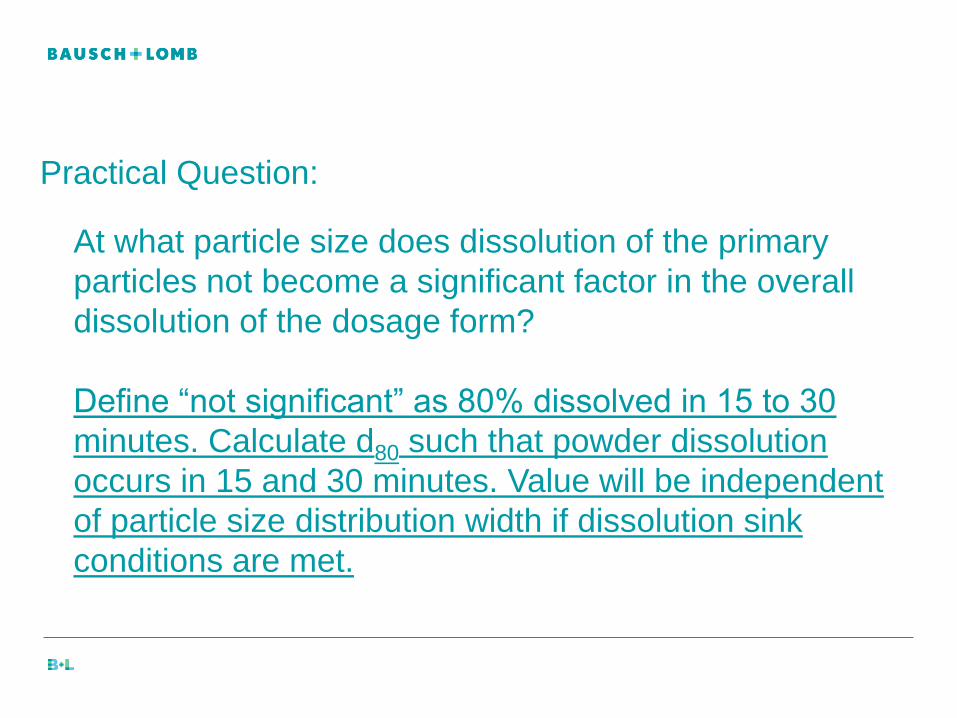
Practical Question:
At what particle size does dissolution of the primary
particles not become a significant factor in the overall
dissolution of the dosage form?
Define “not significant” as 80% dissolved in 15 to 30
minutes. Calculate d80 such that powder dissolution
occurs in 15 and 30 minutes. Value will be independent
of particle size distribution width if dissolution sink
conditions are met.
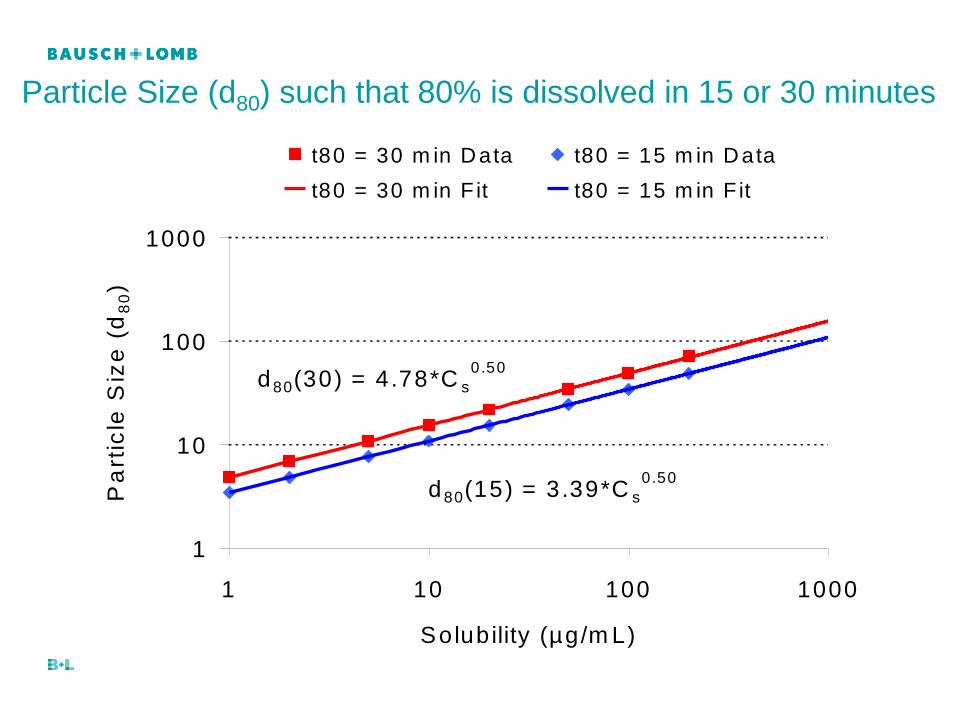
Particle Size (d80) such that 80% is dissolved in 15 or 30 minutes
d80(30) = 4.78*C s
0.50
d80(15) = 3.39*C s
0.50
1
10
100
1000
1 10 100 1000
Solubility (µg/m L)
Pa
rtic
le S
ize
(d
80)
t80 = 30 m in D ata t80 = 15 m in D ata
t80 = 30 m in F it t80 = 15 m in F it

Conclusions
• For Content Uniformity, large particles will have the greatest impact on failures. The nomograph can be used to give guidance on mean and width of particle size distribution such that primary particle size is not a concern.
• For Dissolution, smaller particles result in faster dissolution. Guidance for particle size such that primary particles do not significantly impact dissolution (assume sink conditions) can be determined from the supplied equations.

Impact of Particle Size on Performance
Manufacturing Performance:
Flow and Segregation
Jim PrescottSenior Consultant
400 Business Park Dr.
Tyngsboro, MA 01879
(978) 649-3300
USP Workshop on Particle Size: Particle Detection and Measurement
December 8-10, 2010 Rockville, MD

©2010 Jenike & Johanson, Inc.
Process
PerformanceParticle Size Distribution (PSD) Efficiency/Costs-Production time/rate
-Manpower
-Process complexity
-Repeatability/control
-Yield
-Time-to-market
Quality-Weight control
-CU/BU
- Composition
- Dissolution
Flow and
segregation
Formation (crystallization)
and Processing (milling)
Product
Performance

©2010 Jenike & Johanson, Inc.
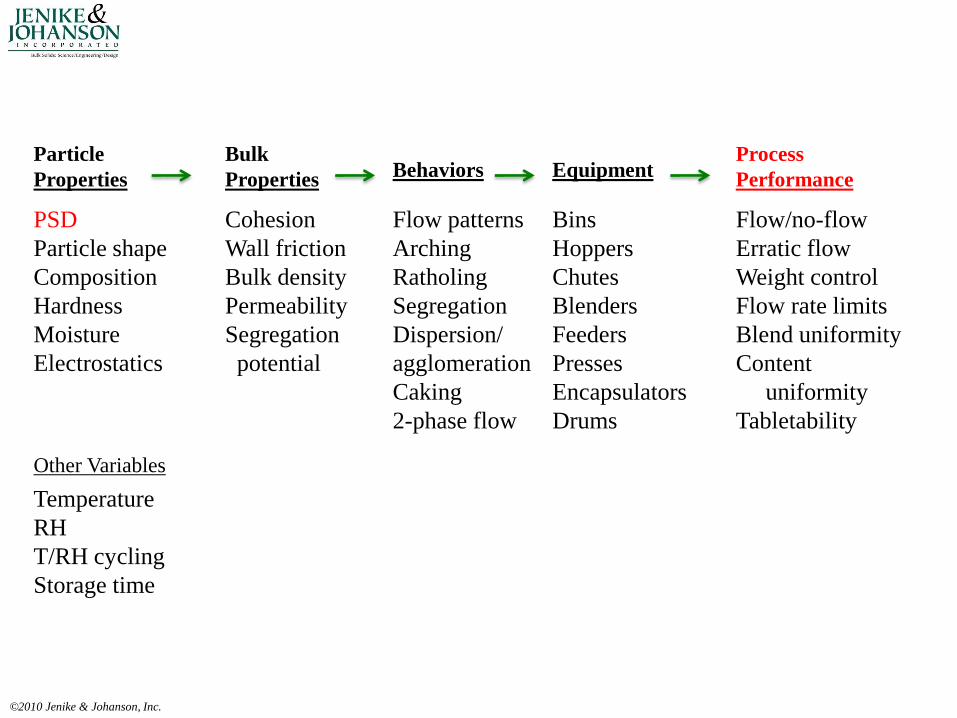
Process
PerformancePSD
Flow/no-flow
Erratic flow
Weight control
Flow rate limits
Blend uniformity
Content
uniformity
Tabletability
Particle
Properties
Efficiency/Costs-Production time/rate
-Manpower
-Process complexity
-Repeatability/control
-Yield
-Time-to-market
Quality-Weight control
-CU/BU
- Composition
- Dissolution

©2010 Jenike & Johanson, Inc.
Flow/no-flow
Erratic flow
Weight control
Flow rate limits
Blend uniformity
Content
uniformity
Particle shape
Composition
Hardness
Moisture
Electrostatics
Particle
Properties
Process
Performance
Other Variables
Temperature
RH
T/RH cycling
Storage time
PSD
Flowability

Define “Flowability”
Powder flowability is a function of:
• The powder itself (Flow Properties)
– Physical properties, e.g. particle size distribution, shape
– Chemical properties, e.g. composition, moisture
• The powder handling equipment
– Geometry, e.g. angles, surface finish
– Throughput, e.g. paddle speed
©2010 Jenike & Johanson, Inc.
©2010 Jenike & Johanson, Inc.
Flow/no-flow
Erratic flow
Weight control
Flow rate limits
Blend uniformity
Content
uniformity
Tabletability
PSD
Particle shape
Composition
Hardness
Moisture
Electrostatics
Particle
Properties
Process
Performance
Other Variables
Temperature
RH
T/RH cycling
Storage time
Bulk
Properties
Cohesion
Wall friction
Bulk density
Permeability
Segregation
potential
Behaviors
Flow patterns
Arching
Ratholing
Segregation
Dispersion/
agglomeration
Caking
2-phase flow
Equipment
Bins
Hoppers
Chutes
Blenders
Feeders
Presses
Encapsulators
Drums

Differences in PSD
• Size differences can cause differences in
manufacturing performance
• Size differences can be the result of other
manufacturing variables that affect other
properties too
• Hard to determine the effect of size alone, since
two samples with different sizes can also have
other particle properties which are different
©2010 Jenike & Johanson, Inc.

How to Connect PSD to
Performance?
• Option 1: use properties such as size as an
empirical indicator
– “Blends with a finer size are generally more cohesive”
• Option 2: measure bulk properties as a predictor
– “Using cohesive strength data, we know a minimum
opening size for the bin is 3 inches to avoid a stable
arch”
©2010 Jenike & Johanson, Inc.

©2010 Jenike & Johanson, Inc.
Flow/no-flow
Erratic flow
Weight control
Flow rate limits
Blend uniformity
Content
uniformity
Tabletability
PSD
Particle shape
Composition
Hardness
Moisture
Electrostatics
Particle
Properties
Process
Performance
Other Variables
Temperature
RH
T/RH cycling
Storage time
Bulk
Properties
Cohesion
Wall friction
Bulk density
Permeability
Segregation
potential
Behaviors
Flow patterns
Arching
Ratholing
Segregation
Dispersion/
agglomeration
Caking
2-phase flow
Equipment
Bins
Hoppers
Chutes
Blenders
Feeders
Presses
Encapsulators
Drums

©2010 Jenike & Johanson, Inc.
Flow/no-flowPSD
Particle
Properties
Process
Performance
Bulk
Properties
Cohesion
Behaviors
Arching
Ratholing
Equipment
Bins
Hoppers
Measure
PSD
Likely direction of
Flow/no-flow
Option 1: emperical
Apply past experiences:
Finer particle size worse
Wider particle size worse
(other variables equal)
Measure
PSD
Predict
Flow/no-flow
Option 2: predictive
Measure
Cohesion
Calculate
Arching
& ratholing
parameters
Apply to
Specific
Bin Design

Fill and Discharge Sequence:
Flow Patterns in Hoppers, Bins
• Funnel flow
• Mass flow
©2010 Jenike & Johanson, Inc.

Funnel Flow
• Features
– First-in, last-out flow sequence:
material at walls discharges last
– Segregation often made worse
– More likely to yield erratic
flow problems such as arching
and ratholing
©2010 Jenike & Johanson, Inc.

Erratic Flow
©2010 Jenike & Johanson, Inc.
Funnel flow pattern led to increased processing time, operator
exposure, variable tablet weights, and decreased tableting speeds

©2010 Jenike & Johanson, Inc.
Mass Flow
• Features
– First-in, first-out flow sequence: material moves as a mass
– Segregation generally minimized
– Consistent feed density
• Mass flow occurs when the hopper walls are sufficiently smooth and steep to allow flow along them (wall friction; surface and powder dependent)

©2010 Jenike & Johanson, Inc.
Flow/no-flow
Erratic flow
Weight control
Content
uniformity
PSD
Particle
Properties
Process
Performance
Bulk
Properties
Wall Friction
Behaviors
Flow patterns
Equipment
Bins
Hoppers
Measure
PSD
No added insight
Option 1
Unknown connection
(highly material dependent)
Measure
PSD
Predict
Flow/no-flow
Erratic flow
Weight control
Content
uniformity
Option 2
Measure
Wall friction
Calculate
Required
hopper
parameters
Apply to
Specific
Bin Design

©2010 Jenike & Johanson, Inc.
Flow Properties Tests
• Use lab-scale tests to predict what will happen at the manufacturing scale
• Quantified, absolute dimensions/angles
• ASTM Standards:– D6128 Direct Shear (Jenike)
– D6773 Annular Shear Cell (Schulze)
• Critical tests include cohesive strength and wall friction Schulze RST-XS

©2010 Jenike & Johanson, Inc.
Air Counterflow
• Powder flows down by gravity
• As powder flows it expands and decreases bulk density, increases void spaces
• Air enters to satisfy the voids
• Upward flow of air acts as a body force against gravity, reducing flow rate

©2010 Jenike & Johanson, Inc.
Erratic flow
Weight control
PSD
Particle
Properties
Process
Performance
Bulk
Properties
Permeability
Behaviors
2-phase flow
Equipment
Presses
Measure
PSD
Likely direction of
Erratic flow
Weight control
Option 1
Finer particle size worse
Wider particle size worse
(other variables equal)
Measure
PSD
Predict rate limits
Erratic flow
Weight control
Option 2
Measure
Permeability
Calculate
Limiting
flow rates
Apply to
Specific
Press feeder
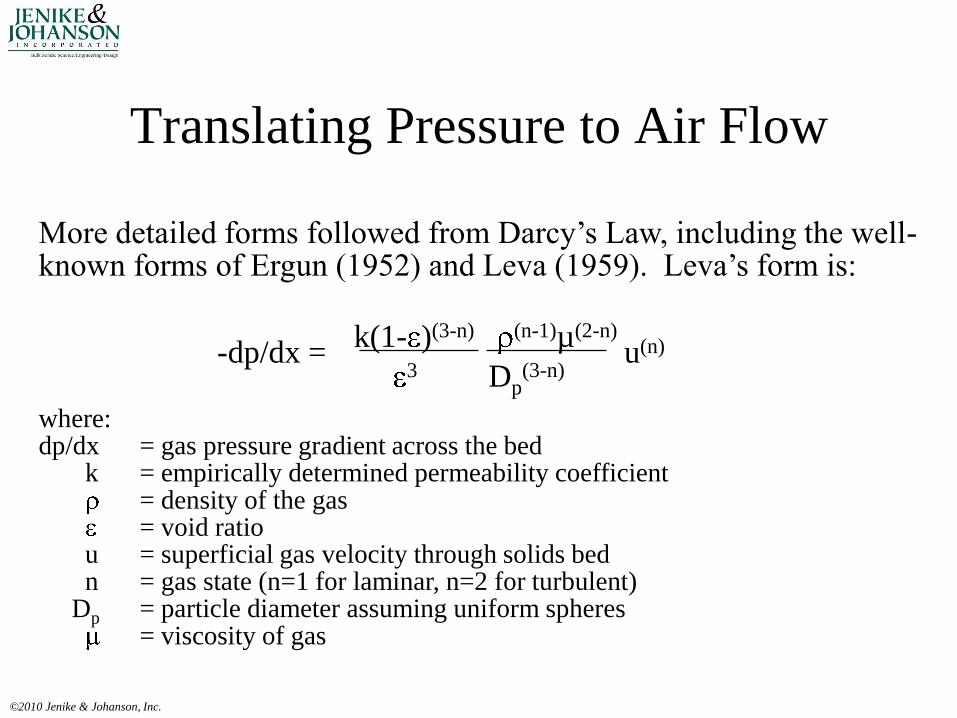
where: dp/dx = gas pressure gradient across the bed
k = empirically determined permeability coefficient = density of the gas= void ratio
u = superficial gas velocity through solids bedn = gas state (n=1 for laminar, n=2 for turbulent)
Dp = particle diameter assuming uniform spheres= viscosity of gas
Translating Pressure to Air Flow
©2010 Jenike & Johanson, Inc.
k(1- )(3-n)
3
(n-1)µ(2-n)
Dp(3-n)
u(n)-dp/dx =
More detailed forms followed from Darcy’s Law, including the well-known forms of Ergun (1952) and Leva (1959). Leva’s form is:

Translating Pressure to Air Flow
Because of the difficulty in determining an appropriate particle diameter, and since k must be empirically determined, this equation may be simplified by lumping the terms together into one overall material dependent coefficient.
k(1- )2
3
µ
Dp2
u-dp/dx =
Laminar flow simplification (n=1):
©2010 Jenike & Johanson, Inc.

Permeability Test
• Measures resistance to airflow through a contact bed of powder
• Required to determine settlement (deaeration), and powder flow rate limitations
• Results in relationship of permeability (K) as a function of bed density, with a curve fit constant K0
©2010 Jenike & Johanson, Inc.

Rate Limitation, Air Counterflow
• Manufacturer was feeding a blend from a bin
through a chute, into an encapsulator
• At higher feed rates, weights became erratic
• Choke point identified within the encapsulator
• Material change improved behavior
©2010 Jenike & Johanson, Inc.

Rate Limitation, Air Counterflow
• Before
– d10: 16 , d50: 125
– K0: 0.0017 fps
– Critical powder flow rate
• Calculated: 60% of target
• Actual: 75% of target
• After process changes
– d10: 26 , d50: 119
– K0: 0.0032 fps
– Critical powder flow rate
• Calculated: >110% of target
• Actual: 100% of target (max)
• Concluded: d10 was critical
©2010 Jenike & Johanson, Inc.

©2010 Jenike & Johanson, Inc.
Flow/no-flow
Erratic flow
Weight control
Flow rate limits
Blend uniformity
Content
uniformity
Tabletability
PSD
Particle shape
Composition
Hardness
Moisture
Electrostatics
Particle
Properties
Process
Performance
Other Variables
Temperature
RH
T/RH cycling
Storage time
Bulk
Properties
Cohesion
Wall friction
Bulk density
Permeability
Segregation
potential
Behaviors
Flow patterns
Arching
Ratholing
Segregation
Dispersion/
agglomeration
Caking
2-phase flow
Equipment
Bins
Hoppers
Chutes
Blenders
Feeders
Presses
Encapsulators
Drums

©2010 Jenike & Johanson, Inc.
Segregation Mechanisms
• Particle entrainment
• Air entrainment
• Sifting

©2010 Jenike & Johanson, Inc.
Segregation Mechanisms
• Particle entrainment (dusting)
– Particle entrainment requires:
• Airborne particles
• Differences in settling velocities
– Stokes’ law
• Air currents
– Results in thin layer at walls, significantly different
than bulk

©2010 Jenike & Johanson, Inc.
Particle Entrainment Filling a Bin

Segregation by Particle Entrainment
©2010 Jenike & Johanson, Inc.
Time into compression, h:mm
Assay,
% label

Segregation Mechanisms
• Particle entrainment (dusting)
• Air entrainment (fluidization)
©2010 Jenike & Johanson, Inc.

Segregation Mechanisms
• Air entrainment (fluidization)
– Air entrainment requires:
• Fine particles
• Excess air between particles
• Air counterflow
– Results in top-to-bottom differences, generally
– Tool: Geldart Chart (fluidization behaviors as a
function of particle size and particle density)
• Very fine: too cohesive to fluidize
• Very coarse: requires too much air to fluidize
©2010 Jenike & Johanson, Inc.

Segregation Mechanisms
• Particle entrainment (dusting)
• Air entrainment (fluidization)
• Sifting
©2010 Jenike & Johanson, Inc.

Sifting Segregation
©2010 Jenike & Johanson, Inc.
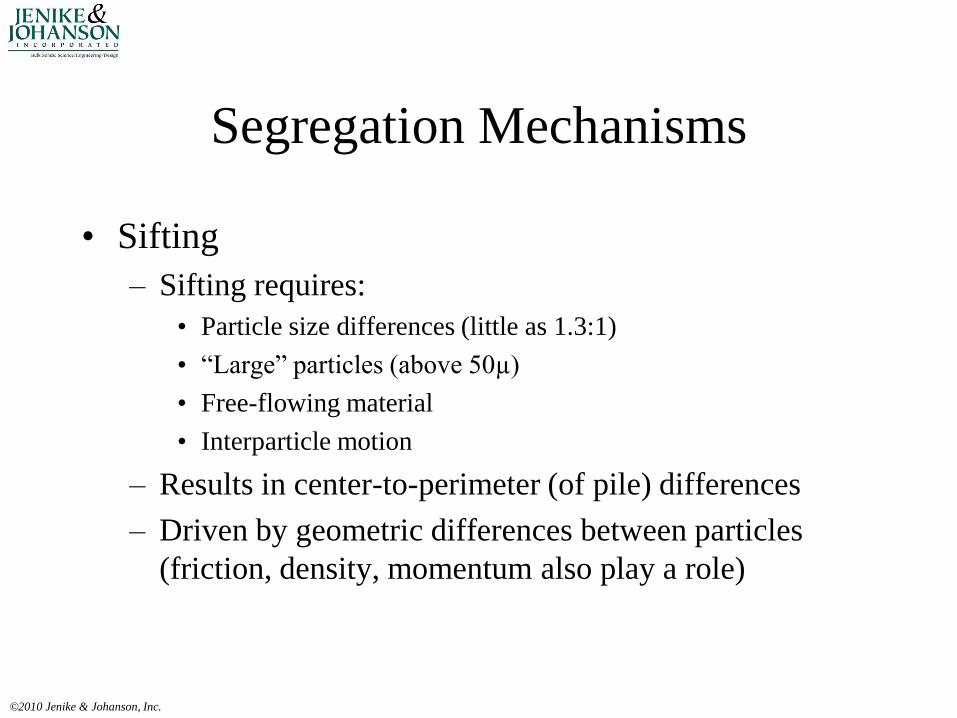
Segregation Mechanisms
• Sifting
– Sifting requires:
• Particle size differences (little as 1.3:1)
• “Large” particles (above 50µ)
• Free-flowing material
• Interparticle motion
– Results in center-to-perimeter (of pile) differences
– Driven by geometric differences between particles
(friction, density, momentum also play a role)
©2010 Jenike & Johanson, Inc.

Fluidization Segregation Test
©2010 Jenike & Johanson, Inc.
Air out
Air in
Column of material
Is fluidized
Column is split into
3 sections, and each
is measured for
segregation (assay/PSD)
Top
Middle
Bottom
ASTM Standard D 6941

Sifting Segregation Test
©2010 Jenike & Johanson, Inc.
Beginning Middle End
ASTM Standard D 6940
Each is measured for
segregation (assay/PSD)

Low Fluidization/Low Sifting Potential
“Product B”
Fluidization segregation test
top=red, center=green, bottom=blue
Sifting segregation test
beginning=red, middle=green, end=blue
©2010 Jenike & Johanson, Inc.
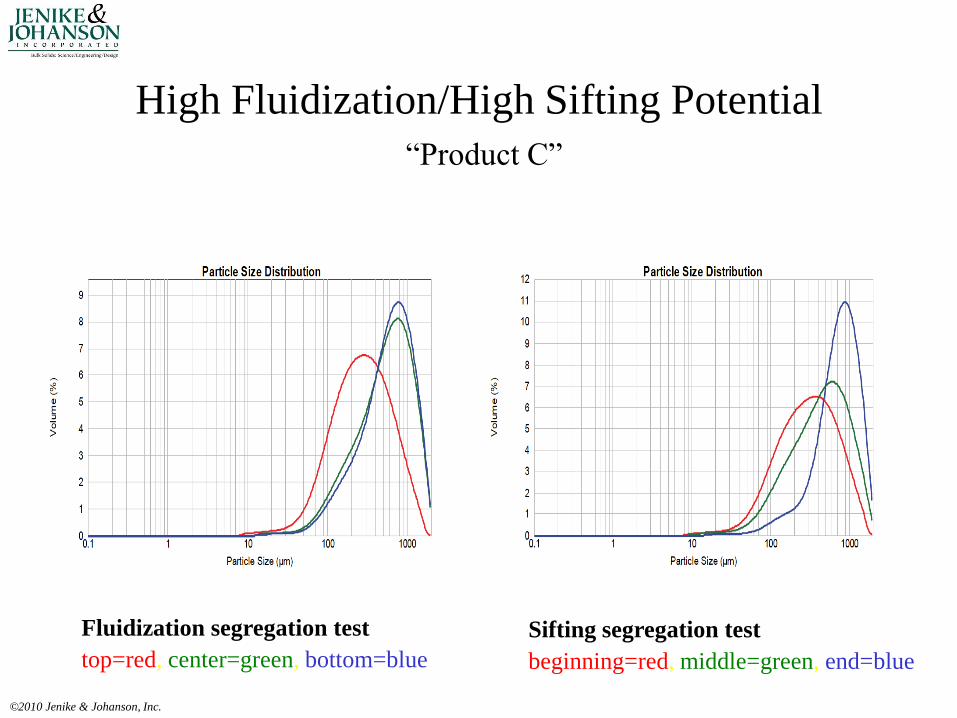
High Fluidization/High Sifting Potential
“Product C”
Fluidization segregation test
top=red, center=green, bottom=blue
Sifting segregation test
beginning=red, middle=green, end=blue
©2010 Jenike & Johanson, Inc.

High Fluidization/Low Sifting Potential
“Product D”
Fluidization segregation test
top=red, center=green, bottom=blue
Sifting segregation test
beginning=red, middle=green, end=blue
©2010 Jenike & Johanson, Inc.

Conclusions
• Particle size distribution, together with many other powder properties, can affect the performance of a manufacturing process
• By itself, particle size distribution data can provide a direct connection to manufacturability: empirically in many cases, predicatively in very few cases, and no insight in other cases
• A more powerful approach to predict manufacturability is to measure key bulk, not particle, properties
• Understanding the mechanism of how size relates to flow and segregation can allow the user to select the right parameter (e.g. D10 vs D50) and relative influence
©2010 Jenike & Johanson, Inc.
Impact of Particle Size on Performance
Manufacturing Performance:
Flow and Segregation
Jim PrescottSenior Consultant
400 Business Park Dr.
Tyngsboro, MA 01879
(978) 649-3300
USP Workshop on Particle Size: Particle Detection and Measurement
December 8-10, 2010 Rockville, MD

Addendum:
Other Sources of Variability
• Segregation often shows up as between-location
variation (trending)
• Within-location variations:
– sampler error
– analytical error
– weight variations
– “micro” non-uniformity of blend (e.g. API
agglomerates or API with too many coarse particles
[e.g. D90])
©2010 Jenike & Johanson, Inc.

©2010 Jenike & Johanson, Inc.
Flow/no-flow
Erratic flow
Weight control
Flow rate limits
Blend uniformity
Content
uniformity
Tabletability
PSD
Particle shape
Composition
Hardness
Moisture
Electrostatics
Particle
Properties
Process
Performance
Other Variables
Temperature
RH
T/RH cycling
Storage time
Bulk
Properties
Cohesion
Wall friction
Bulk density
Permeability
Segregation
potential
Behaviors
Flow patterns
Arching
Ratholing
Segregation
Dispersion/
agglomeration
Caking
2-phase flow
Equipment
Bins
Hoppers
Chutes
Blenders
Feeders
Presses
Encapsulators
Drums

Data on Consumer Product
©2010 Jenike & Johanson, Inc.

Prediction
• Model uses Poisson’s distribution to account for
distribution of largest particles across dosage units
©2010 Jenike & Johanson, Inc.

Cumulative Production Data
©2010 Jenike & Johanson, Inc.

“Too Coarse” API
• Can cause wide variability in results
– Erratic (frequency and locations can
– Occasional high assay values
• Can be predicted with particle size alone; bulk
properties not needed
– Can predict distribution of potency across a lot
• Critical to have “accurate” information on coarsest
particles’ size
©2010 Jenike & Johanson, Inc.

Effect of Excipient Particle Size on Product Performance
Xiaorong He, Ph.D. , M.B.A, USP Workshop on Particle Size , Dec 9 2010

Excipients - Definition
Pharmaceutical excipients are substances other than the pharmacologically active drug or prodrug which are included in the manufacturing process or are contained in a finished pharmaceutical product dosage form
– Aid in the processing of the dosage form during its manufacture
– Protect, support, or enhance stability, bioavailability, or patient acceptability
– Assist in product identification or
– Enhance any other attribute of the overall safety, effectiveness, or delivery of the drug during storage or use
13 January
2011
PLEASE INSERT Presentation title 133
Excipients are not inert!

Current Status
• About 1200 ingredients are in use currently in marketed pharmaceutical products as
excipients excluding colors and flavors
• About 250 documented in the European Pharmacopoeia
• Now 60 monographs in the international harmonization process, USP, JP and Ph Eur
• Compendial monograph primarily focused on purity and safety
• Insufficient list of tests that are related to functional performance
• Functionality Performance• USP: proposed new general information chapter <1059> - USP
33/NF 28• EP (EDQM) plans to list specific functionality related
characteristics in some of its excipient monographs
13 January
2011
PLEASE INSERT Presentation title 134

General Chapter <1059> - Proposed Excipient Functional Category
13 January
2011
PLEASE INSERT Presentation title 135
Tablets & Capsules
Oral Liquids Semisolids, topicals, and suppositories
Parenterals Aerosols
Diluent pH modifier Suppository base Pharmaceutical water
Propellent
Binder Wetting & solubilizing agent
Suspending & viscosity increasing
Diluent
Disintegrant Antimicrobial preservative
Ointment base Tonicity agent
Lubricant Antioxidant Emollient
Glidant and/or anti caking agent
Chelating & complexing
Coloring agent
Sweetening
Capsule shell
Coating agent
Ref. USP PF 33(6) page 1311-1323 & PF 35 (5) page 1228
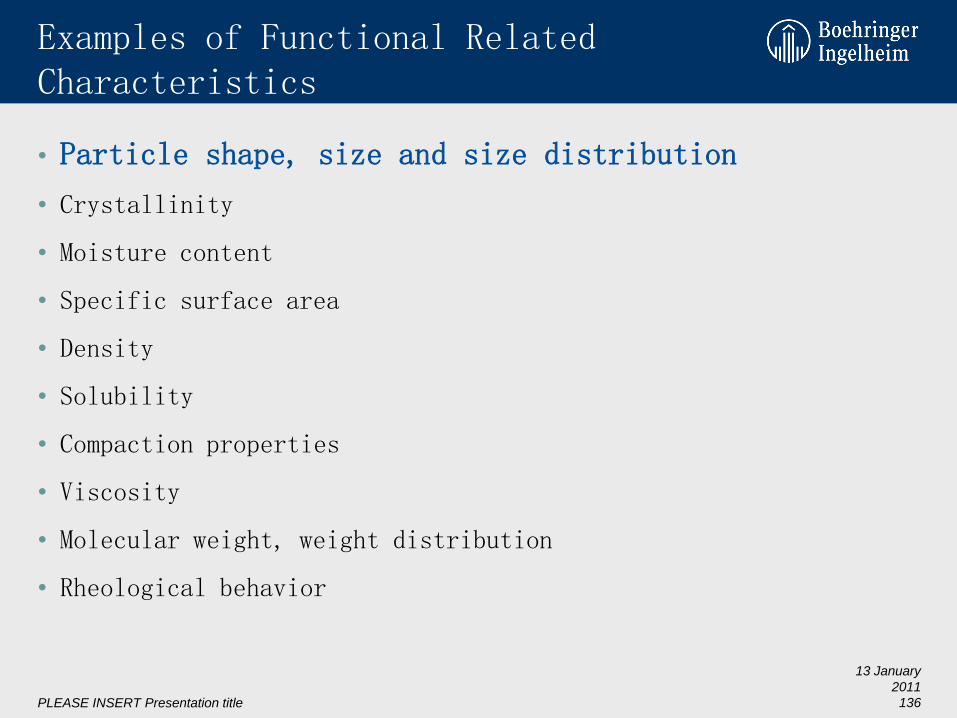
Examples of Functional Related Characteristics
• Particle shape, size and size distribution
• Crystallinity
• Moisture content
• Specific surface area
• Density
• Solubility
• Compaction properties
• Viscosity
• Molecular weight, weight distribution
• Rheological behavior
13 January
2011
PLEASE INSERT Presentation title 136

Potential Concerns from Excipient Suppliers
• Is this necessary?
• Will this become prelude of setting tighter spec on excipients?
• Will users demand to see more data?
13 January
2011
PLEASE INSERT Presentation title 137

Part I– Effect of Excipient Particle Size on Aplivaroc Dissolution
• BCS class II; Intrinsic solubility: 3 ug/ml at pH 5.5 to 7.0 (Free base); HCl
salt is being developed
• Conventional formulation (200mg) - high Shear wet granulation
• Quality by Design approach
• Design space
• Critical formulation and process parameters
• QbD tools: fish bone diagram, PAT etc
13 January
2011
PLEASE INSERT Presentation title 138
Ref. X. He et al, J. Pharm. Sci., 97: 5274-5289, 2008

Formulation & Process DOE
Overlay Plot
A: Dis integrant
B: B
inde
r
6.0 8.0 10.0 12.0 14.0
2.0
3.0
4.0
5.0
6.0
% Disln @60 min: 85.0
%disln @ 10 min: 45.0% < 200 mesh: 20.0
CI *: 0.30
Rathole: 0.5
22
Design Space - Use DOEs to optimize formulation and process variables (dissolution, disintegration, flow, compaction, granule size distribution)
Ref. X. He et al, J. Pharm. Sci., 97: 5274-5289, 2008

Key Batches
Site of Mfg Purpose Scale Water Level Disso. @ 60 min
R&D Process DOE PMA-65 32-36% 88-92%
R&D Dev. Scale-up PMA-150 38% 77%
R&D Phase IIb PMA-150 34% 90%
Production Phase IIb PMA-600 34% 82%
Production Demo batch PMA-600 28% A: 80%, B: 86%
Production Phase 3
batch 1
PMA-600 28% 83%
Stretch critical process parameter to the edge of failureDissolution is not sensitive to lubricant level & lubrication time
Ref. X. He et al, J. Pharm. Sci., 97: 5274-5289, 2008

Fishbone Diagram of Key Differences
Drop in Dissolution
Process
Material
Environment
EquipmentPeople
Did not comil drug before dry mixing
Magnesium steaate supplied by different vendor
Used different grade of lactose (impalpable vs L1142K)
Different lot of drug substancesOversized blender (20% fill)Spray nozzle
location (center vs side)
Faster impeller speed
Longer spray timeSite differences
May favor formation of denser granules
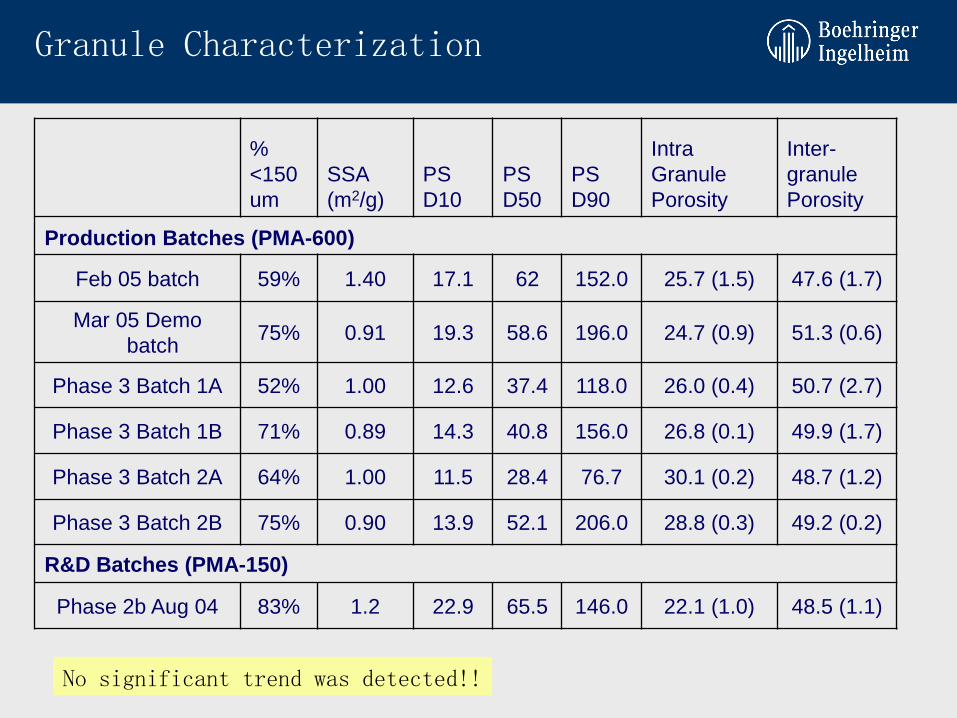
Granule Characterization
%
<150
um
SSA
(m2/g)
PS
D10
PS
D50
PS
D90
Intra
Granule
Porosity
Inter-
granule
Porosity
Production Batches (PMA-600)
Feb 05 batch 59% 1.40 17.1 62 152.0 25.7 (1.5) 47.6 (1.7)
Mar 05 Demo
batch75% 0.91 19.3 58.6 196.0 24.7 (0.9) 51.3 (0.6)
Phase 3 Batch 1A 52% 1.00 12.6 37.4 118.0 26.0 (0.4) 50.7 (2.7)
Phase 3 Batch 1B 71% 0.89 14.3 40.8 156.0 26.8 (0.1) 49.9 (1.7)
Phase 3 Batch 2A 64% 1.00 11.5 28.4 76.7 30.1 (0.2) 48.7 (1.2)
Phase 3 Batch 2B 75% 0.90 13.9 52.1 206.0 28.8 (0.3) 49.2 (0.2)
R&D Batches (PMA-150)
Phase 2b Aug 04 83% 1.2 22.9 65.5 146.0 22.1 (1.0) 48.5 (1.1)
No significant trend was detected!!

Magnesium Stearate PSD
Supplier B - Production
X50 = 5.3 um
Supplier A - R&D
X50 = 12.8 um
Ware’s magnesium stearate is finer than RTP

Magnesium Stearate Moisture Sorption
Supplier A Supplier B
MgSt R&D Lot E01674
0
0.2
0.4
0.6
0.8
1
1.2
1.4
0 10 20 30 40 50 60 70 80 90 100
%RH
Weight (% change)
1st Adsorption
1st Desorption
2nd Adsorption
2nd Desorption
MgSt Production Lot C446858
0
0.1
0.2
0.3
0.4
0.5
0.6
0.7
0 10 20 30 40 50 60 70 80 90 100
%RH
Weight (% change)
1st Adsorption1st Desorption
2nd Adsorption
2nd Desorption
Magnesium stearate at production site is probably more hydrophobic than that in the R&D site

Magnesium Stearate SEM
Supplier A – R&D Supplier B – Production

Contact Angle Analysis
Drug: 143 +/- 5 degree
Production Magnesium Stearate: 142 +/- 2 degree
R&D Magnesium Stearate: 125 +/- 9 degree
Visual observations:
• Tablet floating. Floating fragments contain drug
• Floating is worse for tablets made at production(with more hydrophobic magnesium stearate)
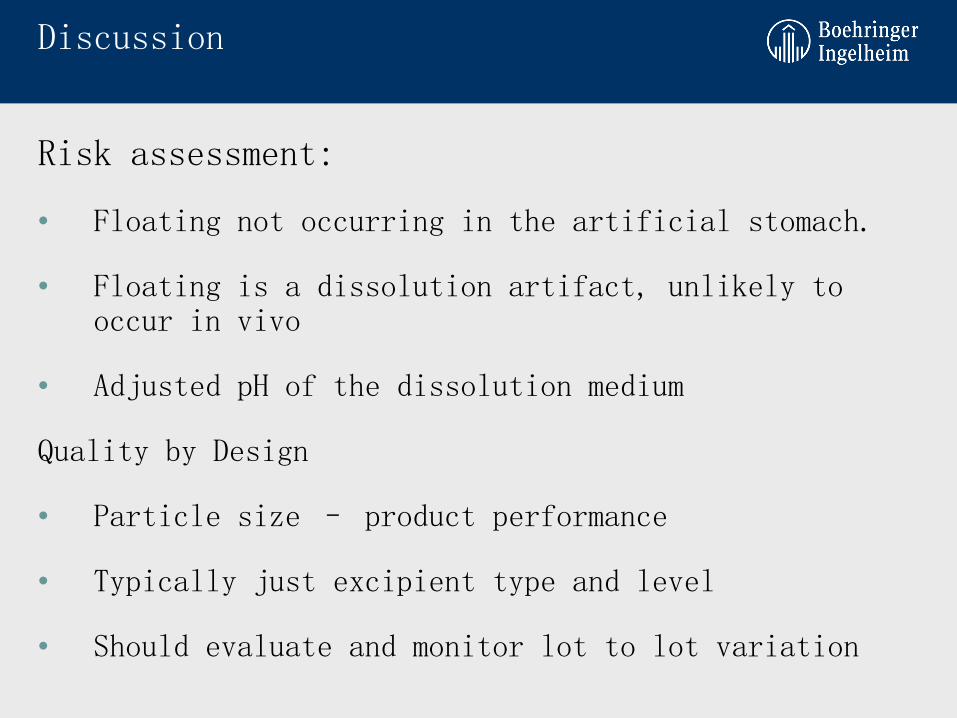
Discussion
Risk assessment:
• Floating not occurring in the artificial stomach.
• Floating is a dissolution artifact, unlikely to occur in vivo
• Adjusted pH of the dissolution medium
Quality by Design
• Particle size – product performance
• Typically just excipient type and level
• Should evaluate and monitor lot to lot variation

Part 2 – Effect of Excipient Particle Size on Product Processibility
• Compaction
• Flow
• Content uniformity – segregation
• Other – e.g. granulation end point
13 January
2011
PLEASE INSERT Presentation title 148

Deformation Mechanism
13 January
2011
PLEASE INSERT Presentation title 149
Elastic
Plastic
Brittle
Visco-elastic
Original Compression Decompression

Particle Interactions
13 January
2011
Ref. Schubert, Chem.Ing .T ech. 51 (1979),
266 – 277.
150
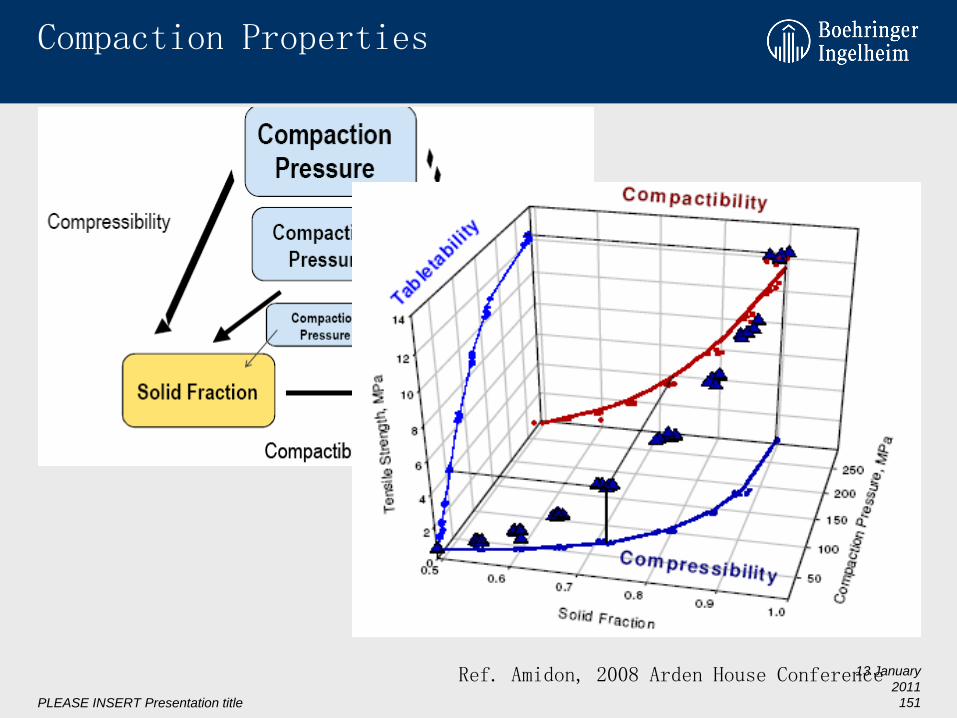
Compaction Properties
13 January
2011
PLEASE INSERT Presentation title 151
Ref. Amidon, 2008 Arden House Conference

Particle Size Effect on Compaction Properties of Lysine (Plastic deforming)
13 January
2011
PLEASE INSERT Presentation title 152
Effect of Particle Size on Tablettability
Effect of Particle Size on Compactibility
• Compactibility increases with decreasing particle size – more contact points• Compressibility increases with increasing particle size at lower pressure – better packing efficiency • Large crystal – initial fragmentation
Effect of Particle Size on
Compressibility
Ref. Sun & Grant, Int. J. Pharm. 215: 221-228, 2001

Effect of Crystal Morphology on Compaction
13 January
2011
PLEASE INSERT Presentation title 153
Morphology affects slip plane (001) orientation, impact compaction
Ref. Sun & Grant, J. Pharm. Sci.,90, 569-579, 2001

Quality by Design Driven by the Regulatory Agency
The Desired State
Pharm. Dev. (ICHQ8)/
QbD (ICH Q8R)
Pharm Quality Systems(ICH Q10)
Quality RiskManagement (ICH Q9)
CGMP initiativePAT initiative
Critical path initiative
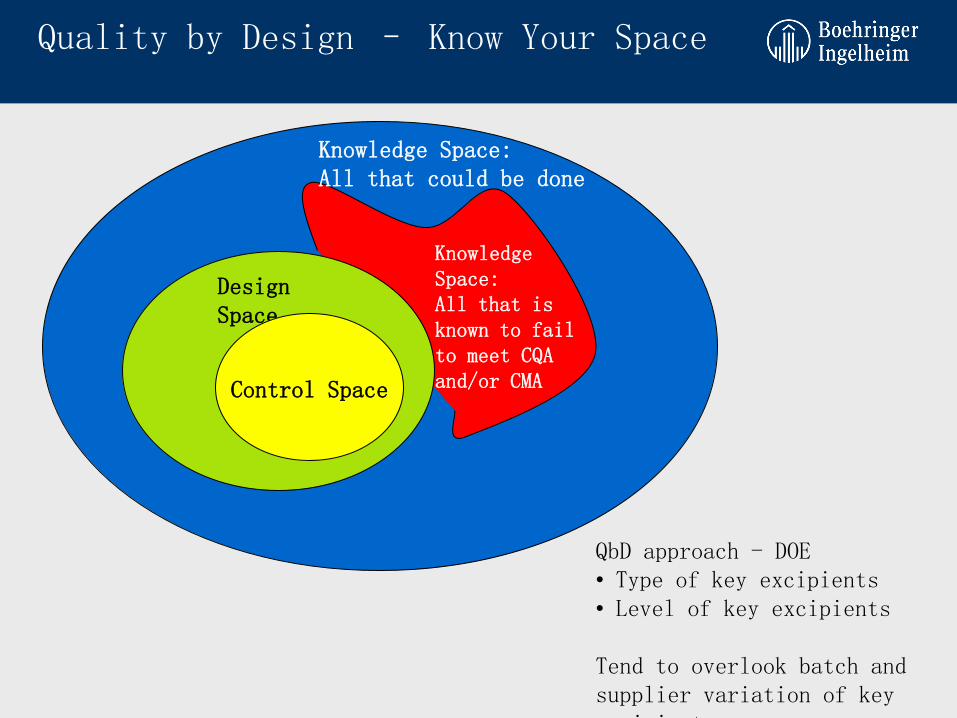
Quality by Design – Know Your Space
Knowledge Space:All that could be done
Knowledge Space:All that is known to fail to meet CQA and/or CMA
Design Space
Control Space
QbD approach - DOE• Type of key excipients• Level of key excipients
Tend to overlook batch and supplier variation of key excipients

Points to Consider
13 January
2011
PLEASE INSERT Presentation title 156
• Excipients are essentially in almost all products – may significantly impact product and process performance
• Excipient performance may be influenced by attributes not described in the monograph/COA - <1059> will address this
• Apply risk assessment tools to key excipents• For those critical to performance, may need to monitor/control
variation between batches and suppliers

Risk Assessment of Critical Excipients – Functionality Related Characteristics
U nit operations
/
Q uality attributes
D ispensing (Raw
M ateria l P roperties) G ranulation D rying
B lending
(M agnesium
Stearate)
Tableting Packaging
Dissolution Partic le s ize AP I Power
consum ption Prior know ledge
N ot critica l to
quality
Not critica l to
quality Prior know ledge
Disintegration Partic le s ize AP I water am ount and
feed rate Prior know ledge
N ot critica l to
quality
Not critica l to
quality Prior know ledge
Hardness Prior know ledge Prior know ledge Prior know ledge N ot critica l to
quality
Not critica l to
quality Prior know ledge
Assay Prior know ledge Prior know ledge Prior know ledge Prior know ledge N IR m easurem ent Prior know ledge
Content uniform ity Prior know ledge Power
consum ption
N ot critica l to
quality
N ot critica l to
quality N IR m easurem ent Prior know ledge
Degradation Prior know ledge W ater am ount and
feed rate
N ot critica l to
quality Prior know ledge Prior know ledge Prior know ledge
Stability Prior know ledge Prior know ledge C ontro l water
content Prior know ledge Prior know ledge Prior know ledge
Appearance Prior know ledge Prior know ledge N ot critica l to
quality Prior know ledge
N ot critica l to
quality Prior know ledge
Identification N IR of raw m ateria l P rior kno w ledge Prior know ledge Prior know ledge Prior know ledge Prior know ledge
W ater P rior know ledge Prior know ledge C ontro l water
content Prior know ledge Prior know ledge Prior know ledge
M icrobiology Specification of
s tarting m ateria l
Purified w ater
used Prio r know ledge Prior know ledge Prior know ledge Prior know ledge
1
low
Process understanding
Control Strategy
1
Unit operation
Qu
ality
Att
rib
ute
s
Ref. ICH Q9 potential applications, EFPIA PAT TG, 2006

Effect of Particle Size on Compaction – Brittle Materials
13 January
2011
PLEASE INSERT Presentation title 158
Alph –monohydrate lactose
NaCl
Na bicarbonate
lactose
Dical
NaCl
Saccharose
Ref. Alderborn, Pharamceutical Compaction Technology, chapter 10, 1996
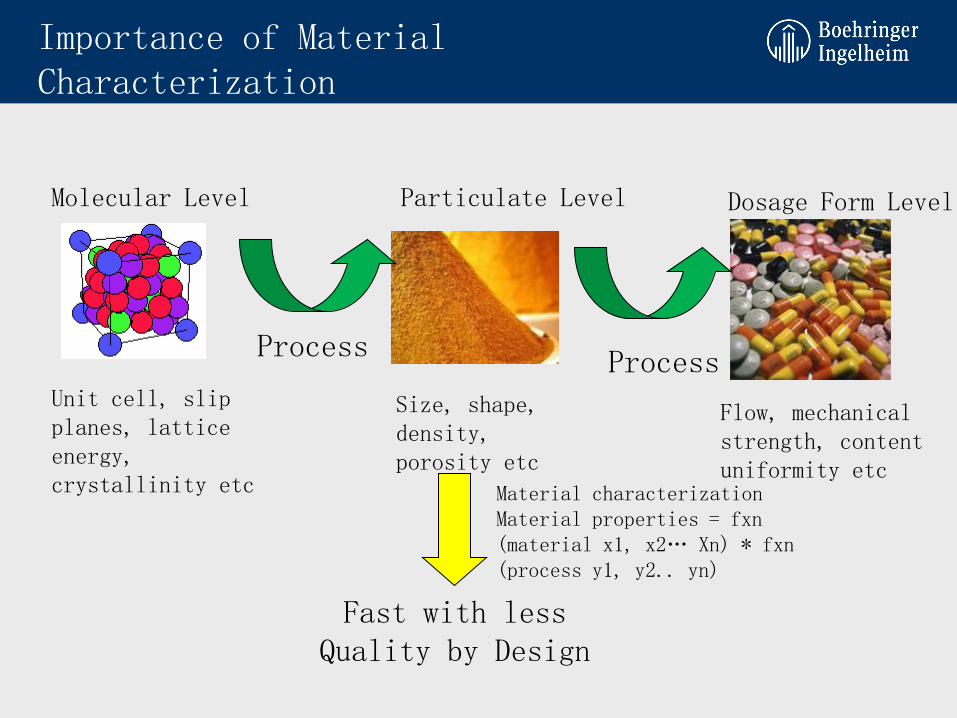
Importance of Material Characterization
Molecular Level Particulate Level Dosage Form Level
Unit cell, slip planes, lattice energy, crystallinity etc
Size, shape, density, porosity etc
Flow, mechanical strength, content uniformity etc
Fast with lessQuality by Design
Process Process
Material characterizationMaterial properties = fxn (material x1, x2… Xn) * fxn (process y1, y2.. yn)

USP Workshop on Particle Size:
Particle Detection and Measurement
December 8-10, 2010; USP Headquarters
Chair: Dr. Steven Byrn,
Purdue University
Discussion – Oral Formulations and
Components