Embed Size (px)
Citation preview

Session II and III Impact Modeling(1)、(2)
Chaired by Harasawa (NIES)
1. Introduction of Impact Study :Harasawa2. Impacts on South Asia : Prof. Lal3. Progress of AIM/Impact Models
- Dr. Takahashi- Profs Li and You- Mr. Jung- Dr. R. Bore (BogorAgri. Univercity, Indonesia)- Dr. Kapshe- Prof. Lal
4. Discussion
Introduction of Impacts Study
CentralEnv.Council(Int’l Strategy)
S-3 Low CarbonSociety 2050 (MoE P)
S-4StrategicImpactsResearch(MoE P)
IPCC AR4 (Impacts,Adaptation, Vulnerability)
GlobalWarming Initiative(CSTP, 2006~)
NIES Global Warming Research(FY 2006-2011)
Stabilization and Impacts/Risk
2℃、475ppm, 50% GHG cut in 2050
←+ burden sharing
Impact Map, Function
New GW Research Prog.
Impacts Detection Integrated ImpactsMonitoring
Extreme events Impacts
ExtremeEvents and Impacts (B-12)
Ch.10 Asia
Adaptation AdaptationStrategy Plan
Impacts and Adaptation (B-52)
Ch.17Adaptation
NIES next Research Plan
Scenario Next IPCC Scenario,GEO4
NIES, MoE, IR3S
Data : Climate Model, etc.
Impact Ref.、Temp. and Impacts
Projects
Subject475ppm,
50% GHG cut in 2050
←+ burden sharing
Impact Map, FunctionImpact/Policy
ExtremeEvents and Impacts (B-12)
Impacts and Adaptation (B-52)
Impacts (B-12)
Impacts and
Agri.Impact
Ch.10 Asia
Impacts (B-12)
HeatStress
Next IPCC Scenario,GEO4
Impact Ref.、Temp. and Impacts
WaterImpact
ExtremeExtremeEvents and Impacts (B-12)
Impacts and
Agri.Impacts (B-12)Agri.Impacts (B-12)
ImpactImpactImpact
ClimateRisk Man.
IntegrateImpactsMonitori
MonitoringNetwork
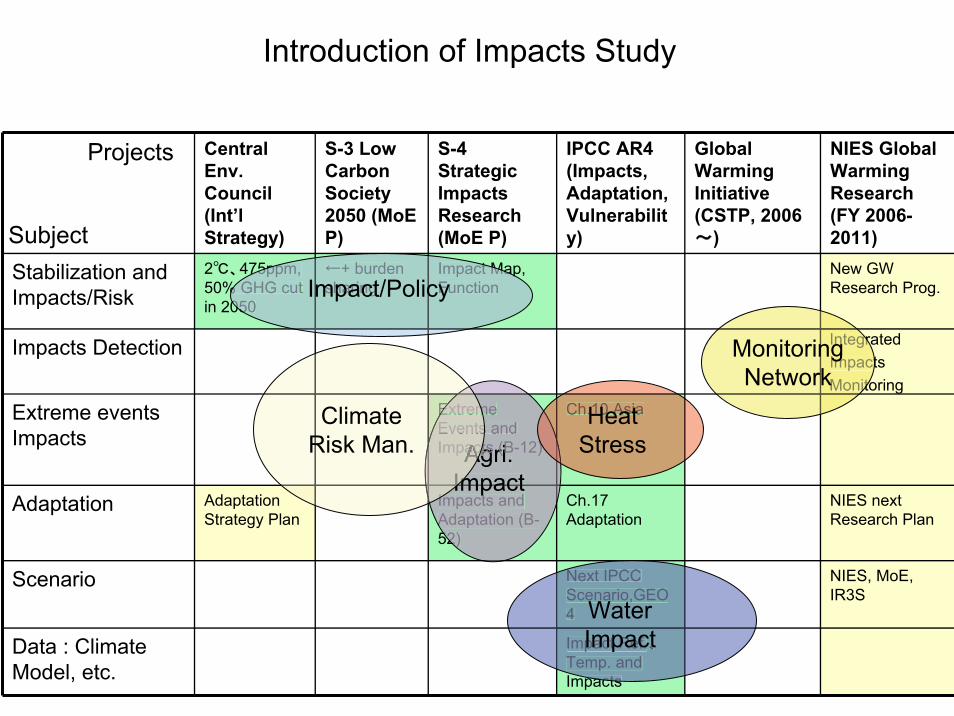
Office for Coordination of Climate Change Observation (OCCCO)
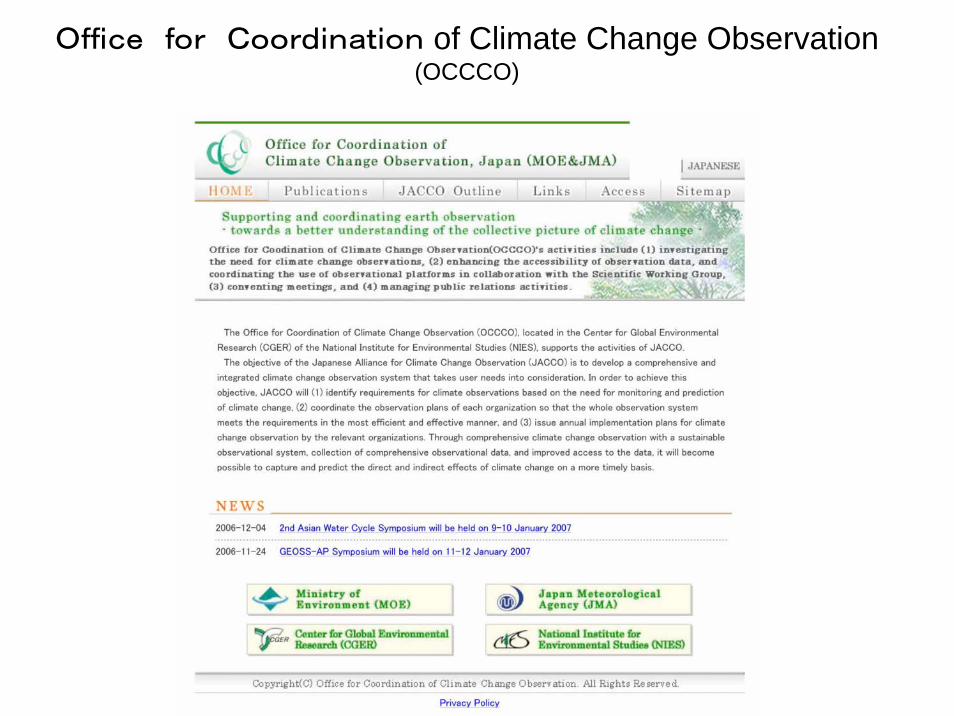
・ FAR, 1990… The size of this warming is broadly consistent with predictions of climate models, but it is also of the same magnitude as natural climate variability. Thus the observed increases could be largely due to this natural variability; alternatively this variability and other human factors could have offset a still larger human-induced greenhouse warming. The unequivocal detection of the enhanced greenhouse effect from observations is not likely for a decade or more.
・ SAR, 1995The balance of evidence suggests a discernible human influence on global climate.
・ TAR, 2001… most of the observed warming over the last 50 years is likely to have
been due to the increase in greenhouse gas concentrations.
・ AR4、2007Most of the observed increase in globally averaged Temperatures since the mid-20th century is very likely due to the observed increase in anthropogenic greenhouse gas concentrations.
Understanding and Attributing Climate ChangeIPCC AR4 :Climate Change 2007 The Physical Science Basis
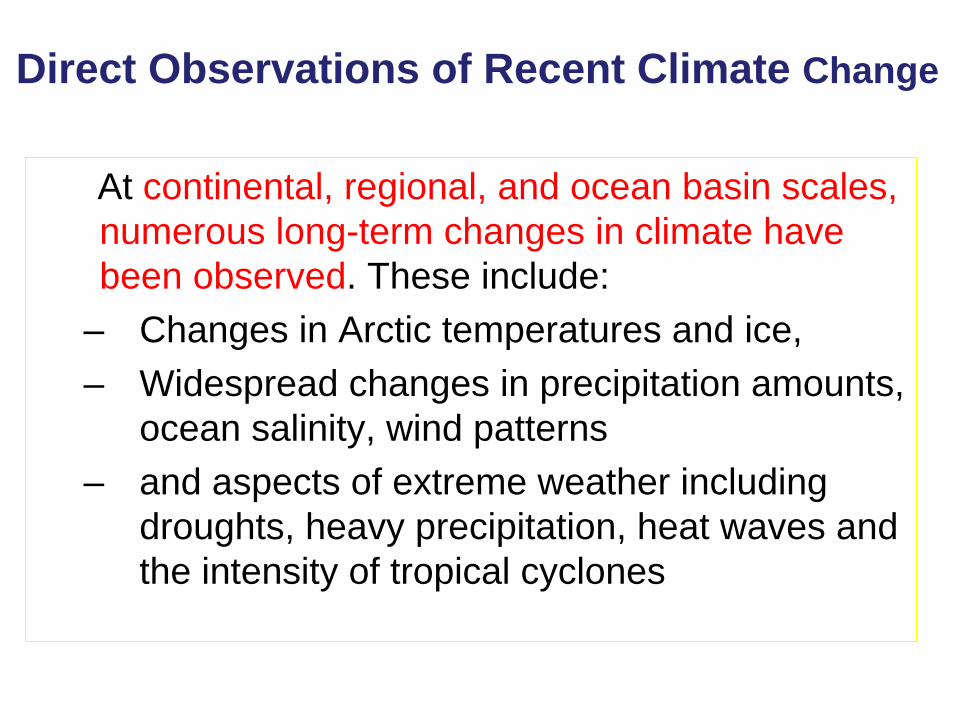
At continental, regional, and ocean basin scales, numerous long-term changes in climate have been observed. These include:
– Changes in Arctic temperatures and ice, – Widespread changes in precipitation amounts,
ocean salinity, wind patterns – and aspects of extreme weather including
droughts, heavy precipitation, heat waves and the intensity of tropical cyclones
Direct Observations of Recent Climate Change
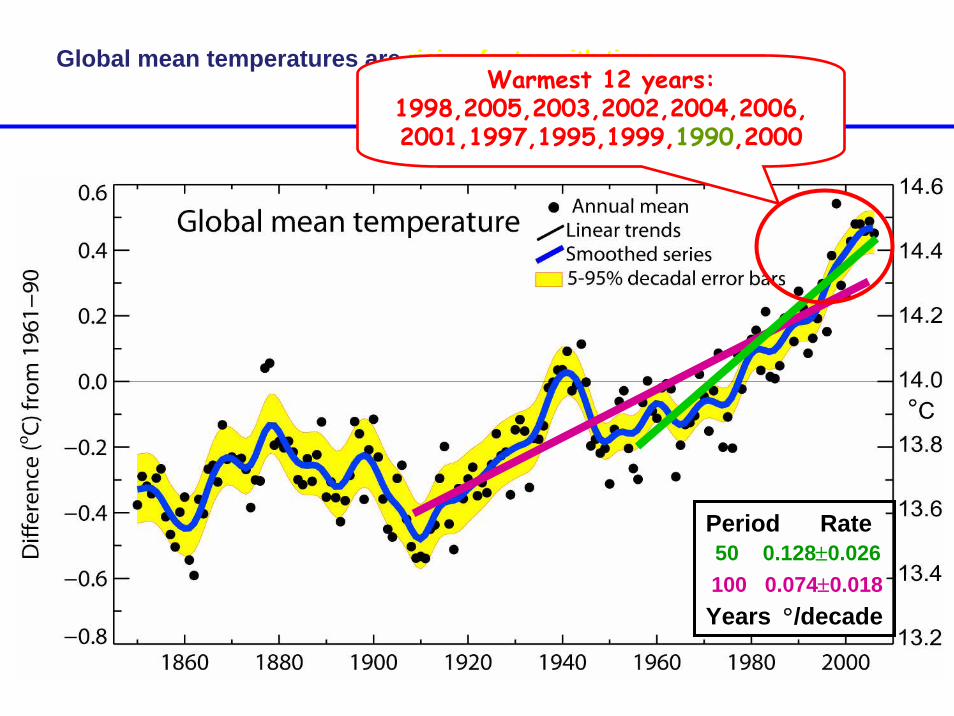
Global mean temperatures are rising faster with time
100 0.074±0.01850 0.128±0.026
Warmest 12 years:1998,2005,2003,2002,2004,2006, 2001,1997,1995,1999,1990,2000
Period Rate
Years °/decade
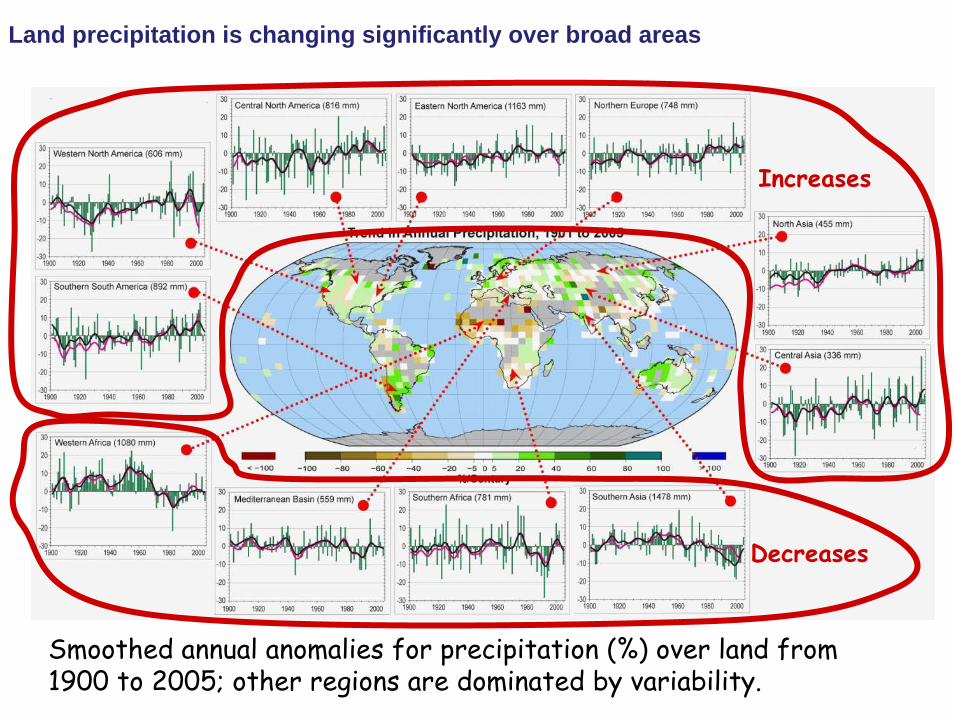
Smoothed annual anomalies for precipitation (%) over land from 1900 to 2005; other regions are dominated by variability.
Land precipitation is changing significantly over broad areas
Increases
Decreases
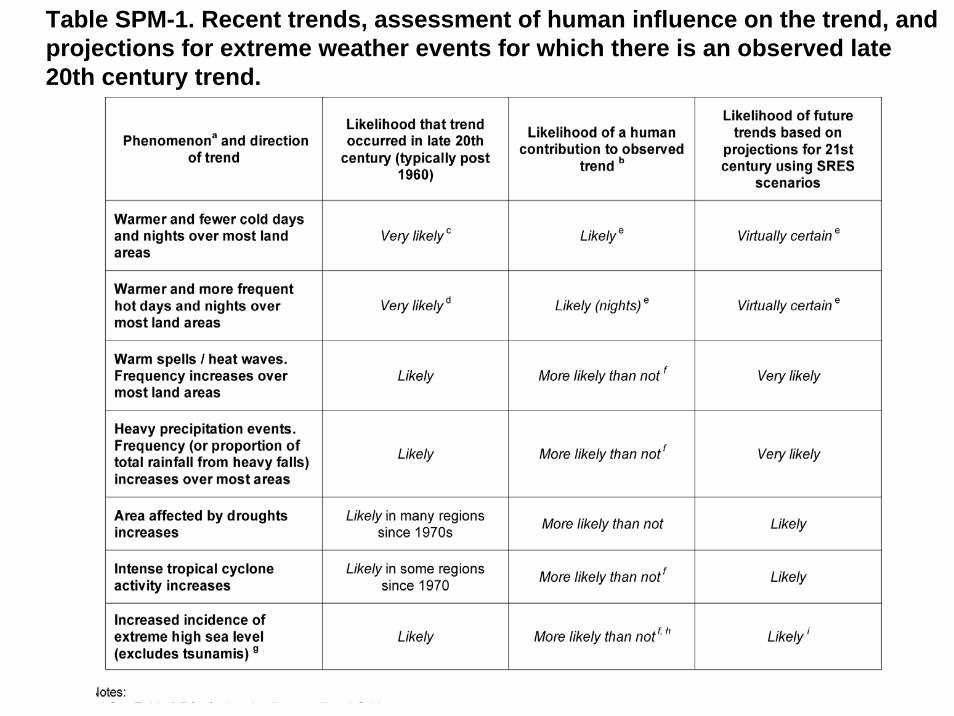
Table SPM-1. Recent trends, assessment of human influence on the trend, and projections for extreme weather events for which there is an observed late 20th century trend.
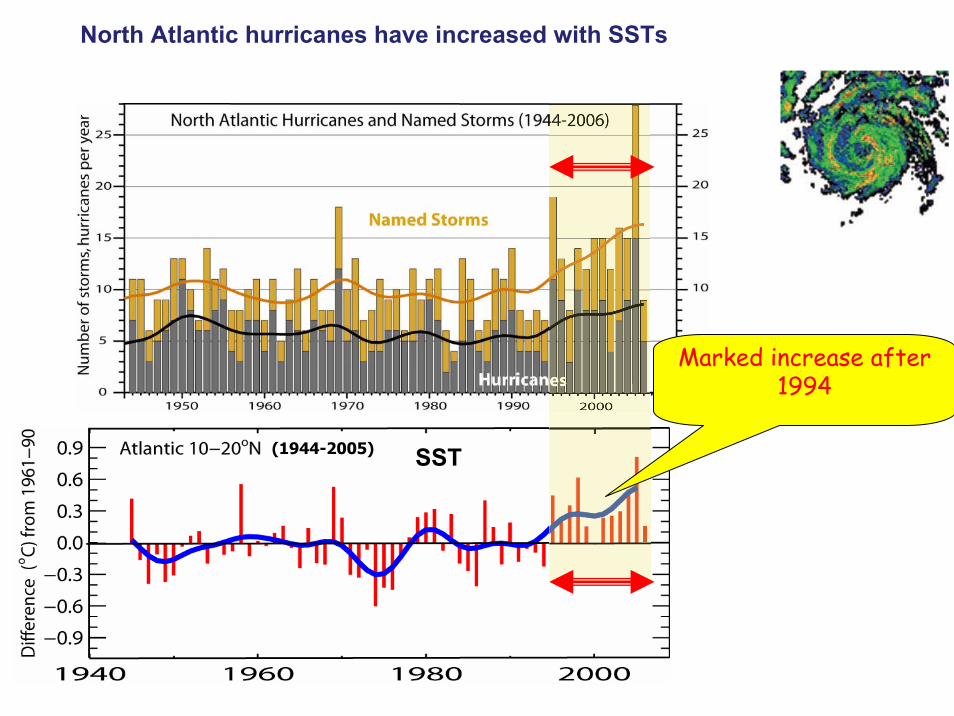
N. Atlantic hurricanerecord best after 1944 with aircraftsurveillance.
Global number andpercentage of intensehurricanesis increasing
North Atlantic hurricanes have increased with SSTs
SST(1944-2005)
Marked increase after 1994
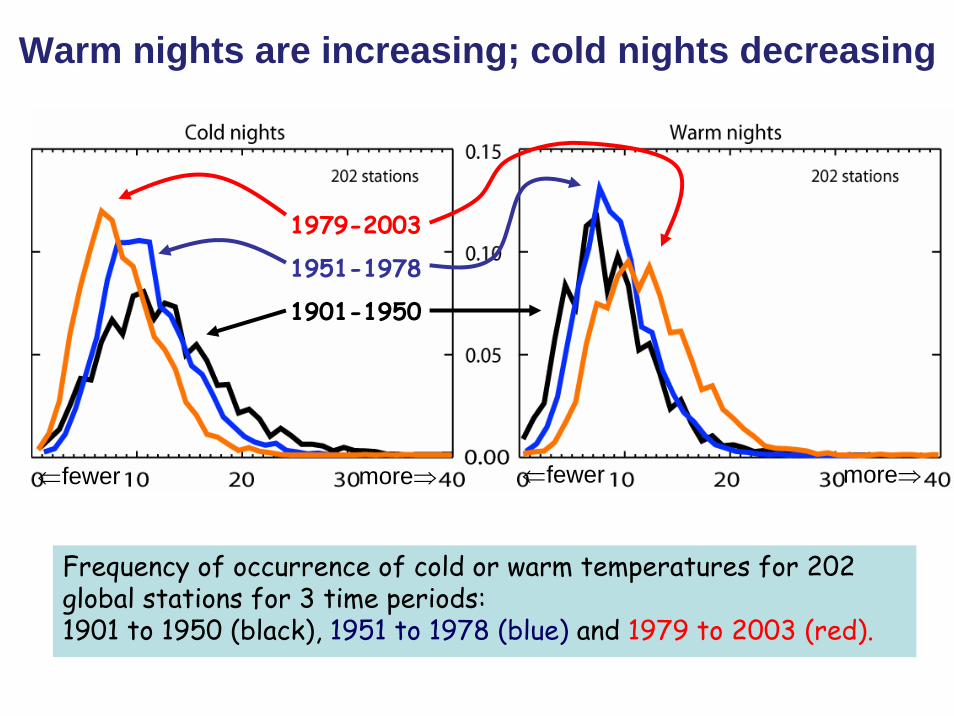
Frequency of occurrence of cold or warm temperatures for 202 global stations for 3 time periods: 1901 to 1950 (black), 1951 to 1978 (blue) and 1979 to 2003 (red).
1979-2003
1951-1978
1901-1950
Warm nights are increasing; cold nights decreasing
⇐fewer more⇒ ⇐fewer more⇒
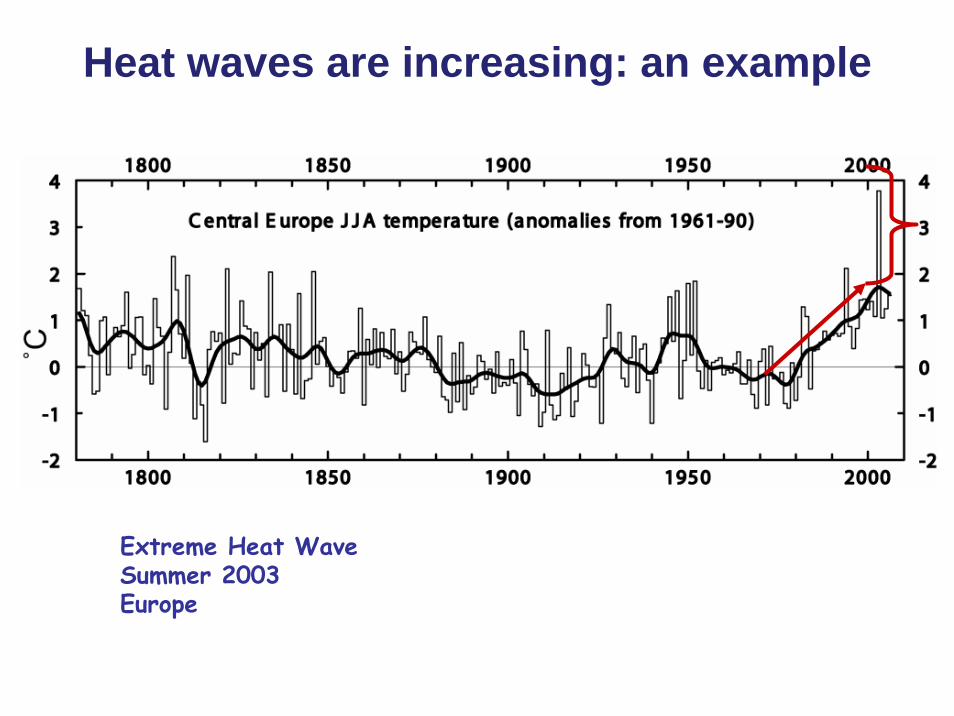
Extreme Heat WaveSummer 2003Europe
Heat waves are increasing: an example
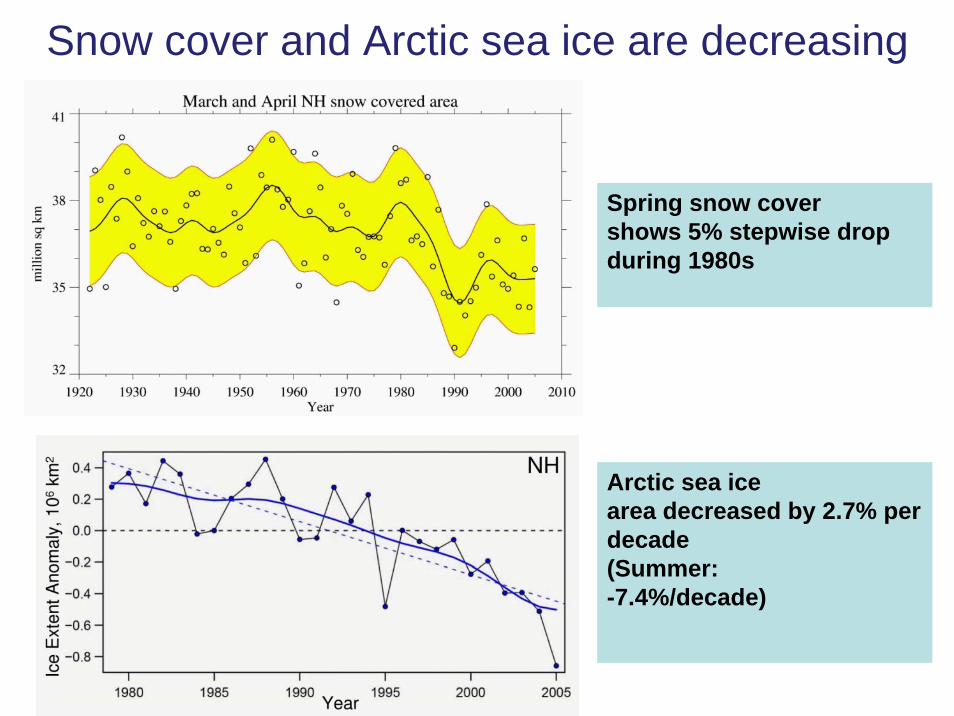
Snow cover and Arctic sea ice are decreasing
Spring snow covershows 5% stepwise drop during 1980s
Arctic sea ice area decreased by 2.7% per decade(Summer: -7.4%/decade)
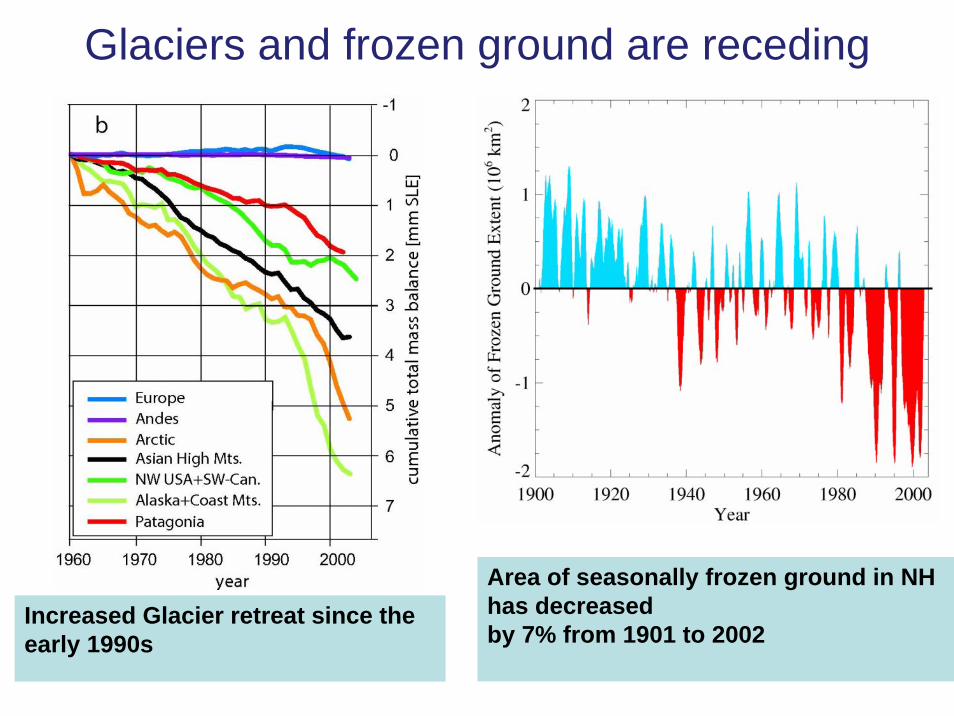
Glaciers and frozen ground are receding
Area of seasonally frozen ground in NH has decreasedby 7% from 1901 to 2002
Increased Glacier retreat since the early 1990s
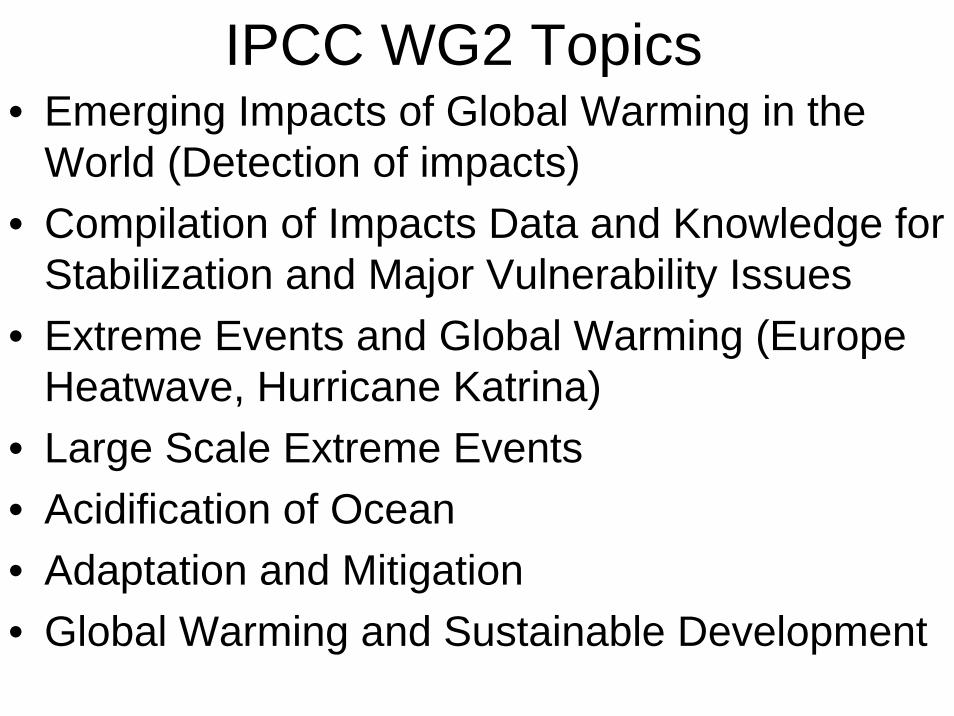
IPCC WG2 Topics • Emerging Impacts of Global Warming in the
World (Detection of impacts)• Compilation of Impacts Data and Knowledge for
Stabilization and Major Vulnerability Issues• Extreme Events and Global Warming (Europe
Heatwave, Hurricane Katrina)• Large Scale Extreme Events • Acidification of Ocean• Adaptation and Mitigation• Global Warming and Sustainable Development
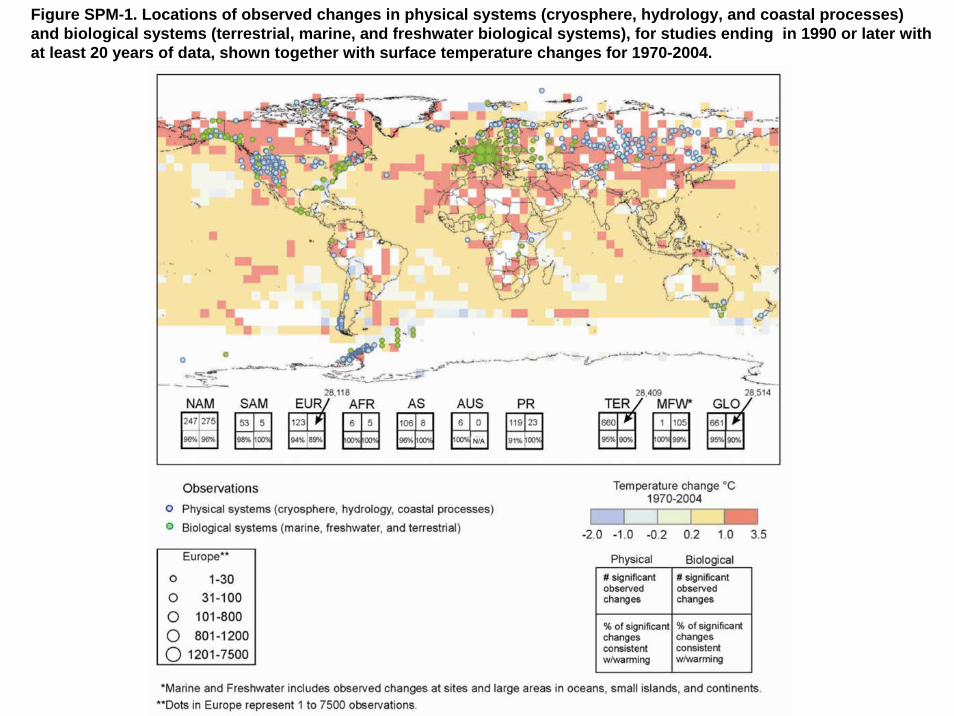
Figure SPM-1. Locations of observed changes in physical systems (cryosphere, hydrology, and coastal processes) and biological systems (terrestrial, marine, and freshwater biological systems), for studies ending in 1990 or later with at least 20 years of data, shown together with surface temperature changes for 1970-2004.
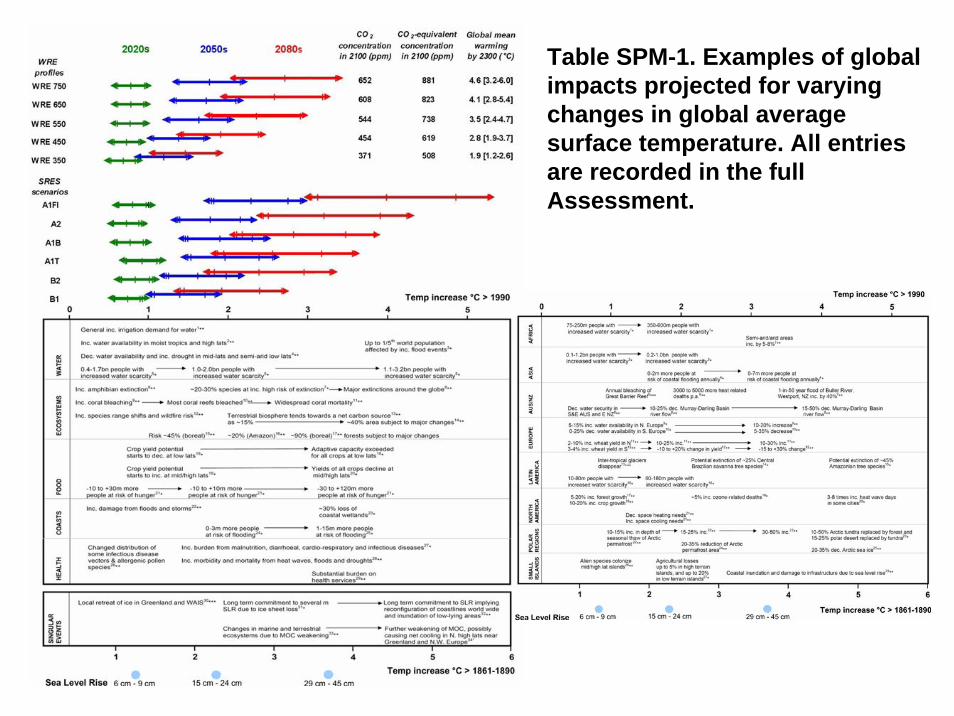
Table SPM-1. Examples of global impacts projected for varying changes in global average surface temperature. All entries are recorded in the full Assessment.
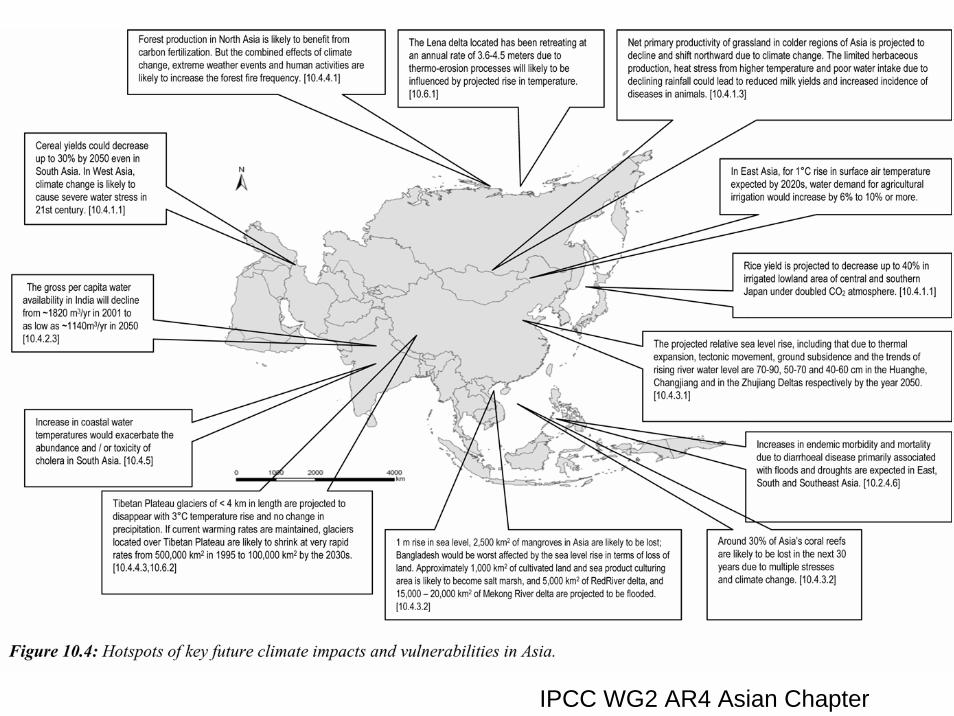
IPCC WG2 AR4 Asian Chapter
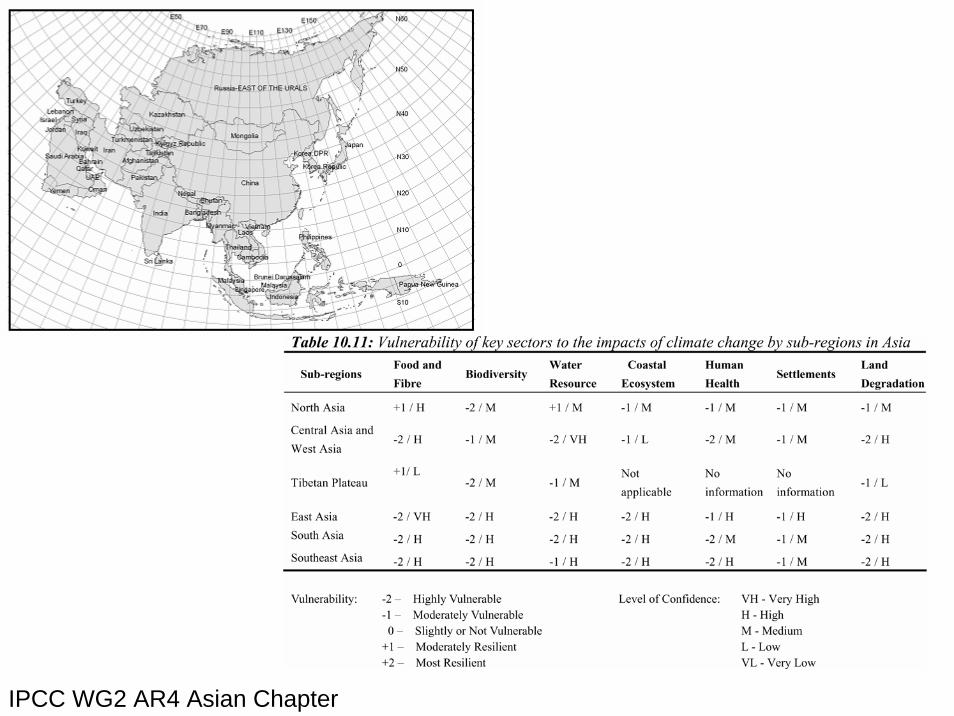
IPCC WG2 AR4 Asian Chapter
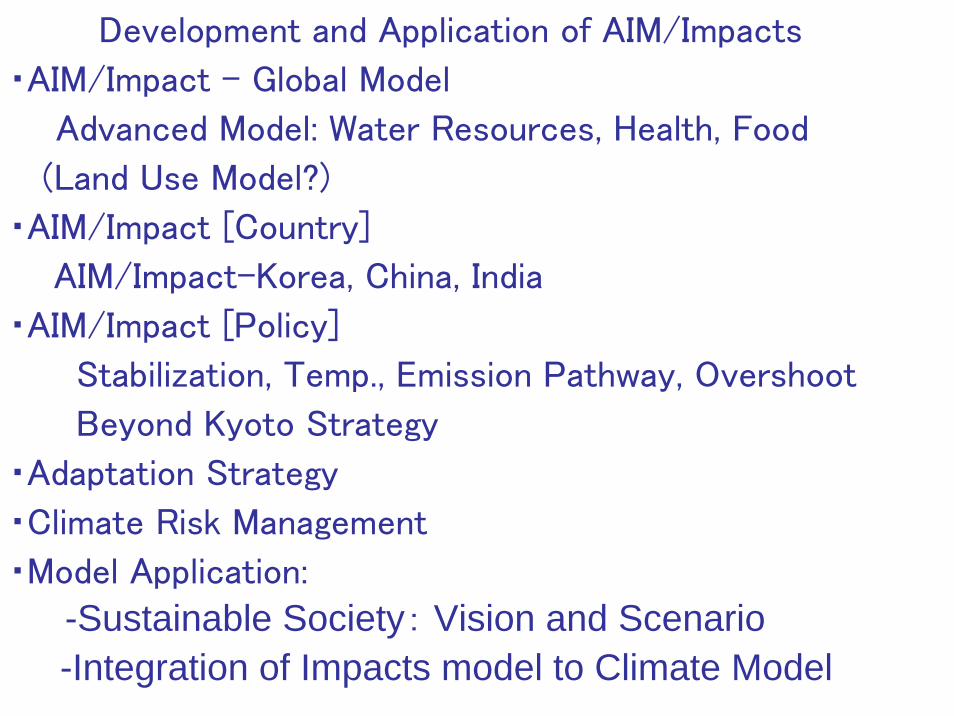
Development and Application of AIM/Impacts
・AIM/Impact - Global Model
Advanced Model: Water Resources, Health, Food
(Land Use Model?)
・AIM/Impact [Country]
AIM/Impact-Korea, China, India
・AIM/Impact [Policy]
Stabilization, Temp., Emission Pathway, Overshoot
Beyond Kyoto Strategy
・Adaptation Strategy
・Climate Risk Management
・Model Application:
-Sustainable Society: Vision and Scenario -Integration of Impacts model to Climate Model