Embed Size (px)
Citation preview
Wanted: “Reliable & Accurate” Multiphase Flow Measurement in Intelligent Completions
Ö. Haldun Ünalmis, Weatherford
Session I: Multiphase Flowmetering in Wells
Outline
• Need for In-Well Flow Measurement
• Introduction: Optical Flow Measuremento The basics: what, how, and why
o Single-phase, two-phase, and multiphase flow measurements
• Milestones & Case Historieso Applications
• Conclusions/Discussion
Slide 2
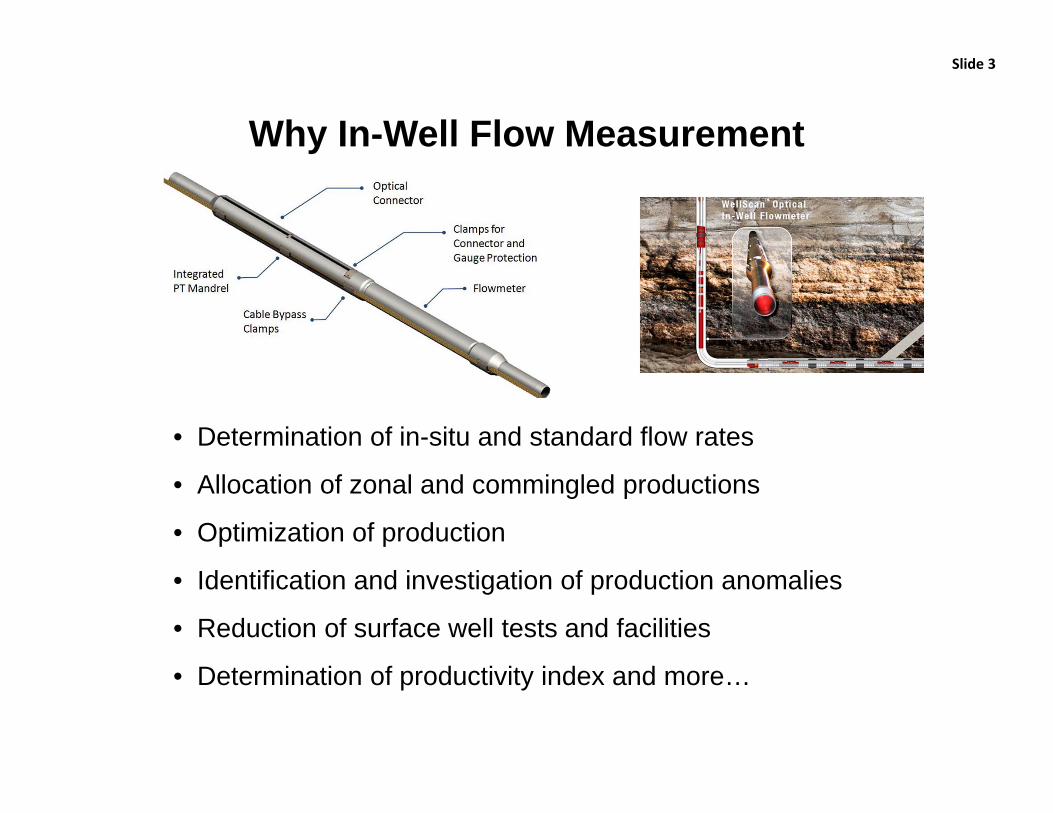
Why In-Well Flow Measurement
Slide 3
• Determination of in-situ and standard flow rates
• Allocation of zonal and commingled productions
• Optimization of production
• Identification and investigation of production anomalies
• Reduction of surface well tests and facilities
• Determination of productivity index and more…
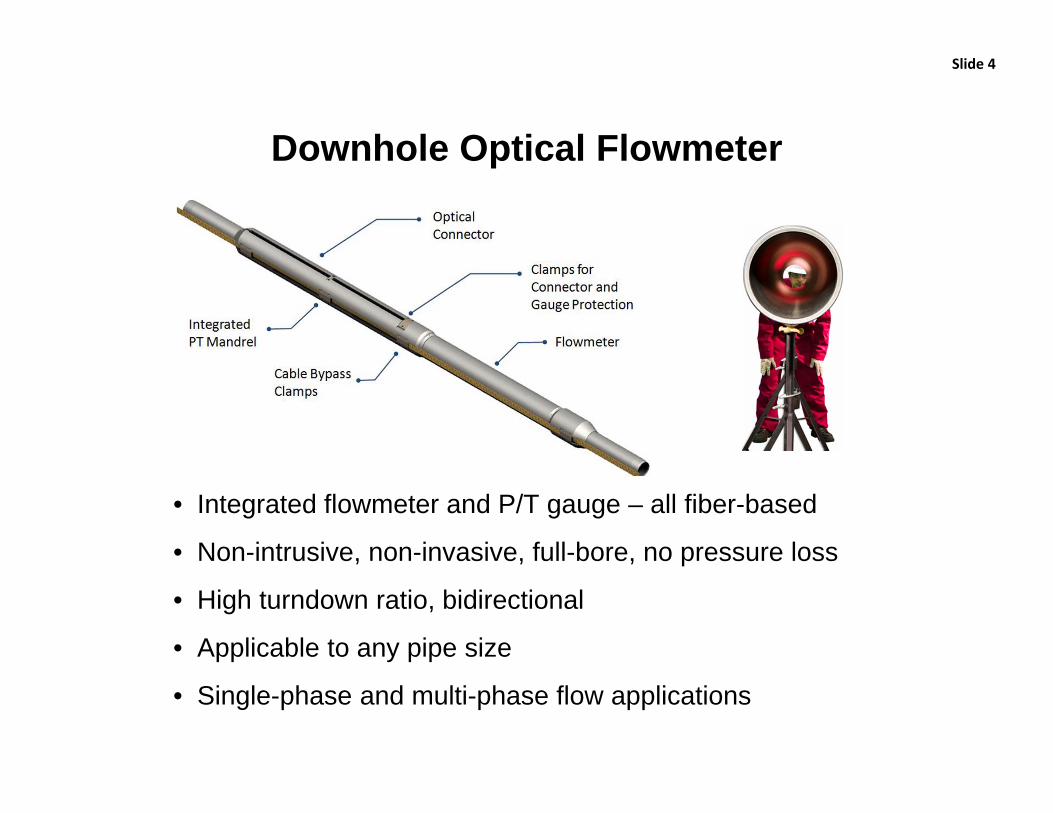
Downhole Optical Flowmeter
Slide 4
• Integrated flowmeter and P/T gauge – all fiber-based
• Non-intrusive, non-invasive, full-bore, no pressure loss
• High turndown ratio, bidirectional
• Applicable to any pipe size
• Single-phase and multi-phase flow applications
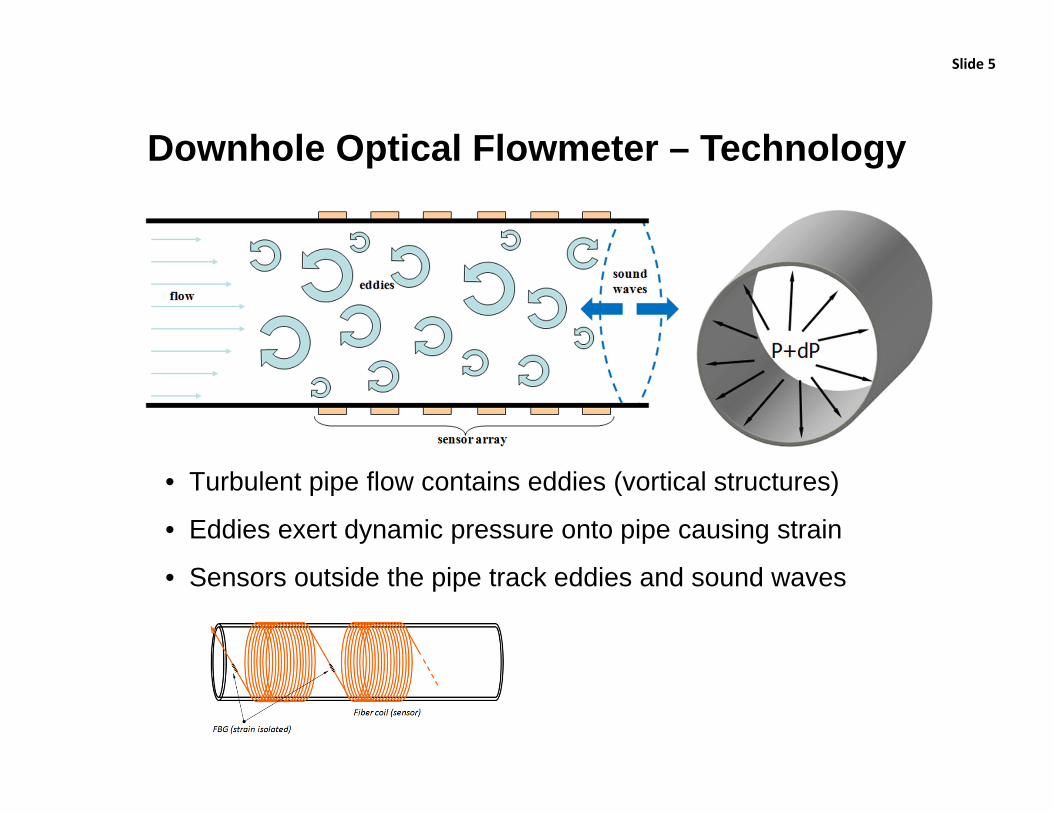
Downhole Optical Flowmeter – Technology
Slide 5
• Turbulent pipe flow contains eddies (vortical structures)
• Eddies exert dynamic pressure onto pipe causing strain
• Sensors outside the pipe track eddies and sound waves
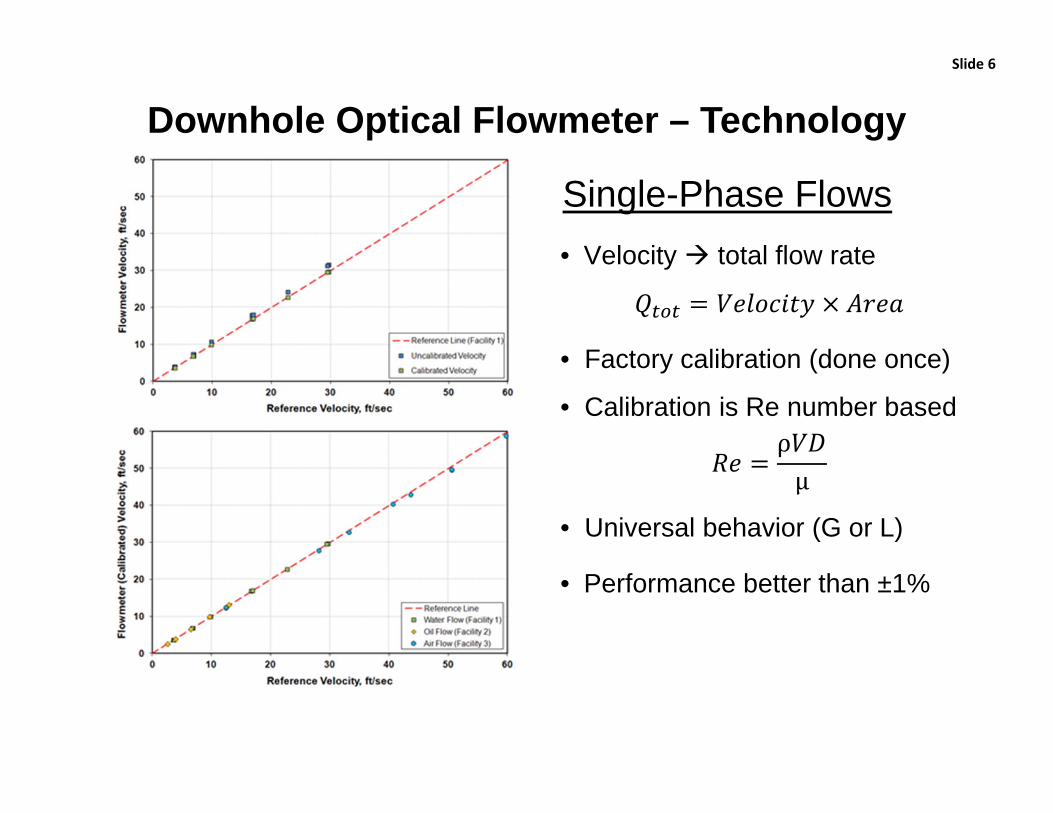
Single-Phase Flows• Velocity total flow rate
• Factory calibration (done once)
• Calibration is Re number basedρμ
• Universal behavior (G or L)
• Performance better than ±1%
Slide 6
Downhole Optical Flowmeter – Technology
Slide 7
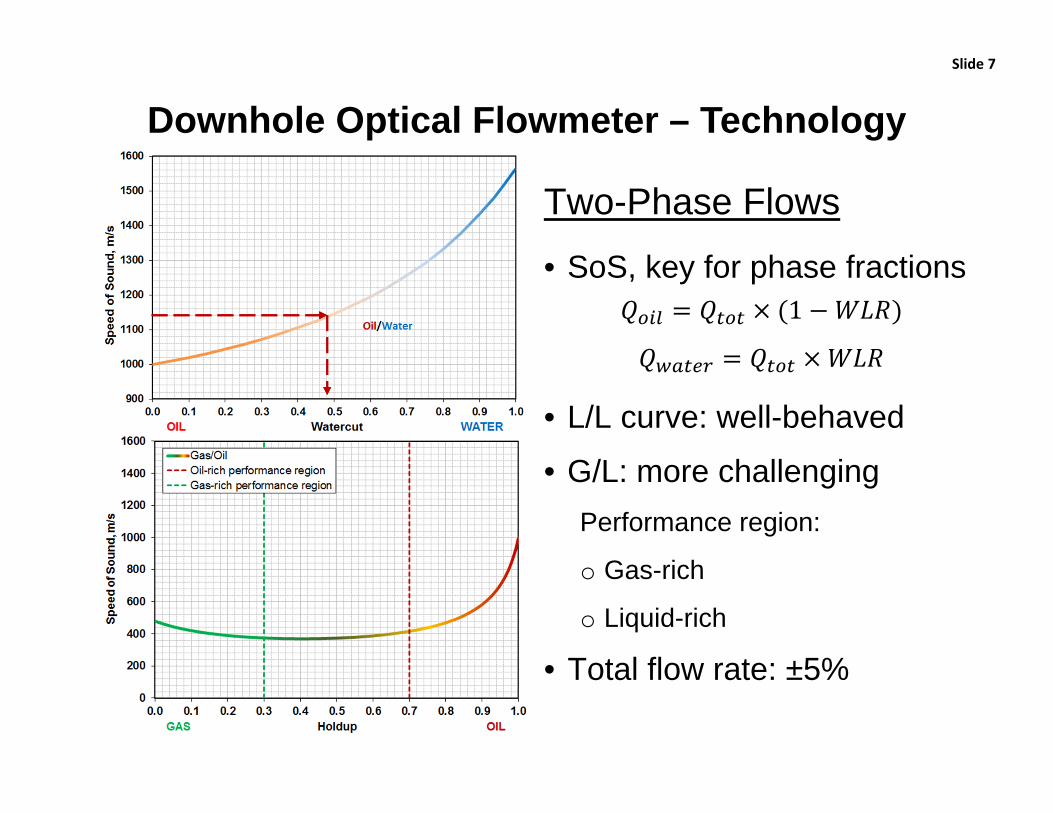
Downhole Optical Flowmeter – Technology
Two-Phase Flows
• SoS, key for phase fractions1
• L/L curve: well-behaved
• G/L: more challengingPerformance region:
o Gas-rich
o Liquid-rich
• Total flow rate: ±5%

Slide 8
Three-Phase Flows
• Solution envelope (PVT)
o SoS & density
• Contours of HL & WLR
• (HL, WLR) phase fractions
• (HL, WLR) 3-phase point
• (SoS, density) (HL, WLR)
• Velocity total flow rate
Downhole Optical Flowmeter – Technology
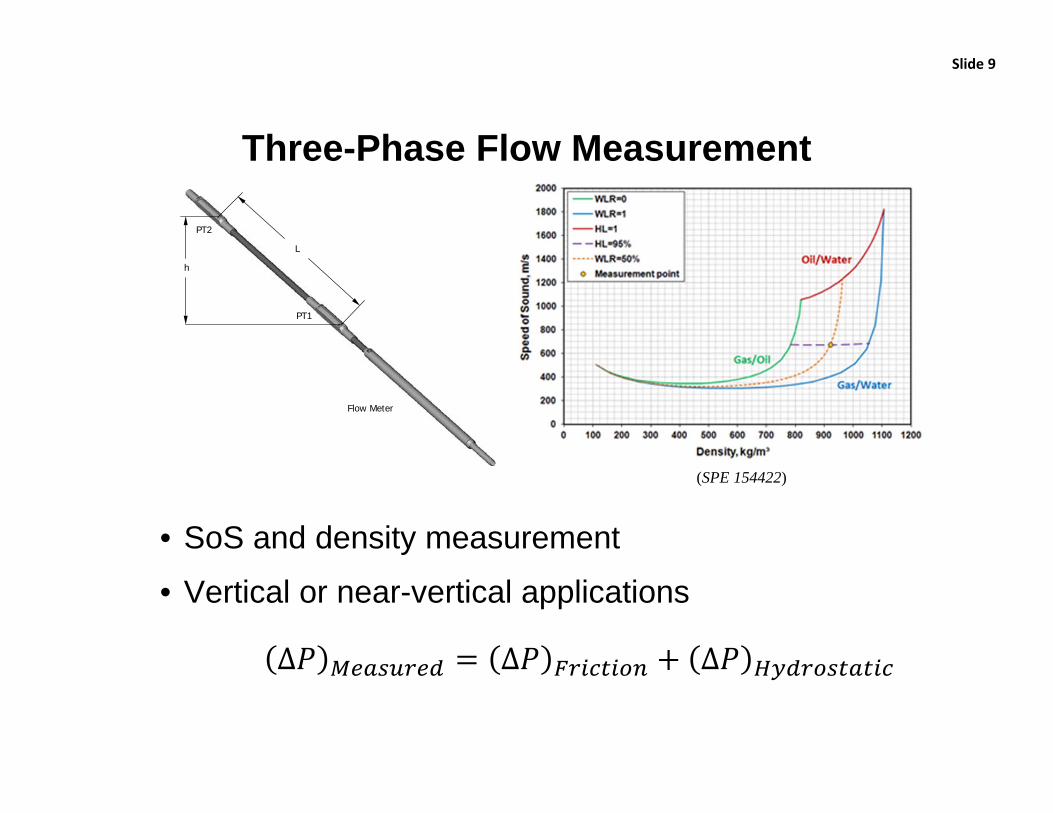
Three-Phase Flow Measurement
Slide 9
PT1
PT2
h
L
Flow Meter
(SPE 154422)
• SoS and density measurement
• Vertical or near-vertical applications
Δ Δ Δ
PT1
PT2
h
L
Flow Meter
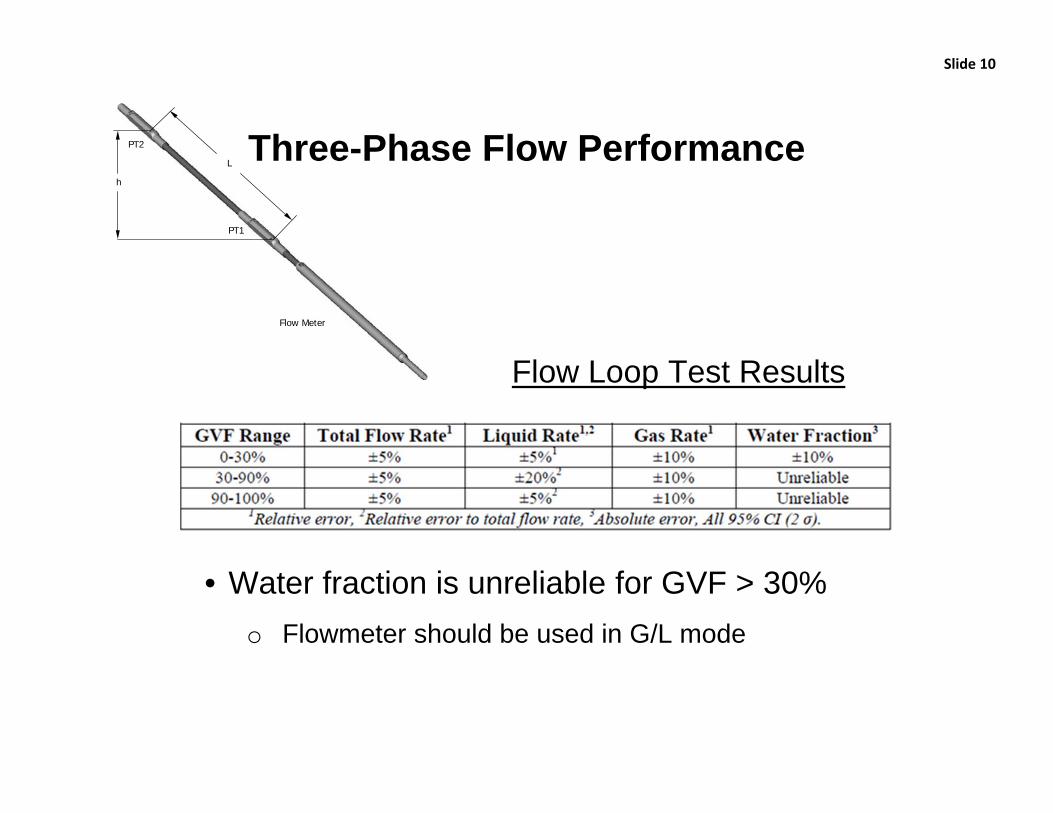
Three-Phase Flow Performance
Slide 10
• Water fraction is unreliable for GVF > 30%o Flowmeter should be used in G/L mode
Flow Loop Test Results
Slide 11Slide 11
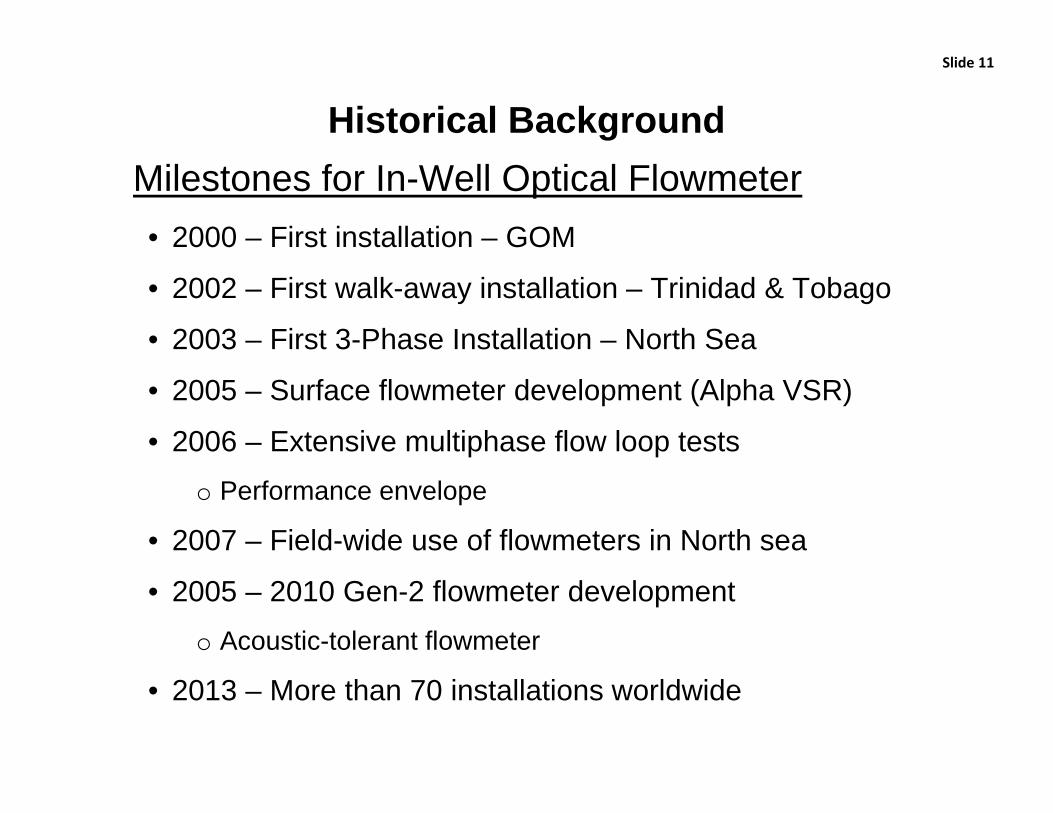
Historical Background
• 2000 – First installation – GOM
• 2002 – First walk-away installation – Trinidad & Tobago
• 2003 – First 3-Phase Installation – North Sea
• 2005 – Surface flowmeter development (Alpha VSR)
• 2006 – Extensive multiphase flow loop testso Performance envelope
• 2007 – Field-wide use of flowmeters in North sea
• 2005 – 2010 Gen-2 flowmeter developmento Acoustic-tolerant flowmeter
• 2013 – More than 70 installations worldwide
Milestones for In-Well Optical Flowmeter
Slide 12Slide 12
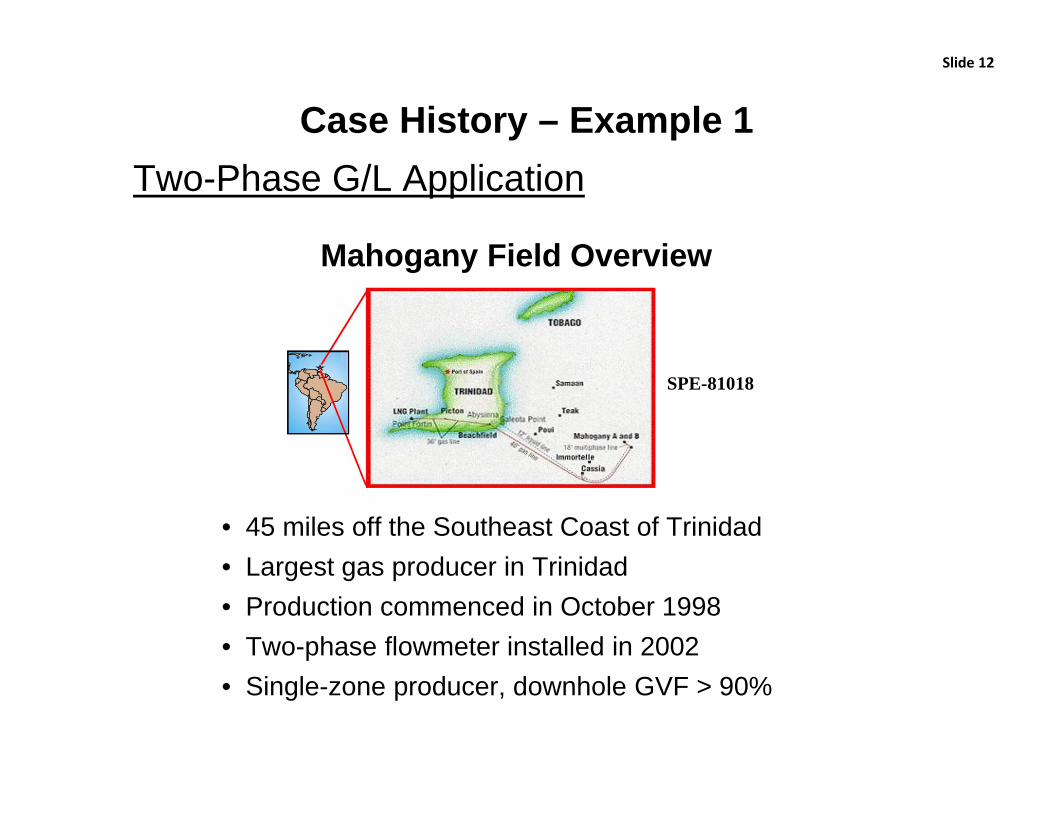
Case History – Example 1Two-Phase G/L Application
Mahogany Field Overview
• 45 miles off the Southeast Coast of Trinidad• Largest gas producer in Trinidad • Production commenced in October 1998• Two-phase flowmeter installed in 2002• Single-zone producer, downhole GVF > 90%
SPE-81018
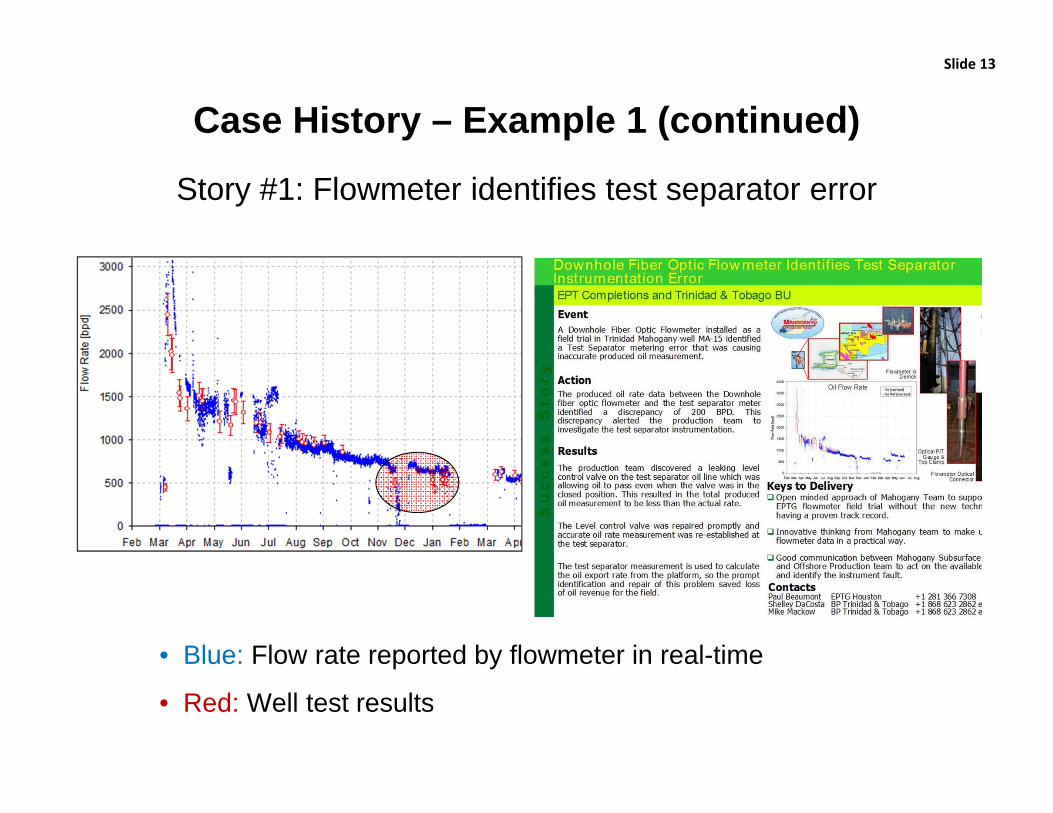
Story #1: Flowmeter identifies test separator error
Slide 13
• Blue: Flow rate reported by flowmeter in real-time
• Red: Well test results
Case History – Example 1 (continued)
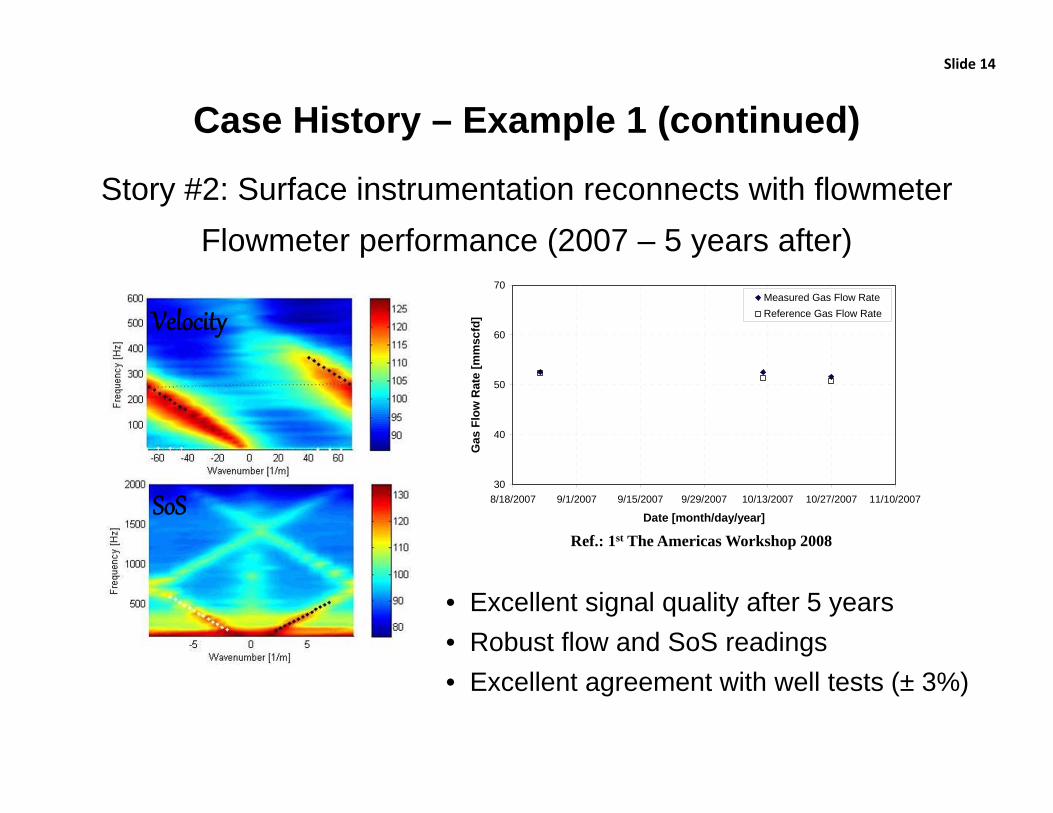
Flowmeter performance (2007 – 5 years after)
Slide 14
• Excellent signal quality after 5 years• Robust flow and SoS readings• Excellent agreement with well tests (± 3%)
Case History – Example 1 (continued)
Velocity
SoS
Story #2: Surface instrumentation reconnects with flowmeter
30
40
50
60
70
8/18/2007 9/1/2007 9/15/2007 9/29/2007 10/13/2007 10/27/2007 11/10/2007
Date [month/day/year]
Gas
Flo
w R
ate
[mm
scfd
]
Measured Gas Flow RateReference Gas Flow Rate
Ref.: 1st The Americas Workshop 2008
SPE-95843
Slide 15Slide 15
Case History – Example 2
• North Sea Veslefrikk Field
• 4-zone WAG injector
• First intelligent well integrated with ICVs
• 3 single-phase flowmeters with P/T gaugeso Installed in 2004
• Objectiveso Remote control and monitoring
o Optimize water and gas injection
o Choke rates in zones with undesired water amount
Multi-Zone Injector Application
Slide 16Slide 16
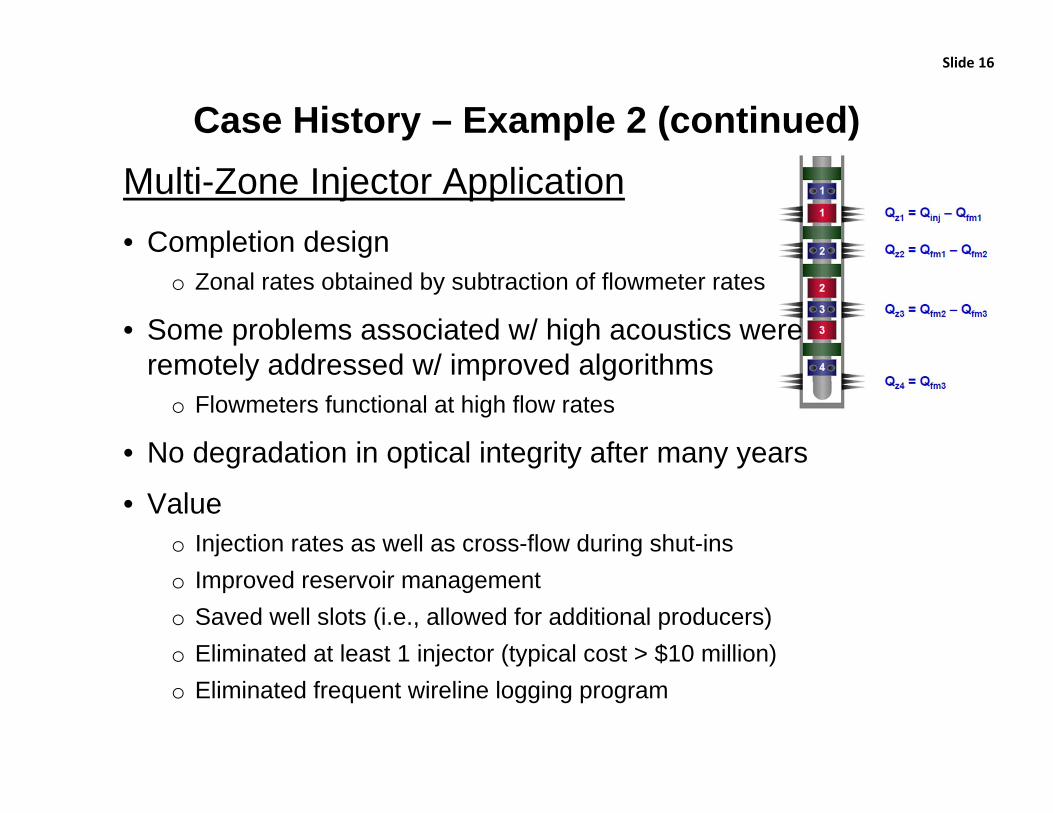
Case History – Example 2 (continued)
• Completion designo Zonal rates obtained by subtraction of flowmeter rates
• Some problems associated w/ high acoustics were remotely addressed w/ improved algorithms
o Flowmeters functional at high flow rates
• No degradation in optical integrity after many years
• Valueo Injection rates as well as cross-flow during shut-inso Improved reservoir managemento Saved well slots (i.e., allowed for additional producers)o Eliminated at least 1 injector (typical cost > $10 million)o Eliminated frequent wireline logging program
Multi-Zone Injector Application
Slide 17Slide 17
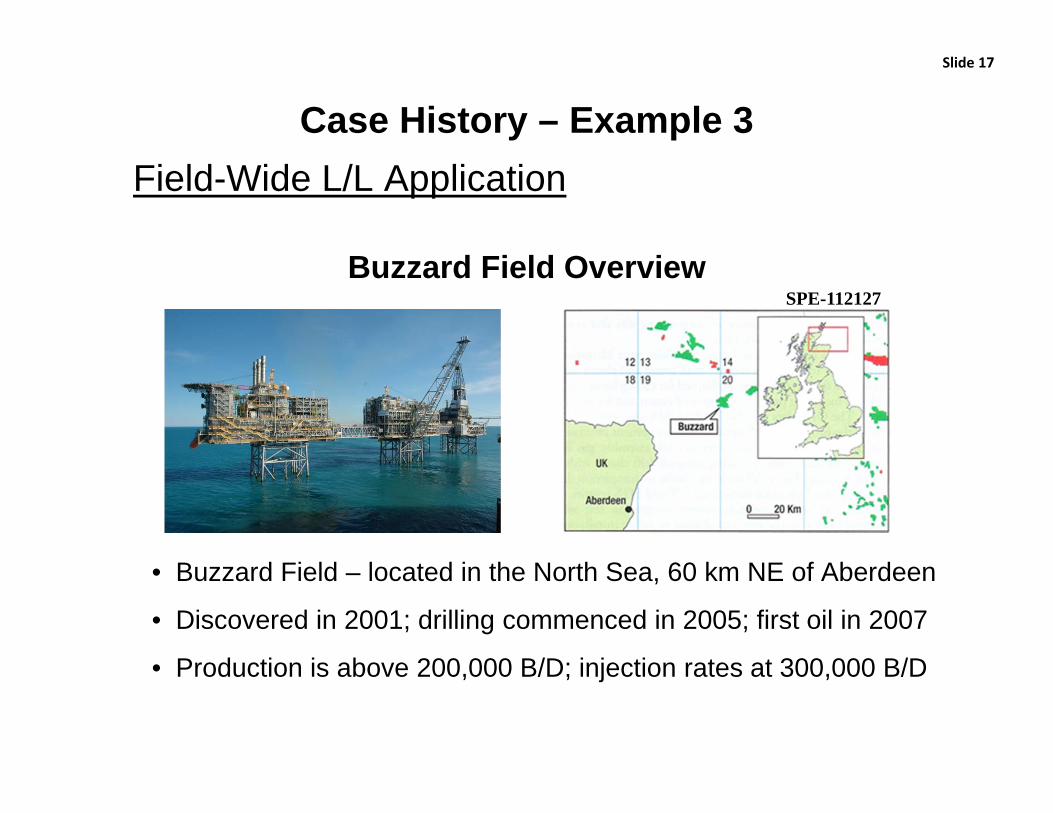
Case History – Example 3Field-Wide L/L Application
Buzzard Field Overview
• Buzzard Field – located in the North Sea, 60 km NE of Aberdeen
• Discovered in 2001; drilling commenced in 2005; first oil in 2007
• Production is above 200,000 B/D; injection rates at 300,000 B/D
SPE-112127
Slide 18
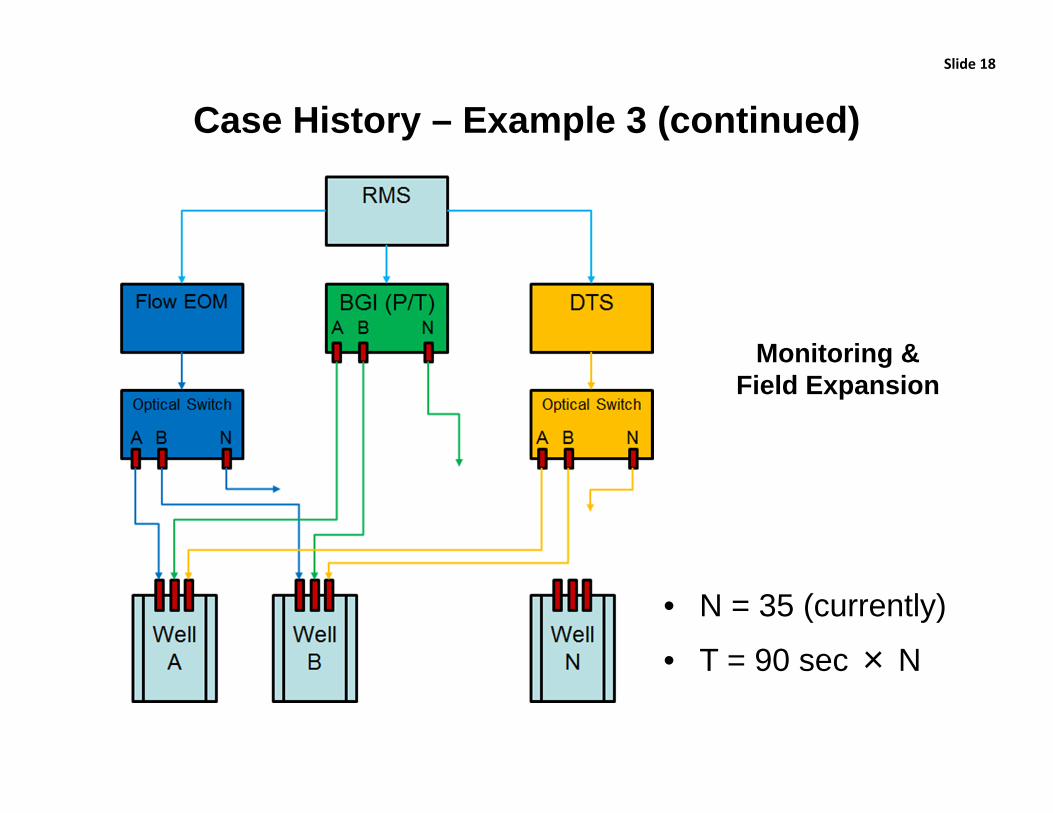
• N = 35 (currently)
• T = 90 sec × N
Monitoring & Field Expansion
Case History – Example 3 (continued)
Slide 19Slide 19
Case History – Example 4Service Change: Producer to Injector• Dedicated injection well required to maintain pressure
support
• Two wells identified for water and oil injectiono Water injector: oil line removed, water line installed
o Gas injector: gas injection feasibility study
• Wells didn’t include topside-metering solutions; utilizationof downhole two-phase flowmeters was important
• Flowmeter is flexible to accommodate the service changeo Flowmeter measurement bidirectional
o Independent of the type of fluid
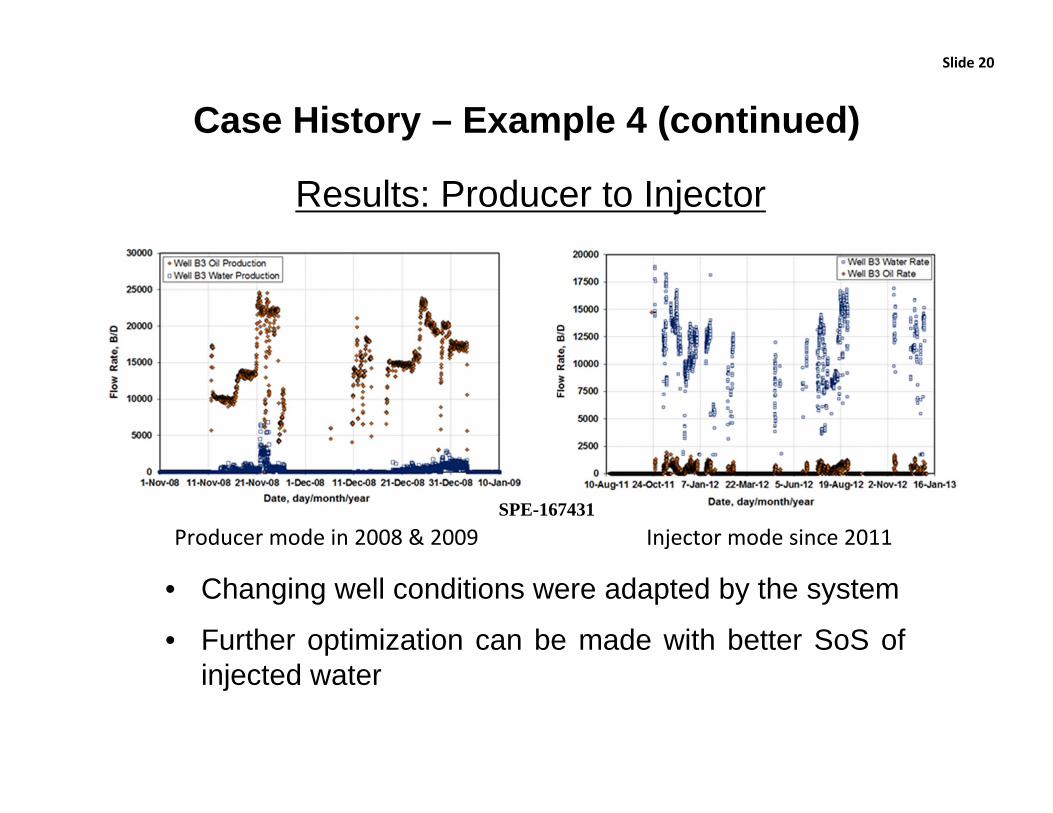
Results: Producer to Injector
Slide 20Slide 20
Producer mode in 2008 & 2009 Injector mode since 2011
• Changing well conditions were adapted by the system
• Further optimization can be made with better SoS ofinjected water
Case History – Example 4 (continued)
SPE-167431
Slide 21Slide 21
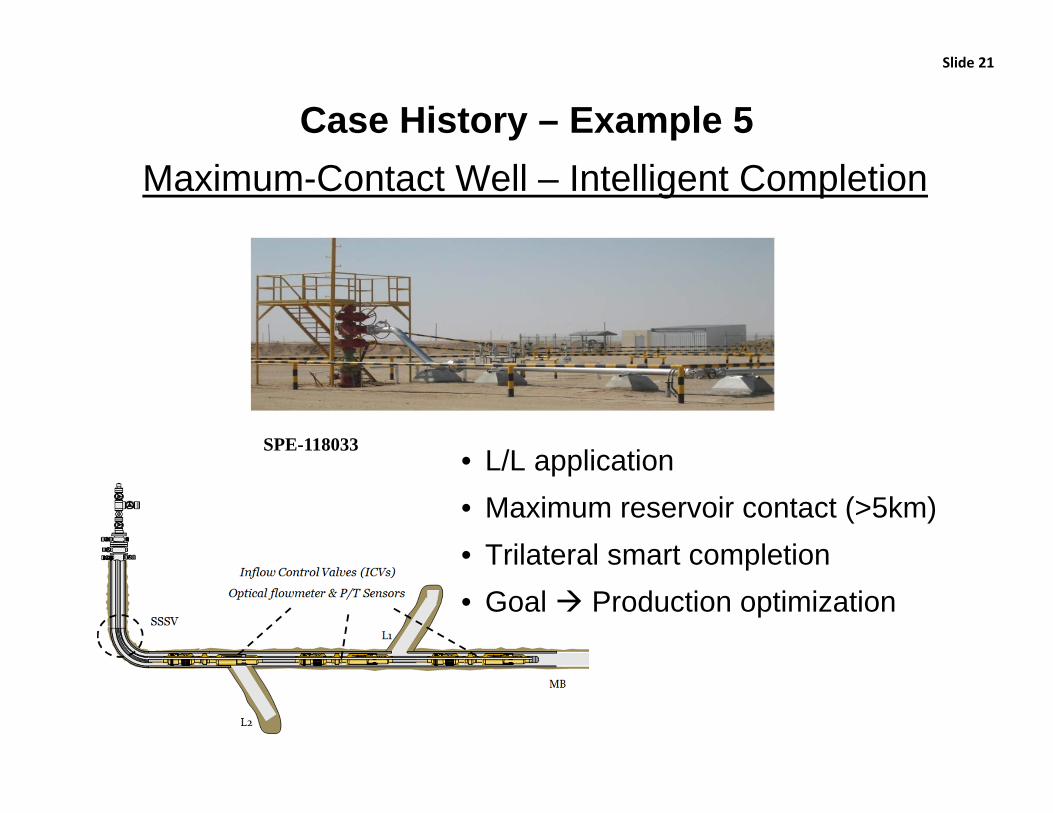
Case History – Example 5Maximum-Contact Well – Intelligent Completion
• L/L application• Maximum reservoir contact (>5km)• Trilateral smart completion• Goal Production optimization
SPE-118033
Slide 22Slide 22
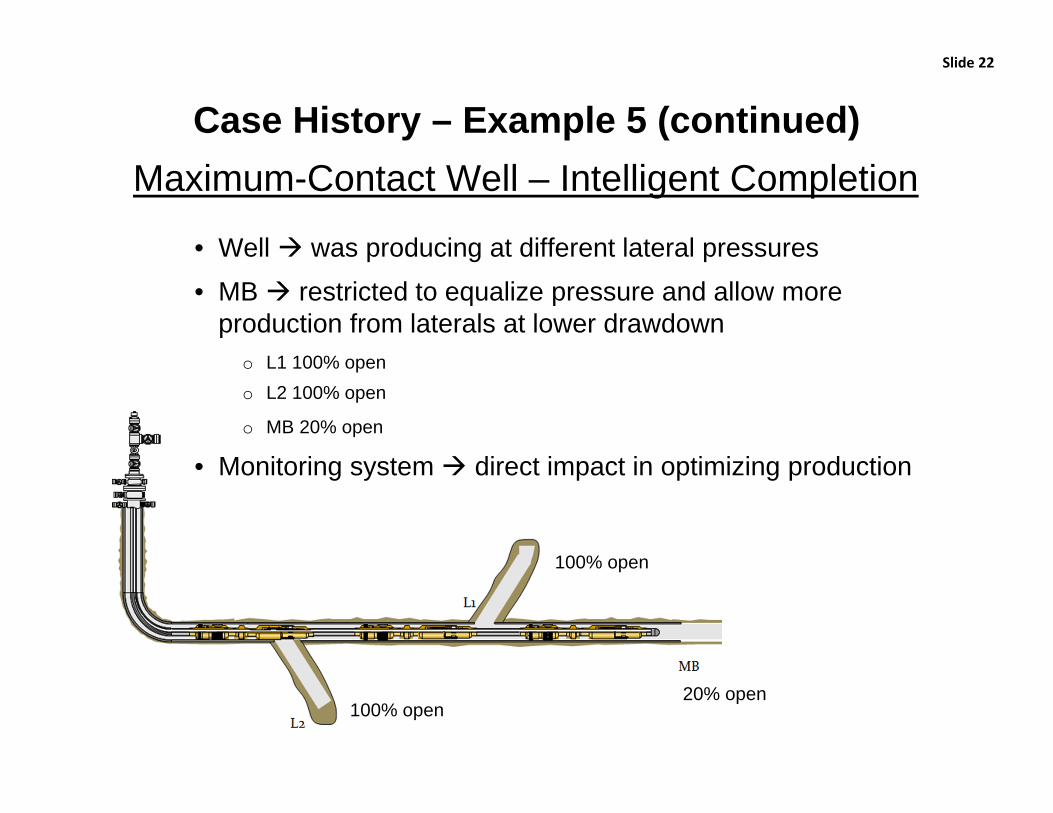
Case History – Example 5 (continued)Maximum-Contact Well – Intelligent Completion
• Well was producing at different lateral pressures• MB restricted to equalize pressure and allow more
production from laterals at lower drawdowno L1 100% openo L2 100% open
o MB 20% open
• Monitoring system direct impact in optimizing production
100% open
100% open
20% open
Slide 23
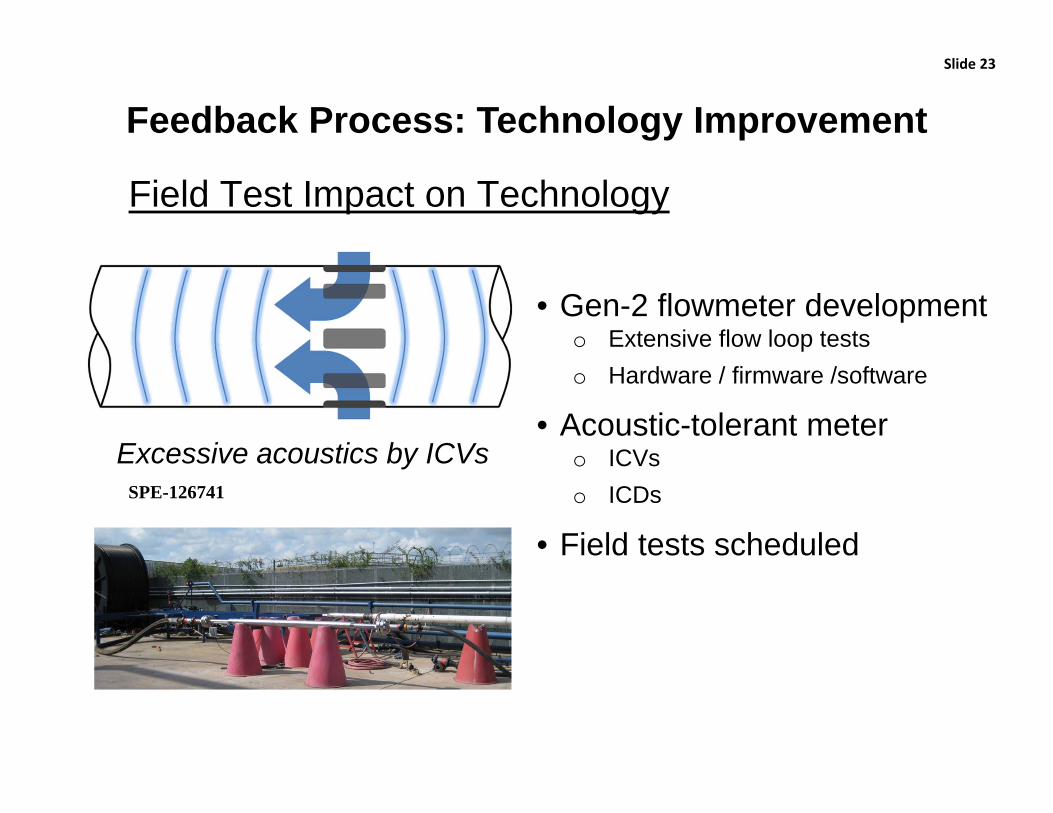
Excessive acoustics by ICVs
• Gen-2 flowmeter developmento Extensive flow loop testso Hardware / firmware /software
• Acoustic-tolerant metero ICVso ICDs
• Field tests scheduled
Feedback Process: Technology Improvement
Field Test Impact on Technology
SPE-126741
Paper # • Paper Title • Presenter Name
Slide 24
• Real-time, continuous monitoring and allocationo Single-zone and multi-zone applicationso Production optimizationo Detection of production anomalies
• Reduction of well test frequency in test separatoro Production acceleration
• “Life-of-well” solutiono Reliabilityo Robustnesso Accuracyo Flexibility
Slide 24
Conclusions – In-Well Flow Measurement
Operator Perspective
Slide 25
• Multi-well, multi-sensor optical systems are proveno Expansion: flexibleo Remote system access: beneficial, fast resultso Reliability, longevity
• Adapting changing field/well conditionso Well service change: possible (e.g. producer-to-injector)o Fluid composition change: possibleo Accuracy
• Real-time flow monitoring: a valuable toolo Production optimizationo Detection of anomalies
Slide 25
Conclusions – In-Well Flow Measurement
Technology Provider Perspective

Thank You
Questions & Discussion
Slide 26