Embed Size (px)
Citation preview

Session 65 PD, Special Topics in Medicare Part D
Moderator:
Brent Lee Greenwood, ASA, MAAA
Presenters:
Paul Douglas Erickson, FSA, MAAA
Doug Proebsting, FSA, MAAA

Session 65 Panel Discussion: Special Topics in Medicare Part DJune 16, 2015, 11:00 am – 12:15 pm
Presented by:Brent Greenwood (Moderator), ASA, MAAA, Vice President, Actuarial Consulting, OptumDoug Proebsting, FSA, MAAA, Principal and Consulting Actuary, MillimanPaul Erickson, FSA, MAAA, Director, Actuarial Consulting, Optum

Agenda for Today’s Meeting
• Part D Market Assessment – Brent Greenwood, Optum• Overview of Medicare Market• Overview of the Part D Market• Part D Auto-Assign Market• Part D Market Drivers
• 2016 Part D Bids Considerations – Doug Proebsting, Milliman• Significant 2016 Part D Bid Issues• Benefit and Formulary Changes • PDP Market• MAPD Part D Market
• Part D Public Resources – Paul Erickson, Optum• Historical Public Use Files• What Is New For Part D• Examples of New Public Use Information
2
And of course, your questions…

Overview of Medicare MarketMedicare
FFSMedicare
Advantage/MCTotal
Medicare
Members 2012 36,458 12,391 48,849 2013 37,214 13,614 50,829
2014 37,587 14,869 52,456 Trend 2013 2.1% 9.9% 4.1%
2014 1.0% 9.2% 3.2%
Medicare Membership Growing at 3-4% Industry Focus is on the 9-10% MA/MC Membership Growth FFS Membership Growth is 1-2% Medigap is not coming to an end, but rather growing at 3-4%
since 2012 Less people with FFS Medicare as only coverage
Source: From CMS Statistic File. Various report dates.
3

Overview of Part D MarketMA PDP Total PART D
EMPLOYER INDIVIDUAL TOTAL EMPLOYER INDIVIDUAL TOTAL EMPLOYER INDIVIDUAL TOTAL
Members 2011 2,180 9,985 12,166 1,563 17,318 18,880 3,743 27,303 31,046
2012 2,398 10,984 13,383 2,234 17,833 20,067 4,632 28,817 33,450
2013 2,614 11,989 14,603 4,543 18,293 22,837 7,157 30,283 37,440
2014 3,023 12,837 15,860 4,787 18,753 23,540 7,811 31,590 39,400
2015 3,150 13,278 16,428 4,715 19,204 23,919 7,865 32,483 40,347
Trend 2012 10.0% 10.0% 10.0% 42.9% 3.0% 6.3% 23.8% 5.5% 7.7%
2013 9.0% 9.1% 9.1% 103.4% 2.6% 13.8% 54.5% 5.1% 11.9%
2014 15.7% 7.1% 8.6% 5.4% 2.5% 3.1% 9.1% 4.3% 5.2%
2015 4.2% 3.4% 3.6% -1.5% 2.4% 1.6% 0.7% 2.8% 2.4%
Average 9.7% 7.4% 7.8% 37.5% 2.6% 6.2% 22.0% 4.4% 6.8%
MAPD Membership Growth Remains Strong PDP Individual membership slowing due to migration to MC and MA EGWP is the primary area of growth for Part D, percentage wise RDS employer membership dropped from 6.9M to 2.1M as those employers
transferred to EGWP Private Exchange membership contributing to the increase in individual PDP
and MAPD
Source: From Monthly CMS Enrollment Reports
4

Part D Auto-Assign (AA) Plan Landscape• Attainment of Auto Assign members are a key strategy to
some PDP players• Top six AA plans (in order of estimated 2015 AA plan
enrollment vs 2014): 1. CVS Caremark Corporation (3.2M vs 2.4M)2. Humana Inc. (1.7M vs 1.7M)3. UnitedHealth Group, Inc. (1.3M vs 1.2M)4. CIGNA (1.0M vs 750K)5. Wellcare Health Plans, Inc. (927K vs 1.2M)6. Aetna Inc. (614K vs 530K)
Source: Estimated from CMS Landscape data
*Copy and paste this text box to enter notations/source information. 7pt type. Aligned to bottom. No need to move or resize this box.
6

Part D Market Drivers - Membership Changes
• PDP Membership has grown 2.3%, with all of the growth in enhanced plans.• Primary Drivers of membership change due to:
– Adopting Low Basic premium strategy– Cross walking Basic members to EA and vice versa– Abandoning low premium strategy – Introduction or maintaining low priced EA plans
Source: CMS Landscape data
2014 (year-end) 2015 (Feb.) ChangeSponsor Basic Enhanced Total Basic Enhanced Total Basic Enhanced Total
Aetna 949,533 566,429 1,515,962 641,195 759,825 1,401,020 (308,338) 193,396 (114,942)
CIGNA 1,106,068 49,846 1,155,914 1,004,713 412,782 1,417,495 (101,355) 362,936 261,581
CVS Health 2,470,834 494,872 2,965,706 3,236,789 135,494 3,372,283 765,955 (359,378) 406,577
Humana 1,719,774 2,127,567 3,847,341 1,707,618 2,523,886 4,231,504 (12,156) 396,319 384,163
UnitedHealthcare 1,200,682 3,760,796 4,961,478 1,322,193 3,590,776 4,912,969 121,511 (170,020) (48,509)
WellCare 1,252,291 147,729 1,400,020 991,550 108,812 1,100,362 (260,741) (38,917) (299,658)
Others 1,973,737 908,005 2,881,742 1,680,559 1,053,835 2,734,394 (293,178) 145,830 (147,348)
10,672,919 8,055,244 18,728,163 10,584,617 8,585,410 19,170,027 (88,302) 530,166 441,864
Percentage change -0.8% 6.2% 2.3%
7

Part D Market Drivers- EA Enrollment Growth
• 2015 saw significant growth in enhanced plans membership, all in low-premium plans
• Of the mid-premium plans, five million members are with three sponsors .• Future growth will likely be in the low EA plans as price is a key driver for PDP
membership movement.
Source: CMS Landscape data
2014 2015Premium Level Mbrs Avg Prem Mbrs Avg Prem Mbr ChangeLow (under $40 average) 1,476,004 22$ 2,540,840 25$ 1,064,836 Mid ($40 - $80 average) 5,840,257 46$ 5,524,171 53$ (316,086) High (over $80 average) 738,983 110$ 520,399 112$ (218,584)
8,055,244 48$ 8,585,410 48$ 530,166
8

Part D Market Drivers - Top 6 Plans• Product offering strategies are not the same!
– Plans offering basic + low-EA + mid-EA = 1 (Humana)– Plans offering basic + mid-EA = 3 (UHG, CVS, WellCare)– Plans offering basic + low/mid-EA + high-EA = 2 (CIGNA, Aetna)
• Split Networks are here to stay!– All Parent Org’s offered some form of split network structure– Some networks much larger than others.– Split network copays are primarily differentiated on generic tiers, but not as much
on brand tiers.• Partnerships and vertical integration appear to be King!
– The three largest sponsors leverage business partnerships to gain or sustain market share
– This can include retiree associations, large retailers that carry strong brand names and Related Party PBMs
• Eat or be Eaten! – Acquisitions will likely continue to be a source of growth.
9
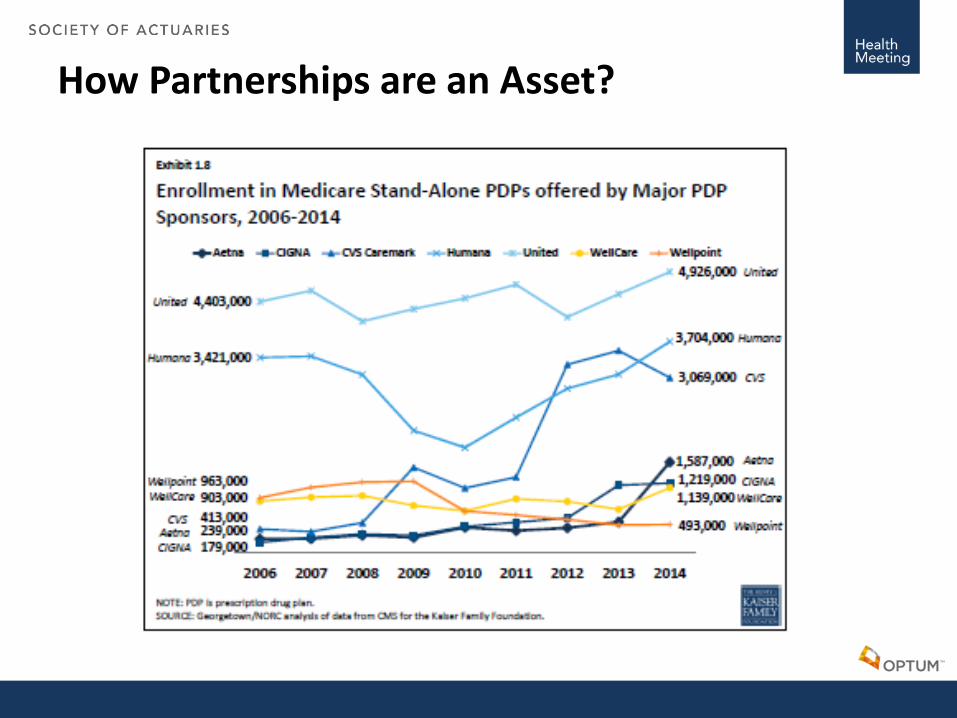
How Partnerships are an Asset?

2016 Part D Bid Considerations
• Significant 2016 Part D bid issues• Benefit and formulary changes • PDP market• MAPD Part D market• Disclaimer
– We are currently in an active 2016 bid cycle so references are made only to known issues and changes that happened through 2015 and not associated to a specific plan or theme for 2016

Significant 2016 Part D Bid Issues
• Trends (Hepatitis-C, PCSK9, Specialty)– Impact on CMS parameters
• Median versus average cost – “Barbell” effect• Reinsurance – higher specialty trend increases CMS’ costs more than plan liability
– Industry Impact in 2015 and beyond• GDR may be reaching limits for many plans, limiting the ability to mitigate unit cost
trend through brands converting to generics• Higher rebates and reinsurance are offsetting trend somewhat• Coverage gap closing for non-low income members• Generic unit cost trends highest in years • Brand trends continue in double digits
• Most significant CMS benefit parameter increases in program to date• Part D risk scores appear to be increasing

Benefit and Formulary Changes
• Benefit Reduction Pressure – PDPs to remain price competitive for EA plans and LIB plans– MAPD benefits decreasing due to MA revenue pressure
• Preferred Network Expansion– PDPs - is it now a requirement?– MAPDs – becoming more common as well
• Formulary Restructuring– PDPs need it to remain competitive and manage risk selection– MAPDs to improve risk selection– Both must meet OOPC requirements– Leverage more rebates
• Concerns Beyond 2016– Preferred network DIR / network adequacy requirements– Limiting generic tier placement

PDP Market
• AWP trends are up, NLI benefits are richer, so why do we think the National Average Bid Amount (NABA) will drop?– See also Section 76 later today for a deep dive into NABA/NAMP– Direct subsidy could drop significantly if historical changes continue– Competition for LIB or premium positioning
• Population shifting to lower cost plans
– Increased DIR payments from preferred network and manufacturer rebates and formulary alignment/negotiation (example Hepatitis C)
• Percentage rebates times high trend produces more rebates
– CMS risk scores averaging > 1.00?– Pharmacy discount improvements– Large portion of trend falls into gap and catastrophic and paid by member or
CMS, increases NAMP, decreases NABA

MAPD Part D Market
• Continued pressure on Part C rebates with FFS equivalency, ICD-10, risk models, practice model leakage, etc…
• Preferred networks are becoming more popular • Benefit reductions offset trends
– Many MA PD plans were more enhanced in the past– Deductibles are becoming more common (often brand only)– Potentially switching from copays to coinsurance– Reducing or removing enhanced GAP coverage (ACA provided)– Formulary changes with limits on NPB tier– Increase copays to the higher brand limits in 2016?
• High brand trend makes annual dollar copay limit increases important for T3 and T4 in particular (for 5 tier plans)

Part D Public Resources
• What is going on in your industry? – Historical Public Use Files– What Is New For Part D– Examples of New Public Use Information
16
Part D Public Resources
• CMS Statistics File• Part D Landscape• Enrollment Reports (Monthly and Special)• Audit Findings• Part D Star Ratings• Part D Prescriber PUF• Formulary, Network and Benefits • PBP Information (Annual PBP Files All Plans)
17

Part D Public Resources
• Part D Landscape– Probably Most Used File By Part D Actuaries– Determine Membership Shifts– NAB/LIB Models– Forecasting and Projections– Review Competitively
• Average Percentile• DE Minimis Percentage• Competitor Trend Analysis
18

Part D Public Resources
• Monthly Enrollment Statistics– Growth of Competition During AEP– Analysis of Age-in Growth– Plan Forecasting
• Annual LI/Non-LI Report– LIB Models– Estimate Risk Score Change Impact
19

Part D Public Resources
• Audit Findings – Plan Sanctions– OACT Bid Audits– Operation Audits
• CARs and ICARs• Plan Enrollment Sanctions• Financial Penalties
– OMB Audits and CMS Audits• What should the Plan should focus on next?
20

Part D Public Resources
• Part D Star Reporting– Where is the “Silver Bullet!”– Lots of competitive information
• What has the best adherence rates?• Reviewing large year over year movement.• What are the best Star rating and impact on competition?• Determining reasons for plan differences.
– Personally, the Star Reports answer and raise many questions
21

Part D Public Resources
• Part D Prescriber PUF– I have not figured this one out yet!– Most likely Review Practice patterns
• Clinical• Adherence• Continuing Education • Fraud and Abuse• Outliers
22

Part D Public Resources
• Part D Formulary Information – Discounts & Premium (POS vs DIR)– Industry Direction– Clinical Analysis – Policy Monitoring (copay and network)– Benefit Discrimination Analysis – Competitive Analysis
• Drugs Covered– Selection Issues
• Tiers Alignment• PA/ST
23

Part D Public Resources
• PBP Information (Annual PBP Files All Plans)– CMS Released all PBP for 2014 and 2015 – A few examples
• MAPD EA plans preferred networks increased from 16.9%-28.7%• Total PDP preferred network penetration went from 71.8%-86.7%• 5-Tier plans increased from 83.4%-93.4%• MAPD-EA plans with no deductibles dropped from 87%-75%• PDP deductibles increased 29% in total and by 57% for MAPD EA plans
– Medium For MAPD EA moved from 100-150• PDP Generic (Tier 2) coverage dropped from 21.5-16%• PDP Tier 3&4 Brand coverage increased – 10% GAP rule?
“Substituting facts for Impressions”
24

Questions?
25