Embed Size (px)
Citation preview
1
Session 3226
The Virtual Soil Mechanics Laboratory
Vito A. GuidoThe Cooper Union for the Advancement of Science & Art
AbstractThe Virtual Soil Mechanics Laboratory is used in conjunction with the introductoryundergraduate course in Soil Mechanics, which is required of all students majoring in CivilEngineering at the Cooper Union.
Integrating the laboratory portion of the introductory Soil Mechanics course with the world wideweb has many significant benefits. At the forefront is the ability to improve the students'perception of the material at hand. An on-line laboratory provides students with the capability toperform experimental calculations directly from their home computers using regular browsers.Furthermore, the availability of the Virtual Soil Mechanics Laboratory on the world wide weballows students from all over the world access to Cooper Union's Virtual Soil MechanicsLaboratory, its manual and procedures.
I. Introduction
Civil Engineering is the oldest form of engineering, dating back to ancient Egypt and thebuilding of the great pyramids. Civil Engineering is comprised of Environmental Engineering,Geotechnical Engineering, Hydraulic Engineering, Structural Engineering, TransportationEngineering and many others, such as Geoenvironmental Engineering. The fundamental courseupon which the Geotechnical Engineering field is founded is Soil Mechanics, which is the namegiven to the scientific approach to understanding soil action.
Soil Mechanics may be defined as the study of the engineering behavior of soils, with referenceto the design of civil engineering structures made from or in the earth. Its introduction into theUnited States is generally accredited to Dr. Karl Terzaghi and is considered to have occurred in1925.
At the Cooper Union for the Advancement of Science and Art – Albert Nerken School ofEngineering, Soil Mechanics is a required course for all students majoring in Civil Engineering.It is offered in the spring semester of junior year and is a 4.5 credit course, comprised of threehours of lecture and three hours of laboratory per week. The laboratory has always been anintegral part of the course, where the students perform experiments determining the indexing andstrength properties of soil. A total of eleven experiments are performed:
Experiment #1 – Sample PreparationExperiment #2 – Specific Gravity DeterminationExperiment #3 – Grain Size Distribution AnalysisExperiment #4 – Liquid and Plastic Limits of SoilExperiment #5 – Compaction
2
Experiment #6 – Constant Head Permeability TestExperiment #7 – Variable Head Permeability TestExperiment #8 – Direct Shear Test on Cohesionless SoilExperiment #9 – ConsolidationExperiment #10 – Unconfined Compression TestExperiment #11 – Triaxial Compression Test on Cohesionless Soil
The first five experiments are performed on one soil, usually a glacial till, with the studentsworking in groups of three to four. The soil is analyzed for its suitability as a subgrade soil in aflexible pavement. From this analysis each group of students must design a flexible pavementutilizing an asphalt wearing surface, base course and sub-base course for a given traffic loading.The inclusion of geotextiles and/or geogrids is a requirement of the design. The remaining sixexperiments are performed as an entire class with individual laboratory reports required for eachexperiment. In total, the laboratory accounts for one-third of the grade for each student.
Prior to the spring of 1998 the only means of preparation for the Soil Mechanics Laboratory wasa laboratory manual developed in-house. This manual was distributed to each student at the startof the semester and contained the laboratory procedures and data sheets necessary forexperiments 1 to 5. Experiments 6 to 11 had data sheets but no formal laboratory procedurewritten down. The data for all eleven experiments was processed by using a DOS-based "C"program which one would hardly describe as "user-friendly".
In the 1996-1997 academic year a project was funded at the Cooper Union by the NSF/GatewayCoalition for the development of a Virtual Soil Mechanics Laboratory. This funding wascontinued in the 1997-98 and 1998-99 academic years, and was the impetus for the developmentof additional formal laboratory procedures for experiments 6 to 11, where none had previouslyexisted.
II. The Virtual Soil Mechanics Laboratory
The Virtual Soil Mechanics Laboratory is a fully functional website that has been used since theSpring of 1998 for instruction with the undergraduate Soil Mechanics course at the CooperUnion. The website address is http://www.cooper.edu/vsoil. It is accessible from any browserboth inside and outside the Cooper Union.
Educators are constantly seeking new and improved methods of preparing and presenting theircoursework to students; methods which distill the key information and reduce the potential forconfusion; or which allow for independent study. The use of the world wide web hasincreasingly become significant in this effort, offering a unique and always-visible approach toproviding the coursework for any class, from a simple training course to a full-scale degreeprogram. However, while the web has been available for a number of years, it has only been inthe last couple of years that major advancements in computers and web programming haveenabled this medium to become a robustly-equipped teaching tool.
The marriage of course material with the web can highly impact the educational experiencestudents receive. Using the Soil Mechanics course, the objective of the Gateway-funded projectentitled Virtual Soils Mechanics Laboratory was to create an interactive environment that wasboth stimulating and educational, using the latest in web-based technology.
3
Traditionally, the laboratory information was dispensed through a paper-based manualcontaining only text. The students were required to prepare for each experiment prior to thescheduled laboratory session by reading the procedures associated with the respectiveexperiment. Ideally, it would be most beneficial for the students to witness a live demonstrationof each experiment before conducting it themselves. Due to the limited number of hoursallocated per session and the number of students in each class, this becomes an impossible taskto accomplish. Yet it is important, because it provides students with the knowledge to safelyperform the experiments with understanding and efficiency. The visual incorporation of text andimages on the web can allow for this.
Upon completion of each experiment, the data obtained was then processed. Prior to thedevelopment of the website, our students were familiarized with the steps involved in processingthe data. Due to the complex and repetitive nature of the associated calculations, a computerprogram had been written to reduce the processing time and effort. It was an archaic (by today'sstandards) DOS-based "C" program. The Virtual Soil Mechanics Laboratory provides thenecessary references as part of the design, and allows for instantaneous answers in the lab, inmany cases during the experiment. Thus, should an error be detected through a flaw in theresults, the students often have time to address this issue during the same lab period, savingmuch time and effort later.
The characteristics of the course make it a prime candidate from which to create interactiveeducational web content. The use of the web allows for the complex nature of the informationassociated with the laboratory experiments to be presented and manipulated in numerous waysunavailable in the traditional practice. The static text manual can be replaced with interactivemultimedia elements using hypertext links, pictures, videos, and animation. The students willview the enriched experimental procedures on line prior to actually performing the experimentsin the laboratory, and are therefore being much more informed on – and aware of – what is to bedone in the laboratory and what results to expect. With web-based demonstrations, students canobtain the needed experimental skills without setting foot into the laboratory prior to theexperiments.
The DOS-based software package used in the calculations can be converted into a graphicalinterface (GUI) common to the Windows and web environments. This allows the students tovisually digest and better understand the procedures of the calculations as they are beingperformed.
The web also provides the students with the opportunity to study the experiments at their ownpace and from virtually any computer, within or outside of Cooper Union. They are providedwith a flexible and relaxed interactive learning experience.
The Virtual Soil Mechanics Laboratory has transferred all of the reference material andcomputational capability to the web, while also including significant improvements in thepresentation and clarity of the material. By including photographs of the laboratory equipmentused for each experiment with each procedure, students are able to see what will be required, andthey become familiar with what each piece looks like prior to entering the laboratory. Videoclips of the instructor's description of the procedures (for the more involved experiments) allowstudents to see the actual setup of the experiments in the lab by students. The human brainremembers information according to how it is recorded, and visual impact is much more
4
desirable, because it may be recalled as the actual steps taken, rather than as future steps to take.
Also, a Virtual Tour of the physical laboratory has been incorporated, which shows theplacement of major equipment and supplies. Thus, the traditional need to familiarize the classwith the laboratory environment prior to the start of experimentation has been reducedsignificantly, since the class may now tour the lab and view the equipment at their leisure prior tothe class period. This advanced preparation also allows most basic questions about the lab to beanswered ahead of time, and gives the students opportunity to prepare pointed questions for theinstructor in advance, to be answered more quickly and prior to – rather than during – theexperiment.
III. Creation of the Web Page
In designing the Virtual Soil Mechanics Laboratory, many issues were considered, includingthose mentioned above, as well as: ease of use/user interface, potential internet connectionspeeds (from off-campus sites), color scheme, interpretability and compatibility with otherprograms/browsers, and the ability to save data for future reference. These issues reflectimportant concerns in the web page design. While, for example, the pages are primarilyaccessed from the Cooper Union Computer Center or from the laboratory, part of the purpose ofthis project was to allow access from other facilities and locations. A major concern in thisregard is the speed of the remote user's interface, especially if they are accessing the pages fromhome. As such, we decided that the pages must not have large-sized files, to reduce downloadtimes. Compatibility with other programs and browsers was also key, as there are severalcompeting browser technologies currently in use. The browser with the features most useful forthis project, however, was determined to be Netscape Navigator 4.02, and all the pages wereprimarily written for this platform.
The documentation for experiments 1 to 11 was prepared as an on-line interactive manual. Thegeneral format consists of the objectives, references, apparatus, procedures, and calculationsrelated to each particular experiment. They were prepared in a graphical user-friendlyenvironment. The use of hyperlinked pictures and video clips were incorporated into the text,allowing students to familiarize themselves with the apparatus they would be using and theprocedures they would be performing, prior to entering the laboratory.
The procedure for creating these pages and applets was as follows:
1. The original text of the laboratory procedure was obtained. Since experiments 6 through 11were not part of the original paper-based manual, these procedures were taken from theinstructor's notes.
2. The information on references used to create the procedures was verified and updated, ifnecessary.
3. The materials and equipment to be used in the lab were itemized and verified, and photographsof the same were taken using a Kodak DCS-120 digital camera.
4. Video clips of different parts of the experiments were shot using an 8mm Sony camcorder.
5. Using Microsoft FrontPage 98, the text of the procedure was entered from the notes, and links
5
were created from the equipment lists to the images of the materials and equipment used. Anycalculations associated with the experiments were itemized here as well.
6. In order for a computer to recognize any multimedia file, the file must be of a digital type.Using Media-100 hardware and software, the analog videos were converted to digital format.Once on the computer and in digital form, the videos were exported to Quicktime format.
7. Audio wave files were recorded using an ordinary in-line computer microphone and theWindows Sound Recorder software. Smooth integration of the sound tracks into the video trackswere done using the Quicktime 4.0 Pro utility. The combined video and audio movie clips werefinally compressed and streamed for fluid internet playback.
8. The integration of the videos into the appropriate sections of the on-line experimentalprocedures was achieved using html code and Java Scripting. An animated gif button was usedto link the existing web page with the video clips.
9. The data sheets for the experiments were coded using JavaScript and were placed in the htmlcoding of the applicable page. These data sheets are self-calculating and contain save and exportfunctions. The save function enables the students to save and retrieve their data and results, andthe export function allows the students to transfer data and results from the web page to aspreadsheet.
10. The pages were then tested for compatibility and correct operation on an IBM Thinkpad 770and on Pentium 133-based personal computers using Netscape Navigator, versions 3.0 and 4.01,and Microsoft Internet Explorer, versions 3.0 and 4.0. Any issues that arose during this testingwere then posted on the website, and were checked over the internet via an ISP account forfunctionality. The pages have been thoroughly checked for accuracy, and have been "field-tested" in the laboratory during the actual experiments, yielding qualitative and quantitative dataabout the effects of using this method.
In addition to the basic issues of how to program the features, the user interface and site colorplan were a major issue in the design of web pages. Both the colors and the layout of web pagesinfluence the users' experience with the page. A site may be fully comprehensive, but mayhinder the user so greatly that it provides little of the desired information. It is the primaryfunction of the Virtual Soil pages to provide information effectively and efficiently to the user,so the pages must be both technically convenient and enjoyable to look at while functionallycomplete. Several different layouts and color schemes were suggested for the pages, to improvereadability and ease of navigation.
Light text on black background was selected to lessen the strain on the readers' eyes. Dark texton a light background, when viewed on a computer screen, may appear to be more intense, andcan cause excessive stress for the reader. The darker background has a relaxing effect on theeyes, while not causing drowsiness, and the new styling of the text (using a Helvetica instead ofa Courier font) allows for a better style of text to read, thus enhancing the transfer of data to theuser. In addition, a splash page was included. It is essentially an index, and is the first pagevisitors see when accessing the site. The splash page uses an elevator theme, suggesting that thesite will raise the user's experience in Soil Mechanics. The splash page also offers a clean andclear map to the pages within, containing all the choices within the limits of the first page, andconnecting the user to the desired choices with minimal effort.
6
Following the splash page is a page containing a Photovista Panoramic view of the square withinThe Cooper Union Campus. This page may be obtained from either direct addressing or fromthe splash page. Here, users may obtain a better feel for what the site is intended to do, and mayreceive background on the Soil Mechanics class. Here also the user is introduced to thenavigation bar, which allows access to any other major index page from any page in the site,without the need to hit the back button or to retrace one's steps through a myriad of menus andsub-links. With one click, the user may go directly to the main lab manual index, or the maindata sheet index, back to the introduction pages, to the virtual tour of the soil mechanicslaboratory, or to the links page.
A virtual tour of the Soil Mechanics laboratory is the third page of the website. Users can tourthe Cooper Union Soil Mechanics Laboratory from the comfort of any computer with access tothe web. This allows a familiarization previously unavailable to the user, since no photos of thelaboratory were included in the paper-based manual, and access to the lab is generally notpermitted prior to the class sessions. Users can locate supplies in the room, view key pieces ofequipment, and just look around at the facility to become familiar with it, thereby reducing, if noteliminating, the need for a potentially lengthy introductory session by the instructor. The labmanual and data sheets follow the virtual tour.
7
IV. Evaluation Plan
As part of the evaluation plan, two practicing engineers were asked by the instructor of thecourse to evaluate the Virtual Soil Mechanics Laboratory website. Both have done extensivecommercial soil mechanics laboratory work. These gentlemen are both managers of SoilMechanics Laboratories, one at the Port Authority of New York and New Jersey, and the other atMueser Rutledge Consulting Engineers, a consulting firm specializing in foundation engineering.Their comments can be found below.
Overall, we found the Virtual Soils Laboratory to be an upgrade from the traditionalmethods of teaching laboratory soils testing, which relies principally on textbooks andwritten notes. We cite the following reasons.
1. The Virtual Soil Mechanics Laboratory is an interactive medium with a principaladvantage in allowing the student to blend visual images of the actual test apparatus andequipment with the written test procedures prior to embarking on the performance of thetest in the laboratory.
2. The Virtual Laboratory is an integrated platform allowing students to review testprocedures, apparatus and equipment, reduce test data and visualize and interpret testresults in a single setting. The computerized format enables quick and easy referencebetween the lab manual, test data sheets and test results, eliminating the need to shufflebetween textbook, class notes and test data sheets. The integrated structure saves thestudent time and we believe makes learning laboratory soils testing less tedious and moreenjoyable.
3. The Virtual Tour of the Soils Laboratory allows the students to enter and view the labon his own terms and at his own pace, allowing him to explore the lab and its equipment,something he might not do in the actual physical condition due to time constraints orother limitations. The Virtual Lab is always open and readily accessible.
4. The Virtual Laboratory, with its built in graphical capabilities and ability to export testdata to other software packages, allows quick and easy visualization and interpretation ofthe data.
5. Civil engineering students choosing career paths other than geotechnical engineeringmay be required to specify or interpret soils testing later in their careers. Exposure to theVirtual Laboratory will provide them with an easily accessible and efficient means forrecalling test objectives and procedures.
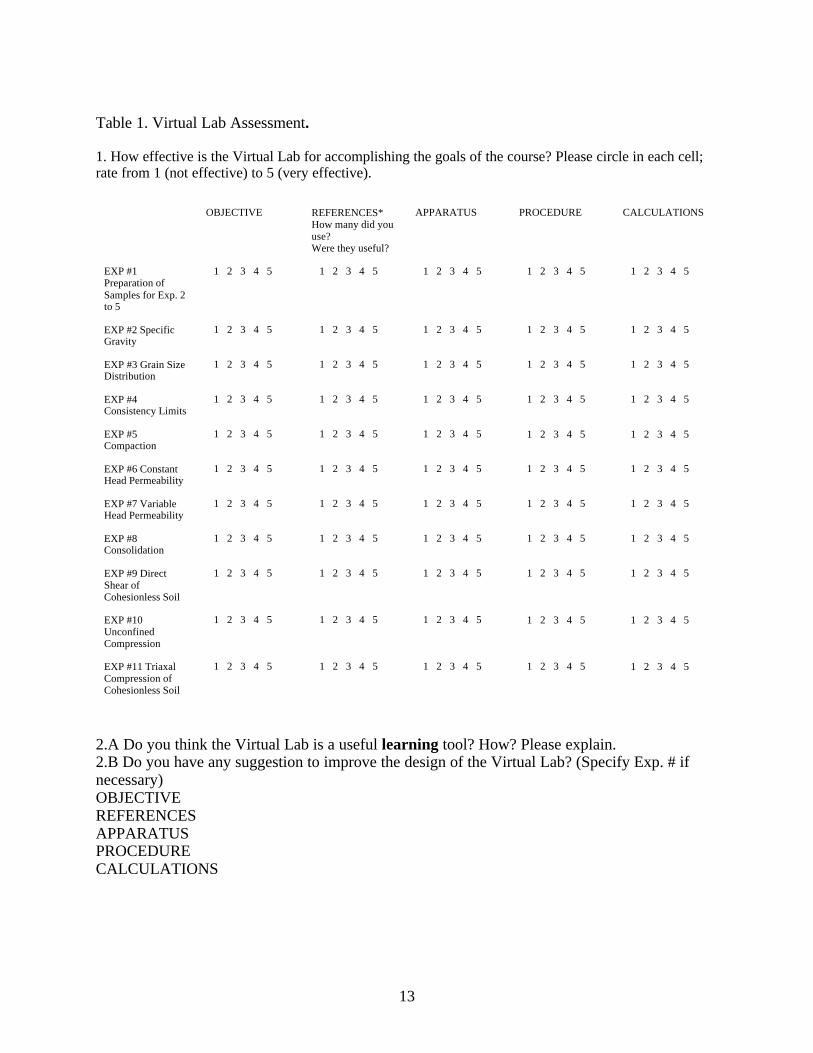
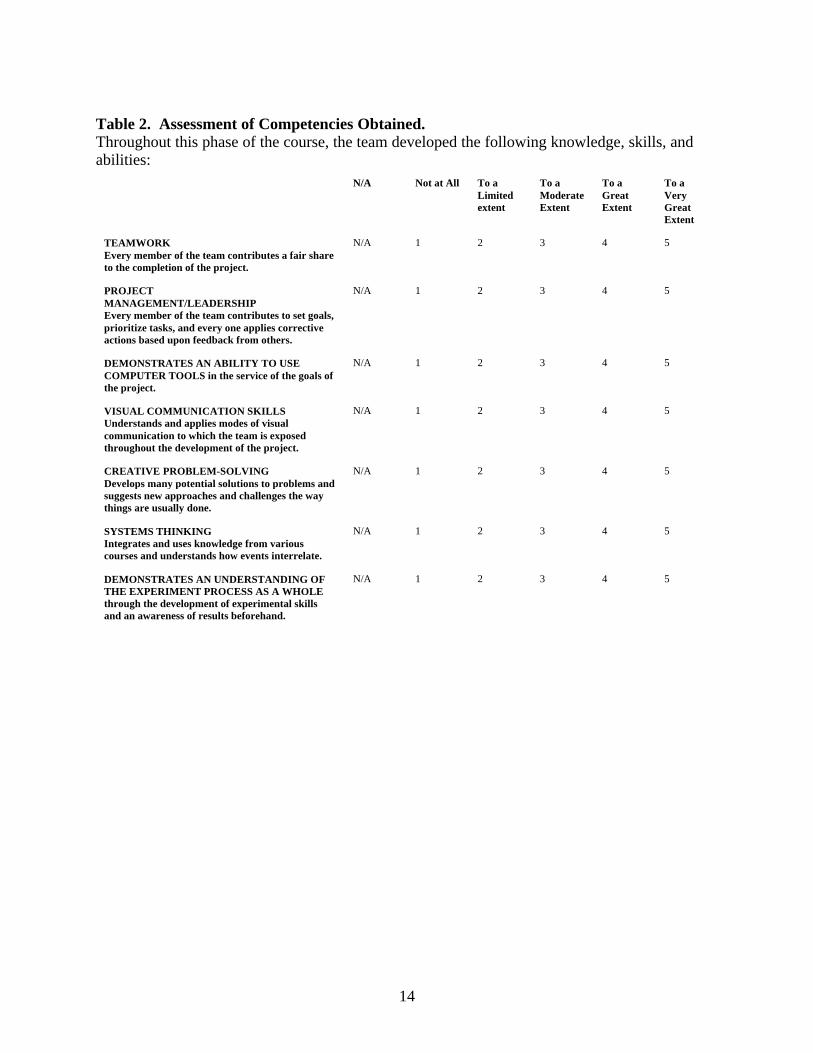
The Virtual Soil Mechanics Laboratory website has been evaluated by the students twice: oncein the Spring of 1998 and again in the Spring of 1999. In Spring 1998, one-half of the SoilMechanics class was to prepare for the Soil Mechanics Laboratory in the conventional way(using a paper-based laboratory manual). The other half of the class would use the Virtual SoilMechanics Laboratory website for its preparation. No interaction between the two groups wasallowed. The Cooper Union Gateway evaluator and the course instructor developed two surveyforms that were filled out by the students in the course. See Tables 1 and 2 for the surveysdeveloped. One form was completed by only those students using the website for labpreparation. The intent of this survey was to develop a preliminary evaluation of the benefits – if
8
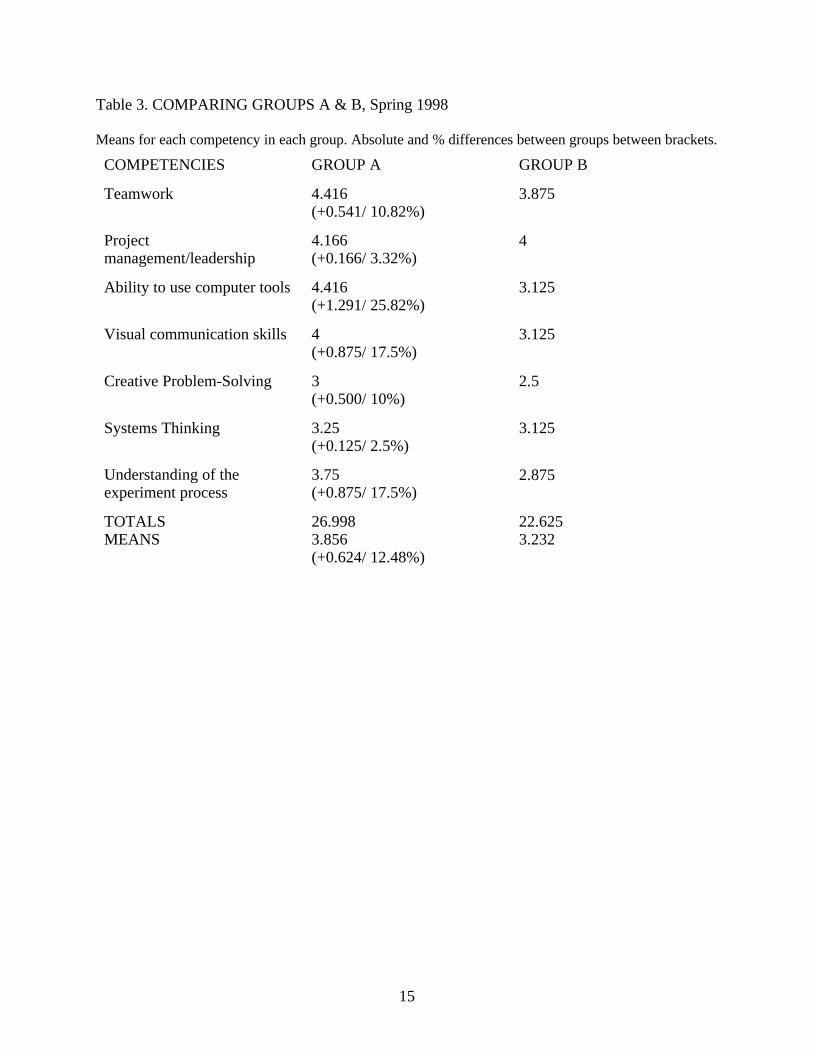
any – of the Virtual Soil Mechanics Laboratory website. The other form was completed by theentire class. The intent of this survey was to evaluate the students' competencies obtained in SoilMechanics. In the spring of 1998, 21 students registered for Soil Mechanics: 12 in Section A,and 9 in Section B. Section A was the group of students arbitrarily chosen to use the website.The result of the surveys and their evaluations by the Gateway Evaluator may be found belowand in Table 3. The following are the Gateway evaluator's comments:
We have strong, consistent evidence to suggest that your Virtual Lab is a good, efficientlearning tool. Students exposed to it (group A) scored higher in all competenciesproposed, and particularly in those competencies which reflect the goals you prioritizedin you course goals for this phase of the course. Students in group A have a self-perception that they have developed the competencies we proposed for assessment(overall, and each of them) in a higher degree than students in group B (0.624 unitshigher, or 12.48% higher). Overall, students in group A scored 3.856 (maximum is 5);and students in group B scored 3.232. These scores mean that students in both groups(but particularly students in group A) have reasonably high self-perception of their skilldevelopment throughout the phase of the course being assessed.
The significant percentage difference between groups regarding USE OF COMPUTERTOOLS (25.82% higher in group A than in B) could be expected: one of the groups (A)heavily used computers -the Virtual Lab website- whereas the other group (B) did not.Leaving this competency aside, the two competencies in which inter-group differencesare broadest are VISUAL COMMUNICATION SKILLS and UNDERSTANDING OFTHE EXPERIMENT PROCESS AS A WHOLE (in both cases, students in group Ascored 17.5% higher than students in group B). This result confirms that two of the maingoals of the Virtual Lab as you designed it are being accomplished, as perceived bystudents.
I also think it is very revealing that the next two competencies -as ordered by percentagedifferences between the two groups- are TEAMWORK (10.82% higher in group A thanin B), and CREATIVE PROBLEM-SOLVING (10% higher in group A than in B).PROJECT MANAGEMENT/LEADERSHIP and SYSTEMS THINKING register smallpercentage differences between groups. In the case of the first one, ProjectManagement/Leadership (3.32% higher in group A), we have both groups with high self-perceptions of accomplishment (over 4 points in a maximum of 5), a very positive resultthat indicates that all of your students feel prepared, particularly after working on the 5experiments, to set goals, prioritize tasks, and apply corrective actions based uponfeedback from others, as the competency was defined.
The interesting thing here is to compare results for this competency with results forTEAMWORK, a competency in which your students in group A feel clearly moreprepared than students in group B after working on the experiments. A straightconclusion to be drawn from this is that your Virtual Lab incited student teams, and everystudent in each team, to contribute a fair share to the completion of the project. However,we should also consider the actual arrangements of the teams in this particular course toestablish more precisely whether the difference is due to the Lab tasks or to the teams'composition. In any case, both Teamwork and Project Management/Leadership are thetwo competencies registering highest scores in both groups, what makes our concernsabout these skills less urgent perhaps.
9
An analysis of qualitative responses from students exposed to the Virtual Lab can nowgive us a closer, richer picture of their opinions and suggestions.
Your Virtual Lab is highly regarded as being very effective for accomplishing the goalsof the course . Most of the 12 students exposed to it give it a score between 4 and 5 (5being the maximum). They also think that it is a useful learning tool, howeverimprovable (they particularly feel they should be able to save the calculations).
In general, it was felt that those students using the website were better prepared for theSoil Mechanics laboratory, and had a better level of understanding in the course thanthose who did not use the website. However, several glitches were encountered in theself-calculating data sheets. These included faulty operation of the compute and savefunctions as well as the inability to export from the website to a spreadsheet. Overall, thefirst year use of the Virtual Soils Laboratory proved to be a success and deemed theproject a great tool for providing instructions to the students.
In the Spring of 1999, all the students taking Soil Mechanics (20) were to prepare for the SoilMechanics Laboratory using the Virtual Soil Mechanics Laboratory website. The same twosurveys used in the Spring of 1998 were used again in the Spring of 1999, but this time allstudents completed both forms. The result of the surveys and their evaluation by the Gatewayevaluator can be found below:
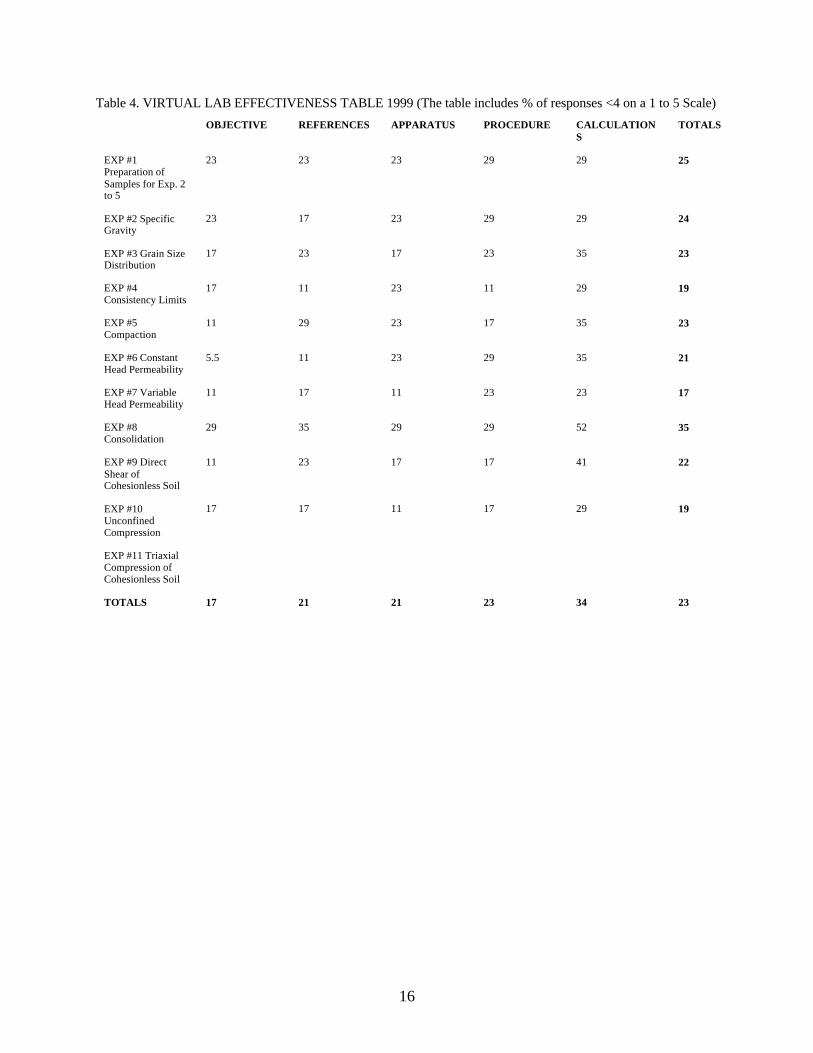
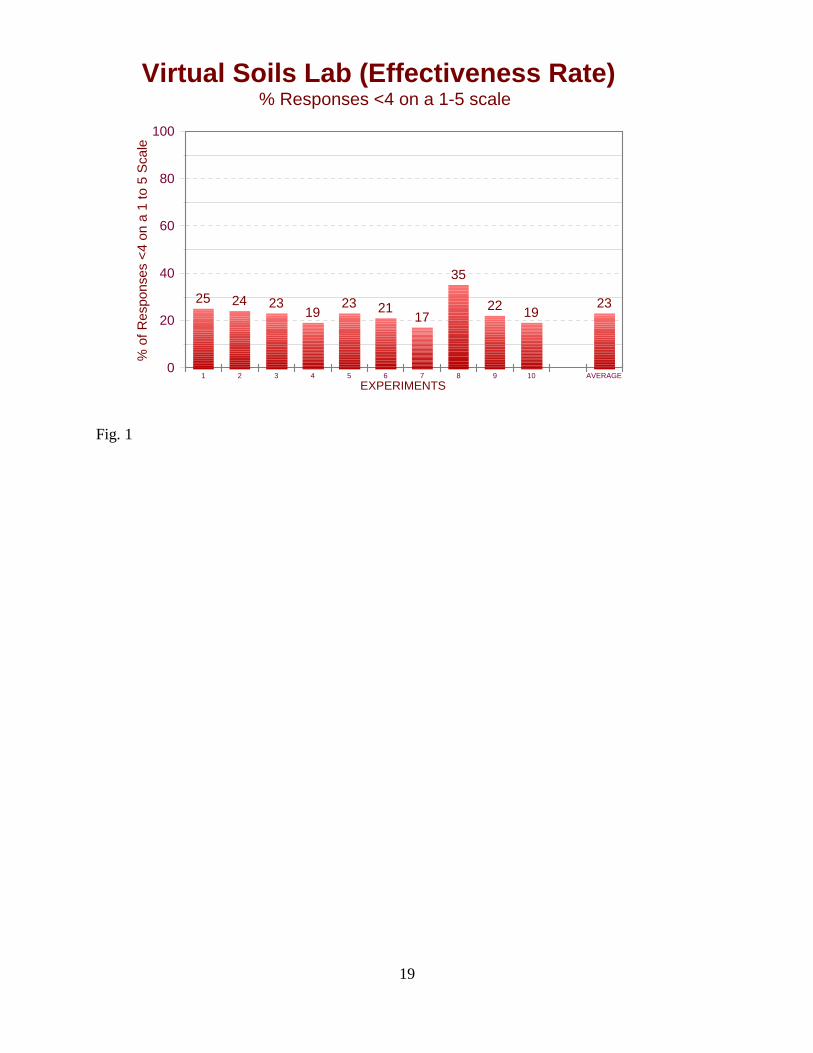
I have analyzed the data on question 1. The results will give you a quantitative picture ofwhat students think of the lab's effectiveness. Overall the lab works very well. There aresome problems that could be overcome with a bit of work. The students' comments toquestions 2a and 2b (which I have not transcribed) are consistent with results to question1. (See Table 4.)
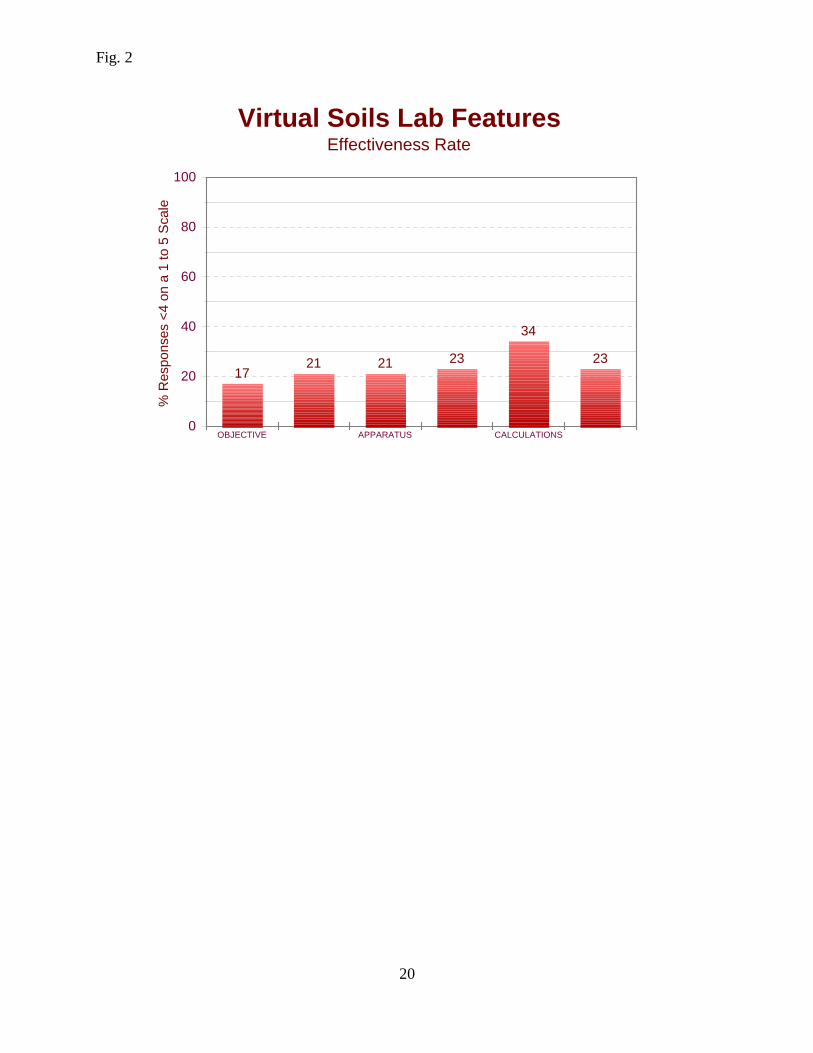
The vast majority of students think that the Virtual Soils Lab is a useful tool. Overall,77% of the responses given by the students who used it were 4 or 5 -on a 1 to 5 scale.This is a great result, and in my view, the minimum acceptable in a school committed toexcellence as Cooper Union is. Reversely, 23% of the responses registered a score lowerthan four. I would like to focus on these. The question is, once we have reached a highlevel of effectiveness with the Virtual Lab, how can we improve on the aspects thatconcern students? Figs. 1 and 2 show % of responses that were lower than 4 or 5 on the 1to 5 scale. The figures do not show success directly, but rather improvable areas. Howcan we lower the % of responses registering scores lower than 4 on a 1 to 5 scale?Are these figures due to the Lab design, to its performance features, or to organizationalaspects and dynamics of the course? These are considerations to be kept in mind for nextyear.
The "Effectiveness Rate" that I have used as indicator for analyzing results to question 1is 23 for overall results. It means that 23% of the responses registered a score lower than4. It can be read as an indication of problems experienced by students in using the VirtualLab.
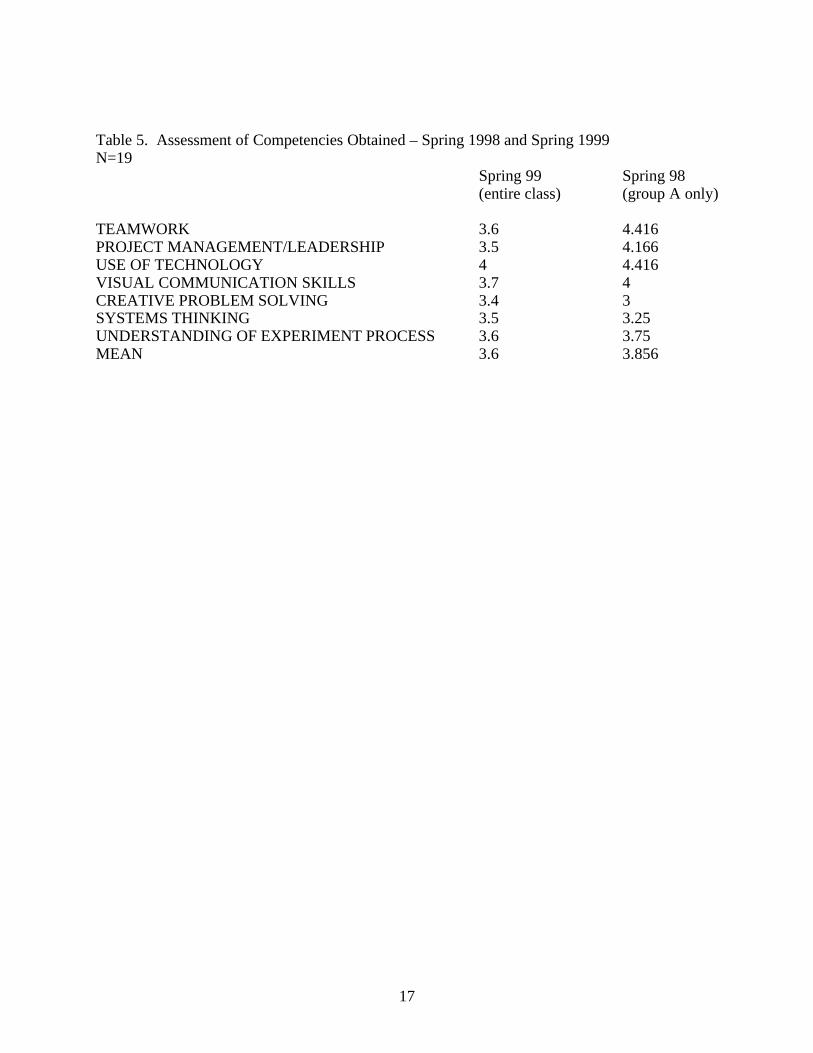
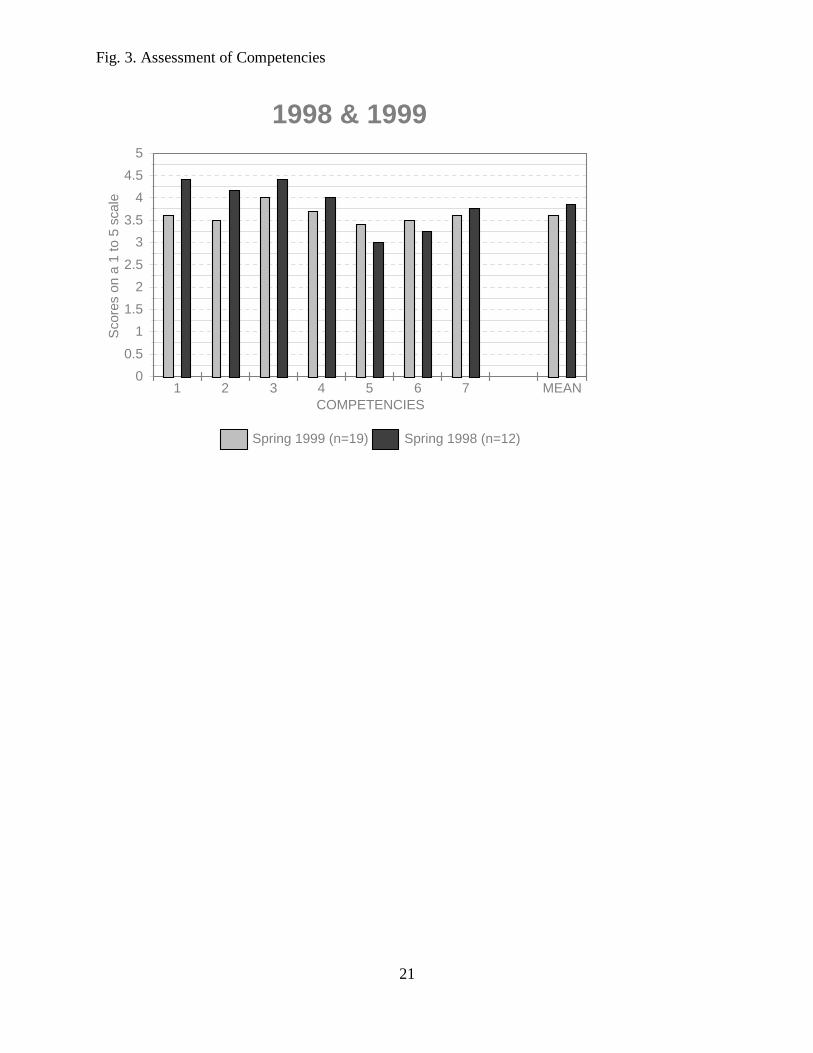
An assessment of the students' competencies for 1999 and their comparison to 1998 can be foundin Table 5 and Fig. 3. The mean score of the seven competencies surveyed decreased only 0.256
10
from 3.856 to 3.6 from Spring 1998 to Spring 1999. This is essentially a status quo condition.
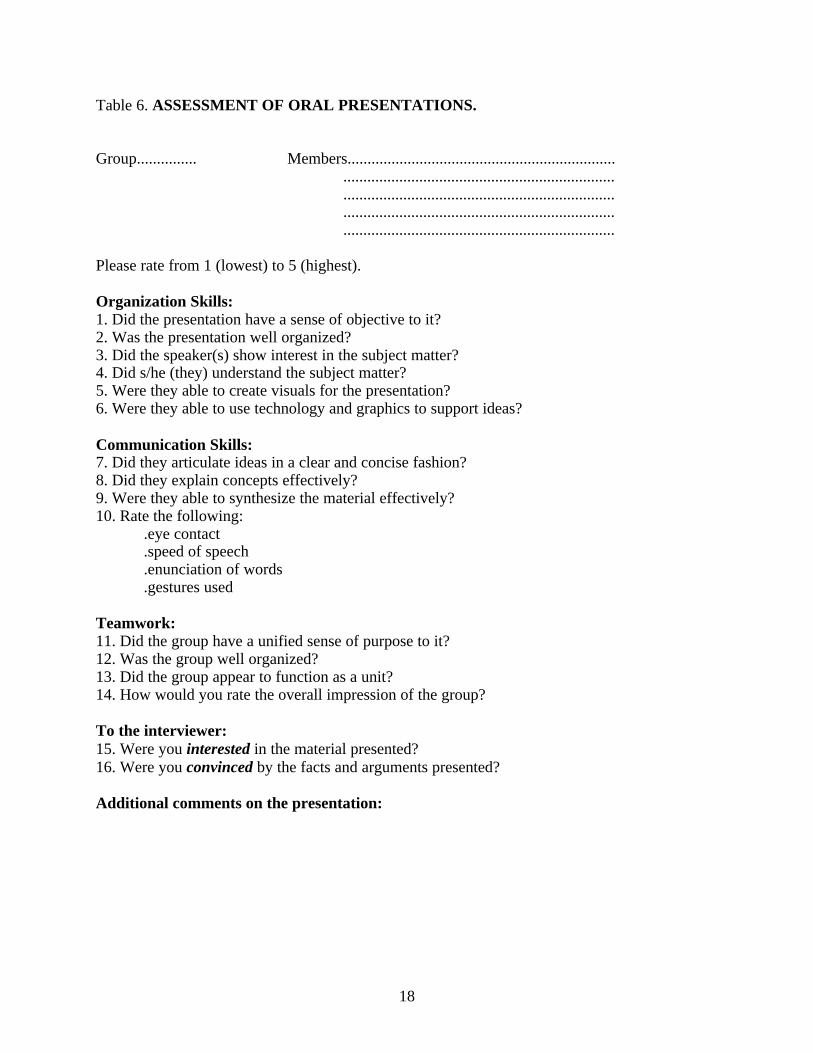
As part of the continuing evaluation process for the Soil Mechanics course, the instructor inviteda prominent practitioner in the geotechnical engineering field - a partner at Mueser RutledgeConsulting Engineers, to help evaluate the oral presentations made by the class on their flexiblepavement design. This was done both in the Spring of 1998 and the Spring of 1999. TheGateway evaluator and the instructor devised an assessment sheet for the oral presentations (seeTable 6). The invited guest was very impressed with the caliber of these presentations, and hiscomments can be found below:
Spring 1998:
I was very pleased to participate in evaluating the presentations of your laboratorystudents. During the course of Monday afternoon's program, I listened topresentations by seven groups of three students each. Their names are on theattached sheet. The problem which each group had been given was to evaluatesoil conditions and to design a flexible pavement for a particular site. Each groupdescribed the problem, described the laboratory tests which they performed, andthen described the design process which they went through to determine thepavement thickness, evaluate costs and develop an economical design. I was veryimpressed with the technical content of the presentations, the comprehensivesummaries of data, the design process which each group was able to describe, theinteresting and clear use of visual aids and the excellent verbal presentation. Eachof the 21 participating students spoke clearly, concisely and with a confidencethat illustrated their underlying knowledge of the material being presented.
I applaud you for the concept of taking soil mechanics laboratory tests andmaking them meaningful by requiring the students to develop a design based onthe results of their tests. In so doing, each of these students has developed anunderstanding of basic concepts of soil behavior, moisture- density relationshipsand the implications of that information on pavement design. That knowledgewill serve them well in their future careers. They will remember these tests andtheir applications to design are better than if they had just done testing out ofcontext.
I encourage you to continue this concept in future years and would be happy toparticipate in a similar session again.
Spring 1999:
On Monday, May 3, I attended the project presentations by your students inpartial completion of the requirements of the referenced course. Six teams,varying from 3 to 4 students, made presentations. Group identifications and teammember names are on the attached sheet.
Each team described a sample of soil which they were given at the start of thecourse. They tested the soil in the school's laboratory to determine subgradeproperties. They performed Atterberg limits, specific gravities, gradation withsieve and hydrometer, proctor compaction tests and CBR tests. From those data,
11
they designed a pavement section, selected geogrid reinforcement, and preparedcomparative cost estimates for a section of highway.
I was impressed by the thoroughness of the work performed by the teams. Eachteam was able to present soil data and describe its significance, and then use thatdata to develop plausible pavement designs. They used computer-generatedgraphics to present their projects to the audience, and in every case, did a crediblejob of explaining the project and documenting their conclusions. This course hasprovided your students with an appreciation for the engineering process from datagathering, through testing design and presentation. This experience will bevaluable for the students in their working careers, because they understand thatthe engineer's final product is an economical, buildable design.
I encourage you to continue this concept in future years and would be happy toparticipate in a similar session again.
V. Conclusions
It is the opinion of the Department of Civil Engineering at the Cooper Union that the Virtual SoilMechanics Laboratory website is an unequivocal success. It will become a permanent part of theSoil Mechanics course and the only means of preparation for the lab and data evaluation. Othercourses with labs are also considering the development of virtual laboratory websites. Thesecourses are: Environmental Systems Engineering, Hydraulic Engineering, and StructuralEngineering I.
12
VI. Acknowledgments
The author would like to thank the NSF/Gateway Coalition for the funding provided for thisproject, without which it would have been very difficult to have started; and Mr. Gerardo delCerro, the Gateway Evaluator at the Cooper Union, for his help in developing and assessing thesurveys given to the students. In addition, the author would like to thank two graduate students:Messrs. Roni Benjamini and Frank Krupicka, and two undergraduate students: Messrs. EranDekel and Aleksandr Krutovskiy, who worked very diligently on this project from start to finish.
13
Table 1. Virtual Lab Assessment.
1. How effective is the Virtual Lab for accomplishing the goals of the course? Please circle in each cell;rate from 1 (not effective) to 5 (very effective).
OBJECTIVE REFERENCES*How many did youuse?Were they useful?
APPARATUS PROCEDURE CALCULATIONS
EXP #1Preparation ofSamples for Exp. 2to 5
1 2 3 4 5 1 2 3 4 5 1 2 3 4 5 1 2 3 4 5 1 2 3 4 5
EXP #2 SpecificGravity
1 2 3 4 5 1 2 3 4 5 1 2 3 4 5 1 2 3 4 5 1 2 3 4 5
EXP #3 Grain SizeDistribution
1 2 3 4 5 1 2 3 4 5 1 2 3 4 5 1 2 3 4 5 1 2 3 4 5
EXP #4Consistency Limits
1 2 3 4 5 1 2 3 4 5 1 2 3 4 5 1 2 3 4 5 1 2 3 4 5
EXP #5Compaction
1 2 3 4 5 1 2 3 4 5 1 2 3 4 5 1 2 3 4 5 1 2 3 4 5
EXP #6 ConstantHead Permeability
1 2 3 4 5 1 2 3 4 5 1 2 3 4 5 1 2 3 4 5 1 2 3 4 5
EXP #7 VariableHead Permeability
1 2 3 4 5 1 2 3 4 5 1 2 3 4 5 1 2 3 4 5 1 2 3 4 5
EXP #8Consolidation
1 2 3 4 5 1 2 3 4 5 1 2 3 4 5 1 2 3 4 5 1 2 3 4 5
EXP #9 DirectShear ofCohesionless Soil
1 2 3 4 5 1 2 3 4 5 1 2 3 4 5 1 2 3 4 5 1 2 3 4 5
EXP #10UnconfinedCompression
1 2 3 4 5 1 2 3 4 5 1 2 3 4 5 1 2 3 4 5 1 2 3 4 5
EXP #11 TriaxalCompression ofCohesionless Soil
1 2 3 4 5 1 2 3 4 5 1 2 3 4 5 1 2 3 4 5 1 2 3 4 5
2.A Do you think the Virtual Lab is a useful learning tool? How? Please explain.2.B Do you have any suggestion to improve the design of the Virtual Lab? (Specify Exp. # ifnecessary)OBJECTIVEREFERENCESAPPARATUSPROCEDURECALCULATIONS
14
Table 2. Assessment of Competencies Obtained.Throughout this phase of the course, the team developed the following knowledge, skills, andabilities:
N/A Not at All To aLimitedextent
To aModerateExtent
To aGreatExtent
To aVeryGreatExtent
TEAMWORKEvery member of the team contributes a fair shareto the completion of the project.
N/A 1 2 3 4 5
PROJECTMANAGEMENT/LEADERSHIPEvery member of the team contributes to set goals,prioritize tasks, and every one applies correctiveactions based upon feedback from others.
N/A 1 2 3 4 5
DEMONSTRATES AN ABILITY TO USECOMPUTER TOOLS in the service of the goals ofthe project.
N/A 1 2 3 4 5
VISUAL COMMUNICATION SKILLSUnderstands and applies modes of visualcommunication to which the team is exposedthroughout the development of the project.
N/A 1 2 3 4 5
CREATIVE PROBLEM-SOLVINGDevelops many potential solutions to problems andsuggests new approaches and challenges the waythings are usually done.
N/A 1 2 3 4 5
SYSTEMS THINKINGIntegrates and uses knowledge from variouscourses and understands how events interrelate.
N/A 1 2 3 4 5
DEMONSTRATES AN UNDERSTANDING OFTHE EXPERIMENT PROCESS AS A WHOLEthrough the development of experimental skillsand an awareness of results beforehand.
N/A 1 2 3 4 5
15
Table 3. COMPARING GROUPS A & B, Spring 1998
Means for each competency in each group. Absolute and % differences between groups between brackets.
COMPETENCIES GROUP A GROUP B
Teamwork 4.416(+0.541/ 10.82%)
3.875
Projectmanagement/leadership
4.166(+0.166/ 3.32%)
4
Ability to use computer tools 4.416(+1.291/ 25.82%)
3.125
Visual communication skills 4(+0.875/ 17.5%)
3.125
Creative Problem-Solving 3(+0.500/ 10%)
2.5
Systems Thinking 3.25(+0.125/ 2.5%)
3.125
Understanding of theexperiment process
3.75(+0.875/ 17.5%)
2.875
TOTALSMEANS
26.9983.856(+0.624/ 12.48%)
22.6253.232
16
Table 4. VIRTUAL LAB EFFECTIVENESS TABLE 1999 (The table includes % of responses <4 on a 1 to 5 Scale)
OBJECTIVE REFERENCES APPARATUS PROCEDURE CALCULATIONS
TOTALS
EXP #1Preparation ofSamples for Exp. 2to 5
23 23 23 29 29 25
EXP #2 SpecificGravity
23 17 23 29 29 24
EXP #3 Grain SizeDistribution
17 23 17 23 35 23
EXP #4Consistency Limits
17 11 23 11 29 19
EXP #5Compaction
11 29 23 17 35 23
EXP #6 ConstantHead Permeability
5.5 11 23 29 35 21
EXP #7 VariableHead Permeability
11 17 11 23 23 17
EXP #8Consolidation
29 35 29 29 52 35
EXP #9 DirectShear ofCohesionless Soil
11 23 17 17 41 22
EXP #10UnconfinedCompression
17 17 11 17 29 19
EXP #11 TriaxialCompression ofCohesionless Soil
TOTALS 17 21 21 23 34 23
17
Table 5. Assessment of Competencies Obtained – Spring 1998 and Spring 1999N=19
Spring 99 Spring 98(entire class) (group A only)
TEAMWORK 3.6 4.416PROJECT MANAGEMENT/LEADERSHIP 3.5 4.166USE OF TECHNOLOGY 4 4.416VISUAL COMMUNICATION SKILLS 3.7 4CREATIVE PROBLEM SOLVING 3.4 3SYSTEMS THINKING 3.5 3.25UNDERSTANDING OF EXPERIMENT PROCESS 3.6 3.75MEAN 3.6 3.856
18
Table 6. ASSESSMENT OF ORAL PRESENTATIONS.
Group............... Members................................................................... .................................................................... .................................................................... .................................................................... ....................................................................
Please rate from 1 (lowest) to 5 (highest).
Organization Skills:1. Did the presentation have a sense of objective to it? 2. Was the presentation well organized? 3. Did the speaker(s) show interest in the subject matter?4. Did s/he (they) understand the subject matter?5. Were they able to create visuals for the presentation?6. Were they able to use technology and graphics to support ideas?
Communication Skills:7. Did they articulate ideas in a clear and concise fashion?8. Did they explain concepts effectively?9. Were they able to synthesize the material effectively?10. Rate the following:
.eye contact
.speed of speech
.enunciation of words
.gestures used
Teamwork:11. Did the group have a unified sense of purpose to it?12. Was the group well organized?13. Did the group appear to function as a unit?14. How would you rate the overall impression of the group?
To the interviewer:15. Were you interested in the material presented?16. Were you convinced by the facts and arguments presented?
Additional comments on the presentation:
19
Fig. 1
0
20
40
60
80
100 %
of R
espo
nses
<4
on a
1 to
5 S
cale
1 2 3 4 5 6 7 8 9 10 AVERAGE
EXPERIMENTS
25 24 2319
23 2117
35
22 1923
Virtual Soils Lab (Effectiveness Rate)% Responses <4 on a 1-5 scale
20
Fig. 2
0
20
40
60
80
100 %
Res
pons
es <
4 on
a 1
to 5
Sca
le
OBJECTIVE APPARATUS CALCULATIONS
1721 21 23
34
23
Virtual Soils Lab FeaturesEffectiveness Rate
21
Fig. 3. Assessment of Competencies
0
0.5
1
1.5
2
2.5
3
3.5
4
4.5
5
Sco
res
on a
1 to
5 s
cale
1 2 3 4 5 6 7 MEANCOMPETENCIES
Spring 1999 (n=19) Spring 1998 (n=12)
1998 & 1999
22
VITO A. GUIDOVito A. Guido is a Professor of Civil Engineering at the Cooper Union for the Advancement ofScience and Art - Albert Nerken School of Engineering. Dr. Guido is a registered ProfessionalEngineer in New York and has done consulting in the geotechnical engineering field for overtwenty five years at several major consulting firms in the New York Metropolitan area. Dr. Guidoreceived his B.S., M.S., and Ph.D. degrees in Civil Engineering from Polytechnic University in1972, 1974, and 1982, respectively.
GERARDO DEL CERROGerardo del Cerro is Director of Assessment at the Cooper Union School of Engineering. He is aPh.D. candidate in Sociology and Planning at the New School for Social Research (New York). Asa research associate, he worked on the design and implementation of higher education reformundertaken by the Spanish government from 1990-2. Since October 1996, he has served as LocalEvaluator for the NSF Gateway Program.

![Craig's Soil Mechanics, Seventh edition - Priodeep's …priodeep.weebly.com/.../6/5/4/9/65495087/craig_s_soil_mechanics_2_.pdf[Soil mechanics] Craig’s soil mechanics / R.F. Craig](https://img.pdfslide.us/doc/110x75/5aa66a337f8b9ab4788e6f0f/craigs-soil-mechanics-seventh-edition-priodeeps-soil-mechanics-craigs.jpg)