Embed Size (px)
Citation preview
1• 00 maand 2001, Naam
• Ondertitel presentatie
The project is funded by the European CommissionThe project is funded by the European Commission’’s s DirectorateDirectorate--General EnvironmentGeneral Environment
11stst Stakeholder EventStakeholder EventFriday 27th March 2009, BrusselsFriday 27th March 2009, Brussels
www.eutransportghg2050.euwww.eutransportghg2050.eu
Session 2 Session 2 -- Review of GHG reduction optionsReview of GHG reduction options
2
Purpose of the review
• element of part I of the project– February – August 2009
• overview of available information on GHG reduction options– results of studies– incl. underlying assumptions on oil price, discount rate, cost reduction
• establish consensus on state-of-the-art insight in readiness, potential and costs of various GHG reduction options
• identification of knowledge gaps• focus on longer term
– move beyond the current debate
• provide quantitative & qualitativequantitative & qualitative inputs for scenario analysis and cost curves in part II– GHG reduction potentials– GHG abatement costs (€/tonne of CO2-equiv. avoided)
3
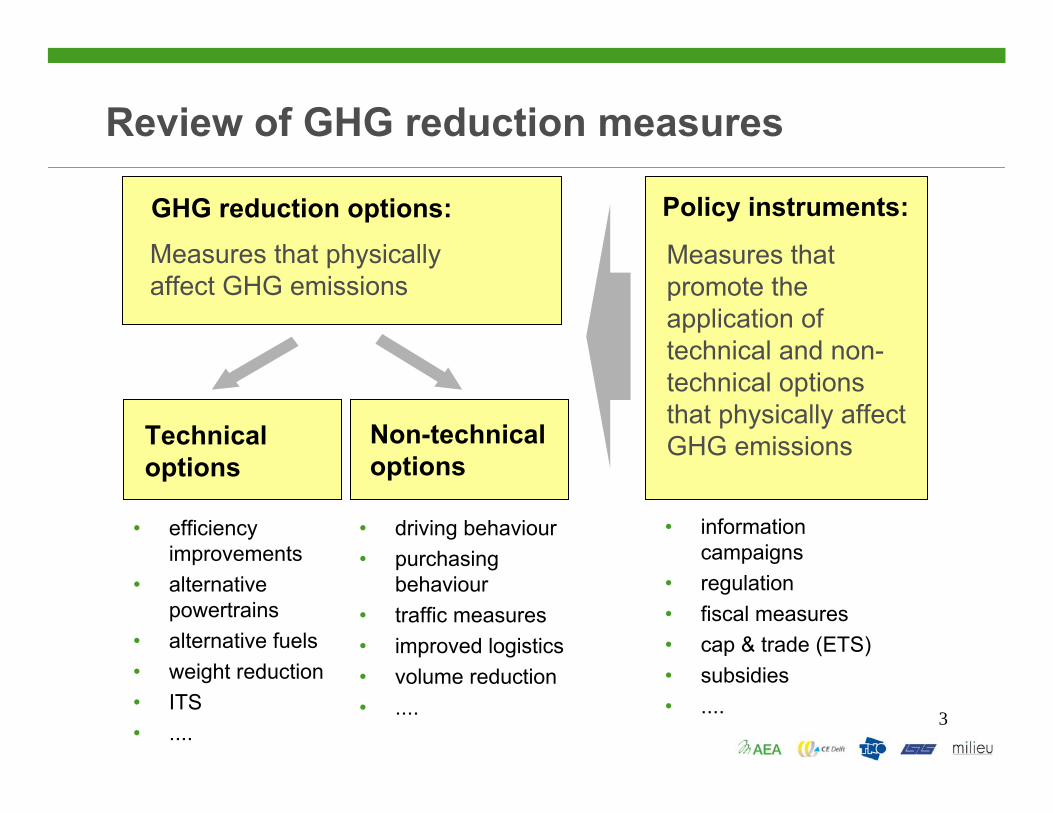
Review of GHG reduction measures
GHG reduction options:Measures that physically affect GHG emissions
Technical options
Policy instruments:
Measures that promote the application of technical and non-technical options that physically affect GHG emissionsNon-technical
options
• efficiency improvements
• alternative powertrains
• alternative fuels• weight reduction• ITS• ....
• driving behaviour• purchasing
behaviour• traffic measures• improved logistics• volume reduction• ....
• information campaigns
• regulation• fiscal measures• cap & trade (ETS)• subsidies• ....
4
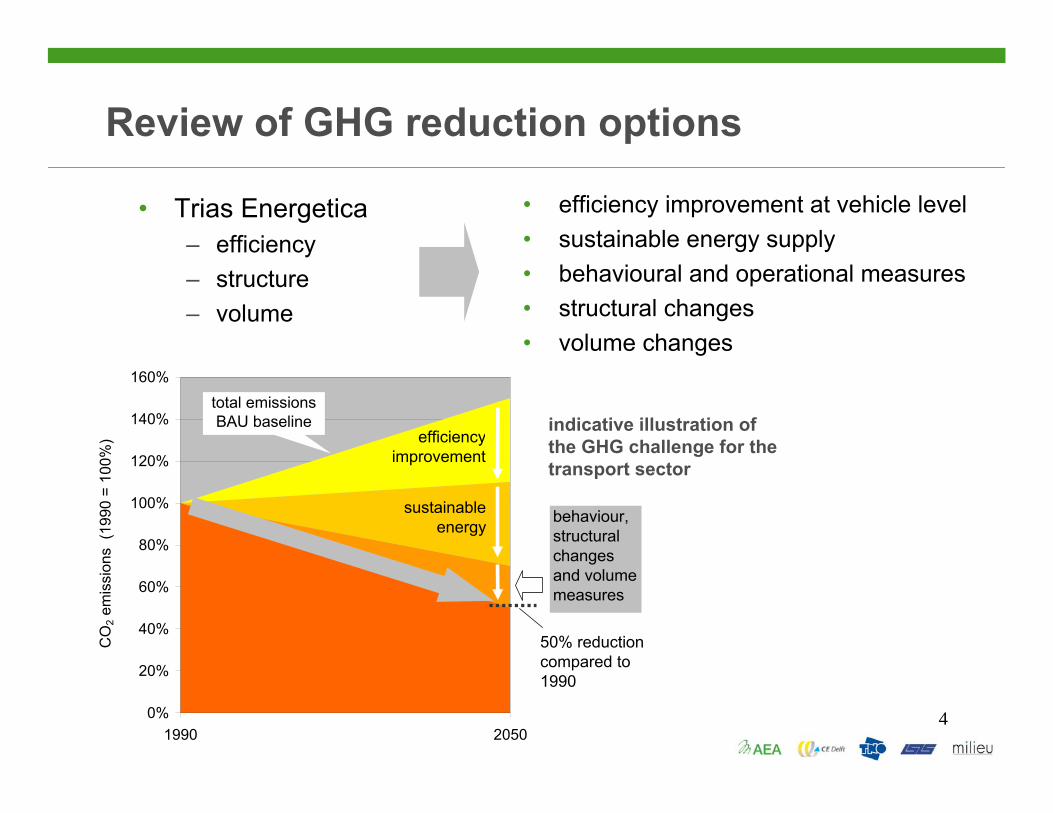
Review of GHG reduction options
• Trias Energetica– efficiency– structure– volume
indicative illustration of the GHG challenge for the transport sector
0%
20%
40%
60%
80%
100%
120%
140%
160%
1990 2050
CO
2 em
issi
ons
(199
0 =
100%
)
total emissions BAU baseline
50% reduction compared to 1990
efficiency improvement
behaviour, structural changesand volume measures
sustainable energy
• efficiency improvement at vehicle level• sustainable energy supply• behavioural and operational measures• structural changes• volume changes
5
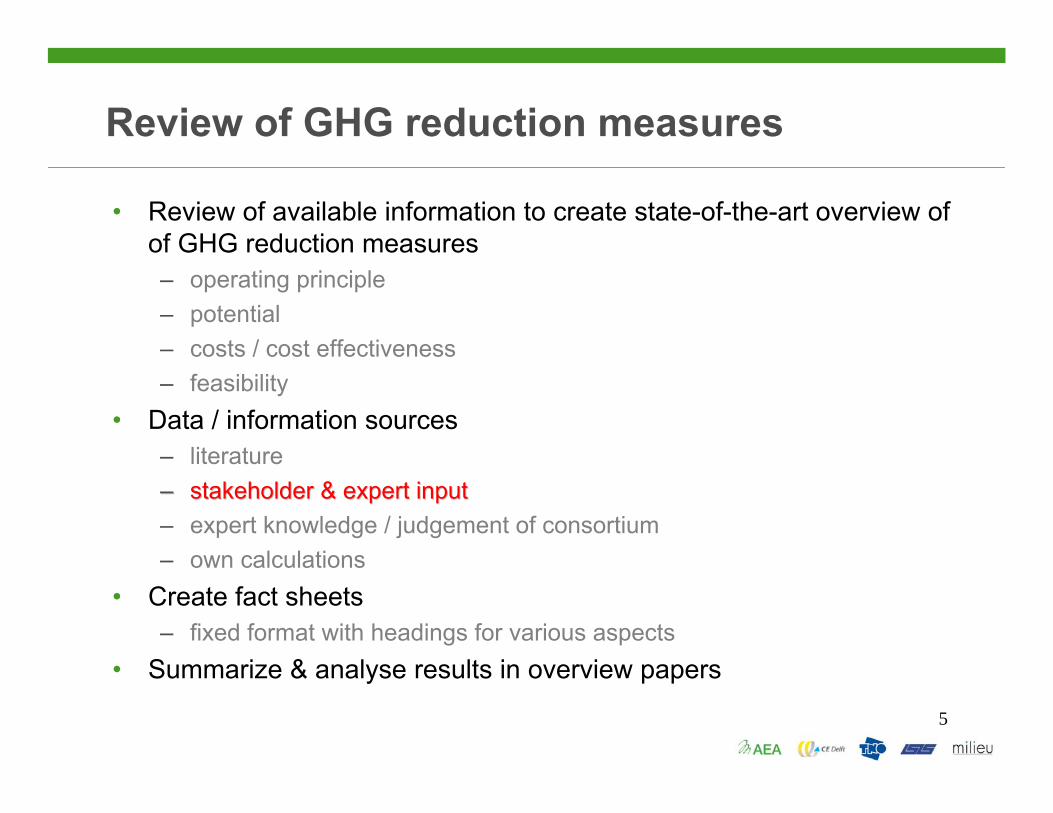
• Review of available information to create state-of-the-art overview of of GHG reduction measures– operating principle– potential– costs / cost effectiveness– feasibility
• Data / information sources– literature–– stakeholder & expert inputstakeholder & expert input– expert knowledge / judgement of consortium– own calculations
• Create fact sheets– fixed format with headings for various aspects
• Summarize & analyse results in overview papers
Review of GHG reduction measures
6
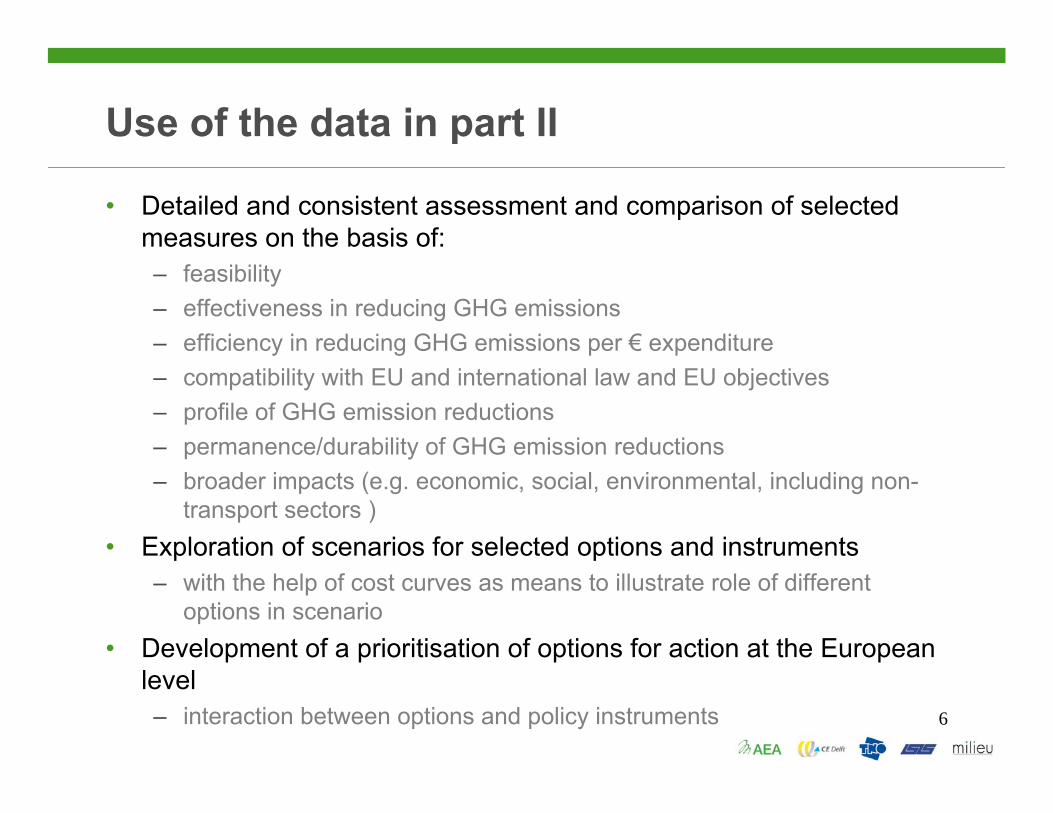
Use of the data in part II
• Detailed and consistent assessment and comparison of selected measures on the basis of: – feasibility– effectiveness in reducing GHG emissions– efficiency in reducing GHG emissions per € expenditure– compatibility with EU and international law and EU objectives– profile of GHG emission reductions– permanence/durability of GHG emission reductions– broader impacts (e.g. economic, social, environmental, including non-
transport sectors )• Exploration of scenarios for selected options and instruments
– with the help of cost curves as means to illustrate role of different options in scenario
• Development of a prioritisation of options for action at the European level– interaction between options and policy instruments
7
Topics
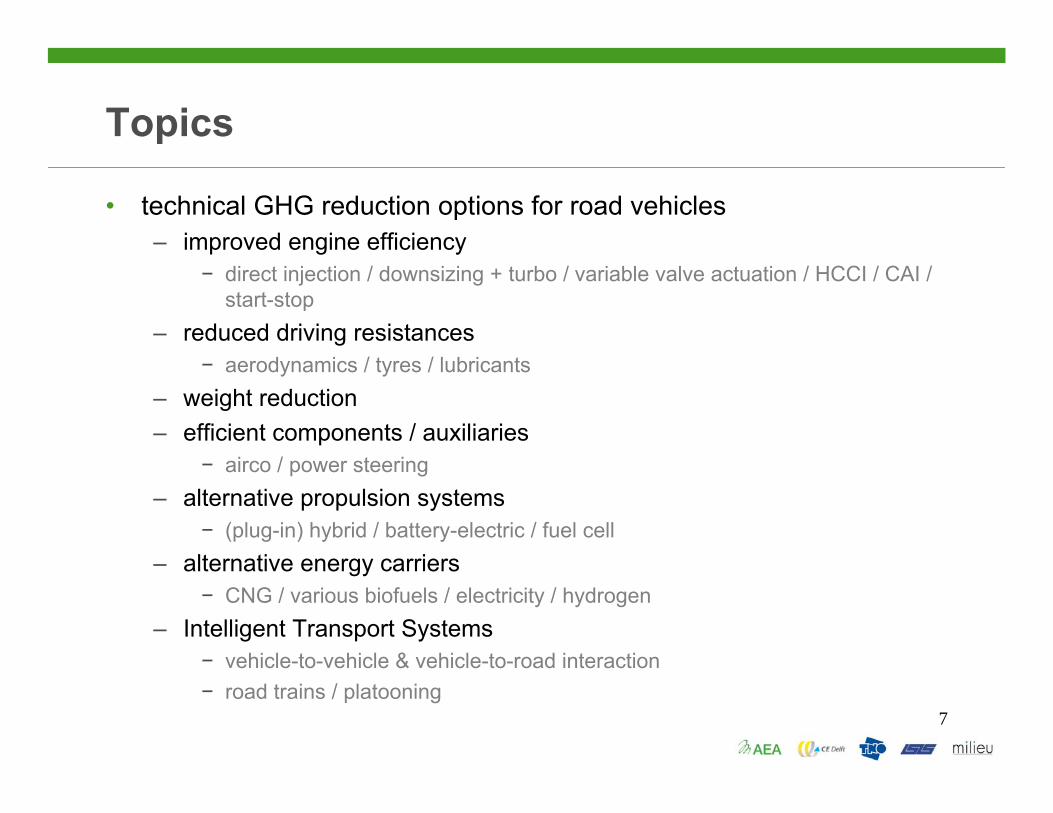
• technical GHG reduction options for road vehicles– improved engine efficiency
− direct injection / downsizing + turbo / variable valve actuation / HCCI / CAI / start-stop
– reduced driving resistances− aerodynamics / tyres / lubricants
– weight reduction– efficient components / auxiliaries
− airco / power steering– alternative propulsion systems
− (plug-in) hybrid / battery-electric / fuel cell– alternative energy carriers
− CNG / various biofuels / electricity / hydrogen– Intelligent Transport Systems
− vehicle-to-vehicle & vehicle-to-road interaction− road trains / platooning
8
Topics
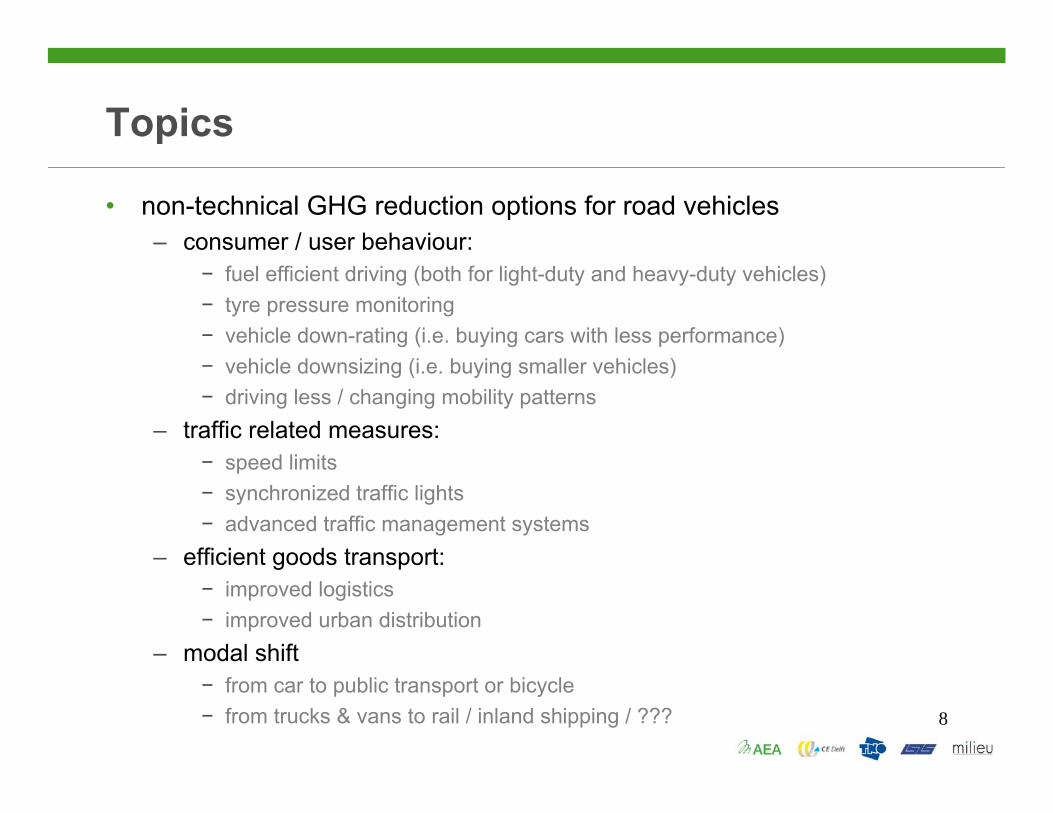
• non-technical GHG reduction options for road vehicles– consumer / user behaviour:
− fuel efficient driving (both for light-duty and heavy-duty vehicles)− tyre pressure monitoring− vehicle down-rating (i.e. buying cars with less performance)− vehicle downsizing (i.e. buying smaller vehicles)− driving less / changing mobility patterns
– traffic related measures:− speed limits− synchronized traffic lights− advanced traffic management systems
– efficient goods transport:− improved logistics− improved urban distribution
– modal shift− from car to public transport or bicycle− from trucks & vans to rail / inland shipping / ???
9
Topics
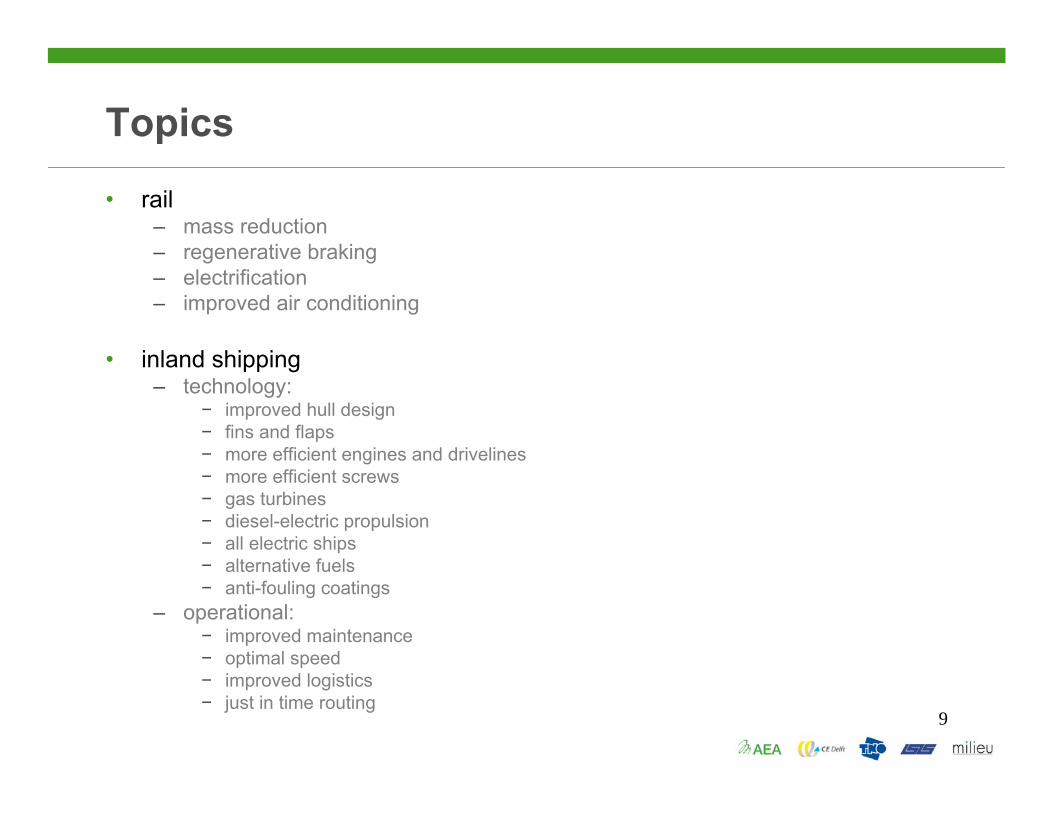
• rail– mass reduction– regenerative braking– electrification– improved air conditioning
• inland shipping– technology:
− improved hull design− fins and flaps− more efficient engines and drivelines− more efficient screws− gas turbines− diesel-electric propulsion− all electric ships− alternative fuels− anti-fouling coatings
– operational:− improved maintenance− optimal speed− improved logistics− just in time routing
10
Topics
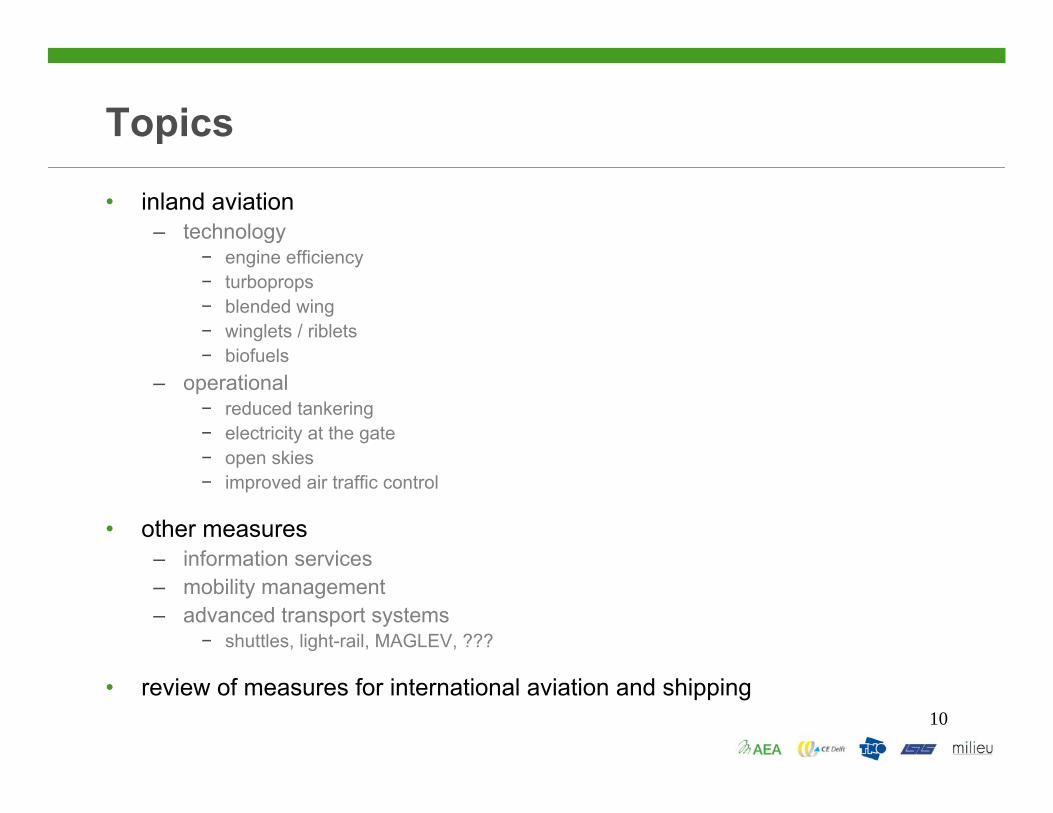
• inland aviation– technology
− engine efficiency− turboprops− blended wing− winglets / riblets− biofuels
– operational− reduced tankering− electricity at the gate− open skies− improved air traffic control
• other measures– information services– mobility management– advanced transport systems
− shuttles, light-rail, MAGLEV, ???
• review of measures for international aviation and shipping
11
Aspects reviewed for GHG reduction optionsStructure of fact sheets (1)
• application area– transport mode / vehicle class
• description• GHG reduction at vehicle level• costs at vehicle level
– additional investment costs– other cost changes, e.g. maintenance
• timeframe for application• potential scale of application• total GHG abatement potential
– Mton/year– determined by many (scenario) assumptions
• abatement costs / cost effectiveness– €/tonCO2-equiv.– determined by many (scenario) assumptions
12
Aspects reviewed for GHG reduction optionsStructure of fact sheets (2)
• co-benefits– air pollutant emissions, noise, safety, congestion, added value to users,
etcetera• infrastructural requirements
– transport infrastructure– energy infrastructure
• barriers for market introduction• policy instruments that might promote application of this GHG
reduction option• interaction with other GHG reduction options
– synergies– double counting– incompatibilities
• uncertainties and main open issues• other relevant information
13
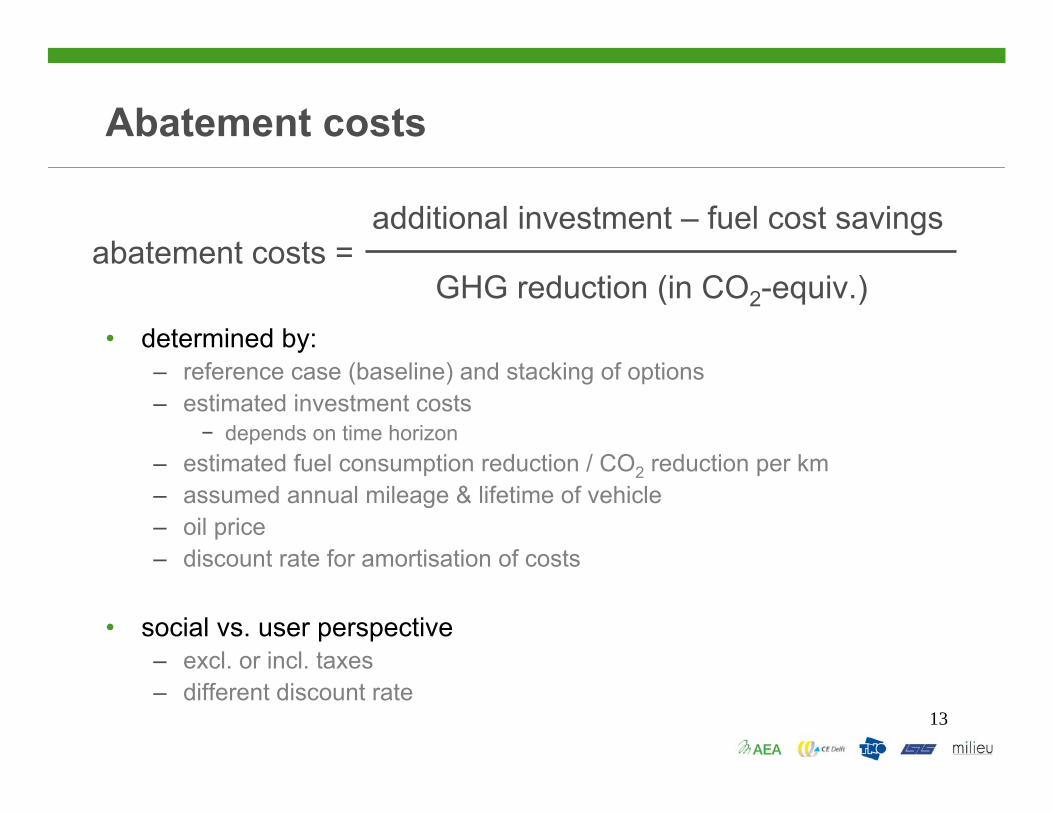
Abatement costs
• determined by:– reference case (baseline) and stacking of options– estimated investment costs
− depends on time horizon– estimated fuel consumption reduction / CO2 reduction per km– assumed annual mileage & lifetime of vehicle– oil price– discount rate for amortisation of costs
• social vs. user perspective– excl. or incl. taxes– different discount rate
additional investment – fuel cost savings
GHG reduction (in CO2-equiv.)abatement costs =
14
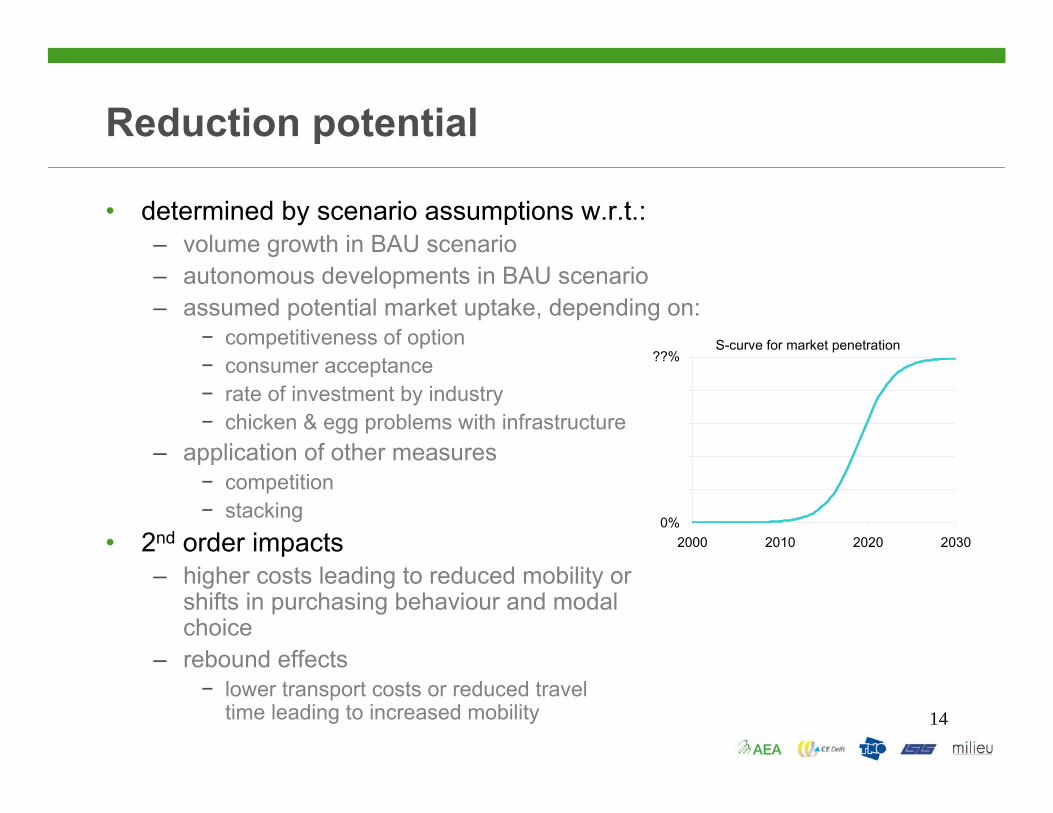
Reduction potential
• determined by scenario assumptions w.r.t.:– volume growth in BAU scenario– autonomous developments in BAU scenario– assumed potential market uptake, depending on:
− competitiveness of option− consumer acceptance− rate of investment by industry− chicken & egg problems with infrastructure
– application of other measures− competition− stacking
• 2nd order impacts– higher costs leading to reduced mobility or
shifts in purchasing behaviour and modalchoice
– rebound effects− lower transport costs or reduced travel
time leading to increased mobility
S-curve for market penetration
2000 2010 2020 20300%
??%
15
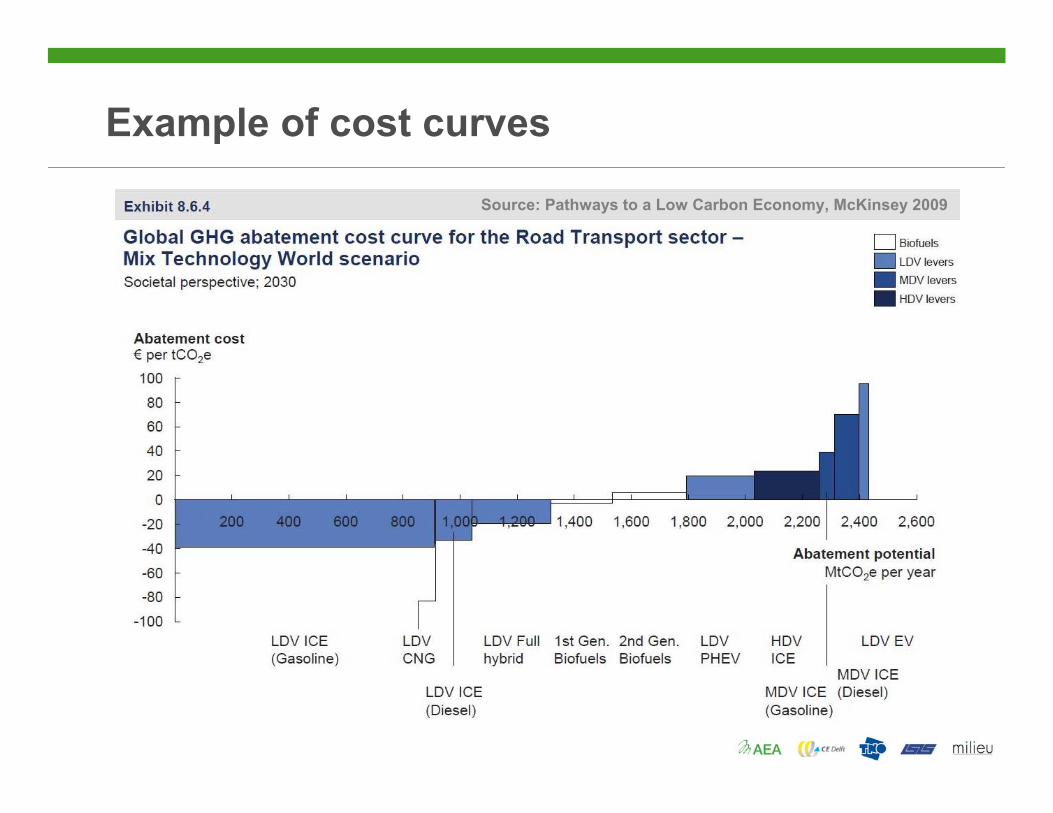
Example of cost curves
Source: Pathways to a Low Carbon Economy, McKinsey 2009
16
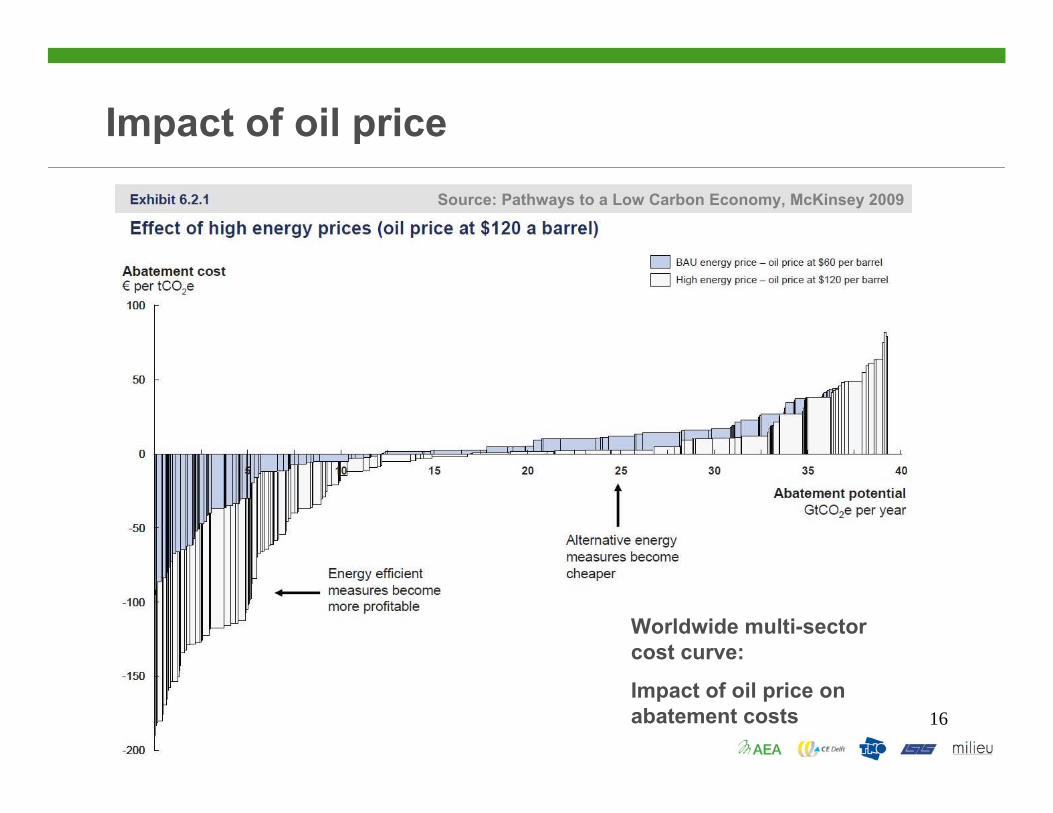
Impact of oil priceSource: Pathways to a Low Carbon Economy, McKinsey 2009
Worldwide multi-sector cost curve:
Impact of oil price on abatement costs
17
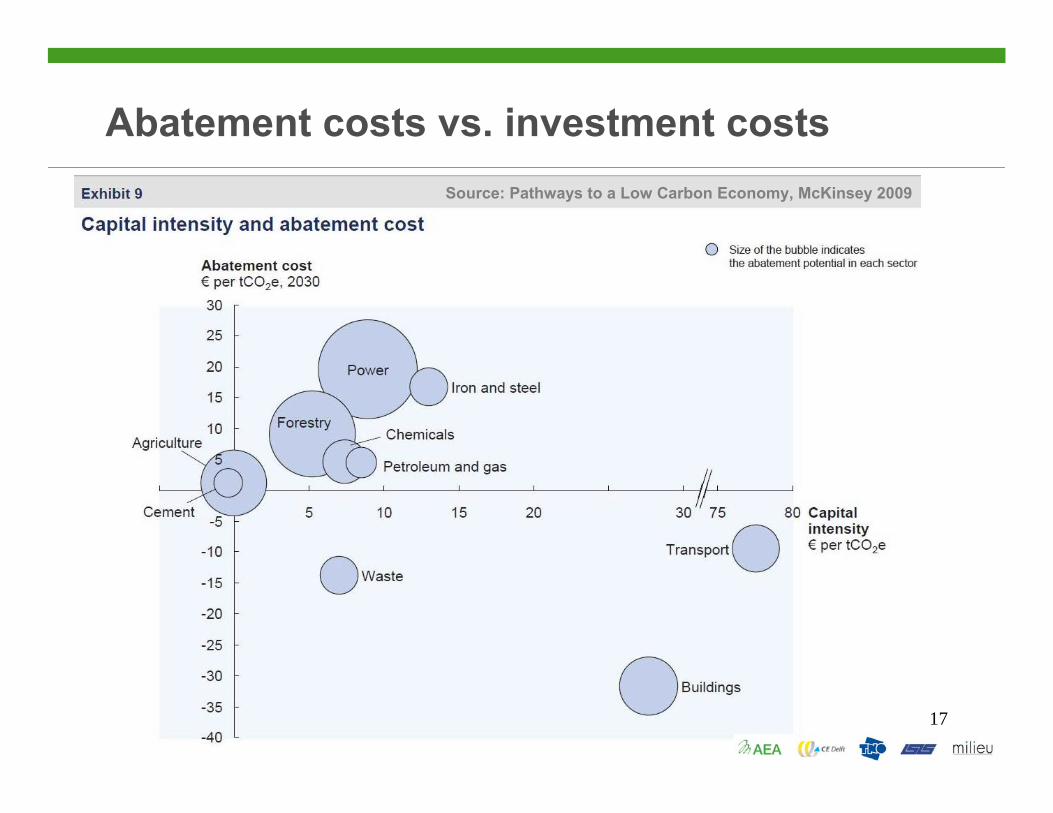
Abatement costs vs. investment costsSource: Pathways to a Low Carbon Economy, McKinsey 2009
18
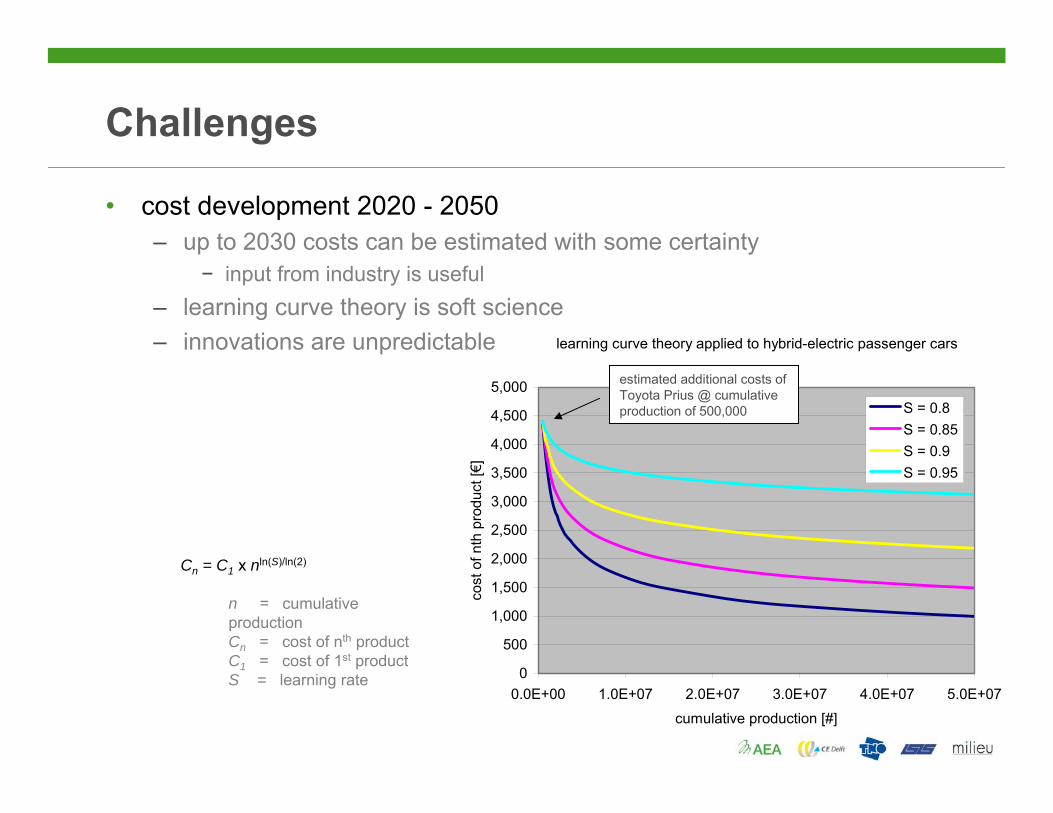
Challenges
learning curve theory applied to hybrid-electric passenger cars
0
500
1,000
1,500
2,000
2,500
3,000
3,500
4,000
4,500
5,000
0.0E+00 1.0E+07 2.0E+07 3.0E+07 4.0E+07 5.0E+07
cumulative production [#]
cost
of n
th p
rodu
ct [€
]
S = 0.8S = 0.85S = 0.9S = 0.95
estimated additional costs of Toyota Prius @ cumulative production of 500,000
Cn = C1 x nln(S)/ln(2)
n = cumulative productionCn = cost of nth productC1 = cost of 1st productS = learning rate
• cost development 2020 - 2050– up to 2030 costs can be estimated with some certainty
− input from industry is useful– learning curve theory is soft science– innovations are unpredictable
19
Challenges
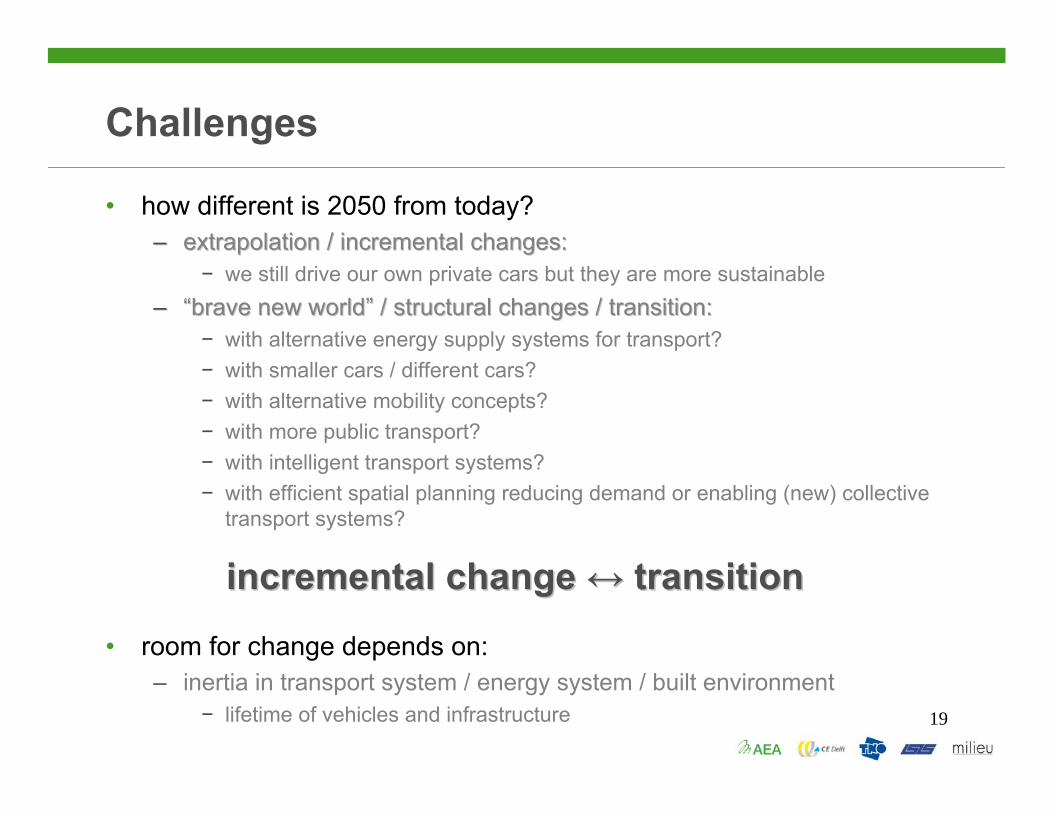
• how different is 2050 from today?–– extrapolation / incremental changes: extrapolation / incremental changes:
− we still drive our own private cars but they are more sustainable–– ““brave new worldbrave new world”” / structural changes / transition:/ structural changes / transition:
− with alternative energy supply systems for transport?− with smaller cars / different cars?− with alternative mobility concepts?− with more public transport?− with intelligent transport systems?− with efficient spatial planning reducing demand or enabling (new) collective
transport systems?
• room for change depends on:– inertia in transport system / energy system / built environment
− lifetime of vehicles and infrastructure
incremental change incremental change ↔↔ transitiontransition
20
Challenges
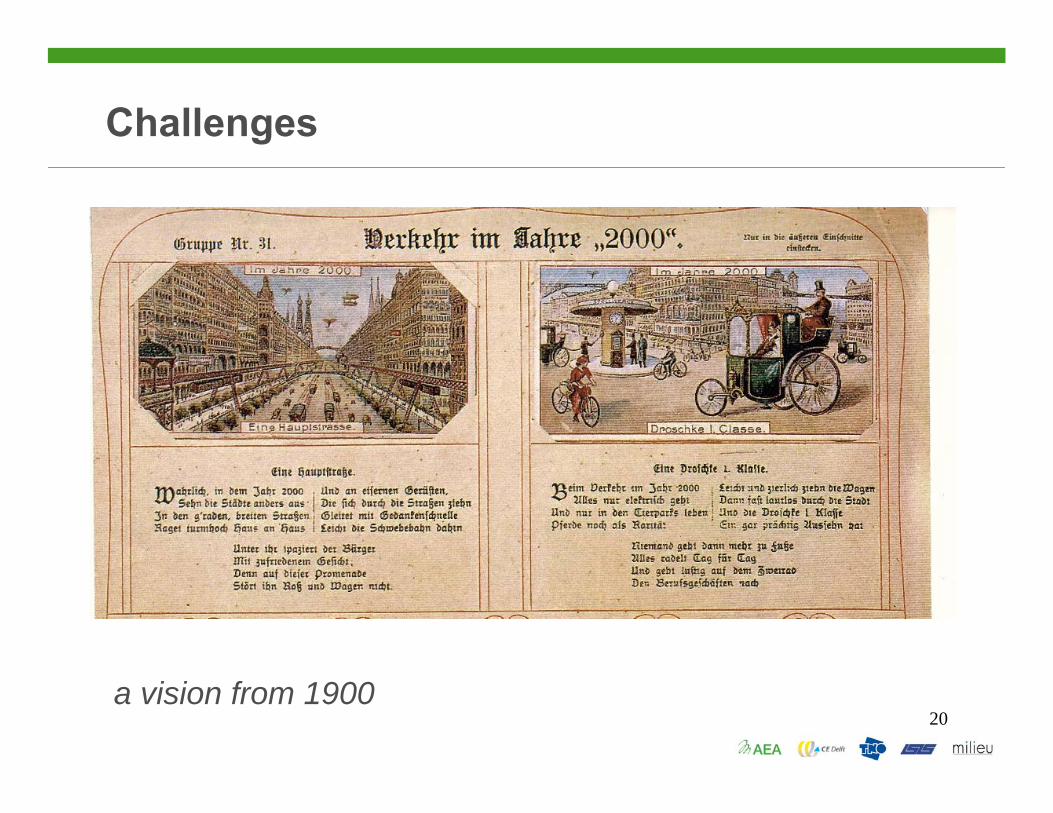
a vision from 1900
21
Challenges
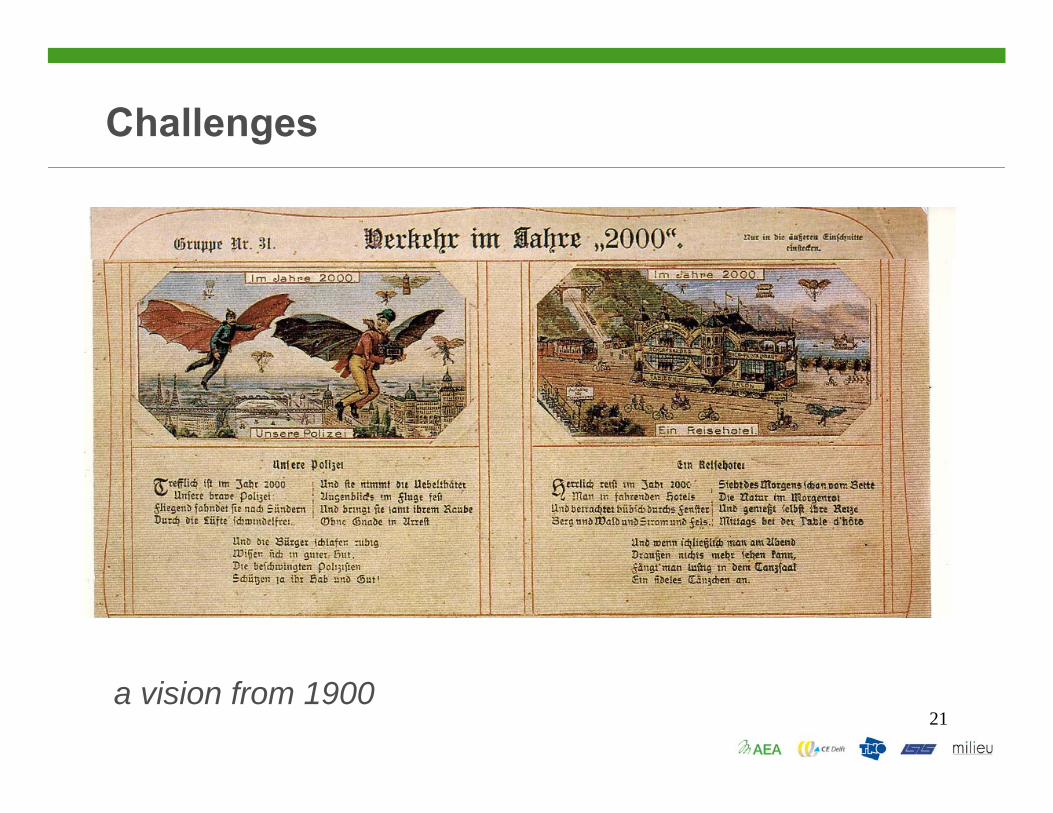
a vision from 1900
22
Challenges
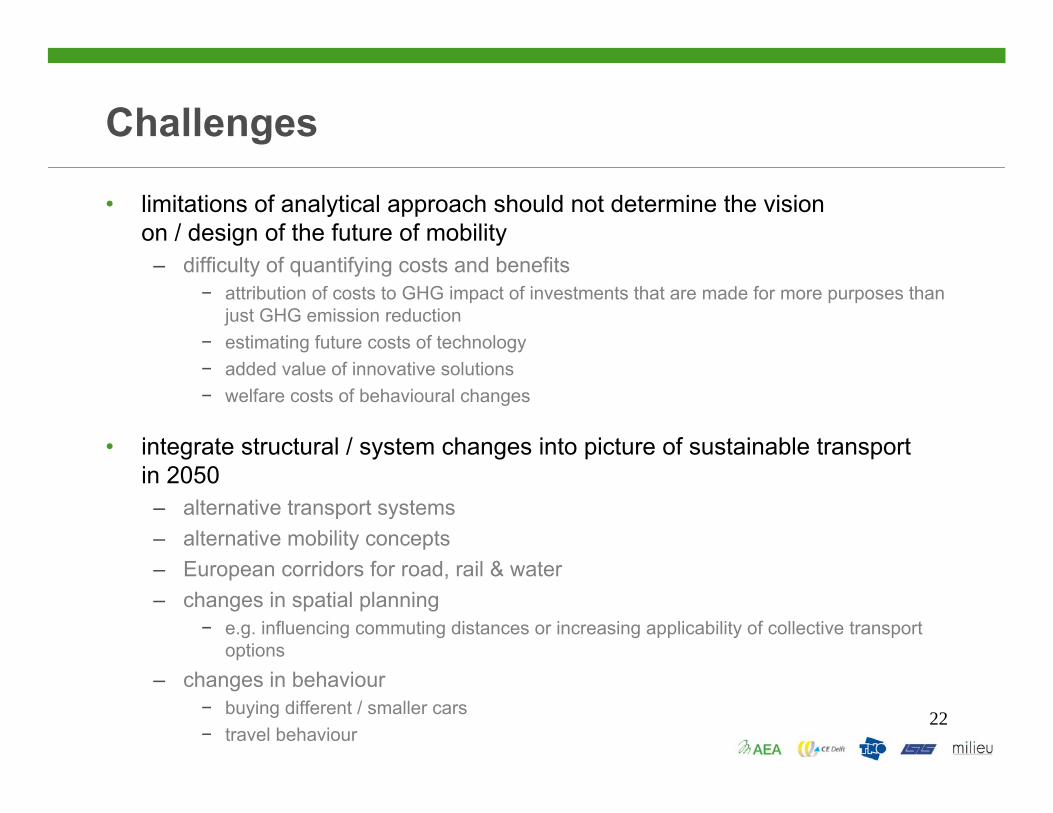
• limitations of analytical approach should not determine the vision on / design of the future of mobility
– difficulty of quantifying costs and benefits− attribution of costs to GHG impact of investments that are made for more purposes than
just GHG emission reduction− estimating future costs of technology− added value of innovative solutions− welfare costs of behavioural changes
• integrate structural / system changes into picture of sustainable transport in 2050
– alternative transport systems– alternative mobility concepts– European corridors for road, rail & water– changes in spatial planning
− e.g. influencing commuting distances or increasing applicability of collective transport options
– changes in behaviour− buying different / smaller cars− travel behaviour
23
Information needs
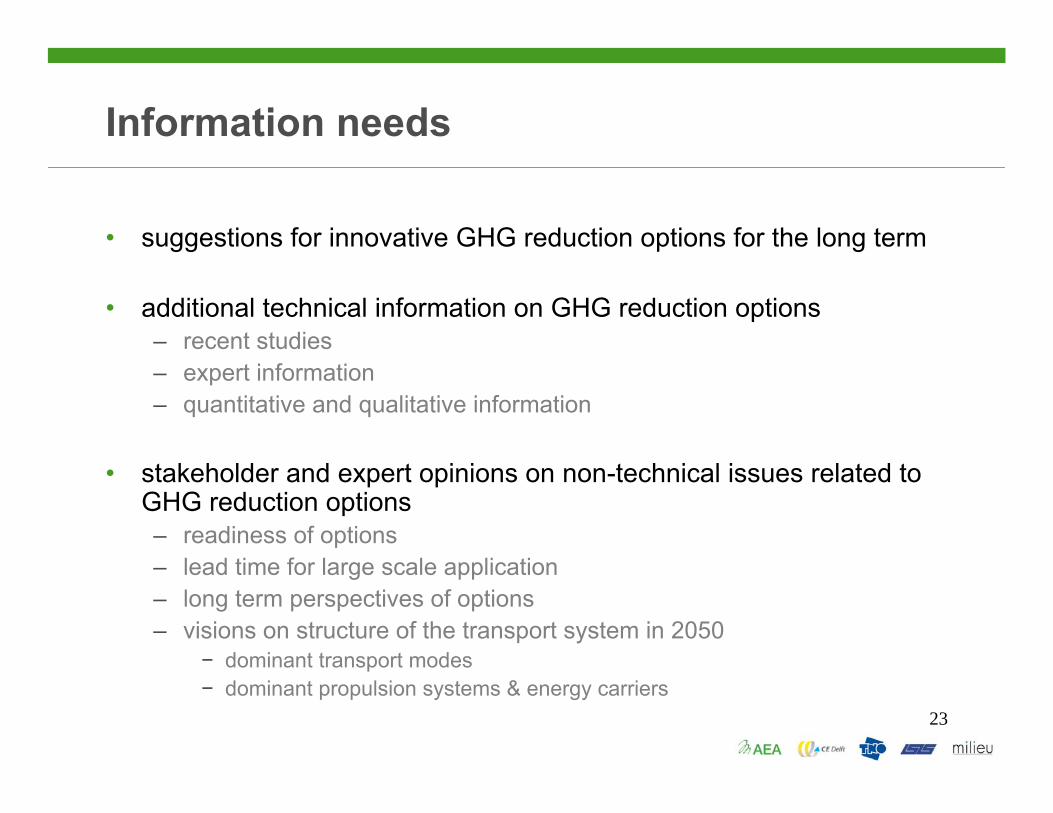
• suggestions for innovative GHG reduction options for the long term
• additional technical information on GHG reduction options– recent studies– expert information– quantitative and qualitative information
• stakeholder and expert opinions on non-technical issues related to GHG reduction options– readiness of options– lead time for large scale application– long term perspectives of options– visions on structure of the transport system in 2050
− dominant transport modes− dominant propulsion systems & energy carriers
24
Session 2 - Review of GHG reduction options
DISCUSSIONDISCUSSION
25
Discussion (1)
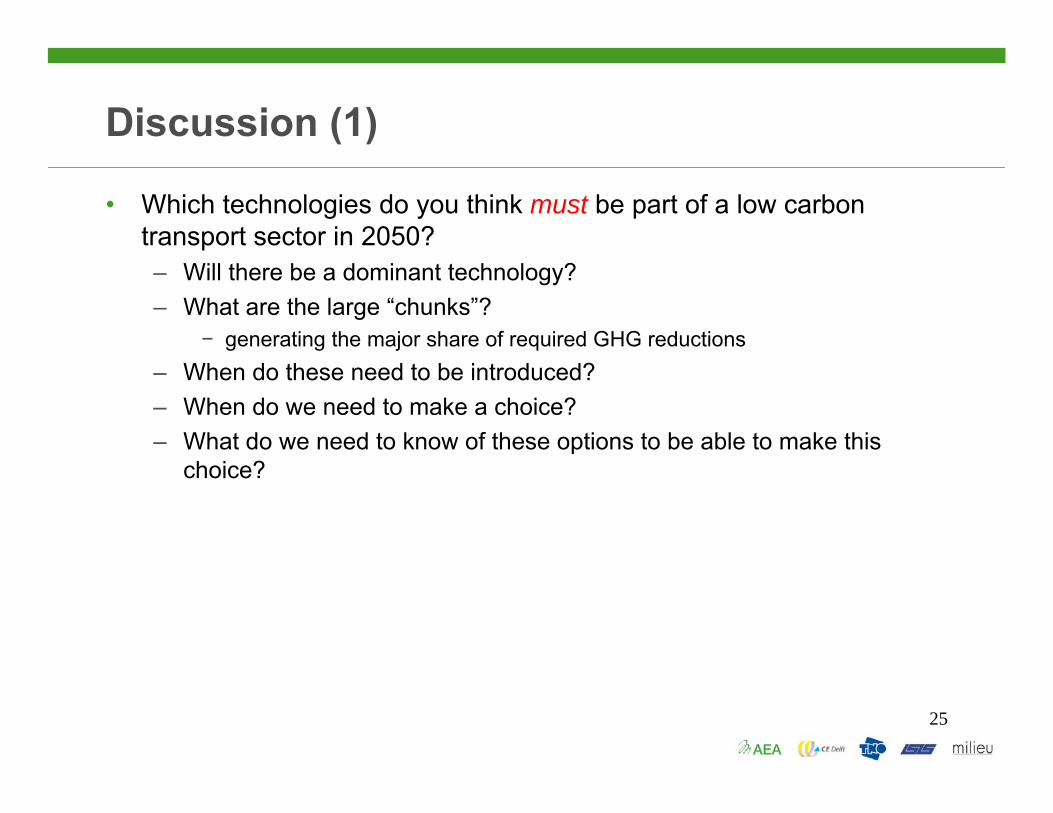
• Which technologies do you think must be part of a low carbon transport sector in 2050?– Will there be a dominant technology? – What are the large “chunks”?
− generating the major share of required GHG reductions– When do these need to be introduced?– When do we need to make a choice?– What do we need to know of these options to be able to make this
choice?
26
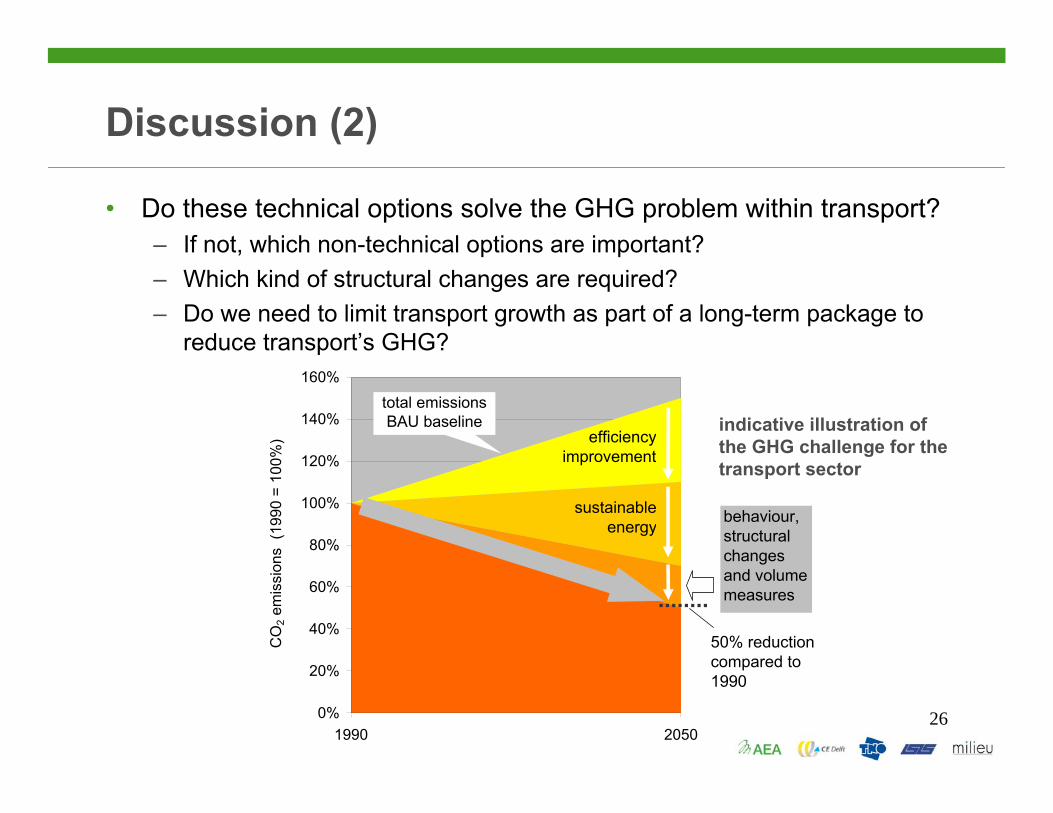
Discussion (2)
• Do these technical options solve the GHG problem within transport?– If not, which non-technical options are important?– Which kind of structural changes are required?– Do we need to limit transport growth as part of a long-term package to
reduce transport’s GHG?
indicative illustration of the GHG challenge for the transport sector
0%
20%
40%
60%
80%
100%
120%
140%
160%
1990 2050
CO
2 em
issi
ons
(199
0 =
100%
)
total emissions BAU baseline
50% reduction compared to 1990
efficiency improvement
behaviour, structural changesand volume measures
sustainable energy

27
Discussion (3)
• On which key questions regarding technical and non-technical options should this project focus in particular?– What do policy makers need to know to be able to make the right
choices?– What do other stakeholders need to know to be able to make the right
choices?