Embed Size (px)
Citation preview
8/3/2019 Session 1_Introduction Managerial Statistics
http://slidepdf.com/reader/full/session-1introduction-managerial-statistics 1/23
Quantitative Method ±I
Managerial Statistics
Introduction
8/3/2019 Session 1_Introduction Managerial Statistics
http://slidepdf.com/reader/full/session-1introduction-managerial-statistics 2/23
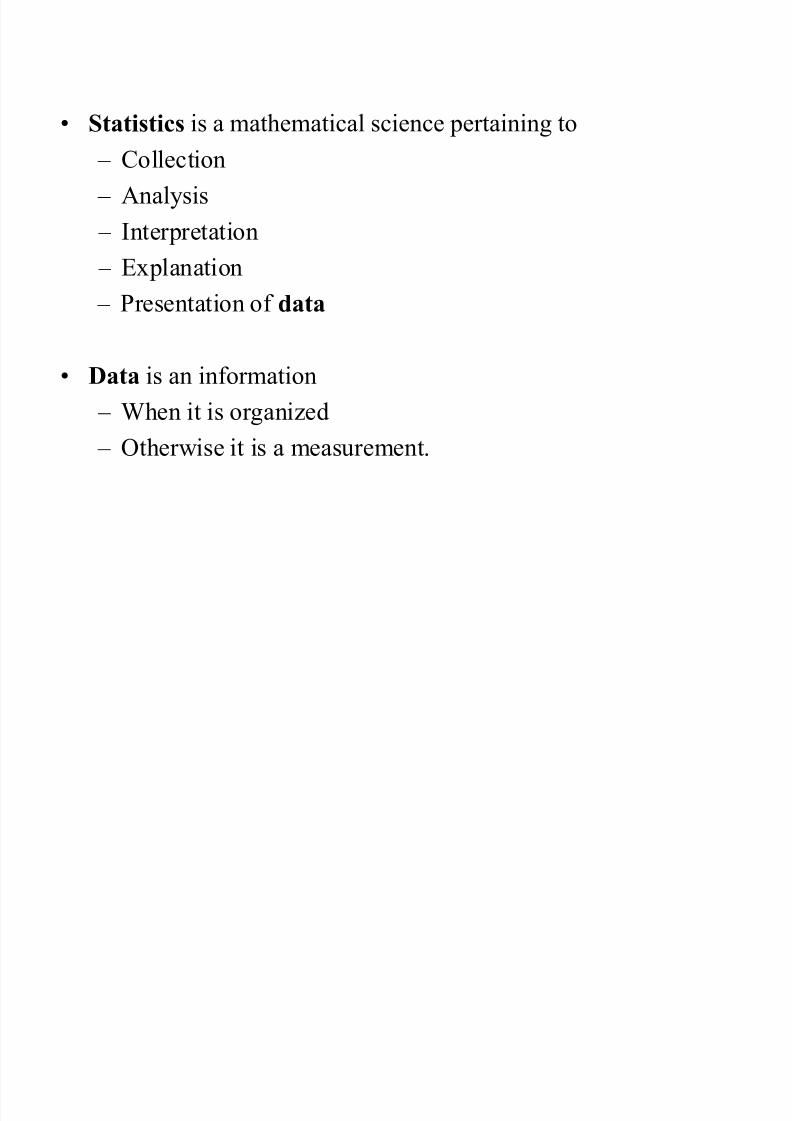
Statistics is a mathematical science pertaining to
± Collection
± Analysis
± Interpretation
± Explanation ± Presentation of data
Data is an information
± When it is organized ± Otherwise it is a measurement.
8/3/2019 Session 1_Introduction Managerial Statistics
http://slidepdf.com/reader/full/session-1introduction-managerial-statistics 3/23
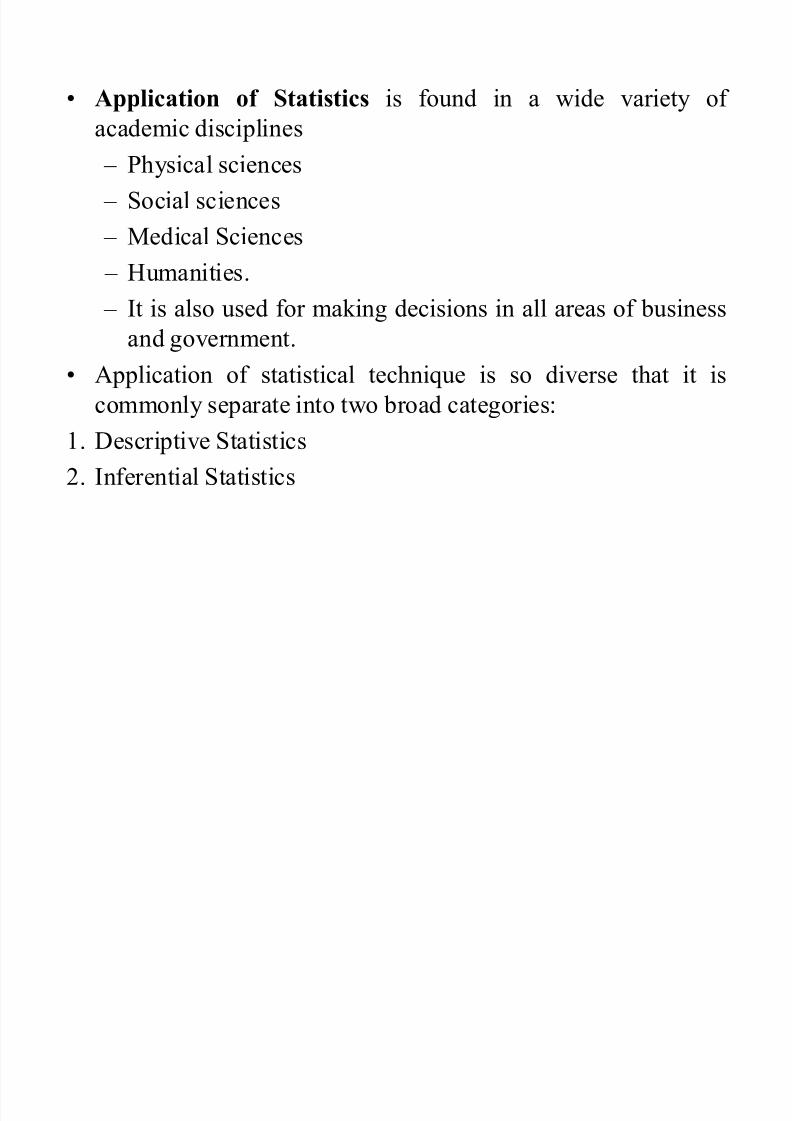
Application of Statistics is found in a wide variety of
academic disciplines ± Physical sciences
± Social sciences
± Medical Sciences
± Humanities. ± It is also used for making decisions in all areas of business
and government.
Application of statistical technique is so diverse that it is
commonly separate into two broad categories:1. Descriptive Statistics
2. Inferential Statistics
8/3/2019 Session 1_Introduction Managerial Statistics
http://slidepdf.com/reader/full/session-1introduction-managerial-statistics 4/23
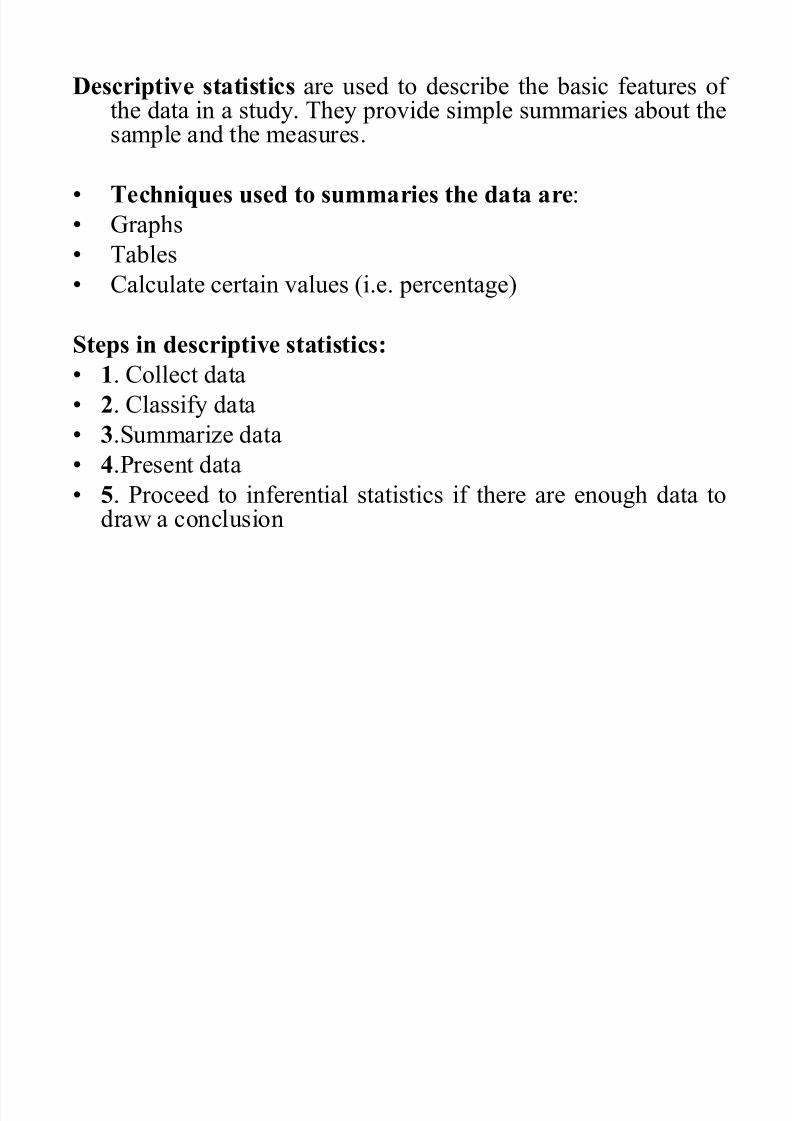
Descriptive statistics are used to describe the basic features of the data in a study. They provide simple summaries about the
sample and the measures.
Techniques used to summaries the data are:
Graphs
Tables
Calculate certain values (i.e. percentage)
Steps in descriptive statistics:
1. Collect data
2. Classify data 3.Summarize data
4.Present data
5. Proceed to inferential statistics if there are enough data todraw a conclusion
8/3/2019 Session 1_Introduction Managerial Statistics
http://slidepdf.com/reader/full/session-1introduction-managerial-statistics 5/23
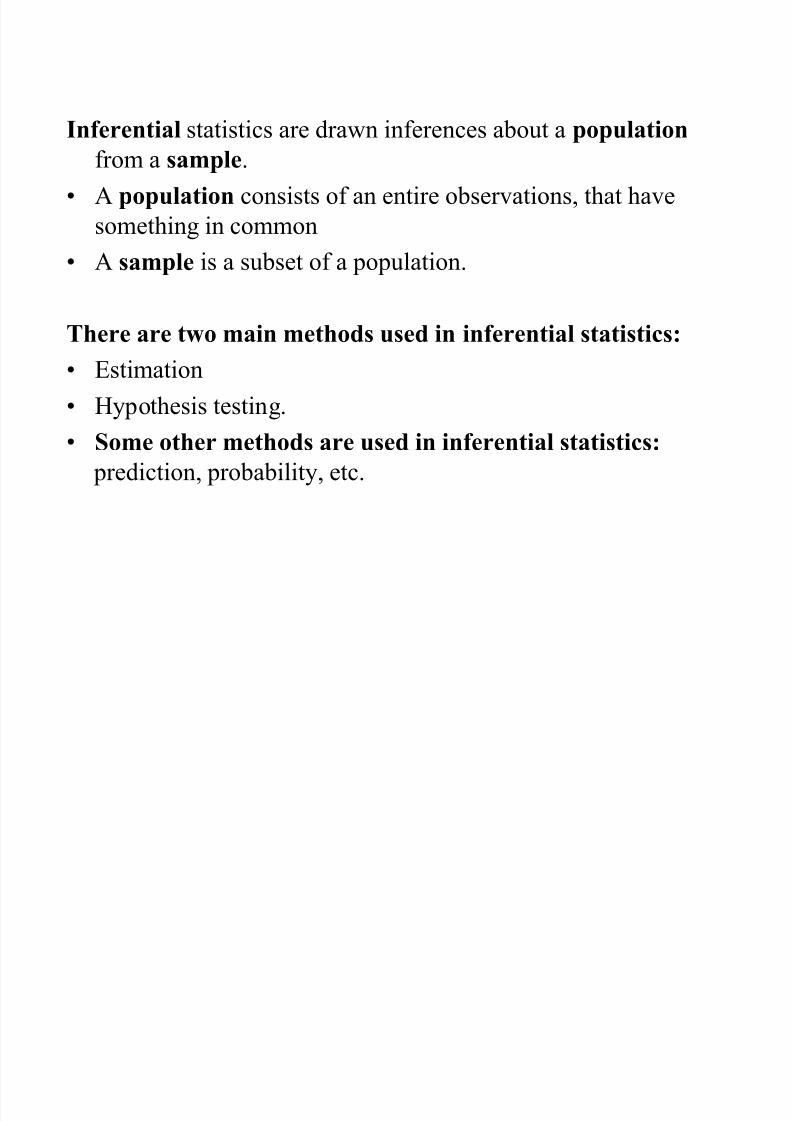
Inferential statistics are drawn inferences about a populationfrom a sample.
A population consists of an entire observations, that have
something in common
A sample is a subset of a population.
There are two main methods used in inferential statistics:
Estimation
Hypothesis testing. Some other methods are used in inferential statistics:
prediction, probability, etc.
8/3/2019 Session 1_Introduction Managerial Statistics
http://slidepdf.com/reader/full/session-1introduction-managerial-statistics 6/23
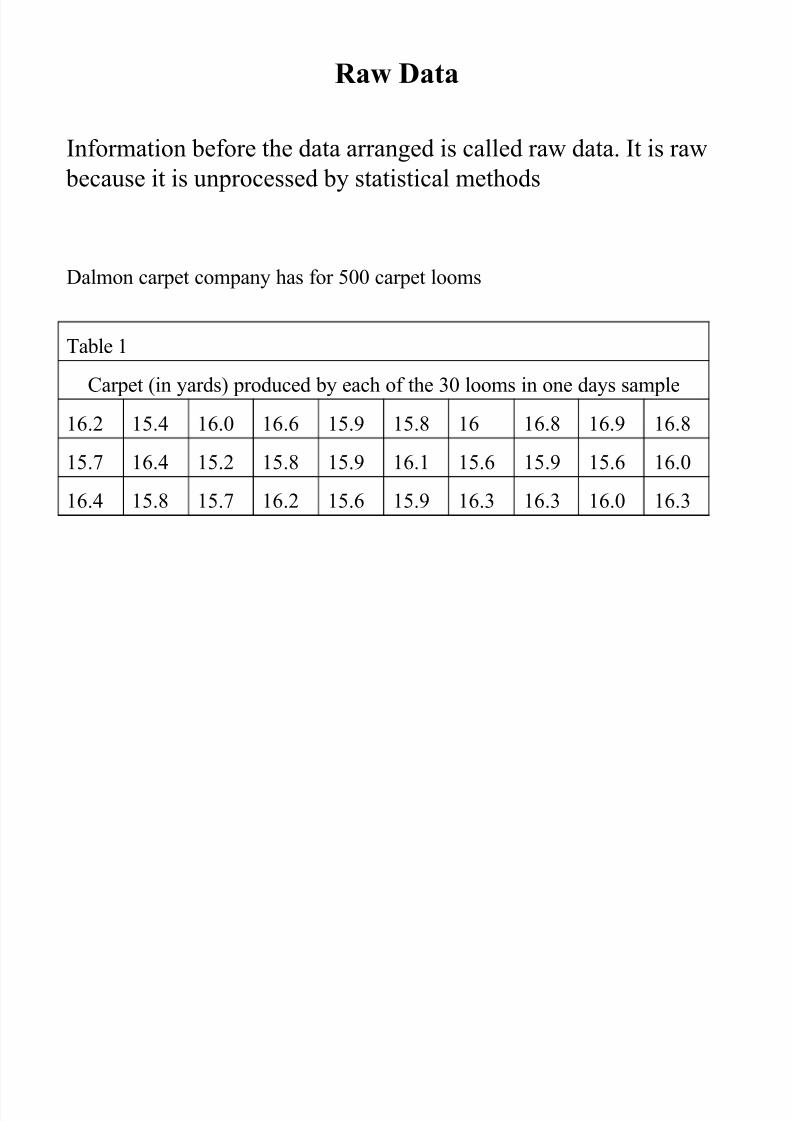
R aw Data
Table 1
Carpet (in yards) produced by each of the 30 looms in one days sample
16.2 15.4 16.0 16.6 15.9 15.8 16 16.8 16.9 16.8
15.7 16.4 15.2 15.8 15.9 16.1 15.6 15.9 15.6 16.0
16.4 15.8 15.7 16.2 15.6 15.9 16.3 16.3 16.0 16.3
Information before the data arranged is called raw data. It is raw
because it is unprocessed by statistical methods
Dalmon carpet company has for 500 carpet looms
8/3/2019 Session 1_Introduction Managerial Statistics
http://slidepdf.com/reader/full/session-1introduction-managerial-statistics 7/23
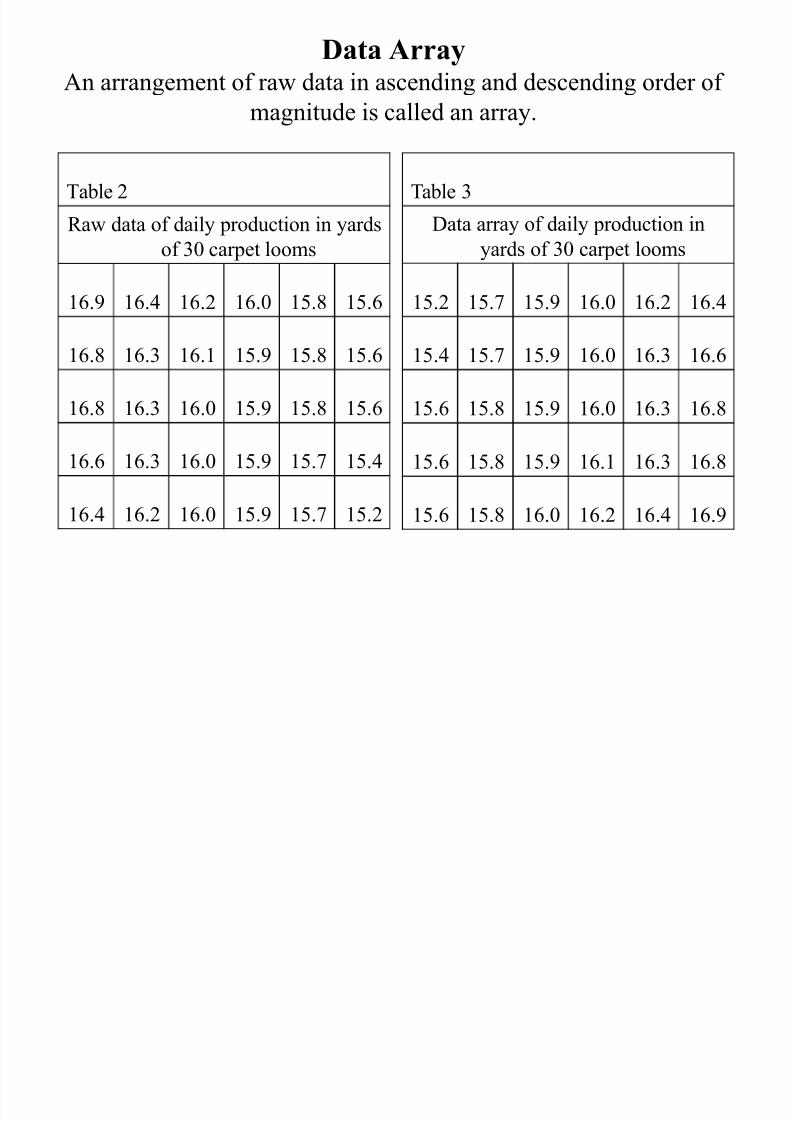
Data ArrayAn arrangement of raw data in ascending and descending order of
magnitude is called an array.
Table 2
Raw data of daily production in yards
of 30 carpet looms
16.9 16.4 16.2 16.0 15.8 15.6
16.8 16.3 16.1 15.9 15.8 15.6
16.8 16.3 16.0 15.9 15.8 15.6
16.6 16.3 16.0 15.9 15.7 15.4
16.4 16.2 16.0 15.9 15.7 15.2
Table 3
Data array of daily production in
yards of 30 carpet looms
15.2 15.7 15.9 16.0 16.2 16.4
15.4 15.7 15.9 16.0 16.3 16.6
15.6 15.8 15.9 16.0 16.3 16.8
15.6 15.8 15.9 16.1 16.3 16.8
15.6 15.8 16.0 16.2 16.4 16.9

8/3/2019 Session 1_Introduction Managerial Statistics
http://slidepdf.com/reader/full/session-1introduction-managerial-statistics 8/23
8/3/2019 Session 1_Introduction Managerial Statistics
http://slidepdf.com/reader/full/session-1introduction-managerial-statistics 9/23
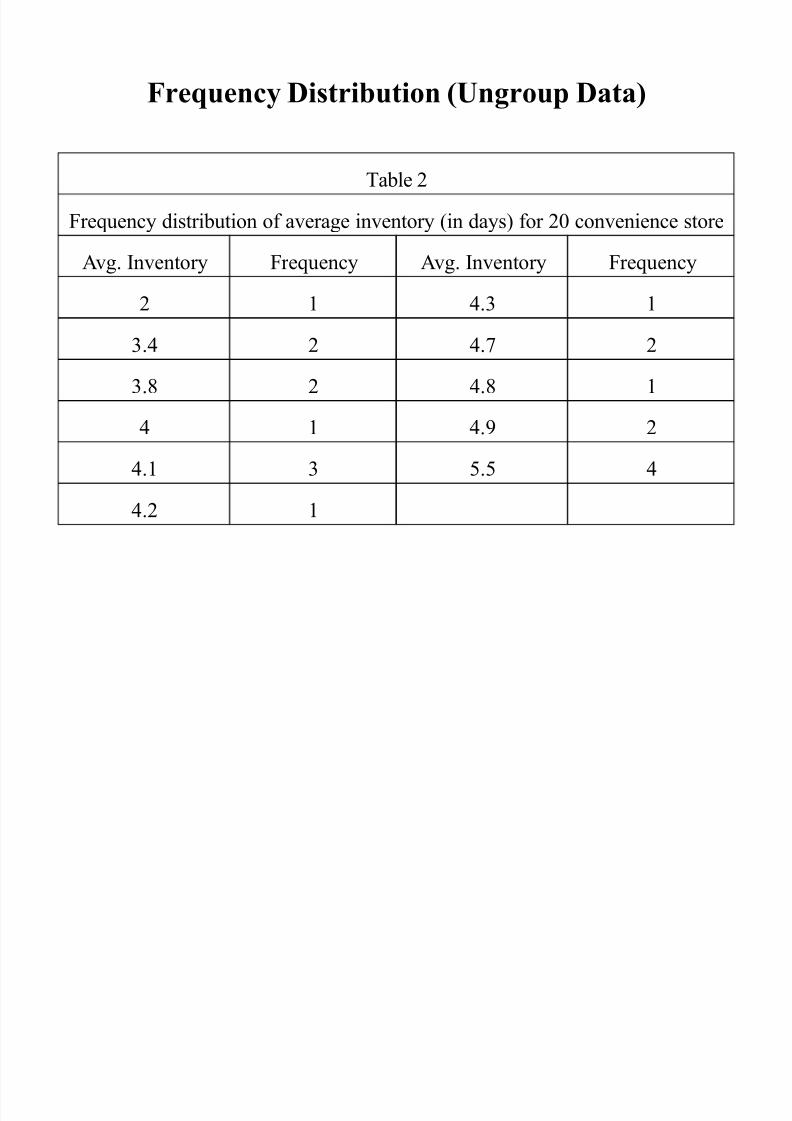
Frequency Distribution (Ungroup Data)
Table 2
Frequency distribution of average inventory (in days) for 20 convenience store
Avg. Inventory Frequency Avg. Inventory Frequency
2 1 4.3 1
3.4 2 4.7 2
3.8 2 4.8 1
4 1 4.9 2
4.1 3 5.5 4
4.2 1
8/3/2019 Session 1_Introduction Managerial Statistics
http://slidepdf.com/reader/full/session-1introduction-managerial-statistics 10/23
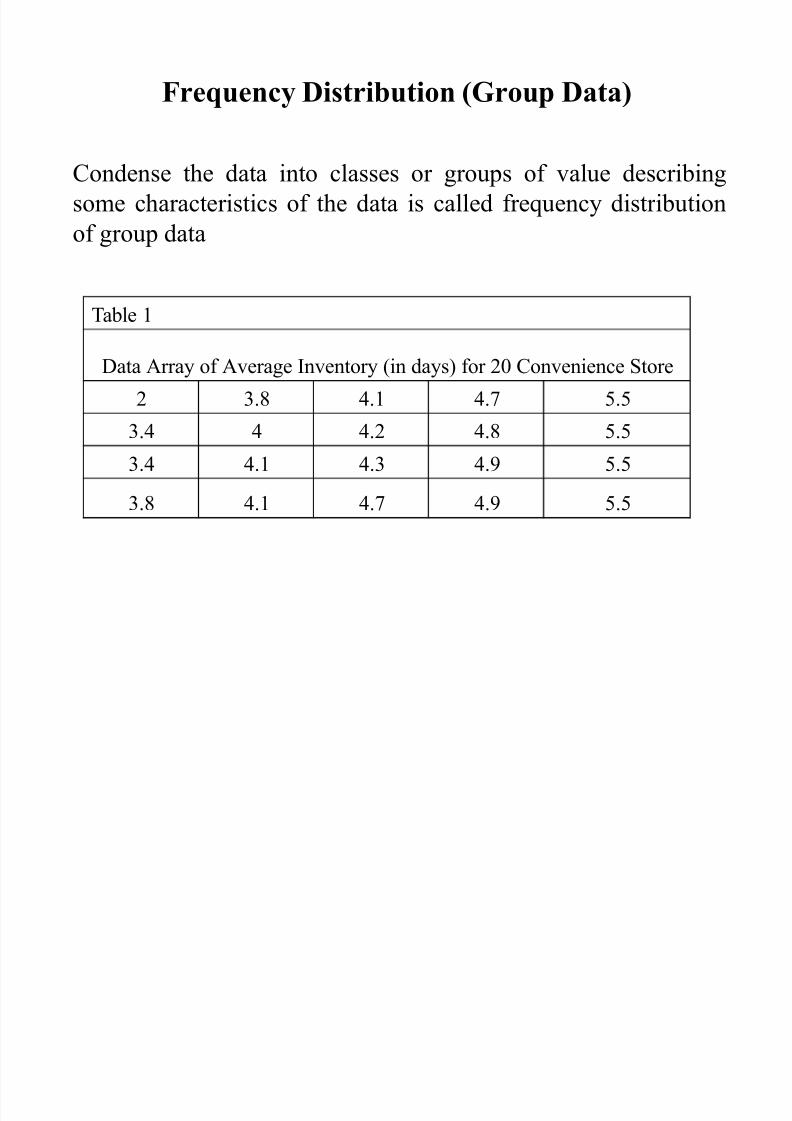
Frequency Distribution (Group Data)
Table 1
Data Array of Average Inventory (in days) for 20 Convenience Store
2 3.8 4.1 4.7 5.5
3.4 4 4.2 4.8 5.5
3.4 4.1 4.3 4.9 5.5
3.8 4.1 4.7 4.9 5.5
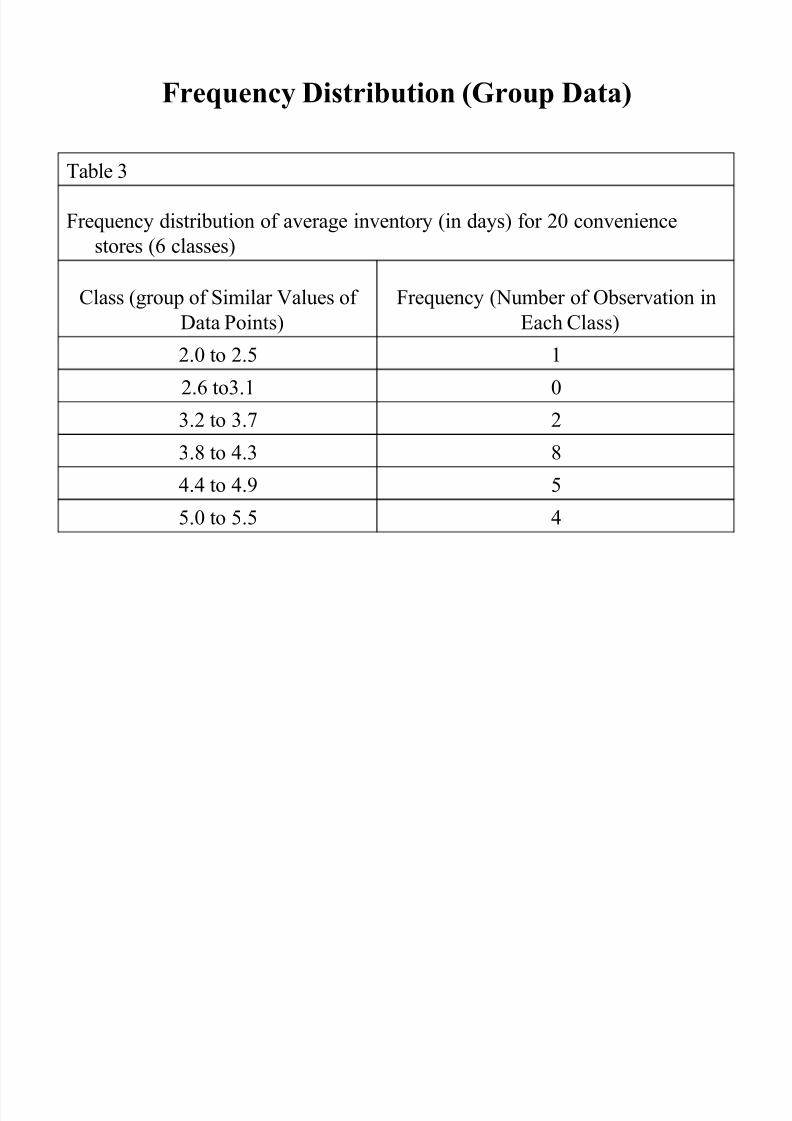
Condense the data into classes or groups of value describing
some characteristics of the data is called frequency distribution
of group data
8/3/2019 Session 1_Introduction Managerial Statistics
http://slidepdf.com/reader/full/session-1introduction-managerial-statistics 11/23
Frequency Distribution (Group Data)
Table 3
Frequency distribution of average inventory (in days) for 20 convenience
stores (6 classes)
Class (group of Similar Values of
Data Points)
Frequency (Number of Observation in
Each Class)
2.0 to 2.5 1
2.6 to3.1 0
3.2 to 3.7 2
3.8 to 4.3 8
4.4 to 4.9 5
5.0 to 5.5 4
8/3/2019 Session 1_Introduction Managerial Statistics
http://slidepdf.com/reader/full/session-1introduction-managerial-statistics 12/23
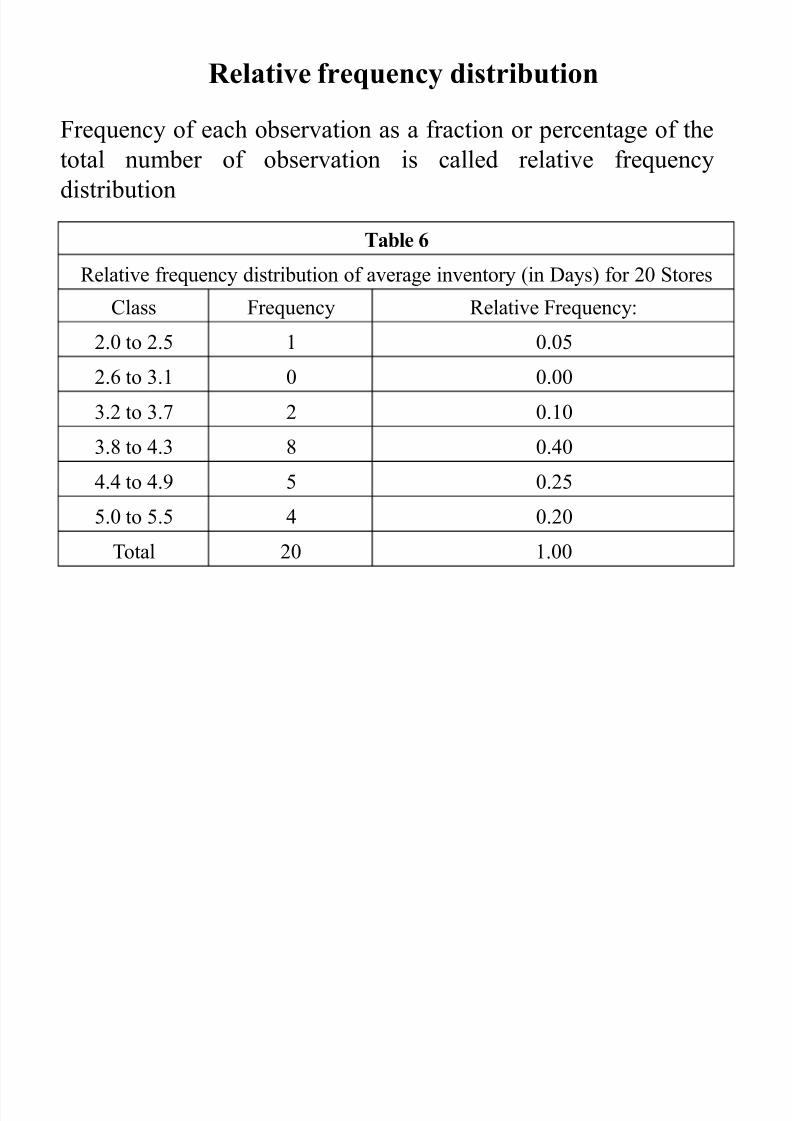
R elative frequency distribution
Table 6
Relative frequency distribution of average inventory (in Days) for 20 StoresClass Frequency Relative Frequency:
2.0 to 2.5 1 0.05
2.6 to 3.1 0 0.00
3.2 to 3.7 2 0.103.8 to 4.3 8 0.40
4.4 to 4.9 5 0.25
5.0 to 5.5 4 0.20
Total 20 1.00
Frequency of each observation as a fraction or percentage of thetotal number of observation is called relative frequency
distribution
8/3/2019 Session 1_Introduction Managerial Statistics
http://slidepdf.com/reader/full/session-1introduction-managerial-statistics 13/23
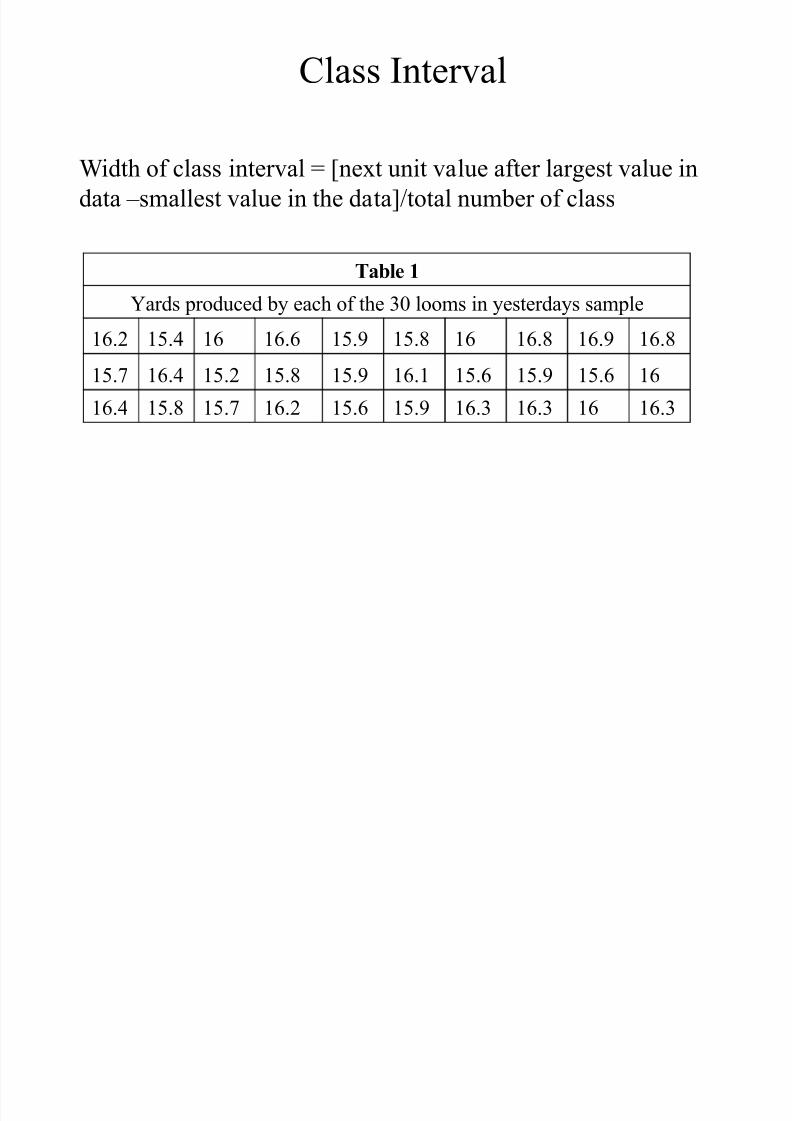
Class Interval
Table 1Yards produced by each of the 30 looms in yesterdays sample
16.2 15.4 16 16.6 15.9 15.8 16 16.8 16.9 16.8
15.7 16.4 15.2 15.8 15.9 16.1 15.6 15.9 15.6 16
16.4 15.8 15.7 16.2 15.6 15.9 16.3 16.3 16 16.3
Width of class interval = [next unit value after largest value in
data ±smallest value in the data]/total number of class
8/3/2019 Session 1_Introduction Managerial Statistics
http://slidepdf.com/reader/full/session-1introduction-managerial-statistics 14/23
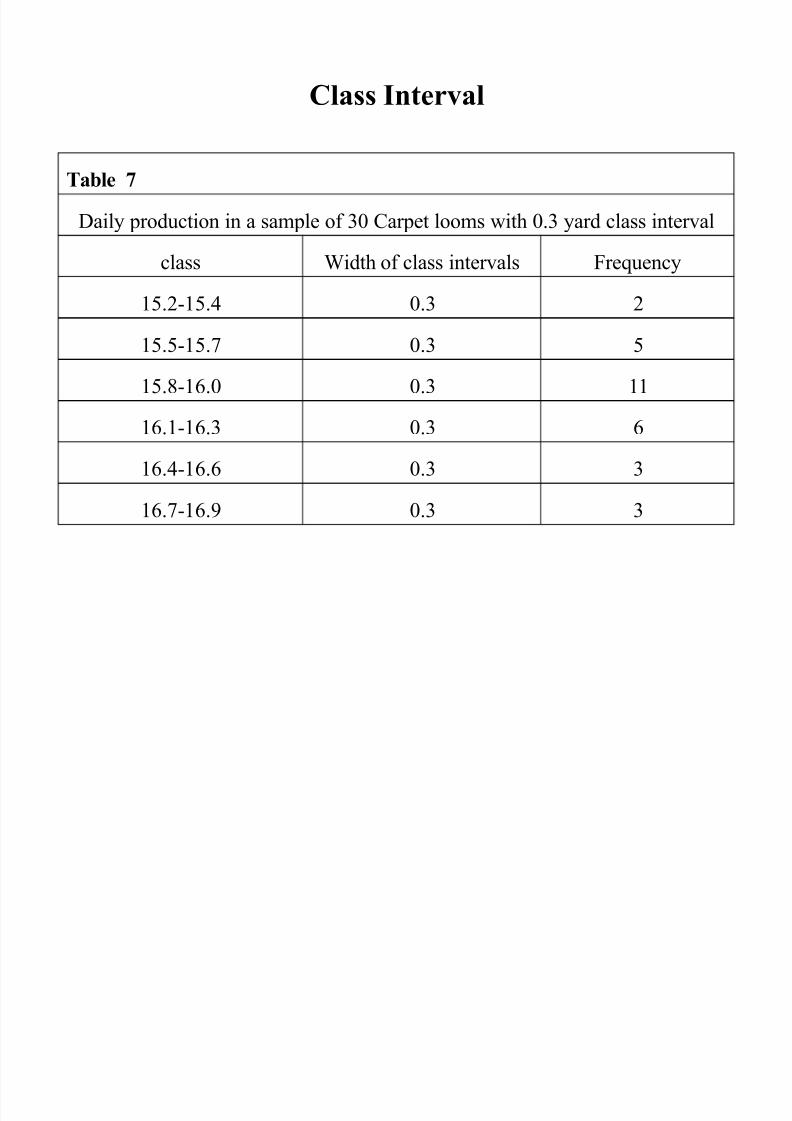
Class Interval
Table 7
Daily production in a sample of 30 Carpet looms with 0.3 yard class interval
class Width of class intervals Frequency
15.2-15.4 0.3 2
15.5-15.7 0.3 5
15.8-16.0 0.3 11
16.1-16.3 0.3 6
16.4-16.6 0.3 3
16.7-16.9 0.3 3
8/3/2019 Session 1_Introduction Managerial Statistics
http://slidepdf.com/reader/full/session-1introduction-managerial-statistics 15/23
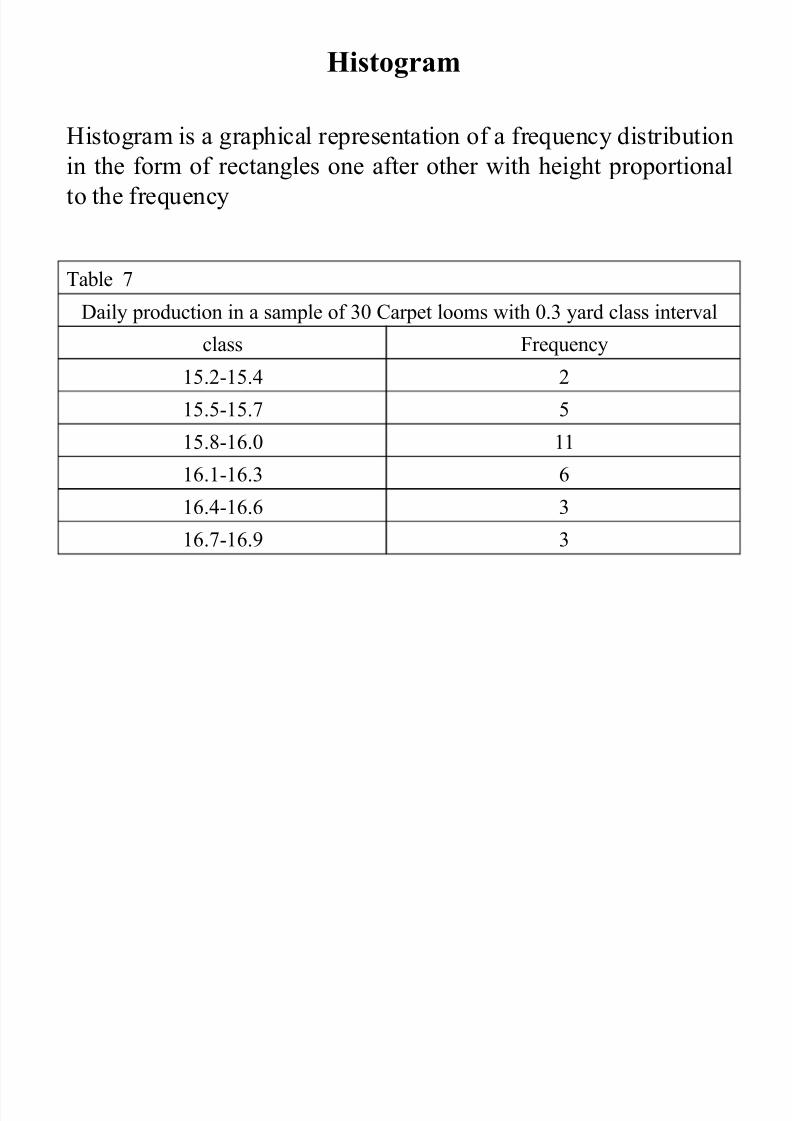
Histogram
Table 7
Daily production in a sample of 30 Carpet looms with 0.3 yard class interval
class Frequency
15.2-15.4 2
15.5-15.7 515.8-16.0 11
16.1-16.3 6
16.4-16.6 3
16.7-16.9 3
Histogram is a graphical representation of a frequency distributionin the form of rectangles one after other with height proportional
to the frequency
8/3/2019 Session 1_Introduction Managerial Statistics
http://slidepdf.com/reader/full/session-1introduction-managerial-statistics 16/23
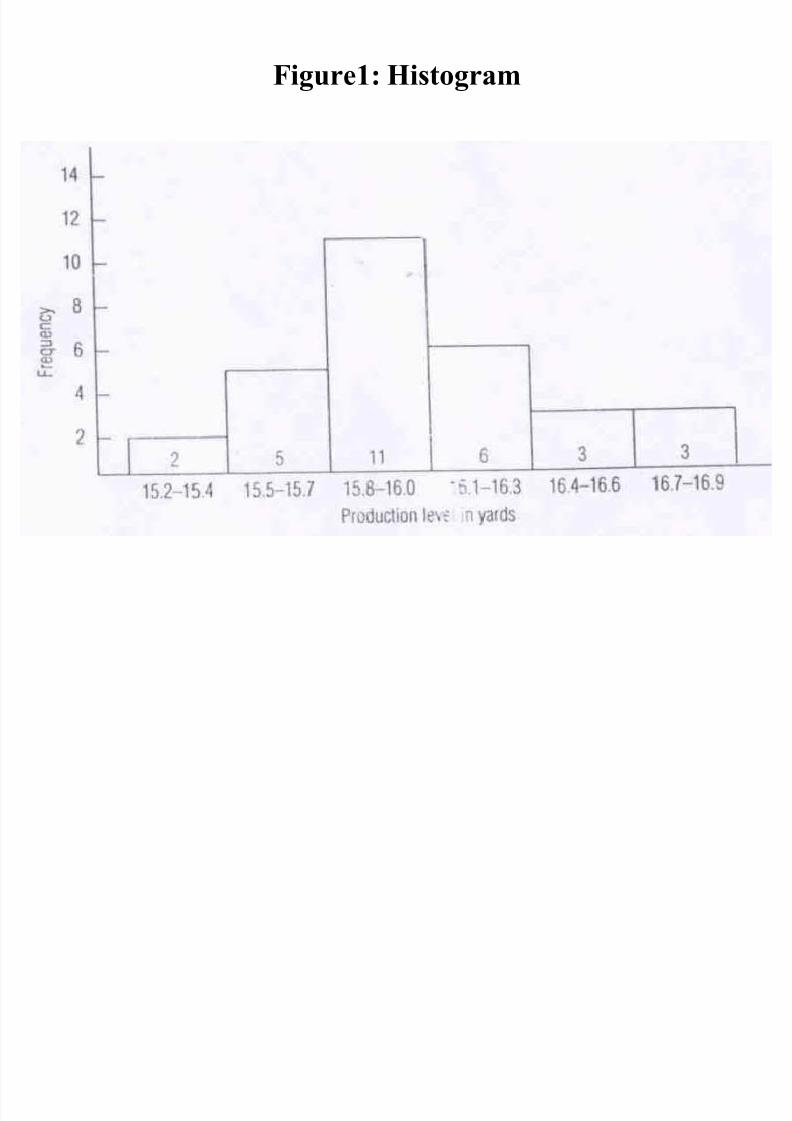
Figure1: Histogram
8/3/2019 Session 1_Introduction Managerial Statistics
http://slidepdf.com/reader/full/session-1introduction-managerial-statistics 17/23
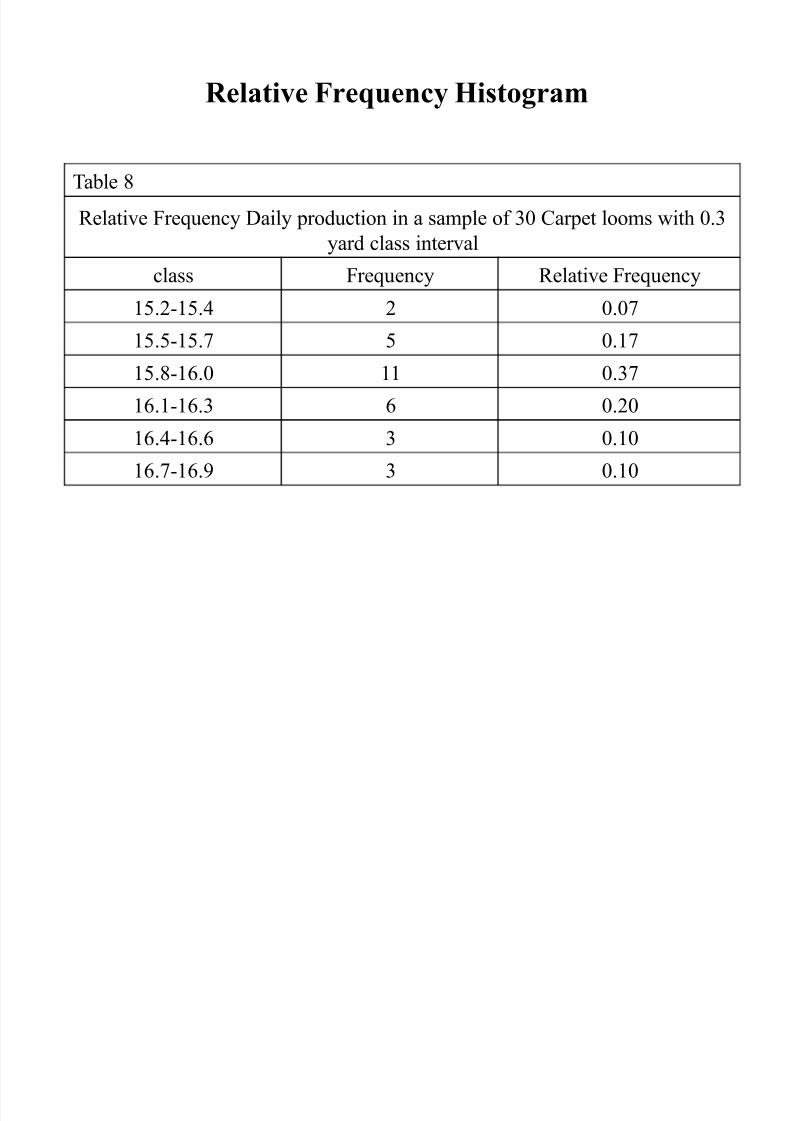
R elative FrequencyHistogram
Table 8
Relative Frequency Daily production in a sample of 30 Carpet looms with 0.3
yard class interval
class Frequency Relative Frequency15.2-15.4 2 0.07
15.5-15.7 5 0.17
15.8-16.0 11 0.37
16.1-16.3 6 0.2016.4-16.6 3 0.10
16.7-16.9 3 0.10
8/3/2019 Session 1_Introduction Managerial Statistics
http://slidepdf.com/reader/full/session-1introduction-managerial-statistics 18/23
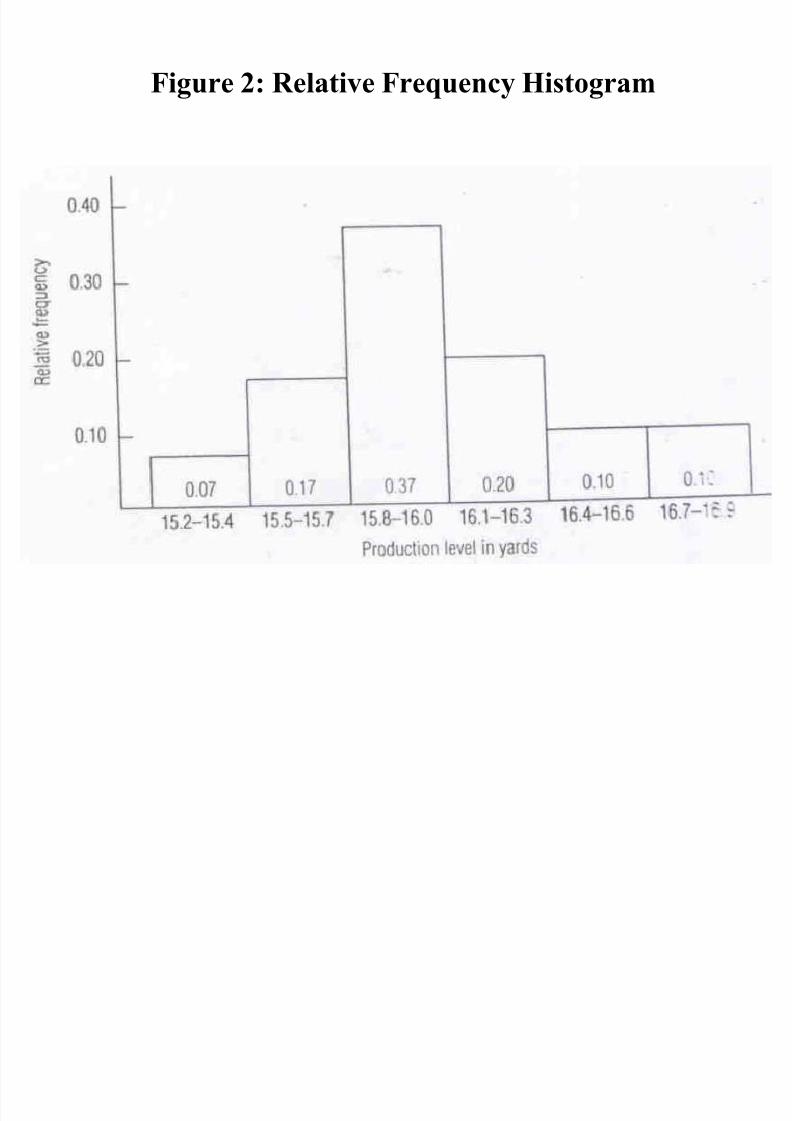
Figure 2: R elative Frequency Histogram
8/3/2019 Session 1_Introduction Managerial Statistics
http://slidepdf.com/reader/full/session-1introduction-managerial-statistics 19/23
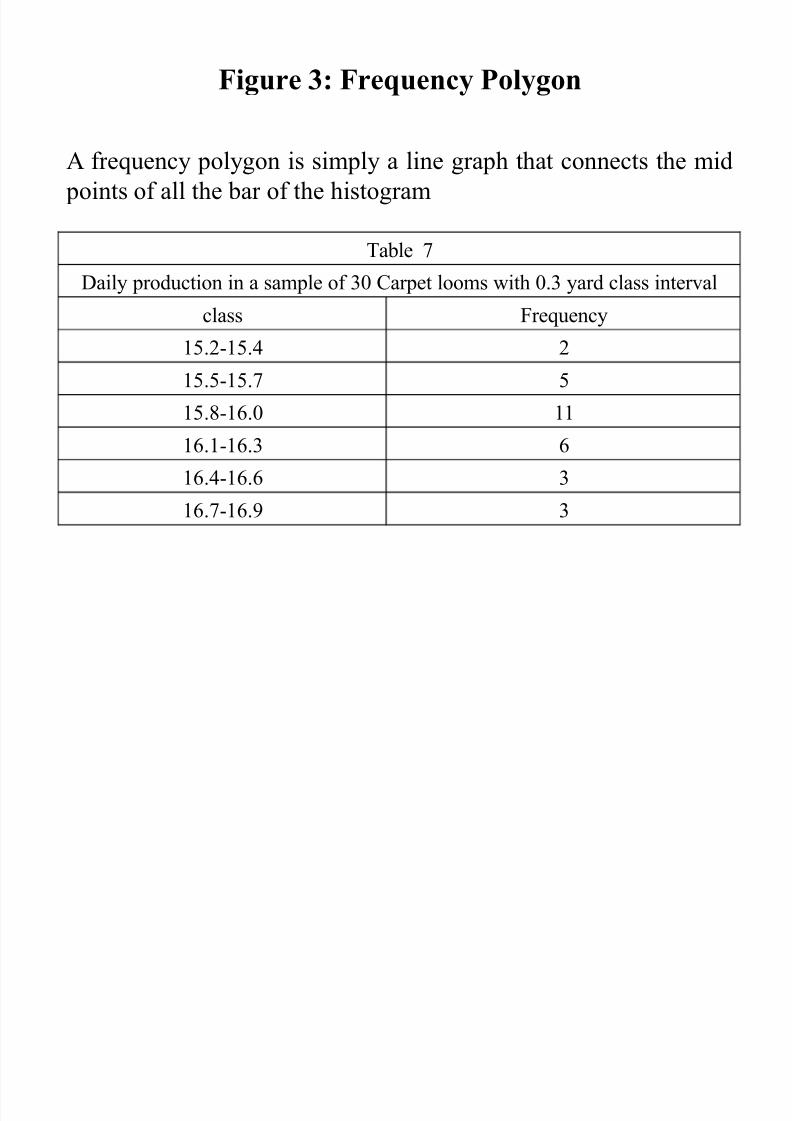
Figure 3: Frequency Polygon
Table 7
Daily production in a sample of 30 Carpet looms with 0.3 yard class interval
class Frequency
15.2-15.4 2
15.5-15.7 5
15.8-16.0 1116.1-16.3 6
16.4-16.6 3
16.7-16.9 3
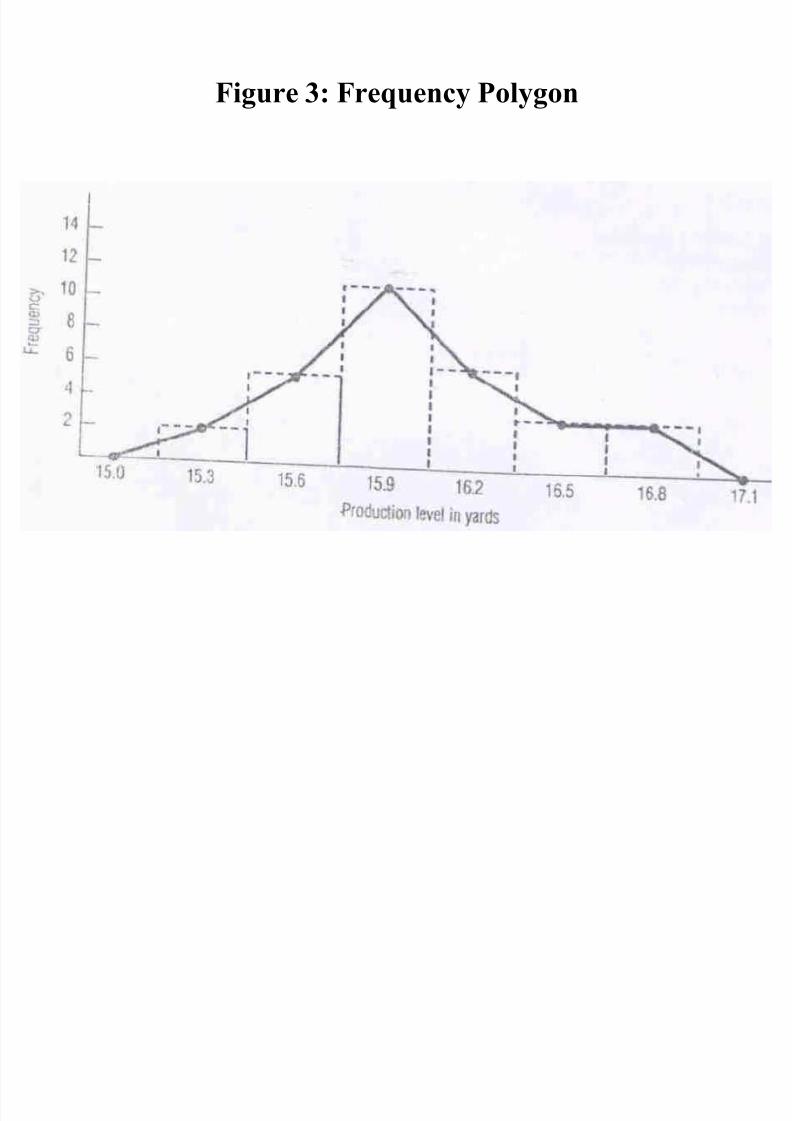
A frequency polygon is simply a line graph that connects the mid
points of all the bar of the histogram
8/3/2019 Session 1_Introduction Managerial Statistics
http://slidepdf.com/reader/full/session-1introduction-managerial-statistics 20/23
Figure 3: Frequency Polygon
8/3/2019 Session 1_Introduction Managerial Statistics
http://slidepdf.com/reader/full/session-1introduction-managerial-statistics 21/23
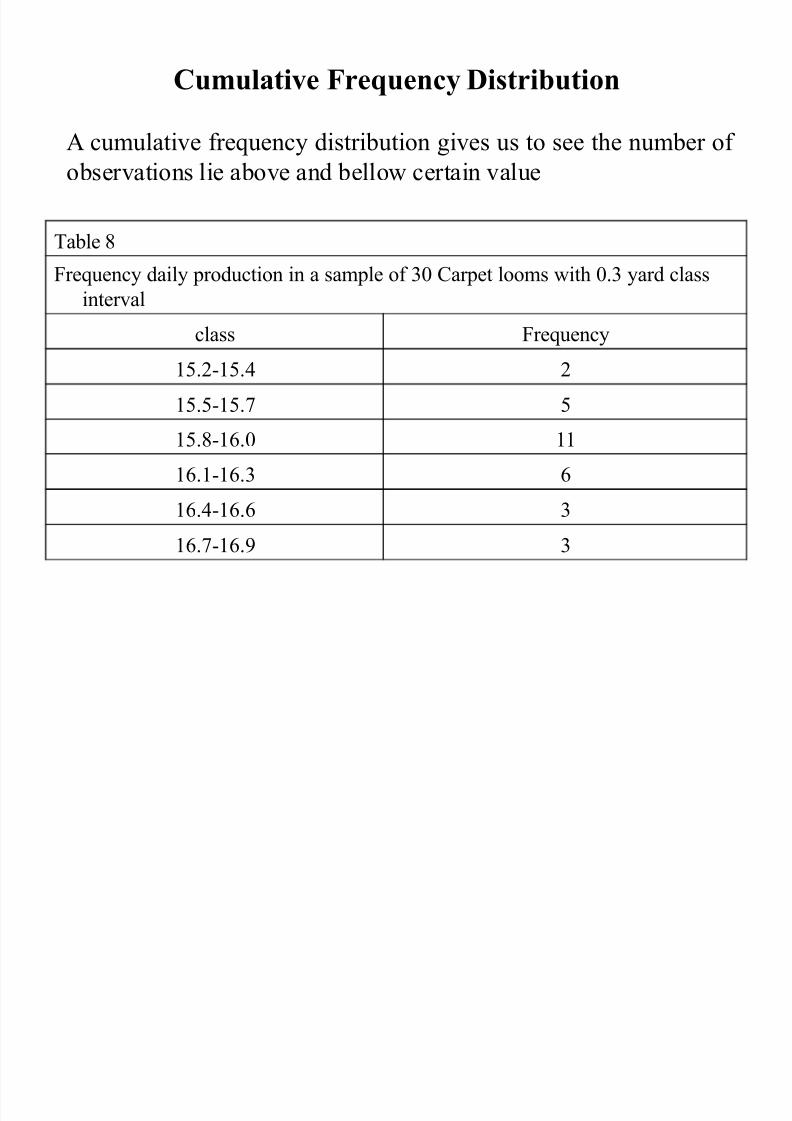
Cumulative Frequency Distribution
Table 8
Frequency daily production in a sample of 30 Carpet looms with 0.3 yard classinterval
class Frequency
15.2-15.4 2
15.5-15.7 5
15.8-16.0 11
16.1-16.3 6
16.4-16.6 3
16.7-16.9 3
A cumulative frequency distribution gives us to see the number of observations lie above and bellow certain value

8/3/2019 Session 1_Introduction Managerial Statistics
http://slidepdf.com/reader/full/session-1introduction-managerial-statistics 22/23
Cumulative Frequency Distribution
Table 9
Cumulative less than frequency distribution of production levels in a sample of
30 Carpet looms
Class Cumulative Frequency
Less Than 15.2 0
Less Than 15.5 2
Less Than 15.8 7
Less Than 16.1 18Less Than 16.4 24
Less Than 16.7 27
Less Than 17.0 30
8/3/2019 Session 1_Introduction Managerial Statistics
http://slidepdf.com/reader/full/session-1introduction-managerial-statistics 23/23
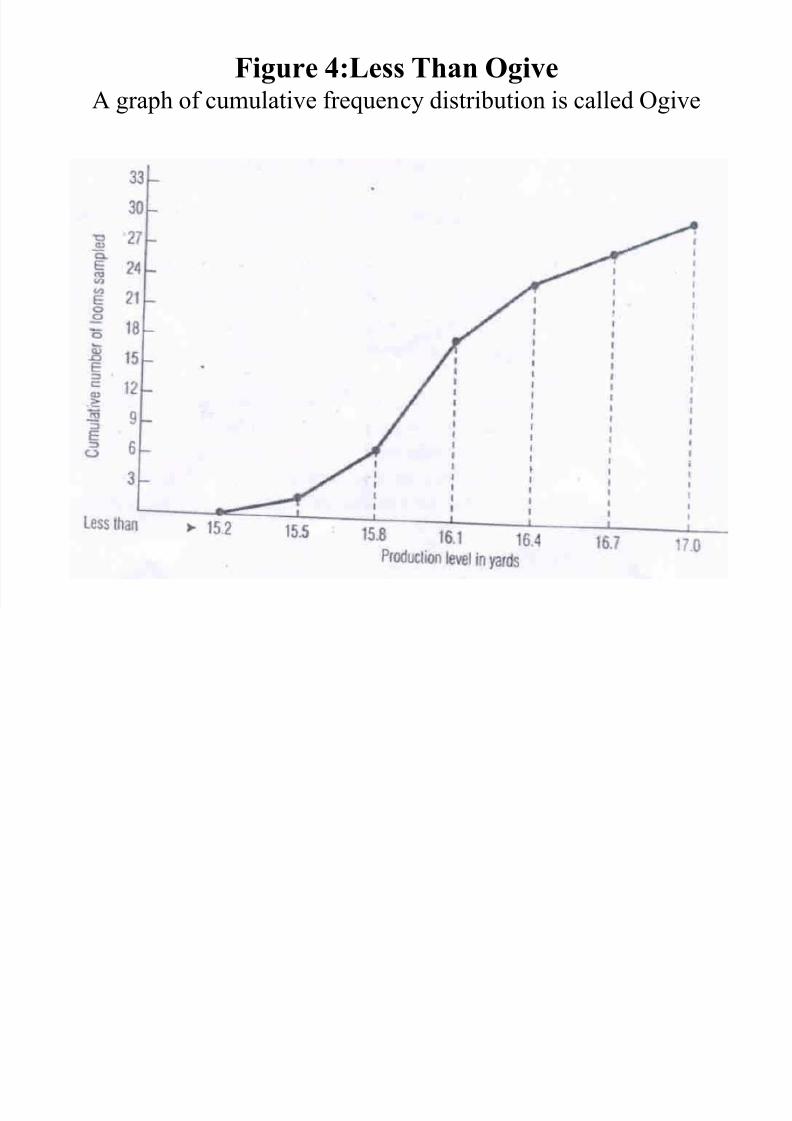
Figure 4:Less Than OgiveA graph of cumulative frequency distribution is called Ogive