Embed Size (px)
Citation preview

Session 1: Small area estimation introduction
Alan Marshall
ESDS Government
Housekeeping
• Toilets
• Loud continuous alarm, head back up the stairs and gather on grass outsidestairs and gather on grass outside
• Lunch & coffee breaks
Today
Session 1 – Introduction
Practical (approach 1)
Session 2 – Curve fitting (approach 1)
Practical
LunchLunch
Session 3 - Relational models (approach 2)
Practical
Session 4 - Synthetic regression (approach 3)
Practical
Session 5 - Conclusions
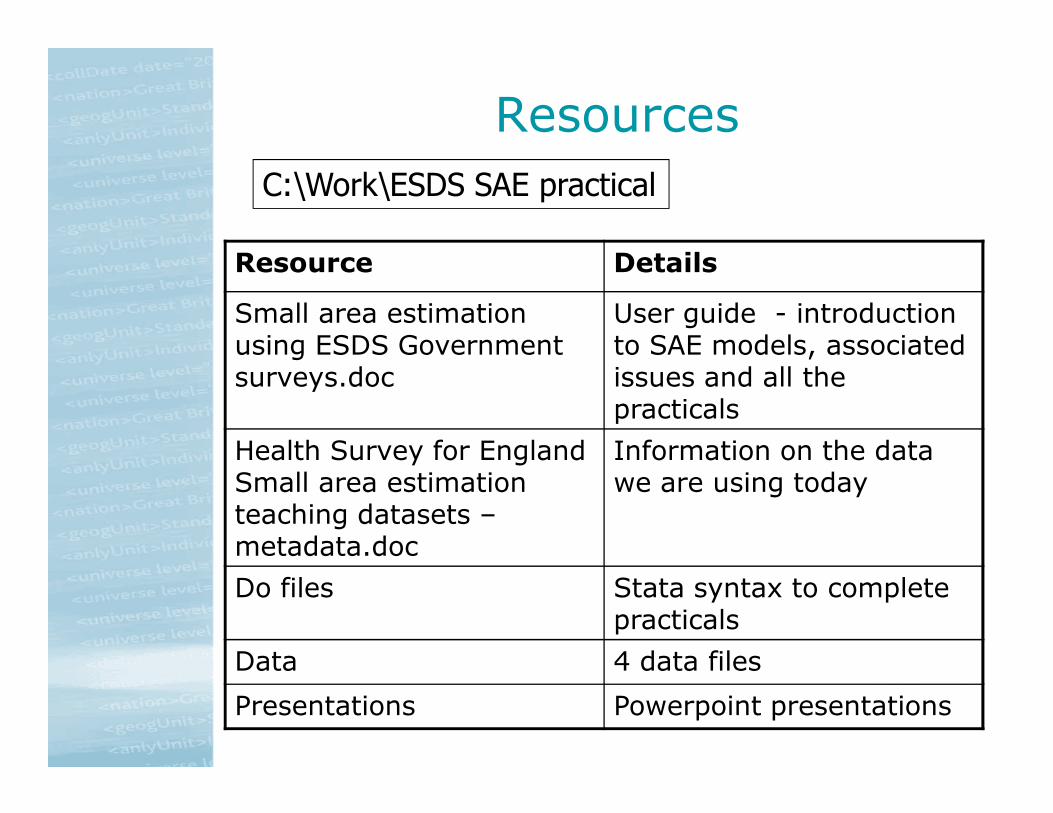
Resources
Resource Details
Small area estimation using ESDS Government surveys.doc
User guide - introduction to SAE models, associated issues and all the practicals
C:\Work\ESDS SAE practical
practicals
Health Survey for England Small area estimation teaching datasets –metadata.doc
Information on the data we are using today
Do files Stata syntax to complete practicals
Data 4 data files
Presentations Powerpoint presentations
ESDS Government • Supports major UK data series
– Large surveys conducted, usually by government
– Repeated cross-sections, often continuous
– Important, widely used microdata
• Joint service
– Team at UK Data Archive receive and archive data
– Team at Manchester deal with users
– Registration for the data managed by ESDS centrally
Role
• Promoting the use of the data
• Navigating users through the right materials
• Creating additional materials to help users • Creating additional materials to help users discover datasets and supporting materials
• Encouraging good practice
• Bridging the gap between data collector and users
Key supported datasets
• General Household Survey
• Labour Force Survey
• Health Survey for England/Wales/Scotland
• Family Expenditure Survey
• British/Scottish Crime Survey
• Family Resources Survey
• National Food Survey• National Food Survey
• Expenditure and Food Survey
• ONS Omnibus Survey
• Survey of English Housing
• British Social Attitudes
• National Travel Survey
• Time Use Survey
• Vital Statistics for England and Wales
This session
• Why do we need small area estimation techniques?
• General small area estimation strategy
• The Health Survey for England (HSE)
• The datasets we will use today
• Calculating rates of disability from microdata
• Practical

Why do we need small area population data?
• Detailed local information on the population of subnational areas (e.g. wards, districts) informs:
1. how resources are allocated between areas
2. the nature of local service provision
3. Identification of areas for specific area-based 3. Identification of areas for specific area-based policy interventions
4. The success of policies over time
• Equality: Local population information is important because the socio-demographic characteristics of subnational areas vary widely across the UK
Why do we need small area estimation techniques?
• Some data sources are reliably available for local areas
• But these are usually aggregate and lack detail (Census, administrative statistics, mid year estimates)estimates)
• ESDS Government survey data contain detailed information on individuals (or households)
• But survey data is either not available or is unreliable for subnational areas due to small sample sizes
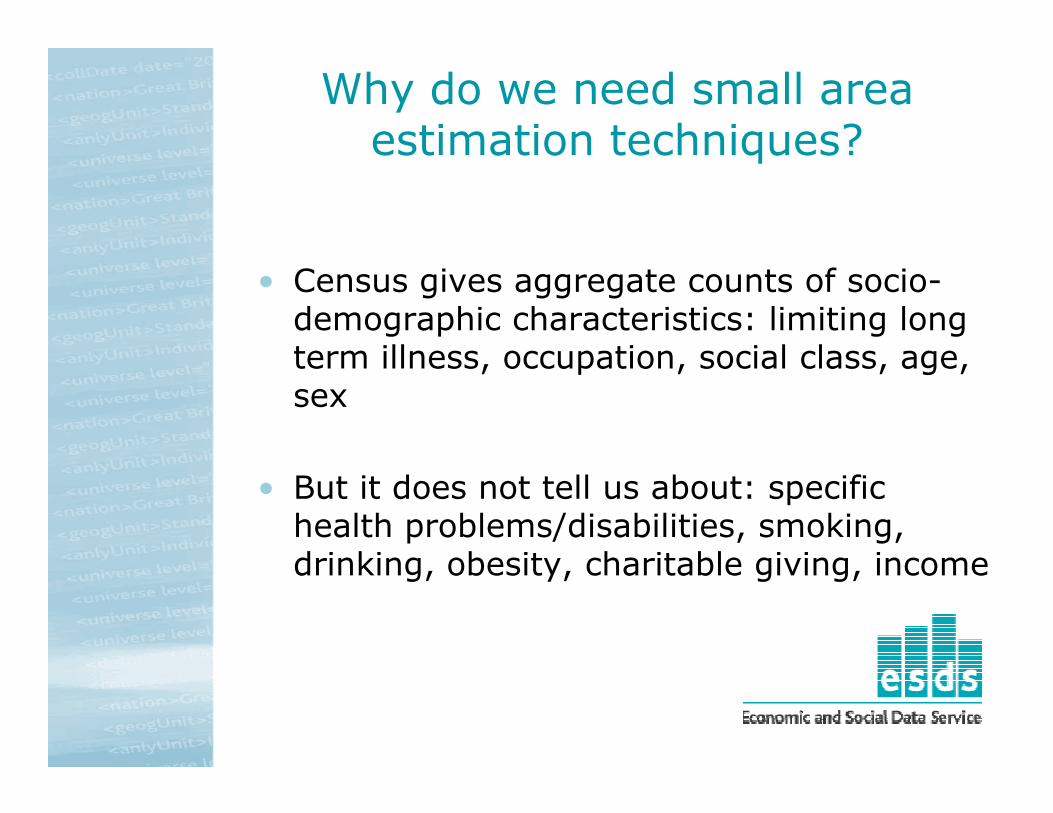
Why do we need small area estimation techniques?
• Census gives aggregate counts of socio-demographic characteristics: limiting long term illness, occupation, social class, age, sexsex
• But it does not tell us about: specific health problems/disabilities, smoking, drinking, obesity, charitable giving, income

General strategy
• Combine survey data (rich data detail but not geography) with aggregate data (detailed geography but lacking detailed data)
• Three techniques are introduced here to generate estimates of specific disabilities generate estimates of specific disabilities for six districts in the UK by combining Census and HSE data:
1. Curve fitting2. Relational models3. Synthetic regression

Small area estimation - disability
• We don’t know how many people have different disability types for districts
• Local estimates require statistical models
• Can derive local estimates using national age • Can derive local estimates using national age specific rates (HSE) and the local population age structure (Census)
BUT this does not account for the variation in local disability prevalence that remains after accounting for differing age structures

General strategy
• Disability is linked to characteristics other than age that are provided for local areas in the census
• E.g. LLTI increases the risk of having a personal care disabilitypersonal care disability
If two districts with same age structure
But one has higher level of LLTI
Then we would expect higher levels of personal care disability

Slide provided by Paul Norman – Leeds University
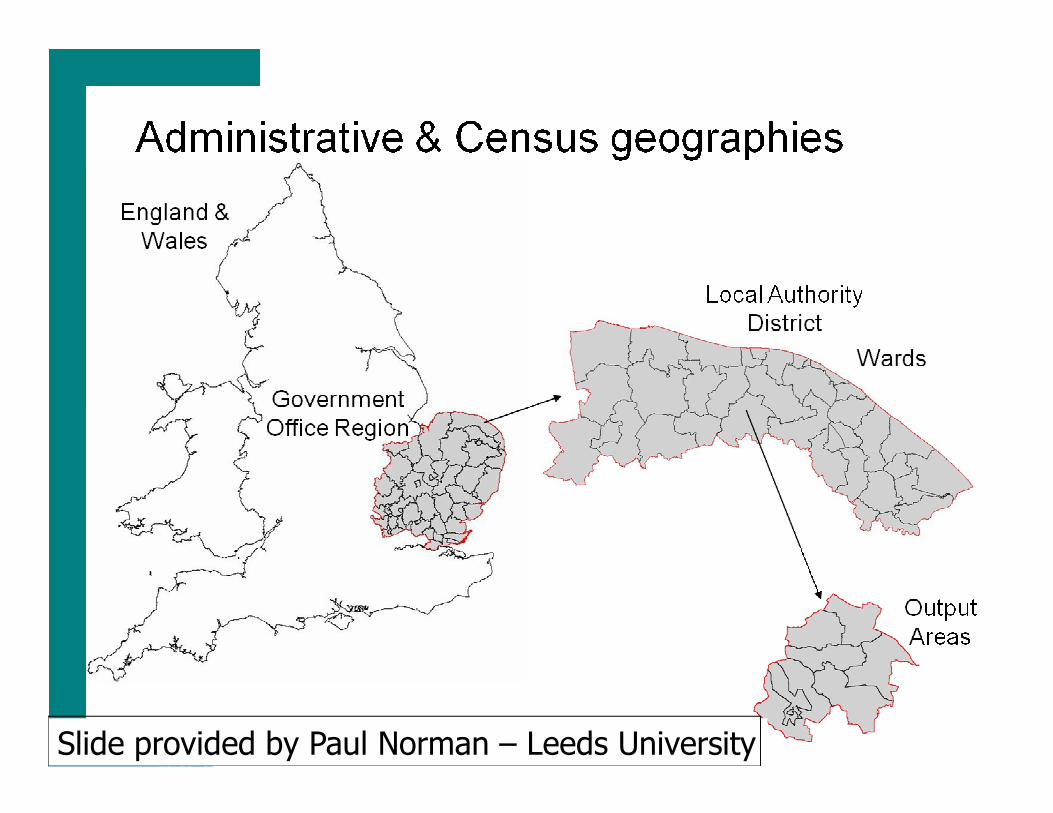
Slide provided by Paul Norman – Leeds University

Auxilliary information
Source Further details
Census Wide range of socio-demographic
Variables. Available from Nomis
Mid-year estimates Population counts by age and sex. Published by National Statistical agencies (ONS, GROS, NISRA)
Administrative statistics Benefit claimants, vital statistics, free school meals

The Health Survey for England

The Health Survey for England
• Commissioned by The NHS Information Centre for health and social care and conducted by NatCen and UCL
• Key indicators for health (used by govt)
• Annual since 1991 (children since 1995)
• Cross-sectional: snapshot data• Cross-sectional: snapshot data
• Sample data
• Computer-assisted personal interviewing (CAPI) & CASI face-to-face interview followed by a nurse visit for a clinical examination

Topics:
Core questions each year plus topic modules
Sample size, design and questionnaire vary to reflect topic e.g………..
2000 Older people, disability
The Health Survey for England
2000 Older people, disability2001 Disability2002 Children and young people2003 cardiovascular disease2004 ethnic minority groups2005 older people2006 cardiovascular disease2007 knowledge and attitudes2008 physical activity and fitness
Changes to Health and Social Care Survey in 2011

Disability in the HSEDisability Question (example) Severity scoring Locomotor What is the furthest you can walk on your own
without stopping and without discomfort? Only a few steps = 2 More than a few steps but less than 200 yards = 1 200 metres or more = 0
Personal Care
Can you get in and out of bed on your own? Only with someone to help =2 With some difficulty = 1 Without difficulty = 0
Sight Can you see well enough to recognise a friend at a distance of four metres (across a road)? If no can you recognise a friend at a distance of one metre (at arms
Cannot recognise a friend at one metre = 2 Can recognise a friend at recognise a friend at a distance of one metre (at arms
length)? Can recognise a friend at one metre but not at four metres = 1 Can recognise a friend at four metres = 0
Hearing Is your hearing good enough to follow a TV programme at a volume others find acceptable? If not, can you follow a TV programme with the volume turned up?
Cannot follow a TV programme even with the volume turned up = 2 Can follow a TV programme with the volume turned up = 1 Can follow a TV programme a normal volume = 0

Sample design
Sampling frame – Postcode address file
PSU – Postcodes
PSU’s stratified by LA and within LA by the % of hh with a non-manual head of household
Systematic sample of households drawn from eachselected postcode.
All adults in selected households interviewed. Up to 2 children aged 0-15 included in the survey
HSE 2000 includes a boost sample of older people in residential homes
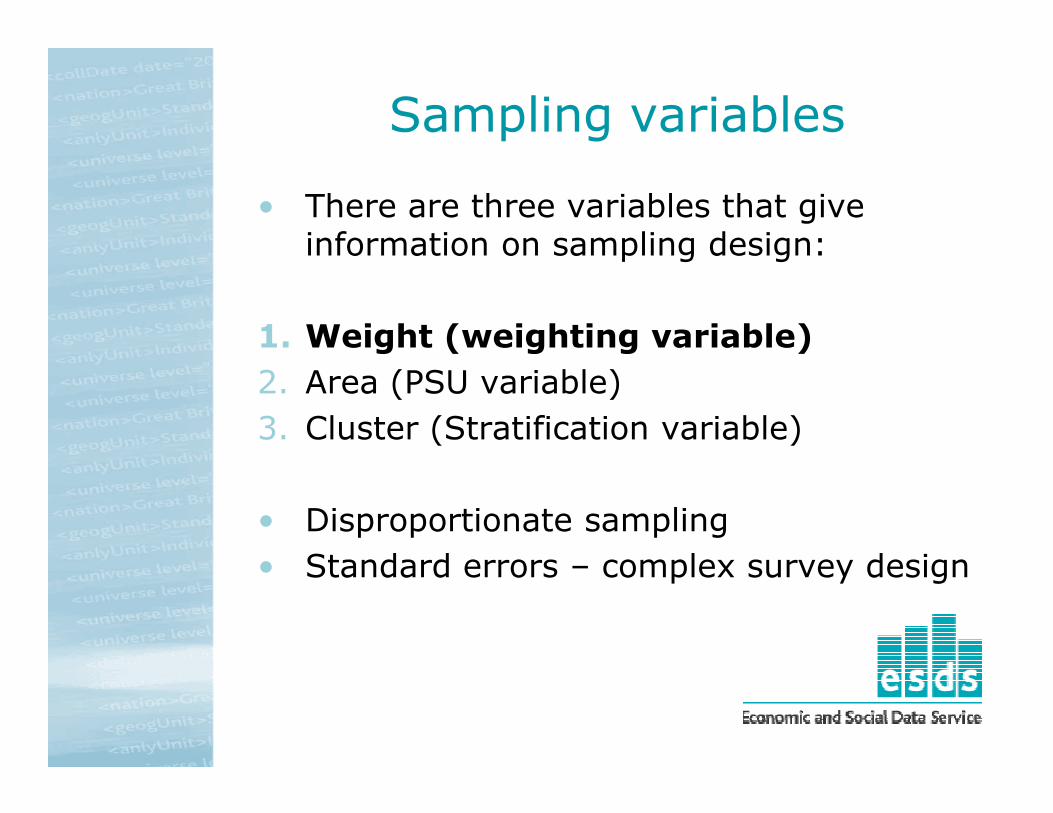
Sampling variables
• There are three variables that give information on sampling design:
1. Weight (weighting variable)
2. Area (PSU variable)
3. Cluster (Stratification variable)
• Disproportionate sampling
• Standard errors – complex survey design

HSE (2000/2001) dataset
• Sex
• Age
• Gora (government office region)
• Weight (account for
• Disab (overall disability)
• Pcare (personal care disability)
• Mobility (mobility • Weight (account for disproportionate sampling of children and older people)
• Year (survey year –2000 or 2001)
• Mobility (mobility disability)
• Sight (sight disability)
• LLTI (limiting long term illness)
For more information see the teaching datasets documents
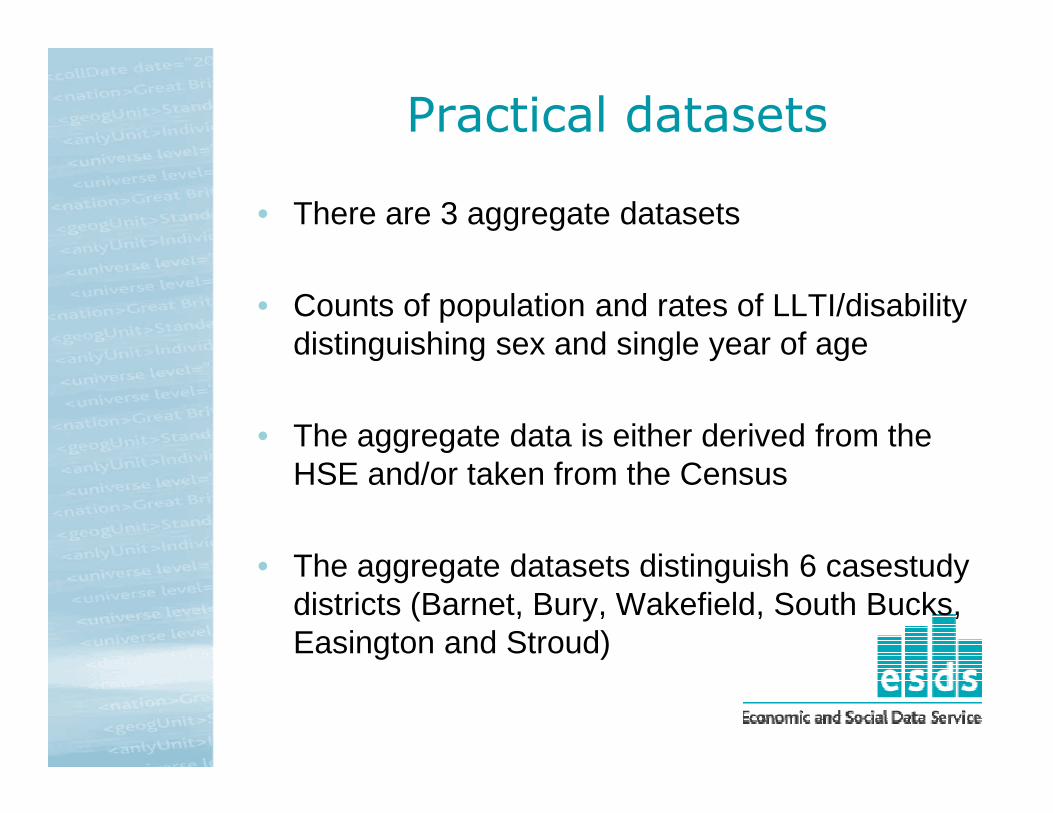
Practical datasets
• There are 3 aggregate datasets
• Counts of population and rates of LLTI/disability distinguishing sex and single year of age
• The aggregate data is either derived from the HSE and/or taken from the Census
• The aggregate datasets distinguish 6 casestudy districts (Barnet, Bury, Wakefield, South Bucks, Easington and Stroud)

Working through practicals
• All the practicals are in the user guide.
• Can copy syntax (bold) or use the do files (C:\ESDS SAE practical\Do files)(C:\ESDS SAE practical\Do files)
• Some explanation of the syntax is in the do files but the user guide contains more detailed instructions
• Additional tasks (italics)
Practical 1 (part 1)
• This practical (tasks 1-2 p27-33) demonstrates how to calculate rates of disability from HSE microdata (data on individuals)
• Calculate schedules of disability rates for • Calculate schedules of disability rates for England
• Valuable because we can multiply disability rates by local population counts to generate estimates of disability counts
• Discuss some of the key points of the practical
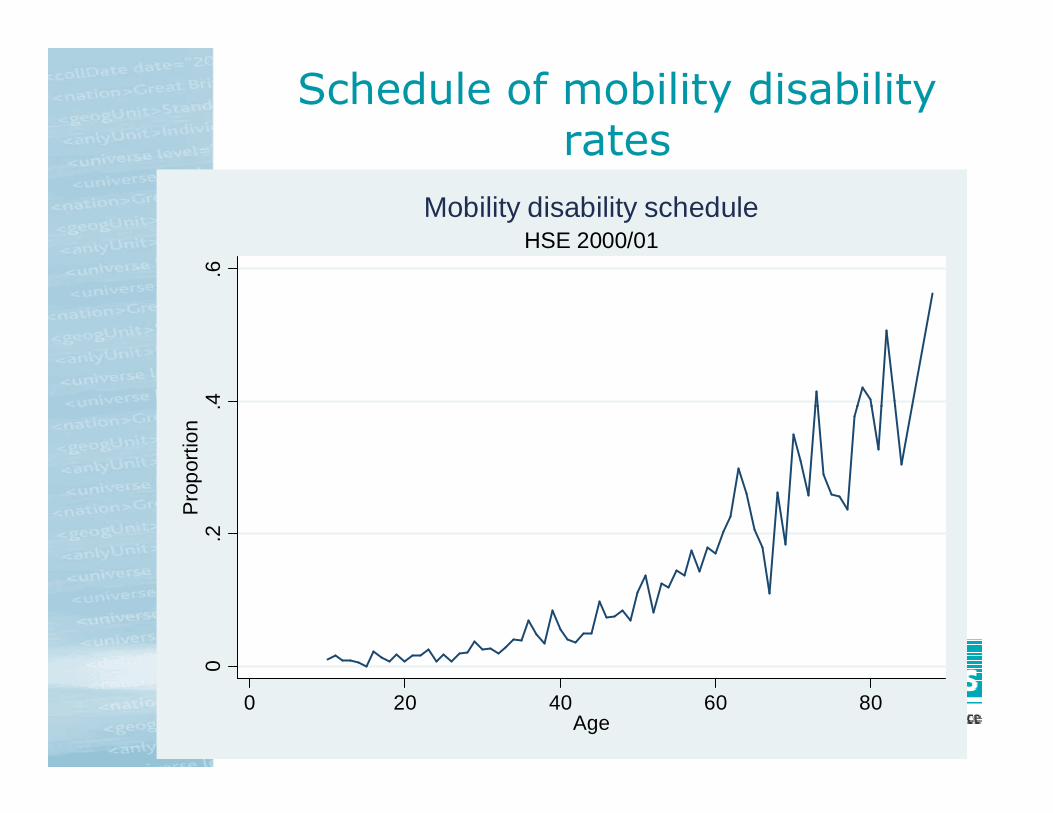
Schedule of mobility disability rates
.4.6
HSE 2000/01Mobility disability schedule
0.2
.4P
ropo
rtio
n
0 20 40 60 80Age
Calculating disability rates
• All types of disability are binary (0=no disability, 1=has disability)
• To estimate a rate of disability we calculate the mean of the disability variable:
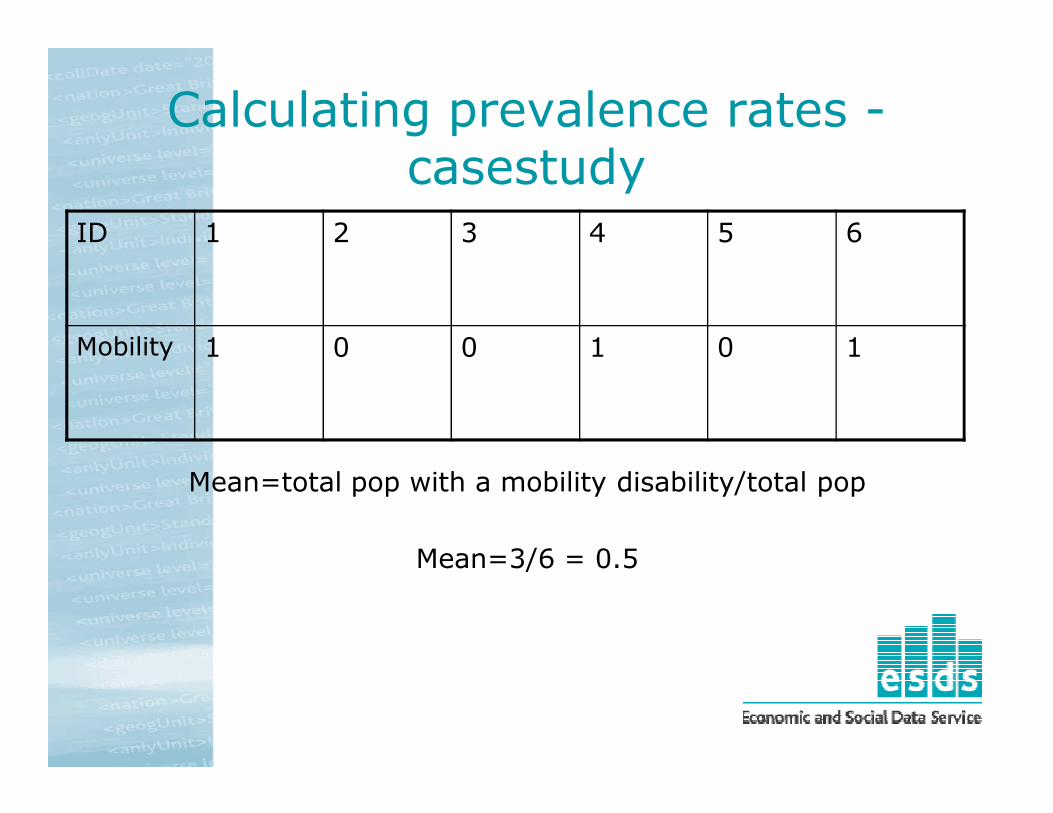
Calculating prevalence rates -casestudy
ID 1 2 3 4 5 6
Mobility 1 0 0 1 0 1
Mean=total pop with a mobility disability/total pop
Mean=3/6 = 0.5
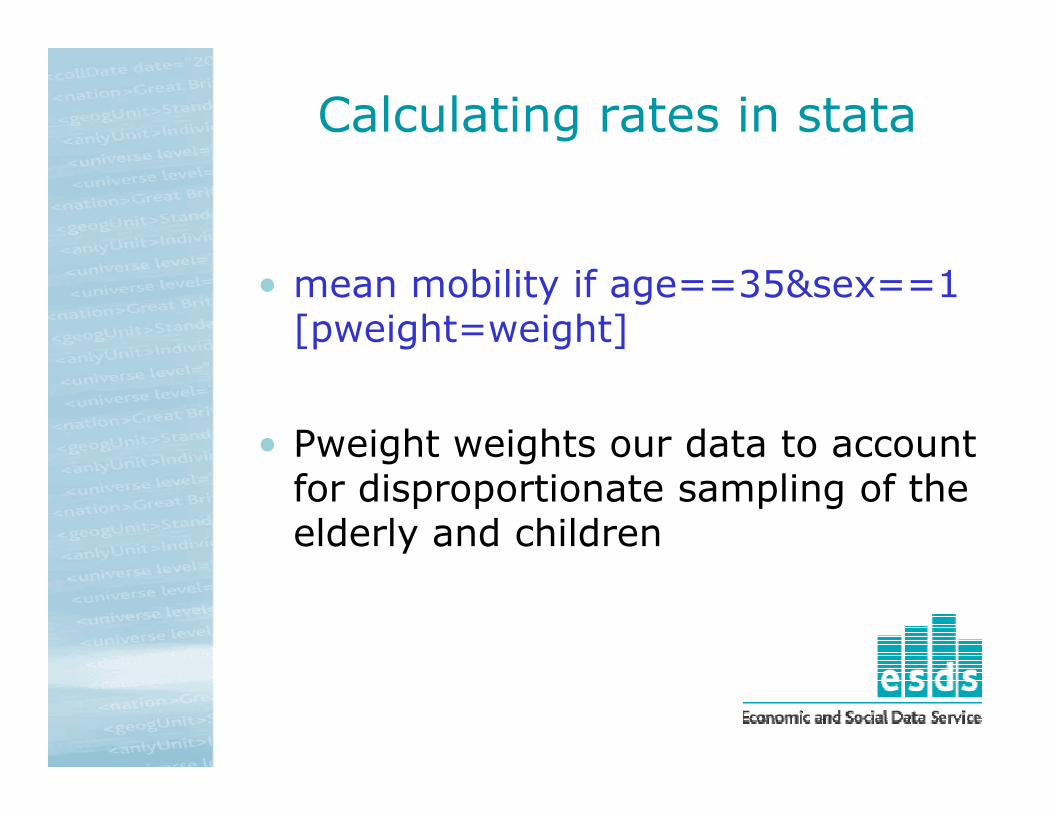
Calculating rates in stata
• mean mobility if age==35&sex==1 [pweight=weight]
• Pweight weights our data to account for disproportionate sampling of the elderly and children
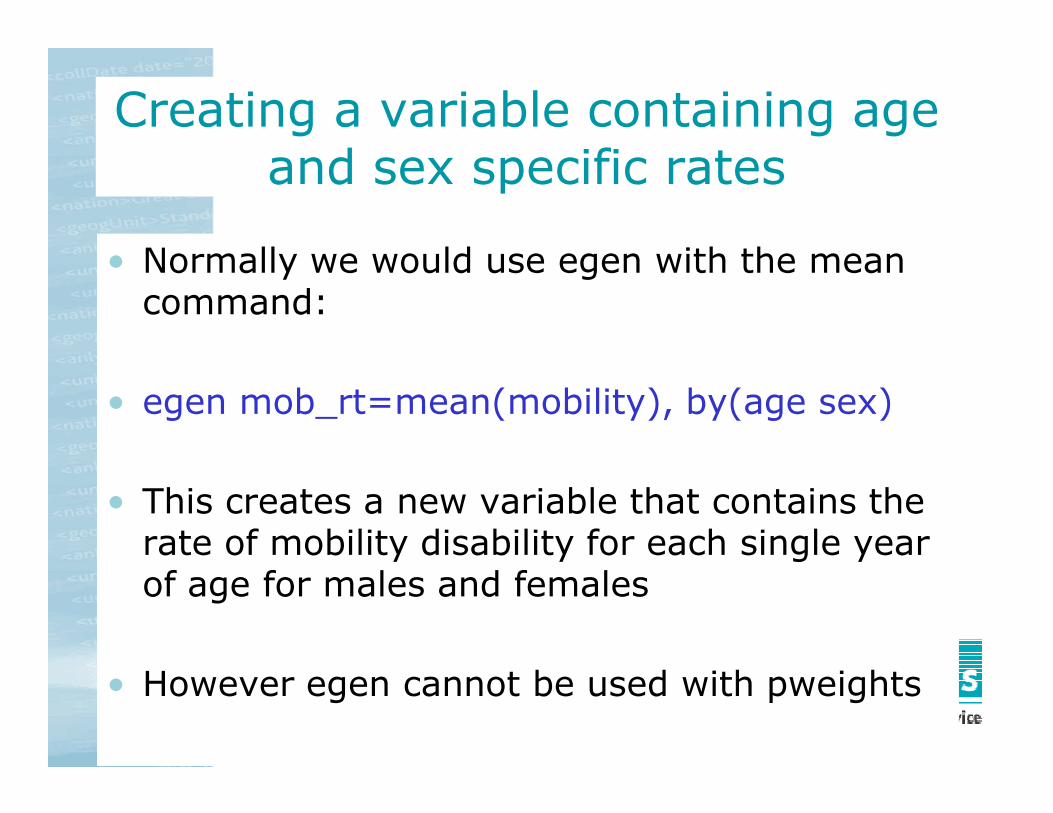
Creating a variable containing age and sex specific rates
• Normally we would use egen with the mean command:
• egen mob_rt=mean(mobility), by(age sex)• egen mob_rt=mean(mobility), by(age sex)
• This creates a new variable that contains the rate of mobility disability for each single year of age for males and females
• However egen cannot be used with pweights

Calculating weighted rates (without egen)
Disability Rate = Total with a disabilityTotal population
Weighted rate = Weighted total with a disabilityWeighted total populationWeighted total population
Weighted count = 1*weight
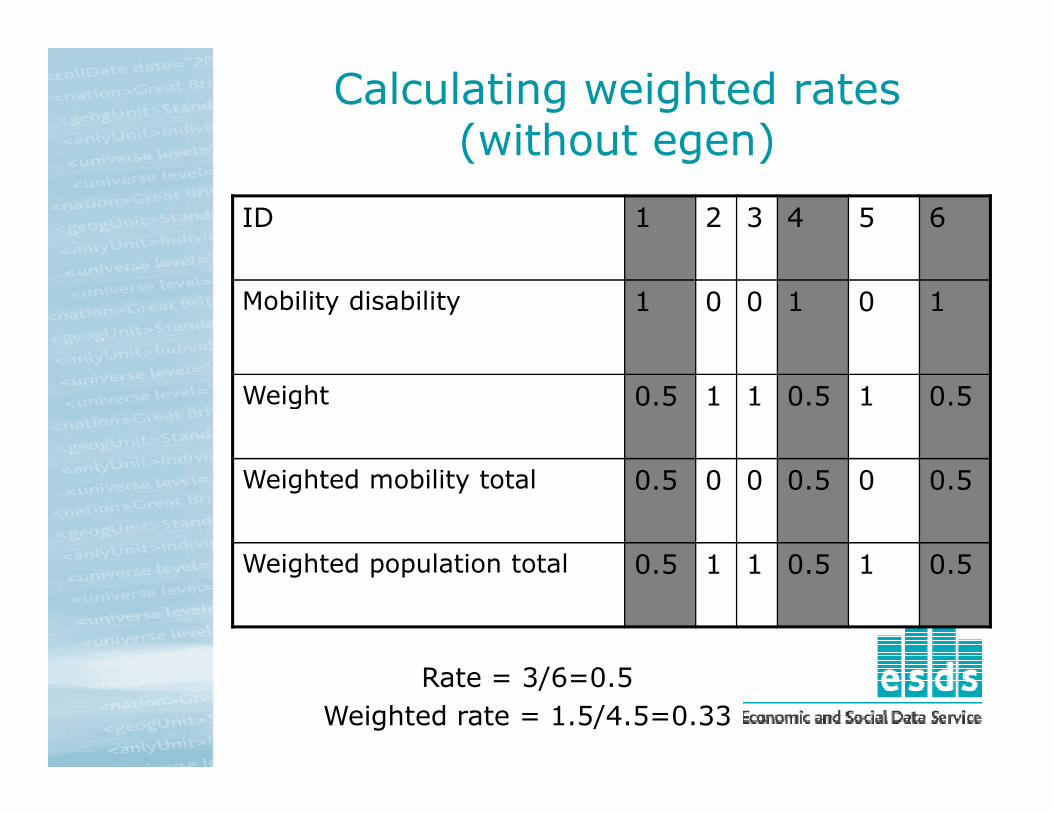
Calculating weighted rates (without egen)
ID 1 2 3 4 5 6
Mobility disability 1 0 0 1 0 1
Weight 0.5 1 1 0.5 1 0.5Weight 0.5 1 1 0.5 1 0.5
Weighted mobility total 0.5 0 0 0.5 0 0.5
Weighted population total 0.5 1 1 0.5 1 0.5
Rate = 3/6=0.5
Weighted rate = 1.5/4.5=0.33

Stata syntax – creating disability schedules
Create weighted counts:
• gen mobpop_wt=weight*mobility
• gen pop_wt=1*weight
Create age and sex specific population totalsCreate age and sex specific population totals
• egen mobtot=total(mobpop_wt), by (age sex)
• egen poptot=total(pop_wt), by (age sex)
Create age/sex specific rates:
• gen mob_rt=mobtot/poptot