Embed Size (px)
Citation preview

SESD Discussion Paper Series Article
Social and Environmental Systems Division, NIES
Evaluation of Carbon Abatement
Policies with Assistance to
Carbon-Intensive Industries in Japan
Azusa OKAGAWA
Kanemi BAN
September 2008
No. 2008-0001

Evaluation of Carbon Abatement Policies with Assistance to
Carbon-Intensive Industries in Japan
Azusa OKAGAWA
JSPS/National Institute for Environmental Studies
Kanemi BAN
Graduate School of Economics, Osaka University
Abstract
The Japanese government is obliged to immediately introduce a national CO2 abatement policy to comply
with the Kyoto Protocol. However, opposition from carbon-intensive industries would delay the
introduction of an abatement policy because it would place a large burden on them. Therefore, various
assistance programs to reduce the cost burden on carbon-intensive industries are required. However, such
programs may increase economy-wide abatement costs. In this paper, we focus on three forms of abatement
policies: carbon tax exemptions; the refund of carbon taxes; and grandfathering emission permits. By using
an original multi sectoral computable general equilibrium model of Japan, we investigate the possibility of
limiting the negative impacts on carbon-intensive industries and reducing the adverse effects on carbon
prices and social welfare. Our results indicate that assistance to carbon-intensive industries would raise
marginal abatement costs by between 45% and 66%. We suggest that granting grandfathering emission
permits is the most cost efficient and effective program for mitigating the effects on carbon-intensive
industries. In addition, our results imply that, relative to having 50% exemptions, implementing two
assistance programs under which economy-wide marginal CO2 abatement costs are equal is more efficient
and can substantially reduce the adverse impacts on the prices of carbon-intensive goods.
Key words: Carbon-intensive industries, carbon tax, emission trading, CGE model.
Acknowledgments:
We thank Dr. Hibiki at the National Institute for Environmental Studies for many comments. We also thank
Prof. Rob Dellink at Vrije Universiteit, Amsterdam, and the members of the Environmental Economics and
Natural Resources Group at Wageningen University for providing comments.
Address for correspondence:
Azusa OKAGAWA Email: [email protected]
National Institute for Environmental Studies, Onogawa 16-2, Tsukuba, Ibaraki 305-8506, Japan
This paper is a full version of Okagawa,A and Ban,K. (2008) “Tanso-Shuyaku-Sangyo no Futankeigen wo
TomonauKokunai-Haishutsu-Sakugen-Seisaku (Japanese Carbon Abatement Policies with Assistance to
Carbon-Intensive Industries)”, Planning Administration, 31-2, pp.72-78 and written for the purpose of
distribution to non-Japanese researchers.

概要
現在、京都議定書の遵守のための国内制度の整備が急がれている。費用効率的な排出削減を行
うための有効な政策手段として、炭素税や排出権取引制度などが検討されてきた。しかし、制度の
導入そのものは、産業界、とりわけ鉄鋼や電力の炭素集約産業の根強い反対によって先送りされ
てきた。炭素税や排出量取引制度は、CO2 排出に対して費用負担を求めることで排出削減を誘引
する制度であり、日本全体としての削減費用が最小となるような削減量の個別配分が達成されるも
のである。しかし問題は、CO2 排出に対して一律の費用負担を求めると、炭素集約産業に削減費
用負担が集中してしまうことにあり、このことが産業界の制度導入に反対する理由となっている。か
といって、こうした産業に対して税率軽減などの負担軽減措置を設定することは、日本全体として
の費用効率性を損ない、国民の負担増を招く可能性がある。そこで本稿では炭素集約産業への
負担軽減をともなう CO2排出削減制度の導入によって、日本全体としての排出削減費用や GDP、
個別産業の生産活動、家計の消費活動にどのような影響が及ぶのかを、CGE モデルによって定
量的に示した。検討対象とする制度は、炭素税率の差別化・炭素税の負担に応じた還付・無償配
布型の排出量取引制度の3種類とした。分析の結果から、炭素集約産業への負担軽減をともなう
措置によって、全体としての限界削減費用は45-60%程度増加することが示された。また、炭素
集約産業への負担軽減の効果が大きく、費用効率的な削減制度は、無償配布型の排出量取引制
度であることが示された。炭素集約産業に対し50%の炭素税率軽減を行う炭素税制度に比べて、
無償配布型排出量取引制度下で削減費用が抑えられる理由は、限界削減費用が均等化されて
いることにあると考えられる。
注)本稿は、同著者による『炭素集約産業の負担軽減をともなう国内排出削減政策』(計画行政,
第 31巻 2号, pp.72-78, 2008年)のフルバージョンの論文であり、非日本人研究者への配布を目
的とするものである。

1
1. Introduction
The first period of the Kyoto Protocol begins in 2008. However, as yet, Japan has no policy for
meeting its Kyoto targets. Implementing a CO2 abatement policy is difficult because of strong
opposition from Nippon Keidanren (the Japan Business Federation). This is because a CO2
abatement policy will increase their production costs, particularly for carbon-intensive industries.
Table 1 shows the effects of abatement policy on the Japanese economy predicted by a number of
models. This table shows that the CO2 reductions required to meet the Kyoto target would cost the
Japanese economy between 5,300 and 45,000 yen per ton of carbon (t-C). These abatement costs
would mainly be borne by large emitters such as the electricity, transport, iron and steel and clay
industries, as is shown in Figure 1. Therefore, it will be difficult to get these industries to support a
CO2 abatement policy.
Nippon Keidanren has a great deal of political power, and carbon-intensive industries have a big
influence within this federation. The group published the Voluntary Action Plan on the Environment
in 1997.1 Under this plan, industries set their respective achievable environmental targets for
reductions of emission amounts, levels of environmental investment, carbon intensity levels, and so
on. The group‟s own assessment of its plan indicates that industries have succeeded in achieving
their environmental targets. 2
However, the problem is that their original targets, even if fulfilled,
are not sufficient to achieve Japan‟s Kyoto target. Moreover, the industries have adopted their own
approaches to reducing CO2 emissions instead of adopting government controls. Hence, they
developed their own plan before the government developed its emission abatement policies.
Although their efforts should be commended and their achievements acknowledged, their actions are
a diversion and hinder the introduction of an emissions reduction policy in Japan.
Therefore, given the desirability of a CO2 abatement policy, it is necessary for the Japanese
government to design a policy that at least mitigates the negative impacts on carbon-intensive
industries. It is suggested that if assistance programs for carbon-intensive industries, such as
1 Nippon Keidanren (1997).
2 Nippon Keidanren (2006).

2
exemptions and the refund of carbon taxes, were introduced, a CO2 abatement policy could be
implemented immediately. These programs may increase economy-wide abatement costs because
assisting carbon-intensive industries increases the burden on other industries and incurs more
welfare costs than would the introduction of a uniform carbon tax. However, such programs may be
reasonable because workers in carbon-intensive industries have the right to be protected from salary
cuts and unemployment, for example. The best and fairest way for Japan to achieve the Kyoto target
would be to implement a uniform carbon tax or to auction emission permits. However, considering
the distribution of emission abatement costs among agents, it would be difficult to identify what is
fair for whom, particularly in the short term. This is the motivation for our research. Our main
purpose is to determine the additional costs of assistance programs. In this way, given time to adapt
over the long term, assisted industries could be persuaded to support abatement programs that are
more cost effective than those implemented as a first step.
There are few quantitative studies of the effect of assistance programs for carbon-intensive
industries in Japan. However, many studies have been conducted for European countries and the U.S.
Boehringer and Rutherford (1996) analyze carbon tax exemptions for energy intensive industries and
export industries in Germany. They conclude that tax exemptions limit the range of emission
abatement and raise marginal abatement costs in the German economy. Jensen (1998) quantifies the
distortions caused by tax exemptions and the initial allocation of emission permits, which amounts to
a production subsidy, by using a computable general equilibrium (CGE) model of the Danish
economy. For tax exemptions, he shows that a 20% abatement target causes a welfare loss of 1.9%.
He also shows that marginal abatement costs are lower under tax exemptions. However, distortions
are more significant under tax exemptions than under free allocation of emission permits based on
past emission levels (grandfathering). Jensen and Rasmussen (2000) analyze the effects of the initial
allocation of emission permits and the recycling of permit revenues. They find that the free
allocation of permits raises wages, which increases total production costs. By using a CGE model of
the U.S., Goulder (2002) analyzes compensation and the effects of recycling carbon tax revenue. He

3
Table 1. The Effects of CO2 Abatement Policy Predicted by Existing Studies
* Abatement by 1990 level in 2008; ** % change from the business-as-usual case; *** 1US$ = 120 yen.
Note: All results except those of Park (2002) are based on normal carbon taxes. Park (2002) shows results
for labor tax reductions.
Abatement rate
(%) *
Carbon price
(Yen/t-C)
GDP (%)** Model
Okagawa and Hamasaki (2005) 22 13,212*** –0.36 GTAP–E
Our study 13 18,722 –1.71 yet unnamed
20 35,431 –1.28 yet unnamed
Ministry of Environment (2001)
AIM Enduse 17 30,000 NA AIM Enduse
GDMEEM 18 34,560 –0.72 GDMEEM
MARIA 20 13,148 –0.40 MARIA
SGM 21 20,424 –0.30 SGM
AIM/Material 17 15,587 –0.54 AIM/Material
Ministry of Environment (2003) 10 45,000 –0.16 AIM Enduse
Park (2002) 20 14,100 –1.00 yet unnamed
Park (2004) 16 5,332*** –0.33 GTAP–E
Washida (2004) 14 20,000 NA EPAM
Hamasaki and Truong (2000) 22 9,012*** NA GTAP–E


5
granting 50% exemptions. This is consistent with the results of previous studies. However, in the
case of carbon tax refunds, social welfare costs and the rate of carbon tax required to achieve the
Kyoto target are relatively sensitive to the abatement rate and the parameters of our model. This is
because carbon tax refunds generate large distortions.
In Section 2, we describe three policies that provide assistance to carbon-intensive industries. In
Section 3, we provide an overview of our CGE model. In Section 4, we describe simulation
scenarios and report our results. In the final section, we offer concluding remarks.
2. Assistance programs
The objective of Japan‟s CO2 abatement policy is to reduce CO2 emissions to 2.1% below the
1990 level to meet the Kyoto target. We focus on two types of assistance program. The first type
involves using the scarcity rent caused by emission constraints. The second grants exemptions from
carbon tax.
2.1 Using the scarcity rent
Total emissions are given by equation (1) below. The relationship between CO2 emissions and
the price of emissions is represented by a complementarity problem, which is given by equation (2).
In these expressions, CO2, 2CO , and PCO2 denote CO2 emissions, the target for CO2 emission
reductions, and the shadow price of the constraint on CO2 emissions, which represents the carbon
price, respectively.
)government(CO)household(CO)industry(COCOindustry
2222 (1)
0222 )COCO(PCO


7
of PCO2 per additional unit of CO2 emissions. Under this policy, energy intensive industries bear a
uniform marginal cost of PCO2, and receive assistance through the allocation of the scarcity rent.3
We analyze two examples of this type of program below.4
(1) The refund of carbon tax
The government imposes a uniform carbon tax on all agents, and refunds it to particular
industries. Under this policy, all firms have the same incentive to substitute less carbon-intensive
fuels for carbon-intensive fuels because all firms pay the same carbon price.
(2) Grandfathering
The government introduces an emission trading system and grants to carbon-intensive industries
emission permits in proportion to their emissions shares in the benchmark year. This means that
industries receive scarcity rents at no cost through the initial permit allocation. Under this policy, all
firms have the same incentive to reduce emissions. This is because the allocated permits are tradable
at the market price.
2.2 Tax exemptions
Carbon tax exemption (or reducing the carbon tax rate) is another effective way of assisting
energy intensive industries. The mechanism underlying this policy differs from those described
above. Under this policy, energy intensive industries pay a lower carbon tax rate than do other
industries. Therefore, to meet a given target, nonexempted industries (NEIs) bear a greater tax
burden than do exempted industries (EIs) in terms of the marginal costs of additional emissions. The
3 However, the issue of how the government secures revenue sources for subsidies is controversial.
4 Although subsidies are an important source of assistance to energy intensive industries, we ignore
this policy in this paper for two reasons. First, carbon tax or emission trading is considered to be the
main way of achieving the Kyoto target; the subsidy system is supplementary. It is difficult to secure
revenue from subsidies to reduce CO2 emissions sufficiently. Second, it is difficult to deal with
subsidies in our top-down CGE model.

8
relationship between CO2 emissions and their prices for exempted and nonexempted industries are
represented by the complementarity problems expressed by equations (3) and (4) below.
0222 )COCO(P EEE
CO
00
00
2
2
22
22
ECO
EE
ECO
EE
PCOCO
PCOCO (3)
0222 )COCO(P NENENE
CO
00
00
2
2
22
22
NECO
NENE
NECO
NENE
PCOCO
PCOCO (4)
222 COCOCO NEE (5)
Under this policy, some industries pay lower carbon tax rates than do other industries. To achieve
the 13% abatement target met by the aggregate economy, nonexempted agents must generate greater
abatement because emission reductions by energy intensive industries are relatively small. Hence,
the program introduces a distortion.
When simulating the free allocation of emission permits in a CGE model, one must incorporate
the scarcity rent into the appropriate part of the model. For example, Goulder (2002) considers the
free allocation of emission permits to be equivalent to granting tax exemptions. Jensen and
Rasmussen (2000) consider the grandfathering policy to be equivalent to making lump-sum transfers
to households (who own firms) because, in their dynamic framework, future behavior does not affect
permit allocations.
Following Jensen (1998), we deal with free allocations of emission permits by using output
subsidies differentiated between industries in our CGE model. We do this for two reasons. First, the
carbon price is unique when there is a free allocation of permits under grandfathering, but not when
there are exemptions. Second, free allocations would reduce average production costs in each

9
industry, and we cannot identify the owners of energy intensive firms because there is only one
representative household in our model.
Thus, the grandfathering policy is similar to the carbon tax refund policy. Industries have
incentives to increase their output levels to obtain higher scarcity rents under both policies.5
However, under the grandfathering policy, incentives to increase output levels are restricted by the
benchmark emissions. When there are tax refunds, incentives are less limited. Thus, some industries
could get as much output subsidy as they wish. Hence, carbon tax refunds are more likely to induce
distortions.
3. The model
3.1 The model structure
In this section, we provide an overview of our static CGE model. The model is developed for
convenience, bit incorporates energy substitutions. The three agents in the model are industries, the
representative household, and the government.
3.1.1 Production
Industries produce goods and services by using primary factors and intermediate inputs. Production
processes exhibit constant returns to scale and are represented by nested CES functions following the
GREEN model.6 Our model incorporates energy substitutions. Figures 2 and 3 show the nesting
structures for the production of all goods. Table 2 shows the elasticities of substitution. Firms select
each input level to minimize the production cost given the output level. The goods and services
produced by domestic industries are purchased as intermediate inputs by industries and as final
goods by the household, the government, and foreign countries. We aggregated the input–output
table to 33 industries. There are seven energy industries and 26 nonenergy industries.
5 This topic is discussed by Fischer and Fox (2004).
6 OECD (1994).


11
3.1.2 The household
As shown in Figure 4, the representative household has a Cobb–Douglas utility function that
implies a trade-off between leisure and consumption. The household owns factors of production, and
uses its factor income to purchase goods and services from domestic industries and foreign countries
to maximize utility. The 12 hours of the day not spent working constitutes leisure. The price of
leisure is defined as the opportunity cost of labor supply. Household savings are exogenous.
3.1.3 The government
The government collects labor taxes, capital taxes, excise taxes, import taxes, and carbon taxes
from industries and the household. The government purchases goods and services to maximize a
Cobb–Douglas utility function. Government savings are exogenous.
3.1.4 Factor markets
Primary factors include labor and capital, which are used in conjunction with energy goods and
nonenergy intermediate goods to produce domestic goods. Having been determined by a choice
between labor and leisure, labor supply depends on real wages. The level of capital is constant and
the rate of return on capital is endogenous. We assume that both labor and capital markets are
perfectly competitive, and that both factors are perfectly mobile between sectors.
3.1.5 International trade
Our model is an open economy model. Imports and exports are endogenously determined by
domestic goods and services prices relative to world prices. Foreign countries are treated as one
region termed the „rest of the world. World goods and services prices are constant. We use the
Armington assumption for explaining trade in identical goods and services.7 This means that
domestic goods and foreign goods are imperfect substitutes. The exchange rate adjusts to balance the
current account.
7 Armington (1969)

12
Figure 4. The Production Structure
Sigmas stand for substitution elasticities between inputs.
Figure 5. The Production Structure (Energy Composite)
ELE
Energy composite
Coal Coal
Products
CO2 CO2
σ ELFOS
σ FOS
Gas
distribution
Natural
gas
CO2
0 0
σ FP
Oil
products
Oil CO2CO2 CO2
σ FP σ FP
0 0 0 0
ELE
Energy composite
Coal Coal
Products
CO2 CO2
σ ELFOS
σ FOS
Gas
distribution
Natural
gas
CO2
0 0
σ FP
Oil
products
Oil CO2CO2 CO2
σ FP σ FP
0 0 0 0
Sigmas stand for substitution elasticities between inputs.

13
Figure 6. Household Welfare Functions
Utility
σ PRIV
Goods and services Leisure
Sigmas stand for substitution elasticities between goods and services.
3.1.6 CO2 abatement and marginal abatement costs
As shown in Figure 3, we assume that CO2 emissions are proportional to fossil fuel inputs in each
industry. This means that demand for fossil fuels is synonymous with demand for CO2 emissions. By
restricting CO2 emissions, the household, industries, and the government incur emission costs when
using fossil fuel inputs. These additional emission costs are collected by the government in the form
of carbon tax revenues.
In our model, CO2 abatement is essentially achieved through three types of substitution.8 When the
introduction of a carbon tax raises energy costs, agents substitute less CO2 intensive fuels, such as
natural gas, for CO2 intensive fuels such as coal. (This represents interfuel substitution.) Agents also
substitute energy-composites goods for capital and labor. (This represents interfactor substitution.)
Depending on CO2 intensity, rises in the relative prices of CO2 intensive goods and services lower
the relative demand for CO2 intensive goods. (This represents intergoods substitution.)
3.2 The software and database
We constructed our model by using GAMS/MPSGE. The database used is the input–output table
for 2000,9 which is the most recent one. To calculate the CO2 emissions coefficient, we used the
Energy Balance table and „Energy and the GHGs Emissions Data of Japan‟.10, 11
8 If it is impossible to reduce CO2 sufficiently by using substitutions, the economy would contract.
9 Ministry of Internal Affairs and Communications. 2000 Input-Output Tables for Japan

14
Japan‟s Kyoto target is to reduce CO2 emissions to 2.1% below the 1990 level, taking into account
carbon sinks. According to „Outlook on Energy Demand and Supply in 2030‟, Japan‟s total CO2
emissions were 286 million t-C in 1990,12
and are expected to increase by 322 million t-C in 2010.
This implies that Japan has to reduce CO2 emissions to 13% below the 2010 level.
Table 3. Elasticities of Substitution
Index Notes
KEL–M 0.0 –
M 0.2 –
KE–L 0.8 –
K–E 0.2 0.1 in Electricity, Clay, Iron and steel, Transport
EL–FOS 0.2 0.1 in Clay, Iron and steel, Transport
FOS 0.5 0.1 in Electricity, Clay, Iron and steel, Transport
F–P 0.0 –
PRIV 1.0 (Cobb–Douglas utility function of the household)
DM 0.4 0.1 between fossil fuels (Armington)
10
Agency for Natural Resources and Energy. 11
National Institute for Environmental Studies. 12
Agency for Natural Resources and Energy (2005).

15
4. Scenarios and results
4.1 Simulation scenarios
The objective on which of all the simulations are based is to reduce emissions by 13% to meet
the Kyoto target. The government puts carbon tax on the combustion of all fossil fuels in proportion
to their carbon content. We simulated four different policy experiments to analyze the policies
outlined in Section 2.
4.1.1 Lump-sum transfers to households
Under this scenario, there is no assistance case to carbon-intensive industries, and thus it is the
reference case. The government puts a uniform carbon tax on all industries and households. Carbon
tax revenues are transferred to households in the form of a lump sum. The carbon tax raises marginal
production costs and output prices relative to household income. However, under this policy,
private-sector demand might not fall significantly.
4.1.2 Government revenue
The government puts a uniform carbon tax on all industries and households, and spends the
revenues on government consumption. In this case, there is no assistance.
4.1.3 Fifty percent exemptions
The government differentiates carbon taxes between industries. The tax rate imposed on the six
carbon-intensive industries is half that of the rate imposed on other industries and households. This
is done to assist carbon-intensive industries. This means that carbon-intensive industries have less of
an incentive to lower emissions.
The top six carbon-intensive industries to receive assistance are chosen as those whose output
prices increased considerably (by between 1% and 14%) following the transfer of lump-sum
payments to households, according to the results from the first simulation. These are: electricity;

16
recycling; iron and steel; coal production; clay; and transportation.13
These six industries combined
produce 70% of Japan‟s emissions.
4.1.4 Refund of carbon tax
In our model, the government collects a uniform carbon tax from all agents, and refunds it to the
six carbon-intensive industries listed in Table 2 in the form of an output subsidy. This program
generates two inverse incentives for the six industries; one incentive is to reduce emissions by using
carbon pricing, and the second is to increase output levels and, therefore, emissions through
subsidies.
4.1.5 Grandfathering
Under this policy, the government grants emission permits to the six carbon-intensive industries
based on their CO2 emission shares in 2000. Permits representing 97% of the 1990 emission level
are granted. In our model, each industry receives an emission permit equal to the value of its output
subsidy. This program also provides two inverse incentives for the six industries. However, each
industry‟s incentive to increase output and emissions is limited by its past share of CO2 emissions.
4.2 Simulation results
When there is assistance, carbon prices are higher than when there is not. These qualitative
results are the same as those from previous studies (see Table 4). In the 50% exemption case,
nonexempted industries reduce emissions by more than do exempted industries, whose marginal
abatement costs are lower. This is why carbon prices are higher when there are 50% exemptions.
Under tax refunds and grandfathering, industries do not reduce their output levels (see Figure 8).
Thus, increased demand for emissions increases the carbon tax rate. Factor prices fall except under
tax refunds and grandfathering. In these two cases, carbon-intensive industries substitute
energy-capital composite goods for labor. This result is similar to that of Jensen and Rasmussen
(2000).
13
In Japan, the share of coal-fired electricity is high.
17
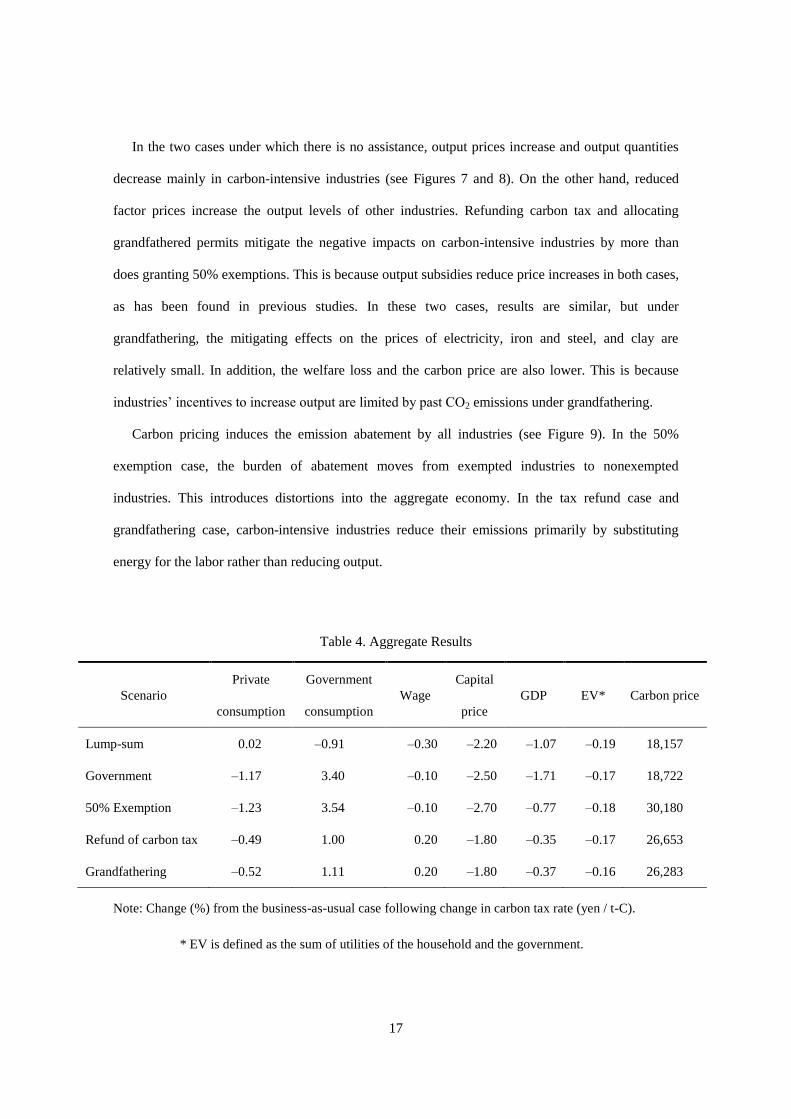
In the two cases under which there is no assistance, output prices increase and output quantities
decrease mainly in carbon-intensive industries (see Figures 7 and 8). On the other hand, reduced
factor prices increase the output levels of other industries. Refunding carbon tax and allocating
grandfathered permits mitigate the negative impacts on carbon-intensive industries by more than
does granting 50% exemptions. This is because output subsidies reduce price increases in both cases,
as has been found in previous studies. In these two cases, results are similar, but under
grandfathering, the mitigating effects on the prices of electricity, iron and steel, and clay are
relatively small. In addition, the welfare loss and the carbon price are also lower. This is because
industries‟ incentives to increase output are limited by past CO2 emissions under grandfathering.
Carbon pricing induces the emission abatement by all industries (see Figure 9). In the 50%
exemption case, the burden of abatement moves from exempted industries to nonexempted
industries. This introduces distortions into the aggregate economy. In the tax refund case and
grandfathering case, carbon-intensive industries reduce their emissions primarily by substituting
energy for the labor rather than reducing output.
Table 4. Aggregate Results
Scenario
Private
consumption
Government
consumption
Wage
Capital
price
GDP EV* Carbon price
Lump-sum 0.02 –0.91 –0.30 –2.20 –1.07 –0.19 18,157
Government –1.17 3.40 –0.10 –2.50 –1.71 –0.17 18,722
50% Exemption –1.23 3.54 –0.10 –2.70 –0.77 –0.18 30,180
Refund of carbon tax –0.49 1.00 0.20 –1.80 –0.35 –0.17 26,653
Grandfathering –0.52 1.11 0.20 –1.80 –0.37 –0.16 26,283
Note: Change (%) from the business-as-usual case following change in carbon tax rate (yen / t-C).
* EV is defined as the sum of utilities of the household and the government.

18
Figure 7. Output Price
-2
0
2
4
6
8
10
12
Electricity Iron and
steel
Clay Trans Chemicals Machinery Electrical
machinery
Transport
equipment
Construction
%
Lump-sum Government 50% Exemption Refund Grandfathering
Note: Change (%) from the business-as-usual case.
Figure 8. Quantity of Output
-7
-6
-5
-4
-3
-2
-1
0
1
2
Electricity
Iron and
steel Clay Trans Chemicals Machinery
Electrical
machinery
Transport
equipmentConstruction
%
Lump-sum Government 50% Exemption Refund Grandfathering

19
Figure 9. CO2 Emissions
-25
-20
-15
-10
-5
0
Electricity
Iron and
steel Clay Trans Chemicals Machinery
Electrical
machinery
Transport
equipmentConstruction
%
Lump-sum Government 50% Exemption Refund Grandfathering
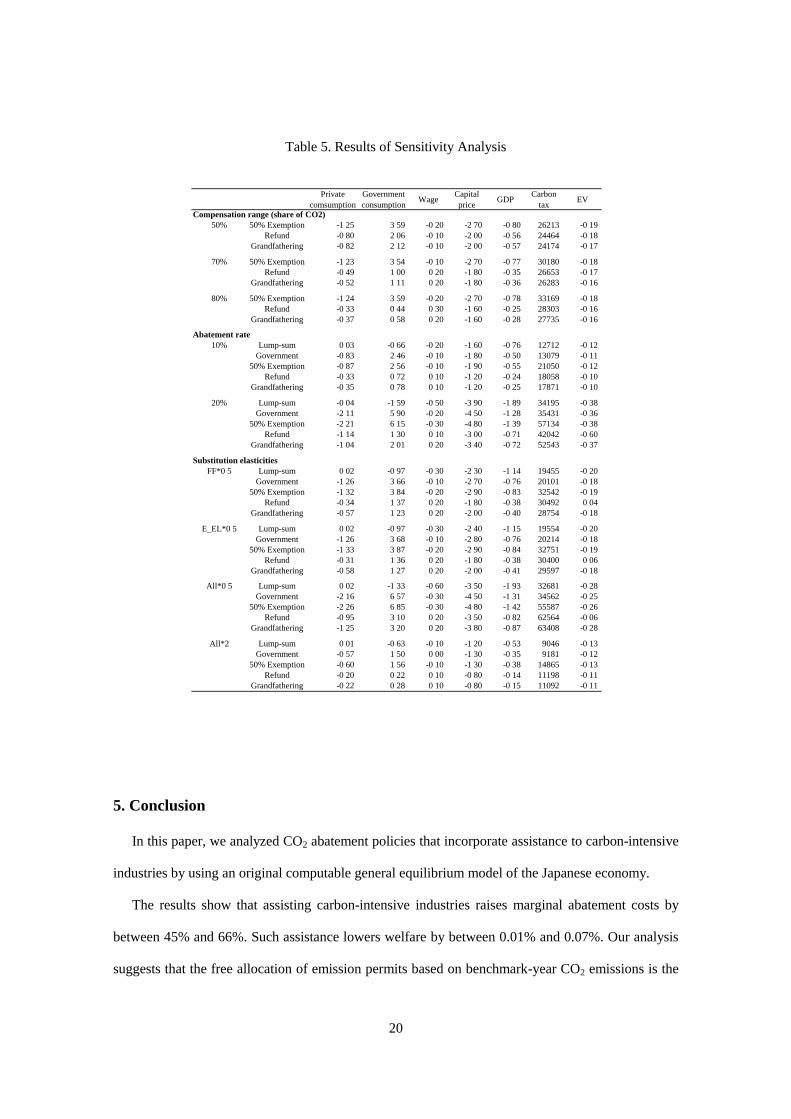
4.3 Sensitivity analysis
Table 5 shows the results of sensitivity analysis. We investigated the range of compensation, the
abatement rate of CO2 emissions, and substitution elasticities between productive factors and
intermediate goods. An expansion of the compensation range improves welfare by raising carbon tax
revenue. The stricter is the abatement target, the greater is the difference between the refund of
carbon tax and grandfathering. Carbon tax refunds can increase distortions in relative prices. A
reduction in substitutability between fossil fuels and electricity-based energy raises carbon prices,
but improves welfare when there are carbon tax refunds. The effect of refunding carbon tax is
sensitive to the CO2 abatement target and to the degree of substitutability between energy-related
production factors. This is because there are two inverse incentives.
20
Table 5. Results of Sensitivity Analysis
Private
comsumption
Government
consumptionWage
Capital
priceGDP
Carbon
taxEV
Compensation range (share of CO2)
50% 50% Exemption -1 25 3 59 -0 20 -2 70 -0 80 26213 -0 19
Refund -0 80 2 06 -0 10 -2 00 -0 56 24464 -0 18
Grandfathering -0 82 2 12 -0 10 -2 00 -0 57 24174 -0 17
70% 50% Exemption -1 23 3 54 -0 10 -2 70 -0 77 30180 -0 18
Refund -0 49 1 00 0 20 -1 80 -0 35 26653 -0 17
Grandfathering -0 52 1 11 0 20 -1 80 -0 36 26283 -0 16
80% 50% Exemption -1 24 3 59 -0 20 -2 70 -0 78 33169 -0 18
Refund -0 33 0 44 0 30 -1 60 -0 25 28303 -0 16
Grandfathering -0 37 0 58 0 20 -1 60 -0 28 27735 -0 16
Abatement rate
10% Lump-sum 0 03 -0 66 -0 20 -1 60 -0 76 12712 -0 12
Government -0 83 2 46 -0 10 -1 80 -0 50 13079 -0 11
50% Exemption -0 87 2 56 -0 10 -1 90 -0 55 21050 -0 12
Refund -0 33 0 72 0 10 -1 20 -0 24 18058 -0 10
Grandfathering -0 35 0 78 0 10 -1 20 -0 25 17871 -0 10
20% Lump-sum -0 04 -1 59 -0 50 -3 90 -1 89 34195 -0 38
Government -2 11 5 90 -0 20 -4 50 -1 28 35431 -0 36
50% Exemption -2 21 6 15 -0 30 -4 80 -1 39 57134 -0 38
Refund -1 14 1 30 0 10 -3 00 -0 71 42042 -0 60
Grandfathering -1 04 2 01 0 20 -3 40 -0 72 52543 -0 37
Substitution elasticities
FF*0 5 Lump-sum 0 02 -0 97 -0 30 -2 30 -1 14 19455 -0 20
Government -1 26 3 66 -0 10 -2 70 -0 76 20101 -0 18
50% Exemption -1 32 3 84 -0 20 -2 90 -0 83 32542 -0 19
Refund -0 34 1 37 0 20 -1 80 -0 38 30492 0 04
Grandfathering -0 57 1 23 0 20 -2 00 -0 40 28754 -0 18
E_EL*0 5 Lump-sum 0 02 -0 97 -0 30 -2 40 -1 15 19554 -0 20
Government -1 26 3 68 -0 10 -2 80 -0 76 20214 -0 18
50% Exemption -1 33 3 87 -0 20 -2 90 -0 84 32751 -0 19
Refund -0 31 1 36 0 20 -1 80 -0 38 30400 0 06
Grandfathering -0 58 1 27 0 20 -2 00 -0 41 29597 -0 18
All*0 5 Lump-sum 0 02 -1 33 -0 60 -3 50 -1 93 32681 -0 28
Government -2 16 6 57 -0 30 -4 50 -1 31 34562 -0 25
50% Exemption -2 26 6 85 -0 30 -4 80 -1 42 55587 -0 26
Refund -0 95 3 10 0 20 -3 50 -0 82 62564 -0 06
Grandfathering -1 25 3 20 0 20 -3 80 -0 87 63408 -0 28
All*2 Lump-sum 0 01 -0 63 -0 10 -1 20 -0 53 9046 -0 13
Government -0 57 1 50 0 00 -1 30 -0 35 9181 -0 12
50% Exemption -0 60 1 56 -0 10 -1 30 -0 38 14865 -0 13
Refund -0 20 0 22 0 10 -0 80 -0 14 11198 -0 11
Grandfathering -0 22 0 28 0 10 -0 80 -0 15 11092 -0 11
5. Conclusion
In this paper, we analyzed CO2 abatement policies that incorporate assistance to carbon-intensive
industries by using an original computable general equilibrium model of the Japanese economy.
The results show that assisting carbon-intensive industries raises marginal abatement costs by
between 45% and 66%. Such assistance lowers welfare by between 0.01% and 0.07%. Our analysis
suggests that the free allocation of emission permits based on benchmark-year CO2 emissions is the

21
most cost efficient and effective way of mitigating the negative impact of abatement on
carbon-intensive industries. In addition, implementing two assistance programs under which
marginal CO2 abatement costs are equal in the aggregate economy is more efficient than granting
50% exemptions in terms of social welfare losses and CO2 abatement costs, and substantially
mitigates the adverse effects of abatement on the prices of carbon-intensive goods. However, the
effect of refunding carbon tax seems sensitive to the severity of the CO2 abatement target and to
some of the model‟s parameters.
In the short term, granting tax exemptions and freely allocating emission permits for
carbon-intensive industries would spread the burden of reducing CO2 emissions. However, in the
long term, when carbon-intensive industries have had sufficient time to adapt, these industries must
be persuaded to accept a cost effective way of reducing aggregate emissions. Thus, in future, we aim
to develop a dynamic model to evaluate the processes involved in adjusting to the development of
environmentally friendly production structures.

22
References
Armington, P. S. (1969) “A Theory of Demand for Products Distinguished by Place of Production”,
International Monetary Fund Staff Paper Vol. 16, No. 1.
Boehringer, C. and Rutherford, T. (1996) “Carbon Taxes with Exemptions in an Open Economy: A
General Equilibrium Analysis of the German Tax Initiative”, Journal of Environmental
Economics and Management, Vol. 40, 189–203.
Agency for Natural Resources and Energy (2005), “Outlook on Energy Demand and Supply in
2030”, Energy Supply and Demand Subcommittee of Advisory Committee for Natural
Resources and Energy (in Japanese).
Fischer, C. and Fox, A. (2004) “Output-Based Allocations of Emissions Permits: Efficiency and
Distributional Effects in a General Equilibrium Setting with Taxes and Trade”, RRF
Discussion Paper 04–37, Washington, DC, Resources for the Future.
Goulder, L. H. (2002) “Mitigating the Adverse Impacts of CO2 Abatement Policies on
Energy-Intensive Industries”, Resources for the Future.
Hamasaki, H. and Truong, T. P. (2000), “The Costs of Greenhouse Gas Emission Reductions in the
Japanese Economy: An Investigation Using the GTAP–E Model”, The 4th Annual
Conference on Global Trade Analysis, Indiana, 2001.
Jensen, J. (1998) “Carbon Abatement Policies with Assistance to Energy Intensive Industry”, Draft
#2, MobiDK Project, Ministry of Business and Industry, Copenhagen.
Jensen, J. and Rasmussen, T. N. (2000) “Allocation of CO2 Emissions Permits: A General
Equilibrium Analysis of Policy Instruments”, Journal of Environmental Economics and
Management, Vol. 40, 111–136.
Ministry of the Environment (2001), “Interim Report of the Committee on target achievement
scenarios”, Central Environmental Council (in Japanese).
Ministry of the Environment (2003), “Concrete policy design for the prevention of global warming”
Central Environmental Council, Japan (in Japanese).

23
Ministry of Internal Affairs and Communications (2005), “2000 Input-Output Tables for Japan”.
National Institute for Environmental Studies (2004), “The GHGs Emissions Data of Japan”.
Nippon Keidanren (1997) “Keidanren Voluntary Action Plan on the Environment (Final Report)”,
Nippon Keidanren.
Nippon Keidanren (2006) “Results of the Fiscal 2006 Follow-Up to the Keidanren Voluntary Action
Plan on the Environment (Summary) – Section on Global Warming Measures – <Performance
in Fiscal 2005>”, Nippon Keidanren.
OECD (1994) “GREEN: The Reference Manual”, OECD, Paris.
Okagawa, A. and Hamasaki, H. (2005) “Evaluation of Japanese Domestic Policies for Global
Warming Based on the GTAP–E Model”, JCER Economic Journal, No.52 (Oct 2005),
88–102 (in Japanese).
Park, S. (2002) “The Environmental Tax Reform under the Open Economy”, Kyoto Sangyo
University Discussion Paper Series No.2005–01 (in Japanese).
Park, S. (2004) “A Computable General Equilibrium Analysis of an Environmental Tax Reform in
Japan”, Journal of political economy and commercial science, Vol. 186, No.2, 1–16 (in
Japanese).
Washida, T. (2004) “Tax Simulations for Global Warming: A CGE Analysis of Environmental
Policy”, Keiso-shobo, Chapter 5, 141–161 (in Japanese).

本ディスカッションペーパーシリーズは、独立行政法人国立環境研究所の研究者
および外部研究協力者によって行われた研究成果をとりまとめたものです。関係す
る方々から幅広く意見やコメントを得るための場として公開しています。
論文は、すべて研究者個人の責任で執筆されており、独立行政法人国立環境研究
所の見解を示すものではありません。