Embed Size (px)
Citation preview
Serving Society, Delivering Excellence
2015 Interim Results
Aug. 28, 2015
1
Forward-looking Statement Disclaimer
This presentation and subsequent discussions may contain forward-looking
statements that involve risks and uncertainties. These statements are
generally indicated by the use of forward-looking terminology such as believe,
expect, anticipate, estimate, plan, project, target, may, will or may be
expressed to be results of actions that may or are expected to occur in the
future. You should not place undue reliance on these forward-looking
statements, which reflect our belief only as of the date of this presentation.
These forward-looking statements are based on our own information and on
information from other sources we believe to be reliable. They relate to future
events or our future financial, business or other performance and are subject
to a number of uncertainties that may cause our actual results to differ
materially.

2
Presentation Team
Mr. Chen Siqing
President
Mr. Zhu Hexin
Executive Vice President
Mr. Zhang Jinliang
Executive Vice President
Mr. Xu Luode
Executive Vice President
Mr. Gao Yingxin
Executive Vice President
Mr. Ren Deqi
Executive Vice President
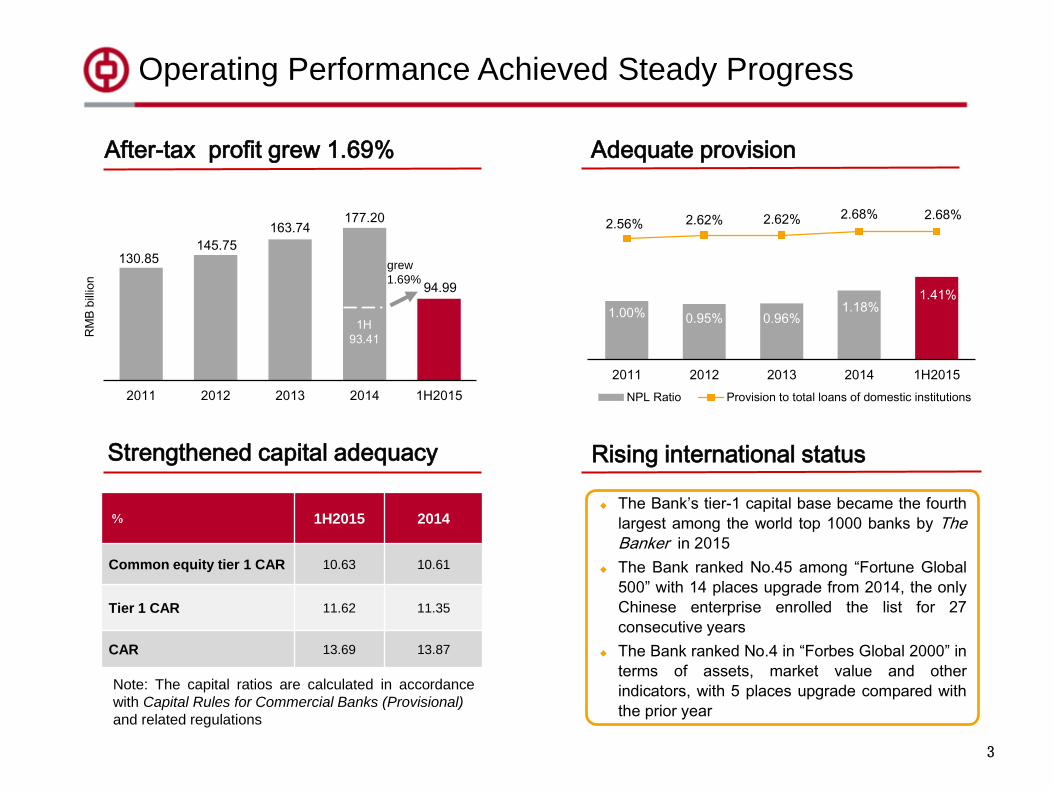
130.85 145.75
163.74 177.20
94.99
2011 2012 2013 2014 1H2015
RM
B b
illio
n
grew
1.69%
1H
93.41
After-tax profit grew 1.69%
Strengthened capital adequacy
Operating Performance Achieved Steady Progress
3
Adequate provision
Rising international status
% 1H2015 2014
Common equity tier 1 CAR 10.63 10.61
Tier 1 CAR 11.62 11.35
CAR 13.69 13.87
The Bank’s tier-1 capital base became the fourth
largest among the world top 1000 banks by The
Banker in 2015
The Bank ranked No.45 among “Fortune Global
500” with 14 places upgrade from 2014, the only
Chinese enterprise enrolled the list for 27
consecutive years
The Bank ranked No.4 in “Forbes Global 2000” in
terms of assets, market value and other
indicators, with 5 places upgrade compared with
the prior year
Note: The capital ratios are calculated in accordance
with Capital Rules for Commercial Banks (Provisional)
and related regulations
1.00% 0.95% 0.96% 1.18%
1.41%
2.56% 2.62% 2.62% 2.68% 2.68%
2011 2012 2013 2014 1H2015
NPL Ratio Provision to total loans of domestic institutions
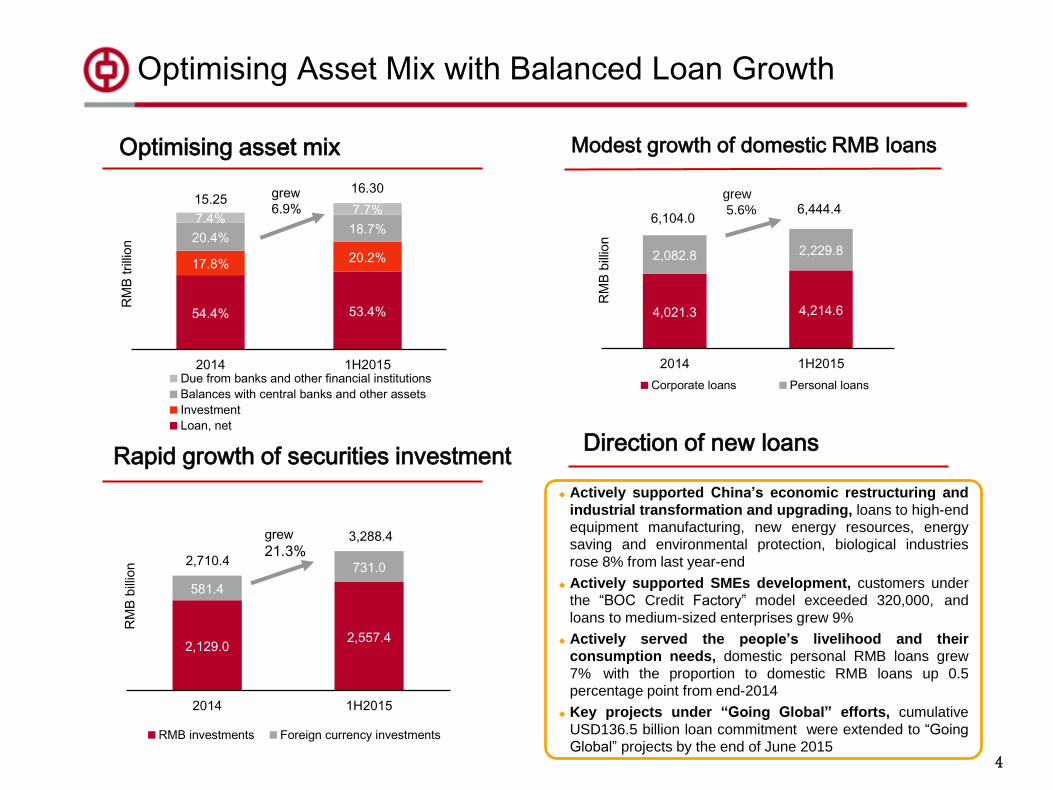
Optimising asset mix
4
Optimising Asset Mix with Balanced Loan Growth
Modest growth of domestic RMB loans
Rapid growth of securities investment Direction of new loans
Actively supported China’s economic restructuring and
industrial transformation and upgrading, loans to high-end
equipment manufacturing, new energy resources, energy
saving and environmental protection, biological industries
rose 8% from last year-end
Actively supported SMEs development, customers under
the “BOC Credit Factory” model exceeded 320,000, and
loans to medium-sized enterprises grew 9%
Actively served the people’s livelihood and their
consumption needs, domestic personal RMB loans grew
7% with the proportion to domestic RMB loans up 0.5
percentage point from end-2014
Key projects under “Going Global” efforts, cumulative
USD136.5 billion loan commitment were extended to “Going Global” projects by the end of June 2015
4,021.3 4,214.6
2,082.8 2,229.8
2014 1H2015
RM
B b
illio
n
Corporate loans Personal loans
6,444.4 6,104.0
grew
5.6%
2,129.0 2,557.4
581.4
731.0
2014 1H2015
RM
B b
illio
n
RMB investments Foreign currency investments
grew
21.3% 2,710.4
3,288.4
54.4% 53.4%
17.8% 20.2%
20.4% 18.7%
7.4% 7.7%
2014 1H2015
RM
B t
rilli
on
Due from banks and other financial institutions
Balances with central banks and other assets
Investment
Loan, net
15.25 16.30 grew
6.9%
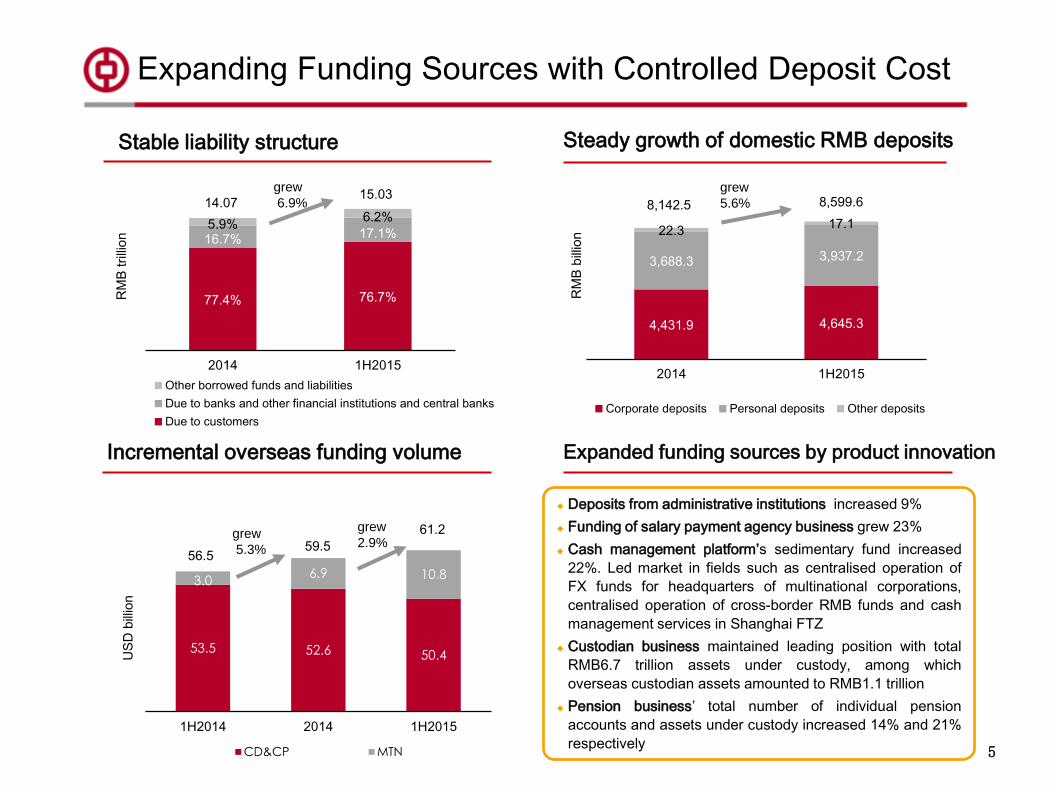
4,431.9 4,645.3
3,688.3 3,937.2
22.3 17.1
2014 1H2015
RM
B b
illio
n
Corporate deposits Personal deposits Other deposits
8,599.6 8,142.5
grew
5.6%
77.4% 76.7%
16.7% 17.1% 5.9%
6.2%
2014 1H2015
RM
B t
rilli
on
Other borrowed funds and liabilities
Due to banks and other financial institutions and central banks
Due to customers
14.07 15.03
grew
6.9%
5
Expanding Funding Sources with Controlled Deposit Cost
Expanded funding sources by product innovation Incremental overseas funding volume
Steady growth of domestic RMB deposits
Deposits from administrative institutions increased 9%
Funding of salary payment agency business grew 23%
Cash management platform’s sedimentary fund increased
22%. Led market in fields such as centralised operation of
FX funds for headquarters of multinational corporations,
centralised operation of cross-border RMB funds and cash
management services in Shanghai FTZ
Custodian business maintained leading position with total
RMB6.7 trillion assets under custody, among which
overseas custodian assets amounted to RMB1.1 trillion
Pension business’ total number of individual pension
accounts and assets under custody increased 14% and 21%
respectively
Stable liability structure
53.5 52.6 50.4
3.0 6.9 10.8
1H2014 2014 1H2015
US
D b
illio
n
CD&CP MTN
56.5
grew
5.3%
grew
2.9% 59.5
61.2
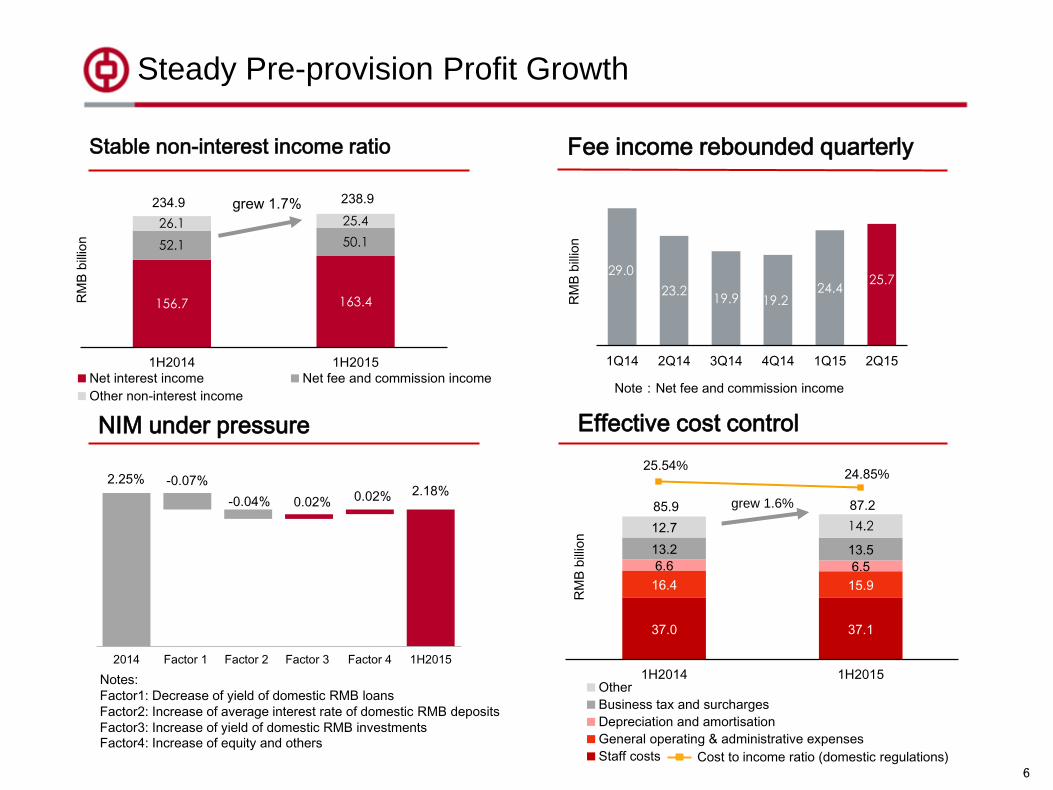
2.25% 2.18%
-0.07%
-0.04% 0.02% 0.02%
2014 Factor 1 Factor 2 Factor 3 Factor 4 1H2015
37.0 37.1
16.4 15.9
6.6 6.5
13.2 13.5
12.7 14.2
1H2014 1H2015
RM
B b
illio
n
Other
Business tax and surcharges
Depreciation and amortisation
General operating & administrative expenses
Staff costs
85.9 87.2 grew 1.6%
25.54% 24.85%
29.0
23.2 19.9 19.2
24.4 25.7
1Q14 2Q14 3Q14 4Q14 1Q15 2Q15
RM
B b
illio
n
6
Steady Pre-provision Profit Growth
Stable non-interest income ratio
NIM under pressure
Fee income rebounded quarterly
Notes:
Factor1: Decrease of yield of domestic RMB loans
Factor2: Increase of average interest rate of domestic RMB deposits
Factor3: Increase of yield of domestic RMB investments Factor4: Increase of equity and others
Effective cost control
Cost to income ratio (domestic regulations)
Note:Net fee and commission income
156.7 163.4
52.1 50.1
26.1 25.4
1H2014 1H2015
RM
B b
illio
n
Net interest income Net fee and commission income
Other non-interest income
grew 1.7% 234.9 238.9
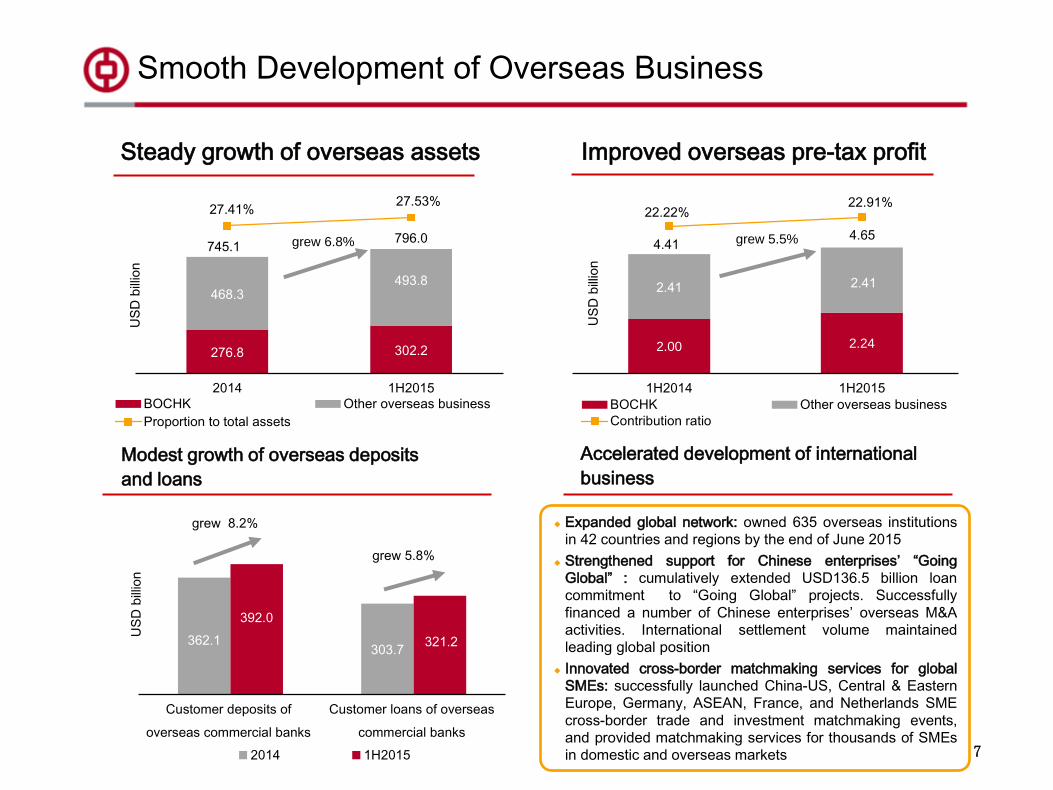
2.00 2.24
2.41 2.41
22.22% 22.91%
1H2014 1H2015
US
D b
illio
n
BOCHK Other overseas business
Contribution ratio
4.41 4.65 grew 5.5%
Smooth Development of Overseas Business
Steady growth of overseas assets
7
Improved overseas pre-tax profit
Accelerated development of international
business
Expanded global network: owned 635 overseas institutions
in 42 countries and regions by the end of June 2015
Strengthened support for Chinese enterprises’ “Going
Global” : cumulatively extended USD136.5 billion loan
commitment to “Going Global” projects. Successfully
financed a number of Chinese enterprises’ overseas M&A
activities. International settlement volume maintained
leading global position
Innovated cross-border matchmaking services for global
SMEs: successfully launched China-US, Central & Eastern
Europe, Germany, ASEAN, France, and Netherlands SME
cross-border trade and investment matchmaking events, and provided matchmaking services for thousands of SMEs
in domestic and overseas markets
Modest growth of overseas deposits
and loans
276.8 302.2
468.3 493.8
27.41% 27.53%
2014 1H2015
US
D b
illio
n
BOCHK Other overseas business
Proportion to total assets
796.0 745.1 grew 6.8%
362.1 303.7
392.0
321.2
Customer deposits of
overseas commercial banks
Customer loans of overseas
commercial banks
US
D b
illio
n
2014 1H2015
grew 8.2%
grew 5.8%
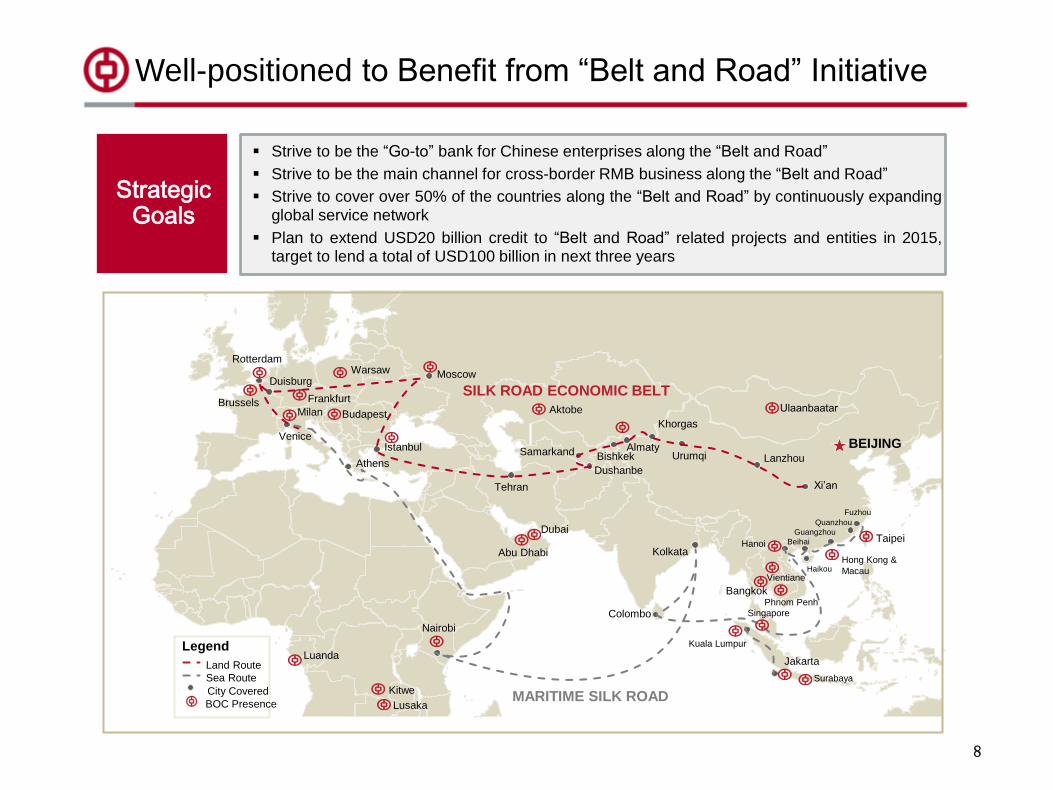
Well-positioned to Benefit from “Belt and Road” Initiative
StrategicGoals
Strive to be the “Go-to” bank for Chinese enterprises along the “Belt and Road”
Strive to be the main channel for cross-border RMB business along the “Belt and Road”
Strive to cover over 50% of the countries along the “Belt and Road” by continuously expanding global service network
Plan to extend USD20 billion credit to “Belt and Road” related projects and entities in 2015, target to lend a total of USD100 billion in next three years
Athens
Venice Istanbul BEIJING
Xi’an
Lanzhou Urumqi
Khorgas
Almaty Bishkek Samarkand
Dushanbe
Tehran
Moscow Duisburg
Rotterdam
SILK ROAD ECONOMIC BELT Frankfurt
Milan Budapest Brussels
Warsaw
Ulaanbaatar
Jakarta
Fuzhou
Quanzhou
Guangzhou
Beihai
Haikou
Hanoi
Kuala Lumpur
Colombo
Kolkata
Nairobi
MARITIME SILK ROAD
Abu Dhabi
Taipei
Hong Kong &
Macau
Bangkok Phnom Penh
Vientiane
Kitwe
Singapore
Legend
Land Route
Sea Route
BOC Presence
City Covered
8
Dubai
Lusaka
Surabaya
Aktobe
Luanda
9
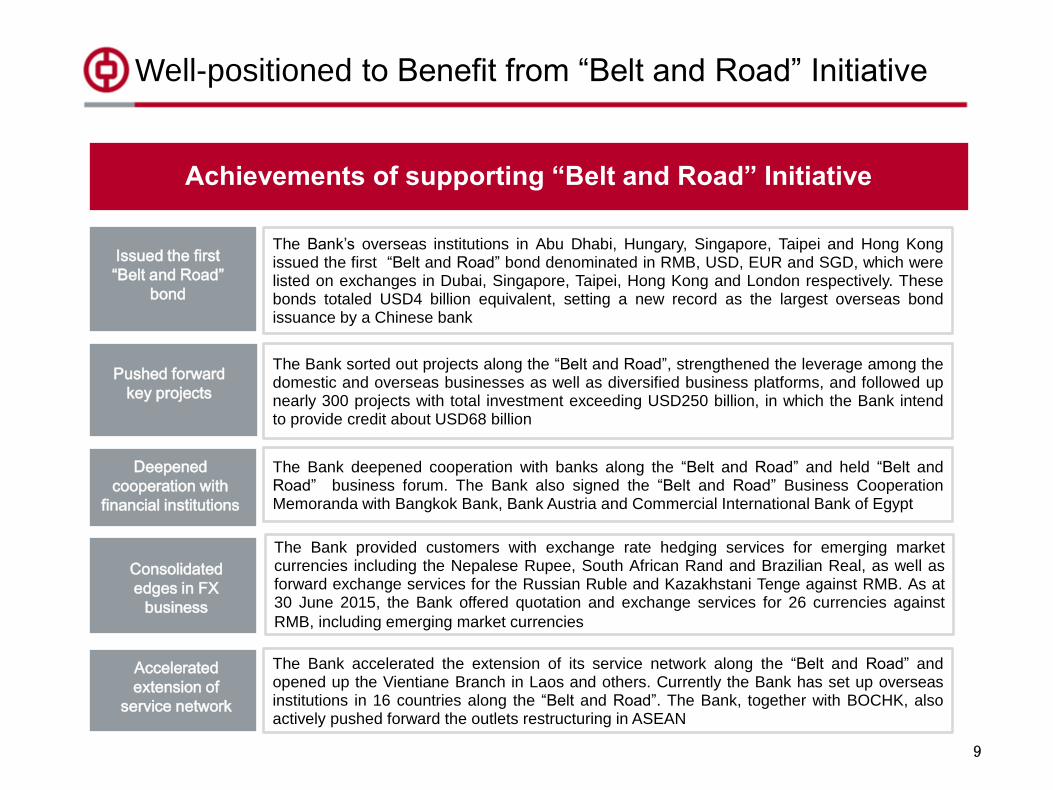
Achievements of supporting “Belt and Road” Initiative
The Bank’s overseas institutions in Abu Dhabi, Hungary, Singapore, Taipei and Hong Kong issued the first “Belt and Road” bond denominated in RMB, USD, EUR and SGD, which were listed on exchanges in Dubai, Singapore, Taipei, Hong Kong and London respectively. These bonds totaled USD4 billion equivalent, setting a new record as the largest overseas bond issuance by a Chinese bank
The Bank sorted out projects along the “Belt and Road”, strengthened the leverage among the domestic and overseas businesses as well as diversified business platforms, and followed up nearly 300 projects with total investment exceeding USD250 billion, in which the Bank intend to provide credit about USD68 billion
The Bank deepened cooperation with banks along the “Belt and Road” and held “Belt and Road” business forum. The Bank also signed the “Belt and Road” Business Cooperation Memoranda with Bangkok Bank, Bank Austria and Commercial International Bank of Egypt
The Bank provided customers with exchange rate hedging services for emerging market currencies including the Nepalese Rupee, South African Rand and Brazilian Real, as well as forward exchange services for the Russian Ruble and Kazakhstani Tenge against RMB. As at 30 June 2015, the Bank offered quotation and exchange services for 26 currencies against
RMB, including emerging market currencies报价及兑换服务。)
The Bank accelerated the extension of its service network along the “Belt and Road” and opened up the Vientiane Branch in Laos and others. Currently the Bank has set up overseas institutions in 16 countries along the “Belt and Road”. The Bank, together with BOCHK, also actively pushed forward the outlets restructuring in ASEAN
Issued the first
“Belt and Road”
bond
Pushed forward
key projects
Deepened
cooperation with
financial institutions
Accelerated
extension of
service network
Consolidated
edges in FX
business
Well-positioned to Benefit from “Belt and Road” Initiative
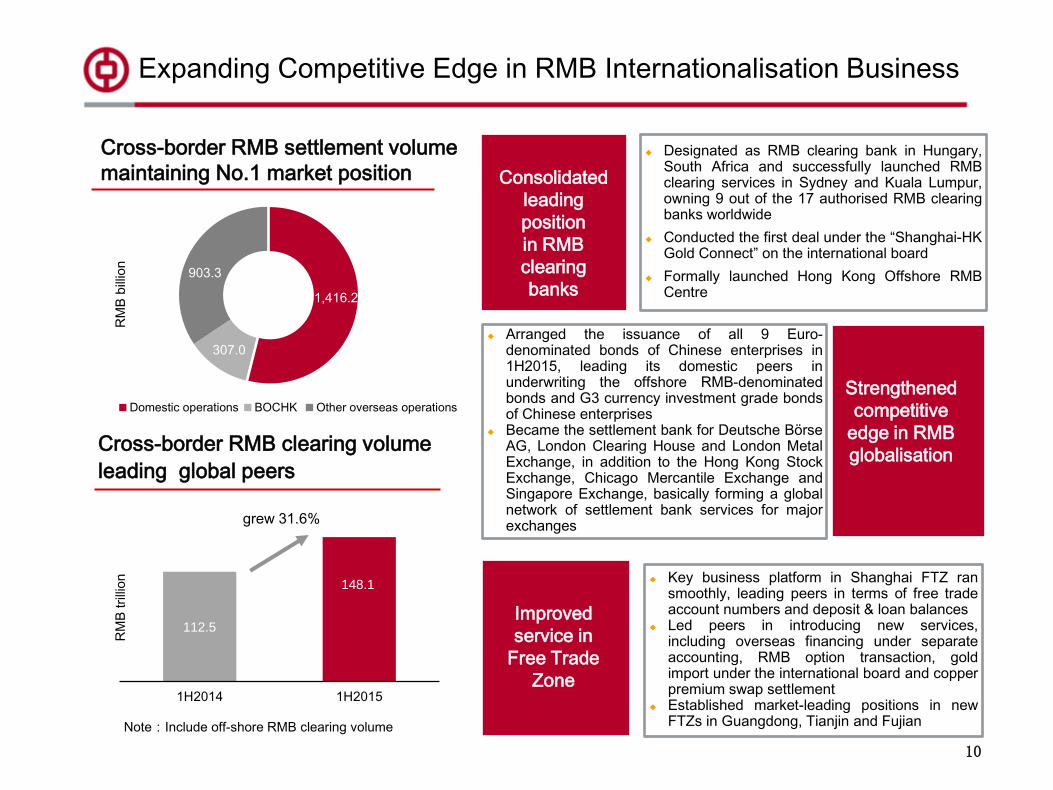
Designated as RMB clearing bank in Hungary, South Africa and successfully launched RMB clearing services in Sydney and Kuala Lumpur, owning 9 out of the 17 authorised RMB clearing banks worldwide
Conducted the first deal under the “Shanghai-HK Gold Connect” on the international board
Formally launched Hong Kong Offshore RMB Centre
Key business platform in Shanghai FTZ ran smoothly, leading peers in terms of free trade account numbers and deposit & loan balances
Led peers in introducing new services, including overseas financing under separate accounting, RMB option transaction, gold import under the international board and copper premium swap settlement
Established market-leading positions in new FTZs in Guangdong, Tianjin and Fujian
Arranged the issuance of all 9 Euro-denominated bonds of Chinese enterprises in 1H2015, leading its domestic peers in underwriting the offshore RMB-denominated bonds and G3 currency investment grade bonds of Chinese enterprises
Became the settlement bank for Deutsche Börse AG, London Clearing House and London Metal Exchange, in addition to the Hong Kong Stock Exchange, Chicago Mercantile Exchange and Singapore Exchange, basically forming a global network of settlement bank services for major exchanges
112.5
148.1
1H2014 1H2015
RM
B t
rilli
on
grew 31.6%
Expanding Competitive Edge in RMB Internationalisation Business
Cross-border RMB settlement volume
maintaining No.1 market position
10
Cross-border RMB clearing volume
leading global peers
Consolidated
leading
position
in RMB
clearing
banks
Improved
service in
Free Trade
Zone
Strengthened
competitive
edge in RMB
globalisation
Note:Include off-shore RMB clearing volume
1,416.2
307.0
903.3
Domestic operations BOCHK Other overseas operations
RM
B b
illio
n
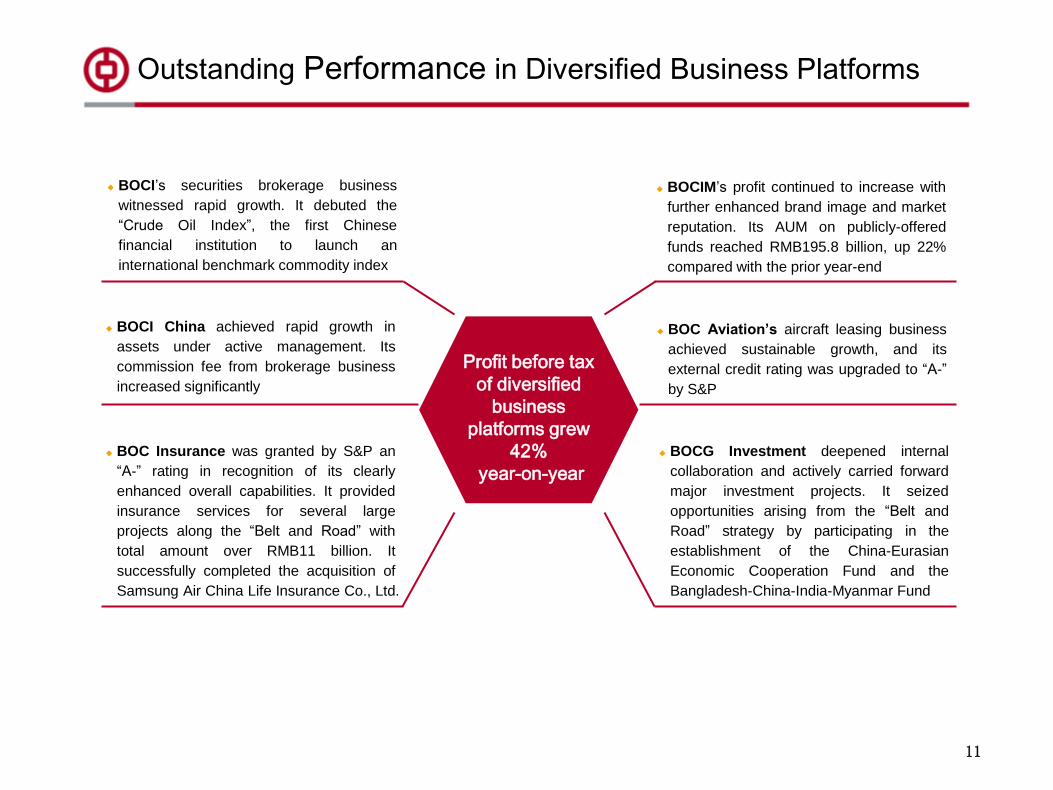
BOCI’s securities brokerage business
witnessed rapid growth. It debuted the
“Crude Oil Index”, the first Chinese
financial institution to launch an
international benchmark commodity index
11
Profit before tax
of diversified
business
platforms grew
42%
year-on-year
BOCI China achieved rapid growth in
assets under active management. Its
commission fee from brokerage business
increased significantly
BOCIM’s profit continued to increase with
further enhanced brand image and market
reputation. Its AUM on publicly-offered
funds reached RMB195.8 billion, up 22%
compared with the prior year-end
BOC Insurance was granted by S&P an
“A-” rating in recognition of its clearly
enhanced overall capabilities. It provided
insurance services for several large
projects along the “Belt and Road” with
total amount over RMB11 billion. It
successfully completed the acquisition of
Samsung Air China Life Insurance Co., Ltd.
BOCG Investment deepened internal
collaboration and actively carried forward
major investment projects. It seized
opportunities arising from the “Belt and
Road” strategy by participating in the
establishment of the China-Eurasian
Economic Cooperation Fund and the
Bangladesh-China-India-Myanmar Fund
BOC Aviation’s aircraft leasing business
achieved sustainable growth, and its
external credit rating was upgraded to “A-”
by S&P
Outstanding Performance in Diversified Business Platforms
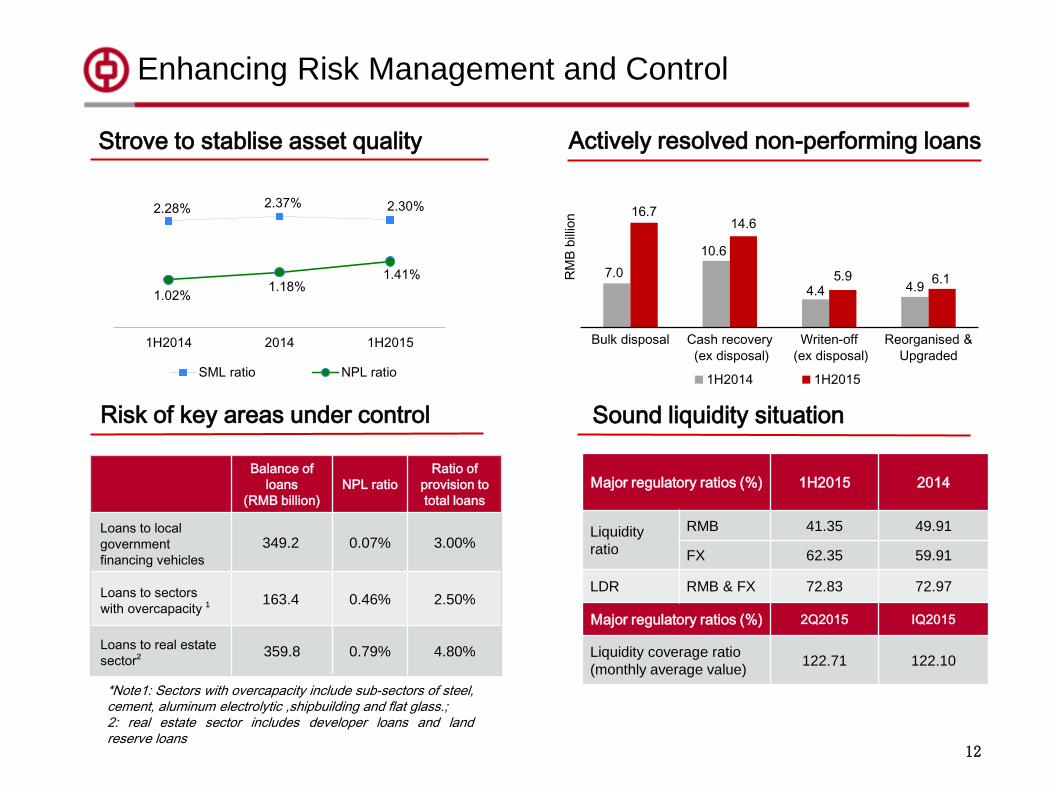
Strove to stablise asset quality
Enhancing Risk Management and Control
12
Risk of key areas under control
新)
Actively resolved non-performing loans
Balance of
loans
(RMB billion)
NPL ratio
Ratio of
provision to
total loans
Loans to local
government
financing vehicles
349.2 0.07% 3.00%
Loans to sectors
with overcapacity ¹ 163.4 0.46% 2.50%
Loans to real estate
sector² 359.8 0.79% 4.80%
*Note1: Sectors with overcapacity include sub-sectors of steel, cement, aluminum electrolytic ,shipbuilding and flat glass.; 2: real estate sector includes developer loans and land reserve loans
Sound liquidity situation
Major regulatory ratios (%) 1H2015 2014
Liquidity
ratio
RMB 41.35 49.91
FX 62.35 59.91
LDR RMB & FX 72.83 72.97
Major regulatory ratios (%) 2Q2015 IQ2015
Liquidity coverage ratio
(monthly average value) 122.71 122.10
2.28% 2.37% 2.30%
1.02% 1.18%
1.41%
1H2014 2014 1H2015
SML ratio NPL ratio
7.0
10.6
4.4 4.9
16.7 14.6
5.9 6.1
Bulk disposal Cash recovery
(ex disposal)
Writen-off
(ex disposal)
Reorganised &
Upgraded
RM
B b
illio
n
1H2014 1H2015
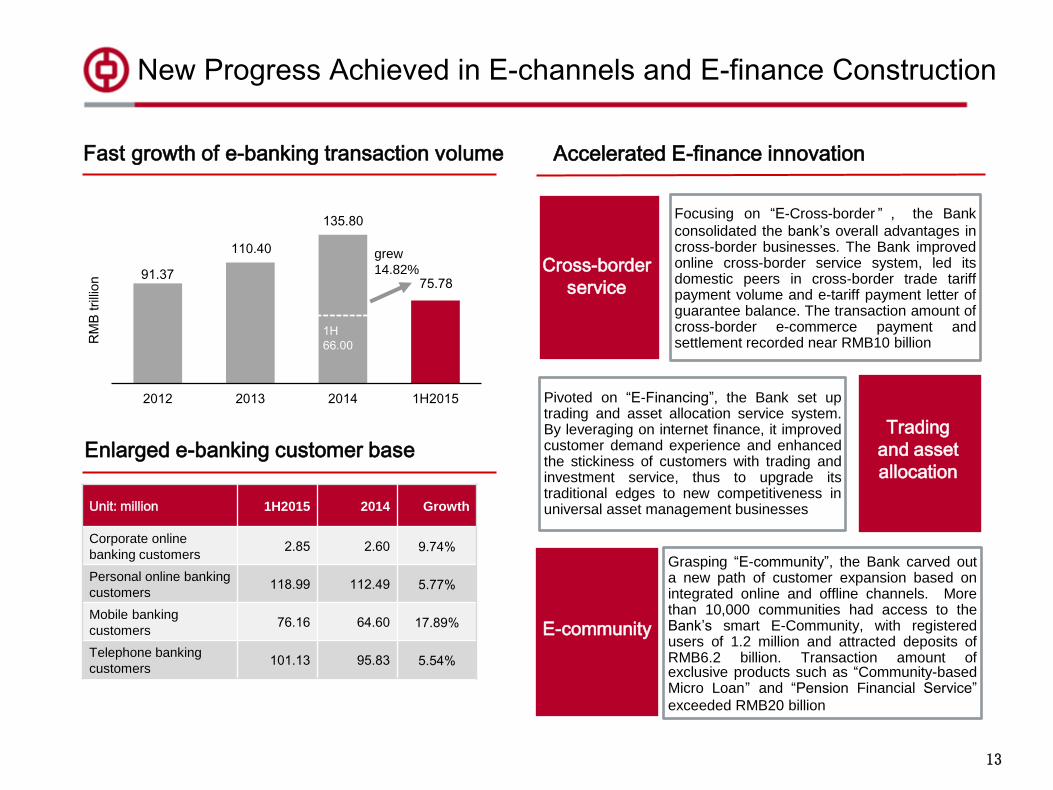
91.37
110.40
135.80
75.78
2012 2013 2014 1H2015
RM
B t
rilli
on
grew
14.82%
1H
66.00
Focusing on “E-Cross-border ” , the Bank
consolidated the bank’s overall advantages in cross-border businesses. The Bank improved online cross-border service system, led its domestic peers in cross-border trade tariff payment volume and e-tariff payment letter of guarantee balance. The transaction amount of cross-border e-commerce payment and settlement recorded near RMB10 billion
Pivoted on “E-Financing”, the Bank set up trading and asset allocation service system. By leveraging on internet finance, it improved customer demand experience and enhanced the stickiness of customers with trading and investment service, thus to upgrade its traditional edges to new competitiveness in universal asset management businesses
Grasping “E-community”, the Bank carved out a new path of customer expansion based on integrated online and offline channels. More than 10,000 communities had access to the Bank’s smart E-Community, with registered users of 1.2 million and attracted deposits of RMB6.2 billion. Transaction amount of exclusive products such as “Community-based Micro Loan” and “Pension Financial Service”
exceeded RMB20 billion
New Progress Achieved in E-channels and E-finance Construction
Fast growth of e-banking transaction volume
Unit: million 1H2015 2014 Growth
Corporate online
banking customers 2.85 2.60 9.74%
Personal online banking
customers 118.99 112.49 5.77%
Mobile banking
customers 76.16 64.60 17.89%
Telephone banking
customers 101.13 95.83 5.54%
Enlarged e-banking customer base
13
Accelerated E-finance innovation
Cross-border
service
Trading
and asset
allocation
E-community

14
2H2015 Outlook
14
• Stablise business growth and raise income to enhance operational profitability
• Streamline business structure and deepen transformation to promote developing momentum
• Monitor risks and resolve non-performing assets to improve developing quality
• Strengthen internal control and solidify operational foundation to stimulate developing potential
Adhering to the strategic goal of “Serving
Society, Delivering Excellence”, and achieving
new development within the “new normal”
15
Q&A
16
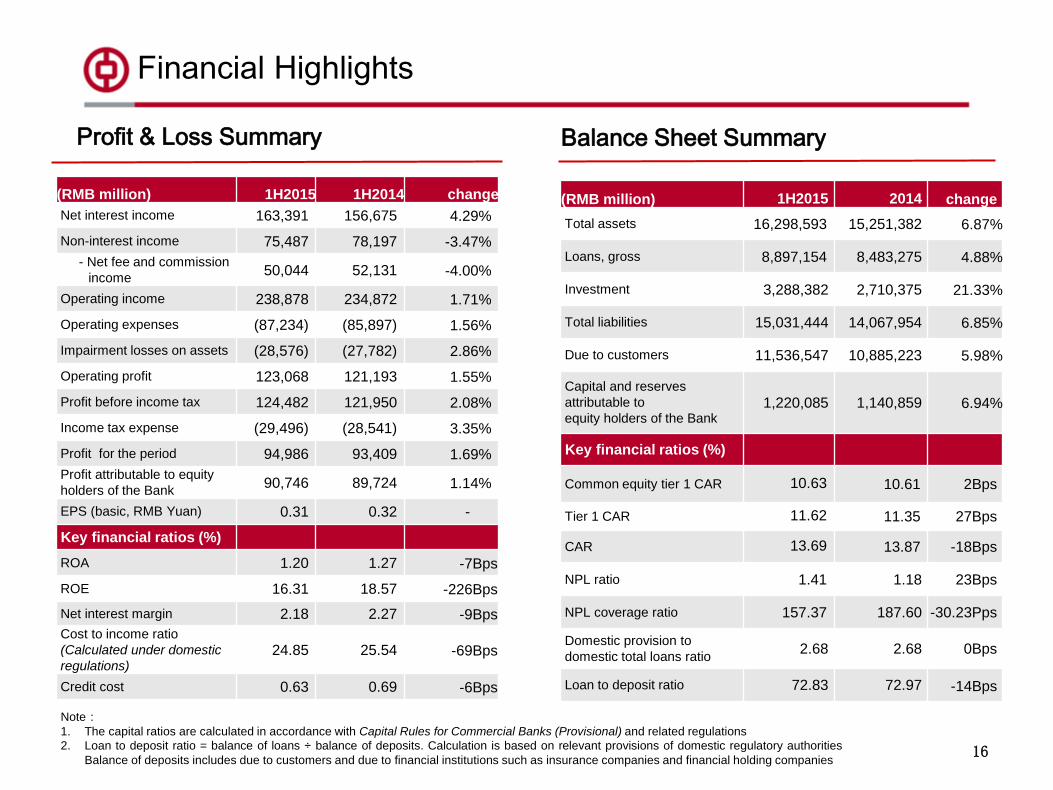
Financial Highlights
Profit & Loss Summary Balance Sheet Summary
(RMB million) 1H2015 2014 change
Total assets 16,298,593 15,251,382 6.87%
Loans, gross 8,897,154 8,483,275 4.88%
Investment 3,288,382 2,710,375 21.33%
Total liabilities 15,031,444 14,067,954 6.85%
Due to customers 11,536,547 10,885,223 5.98%
Capital and reserves
attributable to
equity holders of the Bank 1,220,085 1,140,859 6.94%
Key financial ratios (%)
Common equity tier 1 CAR 10.63 10.61 2Bps
Tier 1 CAR 11.62 11.35 27Bps
CAR 13.69 13.87 -18Bps
NPL ratio 1.41 1.18 23Bps
NPL coverage ratio 157.37 187.60 -30.23Pps
Domestic provision to
domestic total loans ratio 2.68 2.68 0Bps
Loan to deposit ratio 72.83 72.97 -14Bps
(RMB million) 1H2015 1H2014 change
Net interest income 163,391 156,675 4.29%
Non-interest income 75,487 78,197 -3.47%
- Net fee and commission
income 50,044 52,131 -4.00%
Operating income 238,878 234,872 1.71%
Operating expenses (87,234) (85,897) 1.56%
Impairment losses on assets (28,576) (27,782) 2.86%
Operating profit 123,068 121,193 1.55%
Profit before income tax 124,482 121,950 2.08%
Income tax expense (29,496) (28,541) 3.35%
Profit for the period 94,986 93,409 1.69%
Profit attributable to equity
holders of the Bank 90,746 89,724 1.14%
EPS (basic, RMB Yuan) 0.31 0.32 -
Key financial ratios (%)
ROA 1.20 1.27 -7Bps
ROE 16.31 18.57 -226Bps
Net interest margin 2.18 2.27 -9Bps
Cost to income ratio
(Calculated under domestic
regulations) 24.85 25.54 -69Bps
Credit cost 0.63 0.69 -6Bps
Note:
1. The capital ratios are calculated in accordance with Capital Rules for Commercial Banks (Provisional) and related regulations
2. Loan to deposit ratio = balance of loans ÷ balance of deposits. Calculation is based on relevant provisions of domestic regulatory authorities
Balance of deposits includes due to customers and due to financial institutions such as insurance companies and financial holding companies