Embed Size (px)
Citation preview
Services Sector Liberalization, Employment and Growth: A
CGE AnalysisBased on Shantong LI, Yan WANG, and Fan
ZHAI’s [email protected]
Prepared for the Senior Policy Seminar on “China’s Service Sector in the Post WTO Era”
Beijing, ChinaSeptember 22-24, 2003
2
Outline• Why liberalize the service sector?• Trade in services a part of growth and poverty
reduction strategy, China
• How have other countries committed / liberalized? Thailand and China
• Impact of China’s service liberalization-CGE analysis
• Summary• Annex on banking services
3
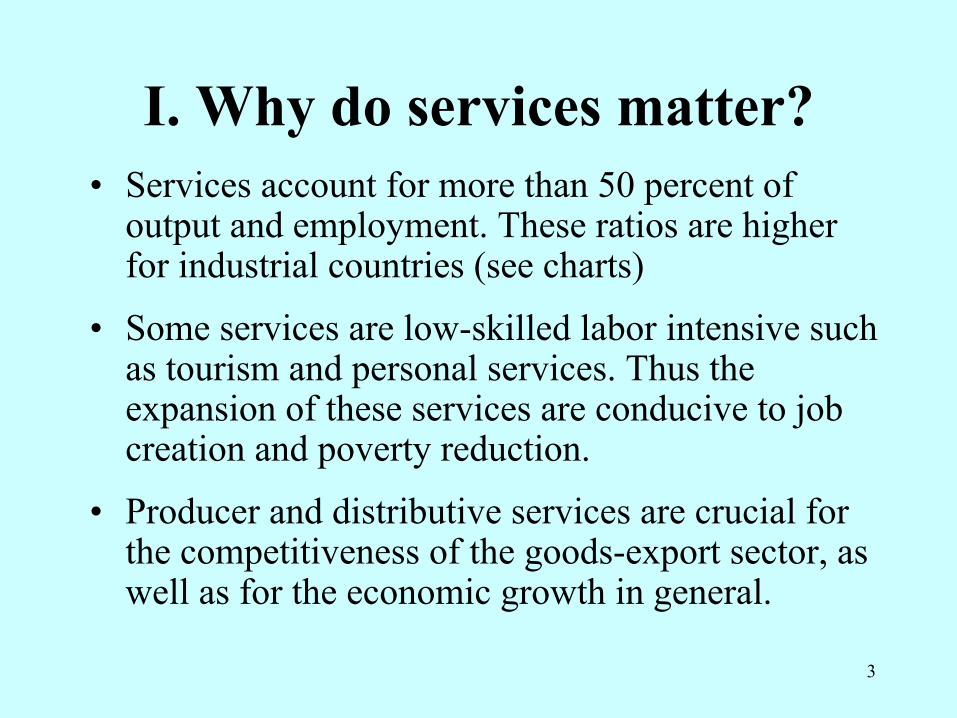
I. Why do services matter?• Services account for more than 50 percent of
output and employment. These ratios are higher for industrial countries (see charts)
• Some services are low-skilled labor intensive such as tourism and personal services. Thus the expansion of these services are conducive to job creation and poverty reduction.
• Producer and distributive services are crucial for the competitiveness of the goods-export sector, as well as for the economic growth in general.
4
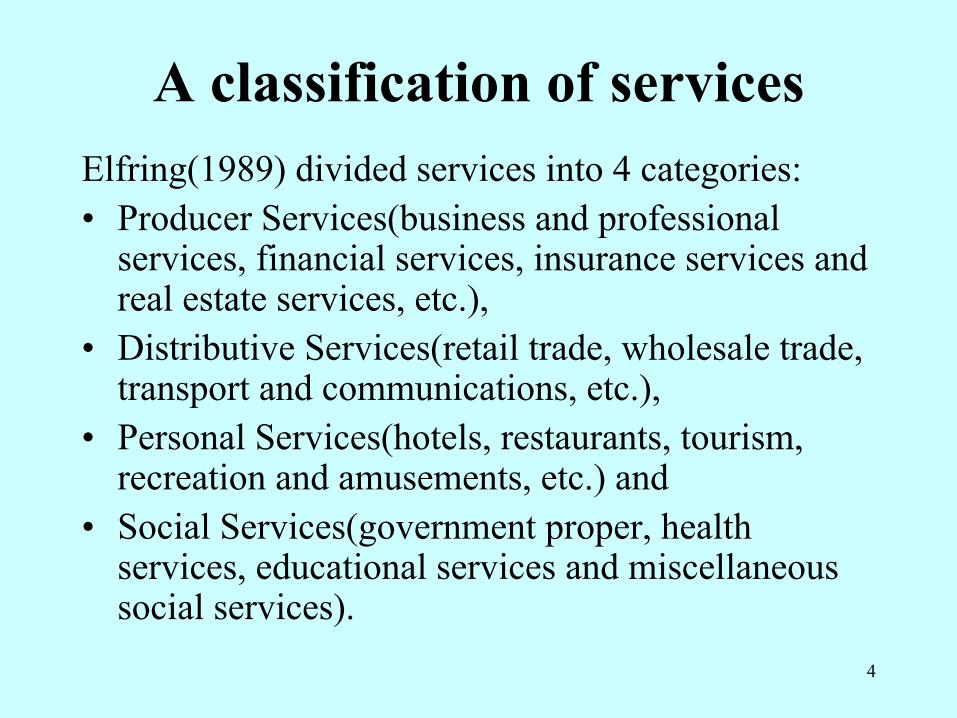
A classification of servicesElfring(1989) divided services into 4 categories: • Producer Services(business and professional
services, financial services, insurance services and real estate services, etc.),
• Distributive Services(retail trade, wholesale trade, transport and communications, etc.),
• Personal Services(hotels, restaurants, tourism, recreation and amusements, etc.) and
• Social Services(government proper, health services, educational services and miscellaneous social services).
5
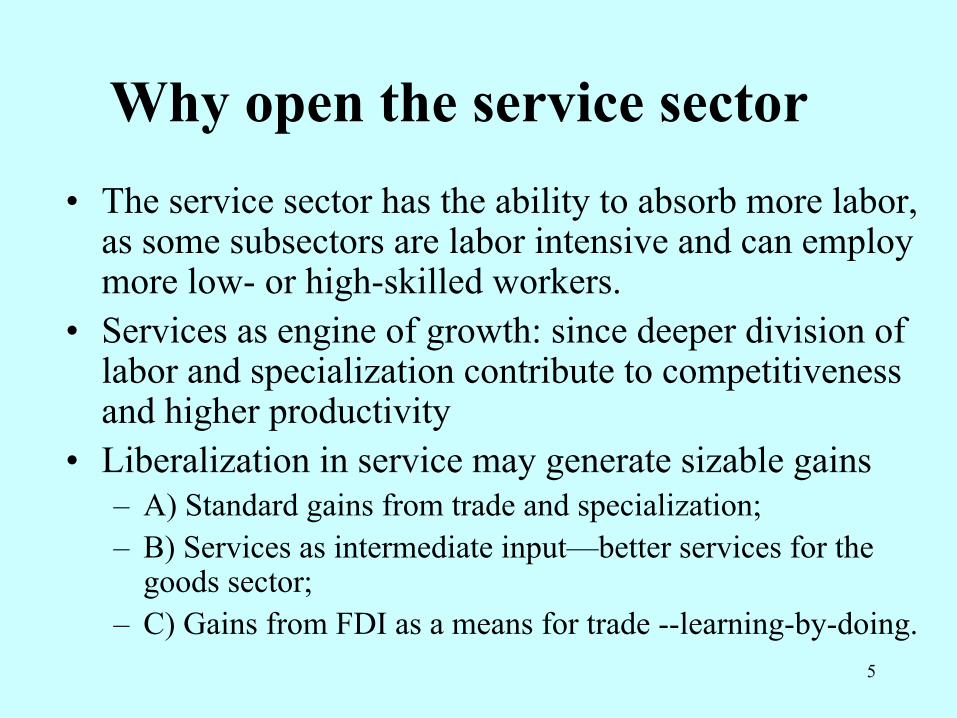
Why open the service sector• The service sector has the ability to absorb more labor,
as some subsectors are labor intensive and can employ more low- or high-skilled workers.
• Services as engine of growth: since deeper division of labor and specialization contribute to competitiveness and higher productivity
• Liberalization in service may generate sizable gains– A) Standard gains from trade and specialization;– B) Services as intermediate input—better services for the
goods sector; – C) Gains from FDI as a means for trade --learning-by-doing.
6
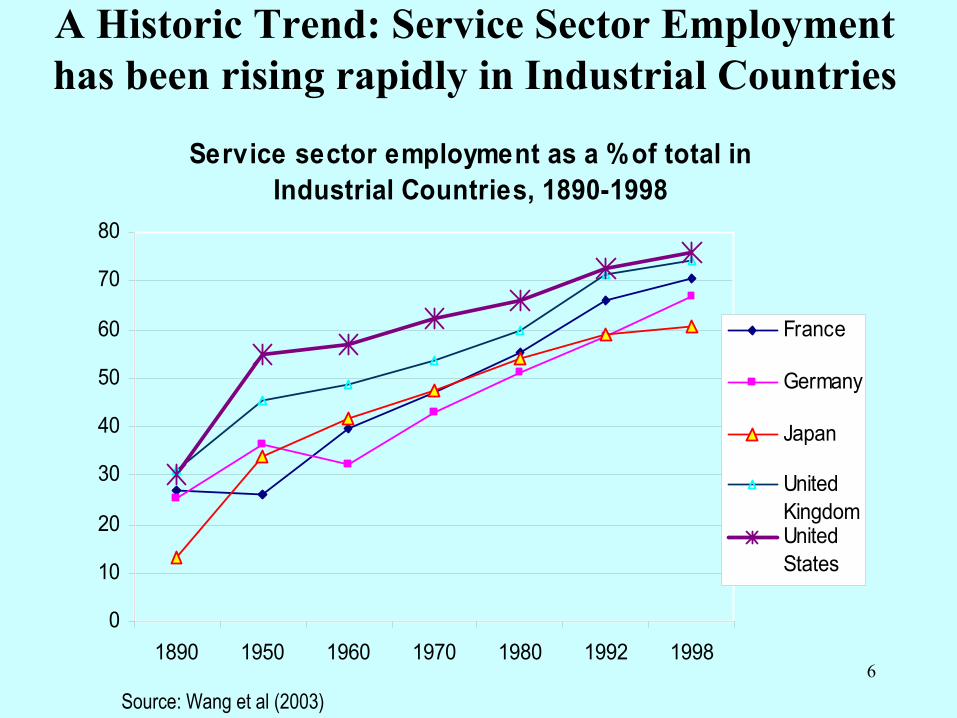
A Historic Trend: Service Sector Employment has been rising rapidly in Industrial Countries
Service sector employment as a % of total in Industrial Countries, 1890-1998
0
10
20
30
40
50
60
70
80
1890 1950 1960 1970 1980 1992 1998
France
Germany
Japan
UnitedKingdomUnitedStates
Source: Wang et al (2003)
7
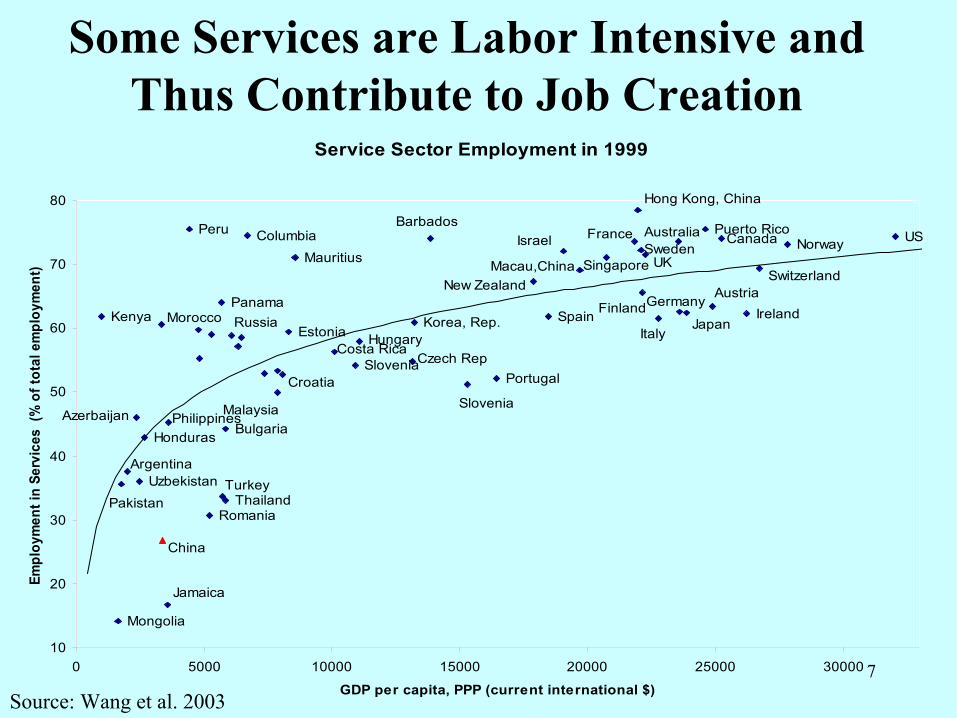
Some Services are Labor Intensive and Thus Contribute to Job Creation
Source: Wang et al. 2003
Service Sector Employment in 1999
Kenya MoroccoPanamaRussia
EstoniaCosta Rica
Slovenia
Portugal
Korea, Rep.
AzerbaijanBulgaria
RomaniaThailand
UzbekistanArgentina
Pakistan
Mongolia
IrelandJapan
ItalySpain
Mauritius
Peru
Singapore UK
Puerto Rico
Hong Kong, China
Switzerland
Norway US
Macau,ChinaNew Zealand
Turkey
Philippines
Croatia
Czech RepSlovenia
ColumbiaBarbados
Israel Canada
Honduras
AustraliaFranceSweden
Malaysia
China
Germany Austria
Hungary
Finland
Jamaica
10
20
30
40
50
60
70
80
0 5000 10000 15000 20000 25000 30000
GDP per capita, PPP (current international $)
Empl
oym
ent i
n Se
rvic
es (
% o
f tot
al e
mpl
oym
ent)
8
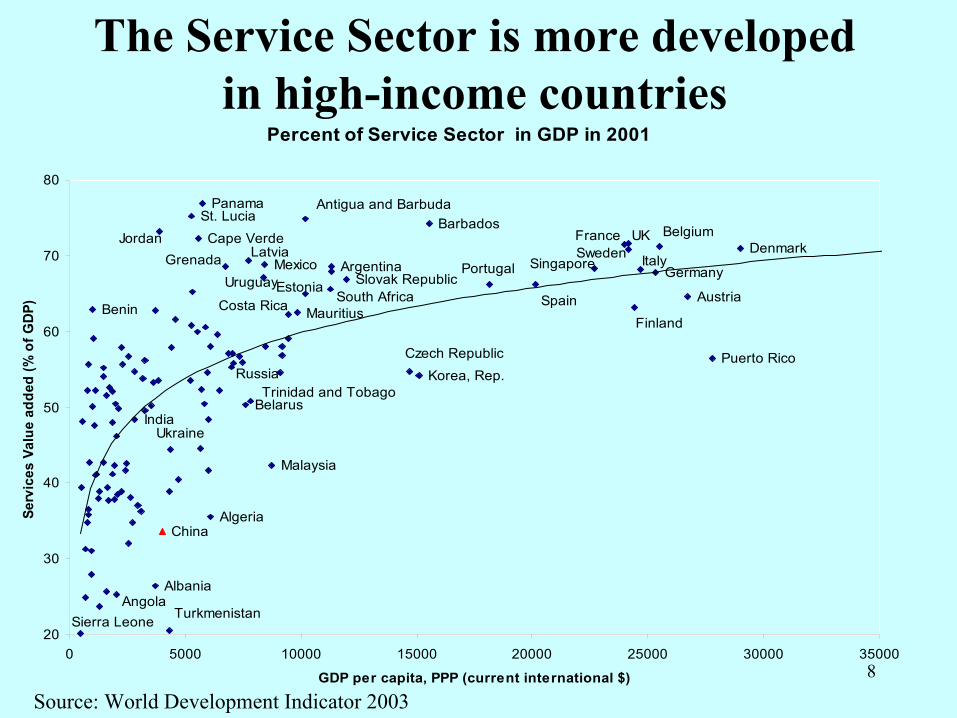
The Service Sector is more developed in high-income countries
Source: World Development Indicator 2003
Percent of Service Sector in GDP in 2001
India
Russia
Ukraine
Belarus
AngolaAlbania
Algeria
Malaysia
Benin
Grenada LatviaMexico
Cape VerdeJordanSt. Lucia
Panama
Estonia
Czech Republic
Costa Rica MauritiusSpain
Portugal SingaporeSweden
UK
ItalySlovak Republic
South Africa
Sierra Leone
France
China
Denmark
Germany
Finland
Belgium
Antigua and BarbudaBarbados
Argentina
Trinidad and Tobago
Turkmenistan
Puerto Rico
Austria
Korea, Rep.
Uruguay
20
30
40
50
60
70
80
0 5000 10000 15000 20000 25000 30000 35000
GDP per capita, PPP (current international $)
Serv
ices
Val
ue a
dded
(% o
f GDP
)
9
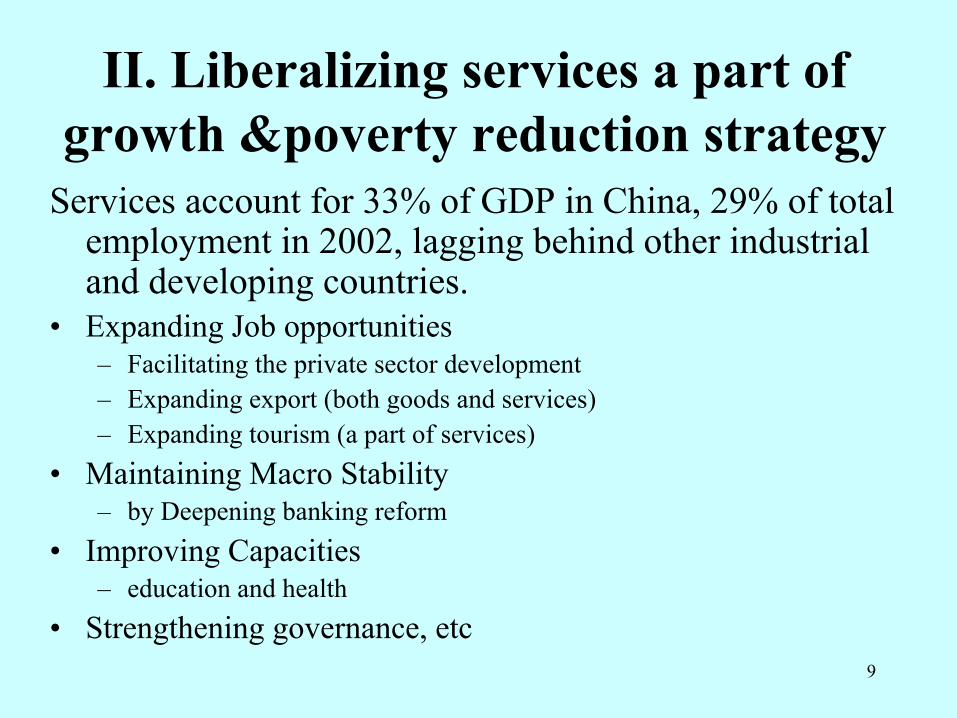
II. Liberalizing services a part of growth &poverty reduction strategy
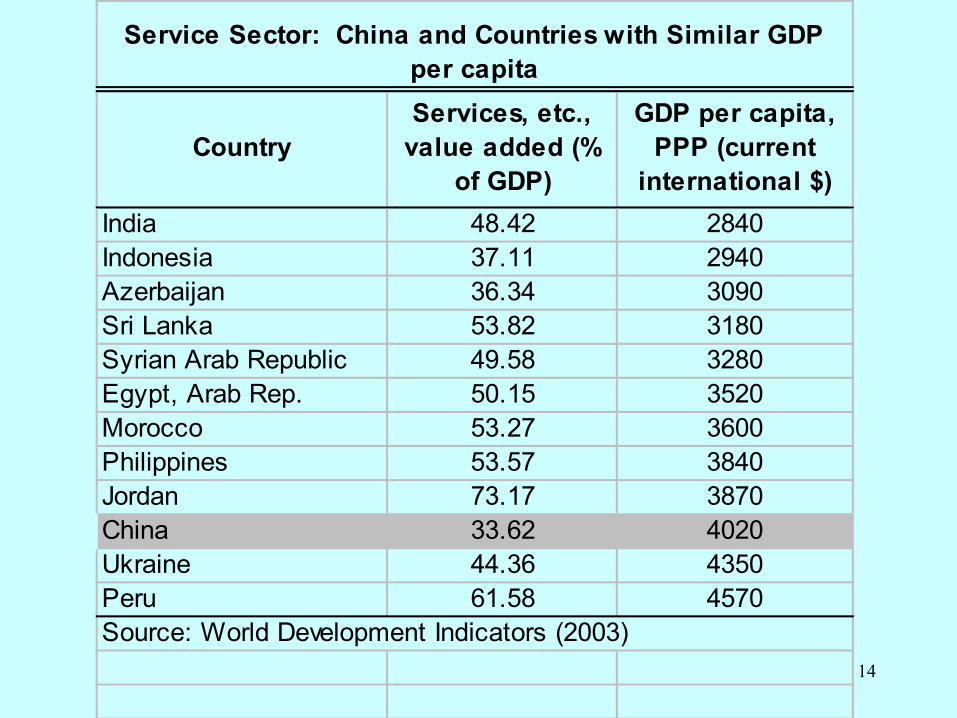
Services account for 33% of GDP in China, 29% of total employment in 2002, lagging behind other industrial and developing countries.
• Expanding Job opportunities– Facilitating the private sector development– Expanding export (both goods and services)– Expanding tourism (a part of services)
• Maintaining Macro Stability– by Deepening banking reform
• Improving Capacities– education and health
• Strengthening governance, etc
10
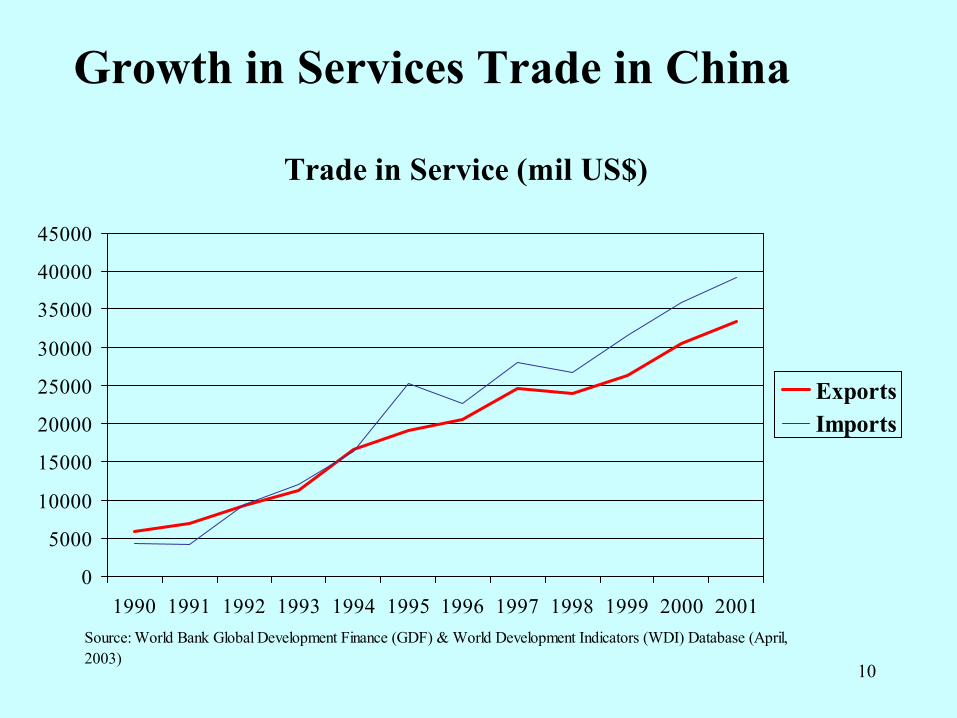
Growth in Services Trade in China
Trade in Service (mil US$)
0
5000
10000
15000
20000
25000
30000
35000
40000
45000
1990 1991 1992 1993 1994 1995 1996 1997 1998 1999 2000 2001Source: World Bank Global Development Finance (GDF) & World Development Indicators (WDI) Database (April, 2003)
ExportsImports
11
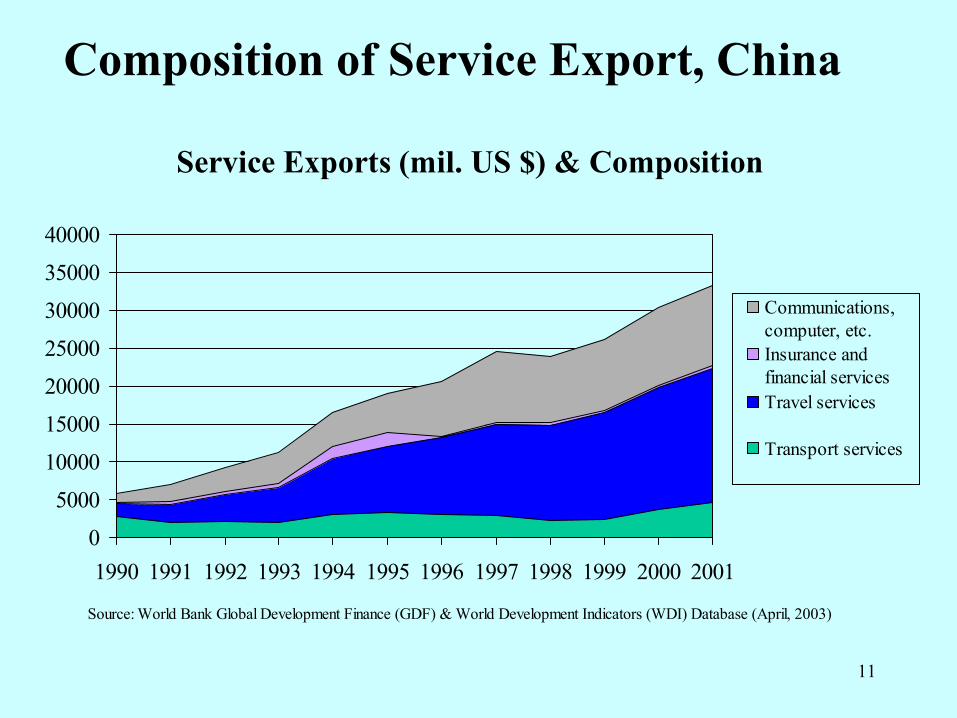
Composition of Service Export, China
Service Exports (mil. US $) & Composition
0
5000
10000
15000
20000
25000
30000
35000
40000
1990 1991 1992 1993 1994 1995 1996 1997 1998 1999 2000 2001
Source: World Bank Global Development Finance (GDF) & World Development Indicators (WDI) Database (April, 2003)
Communications,computer, etc. Insurance andfinancial servicesTravel services
Transport services
12
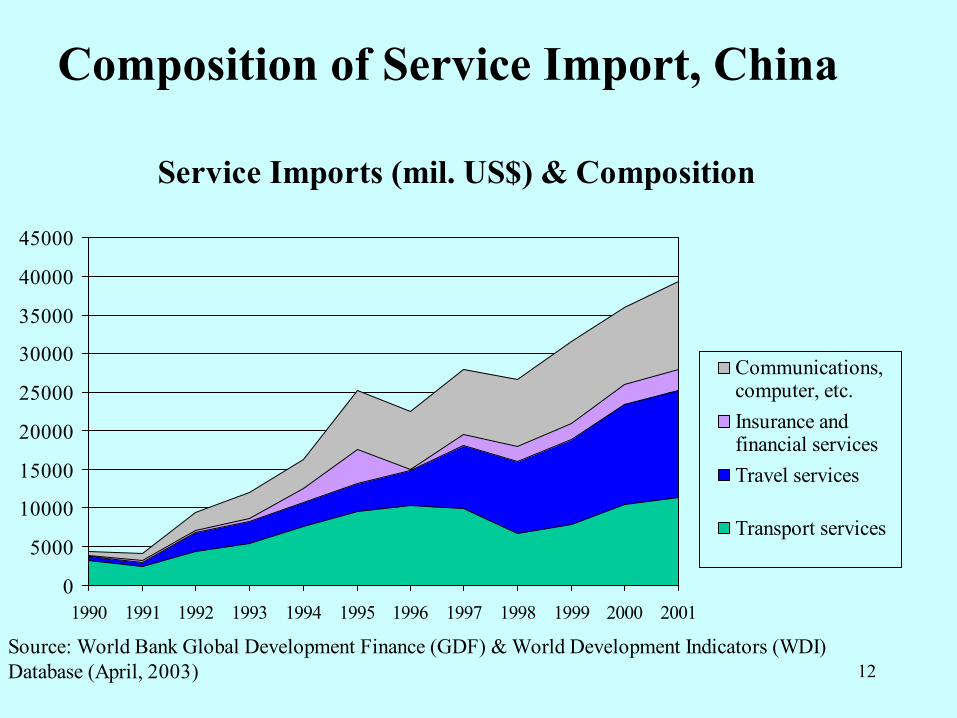
Composition of Service Import, China
Service Imports (mil. US$) & Composition
0
5000
10000
15000
20000
25000
30000
35000
40000
45000
1990 1991 1992 1993 1994 1995 1996 1997 1998 1999 2000 2001
Source: World Bank Global Development Finance (GDF) & World Development Indicators (WDI) Database (April, 2003)
Communications,computer, etc.Insurance andfinancial servicesTravel services
Transport services
13
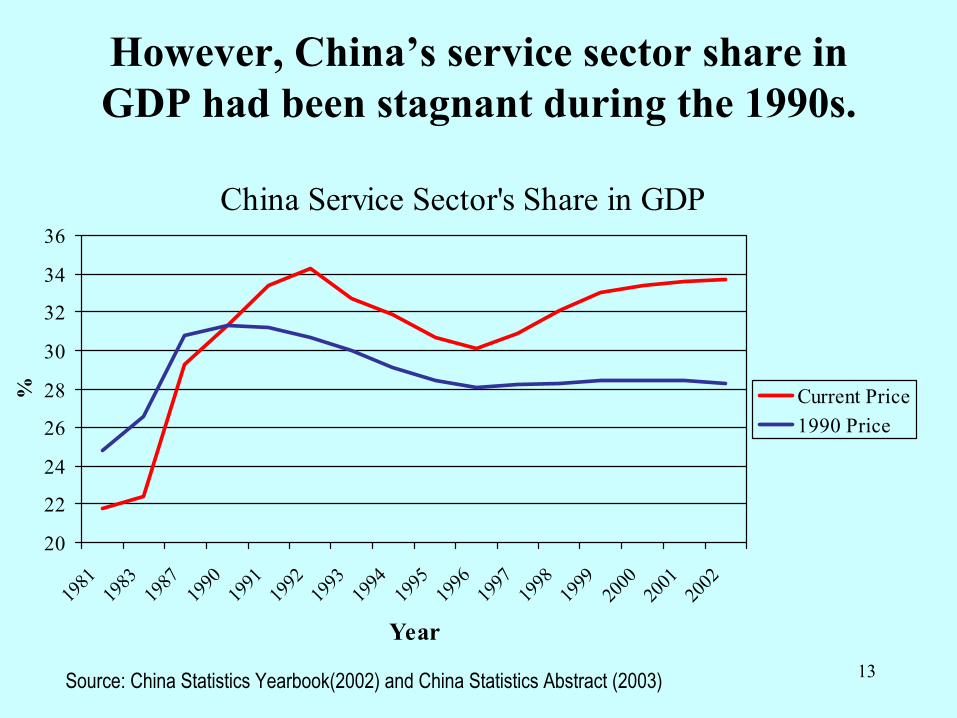
However, China’s service sector share in GDP had been stagnant during the 1990s.
China Service Sector's Share in GDP
20
22
24
26
28
30
32
34
36
1981
1983
1987
1990
1991
1992
1993
1994
1995
1996
1997
1998
1999
2000
2001
2002
Year
% Current Price1990 Price
Source: China Statistics Yearbook(2002) and China Statistics Abstract (2003)
14
CountryServices, etc.,
value added (% of GDP)
GDP per capita, PPP (current
international $) India 48.42 2840Indonesia 37.11 2940Azerbaijan 36.34 3090Sri Lanka 53.82 3180Syrian Arab Republic 49.58 3280Egypt, Arab Rep. 50.15 3520Morocco 53.27 3600Philippines 53.57 3840Jordan 73.17 3870China 33.62 4020Ukraine 44.36 4350Peru 61.58 4570Source: World Development Indicators (2003)
Service Sector: China and Countries with Similar GDP per capita
15
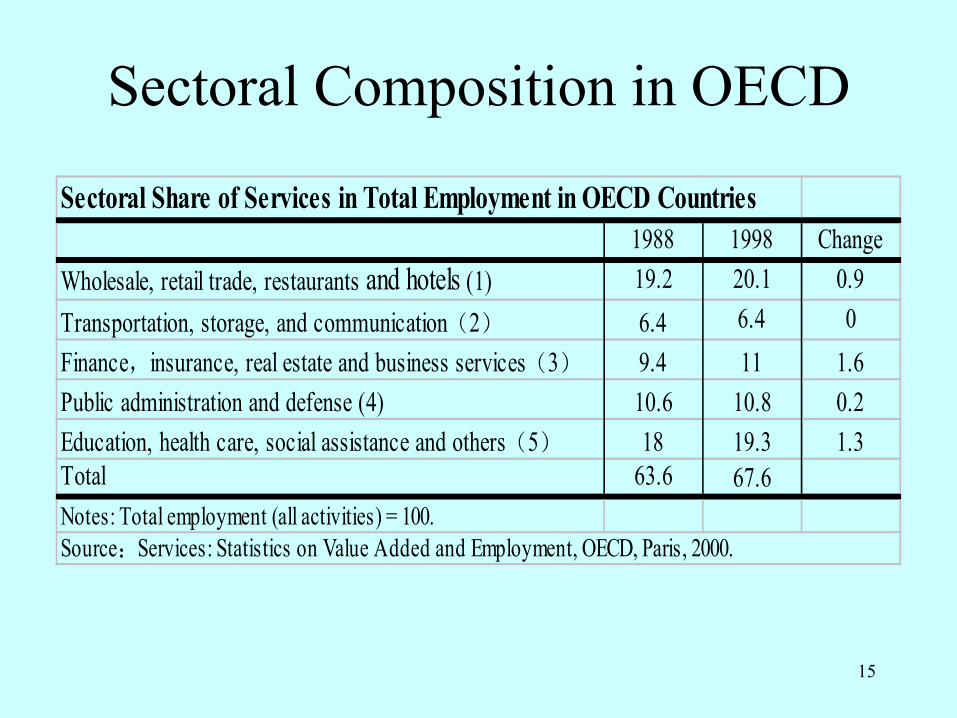
Sectoral Share of Services in Total Employment in OECD Countries1988 1998 Change
Wholesale, retail trade, restaurants and hotels (1) 19.2 20.1 0.9Transportation, storage, and communication(2) 6.4 6.4 0Finance,insurance, real estate and business services(3) 9.4 11 1.6Public administration and defense (4) 10.6 10.8 0.2Education, health care, social assistance and others(5) 18 19.3 1.3Total 63.6 67.6Notes: Total employment (all activities) = 100.Source:Services: Statistics on Value Added and Employment, OECD, Paris, 2000.
Sectoral Composition in OECD
16
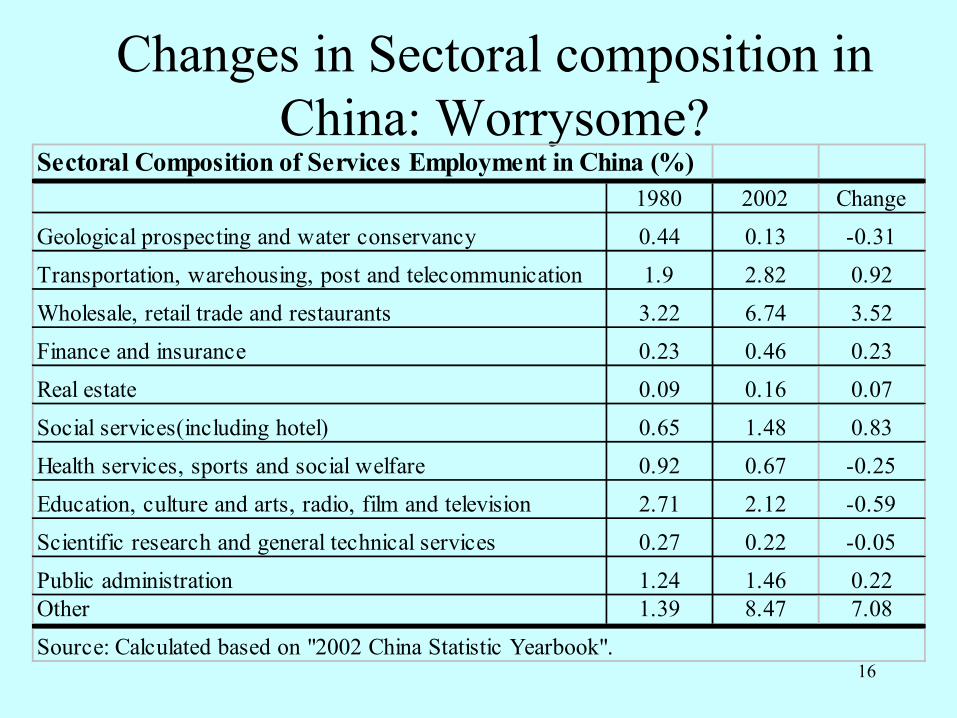
Changes in Sectoral composition in China: Worrysome?
Sectoral Composition of Services Employment in China (%)1980 2002 Change
Geological prospecting and water conservancy 0.44 0.13 -0.31
Transportation, warehousing, post and telecommunication 1.9 2.82 0.92
Wholesale, retail trade and restaurants 3.22 6.74 3.52
Finance and insurance 0.23 0.46 0.23
Real estate 0.09 0.16 0.07
Social services(including hotel) 0.65 1.48 0.83
Health services, sports and social welfare 0.92 0.67 -0.25
Education, culture and arts, radio, film and television 2.71 2.12 -0.59
Scientific research and general technical services 0.27 0.22 -0.05
Public administration 1.24 1.46 0.22Other 1.39 8.47 7.08
Source: Calculated based on "2002 China Statistic Yearbook".
17
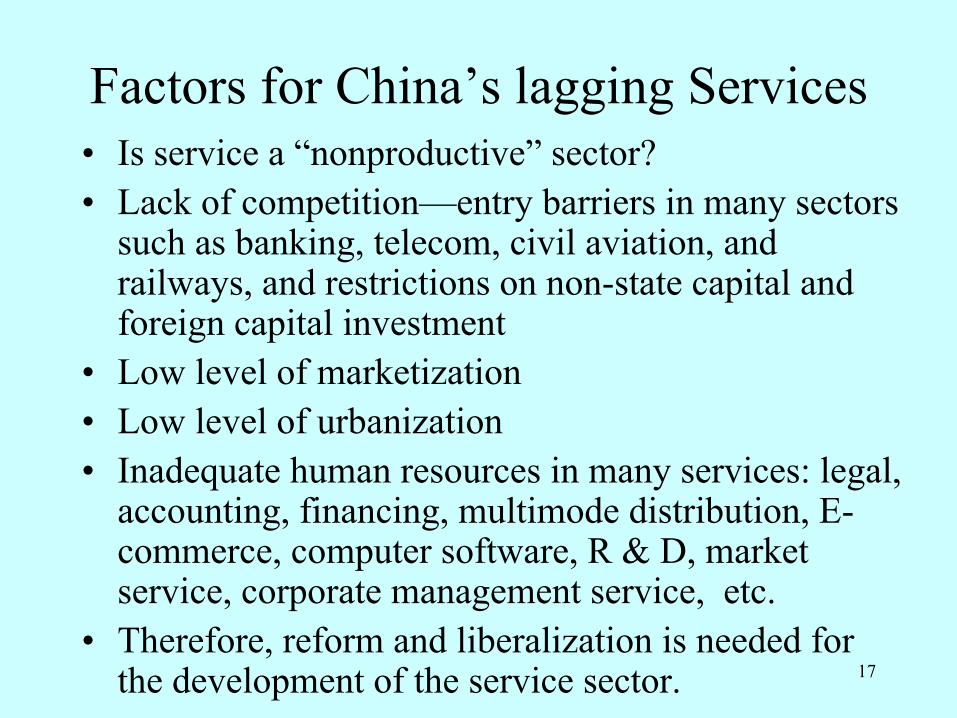
Factors for China’s lagging Services• Is service a “nonproductive” sector?• Lack of competition—entry barriers in many sectors
such as banking, telecom, civil aviation, and railways, and restrictions on non-state capital and foreign capital investment
• Low level of marketization• Low level of urbanization• Inadequate human resources in many services: legal,
accounting, financing, multimode distribution, E-commerce, computer software, R & D, market service, corporate management service, etc.
• Therefore, reform and liberalization is needed for the development of the service sector.
18
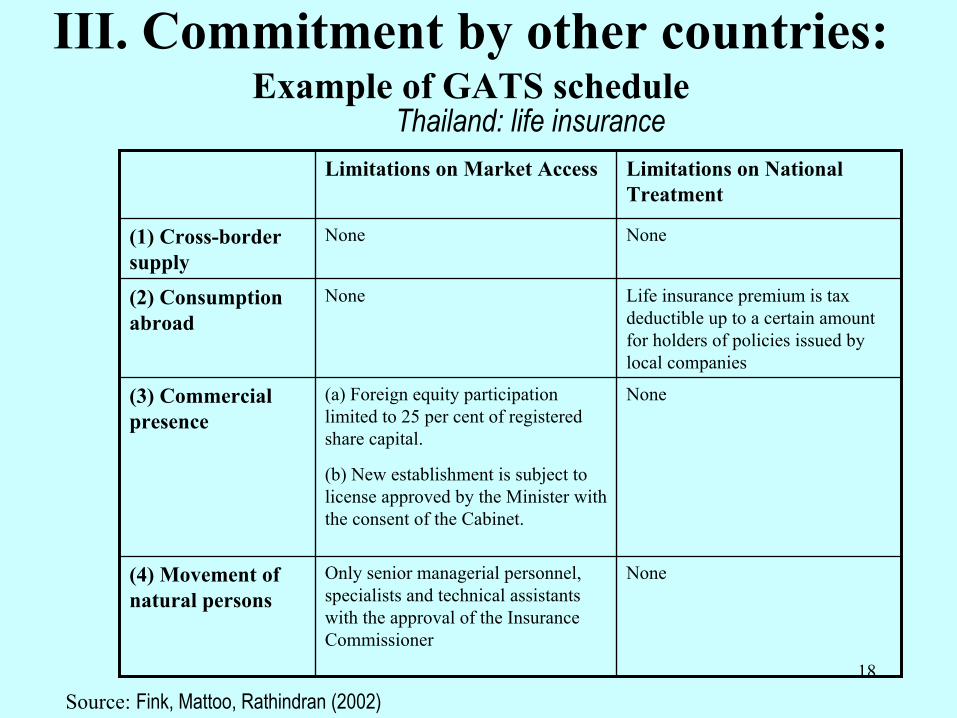
III. Commitment by other countries:Example of GATS schedule
NoneOnly senior managerial personnel, specialists and technical assistants with the approval of the Insurance Commissioner
(4) Movement of natural persons
None(a) Foreign equity participation limited to 25 per cent of registered share capital.
(b) New establishment is subject to license approved by the Minister with the consent of the Cabinet.
(3) Commercial presence
Life insurance premium is tax deductible up to a certain amount for holders of policies issued by local companies
None(2) Consumption abroad
NoneNone(1) Cross-border supply
Limitations on National Treatment
Limitations on Market Access
Thailand: life insurance
Source: Fink, Mattoo, Rathindran (2002)
19
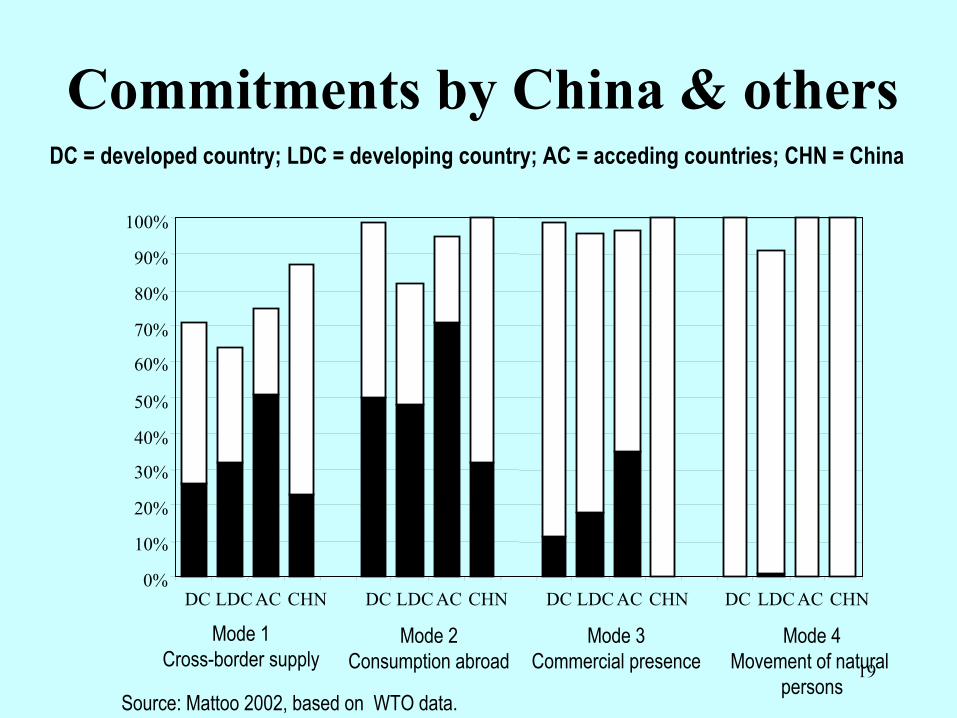
Commitments by China & others
0%
10%
20%
30%
40%
50%
60%
70%
80%
90%
100%
DC LDC AC CHN DC LDC AC CHN DC LDC AC CHN DC LDC AC CHN
Mode 1Cross-border supply
Mode 2Consumption abroad
Mode 3Commercial presence
Mode 4Movement of natural
personsSource: Mattoo 2002, based on WTO data.
DC = developed country; LDC = developing country; AC = acceding countries; CHN = China
20
IV. Macro impact of liberalizing the service sector—CGE analysis
A Computable General Equilibrium(CGE) model of China
• 52 productive sectors and 2 households by urban and rural
• Productive factors– agricultural land, capital, labor by rural/urban and skill
• monopolistic competition – Transportation, communication, finance, insurance, real estate,
social service, education, health and cultural service
21
Simulations Design• Base case projection for 2000-2010• Service liberalization case – incorporated four
aspects of policy or institutional changes.– Promote the competition in service sector – Increased foreign investment resulted from reduction of
barriers– Productivity increases in service sector induced by
service liberalization– Halving the barriers to services trade
• All policy changes will be phased in over the period from 2003-2010
22
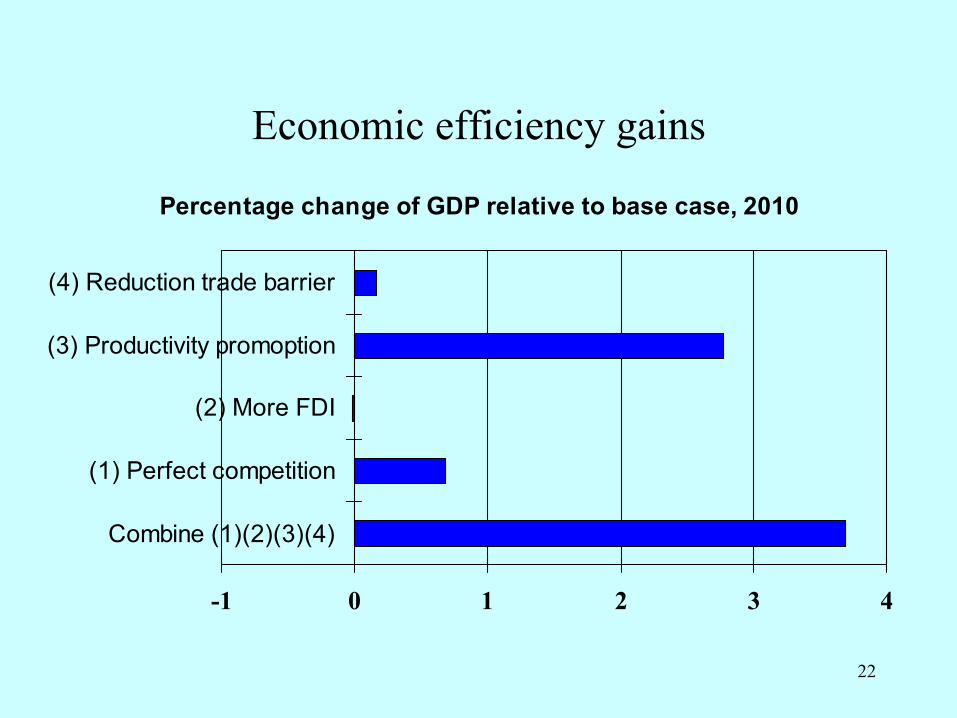
Economic efficiency gains
Percentage change of GDP relative to base case, 2010
-1 0 1 2 3 4
Combine (1)(2)(3)(4)
(1) Perfect competition
(2) More FDI
(3) Productivity promoption
(4) Reduction trade barrier
23
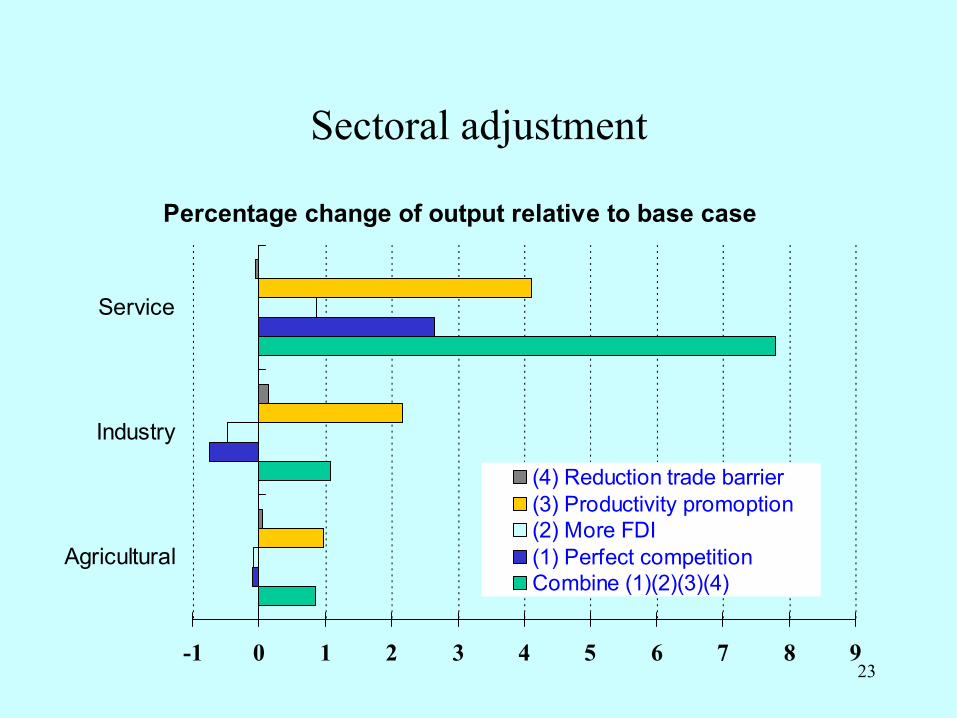
Sectoral adjustment
Percentage change of output relative to base case
-1 0 1 2 3 4 5 6 7 8 9
Agricultural
Industry
Service
(4) Reduction trade barrier(3) Productivity promoption(2) More FDI(1) Perfect competitionCombine (1)(2)(3)(4)
24
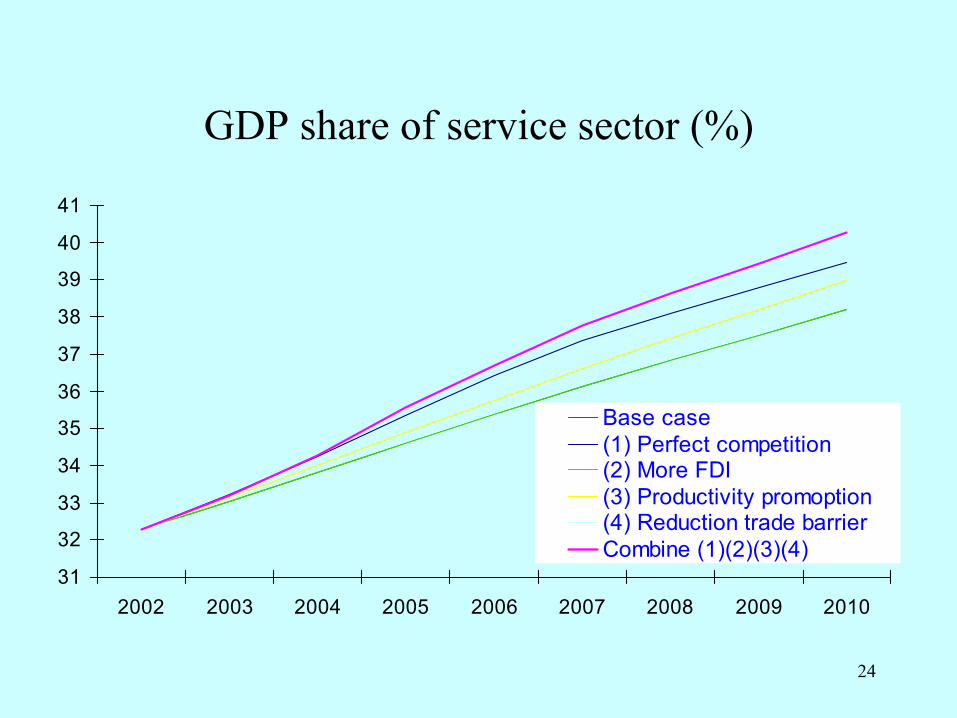
GDP share of service sector (%)
31
32
33
34
35
36
37
38
39
40
41
2002 2003 2004 2005 2006 2007 2008 2009 2010
Base case(1) Perfect competition(2) More FDI(3) Productivity promoption(4) Reduction trade barrierCombine (1)(2)(3)(4)
25
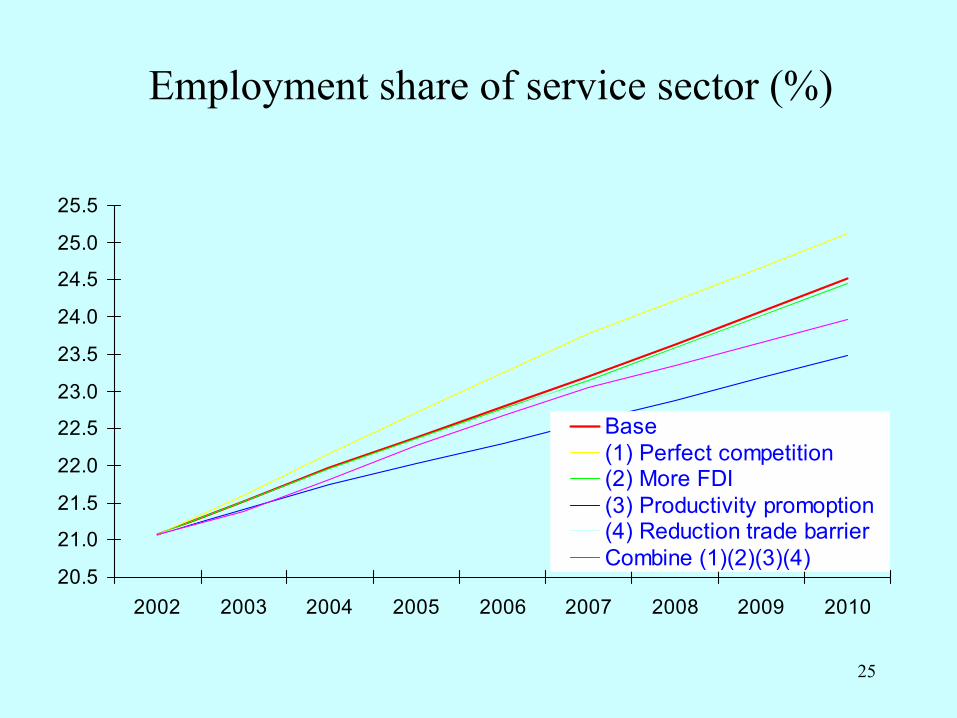
Employment share of service sector (%)
20.5
21.0
21.5
22.0
22.5
23.0
23.5
24.0
24.5
25.0
25.5
2002 2003 2004 2005 2006 2007 2008 2009 2010
Base(1) Perfect competition(2) More FDI(3) Productivity promoption(4) Reduction trade barrierCombine (1)(2)(3)(4)
26
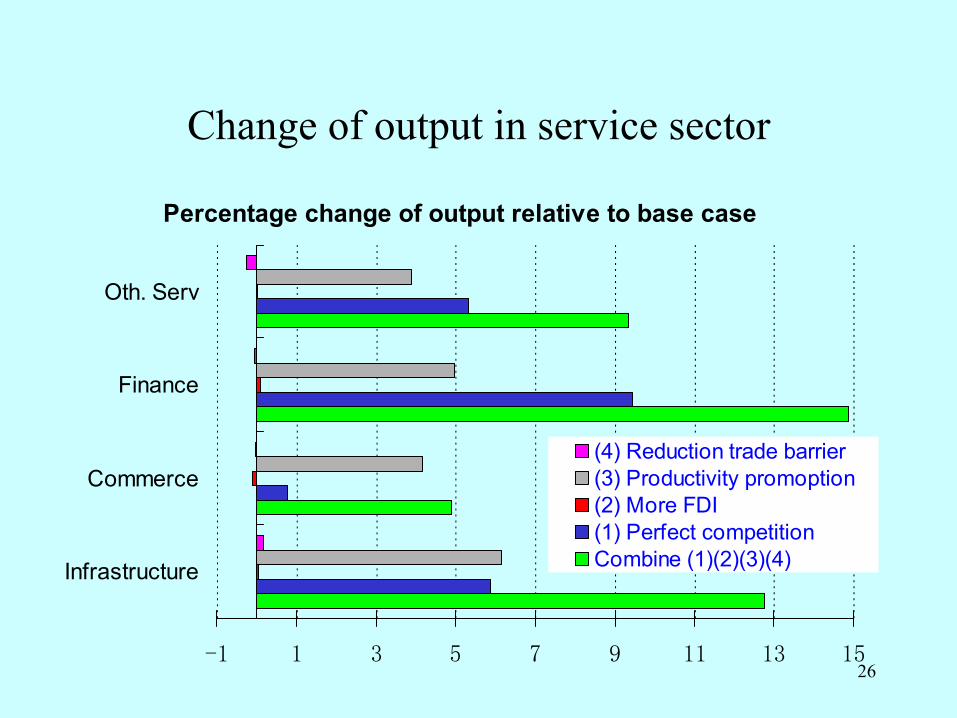
Change of output in service sector
Percentage change of output relative to base case
-1 1 3 5 7 9 11 13 15
Infrastructure
Commerce
Finance
Oth. Serv
(4) Reduction trade barrier(3) Productivity promoption(2) More FDI(1) Perfect competitionCombine (1)(2)(3)(4)
27
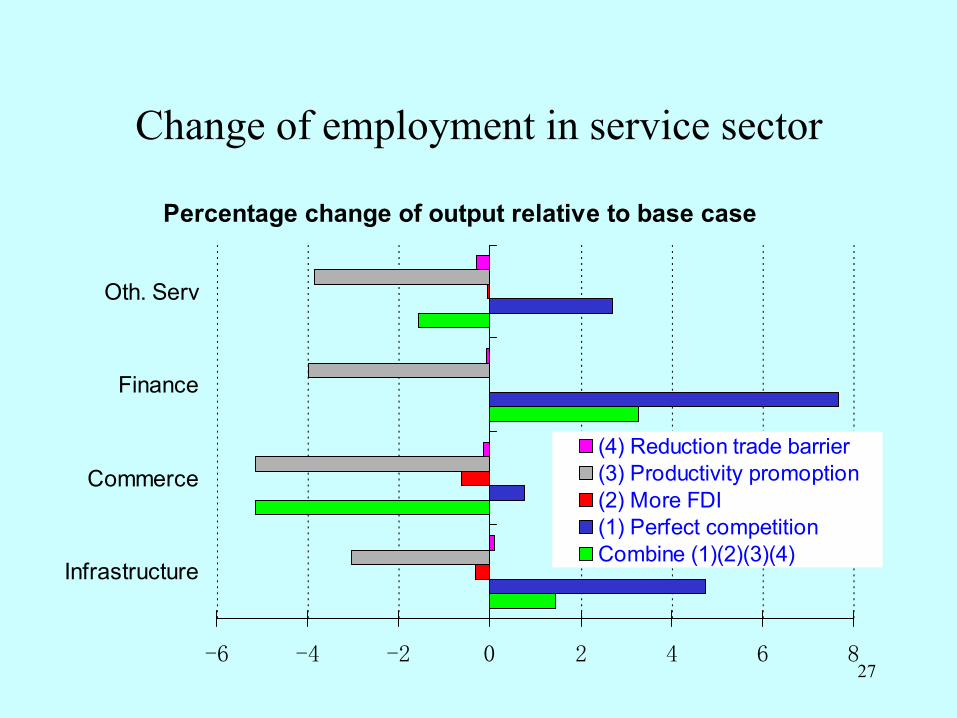
Change of employment in service sector
Percentage change of output relative to base case
-6 -4 -2 0 2 4 6 8
Infrastructure
Commerce
Finance
Oth. Serv
(4) Reduction trade barrier(3) Productivity promoption(2) More FDI(1) Perfect competitionCombine (1)(2)(3)(4)
28
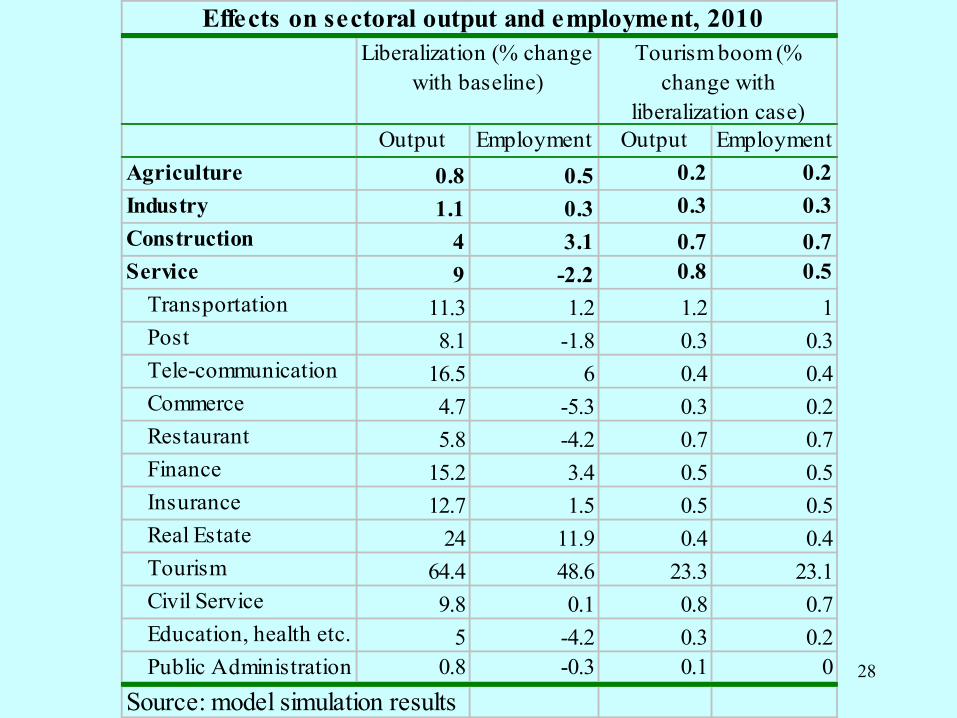
Effects on sectoral output and employment, 2010
Output Employment Output EmploymentAgriculture 0.8 0.5 0.2 0.2Industry 1.1 0.3 0.3 0.3Construction 4 3.1 0.7 0.7Service 9 -2.2 0.8 0.5
Transportation 11.3 1.2 1.2 1Post 8.1 -1.8 0.3 0.3Tele-communication 16.5 6 0.4 0.4Commerce 4.7 -5.3 0.3 0.2Restaurant 5.8 -4.2 0.7 0.7Finance 15.2 3.4 0.5 0.5Insurance 12.7 1.5 0.5 0.5Real Estate 24 11.9 0.4 0.4Tourism 64.4 48.6 23.3 23.1Civil Service 9.8 0.1 0.8 0.7Education, health etc. 5 -4.2 0.3 0.2Public Administration 0.8 -0.3 0.1 0
Source: model simulation results
Liberalization (% change with baseline)
Tourism boom (% change with
liberalization case)
29
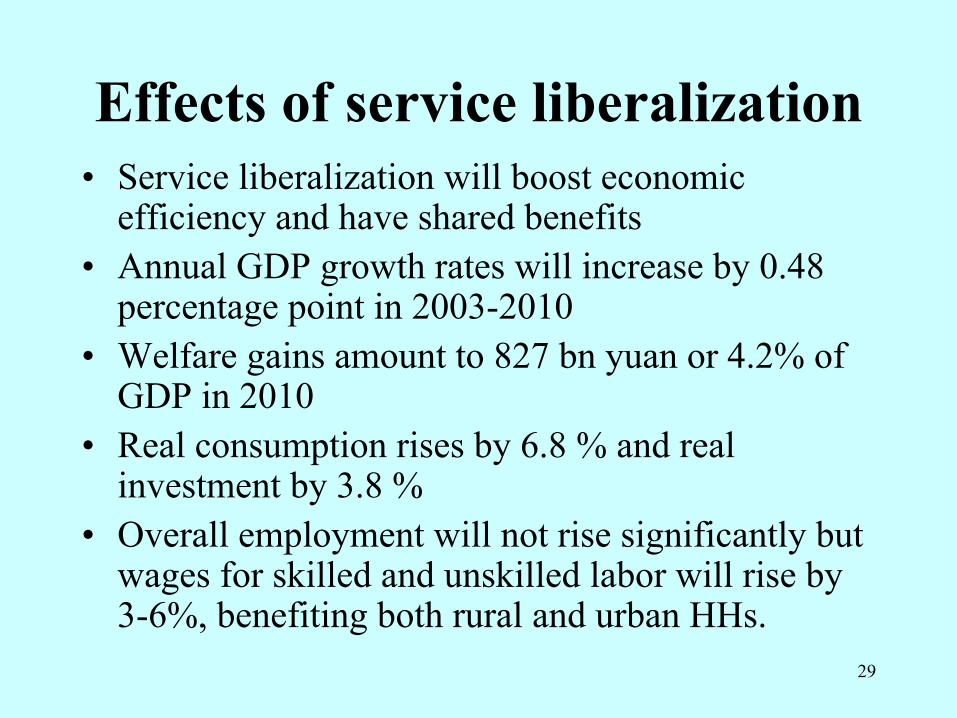
Effects of service liberalization• Service liberalization will boost economic
efficiency and have shared benefits• Annual GDP growth rates will increase by 0.48
percentage point in 2003-2010• Welfare gains amount to 827 bn yuan or 4.2% of
GDP in 2010• Real consumption rises by 6.8 % and real
investment by 3.8 %• Overall employment will not rise significantly but
wages for skilled and unskilled labor will rise by 3-6%, benefiting both rural and urban HHs.
30
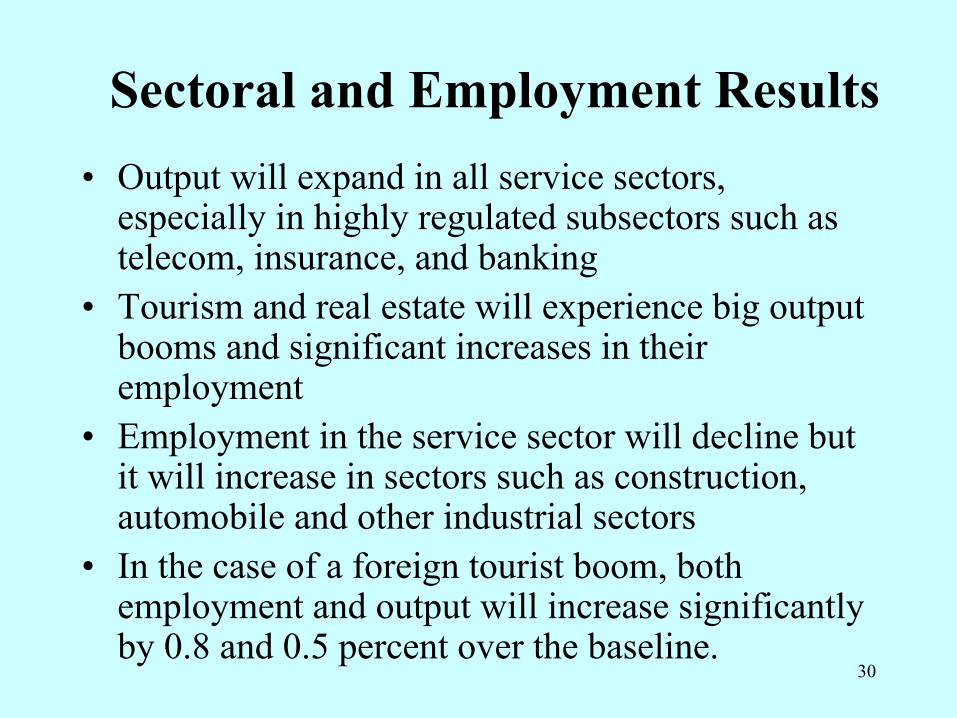
Sectoral and Employment Results• Output will expand in all service sectors,
especially in highly regulated subsectors such as telecom, insurance, and banking
• Tourism and real estate will experience big output booms and significant increases in their employment
• Employment in the service sector will decline but it will increase in sectors such as construction, automobile and other industrial sectors
• In the case of a foreign tourist boom, both employment and output will increase significantly by 0.8 and 0.5 percent over the baseline.
31
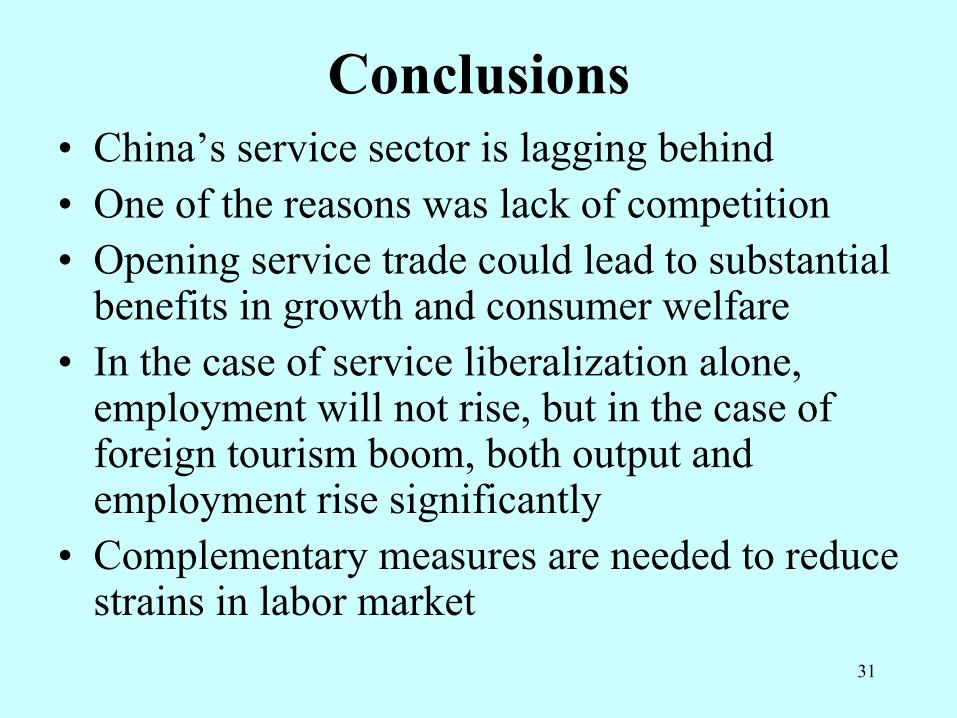
Conclusions• China’s service sector is lagging behind• One of the reasons was lack of competition• Opening service trade could lead to substantial
benefits in growth and consumer welfare• In the case of service liberalization alone,
employment will not rise, but in the case of foreign tourism boom, both output and employment rise significantly
• Complementary measures are needed to reduce strains in labor market


![JBICI Discussion Paper Series - JICA · capital account liberalization should follow current account and domestic financial sector liberalization (McKinnon [1973]). This sequence](https://img.pdfslide.us/doc/110x75/5eaca35f778aaf228459eea6/jbici-discussion-paper-series-jica-capital-account-liberalization-should-follow.jpg)