Embed Size (px)
DESCRIPTION
This is a detailed presentation of services marketing
Citation preview
Size of Service Sector
The Services Sector contributes the most to the Indian GDP. The Sector of Services in India has the biggest share in the country's GDP, it accounts for more than 50% contribution
The various sectors under the Services Sector in India are construction, trade, hotels, transport, restaurant, communication and storage, social and personal services, community, insurance, financing, business services, and real estate.
Services marketing concepts and strategies have developed in response to the tremendous growth of service industries
Most new employment is provided by services
Strongest growth area for marketing
Deregulation and Services Marketing
Specific demand for services marketing concepts has come from deregulated industries and professional servicesDeregulatory moves by governments have
affected service industries such as airlines, banking, and telecommunicationsAs a result, marketing decisions that used to
be tightly controlled by government are now partially, and sometimes totally, within the control of individual firms
Learning ObjectivesDifference between services and consumer marketingConsumer Behaviour in servicesCustomer Expectation & perception of Services Building customer relationship Service development & design Physical Evidence & People in service Service Marketing CommunicationDelivering ServicePricing of services Strategies of Services
Defining Services
Services include all economic activities whose output is not a physical product or construction, is generally consumed at the time it is produced, and provides added value in forms (such as convenience, amusement, timeliness, comfort, or health) that are essentially intangible.
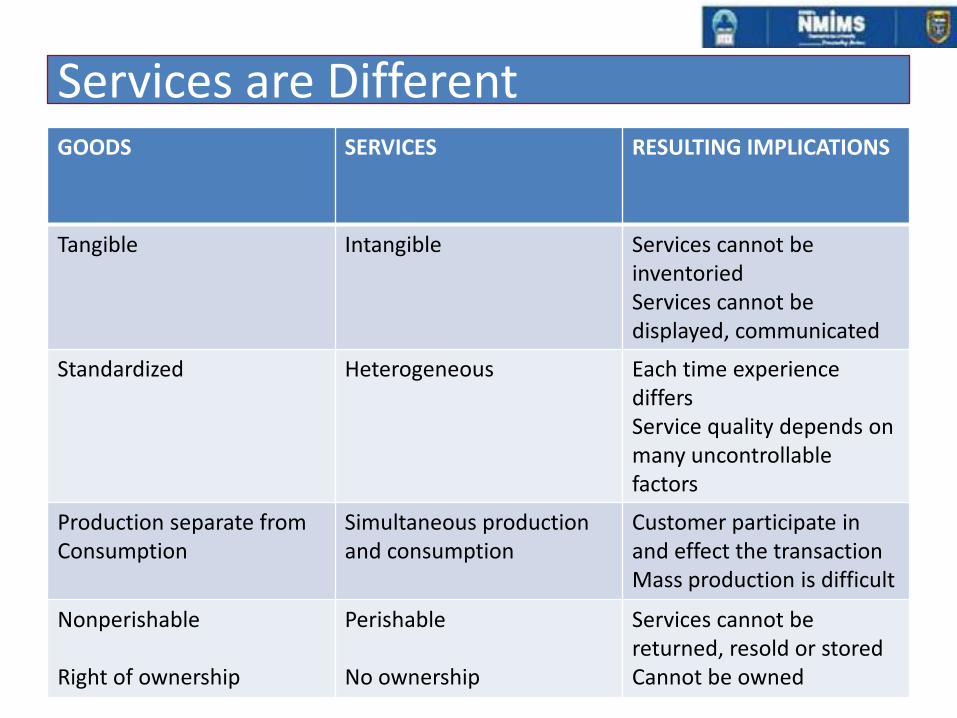
Services are Different GOODS SERVICES RESULTING IMPLICATIONS
Tangible Intangible Services cannot be inventoriedServices cannot be displayed, communicated
Standardized Heterogeneous Each time experience differsService quality depends on many uncontrollable factors
Production separate from Consumption
Simultaneous production and consumption
Customer participate in and effect the transactionMass production is difficult
Nonperishable
Right of ownership
Perishable
No ownership
Services cannot be returned, resold or storedCannot be owned

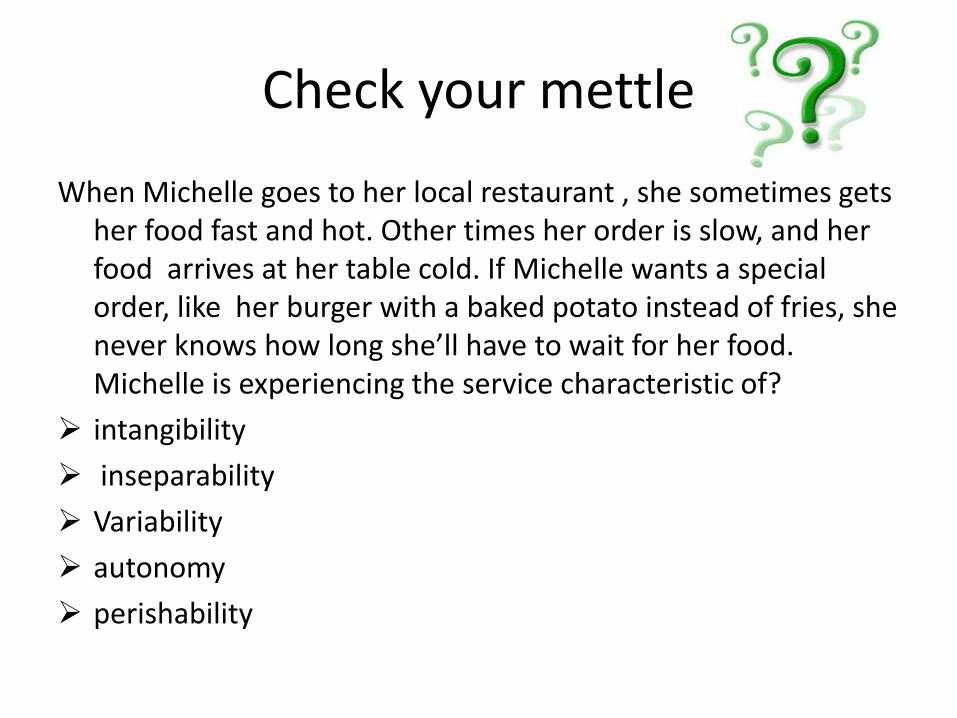
Check your mettle
When Michelle goes to her local restaurant , she sometimes gets her food fast and hot. Other times her order is slow, and her food arrives at her table cold. If Michelle wants a special order, like her burger with a baked potato instead of fries, she never knows how long she’ll have to wait for her food. Michelle is experiencing the service characteristic of?
intangibility
inseparability
Variability
autonomy
perishability
Tangibility in Perspective
Services tend to be more intangible than manufactured products, and manufactured products tend to be more tangible than services. For example, the fast-food industry, while classified as a service, also has many tangible components such as the food, the packaging, and so on.”
Tangibility Spectrum
A useful way to distinguish a service from a product is to place them on a scale from tangible-dominant to intangible-dominant.
When more than half the value comes from service element
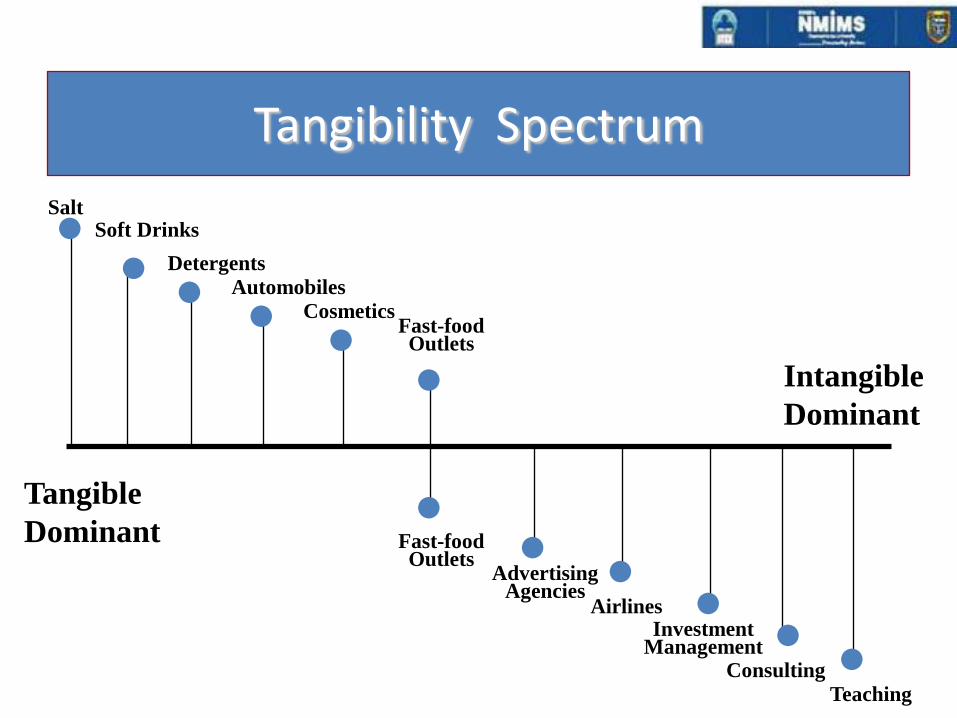
Tangibility Spectrum
TangibleDominant
IntangibleDominant
SaltSoft Drinks
DetergentsAutomobiles
Cosmetics
AdvertisingAgencies
AirlinesInvestment
ManagementConsulting
Teaching
Fast-foodOutlets
Fast-foodOutlets
Tangibility Spectrum
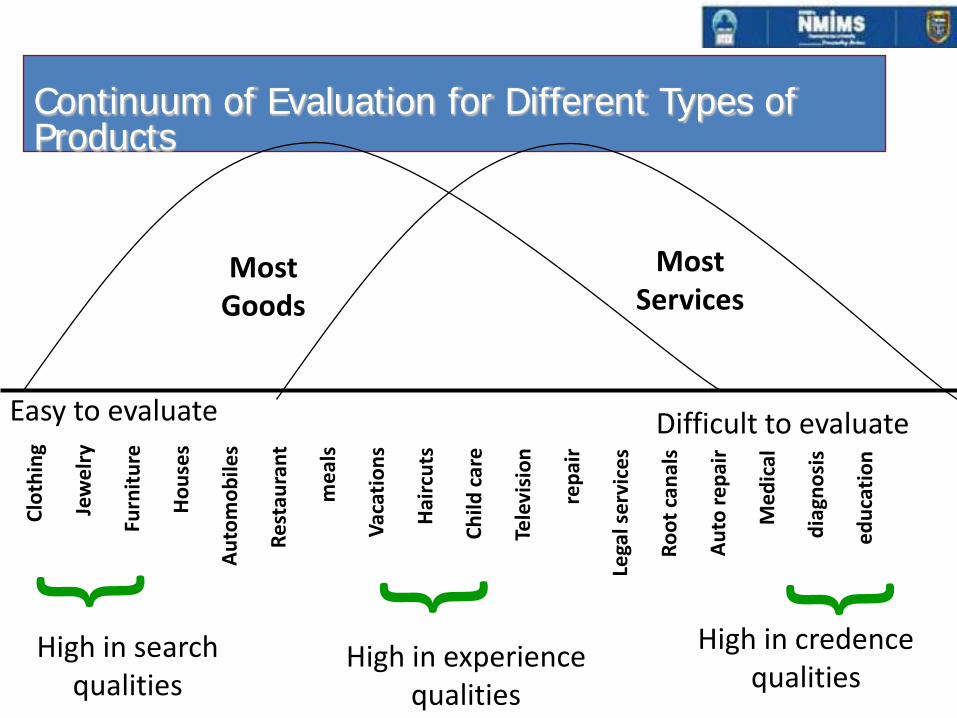
Continuum of Evaluation for Different Types of Products
Difficult to evaluateEasy to evaluate
High in searchqualities
High in experiencequalities
High in credencequalities
MostGoods
MostServices
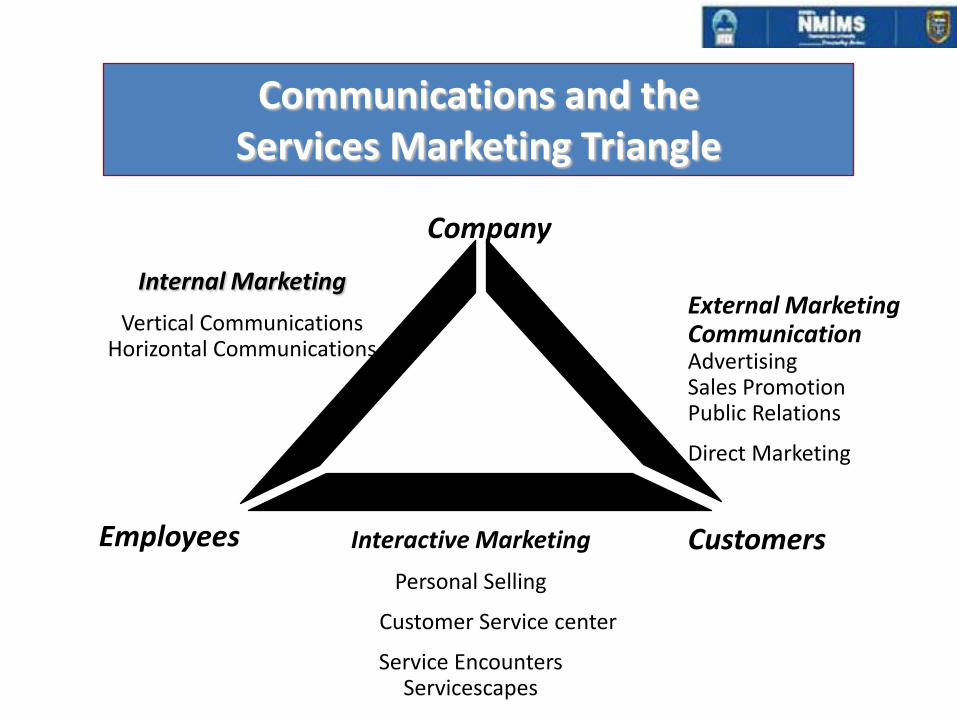
Communications and the Services Marketing Triangle
Internal Marketing
Vertical Communications Horizontal Communications
Interactive Marketing
Personal Selling
Customer Service center
Service Encounters Servicescapes
External Marketing CommunicationAdvertising Sales Promotion Public Relations
Direct Marketing
Company
CustomersEmployees
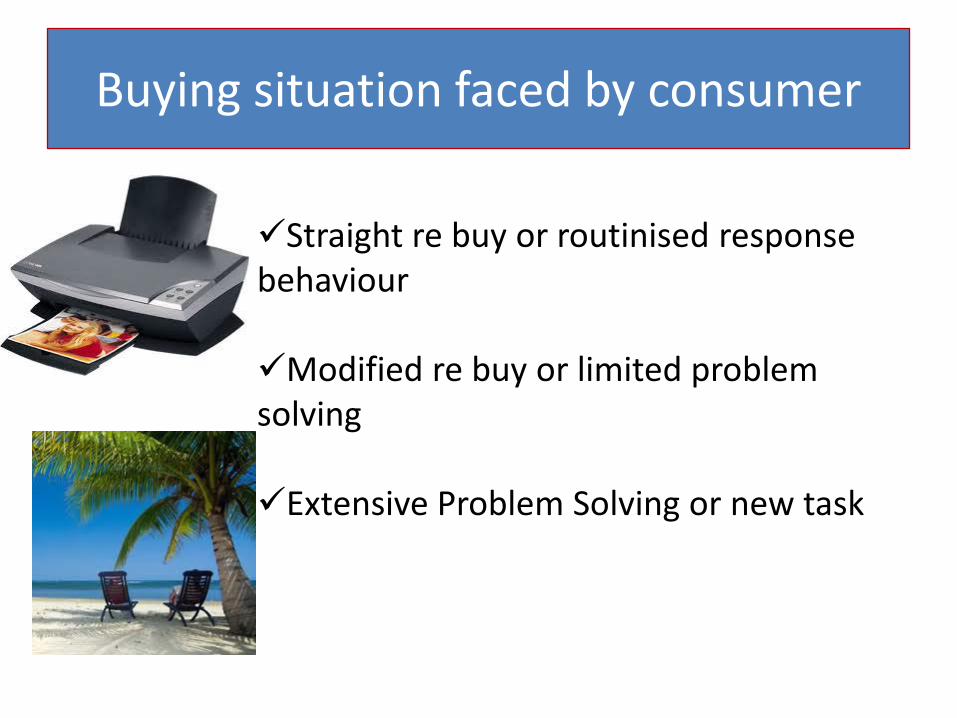
Buying situation faced by consumer
Straight re buy or routinised response behaviour
Modified re buy or limited problem solving
Extensive Problem Solving or new task
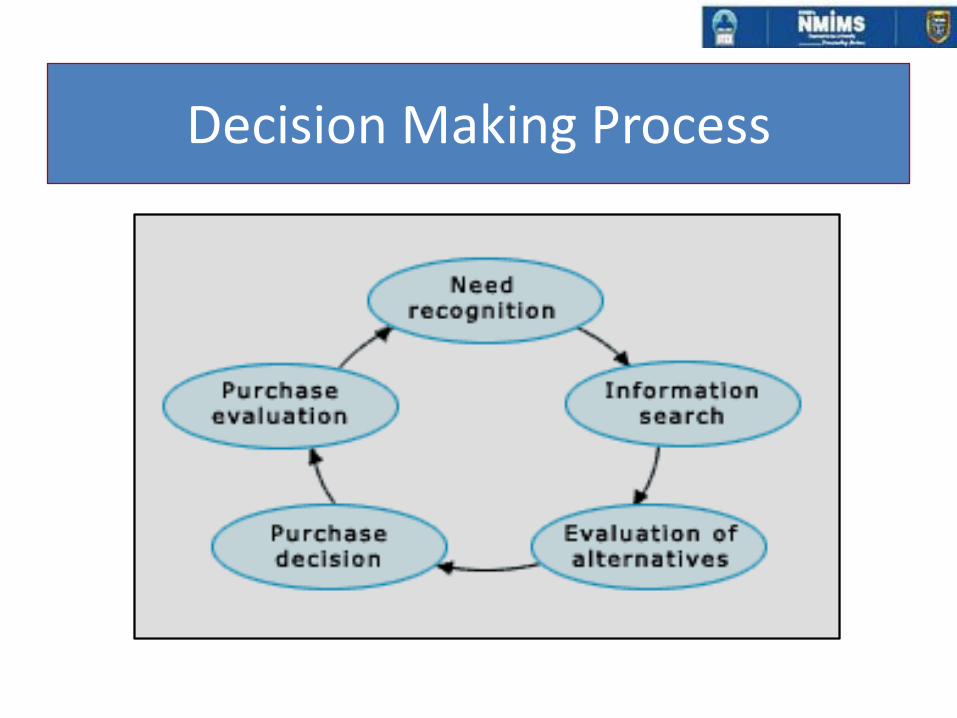
Decision Making Process
Recognition of Need:
Primary Need : Need by occasion urgency and priority
Secondary need : Follow up needs to primary demands which could include both goods as well as services.
Maslow’s hierarchy of needs
• Physiological Needs
• Safety and Security needs
• Social needs
• Ego Needs
• Self Actualisation
Factors Effecting decision making process
• Culture
• Value Attitude
• Manners and Customs
• Reference Group
• Social class
• Education
• Perception
• Motivation
• Attitude
• Personality
Customer Expectation & perception of Services
• Customers hold Different types of expectations for services
• Customer expectations are beliefs about service industry that function as standards or reference point against which performance is judged.
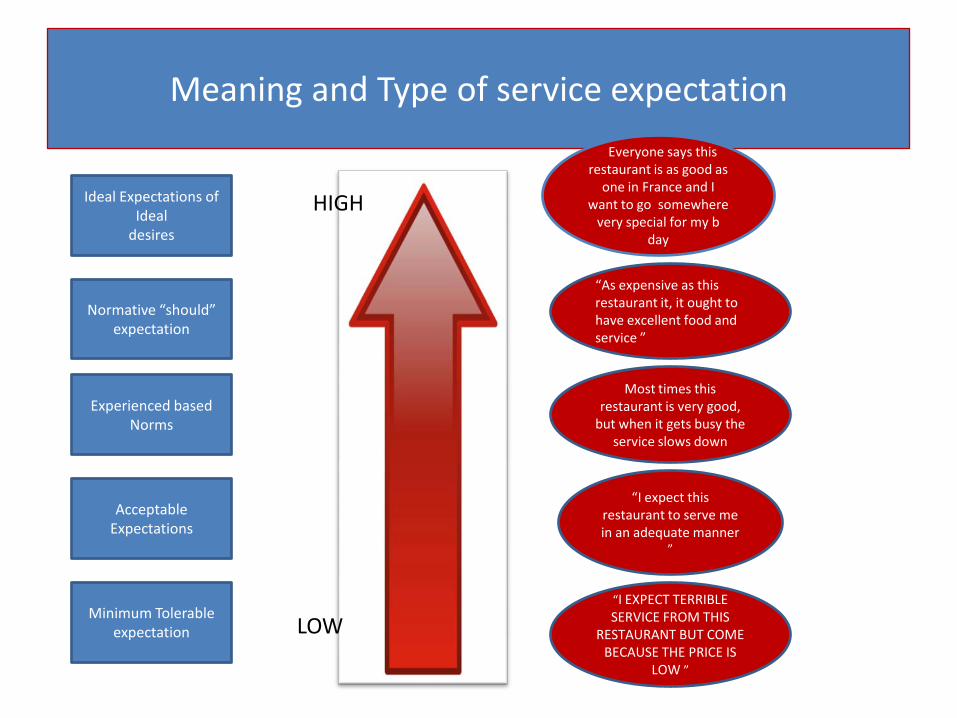
Meaning and Type of service expectation
Ideal Expectations of Ideal
desires
Normative “should” expectation
Experienced based Norms
Acceptable Expectations
Minimum Tolerable expectation
Everyone says this restaurant is as good as
one in France and I want to go somewhere
very special for my b day
“As expensive as this restaurant it, it ought to have excellent food and service ”
Most times this restaurant is very good,
but when it gets busy the service slows down
“I expect this restaurant to serve me in an adequate manner
”
“I EXPECT TERRIBLE SERVICE FROM THIS
RESTAURANT BUT COME BECAUSE THE PRICE IS
LOW ”
HIGH
LOW
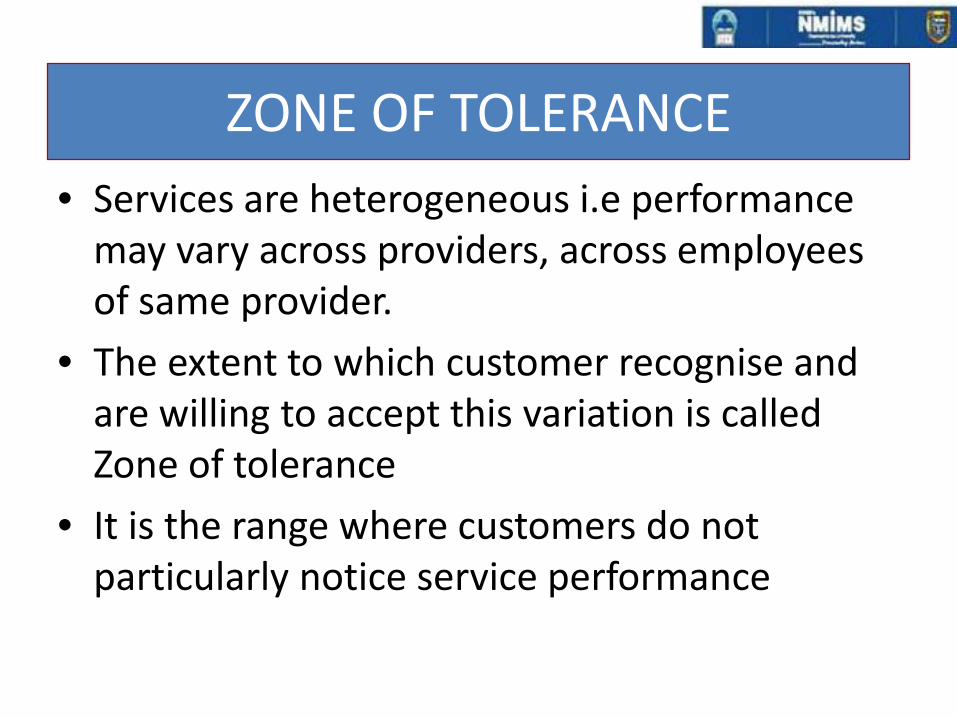
ZONE OF TOLERANCE • Services are heterogeneous i.e performance
may vary across providers, across employees of same provider.
• The extent to which customer recognise and are willing to accept this variation is called Zone of tolerance
• It is the range where customers do not particularly notice service performance
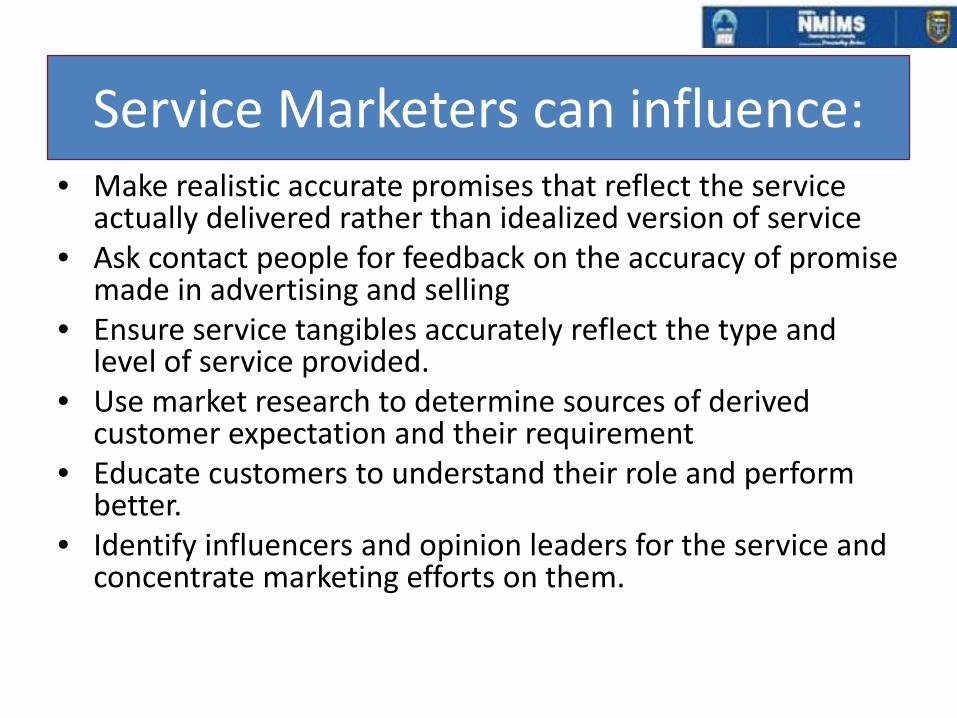
Service Marketers can influence:• Make realistic accurate promises that reflect the service
actually delivered rather than idealized version of service• Ask contact people for feedback on the accuracy of promise
made in advertising and selling • Ensure service tangibles accurately reflect the type and
level of service provided.• Use market research to determine sources of derived
customer expectation and their requirement • Educate customers to understand their role and perform
better.• Identify influencers and opinion leaders for the service and
concentrate marketing efforts on them.
Points to ponder!!!
• Should a company try to delight the customer?• What does a service marketer do if the customer
expectation are unrealistic?• How does a company exceed customer service
expectation?• Do customer service expectation continually
escalate?• How does a service company stay ahead of
competition in meeting customer expectation ?
???
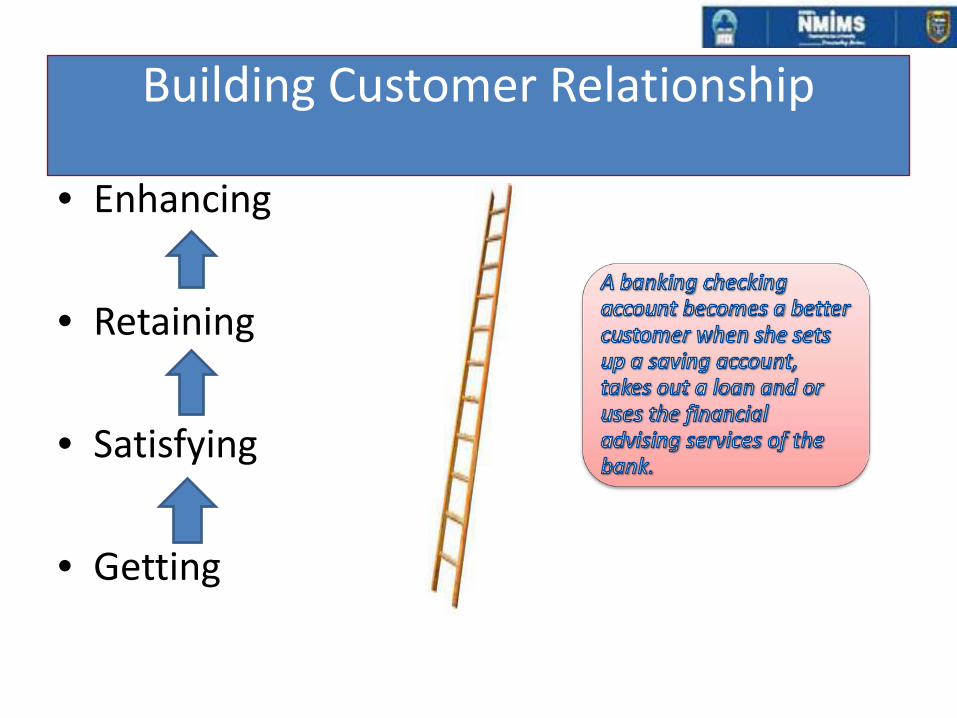
Building Customer Relationship
• Enhancing
• Retaining
• Satisfying
• Getting
1. The first step in managing a loyalty based business system is finding and acquiring the right customers.
2. After acquisition of the desirable customers the next step is to build relationships and turn them into loyal customers who will generate a growing revenue stream for the company.
3. A loyal customer is a consistent source of revenue for the organisation. This loyalty has to be sustained by continuously providing superior quality and value.
Factors Contributing to Incremental profits In a Business
Profit derived from increased purchases.
Profit from reduced operating costs.
Profits from referrals to other customers.
Profit from Price premium.
Customer Lifetime Value
• It is equivalent to life time profitability generated by a loyal customer. It depends on the average revenue generated over a period of time, referrals generated by the customer over the period of time and also the costs incurred to serve the customer.
Foundations For Relationship Strategies
1. Quality offered in the core service
2. Careful market segmentation & targeting
3. Continuous monitoring of relationships
Continuous Monitoring of Relationships.
Annual customer relationship surveys through basic market research help in monitoring strategy.
A well designed customer data base is beneficial to provide all relevant information.
Service Development and Design
• Have you ever considered starting your own service business? What type of services would it be? What would you so first? Even if you have understood your market and customer expectation, how would you go about designing the service to meet those needs
Challenges of Service design
Oversimplification
Incompleteness
Subjectivity
Biased interpretation
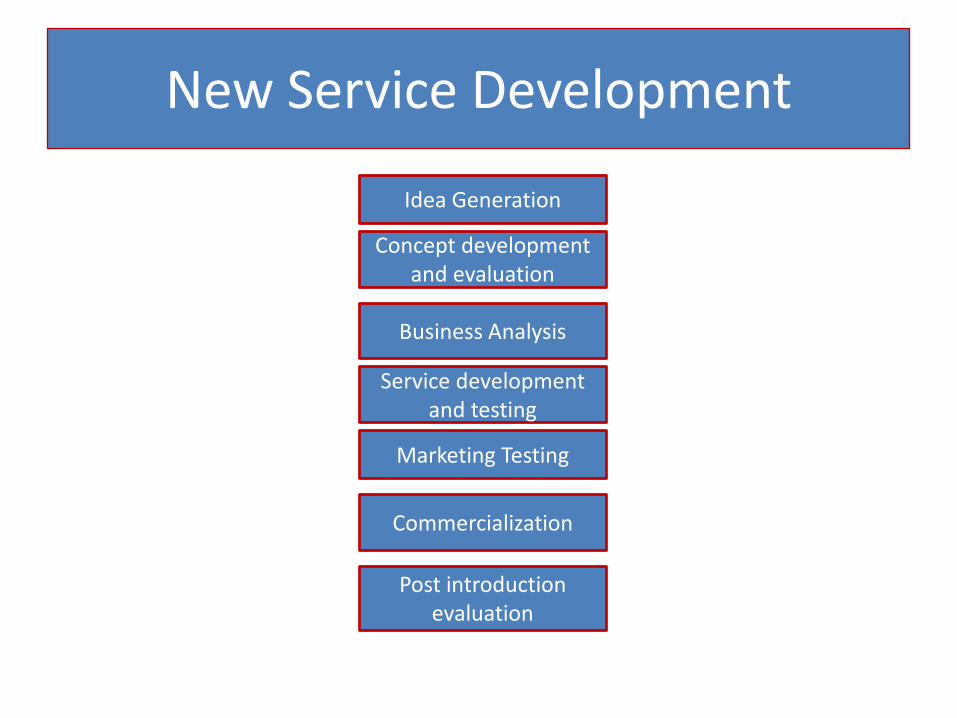
New Service Development
Idea Generation
Concept development and evaluation
Business Analysis
Service development and testing
Marketing Testing
Commercialization
Post introduction evaluation

Service Blue printing
• A service blue print is a picture or a map that accurately portrays the service system so that the difference people involved in providing it can understand and deal with it objectively regardless of their roles or their individual points of view.
• Blue prints are especially useful at the design and redesign stage
• They help to break a service down to its logical components
• They visually display the service by simultaneously depicting the process of service delivery, role of customers and employees and the visible element of the service

PHYSICAL EVIDENCE AND PEOPLE IN SERVICE
• Physical evidence is the environment in which the service is delivered and where the firm and the customer interact and any tangible commodities that facilitate performance or communication of the service
• Physical evidence includes the servicescape, a term used to describe the physical facility where the service is produced and/or delivered.
• Physical facility ---(interior & exterior)
• Ambient conditions ---(temp. colors, noises, smells)
• Other tangibles
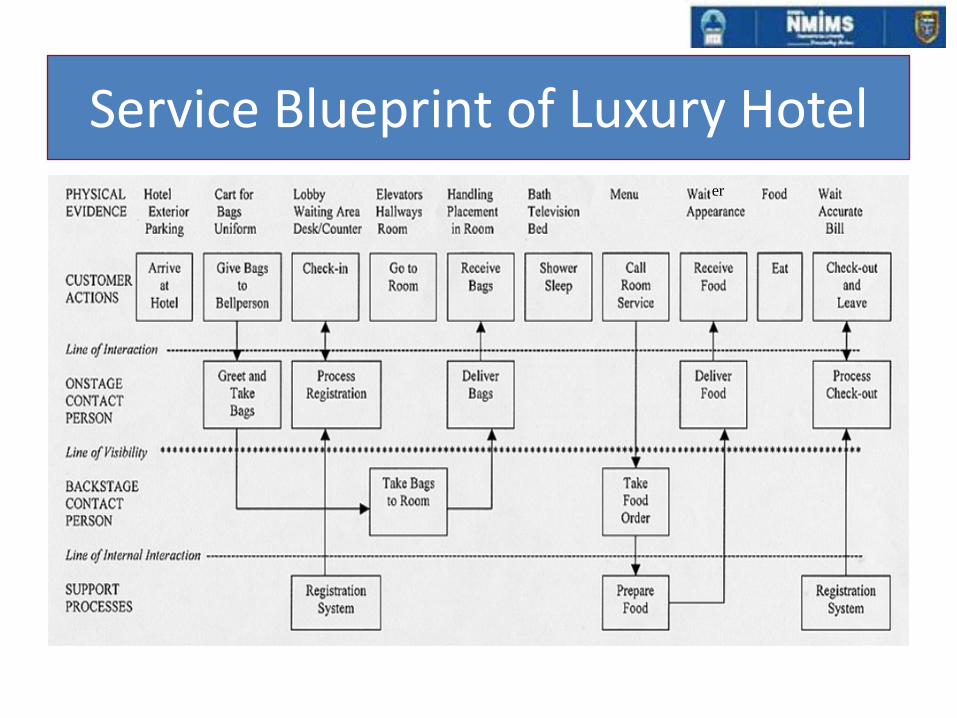
Service Blueprint of Luxury Hoteler
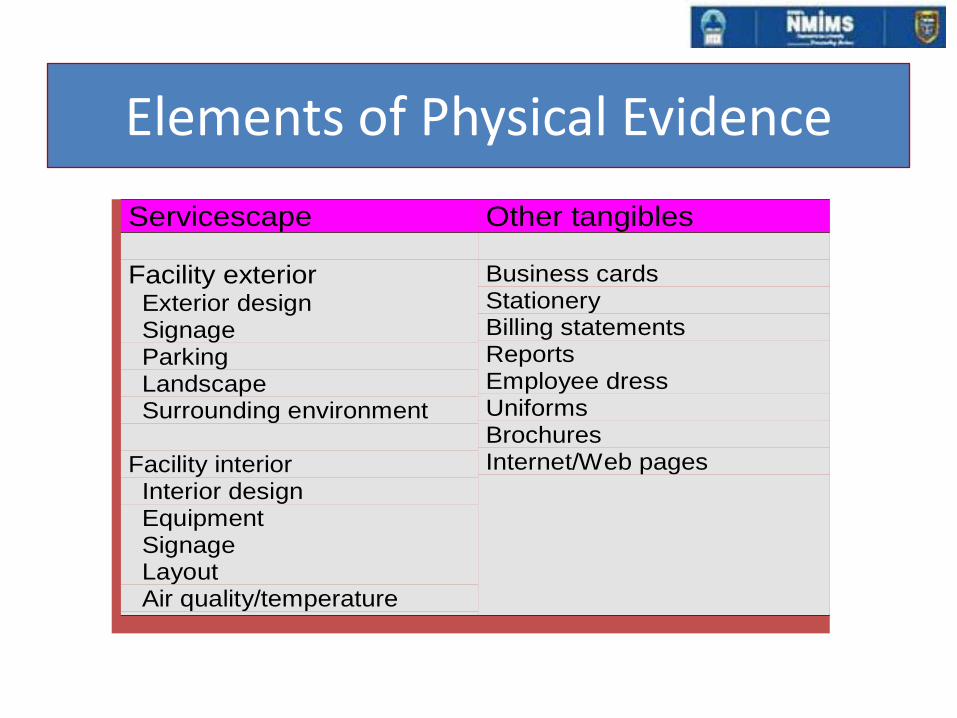
Elements of Physical Evidence
Servicescape Other tangibles
Facility exteriorExterior designSignageParkingLandscapeSurrounding environment
Facility interiorInterior designEquipmentSignageLayoutAir quality/temperature
Business cardsStationeryBilling statementsReportsEmployee dressUniformsBrochuresInternet/Web pages
Impact of Service Environment
• Purchase decision
• Expectations
• Service quality evaluations
• Satisfaction
Guidelines for Physical Evidence Strategy
• Recognize the strategic impact of physical evidence.
• Blueprint the physical evidence of service.
• Clarify strategic roles of the servicescape.
• Assess and identify physical evidence opportunities.
• Be prepared to update and modernize the evidence.
• Work cross-functionally.
CUSTOMERS’ ROLE INSERVICE DELIVERY
Customers play a very vital role in successful delivery of service as customers are often present in the place where service is produced (Delivered)
Customers alone can influence whether the delivered service is as per customer defined specifications.
Other customers who are present in the Service scape can also influence the Service positively or negatively.
The level of participation of customers varies from Service to Service.
In “High level of participation.” Eg. B to B projects like providing software solutions & consultancies.
In “Moderate level of participation” customers inputs are necessary to facilitate effective delivery of service
In entertainment service very “low level of participation” is required. Service provider provides the Service & only the customer’s presence is required to avail the service
In many Service deliveries other customers also affect the service delivery in a positive or negative way. This can influence the customer’s perceptions of Service quality and affect customer satisfaction.
DELIVERING SERVICE • Identify the primary channels through which services
are delivered to end customers• Provide examples of each of the key service
intermediaries• View delivery of service from two perspectives--the
service provider and the service deliverer• Identify the benefits and challenges of each method
of service delivery• Outline the strategies that are used to manage
service delivery through intermediaries
Service Provider Participants• service principal (originator)
– creates the service concept• (like a manufacturer)
• service deliverer (intermediary)– entity that interacts with the customer in the
execution of the service• (like a distributor/wholesaler)
• franchisees– e.g. McDonald’s, NIIT
• agents and brokers– e.g., travel agents, independent insurance agents
• electronic channels– e.g., ATMs, Internet banking
Key Issues Involving Intermediaries
• conflict over objectives and performance
• conflict over costs and rewards
• control of service quality
• empowerment versus control
• channel ambiguity
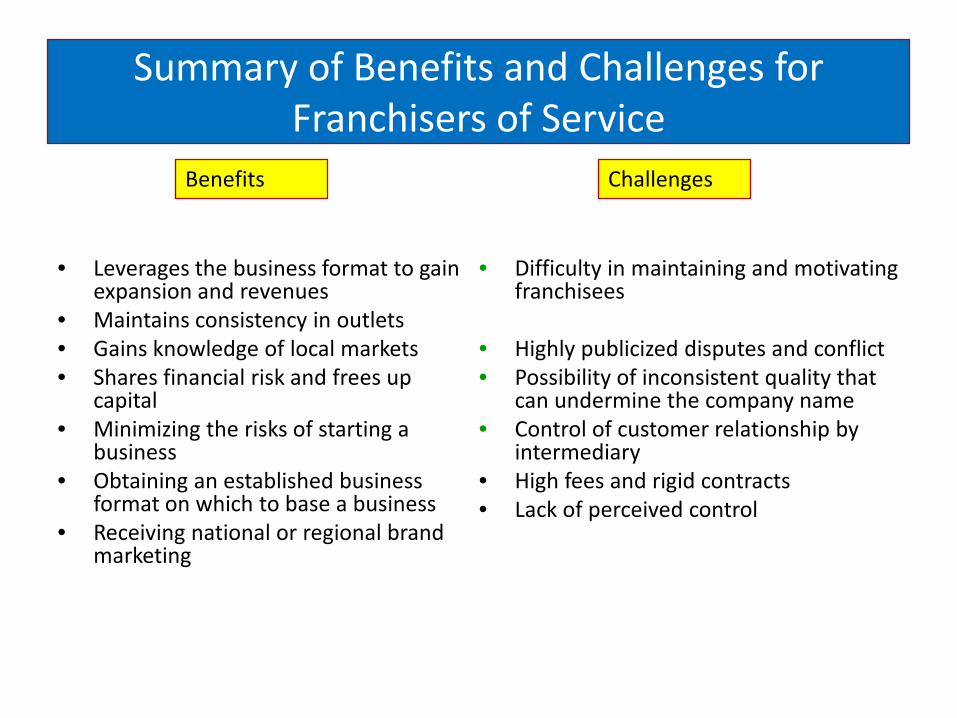
Summary of Benefits and Challenges for Franchisers of Service
• Leverages the business format to gain expansion and revenues
• Maintains consistency in outlets• Gains knowledge of local markets• Shares financial risk and frees up
capital• Minimizing the risks of starting a
business• Obtaining an established business
format on which to base a business• Receiving national or regional brand
marketing
• Difficulty in maintaining and motivating franchisees
• Highly publicized disputes and conflict• Possibility of inconsistent quality that
can undermine the company name• Control of customer relationship by
intermediary• High fees and rigid contracts• Lack of perceived control
Benefits Challenges
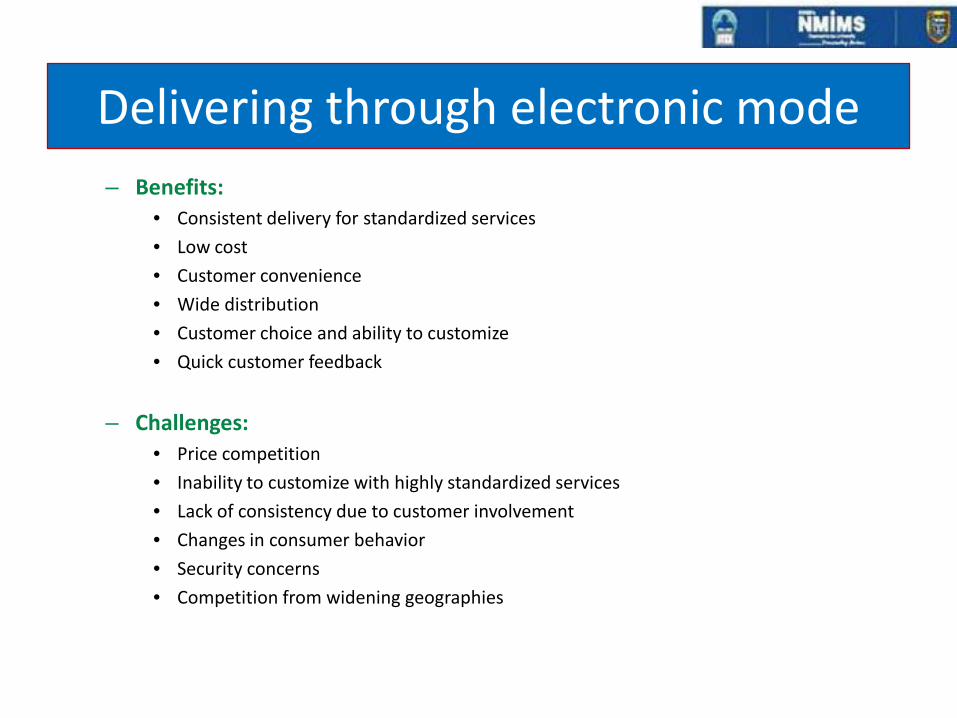
Delivering through electronic mode – Benefits:
• Consistent delivery for standardized services
• Low cost
• Customer convenience
• Wide distribution
• Customer choice and ability to customize
• Quick customer feedback
– Challenges:• Price competition
• Inability to customize with highly standardized services
• Lack of consistency due to customer involvement
• Changes in consumer behavior
• Security concerns
• Competition from widening geographies
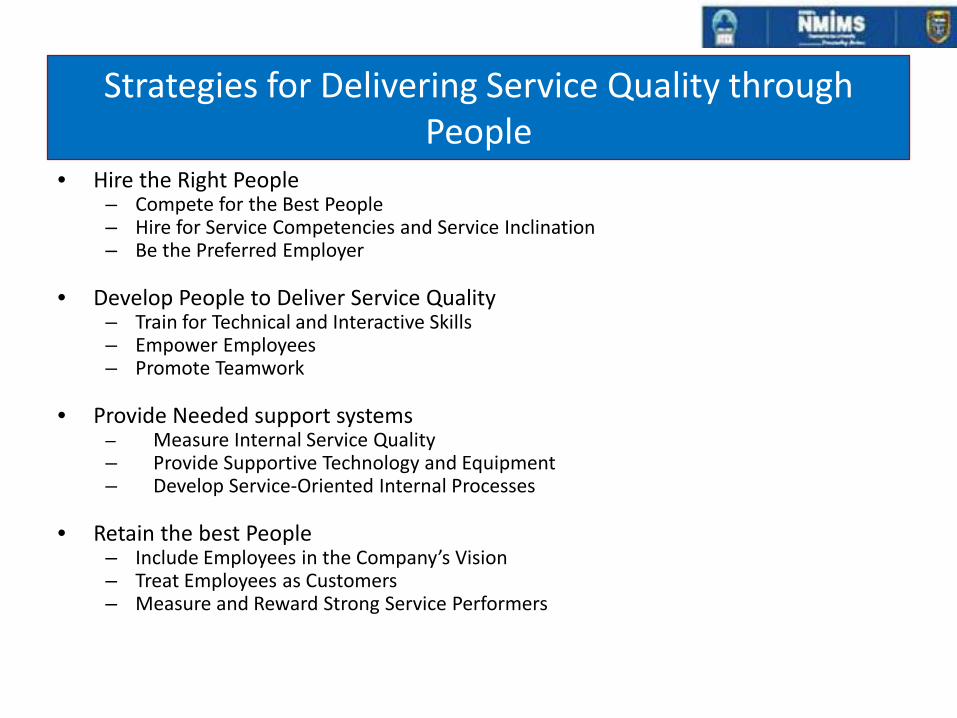
Strategies for Delivering Service Quality through People
• Hire the Right People– Compete for the Best People– Hire for Service Competencies and Service Inclination– Be the Preferred Employer
• Develop People to Deliver Service Quality– Train for Technical and Interactive Skills– Empower Employees– Promote Teamwork
• Provide Needed support systems– Measure Internal Service Quality– Provide Supportive Technology and Equipment– Develop Service-Oriented Internal Processes
• Retain the best People– Include Employees in the Company’s Vision– Treat Employees as Customers– Measure and Reward Strong Service Performers

Integrated Service Marketing Communication and promotions
• IMC is the development of an Integrated Comprehensive Marketing Communication (Promotion) Plan that links the marketing function with the communication function to deliver Effective Marketing Messages capable of
(1) informing(2) convincing(3) persuading people to buy.
Purposes of Marketing Communications
• Informs, persuades and reminds• Is part of the marketing mix• Includes all the means by which a company
communicates directly with potential customers.
• Attempt to influence feelings, beliefs, or behaviour
Cont….
• Not only informs, but is also used to differentiate the seller’s products/services
• May also be effective in affecting the price elasticity of demand (non-price competition)
• The marketing communications strategy of a firm must be coordinated and linked with concepts such as target segments, positioning, differentiation, and image
• Requires a closely coordinated approach
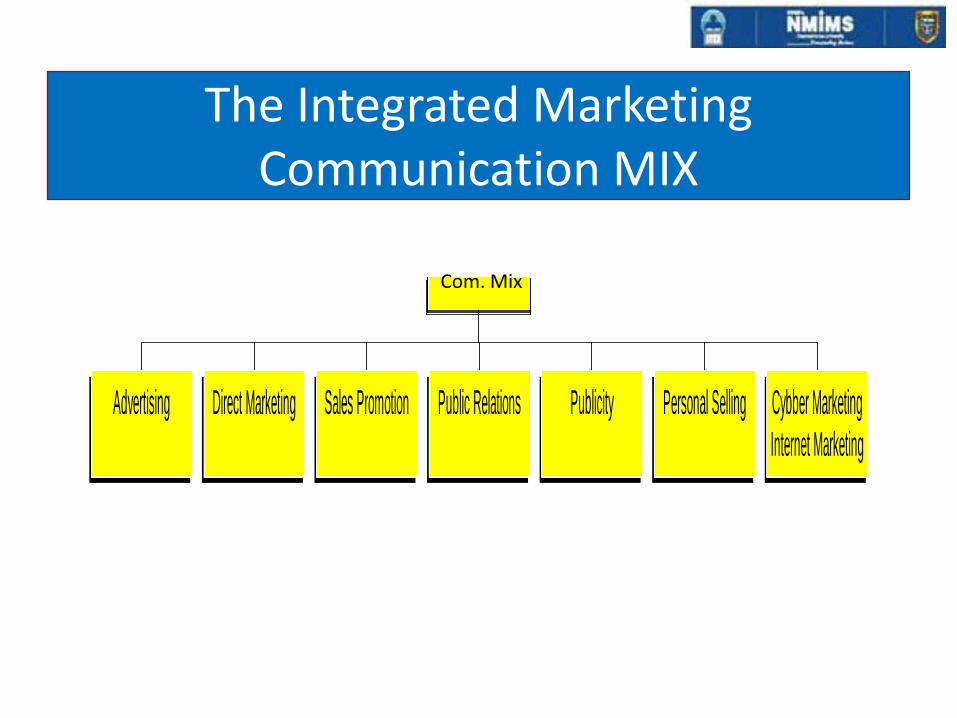
The Integrated Marketing Communication MIX
Advertising Direct Marketing Sales Promotion Public Relations Publicity Personal Selling Cybber MarketingInternet Marketing
Com. Mix
• Advertising: A paid, impersonal mass communication with a clearly-identified sponsor.
• Sales promotion: Demand-stimulating activity designed to supplement advertising and facilitate personal selling.
• Direct marketing: Form of communication that allows businesses and nonprofits to communicate straight to the customer, with techniques such as mobile messaging, email, interactive consumer websites, online display ads, fliers, catalog distribution
• Public relations: A planned communication effort by an organization to contribute to generally favourable attitudes and opinions toward an organization and its products.
• Publicity: A special form of public relations that involves news stories about an organization or its products.
• Personal selling: The direct presentation of a product to a prospective customer by a representative of the selling organization.
• Cyber Marketing: Internet based promotion through websites, banners, email, etc.
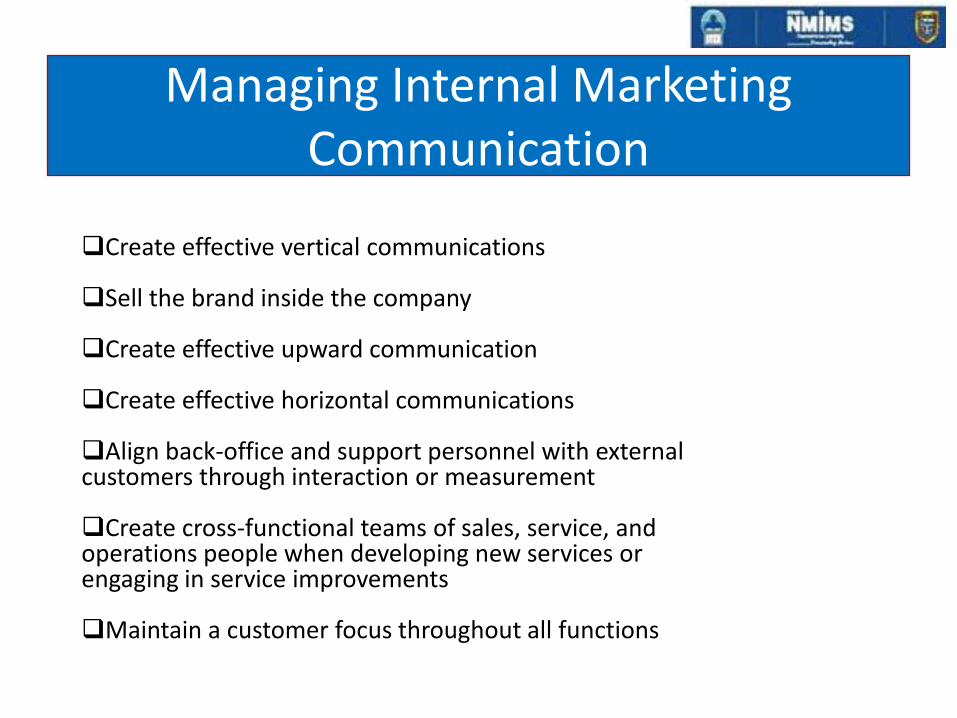
Managing Internal Marketing Communication
Create effective vertical communications
Sell the brand inside the company
Create effective upward communication
Create effective horizontal communications
Align back-office and support personnel with externalcustomers through interaction or measurement
Create cross-functional teams of sales, service, and operations people when developing new services or engaging in service improvements
Maintain a customer focus throughout all functions
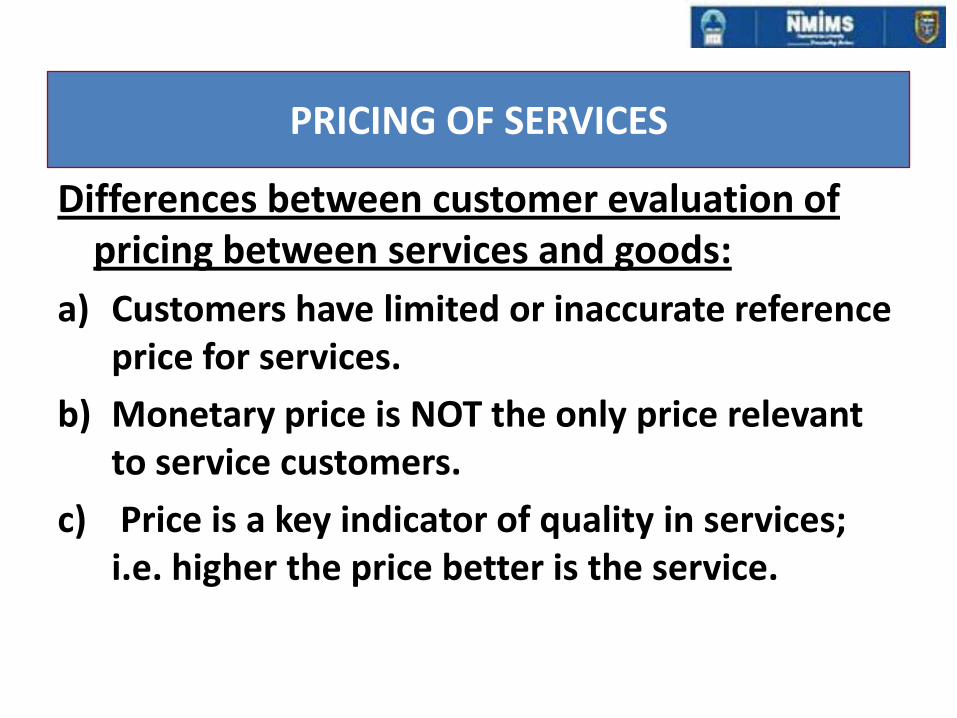
PRICING OF SERVICES
Differences between customer evaluation of pricing between services and goods:
a) Customers have limited or inaccurate reference price for services.
b) Monetary price is NOT the only price relevant to service customers.
c) Price is a key indicator of quality in services; i.e. higher the price better is the service.
NON MONETARY COSTS:
Time costs, search costs, convenience costs and psychological costs are the non monetary costs in a service and play an equally important role like that of monetary cost.
PRICE AS AN INDICATOR OF SERVICE QUALITY:
In the absence of other forms of communication from the company, price becomes the sole decisive factor in selection of a service. Customers look for cues like information through advertising, brand image etc.
In certain services which are perceived as high risk like consultancy services and medical treatment the customers associate pricing with quality assurance.
Too low a pricing can act as a repellant. It could sendnegative signals. Too high a price can set very high expectations
PRICING APPROACHES
a. Cost based.
b. Competition based.
c. Demand based.
A. Cost based Pricing
Cost based Pricing: Used in services like advertising, contracting etc.
Price = Direct Cost+
Overhead Cost+
Profit Margin
B. COMPETITION BASEDPRICING
This approach is based on using the competitors’ price as the point of reference
Eg: Fitness clubs, Driving classes, Computer classes etc.
a. When services are standard across providers. b. In oligopolies where there are few large service
providers : Airlinesc. Going-rate Pricingd. Sealed bid pricing: govt. tenders
C.DEMAND BASED PRICING
• Based on establishing prices consistent with customer perception of value i.e. pricing depends on what customers are likely to pay for the services provided
• Example Show time in multiplexes, happy hours in restaurants, midnight buffets. Etc
SERVICE RECOVERY • Service recovery is the action initiated by the service
provider in response to a service failure, like unavailability of service, a delayed or slow service, an incorrect or poorly executed service or non empathetic or rude behaviour by service provider.
• Customers react positively to effective service recovery initiatives and are more prone to loyalty than disgruntled and dissatisfied customers who have not been provided effective service recovery.
• Besides enhancing customer satisfaction and loyalty, a well designed service recovery also helps in positive word of mouth publicity.
TYPES OF CUSTOMER COMPLAINT ACTIONS
1. On the spot to the service provider - Best method
2. On a later date , by phone, in writing to the service provider or the Corporate office of the organisation.Both the above are proactive approaches and are referred to as voice responses or seeking redress.
• The complainant could just spread negative word of mouth to all he comes in contact. This is extremely damaging to the image of the company.
• Finally the customer may complain to consumer redressal forums or any governmental organisation or NGO, taking care of the rights of the consumer
SERVICE RECOVERY STRATEGIES
Do it right the first time: leave no scope for service failure. Provide quality service every time to every customer.Welcome and Encourage complaints.Act Quickly.Treat customers fairly.Learn from recovery experience.Learn from lost customers
PRINCIPLES OF SERVICE RECOVERY
Easy feedback mechanism from customers. Enable effective service recovery. Proactive. Planned. Trained. Empowered
MANAGING DEMAND AND CAPACITY
How to fill 281 Rooms 365 days of the
year?
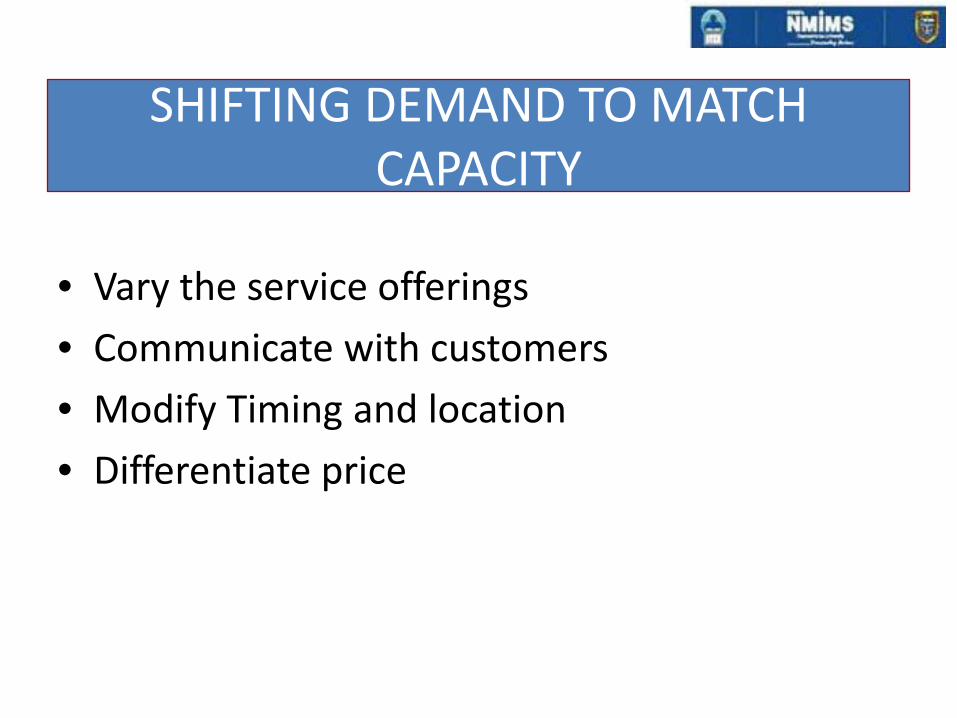
SHIFTING DEMAND TO MATCH CAPACITY
• Vary the service offerings
• Communicate with customers
• Modify Timing and location
• Differentiate price
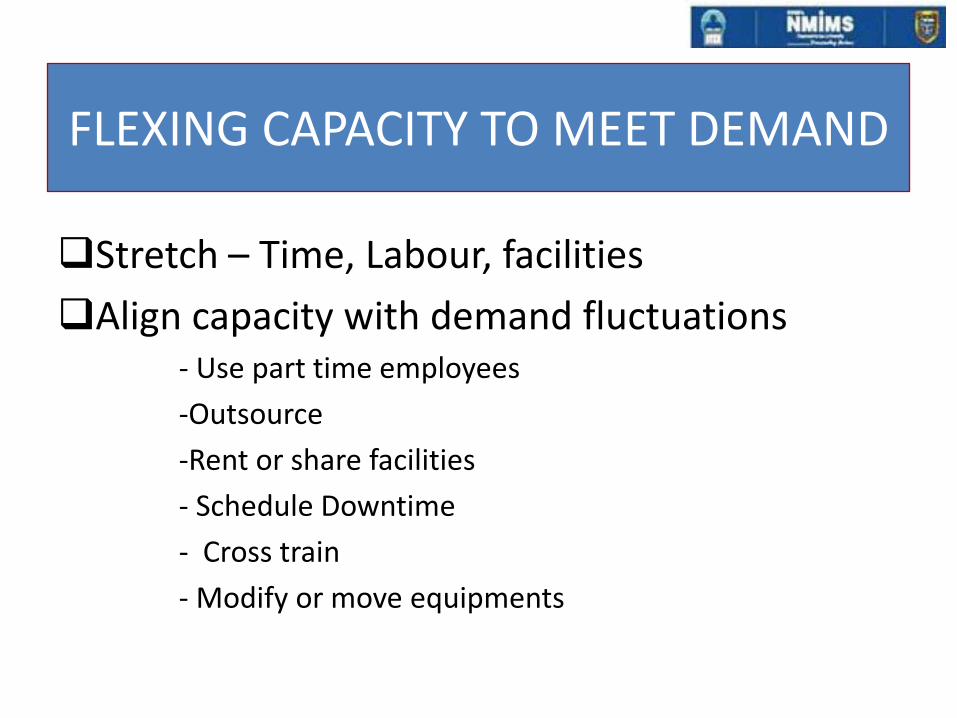
FLEXING CAPACITY TO MEET DEMAND
Stretch – Time, Labour, facilities
Align capacity with demand fluctuations- Use part time employees
-Outsource
-Rent or share facilities
- Schedule Downtime
- Cross train
- Modify or move equipments
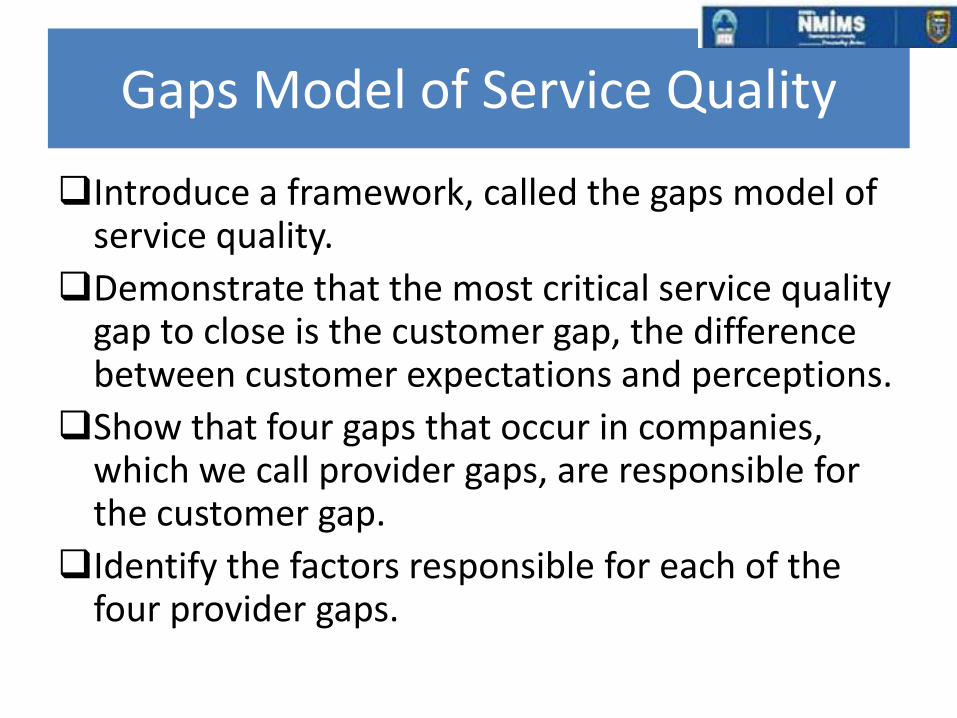
Gaps Model of Service Quality
Introduce a framework, called the gaps model of service quality.
Demonstrate that the most critical service quality gap to close is the customer gap, the difference between customer expectations and perceptions.
Show that four gaps that occur in companies, which we call provider gaps, are responsible for the customer gap.
Identify the factors responsible for each of the four provider gaps.
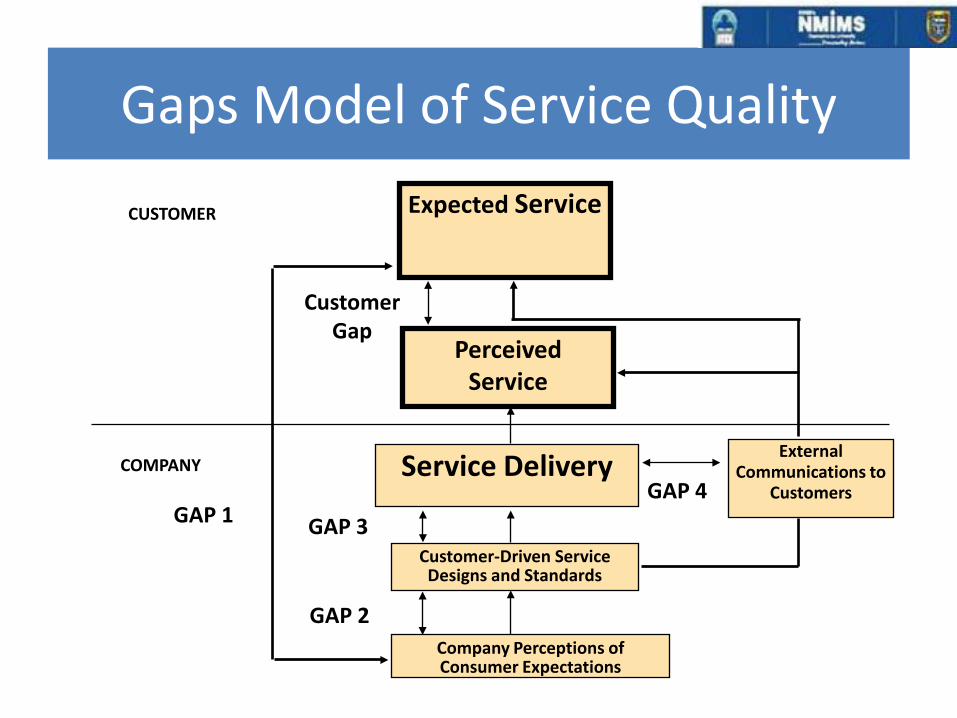
PerceivedService
Expected ServiceCUSTOMER
COMPANY
CustomerGap
GAP 1
GAP 2
GAP 3
External Communications to
CustomersGAP 4Service Delivery
Customer-Driven Service Designs and Standards
Company Perceptions of Consumer Expectations
Gaps Model of Service Quality
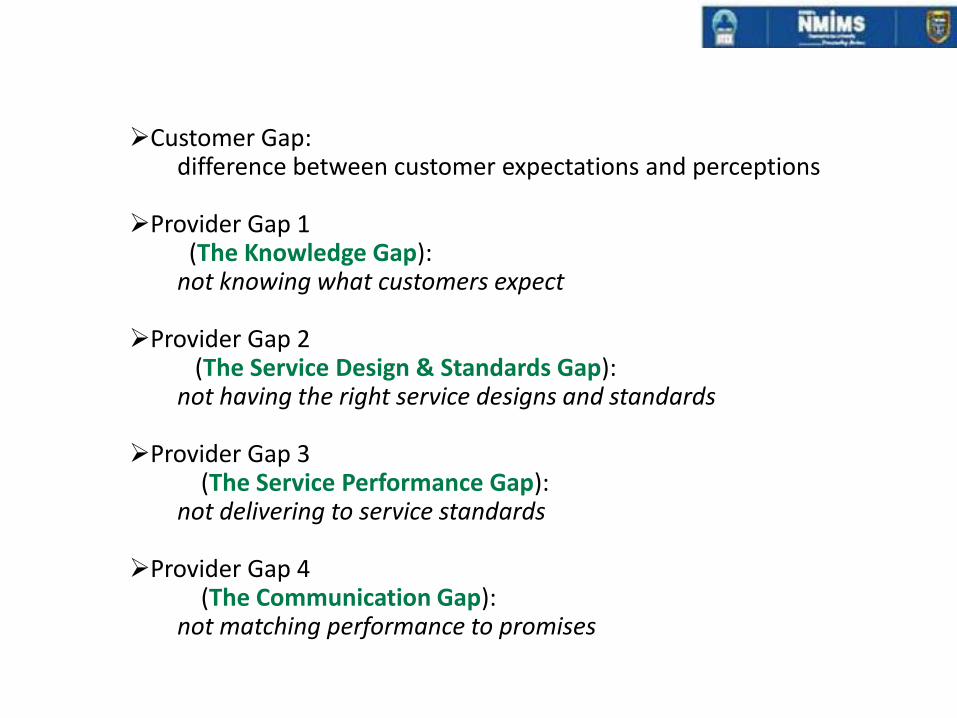
Customer Gap:difference between customer expectations and perceptions
Provider Gap 1(The Knowledge Gap):
not knowing what customers expect
Provider Gap 2 (The Service Design & Standards Gap):
not having the right service designs and standards
Provider Gap 3 (The Service Performance Gap):
not delivering to service standards
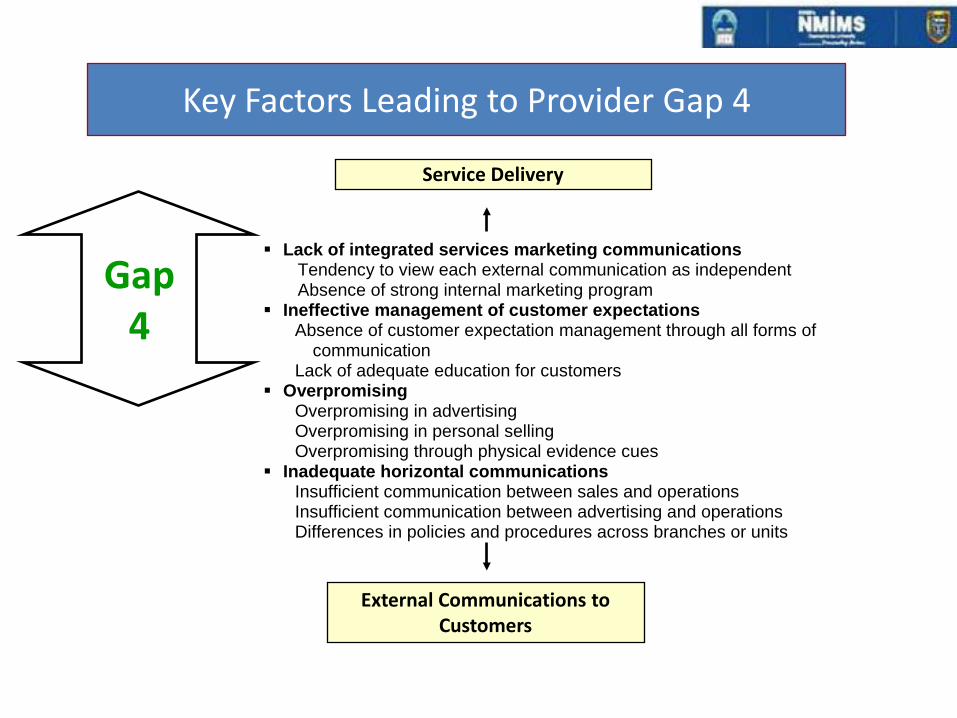
Provider Gap 4 (The Communication Gap):
not matching performance to promises
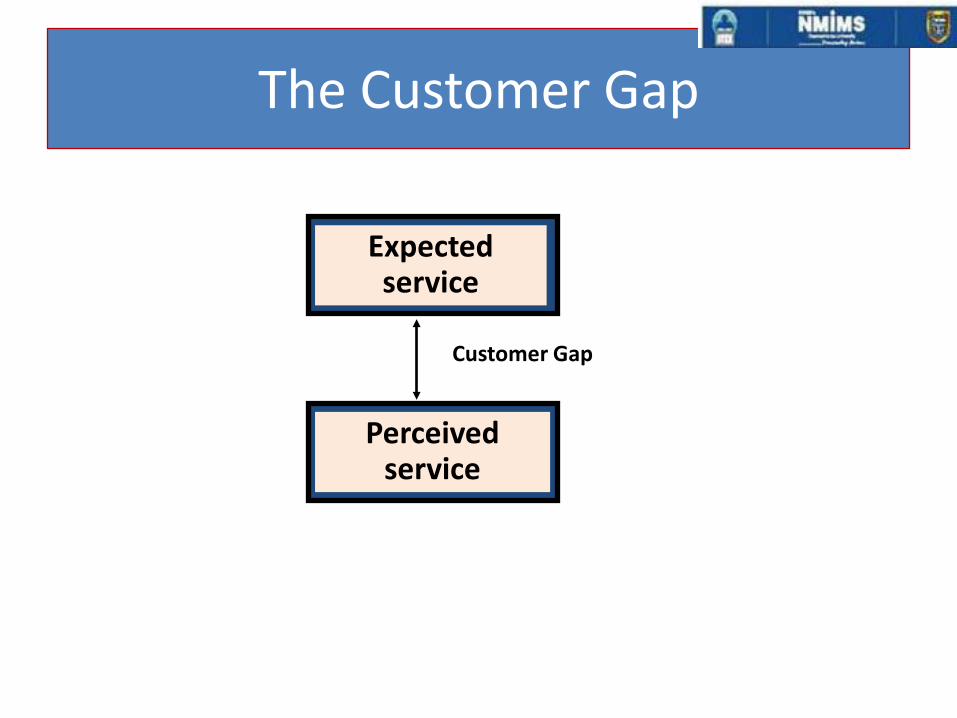
The Customer Gap
Expectedservice
Perceivedservice
Customer Gap
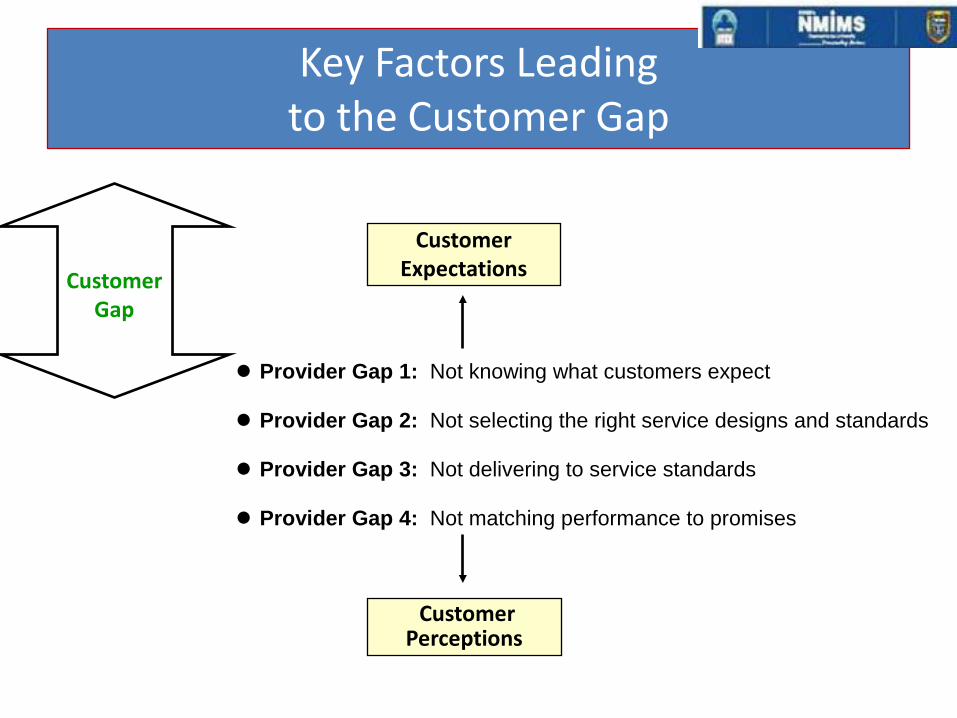
Key Factors Leadingto the Customer Gap
Provider Gap 1: Not knowing what customers expect
Provider Gap 2: Not selecting the right service designs and standards
Provider Gap 3: Not delivering to service standards
Provider Gap 4: Not matching performance to promises
Customer Expectations
Customer Perceptions
CustomerGap
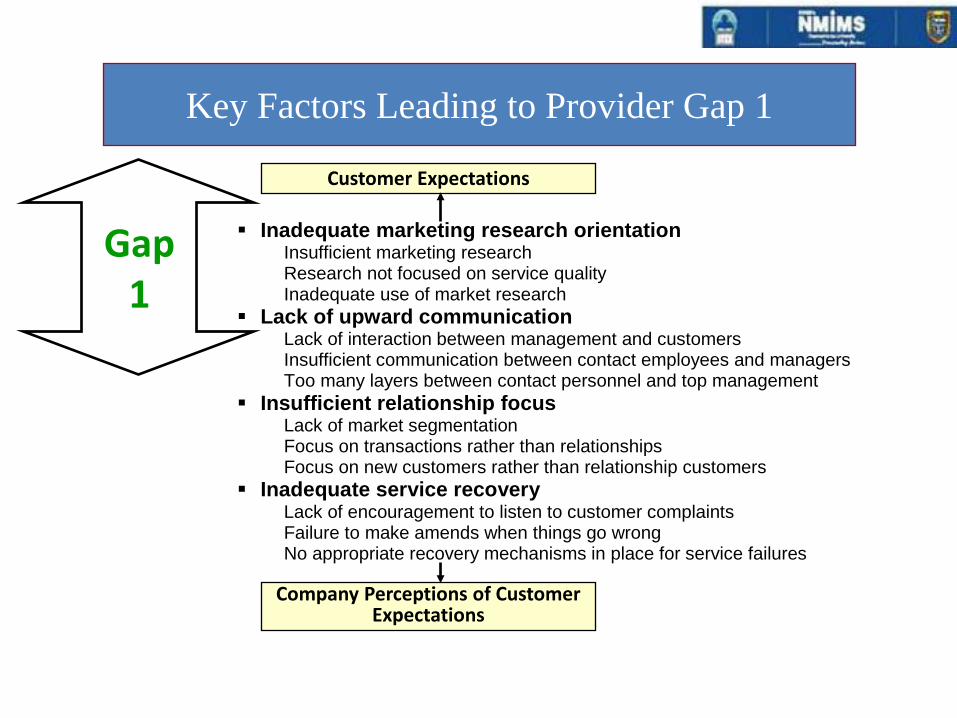
Customer Expectations
Company Perceptions of Customer Expectations
Inadequate marketing research orientation Insufficient marketing research Research not focused on service quality Inadequate use of market research
Lack of upward communication Lack of interaction between management and customers Insufficient communication between contact employees and managers Too many layers between contact personnel and top management
Insufficient relationship focus Lack of market segmentation Focus on transactions rather than relationships Focus on new customers rather than relationship customers
Inadequate service recovery Lack of encouragement to listen to customer complaints Failure to make amends when things go wrong No appropriate recovery mechanisms in place for service failures
Key Factors Leading to Provider Gap 1
Gap1
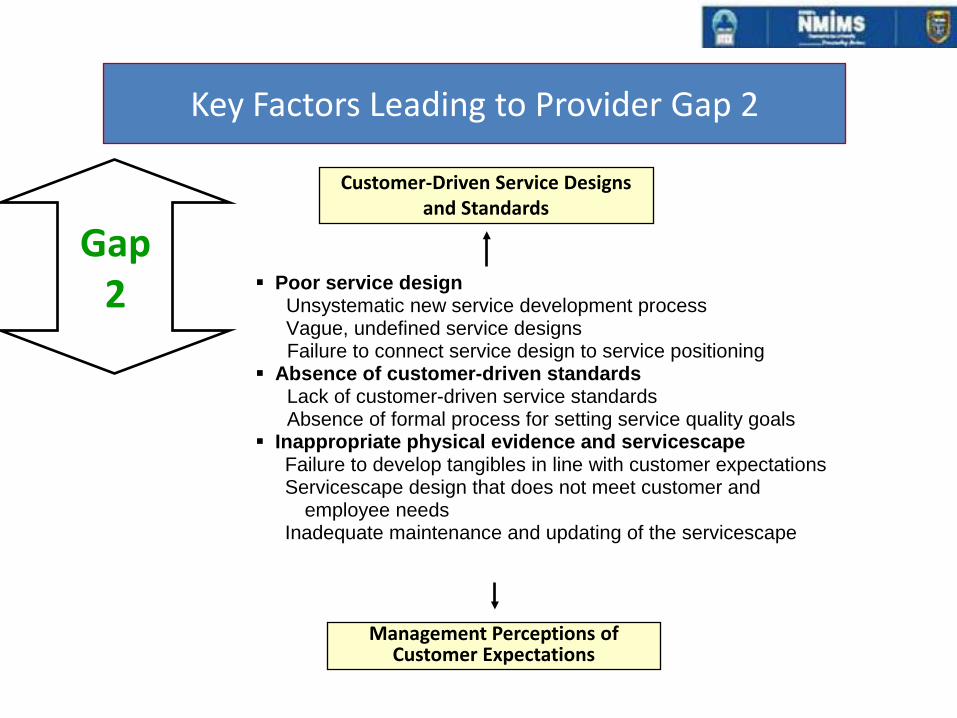
Customer-Driven Service Designs and Standards
Management Perceptions of Customer Expectations
Poor service design Unsystematic new service development process Vague, undefined service designs
Failure to connect service design to service positioning Absence of customer-driven standards
Lack of customer-driven service standards Absence of formal process for setting service quality goals
Inappropriate physical evidence and servicescape Failure to develop tangibles in line with customer expectations Servicescape design that does not meet customer and
employee needs Inadequate maintenance and updating of the servicescape
Key Factors Leading to Provider Gap 2
Gap2

Service Delivery
Customer-Driven Service Designs and Standards
Deficiencies in human resource policies Ineffective recruitment Role ambiguity and role conflict Inappropriate evaluation and compensation systems Lack of empowerment, perceived control, and teamwork
Customers who do not fulfill roles Customers who lack knowledge of their roles and responsibilities Customers who negatively impact each other
Problems with service intermediaries Channel conflict over objectives and performance Difficulty controlling quality and consistency Tension between empowerment and control
Failure to match supply and demand Failure to smooth peaks and valleys of demand
Key Factors Leading to Provider Gap 3
Gap3
Service Delivery
Lack of integrated services marketing communications Tendency to view each external communication as independent Absence of strong internal marketing program
Ineffective management of customer expectations Absence of customer expectation management through all forms of
communication Lack of adequate education for customers
Overpromising Overpromising in advertising Overpromising in personal selling Overpromising through physical evidence cues
Inadequate horizontal communications Insufficient communication between sales and operations Insufficient communication between advertising and operations Differences in policies and procedures across branches or units
External Communications to Customers
Key Factors Leading to Provider Gap 4
Gap4