Embed Size (px)
Citation preview
SERVICE SKILLSIN THE WORKPLACE
A MONOGRAPH BYPAUL BERNTHAL, PH.D.AND JAMES H.S. DAVIS

1
TABLE OF CONTENTSINTRODUCTION
1. Customer Service: Who Needs It? . . . . . . . . . . . . . . . . . . . . . . . . . . . . . . . . . . . . . . . . . . . .2
2. The Service Success Loop . . . . . . . . . . . . . . . . . . . . . . . . . . . . . . . . . . . . . . . . . . . . . . . . . .2
3. Service Encounters: The Point of Contact . . . . . . . . . . . . . . . . . . . . . . . . . . . . . . . . . . . . .3
4. Creating A Service Culture . . . . . . . . . . . . . . . . . . . . . . . . . . . . . . . . . . . . . . . . . . . . . . . . . .4
5. Interviewing for Effective Customer Service . . . . . . . . . . . . . . . . . . . . . . . . . . . . . . . . . . . .4
METHODOLOGY
6. Participants and Data Collection . . . . . . . . . . . . . . . . . . . . . . . . . . . . . . . . . . . . . . . . . . . . .5
7. Measures . . . . . . . . . . . . . . . . . . . . . . . . . . . . . . . . . . . . . . . . . . . . . . . . . . . . . . . . . . . . . . . .5
RESULTS
8. Links in the Service Success Loop . . . . . . . . . . . . . . . . . . . . . . . . . . . . . . . . . . . . . . . . . . . .8
9. Top Customer Satisfaction Builders . . . . . . . . . . . . . . . . . . . . . . . . . . . . . . . . . . . . . . . . . . .9
10. Top Customer Satisfaction Reducers . . . . . . . . . . . . . . . . . . . . . . . . . . . . . . . . . . . . . . . . .10
11. Customer Service Skills and Competencies . . . . . . . . . . . . . . . . . . . . . . . . . . . . . . . . . . .11
12. The Service Encounter . . . . . . . . . . . . . . . . . . . . . . . . . . . . . . . . . . . . . . . . . . . . . . . . . . . .13
13. Service Recovery . . . . . . . . . . . . . . . . . . . . . . . . . . . . . . . . . . . . . . . . . . . . . . . . . . . . . . . .14
14. Attitudes: Customers and Providers . . . . . . . . . . . . . . . . . . . . . . . . . . . . . . . . . . . . . . . . .16
15. Satisfaction and Desire to Repurchase . . . . . . . . . . . . . . . . . . . . . . . . . . . . . . . . . . . . . . . .16
DISCUSSION
16. Meeting (or Exceeding) Customer Needs and Expectations . . . . . . . . . . . . . . . . . . . . . .17
17. Listening to and Understanding Customers . . . . . . . . . . . . . . . . . . . . . . . . . . . . . . . . . . .17
18. Empowerment and Responsibility . . . . . . . . . . . . . . . . . . . . . . . . . . . . . . . . . . . . . . . . . . .17
19. Follow-Through . . . . . . . . . . . . . . . . . . . . . . . . . . . . . . . . . . . . . . . . . . . . . . . . . . . . . . . . .18
IMPLICATIONS
20. Monitor Customer Needs and Perceptions . . . . . . . . . . . . . . . . . . . . . . . . . . . . . . . . . . . .19
21. Promote an Empowering Environment . . . . . . . . . . . . . . . . . . . . . . . . . . . . . . . . . . . . . . .19
22. Provide Training and Integrate Skills and Competencies . . . . . . . . . . . . . . . . . . . . . . . . .19
APPENDIX
22. Characteristics of Participating Service Providers and Their Customers . . . . . . . . . . . . .21
REFERENCES . . . . . . . . . . . . . . . . . . . . . . . . . . . . . . . . . . . . . . . . . . . . . . . . . . . . . . . . . . . . .22
ABOUT THE AUTHORS . . . . . . . . . . . . . . . . . . . . . . . . . . . . . . . . . . . . . . . . . . . . . . . . . . . . .23
© Development Dimensions International, Inc., MCMXCIV. Revised MMIV. All rights reserved under U.S., International, and Universal Copyright Conventions. Reproduction in whole or part without written permission from DDI is prohibited.
2
INTRODUCTIONCUSTOMER SERVICE: WHO NEEDS IT?We live in an era of increasing customer
sophistication. While most people expect
product quality—that the product performs as
advertised—today’s customers are seeking
and demanding excellent service quality as well.
Dynamic organizations already recognize the
need to differentiate their products from
those of their competitors. But in many
competitive markets, the distinguishing
feature between organizations has become
the quality of service, or how employees
interact with customers to satisfy their needs.
A study by Technical Assistance Research
Programs (TARP, 1994) revealed that many
consumers who experience problems with
service do not complain. For small-ticket
products, this number is as high as 96 percent.
Of these individuals, a large number choose
not to buy again. And even though they
might not complain to the organization,
dissatisfied customers often tell 10 to 16
other people about their experience.
In comparison, many studies (e.g., Albrecht
and Bradford,1990;Stamatis,1996;TARP,1994)
prove that customers who are treated well:
> Perceive the provider more favorably.
> Complain less.
> Are more loyal.
> Behave cooperatively.
> Perceive higher quality.
Heskett, Jones,Loveman,Sasser,and Schlesinger
(1994) called the lifetime value of a loyal
customer “astronomical,” especially when
the impact of referrals, retention, and repeat
purchases of related products is added into
the equation. Reichheld and Sasser (1990)
estimated that a 5 percent increase in
customer loyalty can produce a 25 to 85
percent increase in profit.
THE SERVICE SUCCESS LOOPThere is little question that customer loyalty
leads to improved business performance.
However, it’s not always clear what an
organization can do to increase customer
loyalty and retention. Certainly, if customers
are satisfied and see value in the service an
organization provides, they are more likely
to become repeat customers. The question
then becomes,“What factors contribute to
customer satisfaction?”
Recently, discussion has focused on how
employee satisfaction and loyalty affect
customers’ perceptions of an organization
(Heskett et al., 1994). When employees are
more satisfied and committed, they tend to
have more satisfied and committed customers.
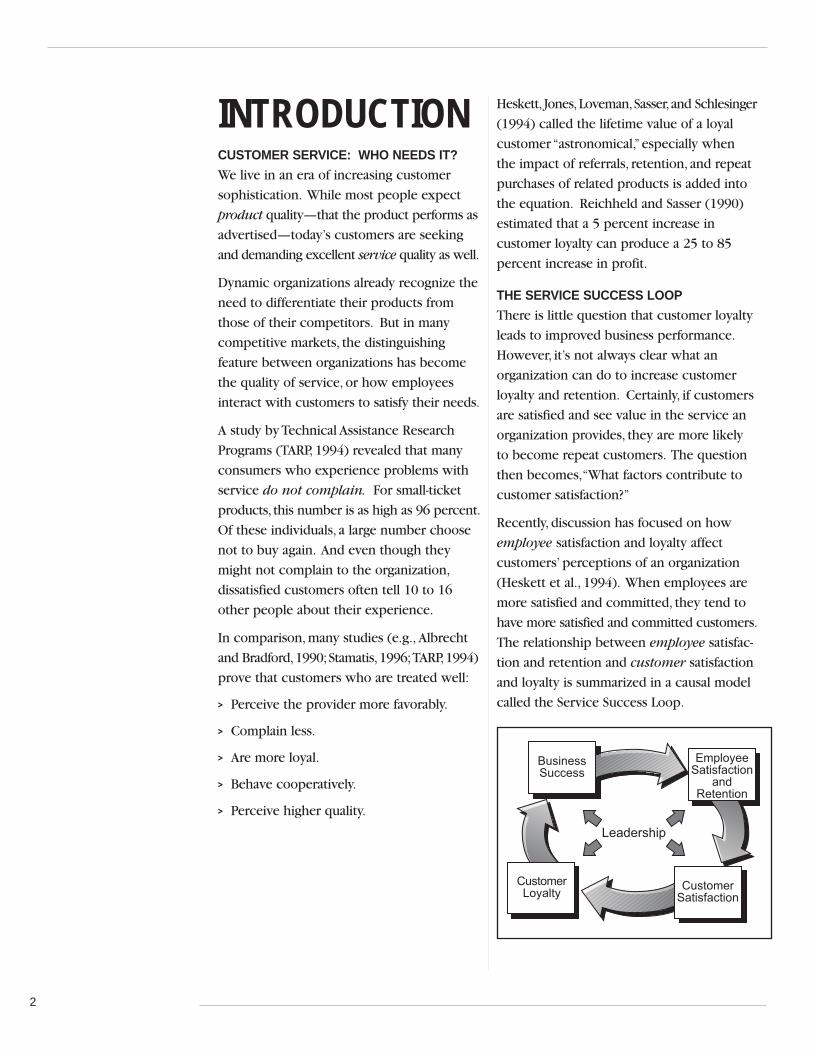
The relationship between employee satisfac-
tion and retention and customer satisfaction
and loyalty is summarized in a causal model
called the Service Success Loop.
���������
������� ������
�������� �����������
������� �����������
������������
���������������
Following are the components of the Service
Success Loop.
1. Leadership: Leaders select the right
employees and provide them with the
systems and resources they need to do their
jobs effectively. The organization promotes
a service culture by clearly identifying
service as a company value.
2. Employee Satisfaction and Retention:Organizational systems and support
mechanisms enable employees to do their
jobs well. Employees are satisfied with their
jobs; they become more productive and less
likely to leave the company.
3. Customer Satisfaction: Customers
perceive value in the services offered by
capable,experienced,and satisfied employees.
4. Customer Loyalty: Customers are so
pleased with the value and quality of service
that they choose a company over its
competitors. They give repeat business and
provide referrals. Over time, a relationship
develops between the customer and the
organization.
5. Business Success: Profitability, market
share,and other measures of success increase,
thanks to satisfied, loyal customers. Successful
businesses have more resources to reinvest
in the organization, which leads to greater
employee satisfaction and retention.
This model implies that to increase customer
satisfaction and loyalty and promote growth
and revenue, we must start with the service
provider. Bowen and Lawler (1995) identified
empowerment, or the authority/power to
meet needs, as the primary factor behind
employee satisfaction and loyalty. Service
providers must have the skills, knowledge, and
organizational support necessary for creating a
perception of service value.
SERVICE ENCOUNTERS: THE POINT OF CONTACTThe “service encounter” is the moment when
customers directly interact with the service
provider. In their study of service encounters,
Bitner, Booms, and Tetreault (1990) observed a
general decline in service quality—even as the
importance of service industries continues to
grow in the U.S. economy. Often, frontline
employees are not trained adequately or
empowered to meet customer needs and
ensure effective service.
The service encounter has been called a “rite
of integration”between the service provider
and the customer (Siehl, Bowen, and Pearson,
1992). During the service encounter,providers
and customers achieve a temporary sense of
closeness that facilitates communication and
collaboration. This closeness is especially
important when the service provided is
somewhat intangible and difficult for the
customer to evaluate (e.g., legal counsel).
Ideally, the service encounter involves
“deliberately planned, carefully managed, and
often rehearsed sets of behaviors” (p. 543).
Using an established “rite”helps the interaction
achieve consistency and predictability.
Understanding which parts of the service
encounter are most important and which are
performed most proficiently helps identify
areas for improvement.
To make the Service Success Loop work,
organizations must do everything they can
to make sure their employees are completely
prepared for customer interactions. As front-
line players, customer contact employees play
a key role in the organization. A service
provider might be the first, last, or only person
who comes in contact with the customer.
This person creates customers’ perceptions
of the organization. Employee skills and
organizational support systems determine
how well service-related needs and problems
are addressed.
3
CREATING A SERVICE CULTUREToday’s customers want service that delights
them, and that’s becoming the baseline for
earning their loyalty. In a total service culture,
providing extraordinary service is the job of
every individual in the organization, from the
top down. Senior executives must become
advocates of a culture in which the customer
is at the center of every decision. Service
leaders need to support and empower their
people to take ownership of their jobs.
Frontline service providers learn specialized
skills for handling customer problems, getting
customer feedback, and ensuring service that
consistently exceeds expectations. In short,
the heart of a service culture is a total
commitment to delighting customers.
Organizations with a strong service culture
enjoy increased employee job satisfaction
and retention, increased customer loyalty,
noticeable behavior changes throughout
the organization, and an improved overall
customer service image.
INTERVENING FOR EFFECTIVE CUSTOMER SERVICEAfter a service encounter, an organization
can do little to alter customer perceptions.
However, organizations can ensure that they
have done everything possible to promote a
positive service encounter by preparing
their employees and changing the work
environment. This study examines the factors
preceding a service encounter and the possible
outcomes.
Study Purposes> Job Requirements and Competencies:
What skills and competencies are essentialfor effective customer service performance,from the viewpoint of both customers andcustomer contact personnel? How well arethey currently performed?
> The Service Encounter: What are themost important steps in a serviceencounter? In which behaviors do serviceproviders display the highest proficiency?
> Service Recovery: What are the most critical steps for handling a customer’s problem? What impact do these steps haveon customer loyalty and retention?
> Links in the Service Success Loop:What support is there for the ServiceSuccess Loop? Do the hypothesized relationships actually exist?
4
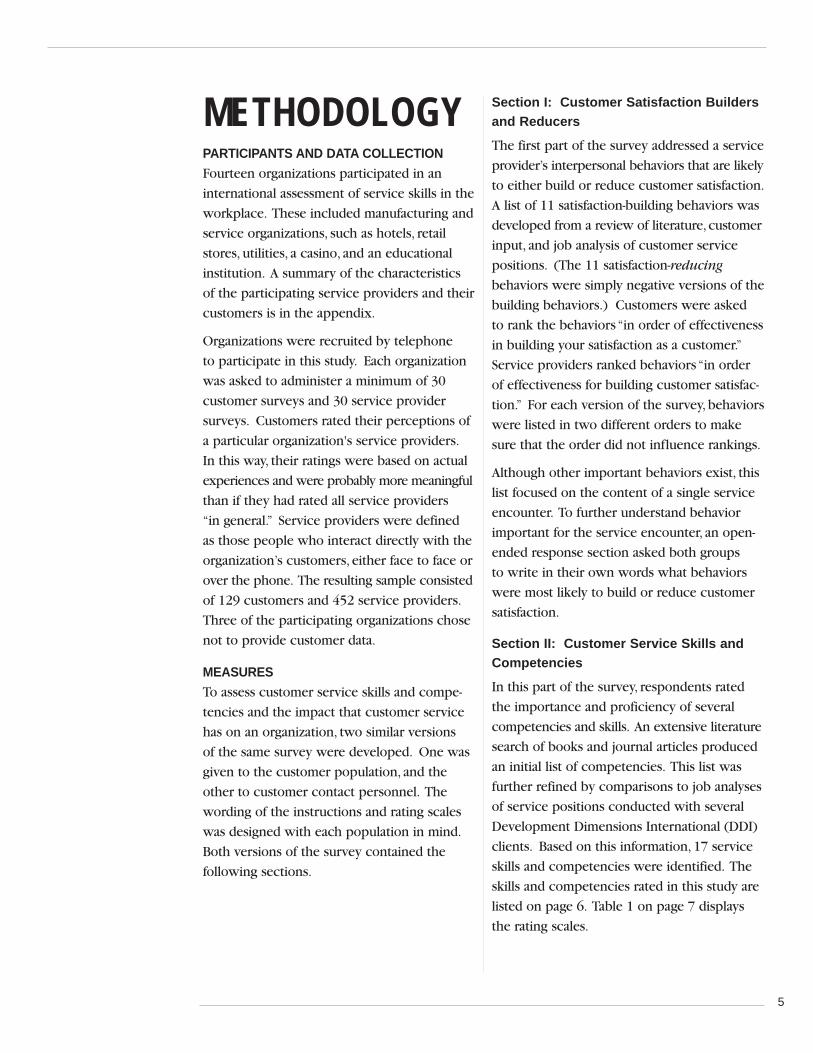
METHODOLOGYPARTICIPANTS AND DATA COLLECTIONFourteen organizations participated in an
international assessment of service skills in the
workplace. These included manufacturing and
service organizations, such as hotels, retail
stores, utilities, a casino, and an educational
institution. A summary of the characteristics
of the participating service providers and their
customers is in the appendix.
Organizations were recruited by telephone
to participate in this study. Each organization
was asked to administer a minimum of 30
customer surveys and 30 service provider
surveys. Customers rated their perceptions of
a particular organization's service providers.
In this way, their ratings were based on actual
experiences and were probably more meaningful
than if they had rated all service providers
“in general.” Service providers were defined
as those people who interact directly with the
organization’s customers, either face to face or
over the phone. The resulting sample consisted
of 129 customers and 452 service providers.
Three of the participating organizations chose
not to provide customer data.
MEASURESTo assess customer service skills and compe-
tencies and the impact that customer service
has on an organization, two similar versions
of the same survey were developed. One was
given to the customer population, and the
other to customer contact personnel. The
wording of the instructions and rating scales
was designed with each population in mind.
Both versions of the survey contained the
following sections.
Section I: Customer Satisfaction Buildersand Reducers
The first part of the survey addressed a service
provider’s interpersonal behaviors that are likely
to either build or reduce customer satisfaction.
A list of 11 satisfaction-building behaviors was
developed from a review of literature, customer
input, and job analysis of customer service
positions. (The 11 satisfaction-reducing
behaviors were simply negative versions of the
building behaviors.) Customers were asked
to rank the behaviors “in order of effectiveness
in building your satisfaction as a customer.”
Service providers ranked behaviors “in order
of effectiveness for building customer satisfac-
tion.” For each version of the survey, behaviors
were listed in two different orders to make
sure that the order did not influence rankings.
Although other important behaviors exist, this
list focused on the content of a single service
encounter. To further understand behavior
important for the service encounter, an open-
ended response section asked both groups
to write in their own words what behaviors
were most likely to build or reduce customer
satisfaction.
Section II: Customer Service Skills andCompetencies
In this part of the survey, respondents rated
the importance and proficiency of several
competencies and skills. An extensive literature
search of books and journal articles produced
an initial list of competencies. This list was
further refined by comparisons to job analyses
of service positions conducted with several
Development Dimensions International (DDI)
clients. Based on this information, 17 service
skills and competencies were identified. The
skills and competencies rated in this study are
listed on page 6. Table 1 on page 7 displays
the rating scales.
5
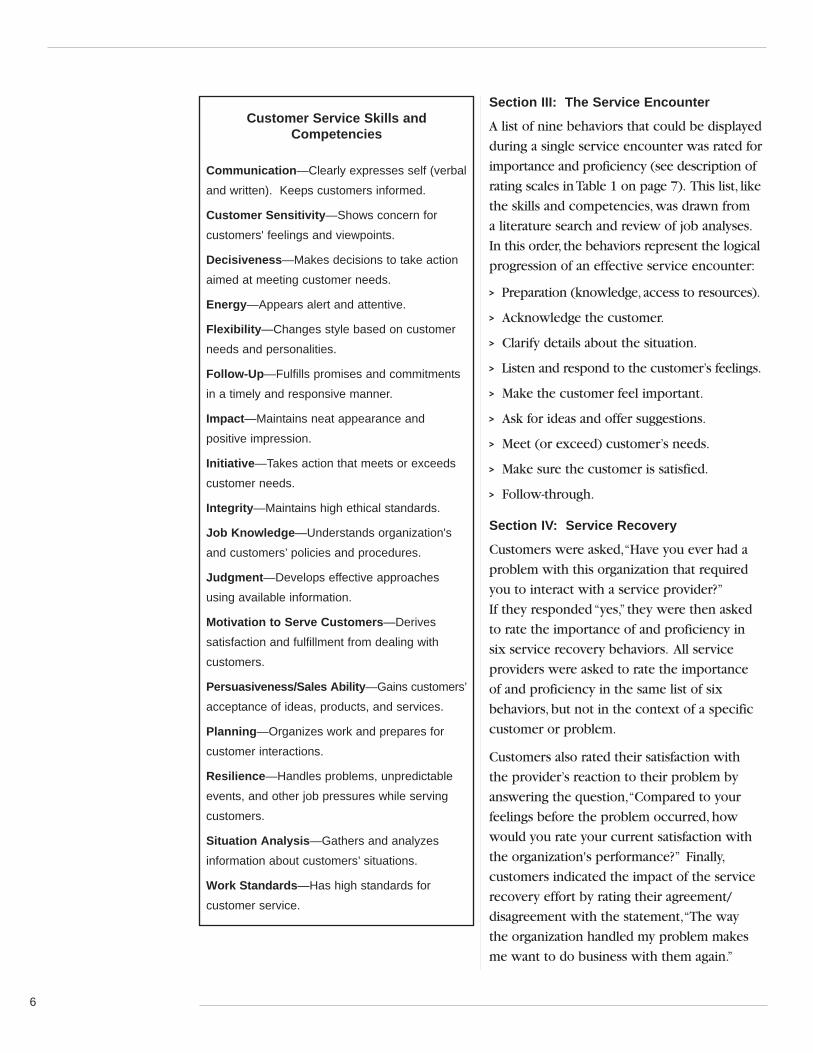
Customer Service Skills andCompetencies
Communication—Clearly expresses self (verbal
and written). Keeps customers informed.
Customer Sensitivity—Shows concern for
customers' feelings and viewpoints.
Decisiveness—Makes decisions to take action
aimed at meeting customer needs.
Energy—Appears alert and attentive.
Flexibility—Changes style based on customer
needs and personalities.
Follow-Up—Fulfills promises and commitments
in a timely and responsive manner.
Impact—Maintains neat appearance and
positive impression.
Initiative—Takes action that meets or exceeds
customer needs.
Integrity—Maintains high ethical standards.
Job Knowledge—Understands organization's
and customers’ policies and procedures.
Judgment—Develops effective approaches
using available information.
Motivation to Serve Customers—Derives
satisfaction and fulfillment from dealing with
customers.
Persuasiveness/Sales Ability—Gains customers’
acceptance of ideas, products, and services.
Planning—Organizes work and prepares for
customer interactions.
Resilience—Handles problems, unpredictable
events, and other job pressures while serving
customers.
Situation Analysis—Gathers and analyzes
information about customers’ situations.
Work Standards—Has high standards for
customer service.
Section III: The Service Encounter
A list of nine behaviors that could be displayed
during a single service encounter was rated for
importance and proficiency (see description of
rating scales in Table 1 on page 7). This list, like
the skills and competencies, was drawn from
a literature search and review of job analyses.
In this order, the behaviors represent the logical
progression of an effective service encounter:
> Preparation (knowledge, access to resources).
> Acknowledge the customer.
> Clarify details about the situation.
> Listen and respond to the customer’s feelings.
> Make the customer feel important.
> Ask for ideas and offer suggestions.
> Meet (or exceed) customer’s needs.
> Make sure the customer is satisfied.
> Follow-through.
Section IV: Service Recovery
Customers were asked,“Have you ever had a
problem with this organization that required
you to interact with a service provider?”
If they responded “yes,” they were then asked
to rate the importance of and proficiency in
six service recovery behaviors. All service
providers were asked to rate the importance
of and proficiency in the same list of six
behaviors, but not in the context of a specific
customer or problem.
Customers also rated their satisfaction with
the provider’s reaction to their problem by
answering the question,“Compared to your
feelings before the problem occurred, how
would you rate your current satisfaction with
the organization's performance?” Finally,
customers indicated the impact of the service
recovery effort by rating their agreement/
disagreement with the statement,“The way
the organization handled my problem makes
me want to do business with them again.”
6
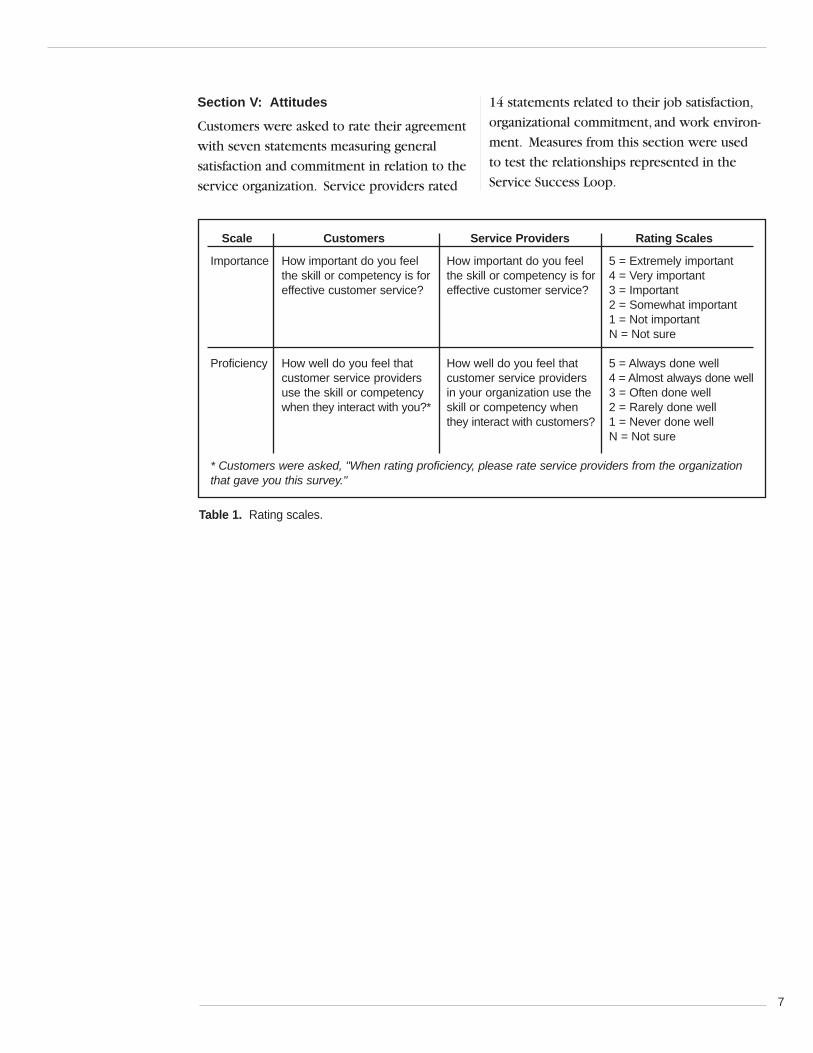
Section V: Attitudes
Customers were asked to rate their agreement
with seven statements measuring general
satisfaction and commitment in relation to the
service organization. Service providers rated
14 statements related to their job satisfaction,
organizational commitment, and work environ-
ment. Measures from this section were used
to test the relationships represented in the
Service Success Loop.
7
Scale Customers Service Providers Rating Scales
Importance How important do you feel How important do you feel 5 = Extremely importantthe skill or competency is for the skill or competency is for 4 = Very importanteffective customer service? effective customer service? 3 = Important
2 = Somewhat important1 = Not importantN = Not sure
Proficiency How well do you feel that How well do you feel that 5 = Always done wellcustomer service providers customer service providers 4 = Almost always done welluse the skill or competency in your organization use the 3 = Often done wellwhen they interact with you?* skill or competency when 2 = Rarely done well
they interact with customers? 1 = Never done wellN = Not sure
* Customers were asked, "When rating proficiency, please rate service providers from the organizationthat gave you this survey."
Table 1. Rating scales.
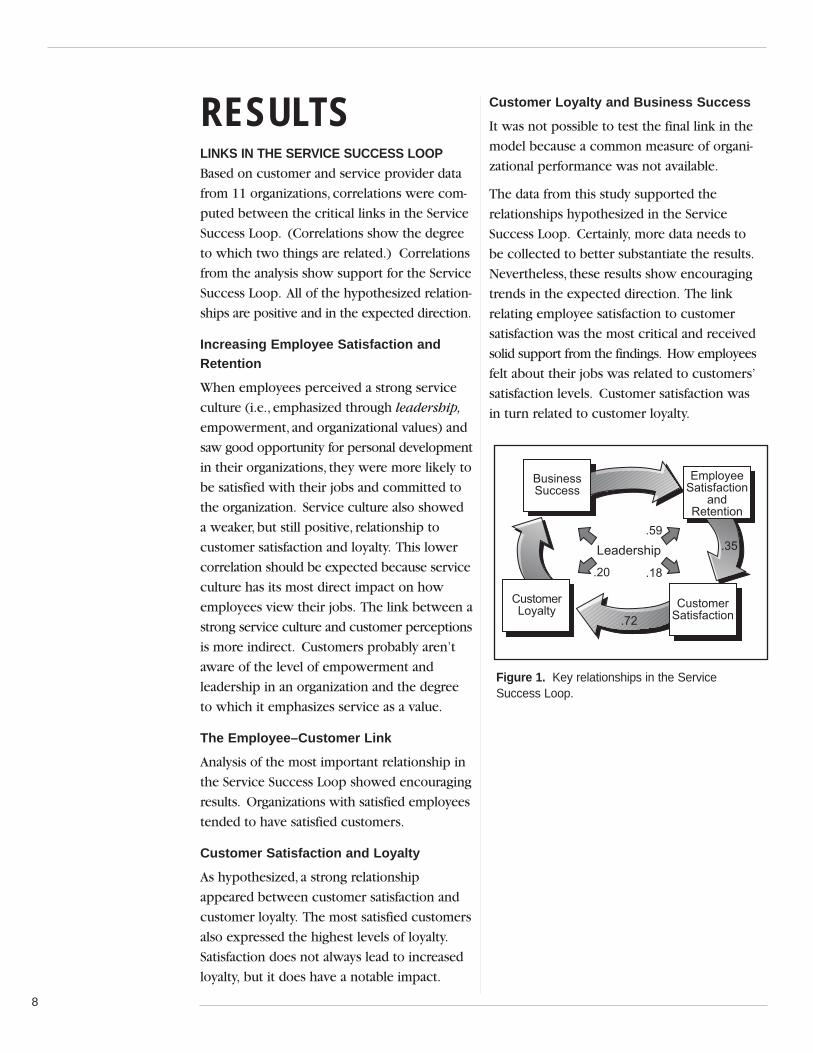
RESULTSLINKS IN THE SERVICE SUCCESS LOOPBased on customer and service provider data
from 11 organizations, correlations were com-
puted between the critical links in the Service
Success Loop. (Correlations show the degree
to which two things are related.) Correlations
from the analysis show support for the Service
Success Loop. All of the hypothesized relation-
ships are positive and in the expected direction.
Increasing Employee Satisfaction andRetention
When employees perceived a strong service
culture (i.e., emphasized through leadership,
empowerment, and organizational values) and
saw good opportunity for personal development
in their organizations, they were more likely to
be satisfied with their jobs and committed to
the organization. Service culture also showed
a weaker, but still positive, relationship to
customer satisfaction and loyalty. This lower
correlation should be expected because service
culture has its most direct impact on how
employees view their jobs. The link between a
strong service culture and customer perceptions
is more indirect. Customers probably aren’t
aware of the level of empowerment and
leadership in an organization and the degree
to which it emphasizes service as a value.
The Employee–Customer Link
Analysis of the most important relationship in
the Service Success Loop showed encouraging
results. Organizations with satisfied employees
tended to have satisfied customers.
Customer Satisfaction and Loyalty
As hypothesized, a strong relationship
appeared between customer satisfaction and
customer loyalty. The most satisfied customers
also expressed the highest levels of loyalty.
Satisfaction does not always lead to increased
loyalty, but it does have a notable impact.
Customer Loyalty and Business Success
It was not possible to test the final link in the
model because a common measure of organi-
zational performance was not available.
The data from this study supported the
relationships hypothesized in the Service
Success Loop. Certainly, more data needs to
be collected to better substantiate the results.
Nevertheless, these results show encouraging
trends in the expected direction. The link
relating employee satisfaction to customer
satisfaction was the most critical and received
solid support from the findings. How employees
felt about their jobs was related to customers’
satisfaction levels. Customer satisfaction was
in turn related to customer loyalty.
8
���������
������� ������
�������� �����������
������� �����������
������������
���������������
���
������
���
��
Figure 1. Key relationships in the Service Success Loop.
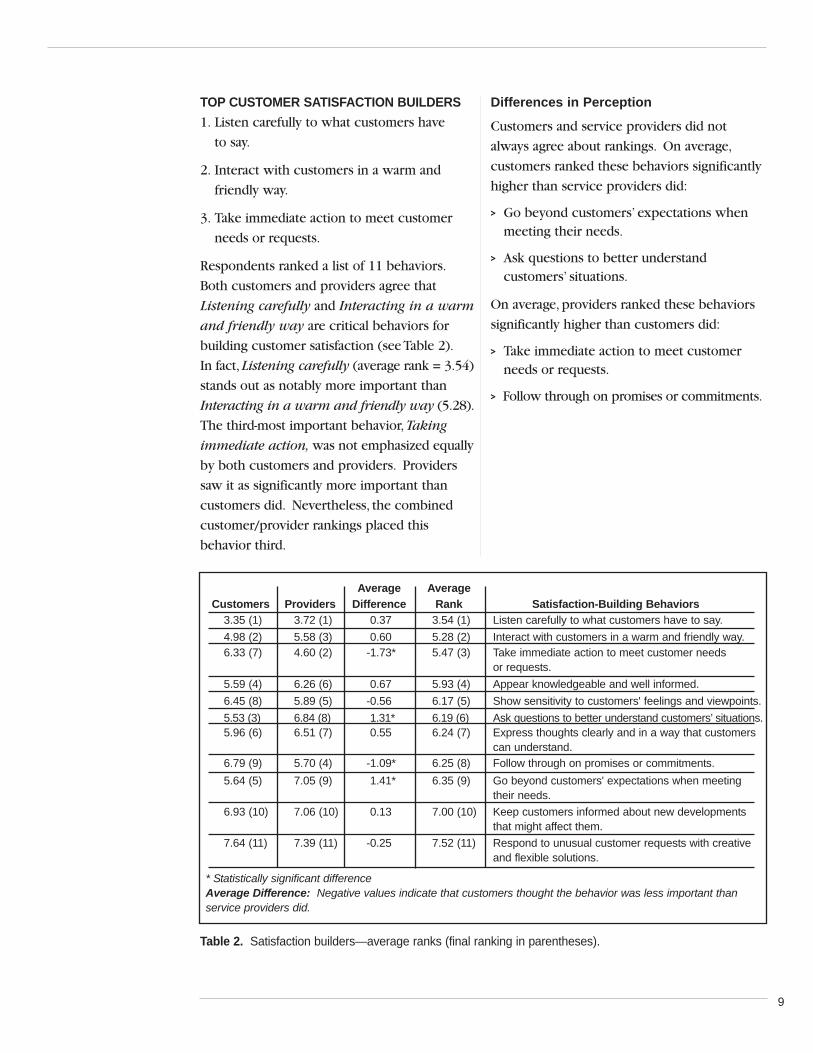
TOP CUSTOMER SATISFACTION BUILDERS1. Listen carefully to what customers have
to say.
2. Interact with customers in a warm and
friendly way.
3. Take immediate action to meet customer
needs or requests.
Respondents ranked a list of 11 behaviors.
Both customers and providers agree that
Listening carefully and Interacting in a warm
and friendly way are critical behaviors for
building customer satisfaction (see Table 2).
In fact,Listening carefully (average rank = 3.54)
stands out as notably more important than
Interacting in a warm and friendly way (5.28).
The third-most important behavior, Taking
immediate action, was not emphasized equally
by both customers and providers. Providers
saw it as significantly more important than
customers did. Nevertheless, the combined
customer/provider rankings placed this
behavior third.
Differences in Perception
Customers and service providers did not
always agree about rankings. On average,
customers ranked these behaviors significantly
higher than service providers did:
> Go beyond customers’ expectations whenmeeting their needs.
> Ask questions to better understand customers’ situations.
On average, providers ranked these behaviors
significantly higher than customers did:
> Take immediate action to meet customerneeds or requests.
> Follow through on promises or commitments.
9
Average AverageCustomers Providers Difference Rank Satisfaction-Building Behaviors
3.35 (1) 3.72 (1) 0.37 3.54 (1) Listen carefully to what customers have to say.4.98 (2) 5.58 (3) 0.60 5.28 (2) Interact with customers in a warm and friendly way.6.33 (7) 4.60 (2) -1.73* 5.47 (3) Take immediate action to meet customer needs
or requests.5.59 (4) 6.26 (6) 0.67 5.93 (4) Appear knowledgeable and well informed.6.45 (8) 5.89 (5) -0.56 6.17 (5) Show sensitivity to customers' feelings and viewpoints.5.53 (3) 6.84 (8) 1.31* 6.19 (6) Ask questions to better understand customers’ situations.5.96 (6) 6.51 (7) 0.55 6.24 (7) Express thoughts clearly and in a way that customers
can understand.6.79 (9) 5.70 (4) -1.09* 6.25 (8) Follow through on promises or commitments.5.64 (5) 7.05 (9) 1.41* 6.35 (9) Go beyond customers' expectations when meeting
their needs.6.93 (10) 7.06 (10) 0.13 7.00 (10) Keep customers informed about new developments
that might affect them.7.64 (11) 7.39 (11) -0.25 7.52 (11) Respond to unusual customer requests with creative
and flexible solutions.
* Statistically significant differenceAverage Difference: Negative values indicate that customers thought the behavior was less important than service providers did.
Table 2. Satisfaction builders—average ranks (final ranking in parentheses).
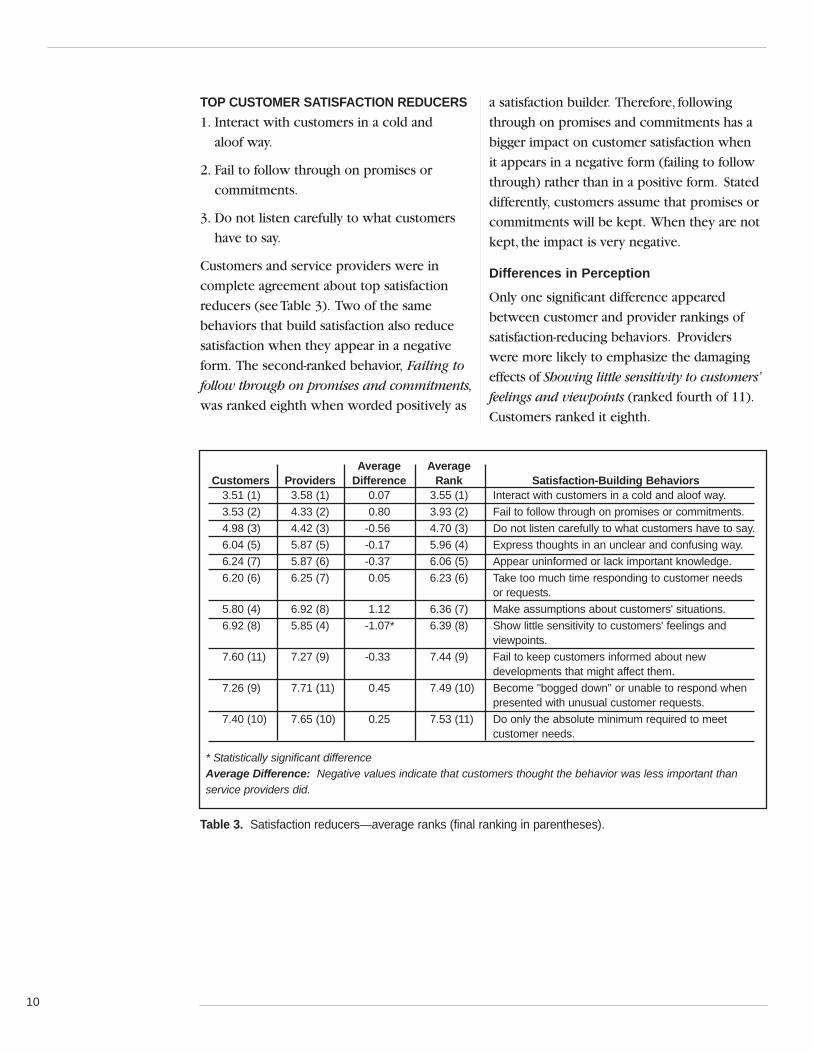
TOP CUSTOMER SATISFACTION REDUCERS1. Interact with customers in a cold and
aloof way.
2. Fail to follow through on promises or
commitments.
3. Do not listen carefully to what customers
have to say.
Customers and service providers were in
complete agreement about top satisfaction
reducers (see Table 3). Two of the same
behaviors that build satisfaction also reduce
satisfaction when they appear in a negative
form. The second-ranked behavior, Failing to
follow through on promises and commitments,
was ranked eighth when worded positively as
a satisfaction builder. Therefore, following
through on promises and commitments has a
bigger impact on customer satisfaction when
it appears in a negative form (failing to follow
through) rather than in a positive form. Stated
differently, customers assume that promises or
commitments will be kept. When they are not
kept, the impact is very negative.
Differences in Perception
Only one significant difference appeared
between customer and provider rankings of
satisfaction-reducing behaviors. Providers
were more likely to emphasize the damaging
effects of Showing little sensitivity to customers’
feelings and viewpoints (ranked fourth of 11).
Customers ranked it eighth.
10
Average AverageCustomers Providers Difference Rank Satisfaction-Building Behaviors
3.51 (1) 3.58 (1) 0.07 3.55 (1) Interact with customers in a cold and aloof way.3.53 (2) 4.33 (2) 0.80 3.93 (2) Fail to follow through on promises or commitments.4.98 (3) 4.42 (3) -0.56 4.70 (3) Do not listen carefully to what customers have to say.6.04 (5) 5.87 (5) -0.17 5.96 (4) Express thoughts in an unclear and confusing way.6.24 (7) 5.87 (6) -0.37 6.06 (5) Appear uninformed or lack important knowledge.6.20 (6) 6.25 (7) 0.05 6.23 (6) Take too much time responding to customer needs
or requests.5.80 (4) 6.92 (8) 1.12 6.36 (7) Make assumptions about customers' situations.6.92 (8) 5.85 (4) -1.07* 6.39 (8) Show little sensitivity to customers' feelings and
viewpoints.7.60 (11) 7.27 (9) -0.33 7.44 (9) Fail to keep customers informed about new
developments that might affect them.7.26 (9) 7.71 (11) 0.45 7.49 (10) Become "bogged down" or unable to respond when
presented with unusual customer requests.7.40 (10) 7.65 (10) 0.25 7.53 (11) Do only the absolute minimum required to meet
customer needs.
* Statistically significant differenceAverage Difference: Negative values indicate that customers thought the behavior was less important than service providers did.
Table 3. Satisfaction reducers—average ranks (final ranking in parentheses).
11
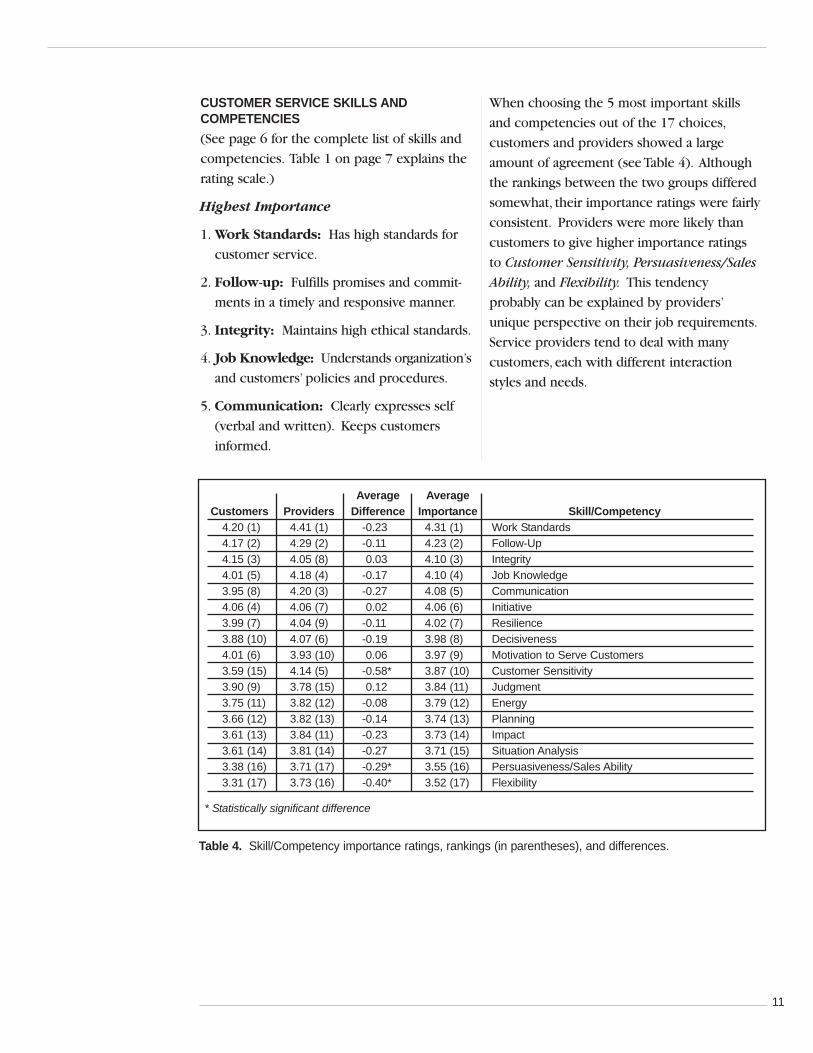
CUSTOMER SERVICE SKILLS ANDCOMPETENCIES(See page 6 for the complete list of skills and
competencies. Table 1 on page 7 explains the
rating scale.)
Highest Importance
1. Work Standards: Has high standards for
customer service.
2. Follow-up: Fulfills promises and commit-
ments in a timely and responsive manner.
3. Integrity: Maintains high ethical standards.
4. Job Knowledge: Understands organization’s
and customers’ policies and procedures.
5. Communication: Clearly expresses self
(verbal and written). Keeps customers
informed.
When choosing the 5 most important skills
and competencies out of the 17 choices,
customers and providers showed a large
amount of agreement (see Table 4). Although
the rankings between the two groups differed
somewhat, their importance ratings were fairly
consistent. Providers were more likely than
customers to give higher importance ratings
to Customer Sensitivity, Persuasiveness/Sales
Ability, and Flexibility. This tendency
probably can be explained by providers’
unique perspective on their job requirements.
Service providers tend to deal with many
customers, each with different interaction
styles and needs.
Average AverageCustomers Providers Difference Importance Skill/Competency
4.20 (1) 4.41 (1) -0.23 4.31 (1) Work Standards4.17 (2) 4.29 (2) -0.11 4.23 (2) Follow-Up4.15 (3) 4.05 (8) 0.03 4.10 (3) Integrity4.01 (5) 4.18 (4) -0.17 4.10 (4) Job Knowledge3.95 (8) 4.20 (3) -0.27 4.08 (5) Communication4.06 (4) 4.06 (7) 0.02 4.06 (6) Initiative3.99 (7) 4.04 (9) -0.11 4.02 (7) Resilience3.88 (10) 4.07 (6) -0.19 3.98 (8) Decisiveness4.01 (6) 3.93 (10) 0.06 3.97 (9) Motivation to Serve Customers3.59 (15) 4.14 (5) -0.58* 3.87 (10) Customer Sensitivity3.90 (9) 3.78 (15) 0.12 3.84 (11) Judgment3.75 (11) 3.82 (12) -0.08 3.79 (12) Energy3.66 (12) 3.82 (13) -0.14 3.74 (13) Planning3.61 (13) 3.84 (11) -0.23 3.73 (14) Impact3.61 (14) 3.81 (14) -0.27 3.71 (15) Situation Analysis3.38 (16) 3.71 (17) -0.29* 3.55 (16) Persuasiveness/Sales Ability3.31 (17) 3.73 (16) -0.40* 3.52 (17) Flexibility
* Statistically significant difference
Table 4. Skill/Competency importance ratings, rankings (in parentheses), and differences.
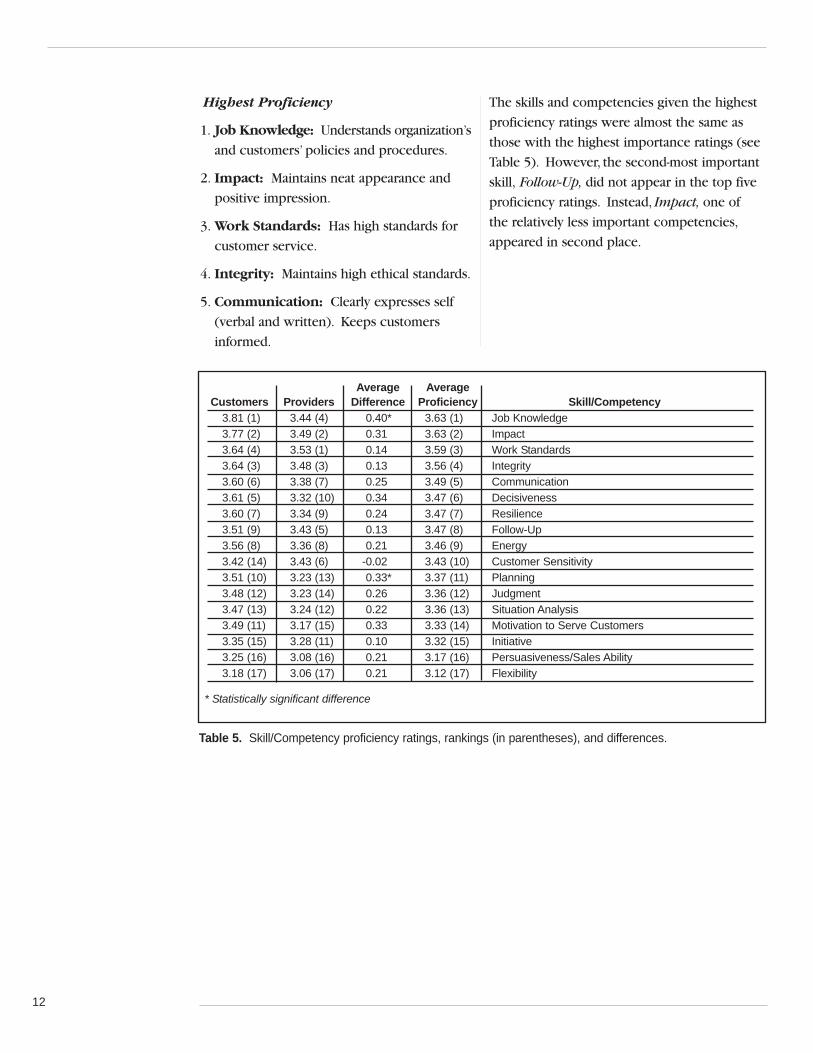
Highest Proficiency
1. Job Knowledge: Understands organization’s
and customers’ policies and procedures.
2. Impact: Maintains neat appearance and
positive impression.
3. Work Standards: Has high standards for
customer service.
4. Integrity: Maintains high ethical standards.
5. Communication: Clearly expresses self
(verbal and written). Keeps customers
informed.
The skills and competencies given the highest
proficiency ratings were almost the same as
those with the highest importance ratings (see
Table 5). However, the second-most important
skill, Follow-Up, did not appear in the top five
proficiency ratings. Instead, Impact, one of
the relatively less important competencies,
appeared in second place.
12
Average AverageCustomers Providers Difference Proficiency Skill/Competency
3.81 (1) 3.44 (4) 0.40* 3.63 (1) Job Knowledge3.77 (2) 3.49 (2) 0.31 3.63 (2) Impact3.64 (4) 3.53 (1) 0.14 3.59 (3) Work Standards3.64 (3) 3.48 (3) 0.13 3.56 (4) Integrity3.60 (6) 3.38 (7) 0.25 3.49 (5) Communication3.61 (5) 3.32 (10) 0.34 3.47 (6) Decisiveness3.60 (7) 3.34 (9) 0.24 3.47 (7) Resilience3.51 (9) 3.43 (5) 0.13 3.47 (8) Follow-Up3.56 (8) 3.36 (8) 0.21 3.46 (9) Energy3.42 (14) 3.43 (6) -0.02 3.43 (10) Customer Sensitivity3.51 (10) 3.23 (13) 0.33* 3.37 (11) Planning3.48 (12) 3.23 (14) 0.26 3.36 (12) Judgment3.47 (13) 3.24 (12) 0.22 3.36 (13) Situation Analysis3.49 (11) 3.17 (15) 0.33 3.33 (14) Motivation to Serve Customers3.35 (15) 3.28 (11) 0.10 3.32 (15) Initiative3.25 (16) 3.08 (16) 0.21 3.17 (16) Persuasiveness/Sales Ability3.18 (17) 3.06 (17) 0.21 3.12 (17) Flexibility
* Statistically significant difference
Table 5. Skill/Competency proficiency ratings, rankings (in parentheses), and differences.
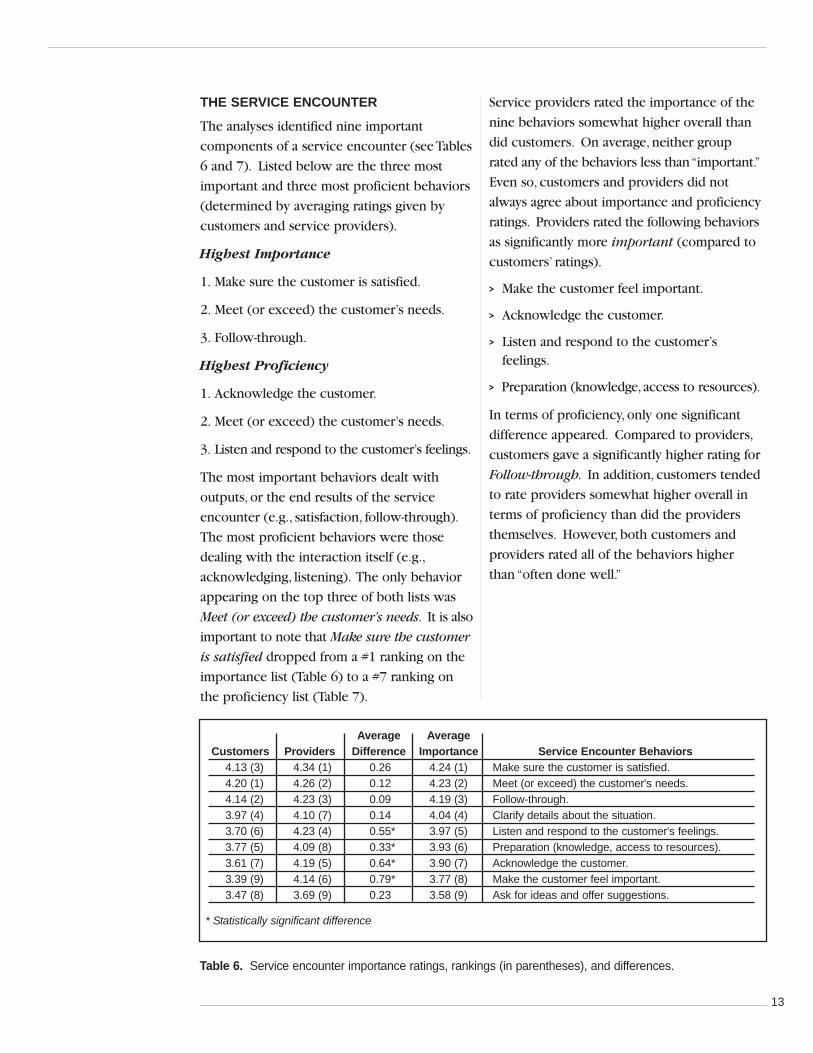
THE SERVICE ENCOUNTER
The analyses identified nine important
components of a service encounter (see Tables
6 and 7). Listed below are the three most
important and three most proficient behaviors
(determined by averaging ratings given by
customers and service providers).
Highest Importance
1. Make sure the customer is satisfied.
2. Meet (or exceed) the customer’s needs.
3. Follow-through.
Highest Proficiency
1. Acknowledge the customer.
2. Meet (or exceed) the customer’s needs.
3. Listen and respond to the customer’s feelings.
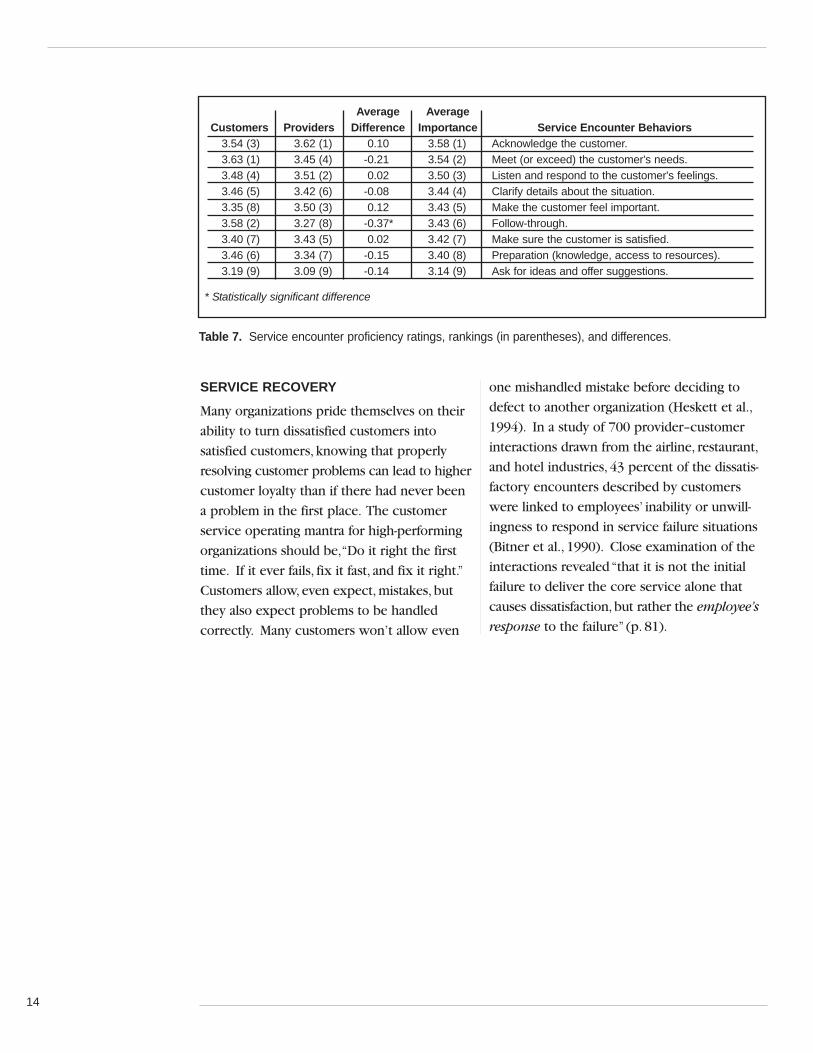
The most important behaviors dealt with
outputs, or the end results of the service
encounter (e.g., satisfaction, follow-through).
The most proficient behaviors were those
dealing with the interaction itself (e.g.,
acknowledging, listening). The only behavior
appearing on the top three of both lists was
Meet (or exceed) the customer’s needs. It is also
important to note that Make sure the customer
is satisfied dropped from a #1 ranking on the
importance list (Table 6) to a #7 ranking on
the proficiency list (Table 7).
Service providers rated the importance of the
nine behaviors somewhat higher overall than
did customers. On average, neither group
rated any of the behaviors less than “important.”
Even so, customers and providers did not
always agree about importance and proficiency
ratings. Providers rated the following behaviors
as significantly more important (compared to
customers’ ratings).
> Make the customer feel important.
> Acknowledge the customer.
> Listen and respond to the customer’s feelings.
> Preparation (knowledge, access to resources).
In terms of proficiency, only one significant
difference appeared. Compared to providers,
customers gave a significantly higher rating for
Follow-through. In addition, customers tended
to rate providers somewhat higher overall in
terms of proficiency than did the providers
themselves. However, both customers and
providers rated all of the behaviors higher
than “often done well.”
13
Average AverageCustomers Providers Difference Importance Service Encounter Behaviors
4.13 (3) 4.34 (1) 0.26 4.24 (1) Make sure the customer is satisfied.4.20 (1) 4.26 (2) 0.12 4.23 (2) Meet (or exceed) the customer's needs.4.14 (2) 4.23 (3) 0.09 4.19 (3) Follow-through.3.97 (4) 4.10 (7) 0.14 4.04 (4) Clarify details about the situation.3.70 (6) 4.23 (4) 0.55* 3.97 (5) Listen and respond to the customer's feelings.3.77 (5) 4.09 (8) 0.33* 3.93 (6) Preparation (knowledge, access to resources).3.61 (7) 4.19 (5) 0.64* 3.90 (7) Acknowledge the customer.3.39 (9) 4.14 (6) 0.79* 3.77 (8) Make the customer feel important.3.47 (8) 3.69 (9) 0.23 3.58 (9) Ask for ideas and offer suggestions.
* Statistically significant difference
Table 6. Service encounter importance ratings, rankings (in parentheses), and differences.
SERVICE RECOVERY
Many organizations pride themselves on their
ability to turn dissatisfied customers into
satisfied customers, knowing that properly
resolving customer problems can lead to higher
customer loyalty than if there had never been
a problem in the first place. The customer
service operating mantra for high-performing
organizations should be,“Do it right the first
time. If it ever fails, fix it fast, and fix it right.”
Customers allow, even expect, mistakes, but
they also expect problems to be handled
correctly. Many customers won’t allow even
one mishandled mistake before deciding to
defect to another organization (Heskett et al.,
1994). In a study of 700 provider–customer
interactions drawn from the airline, restaurant,
and hotel industries, 43 percent of the dissatis-
factory encounters described by customers
were linked to employees’ inability or unwill-
ingness to respond in service failure situations
(Bitner et al., 1990). Close examination of the
interactions revealed “that it is not the initial
failure to deliver the core service alone that
causes dissatisfaction, but rather the employee’s
response to the failure” (p. 81).
14
Average AverageCustomers Providers Difference Importance Service Encounter Behaviors
3.54 (3) 3.62 (1) 0.10 3.58 (1) Acknowledge the customer.3.63 (1) 3.45 (4) -0.21 3.54 (2) Meet (or exceed) the customer's needs.3.48 (4) 3.51 (2) 0.02 3.50 (3) Listen and respond to the customer's feelings.3.46 (5) 3.42 (6) -0.08 3.44 (4) Clarify details about the situation.3.35 (8) 3.50 (3) 0.12 3.43 (5) Make the customer feel important.3.58 (2) 3.27 (8) -0.37* 3.43 (6) Follow-through.3.40 (7) 3.43 (5) 0.02 3.42 (7) Make sure the customer is satisfied.3.46 (6) 3.34 (7) -0.15 3.40 (8) Preparation (knowledge, access to resources).3.19 (9) 3.09 (9) -0.14 3.14 (9) Ask for ideas and offer suggestions.
* Statistically significant difference
Table 7. Service encounter proficiency ratings, rankings (in parentheses), and differences.
In this study, 43 percent of the customers
(55/129) indicated that they had experienced
a problem that required them to interact with
a service provider. The most important
behavior for a provider to display in this
kind of a service encounter was Take time to
“hear them out” and fully understand the
customer’s situation or problem. The second-
most important behavior involved Taking
responsibility for solving the problem.
All of the behaviors rated by customers and
providers were given high marks for impor-
tance and proficiency (see Tables 8 and 9).
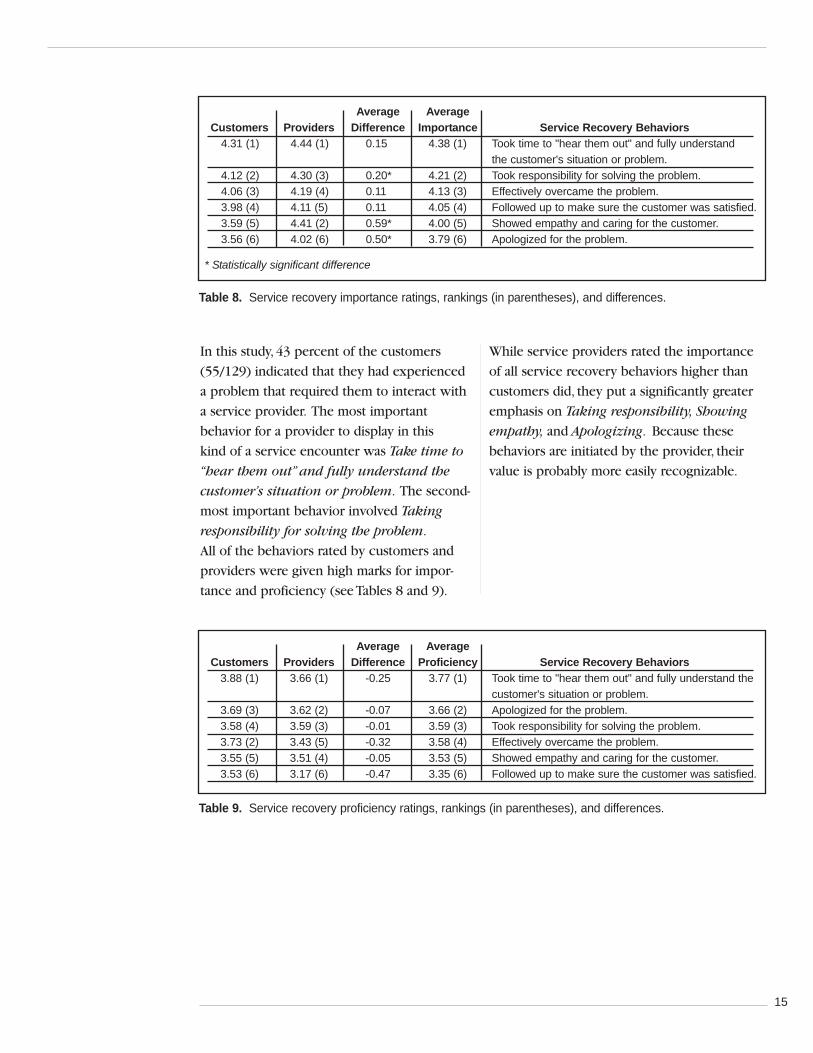
While service providers rated the importance
of all service recovery behaviors higher than
customers did, they put a significantly greater
emphasis on Taking responsibility, Showing
empathy, and Apologizing. Because these
behaviors are initiated by the provider, their
value is probably more easily recognizable.
15
Average AverageCustomers Providers Difference Importance Service Recovery Behaviors
4.31 (1) 4.44 (1) 0.15 4.38 (1) Took time to "hear them out" and fully understand the customer's situation or problem.
4.12 (2) 4.30 (3) 0.20* 4.21 (2) Took responsibility for solving the problem.4.06 (3) 4.19 (4) 0.11 4.13 (3) Effectively overcame the problem.3.98 (4) 4.11 (5) 0.11 4.05 (4) Followed up to make sure the customer was satisfied.3.59 (5) 4.41 (2) 0.59* 4.00 (5) Showed empathy and caring for the customer.3.56 (6) 4.02 (6) 0.50* 3.79 (6) Apologized for the problem.
* Statistically significant difference
Table 8. Service recovery importance ratings, rankings (in parentheses), and differences.
Average AverageCustomers Providers Difference Proficiency Service Recovery Behaviors
3.88 (1) 3.66 (1) -0.25 3.77 (1) Took time to "hear them out" and fully understand the customer's situation or problem.
3.69 (3) 3.62 (2) -0.07 3.66 (2) Apologized for the problem.3.58 (4) 3.59 (3) -0.01 3.59 (3) Took responsibility for solving the problem.3.73 (2) 3.43 (5) -0.32 3.58 (4) Effectively overcame the problem.3.55 (5) 3.51 (4) -0.05 3.53 (5) Showed empathy and caring for the customer.3.53 (6) 3.17 (6) -0.47 3.35 (6) Followed up to make sure the customer was satisfied.
Table 9. Service recovery proficiency ratings, rankings (in parentheses), and differences.
ATTITUDES: CUSTOMERS AND PROVIDERS
Both customers and providers were asked
to provide ratings of overall satisfaction and
loyalty. Customers rated their satisfaction and
loyalty regarding how well the organization
provided them with a service. Providers rated
their job satisfaction and loyalty to their
organization. In addition, providers rated the
level of developmental opportunities in their
organizations and the degree to which a service
culture was emphasized.
Overall, customers indicated a moderate level
of satisfaction with the organizations in this
sample (Mean = 3.81). However, loyalty was
rated not quite as highly (Mean = 3.58). This
difference in ratings illustrates the common
research finding that satisfaction does not
necessarily imply loyalty. Even so, correlational
analysis showed that satisfied customers also
tended to be more loyal (r = 0.72).
When rating their jobs, service providers also
indicated a moderate level of satisfaction
(Mean = 3.88). Like customers, their overall
level of loyalty was somewhat lower (Mean =
3.73). The correlation between satisfaction
and loyalty was also very much in line with
the trend observed for customers (r = 0.80).
Satisfied providers also were more loyal to
their organizations.
Examining the providers’ organizational work
environment provided some insight into ratings
of satisfaction and loyalty. When organizational
emphasis on development and service culture
was high, employees tended to be more
satisfied and loyal. Emphasis on a service
culture showed notable correlations with
providers’ satisfaction (r = 0.59) and loyalty
(r = 0.32). Developmental emphasis also
showed a positive but weaker correlation with
providers’ satisfaction (r = 0.21) and loyalty
(r = 0.25). In general, ratings of developmental
emphasis (e.g., growth and developmental
opportunities, planning) indicated that
providers in this sample did not perceive a
very strong developmental focus (Mean = 3.13).
However, organizational emphasis on a service
culture (e.g., empowerment and leadership) did
receive moderately good ratings (Mean = 3.74).
SATISFACTION AND DESIRE TO REPURCHASE
Customers were classified into groups based
on their responses to the question,“Compared
to your feelings before the problem occurred,
how would you rate your current satisfaction
with the organization’s performance?”and
their agreement with the statement,“The way
the organization handled my problem makes
me want to do business with them again.”
Figure 2 depicts the relationships between
employee behaviors and satisfaction/desire to
do business again.
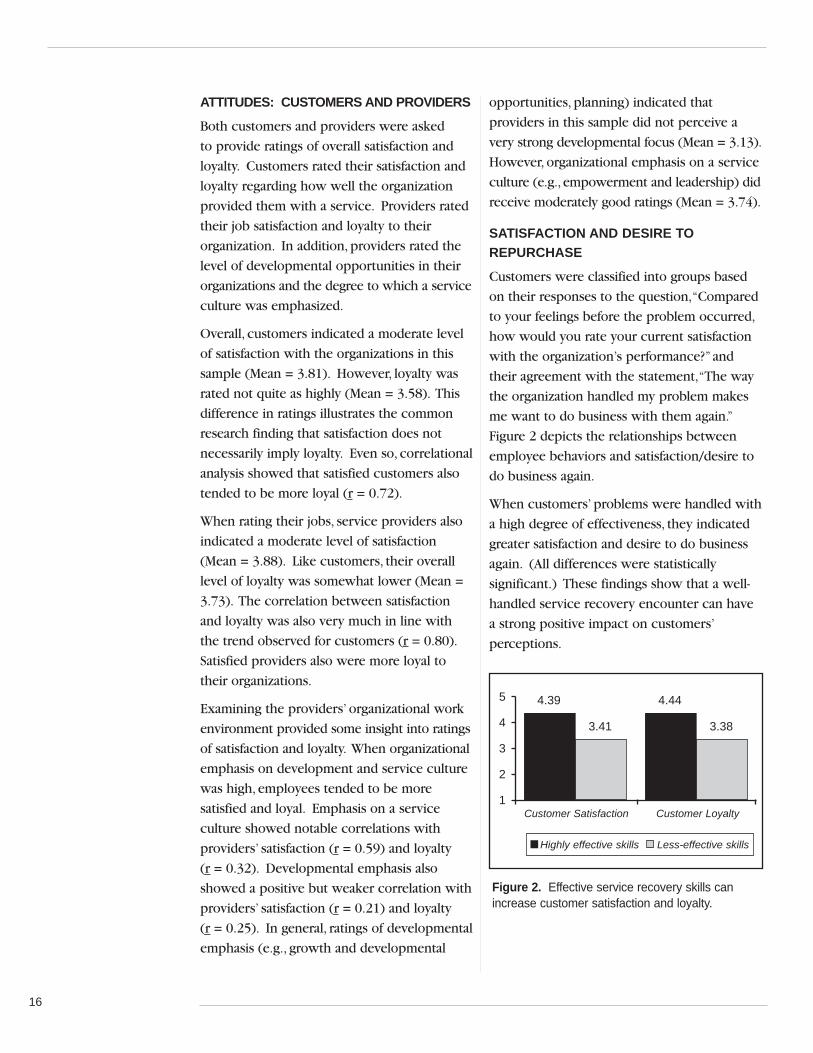
When customers’ problems were handled with
a high degree of effectiveness, they indicated
greater satisfaction and desire to do business
again. (All differences were statistically
significant.) These findings show that a well-
handled service recovery encounter can have
a strong positive impact on customers’
perceptions.
3.383.41
16
Figure 2. Effective service recovery skills canincrease customer satisfaction and loyalty.
4.395
4
3
2
1
4.44
Customer Satisfaction Customer Loyalty
Highly effective skills Less-effective skills
DISCUSSIONThe findings from this research illustrate the
exceedingly complex nature of customer service
and the many influences and differences in
perception that affect it. The most important
skills, behaviors, and competencies are not
always the ones demonstrated with the greatest
proficiency. Service providers focus primarily
on the process for delivering good service,
while customers emphasize the final outcomes
of the interaction. The challenge centers on
integrating service processes and outcomes to
produce a seamless model of service interaction.
MEETING (OR EXCEEDING) CUSTOMERNEEDS AND EXPECTATIONSThe key to service quality exists in the
customer’s perception of value. No matter what
skills, competencies, interaction guidelines, or
services a company offers, everything must be
directed toward meeting or exceeding the
customer’s expectations for service. As seen in
ratings of service encounter behaviors,
Making sure the customer is satisfied and
Meeting or exceeding the customer’s needs
were the two most important behaviors.
However, individual customers have unique
needs, and the needs of the same customer
vary from interaction to interaction. The system
or approach for meeting customer needs must
be flexible and universal enough to address a
multitude of customer needs and styles.
The ability to treat each customer individually
will develop the relationship required to
create customer loyalty, which is so critical to
business success.
LISTENING TO AND UNDERSTANDINGCUSTOMERSOne of the primary methods for making sure
that customer needs are met relates to listening
to and understanding customers. Undeniably,
it is impossible to provide quality service and
meet expectations unless you find out what
customers want or what their problems entail.
Listening carefully to what customers have
to say appeared as the top satisfaction builder.
During the service encounter, it appeared as
one of the most proficient behaviors. Finally,
Taking time to “hear them out” and fully
understand customers’ situations or problems
was the most important behavior in service
recovery situations.
EMPOWERMENT AND RESPONSIBILITYThe need for empowerment and the authority
to take action is one of the most consistent
findings in this study. Even if providers listen
to and understand customers, they cannot
meet needs unless they are given the authority
to take action. There is support for the value
of empowerment in this study’s conclusions
about job knowledge, job satisfaction, customer
satisfaction, and service recovery.
First, it is difficult to assume responsibility and
take action without having sufficient job
knowledge. Job Knowledge was rated among
the five most important and proficient service
provider competency areas. Second, providers’
degree of empowerment on the job was
significantly correlated to job satisfaction.
Empowerment (part of the service culture)
predicts employee satisfaction/loyalty (part of
the Service Success Loop). In turn, employee
satisfaction/loyalty predicts customers’ level
of satisfaction.
17
One of the primary customer satisfaction
builders was Taking immediate action to
meet customer needs or requests. Providers
need sufficient authority and empowerment
to take immediate action. Finally, in service
recovery situations we noted the importance
of Taking responsibility for solving the problem.
FOLLOW-THROUGHThe last major finding in this study illustrates
the importance of follow-through. Following
through on promises and commitments
appeared as a "top five" competency and as a
key service encounter behavior. It also
appeared in the top five customer satisfaction
reducers when worded negatively (i.e., failing
to follow through).
18
IMPLICATIONSMONITOR CUSTOMER NEEDS ANDPERCEPTIONSFor customers to perceive value in the services
an organization offers, an accurate understand-
ing of their needs,expectations,and perceptions
is required. Some of this information can be
gathered through market research. Even so,
regular systems for collecting customer feed-
back will be invaluable for monitoring your
performance. If customers are not completely
satisfied, find out why. Put a system in place
for collecting ongoing feedback from customers.
For example, collecting feedback during the
service interaction itself provides quick and
meaningful information about how well
customer needs are being met and what can
be done to continuously improve the quality
of service.
PROMOTE AN EMPOWERING ENVIRONMENT
Organizational Values
Development of a service culture requires the
support and involvement of senior leaders in
the organization. A clearly stated set of organi-
zational values, including Customer Focus,
helps define what leaders and employees
should emphasize in their everyday activities.
Empowered leaders can use information about
organizational values to make clear objectives
for their particular work groups, considering
unique customer and employee needs.
Providing Resources and Information
Make sure that service personnel understand
and have access to all the information and
solutions customers might request. Customers
should not have to hear a provider say “I don’t
know,” “I don’t make the rules,”or “Someone
else handles that.” Many organizations are
beginning to offer their providers the power
to solve problems without having to go
through layers of approval. Providers should
be able to respond to customer needs immedi-
ately with a solution. Doing this requires skills
and knowledge, customer-focused processes,
strong internal partnerships, and the authority
to take action.
Empowering Leadership
Leaders in the organization should promote
a sense of job ownership among their direct
reports. They can do this by first operationaliz-
ing the organization’s service vision, and then
coaching, developing partnerships, building
trust, and managing the performance of their
service providers. Leaders can help meet
customer expectations by ensuring that
organizations’ systems and processes align
with the service vision and by identifying and
removing barriers that are keeping service
personnel from doing their jobs.
PROVIDE TRAINING AND INTEGRATE SKILLS AND COMPETENCIES
Training
It is a safe bet to assume that the skills of
service providers need to be strengthened
and reinforced. Although many providers are
strong in some skill areas, they do not always
focus on the behaviors that customers find
important. All organizations interested in
creating a service culture should have ongoing
skills training to develop these critical
competencies: managing the customer
interaction, turning dissatisfied customers
into satisfied and loyal customers, and
improving processes.
Integration
The skills and competencies measured in this
study can serve as the basis for an integrated
human resources system for service providers.
For example, many of the competencies can
be used as criteria for selecting new service
employees. Similarly, these competencies
19
can be incorporated into an appraisal and
performance evaluation system. They also
can serve as the basis of a powerful needs
analysis process for service personnel, allowing
organizations to focus valuable training dollars
and time.
In summary, customer-contact employees
are the most important, yet often forgotten,
employees in the organization. This research
and other studies have demonstrated the
importance of supporting service providers
and promoting their satisfaction and loyalty.
They can and will make a difference in
building customer satisfaction and loyalty.
Whether this difference is positive or negative
depends on an organization’s ability and
willingness to manage, develop, and motivate
those who serve their customers.
20
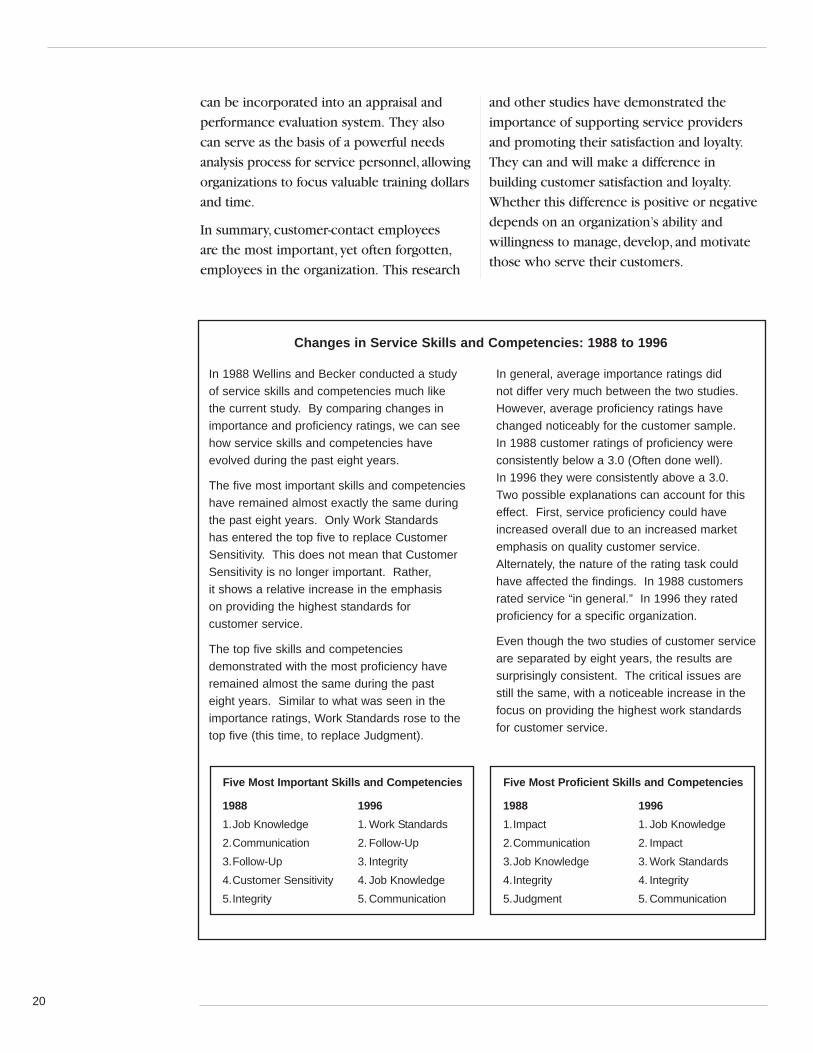
In 1988 Wellins and Becker conducted a study of service skills and competencies much like the current study. By comparing changes inimportance and proficiency ratings, we can seehow service skills and competencies haveevolved during the past eight years.
The five most important skills and competencieshave remained almost exactly the same duringthe past eight years. Only Work Standards has entered the top five to replace CustomerSensitivity. This does not mean that CustomerSensitivity is no longer important. Rather, it shows a relative increase in the emphasis on providing the highest standards for customer service.
The top five skills and competencies demonstrated with the most proficiency haveremained almost the same during the past eight years. Similar to what was seen in theimportance ratings, Work Standards rose to thetop five (this time, to replace Judgment).
In general, average importance ratings did not differ very much between the two studies.However, average proficiency ratings havechanged noticeably for the customer sample. In 1988 customer ratings of proficiency were consistently below a 3.0 (Often done well). In 1996 they were consistently above a 3.0. Two possible explanations can account for thiseffect. First, service proficiency could haveincreased overall due to an increased marketemphasis on quality customer service.Alternately, the nature of the rating task couldhave affected the findings. In 1988 customersrated service “in general.” In 1996 they ratedproficiency for a specific organization.
Even though the two studies of customer service are separated by eight years, the results are surprisingly consistent. The critical issues arestill the same, with a noticeable increase in thefocus on providing the highest work standards for customer service.
Changes in Service Skills and Competencies: 1988 to 1996
Five Most Important Skills and Competencies
1988 19961.Job Knowledge 1. Work Standards2.Communication 2. Follow-Up3.Follow-Up 3. Integrity4.Customer Sensitivity 4. Job Knowledge5.Integrity 5. Communication
Five Most Proficient Skills and Competencies
1988 19961.Impact 1. Job Knowledge2.Communication 2. Impact3.Job Knowledge 3. Work Standards4.Integrity 4. Integrity5.Judgment 5. Communication
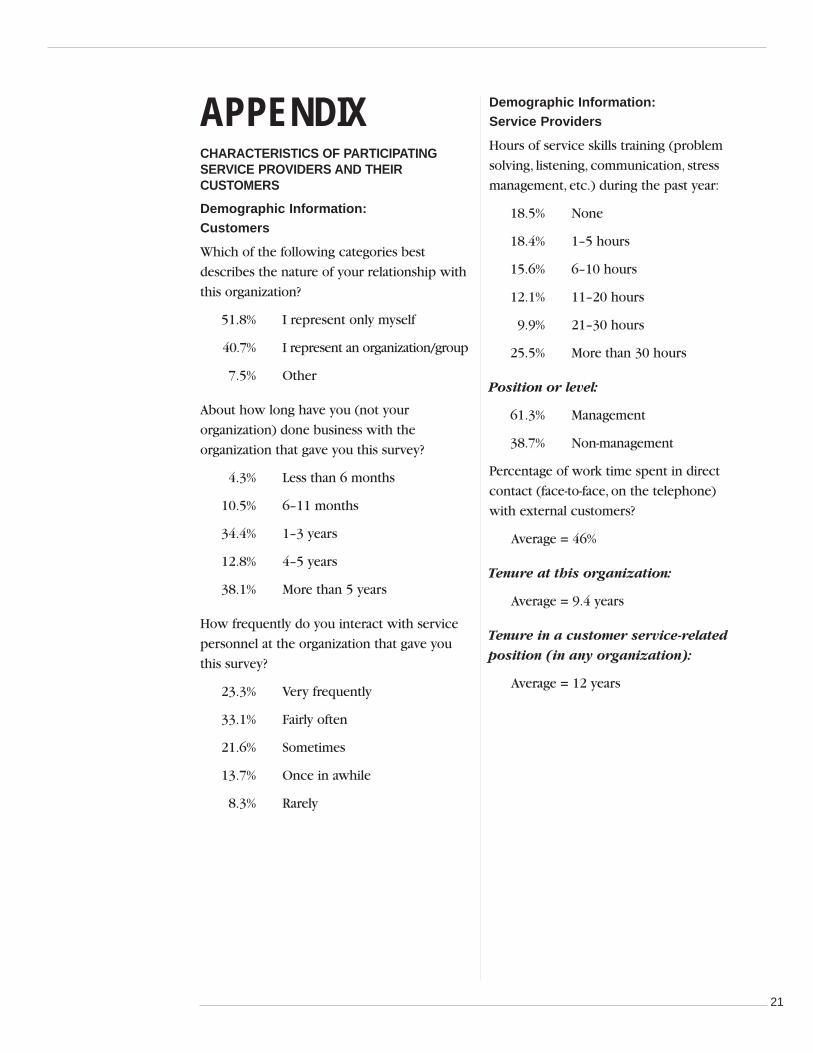
APPENDIXCHARACTERISTICS OF PARTICIPATINGSERVICE PROVIDERS AND THEIRCUSTOMERS
Demographic Information: Customers
Which of the following categories best
describes the nature of your relationship with
this organization?
51.8% I represent only myself
40.7% I represent an organization/group
7.5% Other
About how long have you (not your
organization) done business with the
organization that gave you this survey?
4.3% Less than 6 months
10.5% 6–11 months
34.4% 1–3 years
12.8% 4–5 years
38.1% More than 5 years
How frequently do you interact with service
personnel at the organization that gave you
this survey?
23.3% Very frequently
33.1% Fairly often
21.6% Sometimes
13.7% Once in awhile
8.3% Rarely
Demographic Information: Service Providers
Hours of service skills training (problem
solving, listening, communication, stress
management, etc.) during the past year:
18.5% None
18.4% 1–5 hours
15.6% 6–10 hours
12.1% 11–20 hours
9.9% 21–30 hours
25.5% More than 30 hours
Position or level:
61.3% Management
38.7% Non-management
Percentage of work time spent in direct
contact (face-to-face, on the telephone)
with external customers?
Average = 46%
Tenure at this organization:
Average = 9.4 years
Tenure in a customer service-relatedposition (in any organization):
Average = 12 years
21
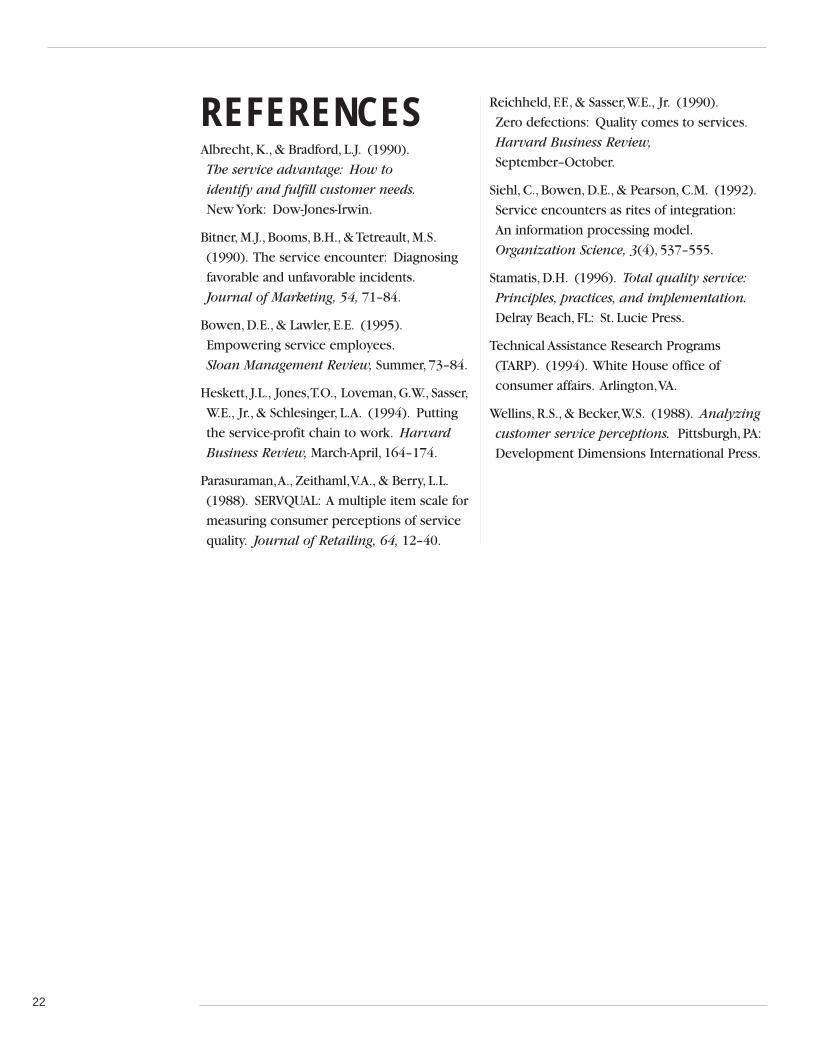
REFERENCESAlbrecht, K., & Bradford, L.J. (1990).
The service advantage: How to
identify and fulfill customer needs.
New York: Dow-Jones-Irwin.
Bitner, M.J., Booms, B.H., & Tetreault, M.S.
(1990). The service encounter: Diagnosing
favorable and unfavorable incidents.
Journal of Marketing, 54, 71–84.
Bowen, D.E., & Lawler, E.E. (1995).
Empowering service employees.
Sloan Management Review, Summer, 73–84.
Heskett, J.L., Jones,T.O., Loveman, G.W., Sasser,
W.E., Jr., & Schlesinger, L.A. (1994). Putting
the service-profit chain to work. Harvard
Business Review, March-April, 164–174.
Parasuraman,A., Zeithaml,V.A., & Berry, L.L.
(1988). SERVQUAL: A multiple item scale for
measuring consumer perceptions of service
quality. Journal of Retailing, 64, 12–40.
Reichheld, F.F., & Sasser,W.E., Jr. (1990).
Zero defections: Quality comes to services.
Harvard Business Review,
September–October.
Siehl, C., Bowen, D.E., & Pearson, C.M. (1992).
Service encounters as rites of integration:
An information processing model.
Organization Science, 3(4), 537–555.
Stamatis, D.H. (1996). Total quality service:
Principles, practices, and implementation.
Delray Beach, FL: St. Lucie Press.
Technical Assistance Research Programs
(TARP). (1994). White House office of
consumer affairs. Arlington,VA.
Wellins, R.S., & Becker,W.S. (1988). Analyzing
customer service perceptions. Pittsburgh, PA:
Development Dimensions International Press.
22
ABOUT THEAUTHORSPaul Bernthal, Ph.D., Manager, Center for Applied Behavioral Research
Paul Bernthal is the leader of DDI’s Center
for Applied Behavioral Research (CABER).
He works with internal and external clients to
conduct benchmarking research, implement
evaluation and validation research designs,
and provide ongoing measurement consulting.
Some of his training evaluation clients include
Ford, Eli Lilly, Motorola, Eastman Chemical,
GMAC Mortgage, Hughes Aircraft, Bellin
Hospital (Ontario), Presbyterian Hospital
(Albuquerque), and International Paper.
In addition, he has conducted evaluations
of selection, assessment, and organizational
change interventions at organizations such
as Unisys, Sprint, PPG, General Motors,
Northern Telecom, and Baptist Health Systems.
In the past seven years, Dr. Bernthal has
conducted more than 50 large-scale program
evaluations for DDI.
James H.S. Davis, Vice President,Workforce and Service Development
A recognized expert in combining selection,
development, and senior management support
to create high-performing organizations, Mr.
Davis has helped many organizations succeed
in today’s highly competitive global business
environment.
Mr.Davis consults with numerous organizations
throughout the world and is sought after as a
consultant and speaker. Some of his clients
include American University, Coca-Cola, Delta
Airlines, HCA, Hyatt Hotels & Resorts,Tenet
Healthcare,Toyota, and Warner Bros.
Mr. Davis coauthored the book The Service
Leaders Club: Dazzling Your Customers
Through Service and Service Skills in the
Workplace, a report based on an international
study of service skills.
23

NOTES
24

NOTES
25
POWERINGSELECTIONSUCCESS
DEVELOPING EXTRAORDINARYLEADERS
UNLEASHINGEXECUTIVETALENT
THE AMERICAS
WORLD HEADQUARTERSPITTSBURGH412.257.0600
MEXICO CITY52.55.1253.9000
TORONTO416.601.5500
Other major offices inAtlanta, Chicago, Dallas, Detroit, Los Angeles, Monterrey, Montreal, New York, St. Louis,San Francisco, Santiago, and São Paulo
EUROPE/AFRICA
DÜSSELDORF49.2159.91680
LONDON44.1.753.616.000
PARIS33.1.41.9686.86
Other major offices inJohannesburg, Utrecht,and Warsaw
ASIA-PACIFIC
HONG KONG852.2526.1188
SINGAPORE65.6226.5335
SYDNEY61.2.9466.0300
Other major offices inAuckland, Bangkok, Jakarta, Kuala Lumpur, Manila, Melbourne, Seoul, Shanghai, Taipei, and Tokyo
E-MAIL: [email protected]
ABOUT DDI. Since 1970 Development
Dimensions International has worked with some
of the world’s most successful organizations to
achieve superior business results by building
engaged, high-performing workforces.
We excel in two major areas. Designing and
implementing selection systems that enable
you to hire better people faster. And identifying
and developing exceptional leadership talent
crucial to creating a workforce that drives
sustained success.
What sets DDI apart is realization. We focus on
the needs of our clients and have a passion for
their success.
The outcome? You bring the best people
on board, who get up to speed faster, contribute
more, and stay longer—giving you the ultimate
competitive advantage.
MKTCPMN05-1294-1104 © Development Dimensions International, Inc., MCMXCIV. Revised MMIV. All rights reserved.
*C32M*C32M