Embed Size (px)
Citation preview

Service Sector Productivity in Japan: y pAn Analysis Based on the JIP Database
O t b 2010October 2010
Kyoji Fukaoy j
(Hitotsubashi University and RIETI)
iTsutomu Miyagawa
(Gakushuin University and RIETI)( y )
1

1. Motivation1. Motivation• As the share of the service sector in the economy i d i i h i hi iincreases, productivity growth in this sector is becoming the key to Japan’s future economic growth.
• But productivity in this sector has stagnated.
• Using mainly industry level data of factor inputs and g y y pproductivity, we examine why service sector productivity in Japan has stagnated. p y p g
• We also try to answer what Japan needs to do to improve service sector productivity.improve service sector productivity.
2

1. Why is the Service Sector is Important for Japan’s Future Growth?
• Historically labor productivity in the tertiary sector was notHistorically, labor productivity in the tertiary sector was not much lower than in the secondary sector except during the period of rapid industrialization from 1947‐1965.period of rapid industrialization from 1947 1965.
• But total factor productivity (TFP) growth in the manufacturing sector has been much higher than that inmanufacturing sector has been much higher than that in other sectors.
• However, the share of the manufacturing sector is decliningHowever, the share of the manufacturing sector is declining rapidly.
• Hence for Japan which is now experiencing populationHence, for Japan, which is now experiencing population decline, productivity growth in the service sector is the key.
3

6
Comparison of sectoral labor productivity (primary=1)
4
5
3Secondary
T ti
1
2Tertiary
0
Notes:Subsidiary occupations are taken account of for periods before the Second World War.Data before 1965 are on a per worker basis. Data from 1973 are on a man-hour basis.
Sources:
The primary sector consists of agriculture, fishery and forestry. The secondary sector consists of mining,manufacturing and construction. The tertiary sector consists of all other sectors except imputed rent.
Data for periods between 1885-1940 are from Osamu Saito and Tokihiko Settsu (2009), "Unveiling historicaloccupational structures and its implications for sectoral labour productivity analysis in Japan’s economic growth,"
4Data for periods between 1947-65 are from Ohkawa, K. and M. Shinohara, eds., (1979), Patterns of JapaneseEconomic Development: A Quantitative Appraisal (New Haven: Yale University Press), p. 41,Table2.12.Data for periods after 1970 are from the JIP Database 2009.
p p p y y p g ,paper presented at INCHOS 2009, 28-30 July 2009, King’s College, Cambridge, p. 31, table 11.

Figure 5. TFP growth in manufacturing and non-manufacturing (marketeconomy excluding imputed house rent), 1970-2006 (1970=1)
3
2 5
3Manufacturing
2.5
2
1.5
1
0.5
0 2 4 6 8 0 2 4 6 8 0 2 4 6 8 0 2 4 6
5
Source: JIP Database 2009.
1970
1972
1974
1976
1978
1980
1982
1984
1986
1988
1990
1992
1994
1996
1998
2000
2002
2004
2006

Share of the manufacturing sector in the macro-economy: Japan-US Comparison
0.4 Nominal value added of the manufacturing sector/nominal GDP: Japan
0.35
Number of workers in the manufacturing sector/total number of workers in the economy: Japan
Nominal value added of the manufacturing sector/nominal GDP: US
0.3
Number of workers in the manufacturing sector/total number of workers in the economy: US
0 250.25
0.2
0.15
6
Sources: JIP 2006 and Council of Economic Advisers, Economic Report of the President , 2005.
0.1
1960
1965
1970
1975
1980
1985
1990
1995
2000

2. Why does Productivity in Japan’s Service Sector Stagnate?
• Japan experienced relatively high TFP growthJapan experienced relatively high TFP growth in the ICT producing sector.
• However, the problem Japan is that TFP growth in ICT‐using sectors, such as distribution services (retail, wholesale and transportation) and in the rest of thetransportation) and in the rest of the manufacturing sector (i.e., excluding electrical machinery) declined substantially after 1995machinery), declined substantially after 1995.
• And these ICT‐using sectors have larger shares
7
in the economy than the ICT‐producing sector.

TFP Growth in the Market Sector: by Sector and by Country
Electrical machinery, post and communication
Manufacturing, excluding electrical machinery Other goods-producing
6 07.0 8.0 9.0
10.0
and communication
2.0
2.5
3.0
electrical machinery
2.0
3.0 industries
1.0 2.0 3.0 4.0 5.0 6.0
1980-95
1995-2005
0.0
0.5
1.0
1.5
n a y e K y S
-1.0
0.0
1.0
Japa
n
Kor
ea
erm
any
Fran
ce UK
Ital
y
US
0.0
Japa
n
Kor
ea
Ger
man
y
Fran
ce
UK
Ital
y
US
2005
-1.5
-1.0
-0.5
Japa
n
Kor
ea
Ger
man
y
Fran
ce UK
Ital
y
US
-3.0
-2.0
Ge F
Other goods producing industries
4.0
Finance and business services
4.0
Distribution services
1.5
Personal and social services
0.0
1.0
2.0
3.0
2.0
3.0
-0.5
0.0
0.5
1.0
pan
orea any
ance UK
taly US
4 0
-3.0
-2.0
-1.0
Japa
n
Kor
ea
Ger
man
y
Fran
ce UK
Ital
y
US
-1.0
0.0
1.0
Japa
n
Kor
ea
erm
any
Fran
ce UK
Ital
y
US
2 5
-2.0
-1.5
-1.0 Jap
Ko
Ger
m
Fra It
8Source: Kyoji Fukao, Tsutomu Miyagawa, Hak K. Pyo and Keun Hee Rhee (2009), “Estimates of Total Factor Productivity, ICT Contributions and Resource Reallocation Effects in Japan and Korea.”
-5.0
-4.0
-2.0
Ge F
-3.0
-2.5

International comparison of labor productivity by sector
• Labor productivity levels in Japan’s non‐manufacturing sectors are less than 50 percent of the U S levelsare less than 50 percent of the U.S. levels.
• In the case of non‐ICT capital service input per man‐hour, Japan uses much more such input than the United Statesuses much more such input than the United States.
• With regard to labor quality, there is not much difference between the two countries.between the two countries.
• The differences in labor productivity are mainly caused by Japan’s low level of ICT‐capital service input and low TFP. p p p
• Since ICT investment may contribute to innovation in production processes, the difference in ICT‐capital service input between Japan and the other countries is likely one of the major causes of the stagnation of TFP in Japan.
9

10

International comparison of labor productivity by sector(contd.)(contd.)
• We should note that it is very difficult to compare differences in the quality of services across countries and to measure PPP forthe quality of services across countries and to measure PPP for services.
• The quantity of truck transportation is basically measured by aThe quantity of truck transportation is basically measured by a unit of tonnage times kilometers per man‐hour (how much transportation in tonnage and distance was conducted by one man‐hour) and differences in quality, such as just‐in‐time delivery, are not taken account.
I il i h l h f b i h i k i• In retail services, the length of business hours is not taken into account. Measured productivity of German shops might be higher than that of Japanese shops because German shops arehigher than that of Japanese shops because German shops are only open until, say, 6 p.m. and customers adjust their lifestyle accordingly.
11

Accumulation of ICT assets in Japan and Korea was very slow in comparison with other countries.comparison with other countries.
14
Figure 3-2 ICT Investment/GDP Ratio in the Major Developed Countries
10
12Japan
Korea
US
8
10
%
US
UK
France
4
6
%
Germany
Italy
2
4
0
12Source: Kyoji Fukao, Tsutomu Miyagawa, Hak K. Pyo and Keun Hee Rhee (2009), “Estimates of Total Factor Productivity, ICT Contributions and Resource Reallocation Effects in Japan and Korea.”

Why was Japan left behind in ICT investment?
• The ratio of custom software investment to packaged software investment is much larger in Japan than in g pthe United States.
• When Japanese firms introduce ICT technology, suchWhen Japanese firms introduce ICT technology, such as an ICT system for customer services or the management of information flows within the firm,management of information flows within the firm, they prefer custom software in order to avoid business reorganization and the training of workers.business reorganization and the training of workers.
• This results in a smaller productivity improvement from ICT investment This example suggests that it isfrom ICT investment. This example suggests that it is important to compare intangible investment in Japan with that in other developed economies
13
with that in other developed economies.

Intangible Investment in Japanh bl /• The intangible investment/output ratio in Japan is smaller than that in the United States.
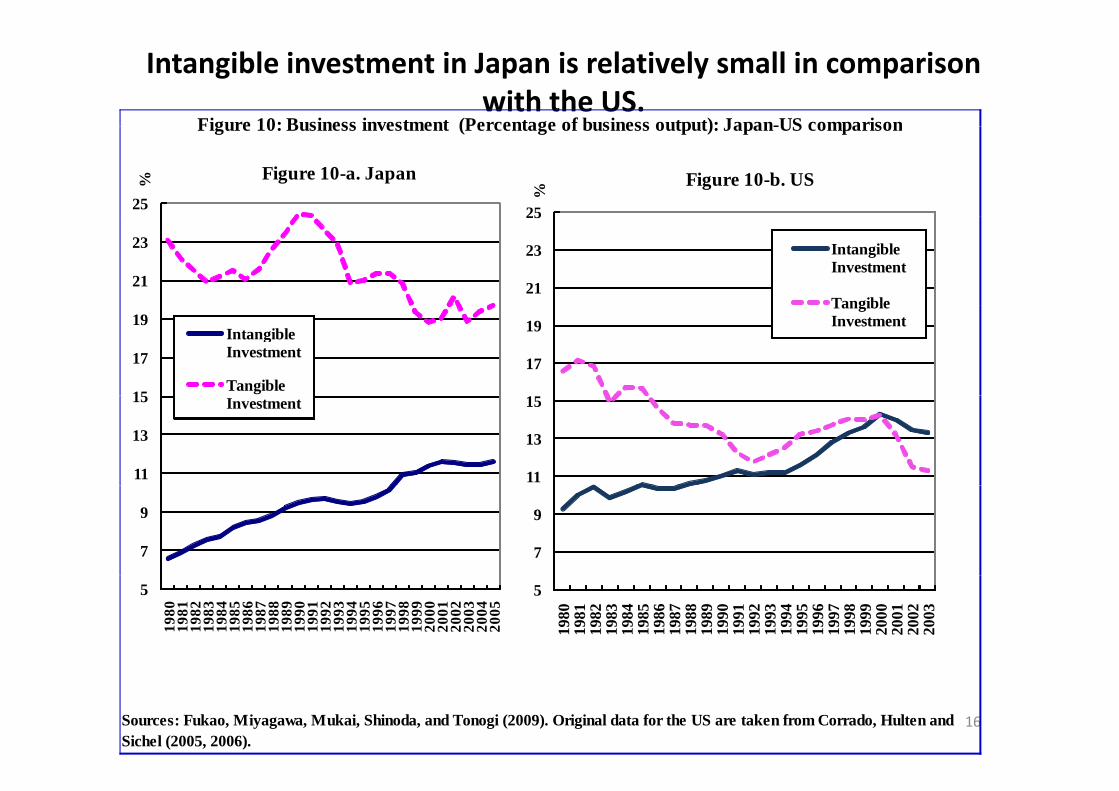
• The intangible investment/gross value added ratio in Japan’s non‐manufacturing sector is much lower than that in Japan’s manufacturing sector.†
• The low level of intangible investment probably is one g p yimportant reason for the stagnation of TFP growth and the delay of ICT investment in Japan’s service sector.y p
† Fukao, Kyoji, Tsutomu Miyagawa, Kentaro Mukai, Yukio Shinoda, and Konomi( ) “ bl dTonogi (2009), “Intangible Investment in Japan: Measurement and
Contribution to Economic Growth,” Review of Income and Wealth 55(3): 717‐736.
14

Japan invests a Intangible investment by category : Japan invests a lot in R&D but very little in 90%
100%
share in total intangible investment
very little in economic competencies 70%
80%
90%
Computerized competencies such as brand equity, firm‐ 50%
60%
70%informationScience and engineering R&Dequity, firm
specific human capital, and 30%
40%Other innovative propertyBrand equitycapital, and
organizational structure.
10%
20%Firm-specific resources
structure. 0%
Japan, 2000-05
US, 1998-2000
UK, 2004
15
Sources: Japan: Fukao et al. (2009), US: Corrado, Hulten and Sichel (2006), UK: Marrano and Haskel (2006).
Intangible investment in Japan is relatively small in comparison with the US.
Figure 10: Business investment (Percentage of business output): Japan-US comparisonFigure 10: Business investment (Percentage of business output): Japan-US comparison
25
% Figure 10-a. Japan
25
%
Figure 10-b. US
21
23
21
23
25
Intangible Investment
Tangible
15
17
19Intangible Investment
Tangible 17
19Tangible Investment
11
13
15 Investment
11
13
15
7
9
7
9
5
1980
1981
1982
1983
1984
1985
1986
1987
1988
1989
1990
1991
1992
1993
1994
1995
1996
1997
1998
1999
2000
2001
2002
2003
2004
2005
5
1980
1981
1982
1983
1984
1985
1986
1987
1988
1989
1990
1991
1992
1993
1994
1995
1996
1997
1998
1999
2000
2001
2002
2003
16Sources: Fukao, Miyagawa, Mukai, Shinoda, and Tonogi (2009). Original data for the US are taken from Corrado, Hulten andSichel (2005, 2006).
The intangible investment/gross value added ratio in Japan’s non‐manufacturing sector is much lower than that in Japan’s manufacturing sector
17

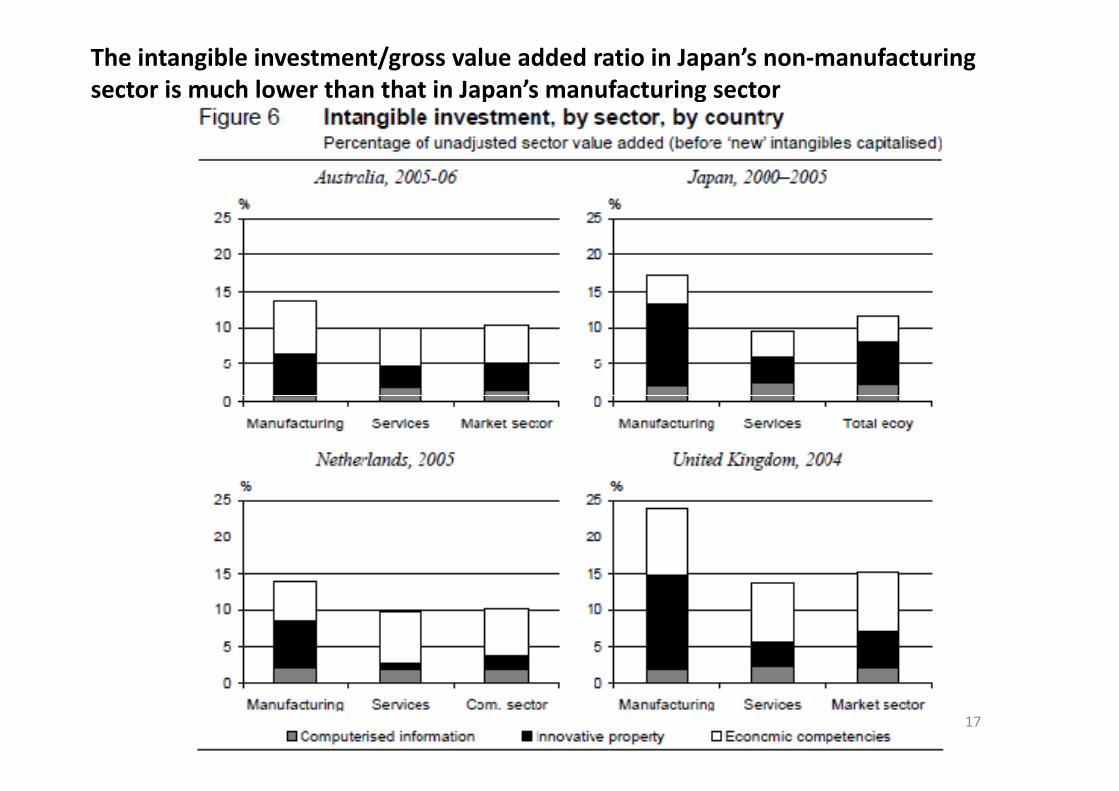
Intangible investment in the service sector decreased drastically after 1995.drastically after 1995.
When we focus on the retail industry, we find that intangible assets have contributed negatively to output growth andassets have contributed negatively to output growth and negative TFP growth in the retail industry since 2000.
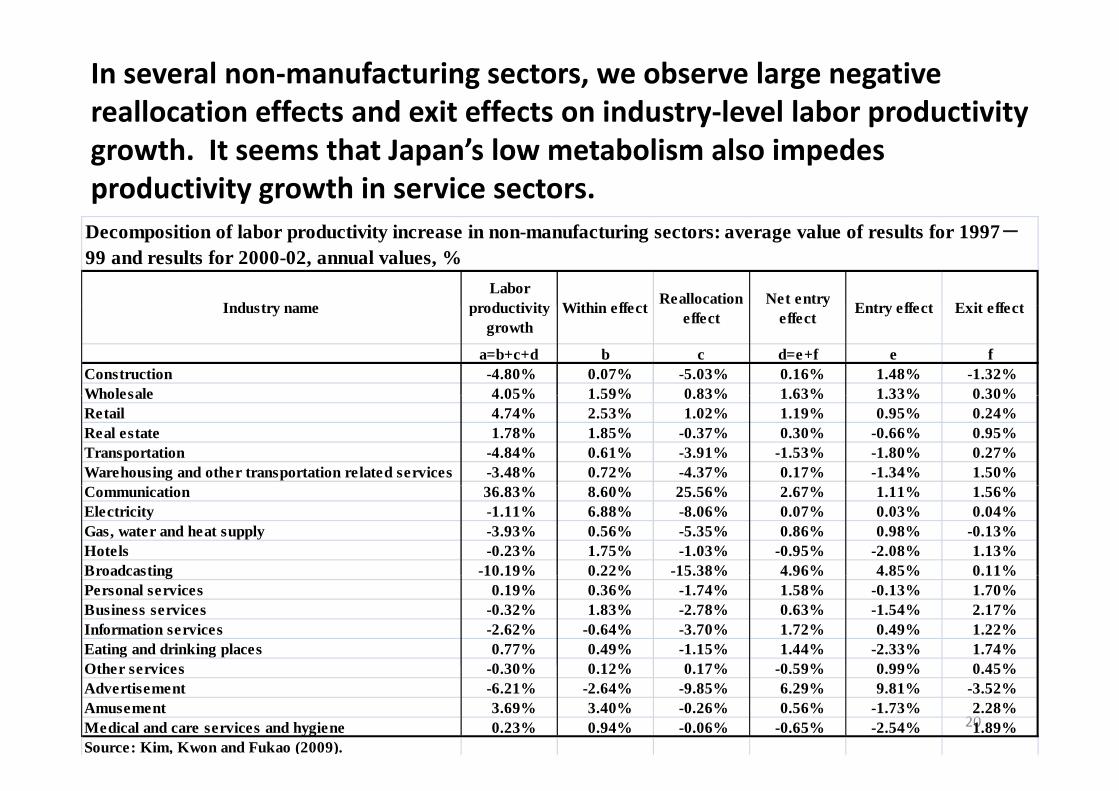
In several non‐manufacturing sectors, we observe large negative reallocation effects and exit effects on industry‐level labor productivity y p ygrowth. It seems that Japan’s low metabolism also impedes productivity growth in service sectors.
Ind str nameLabor
prod cti it Within effect Reallocation Net entry Entr effect E it effect
Decomposition of labor productivity increase in non-manufacturing sectors: average value of results for 1997-99 and results for 2000-02, annual values, %
Industry name productivitygrowth
Within effecteffect
yeffect
Entry effect Exit effect
a=b+c+d b c d=e+f e fConstruction -4.80% 0.07% -5.03% 0.16% 1.48% -1.32%Wholesale 4 05% 1 59% 0 83% 1 63% 1 33% 0 30%Wholesale 4.05% 1.59% 0.83% 1.63% 1.33% 0.30%Retail 4.74% 2.53% 1.02% 1.19% 0.95% 0.24%Real estate 1.78% 1.85% -0.37% 0.30% -0.66% 0.95%Transportation -4.84% 0.61% -3.91% -1.53% -1.80% 0.27%Warehousing and other transportation related services -3.48% 0.72% -4.37% 0.17% -1.34% 1.50%Communication 36.83% 8.60% 25.56% 2.67% 1.11% 1.56%Electricity -1.11% 6.88% -8.06% 0.07% 0.03% 0.04%Gas, water and heat supply -3.93% 0.56% -5.35% 0.86% 0.98% -0.13%Hotels -0.23% 1.75% -1.03% -0.95% -2.08% 1.13%Broadcasting -10.19% 0.22% -15.38% 4.96% 4.85% 0.11%Broadcasting 10.19% 0.22% 15.38% 4.96% 4.85% 0.11%Personal services 0.19% 0.36% -1.74% 1.58% -0.13% 1.70%Business services -0.32% 1.83% -2.78% 0.63% -1.54% 2.17%Information services -2.62% -0.64% -3.70% 1.72% 0.49% 1.22%Eating and drinking places 0.77% 0.49% -1.15% 1.44% -2.33% 1.74%Oth i 0 30% 0 12% 0 17% 0 59% 0 99% 0 45%
20
Other services -0.30% 0.12% 0.17% -0.59% 0.99% 0.45%Advertisement -6.21% -2.64% -9.85% 6.29% 9.81% -3.52%Amusement 3.69% 3.40% -0.26% 0.56% -1.73% 2.28%Medical and care services and hygiene 0.23% 0.94% -0.06% -0.65% -2.54% 1.89%Source: Kim, Kwon and Fukao (2009).

The start‐up and closure rates of establishments in Japan are much lower than those in the US.
Fi 4 1 S d Cl R f E bli h J US C iFigure 4.1 Start-up and Closure Rate of Establishments: Japan-US Comparison
Figure 4.1.Panel A. Start-up Rate: Japan-US Comparison %
Figure 4.2.Panel B. Closure Rate: Japan-US Comparison %
14
16
14
16
All industries: US
10
12
10
12 All industries: Japan
Wholesale, retail
6
8
6
8Wholesale, retail and restaurants: Japan
Services: Japan
2
4
2
4 Manufacturing: Japan
N t D t b d t ti ti f th l t i f h t
0
1981
1982
1983
1984
1985
1986
1987
1988
1989
1990
1991
1992
1993
1994
1995
1996
1997
1998
1999
2000
0
1981
1982
1983
1984
1985
1986
1987
1988
1989
1990
1991
1992
1993
1994
1995
1996
1997
1998
1999
2000
21
Note: Data are based on statistics from the employment insurance program of each country. Sources: Small Business Administration, US Government (1998), Small and Medium Enterprise Agency, Ministry ofIndustry, Trade and Industry, Japanese Government (2001), and Study Group on “Industry Hollowing-out” and TariffPolicy, Ministry of Finance, Japanese Government.

Figure 11. Increase in part-time workers in Japan
2,300
2,400
65,000,000
70,000,000
2,200 60,000,000 Self-employed and family
workers (JIP)
2,000
2,100
50,000,000
55,000,000 Part-time workers (JIP)
Full-time workers
1 800
1,900
40 000 000
45,000,000 Total number of workers
(JIP)
1,700
1,800
35,000,000
40,000,000 Total number of workers
(Labor Force Survey)
Average working hours (JIP)
1,600 30,000,000
1970
19
71
1972
19
73
1974
19
75
1976
19
77
1978
19
79
1980
19
81
1982
19
83
1984
19
85
1986
19
87
1988
19
89
1990
19
91
1992
19
93
1994
19
95
1996
19
97
1998
19
99
2000
20
01
2002
20
03
2004
20
05
2006
20
07
2008
20
09
Jan-
09Fe
b-09
Mar
-09
Apr
-09
May
-09
Jun-
09Ju
l-09
Aug
-09
Sep-
09O
ct-0
9N
ov-0
9D
ec-0
9Ja
n-10
Feb-
10M
ar-1
0A
pr-1
0M
ay-1
0Ju
n-10
Jul-1
0A
ug-1
0
22Source: JIP Database 2010.
F M A M J A N D F M A M J A

Figure 11. Increase in part-time workers in Japan
パート比率の推移
35 0
Percentage of part‐time workers in total workers by sector: 1970‐2005
30.0
35.0
電子計算機・同付属装置
通信機器
Computers and related devicesC i ti i t
20 0
25.0
通信機器
自動車
小売業
金融業
Communication equipmentAutomobileRetailFinance
15.0
20.0
%
金融業
電信・電話業
情報サービス業
FinanceTelecommunicationsInformation services
10.0
0.0
5.0
0 2 4 6 8 0 2 4 6 8 0 2 4 6 8 0 2 4
1970
1972
1974
1976
1978
1980
1982
1984
1986
1988
1990
1992
1994
1996
1998
2000
2002
2004
23Source: JIP Database 2008.

Increase in part‐time workers in Japan (contd.)i i li l i h j b i i d ff h j b• Firms invest little in on‐the‐job training and off‐the‐job training for part‐time workers. The increase in part‐time workers will slow down human capital accumulationworkers will slow down human‐capital accumulation.
• The productivity gap between part‐time workers and l k i l th th b t tregular workers is larger than the wage gap between part‐
time workers and regular workers. It seems that firms pay a premium to part time workers in order to obtain flexibilitypremium to part‐time workers in order to obtain flexibility of employment.†
• The increase in part time workers is not only a problem of• The increase in part‐time workers is not only a problem of inequality but also a problem of productivity.
† Kyoji Fukao Ryo Kambayashi Daiji Kawaguchi Hyeog Ug Kwon Young Gak KimKyoji Fukao, Ryo Kambayashi, Daiji Kawaguchi, Hyeog Ug Kwon, Young Gak Kim, and Izumi Yokomaya (2007) “Deferred Compensation: Evidence from Employer‐Employee Matched Data from Japan,” Hitotsubashi University.
24

Size and Internationalization of FirmsIn the case of commerce and other service sectors, US firms are much ,larger than Japanese firms on a consolidated basis. It seems that Japanese firms are left behind in internationalization and in enjoying
Number of listed firms and their average size measured by consolidated workers: US-Japan comparison, consolidated Wholesale and retail Other servicesManufacturing
scale economies.
NumberofJapanesefirms
Averagenumberofworkers
Numberof USfirms
Averagenumberofworkers
NumberofJapanesefirms
Averagenumberofworkers
Numberof USfirms
Averagenumberofworkers
NumberofJapanesefirms
Averagenumberofworkers
Numberof USfirms
Averagenumberofworkers
g
firms workers workers firms workers workers firms workers workers2000 909 7,306 1,451 7,145 262 2,554 363 19,620 148 1,866 655 7,1832001 774 6,611 1,466 6,729 243 1,626 361 20,302 157 1,462 655 7,0962002 1,079 4,799 1,490 6,501 418 1,093 368 19,857 315 906 691 7,7452003 1,291 4,546 1,558 6,314 540 1,207 375 21,841 398 855 690 7,4182004 1,567 4,702 1,575 6,560 630 1,506 390 21,404 496 999 717 7,6582005 1,622 4,960 1,606 6,376 668 1,597 389 23,175 564 981 715 7,736
Communication Other industries2000 17 16,422 96 11,576 234 5,970 763 5,3022001 13 19,438 102 10,938 214 4,343 827 4,9812002 23 11,193 108 10,664 307 2,944 848 5,1112003 32 8 046 121 9 453 367 2 858 894 4 822
Co u cat o Ot e dust es
25
2003 32 8,046 121 9,453 367 2,858 894 4,8222004 44 6,440 122 9,204 466 3,191 963 5,1202005 50 5,881 123 9,281 493 3,052 967 5,195Source: Kwon (2010)

Summary• TFP growth in the manufacturing sector is much higher than that in the
other sectors. However, the share of the manufacturing sector is declining rapidly. For Japan, which is now experiencing population decline, productivity growth in the service sector is key to economic growth.productivity growth in the service sector is key to economic growth.
• TFP growth in ICT‐using sectors declined substantially after 1995.
• Accumulation of ICT assets in Japan and Korea was very slow in p ycomparison with other countries.
• The low level of intangible investment probably is one important reason f f ffor the stagnation of TFP growth and the delay of ICT investment in Japan’s service sector.
• It seems that Japan’s low metabolism also impedes productivity growth• It seems that Japan s low metabolism also impedes productivity growth.
• Firms invest little in on‐the‐job training and off‐the‐job training for part‐time workers. The increase in part‐time workers will slow down human‐pcapital accumulation.
• It seems that Japanese firms are left behind in internationalization and in j i l i
26
enjoying scale economies.

Summary• If Japan’s comparatively low investment in ICT indeed is the result of a reluctance to reorganize business structures and retrain workers, this may in turn be linked to the increase in part‐time workers, which at least in part is a consequence of Japan’s labor market structures. Possible governmentis a consequence of Japan s labor market structures. Possible government policies to address these issues would include the provision of structures and incentives that facilitate and reward investment in ICT (and intangible
) d i h i i f i k d i i hassets) and in the training of part‐time workers and mitigate the polarization in the labor market between regular workers and part‐time workers while at the same time providing greater labor market flexibility. p g g y
• Slow growth, the low metabolism of the economy, and the fact that Japan’s service sector has fallen behind in terms of internationalization
d l iti i f l ll i t l t d M f thand exploiting economies of scale are all interrelated. Many areas of the service sector remain heavily regulated, thus preventing competition and greater dynamism through the entry, growth, and exit of firms. Obvious g y g y gpolicy measures would be to proceed with deregulation and, for instance, facilitating inward foreign direct investment to encourage the entry of firms that already operate internationally and enjoy economies of scale
27
firms that already operate internationally and enjoy economies of scale.